Embed Size (px)
Citation preview
John W. ElmerAlan T. TeruyaMark Gauthier
June 12, 1997
Beam Profile Analysis for the C&MS B231 ElectronBeam Welding Machines
This is an informal report intended primarily for internal or limited externaldistribution. The opinions and conclusions stated are those of the author and mayor may not be those of the Laboratory.
Work performed under the auspices of the U.S. Department of Energy by theLawrence Livermore National Laboratory under Contract W-7405-Eng-48.
Lawre
nce
Liverm
ore
National
Labora
tory
UCRL-ID-127549
DISCLAIMER
This document was prepared as an account of work sponsored by an agency of the United States Government. Neitherthe United States Government nor the University of California nor any of their employees, makes any warranty, expressor implied, or assumes any legal liability or responsibility for the accuracy, completeness, or usefulness of anyinformation, apparatus, product, or process disclosed, or represents that its use would not infringe privately ownedrights. Reference herein to any specific commercial product, process, or service by trade name, trademark,manufacturer, or otherwise, does not necessarily constitute or imply its endorsement, recommendation, or favoring bythe United States Government or the University of California. The views and opinions of authors expressed herein donot necessarily state or reflect those of the United States Government or the University of California, and shall not beused for advertising or product endorsement purposes.
This report has been reproduceddirectly from the best available copy.
Available to DOE and DOE contractors from theOffice of Scientific and Technical Information
P.O. Box 62, Oak Ridge, TN 37831Prices available from (615) 576-8401, FTS 626-8401
Available to the public from theNational Technical Information Service
U.S. Department of Commerce5285 Port Royal Rd.,
Springfield, VA 22161
1
Beam Profile Analysis for the C&MS B231 Electron Beam Welding Machines
by
John W. Elmer, Alan T. Teruya, and Mark Gauthier
June 12, 1997
Summary
The electron beams produced by two different welders were examined using computer assisted tomographic (CT) analysis.
These machines are located in Building 231 Rm 1737, and are both Hamilton Standard welders with 150 kV/50mA maximum
voltage/current. One machine (the ‘blue’ welder No. 605) uses a ribbon filament while the other (the ‘gray’ welder No. 175) uses a
hairpin filament. The objective of this study was to characterize the beam power distribution on each machine to see if weld
parameters could easily be transferred between machines. A. Sunwoo of Lawrence Livermore National Laboratory’s Engineering
Department pre-selected the beam focus, voltage, and current settings to duplicate the welding conditions used in an LLNL program
application.
The results show that the actual beam currents measured by a Faraday cup are 5 to 10% higher for the blue welder and about
30% lower for the gray welder than is set on their respective digital current meters. The CT analysis of the beam shapes shows that
the hairpin filament on the gray welder produces an elliptical beam shape in the sharp focus condition that defocuses to a diamond
shape. The ribbon filament on the blue welder produces less of an elliptical beam shape than the hairpin filament in the sharp focus
condition, but when defocused, acquires an elliptical shape. CT analysis of the effects of defocus on the peak power density shows
2
that the hairpin filament drops in peak power density much more quickly than the ribbon filament for a given amount of defocus.
Furthermore, it was more difficult to find and repeat the sharp focus condition for the hairpin filament than the ribbon filament,
particularly at higher beam currents.
Experimental Procedures
Weld Parameters
Electron beams were analyzed on both electron beam welders operating at 120 kV, with current settings of 10, 12, and 15 mA
on each of their digital meters. Using a conventional Faraday cup to check the calibration of the meters revealed that the actual beam
currents were 5 to 10 % higher on the blue welder and 30% lower on the gray welder than was set on the digital current meters (Table
1).
The power distribution measurements were made on both sharp focused and defocused beams. The defocus experiments were
made at 10, 15, and 20 mA units of defocus above the workpiece after the sharp focus setting was determined by the electron beam
operator while viewing the beam through magnifying optics as it impinged on a tungsten target. These focus conditions best matched
those that had been used to make the practice welds on stainless steel test pieces requested by A. Sunwoo prior to characterizing the
beam. Table 1 summarizes the electron beam settings for the 12 different conditions.
Power Density Distribution Measurements
Computer assisted tomographic (CT) analysis was performed on each of the electron beams using the procedure described in
Refs. 1–3. Using a disk patterned with 17 regularly shaped slits [3], the beam profiles were recorded as the electron beam was scanned
3
in a circle (1.0-in. diam for the blue welder, 0.75-in. diam for the gray welder) over the modified Faraday cup (MFC) assembly at 30
Hz. These beam profiles were sampled using a 1 MHz A/D converter, and the results were CT reconstructed using a 128 × 128 pixel
array. The results were recorded as contour plots of the power density distribution, and these plots were used to measure the peak
power density and distribution of the power density. The results show the contour plots, the peak power density, and the FWHM*
for each beam, where FWHM* is the full-width at half maximum (FWHM) of a circular Gaussian beam that would have the same area
as that of a non-circular shape.
Results
Ribbon Filament on the “Blue” Welder
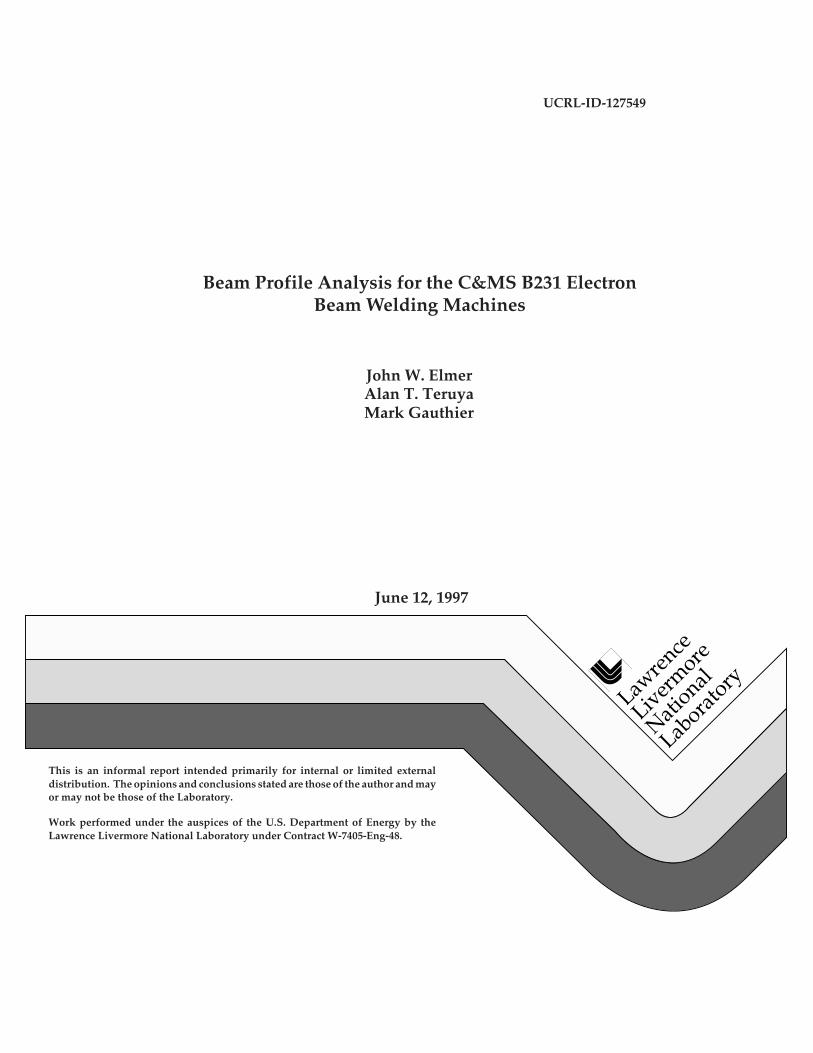
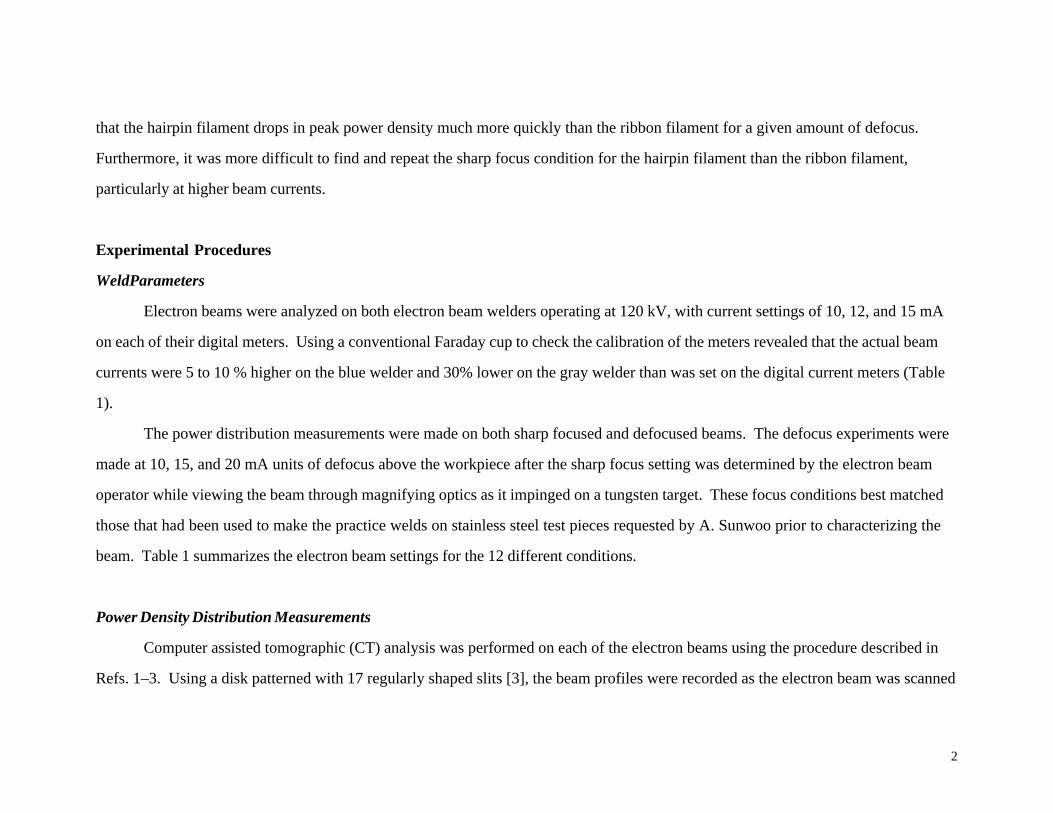
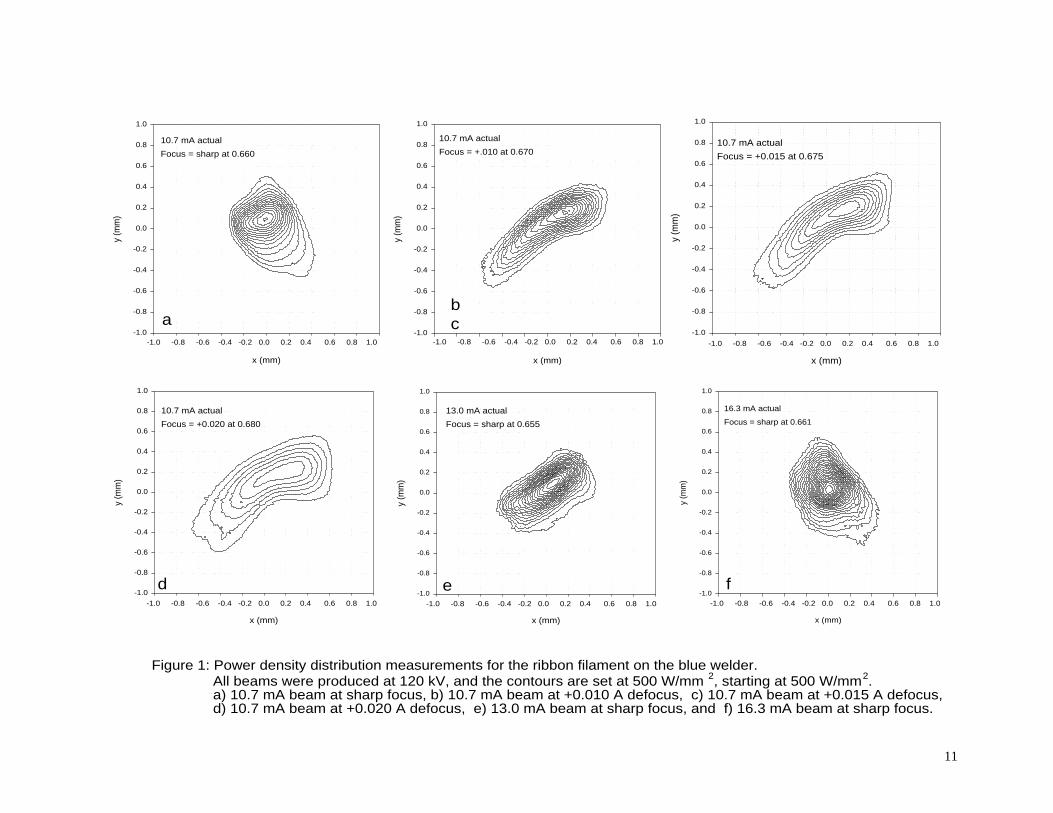
Figure 1 shows the contour plots of the six beams analyzed on the blue welder and summarizes the peak power density and
FWHM* values for all of the ribbon filament beams. For each plot, the x and y coordinates are shown in millimeters and the power
density contours in W/mm2. The sharp focused beam is oblong, and when defocused, becomes even more elongated with a curved
elliptical shape. In these plots, the orientation of each beam is kept constant such that the beams are plotted in the same orientation as
they are viewed through the electron beam welder optics, i.e., with the x-axis extending left-to-right and the y-axis, front-to-back of the
electron beam chamber.
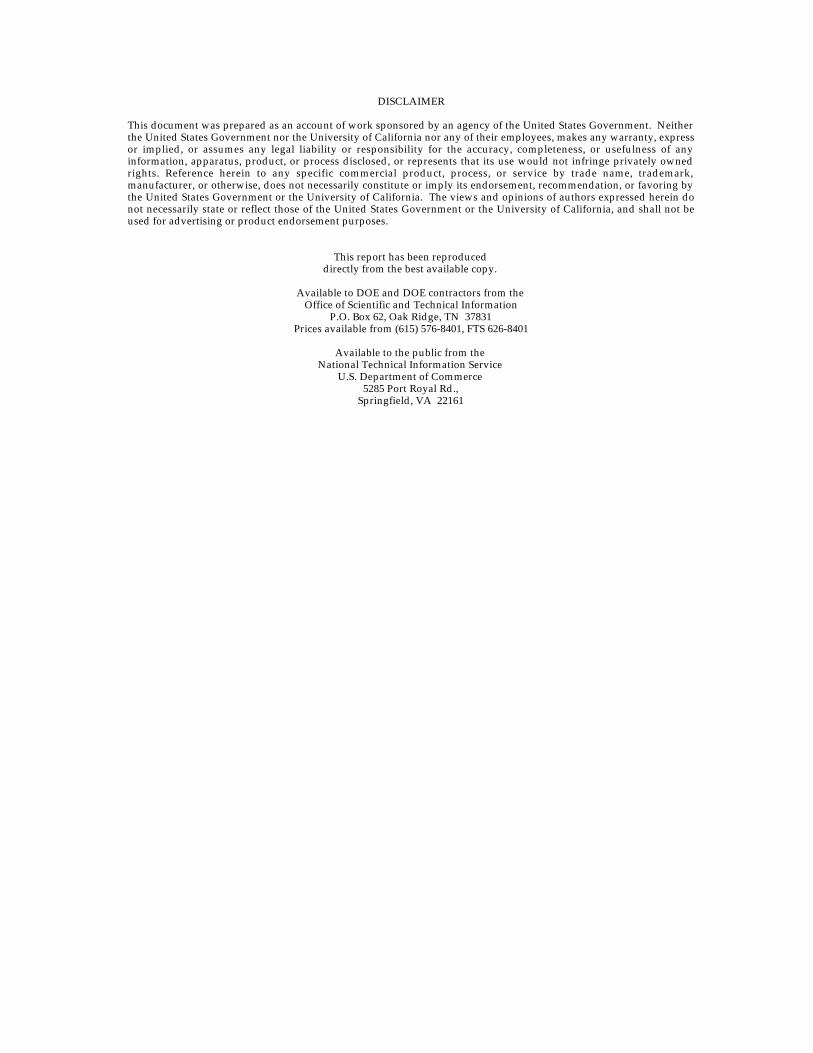
Hairpin Filament on the “Gray” Welder
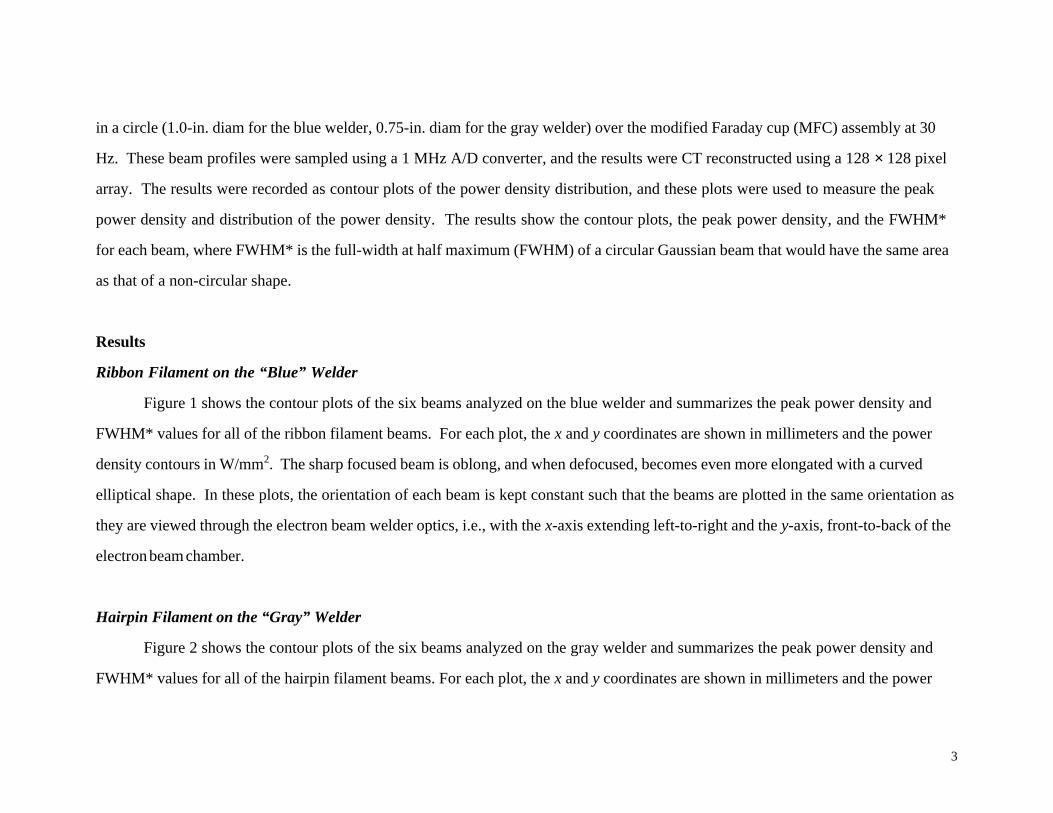
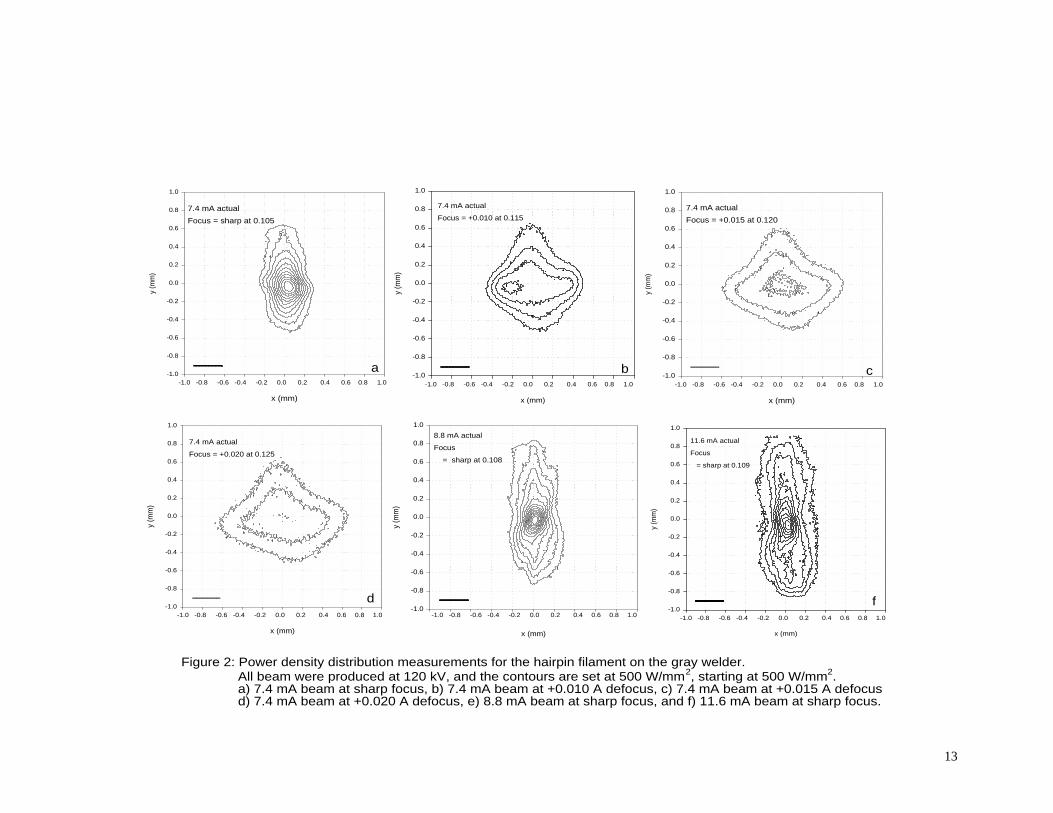
Figure 2 shows the contour plots of the six beams analyzed on the gray welder and summarizes the peak power density and
FWHM* values for all of the hairpin filament beams. For each plot, the x and y coordinates are shown in millimeters and the power
4
density contours in W/mm2. The sharp focused beam is elliptically shaped but when defocused, is diamond shaped. In these plots, the
orientation of each beam is also the same orientation as they are viewed through the electron beam welder optics, i.e., with the x-axis
extending left-to-right and the y-axis, front-to-back of the electron beam chamber.
Beam Defocus Study
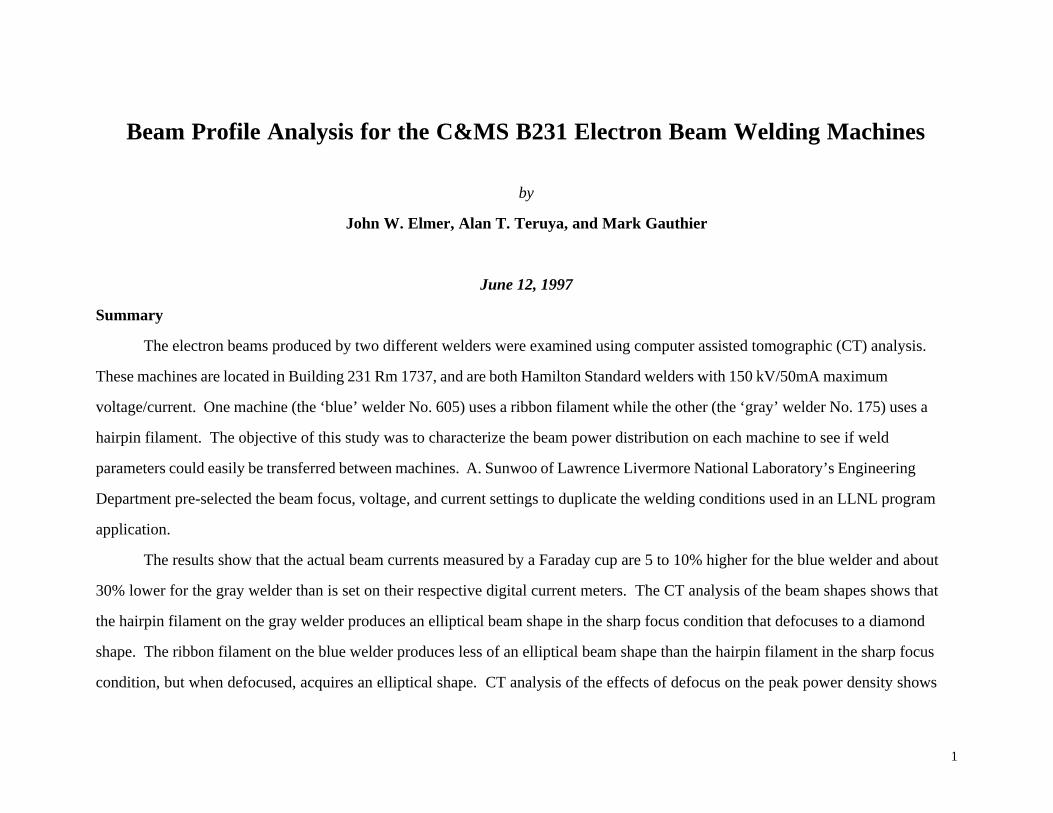
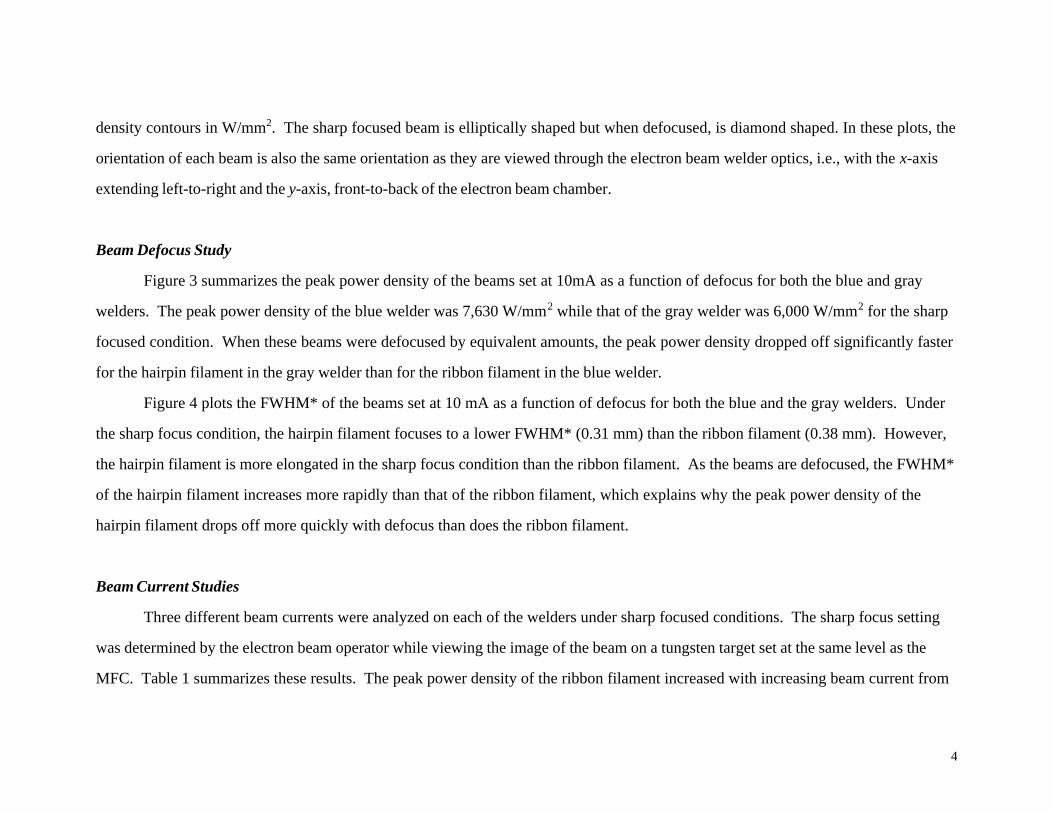
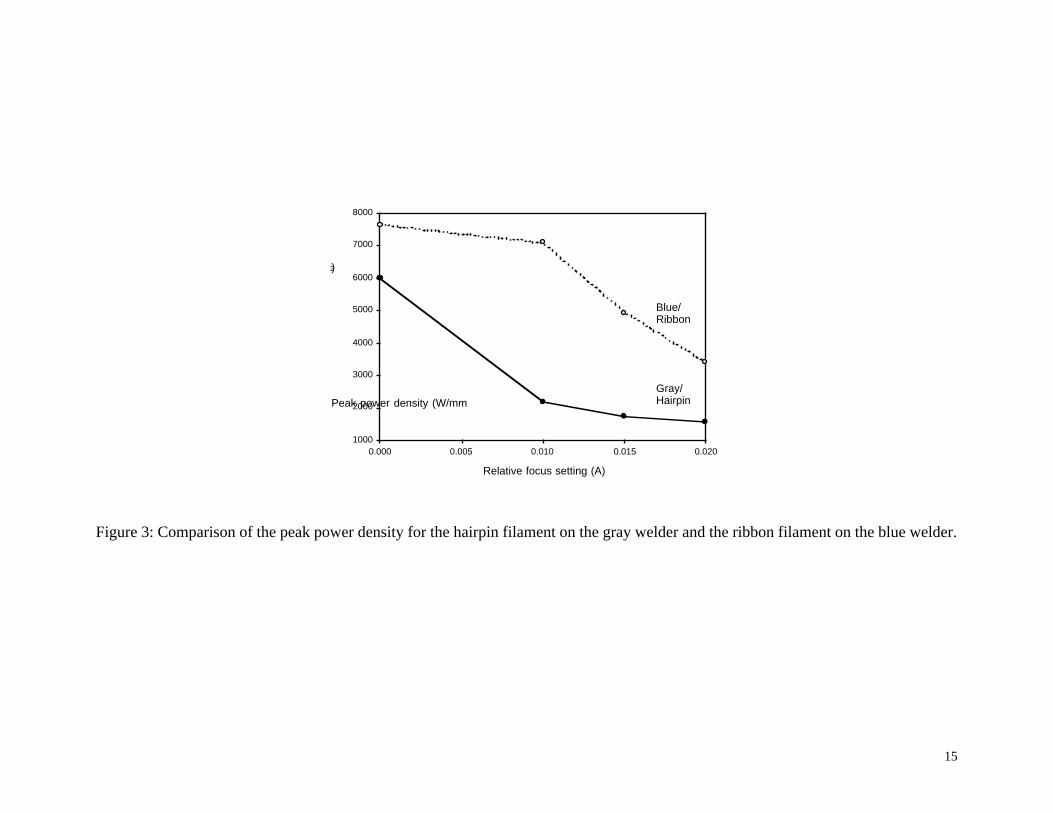
Figure 3 summarizes the peak power density of the beams set at 10mA as a function of defocus for both the blue and gray
welders. The peak power density of the blue welder was 7,630 W/mm2 while that of the gray welder was 6,000 W/mm2 for the sharp
focused condition. When these beams were defocused by equivalent amounts, the peak power density dropped off significantly faster
for the hairpin filament in the gray welder than for the ribbon filament in the blue welder.
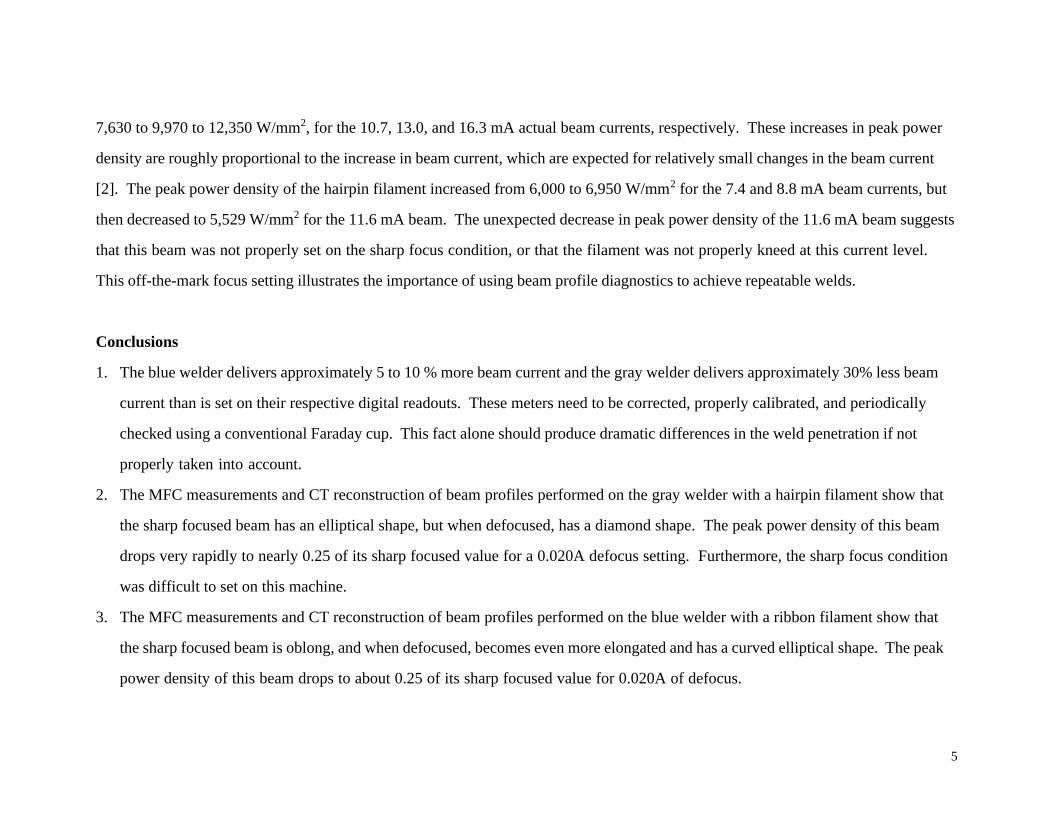
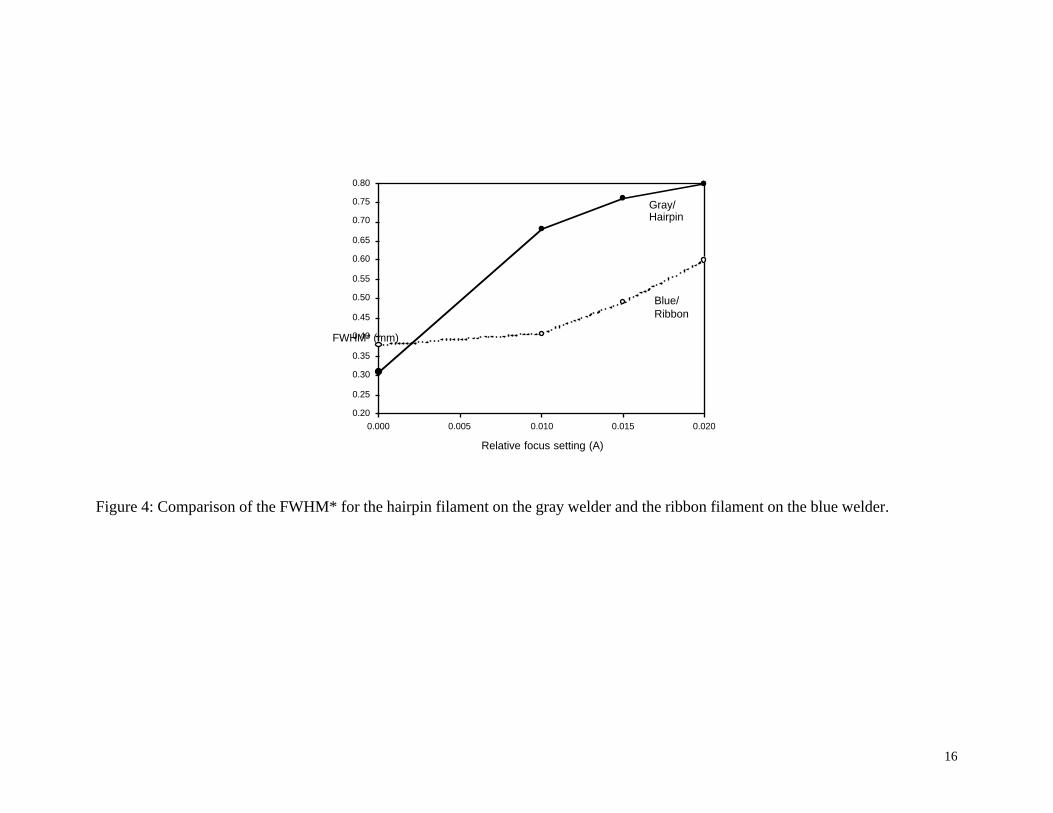
Figure 4 plots the FWHM* of the beams set at 10 mA as a function of defocus for both the blue and the gray welders. Under
the sharp focus condition, the hairpin filament focuses to a lower FWHM* (0.31 mm) than the ribbon filament (0.38 mm). However,
the hairpin filament is more elongated in the sharp focus condition than the ribbon filament. As the beams are defocused, the FWHM*
of the hairpin filament increases more rapidly than that of the ribbon filament, which explains why the peak power density of the
hairpin filament drops off more quickly with defocus than does the ribbon filament.
Beam Current Studies
Three different beam currents were analyzed on each of the welders under sharp focused conditions. The sharp focus setting
was determined by the electron beam operator while viewing the image of the beam on a tungsten target set at the same level as the
MFC. Table 1 summarizes these results. The peak power density of the ribbon filament increased with increasing beam current from
5
7,630 to 9,970 to 12,350 W/mm2, for the 10.7, 13.0, and 16.3 mA actual beam currents, respectively. These increases in peak power
density are roughly proportional to the increase in beam current, which are expected for relatively small changes in the beam current
[2]. The peak power density of the hairpin filament increased from 6,000 to 6,950 W/mm2 for the 7.4 and 8.8 mA beam currents, but
then decreased to 5,529 W/mm2 for the 11.6 mA beam. The unexpected decrease in peak power density of the 11.6 mA beam suggests
that this beam was not properly set on the sharp focus condition, or that the filament was not properly kneed at this current level.
This off-the-mark focus setting illustrates the importance of using beam profile diagnostics to achieve repeatable welds.
Conclusions
1. The blue welder delivers approximately 5 to 10 % more beam current and the gray welder delivers approximately 30% less beam
current than is set on their respective digital readouts. These meters need to be corrected, properly calibrated, and periodically
checked using a conventional Faraday cup. This fact alone should produce dramatic differences in the weld penetration if not
properly taken into account.
2. The MFC measurements and CT reconstruction of beam profiles performed on the gray welder with a hairpin filament show that
the sharp focused beam has an elliptical shape, but when defocused, has a diamond shape. The peak power density of this beam
drops very rapidly to nearly 0.25 of its sharp focused value for a 0.020A defocus setting. Furthermore, the sharp focus condition
was difficult to set on this machine.
3. The MFC measurements and CT reconstruction of beam profiles performed on the blue welder with a ribbon filament show that
the sharp focused beam is oblong, and when defocused, becomes even more elongated and has a curved elliptical shape. The peak
power density of this beam drops to about 0.25 of its sharp focused value for 0.020A of defocus.
6
4. Transferability of welding parameters between these two machines is difficult to perform since the filaments produce different
beam shapes and the beams respond differently to the defocus settings.
7
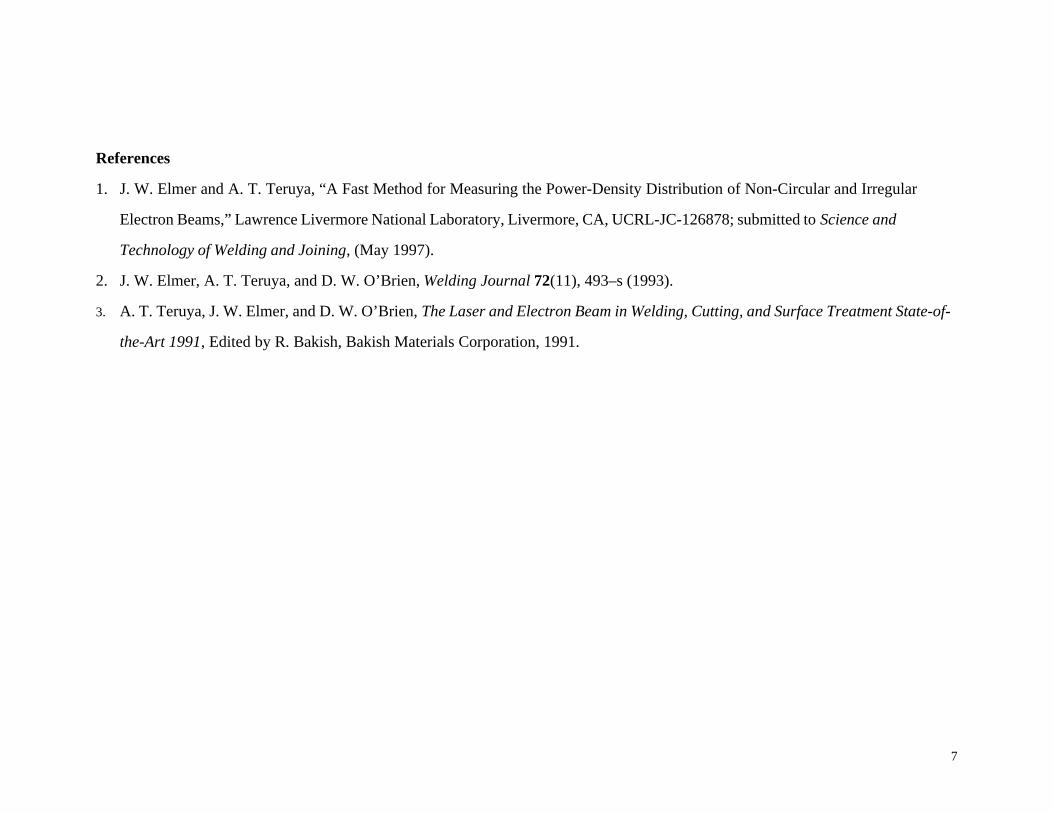
References
1. J. W. Elmer and A. T. Teruya, “A Fast Method for Measuring the Power-Density Distribution of Non-Circular and Irregular
Electron Beams,” Lawrence Livermore National Laboratory, Livermore, CA, UCRL-JC-126878; submitted to Science and
Technology of Welding and Joining, (May 1997).
2. J. W. Elmer, A. T. Teruya, and D. W. O’Brien, Welding Journal 72(11), 493–s (1993).
3. A. T. Teruya, J. W. Elmer, and D. W. O’Brien, The Laser and Electron Beam in Welding, Cutting, and Surface Treatment State-of-
the-Art 1991, Edited by R. Bakish, Bakish Materials Corporation, 1991.
8
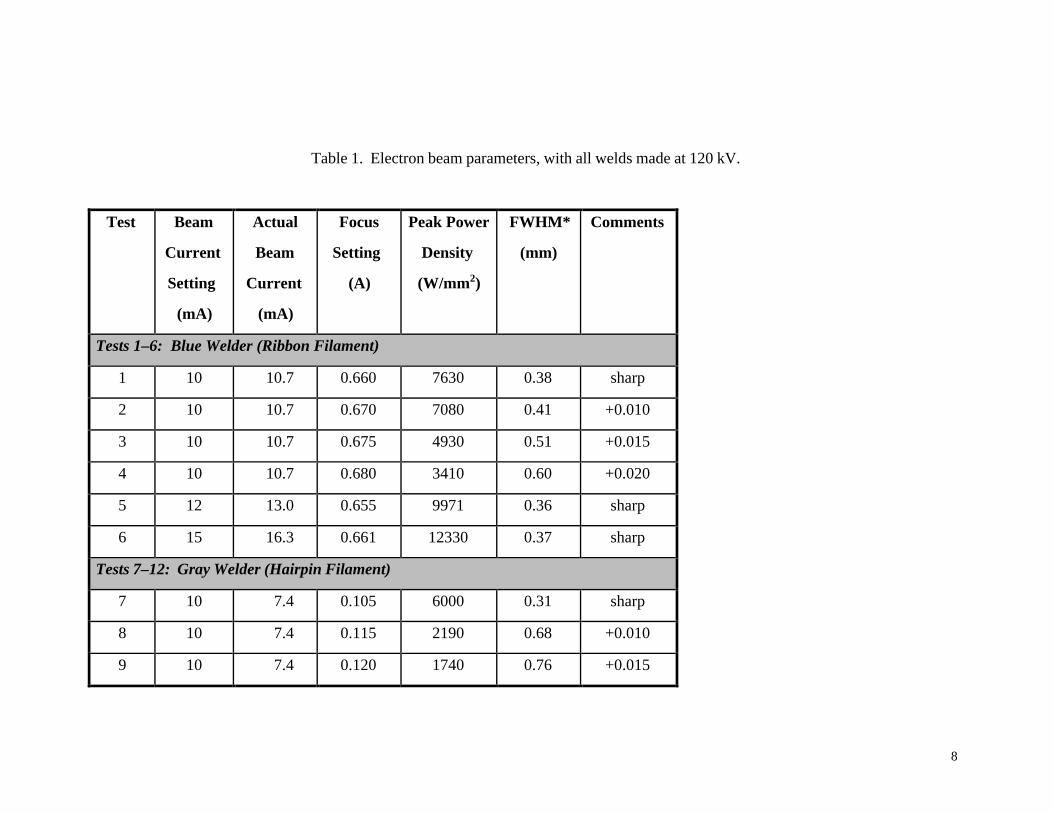
Table 1. Electron beam parameters, with all welds made at 120 kV.
Test Beam
Current
Setting
(mA)
Actual
Beam
Current
(mA)
Focus
Setting
(A)
Peak Power
Density
(W/mm2)
FWHM*
(mm)
Comments
Tests 1–6: Blue Welder (Ribbon Filament)
1 10 10.7 0.660 7630 0.38 sharp
2 10 10.7 0.670 7080 0.41 +0.010
3 10 10.7 0.675 4930 0.51 +0.015
4 10 10.7 0.680 3410 0.60 +0.020
5 12 13.0 0.655 9971 0.36 sharp
6 15 16.3 0.661 12330 0.37 sharp
Tests 7–12: Gray Welder (Hairpin Filament)
7 10 7.4 0.105 6000 0.31 sharp
8 10 7.4 0.115 2190 0.68 +0.010
9 10 7.4 0.120 1740 0.76 +0.015
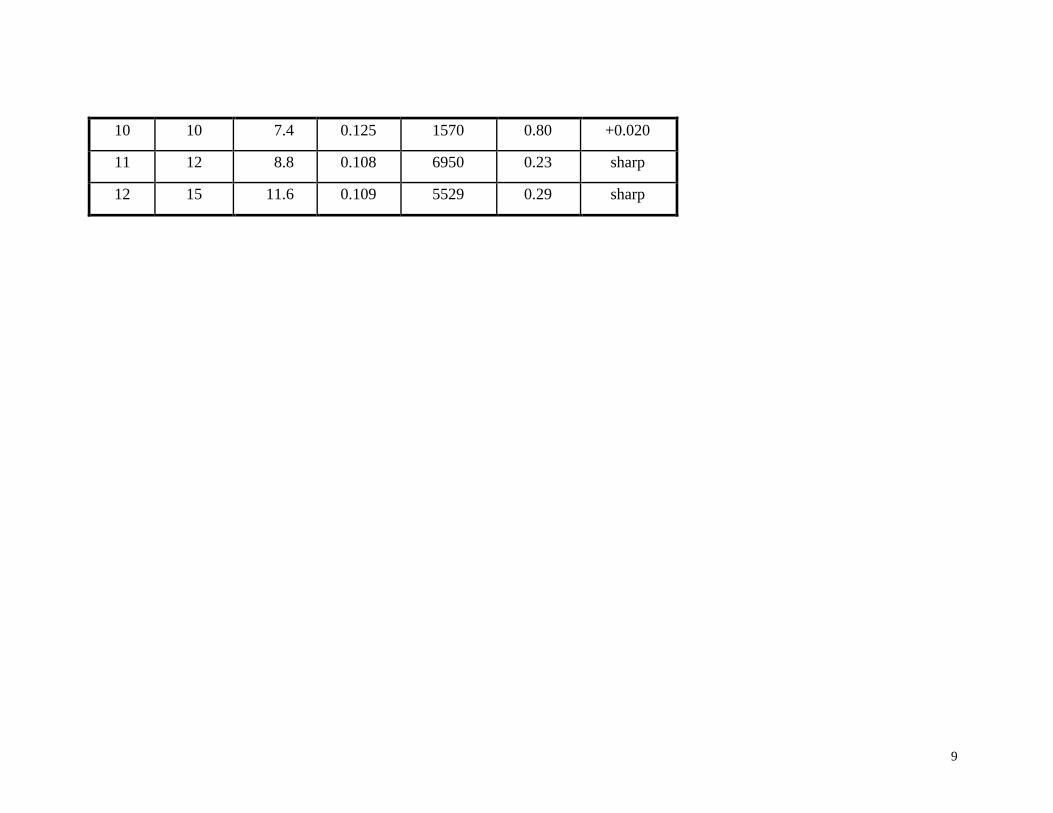
9
10 10 7.4 0.125 1570 0.80 +0.020
11 12 8.8 0.108 6950 0.23 sharp
12 15 11.6 0.109 5529 0.29 sharp

10
11
x (mm)
-1.0 -0.8 -0.6 -0.4 -0.2 0.0 0.2 0.4 0.6 0.8 1.0
y (m
m)
-1.0
-0.8
-0.6
-0.4
-0.2
0.0
0.2
0.4
0.6
0.8
1.0
10.7 mA actual
Focus = sharp at 0.660
x (mm)
y (m
m)
-1.0
-0.8
-0.6
-0.4
-0.2
0.0
0.2
0.4
0.6
0.8
1.0
10.7 mA actual
Focus = +.010 at 0.670
x (mm)
y (m
m)
-1.0
-0.8
-0.6
-0.4
-0.2
0.0
0.2
0.4
0.6
0.8
1.0
10.7 mA actual
Focus = +0.015 at 0.675
x (mm)
y (m
m)
-1.0
-0.8
-0.6
-0.4
-0.2
0.0
0.2
0.4
0.6
0.8
1.0
10.7 mA actual
Focus = +0.020 at 0.680
x (mm)
y (m
m)
-1.0
-0.8
-0.6
-0.4
-0.2
0.0
0.2
0.4
0.6
0.8
1.0
13.0 mA actual
Focus = sharp at 0.655
x (mm)
y (m
m)
-1.0
-0.8
-0.6
-0.4
-0.2
0.0
0.2
0.4
0.6
0.8
1.0
16.3 mA actual
Focus = sharp at 0.661
abc
d e f
Figure 1: Power density distribution measurements for the ribbon filament on the blue welder. All beams were produced at 120 kV, and the contours are set at 500 W/mm 2, starting at 500 W/mm2. a) 10.7 mA beam at sharp focus, b) 10.7 mA beam at +0.010 A defocus, c) 10.7 mA beam at +0.015 A defocus, d) 10.7 mA beam at +0.020 A defocus, e) 13.0 mA beam at sharp focus, and f) 16.3 mA beam at sharp focus.
-1.0 -0.8 -0.6 -0.4 -0.2 0.0 0.2 0.4 0.6 0.8 1.0
-1.0 -0.8 -0.6 -0.4 -0.2 0.0 0.2 0.4 0.6 0.8 1.0 -1.0 -0.8 -0.6 -0.4 -0.2 0.0 0.2 0.4 0.6 0.8 1.0 -1.0 -0.8 -0.6 -0.4 -0.2 0.0 0.2 0.4 0.6 0.8 1.0
-1.0 -0.8 -0.6 -0.4 -0.2 0.0 0.2 0.4 0.6 0.8 1.0

12
13
Figure 2: Power density distribution measurements for the hairpin filament on the gray welder. All beam were produced at 120 kV, and the contours are set at 500 W/mm2, starting at 500 W/mm2. a) 7.4 mA beam at sharp focus, b) 7.4 mA beam at +0.010 A defocus, c) 7.4 mA beam at +0.015 A defocus d) 7.4 mA beam at +0.020 A defocus, e) 8.8 mA beam at sharp focus, and f) 11.6 mA beam at sharp focus.
x (mm)
-1.0 -0.8 -0.6 -0.4 -0.2 0.0 0.2 0.4 0.6 0.8 1.0
y (m
m)
-1.0
-0.8
-0.6
-0.4
-0.2
0.0
0.2
0.4
0.6
0.8
1.0
11.6 mA actual
Focus
= sharp at 0.109
f
x (mm)
-1.0 -0.8 -0.6 -0.4 -0.2 0.0 0.2 0.4 0.6 0.8 1.0
y (m
m)
-1.0
-0.8
-0.6
-0.4
-0.2
0.0
0.2
0.4
0.6
0.8
1.0
7.4 mA actual
Focus = sharp at 0.105
x (mm)
-1.0 -0.8 -0.6 -0.4 -0.2 0.0 0.2 0.4 0.6 0.8 1.0
y (m
m)
-1.0
-0.8
-0.6
-0.4
-0.2
0.0
0.2
0.4
0.6
0.8
1.0
7.4 mA actual
Focus = +0.010 at 0.115
a b
x (mm)
-1.0 -0.8 -0.6 -0.4 -0.2 0.0 0.2 0.4 0.6 0.8 1.0
y (m
m)
-1.0
-0.8
-0.6
-0.4
-0.2
0.0
0.2
0.4
0.6
0.8
1.0
7.4 mA actual
Focus = +0.015 at 0.120
c
d
x (mm)
-1.0 -0.8 -0.6 -0.4 -0.2 0.0 0.2 0.4 0.6 0.8 1.0 -1.0 -0.8 -0.6 -0.4 -0.2 0.0 0.2 0.4 0.6 0.8 1.0
y (m
m)
-1.0
-0.8
-0.6
-0.4
-0.2
0.0
0.2
0.4
0.6
0.8
1.0
7.4 mA actual
Focus = +0.020 at 0.125
d e
x (mm)
y (m
m)
-1.0
-0.8
-0.6
-0.4
-0.2
0.0
0.2
0.4
0.6
0.8
1.0
8.8 mA actual
Focus
= sharp at 0.108

14
15
Relative focus setting (A)
0.000 0.005 0.010 0.015 0.020
Peak power density (W/mm
2)
1000
2000
3000
4000
5000
6000
7000
8000
Gray/Hairpin
Blue/Ribbon
Figure 3: Comparison of the peak power density for the hairpin filament on the gray welder and the ribbon filament on the blue welder.
16
Hairpin
Ribbon
Relative focus setting (A)
0.000 0.005 0.010 0.015 0.020
FWHM* (mm)
0.20
0.25
0.30
0.35
0.40
0.45
0.50
0.55
0.60
0.65
0.70
0.75
0.80
Blue/Ribbon
Gray/Hairpin
Figure 4: Comparison of the FWHM* for the hairpin filament on the gray welder and the ribbon filament on the blue welder.
Technical Inform
ation Departm
ent • Lawrence Liverm
ore National Laboratory
University of C
alifornia • Livermore, C
alifornia 94551