Embed Size (px)
Citation preview
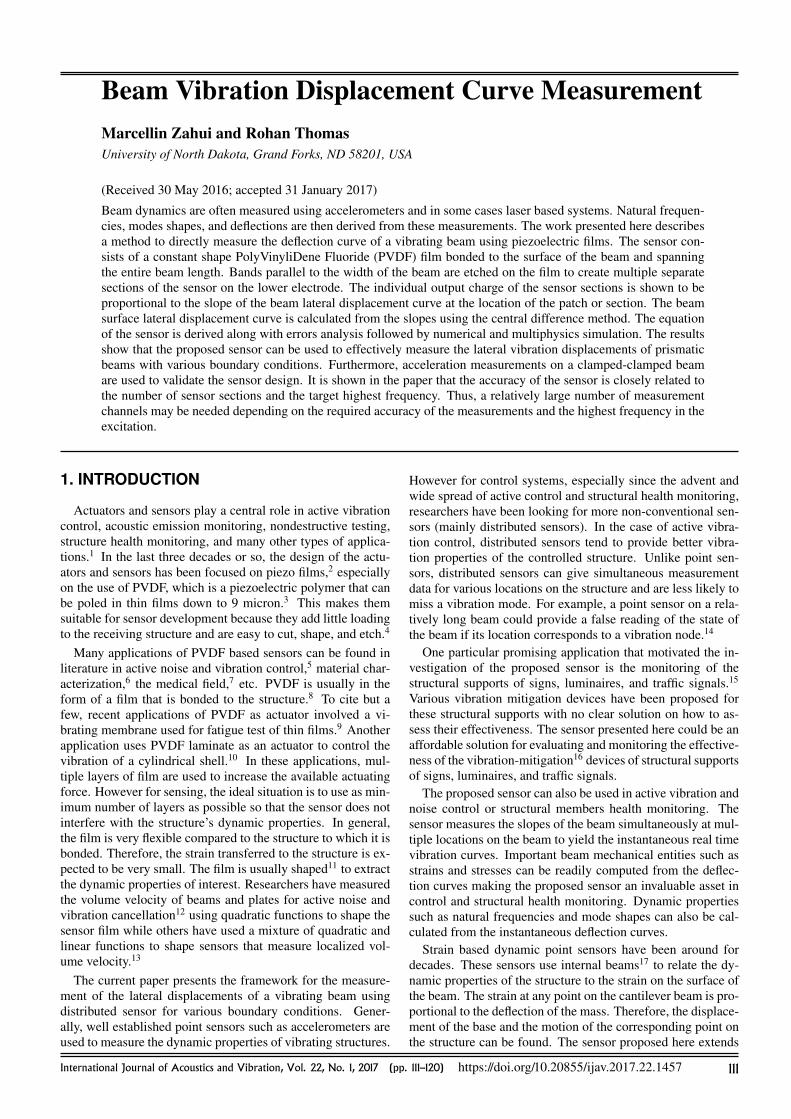
Beam Vibration Displacement Curve MeasurementMarcellin Zahui and Rohan ThomasUniversity of North Dakota, Grand Forks, ND 58201, USA
(Received 30 May 2016; accepted 31 January 2017)
Beam dynamics are often measured using accelerometers and in some cases laser based systems. Natural frequen-cies, modes shapes, and deflections are then derived from these measurements. The work presented here describesa method to directly measure the deflection curve of a vibrating beam using piezoelectric films. The sensor con-sists of a constant shape PolyVinyliDene Fluoride (PVDF) film bonded to the surface of the beam and spanningthe entire beam length. Bands parallel to the width of the beam are etched on the film to create multiple separatesections of the sensor on the lower electrode. The individual output charge of the sensor sections is shown to beproportional to the slope of the beam lateral displacement curve at the location of the patch or section. The beamsurface lateral displacement curve is calculated from the slopes using the central difference method. The equationof the sensor is derived along with errors analysis followed by numerical and multiphysics simulation. The resultsshow that the proposed sensor can be used to effectively measure the lateral vibration displacements of prismaticbeams with various boundary conditions. Furthermore, acceleration measurements on a clamped-clamped beamare used to validate the sensor design. It is shown in the paper that the accuracy of the sensor is closely related tothe number of sensor sections and the target highest frequency. Thus, a relatively large number of measurementchannels may be needed depending on the required accuracy of the measurements and the highest frequency in theexcitation.
1. INTRODUCTION
Actuators and sensors play a central role in active vibrationcontrol, acoustic emission monitoring, nondestructive testing,structure health monitoring, and many other types of applica-tions.1 In the last three decades or so, the design of the actu-ators and sensors has been focused on piezo films,2 especiallyon the use of PVDF, which is a piezoelectric polymer that canbe poled in thin films down to 9 micron.3 This makes themsuitable for sensor development because they add little loadingto the receiving structure and are easy to cut, shape, and etch.4
Many applications of PVDF based sensors can be found inliterature in active noise and vibration control,5 material char-acterization,6 the medical field,7 etc. PVDF is usually in theform of a film that is bonded to the structure.8 To cite but afew, recent applications of PVDF as actuator involved a vi-brating membrane used for fatigue test of thin films.9 Anotherapplication uses PVDF laminate as an actuator to control thevibration of a cylindrical shell.10 In these applications, mul-tiple layers of film are used to increase the available actuatingforce. However for sensing, the ideal situation is to use as min-imum number of layers as possible so that the sensor does notinterfere with the structure’s dynamic properties. In general,the film is very flexible compared to the structure to which it isbonded. Therefore, the strain transferred to the structure is ex-pected to be very small. The film is usually shaped11 to extractthe dynamic properties of interest. Researchers have measuredthe volume velocity of beams and plates for active noise andvibration cancellation12 using quadratic functions to shape thesensor film while others have used a mixture of quadratic andlinear functions to shape sensors that measure localized vol-ume velocity.13
The current paper presents the framework for the measure-ment of the lateral displacements of a vibrating beam usingdistributed sensor for various boundary conditions. Gener-ally, well established point sensors such as accelerometers areused to measure the dynamic properties of vibrating structures.
However for control systems, especially since the advent andwide spread of active control and structural health monitoring,researchers have been looking for more non-conventional sen-sors (mainly distributed sensors). In the case of active vibra-tion control, distributed sensors tend to provide better vibra-tion properties of the controlled structure. Unlike point sen-sors, distributed sensors can give simultaneous measurementdata for various locations on the structure and are less likely tomiss a vibration mode. For example, a point sensor on a rela-tively long beam could provide a false reading of the state ofthe beam if its location corresponds to a vibration node.14
One particular promising application that motivated the in-vestigation of the proposed sensor is the monitoring of thestructural supports of signs, luminaires, and traffic signals.15
Various vibration mitigation devices have been proposed forthese structural supports with no clear solution on how to as-sess their effectiveness. The sensor presented here could be anaffordable solution for evaluating and monitoring the effective-ness of the vibration-mitigation16 devices of structural supportsof signs, luminaires, and traffic signals.
The proposed sensor can also be used in active vibration andnoise control or structural members health monitoring. Thesensor measures the slopes of the beam simultaneously at mul-tiple locations on the beam to yield the instantaneous real timevibration curves. Important beam mechanical entities such asstrains and stresses can be readily computed from the deflec-tion curves making the proposed sensor an invaluable asset incontrol and structural health monitoring. Dynamic propertiessuch as natural frequencies and mode shapes can also be cal-culated from the instantaneous deflection curves.
Strain based dynamic point sensors have been around fordecades. These sensors use internal beams17 to relate the dy-namic properties of the structure to the strain on the surface ofthe beam. The strain at any point on the cantilever beam is pro-portional to the deflection of the mass. Therefore, the displace-ment of the base and the motion of the corresponding point onthe structure can be found. The sensor proposed here extends
International Journal of Acoustics and Vibration, Vol. 22, No. 1, 2017 (pp. 111–120) https://doi.org/10.20855/ijav.2017.22.1457 111
M. Zahui, et al.: BEAM VIBRATION DISPLACEMENT CURVE MEASUREMENT
to the cantilever beam sensor concept with the strain sensor(PVDF) directly attached to the structure. Multiple sections ofthe sensor is used to measure the strain at multiple locations onthe beam and translate those strains into displacements alongthe beam length. It is therefore obvious that the accuracy ofthe measurement will depend on the numbers of sensor sec-tions relative to the highest target frequency.18 The proposeddisplacement sensor approach presented here is made possibleby the availability and cost of PVDF films, etching processes,and single chip computers.
2. SENSOR DESIGN
2.1. Generic Piezoelectric Film OutputCharge Equations
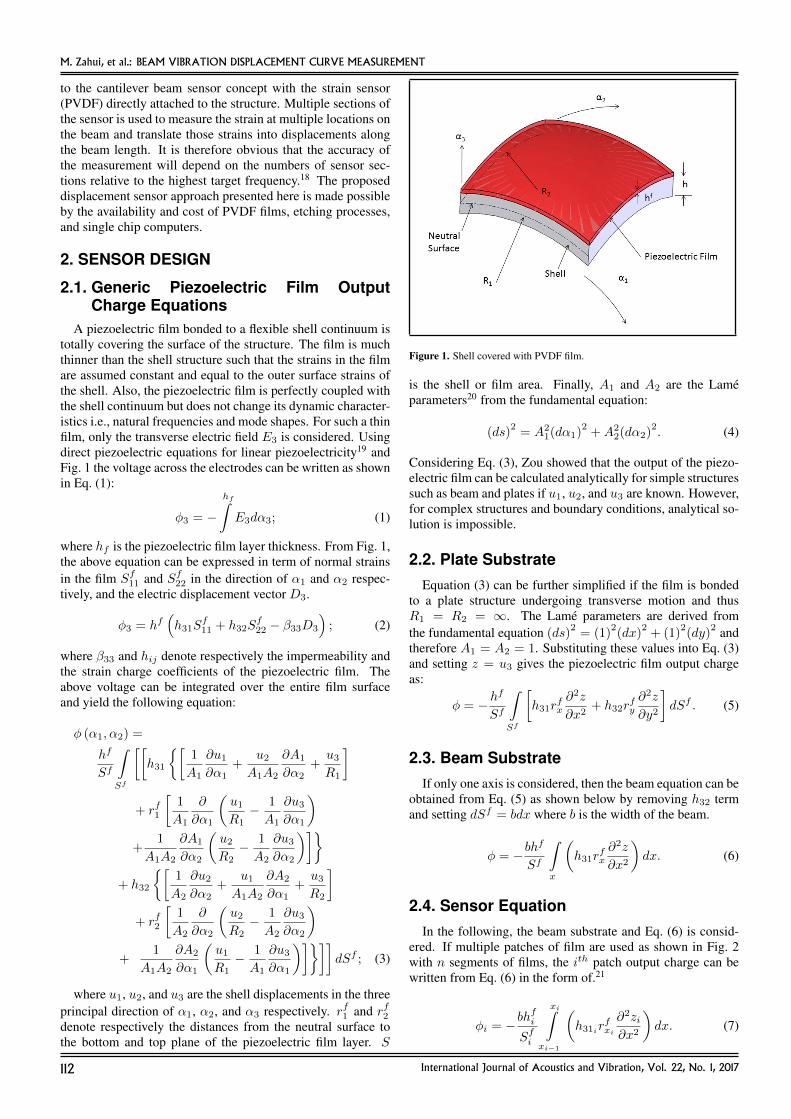
A piezoelectric film bonded to a flexible shell continuum istotally covering the surface of the structure. The film is muchthinner than the shell structure such that the strains in the filmare assumed constant and equal to the outer surface strains ofthe shell. Also, the piezoelectric film is perfectly coupled withthe shell continuum but does not change its dynamic character-istics i.e., natural frequencies and mode shapes. For such a thinfilm, only the transverse electric field E3 is considered. Usingdirect piezoelectric equations for linear piezoelectricity19 andFig. 1 the voltage across the electrodes can be written as shownin Eq. (1):
φ3 = −hf∫E3dα3; (1)
where hf is the piezoelectric film layer thickness. From Fig. 1,the above equation can be expressed in term of normal strainsin the film Sf
11 and Sf22 in the direction of α1 and α2 respec-
tively, and the electric displacement vector D3.
φ3 = hf(h31S
f11 + h32S
f22 − β33D3
); (2)
where β33 and hij denote respectively the impermeability andthe strain charge coefficients of the piezoelectric film. Theabove voltage can be integrated over the entire film surfaceand yield the following equation:
φ (α1, α2) =
hf
Sf
∫Sf
[[h31
{[1
A1
∂u1∂α1
+u2
A1A2
∂A1
∂α2+u3R1
]
+ rf1
[1
A1
∂
∂α1
(u1R1− 1
A1
∂u3∂α1
)+
1
A1A2
∂A1
∂α2
(u2R2− 1
A2
∂u3∂α2
)]}+ h32
{[1
A2
∂u2∂α2
+u1
A1A2
∂A2
∂α1+u3R2
]+ rf2
[1
A2
∂
∂α2
(u2R2− 1
A2
∂u3∂α2
)+
1
A1A2
∂A2
∂α1
(u1R1− 1
A1
∂u3∂α1
)]}]]dSf ; (3)
where u1, u2, and u3 are the shell displacements in the threeprincipal direction of α1, α2, and α3 respectively. rf1 and rf2denote respectively the distances from the neutral surface tothe bottom and top plane of the piezoelectric film layer. S
Figure 1. Shell covered with PVDF film.
is the shell or film area. Finally, A1 and A2 are the Lameparameters20 from the fundamental equation:
(ds)2
= A21(dα1)
2+A2
2(dα2)2. (4)
Considering Eq. (3), Zou showed that the output of the piezo-electric film can be calculated analytically for simple structuressuch as beam and plates if u1, u2, and u3 are known. However,for complex structures and boundary conditions, analytical so-lution is impossible.
2.2. Plate SubstrateEquation (3) can be further simplified if the film is bonded
to a plate structure undergoing transverse motion and thusR1 = R2 = ∞. The Lame parameters are derived fromthe fundamental equation (ds)
2= (1)
2(dx)
2+ (1)
2(dy)
2 andtherefore A1 = A2 = 1. Substituting these values into Eq. (3)and setting z = u3 gives the piezoelectric film output chargeas:
φ = −hf
Sf
∫Sf
[h31r
fx
∂2z
∂x2+ h32r
fy
∂2z
∂y2
]dSf . (5)
2.3. Beam SubstrateIf only one axis is considered, then the beam equation can be
obtained from Eq. (5) as shown below by removing h32 termand setting dSf = bdx where b is the width of the beam.
φ = −bhf
Sf
∫x
(h31r
fx
∂2z
∂x2
)dx. (6)
2.4. Sensor EquationIn the following, the beam substrate and Eq. (6) is consid-
ered. If multiple patches of film are used as shown in Fig. 2with n segments of films, the ith patch output charge can bewritten from Eq. (6) in the form of.21
φi = −bhfi
Sfi
xi∫xi−1
(h31ir
fxi
∂2zi∂x2
)dx. (7)
112 International Journal of Acoustics and Vibration, Vol. 22, No. 1, 2017
M. Zahui, et al.: BEAM VIBRATION DISPLACEMENT CURVE MEASUREMENT
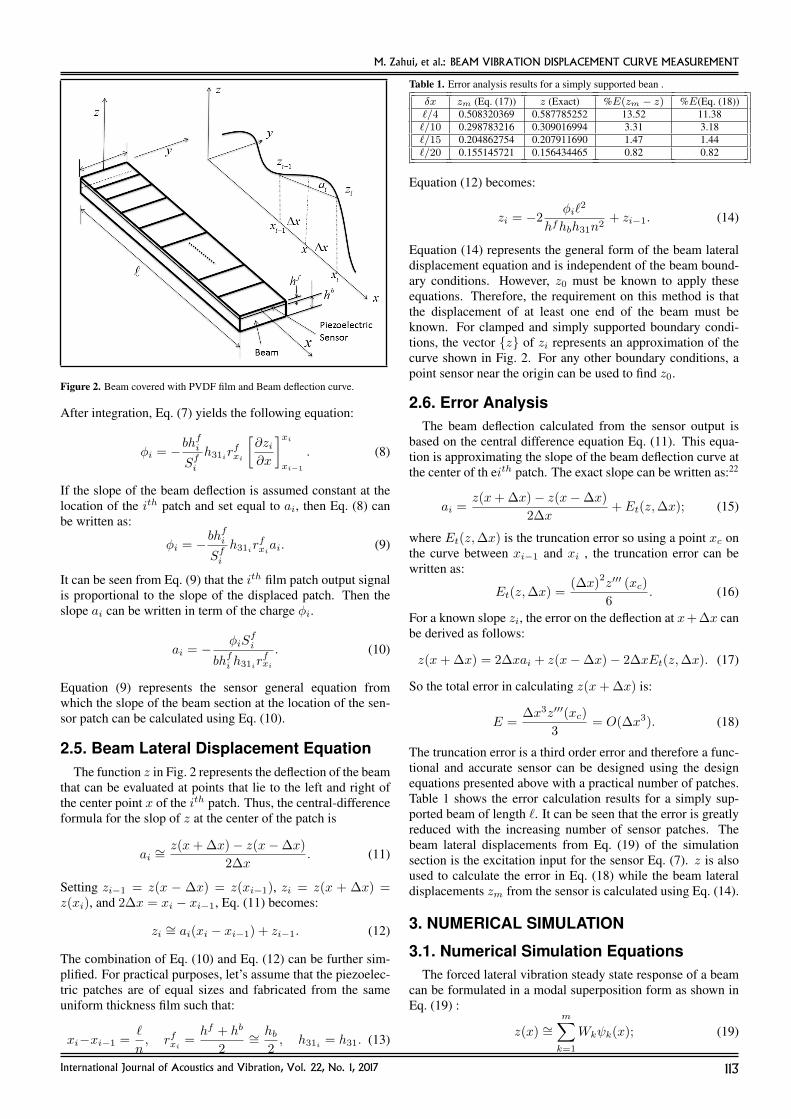
Figure 2. Beam covered with PVDF film and Beam deflection curve.
After integration, Eq. (7) yields the following equation:
φi = −bhfi
Sfi
h31irfxi
[∂zi∂x
]xi
xi−1
. (8)
If the slope of the beam deflection is assumed constant at thelocation of the ith patch and set equal to ai, then Eq. (8) canbe written as:
φi = −bhfi
Sfi
h31irfxiai. (9)
It can be seen from Eq. (9) that the ith film patch output signalis proportional to the slope of the displaced patch. Then theslope ai can be written in term of the charge φi.
ai = − φiSfi
bhfi h31irfxi
. (10)
Equation (9) represents the sensor general equation fromwhich the slope of the beam section at the location of the sen-sor patch can be calculated using Eq. (10).
2.5. Beam Lateral Displacement EquationThe function z in Fig. 2 represents the deflection of the beam
that can be evaluated at points that lie to the left and right ofthe center point x of the ith patch. Thus, the central-differenceformula for the slop of z at the center of the patch is
ai ∼=z(x+ ∆x)− z(x−∆x)
2∆x. (11)
Setting zi−1 = z(x − ∆x) = z(xi−1), zi = z(x + ∆x) =z(xi), and 2∆x = xi − xi−1, Eq. (11) becomes:
zi ∼= ai(xi − xi−1) + zi−1. (12)
The combination of Eq. (10) and Eq. (12) can be further sim-plified. For practical purposes, let’s assume that the piezoelec-tric patches are of equal sizes and fabricated from the sameuniform thickness film such that:
xi−xi−1 =`
n, rfxi
=hf + hb
2∼=hb2, h31i = h31. (13)
Table 1. Error analysis results for a simply supported bean .
δx zm (Eq. (17)) z (Exact) %E(zm − z) %E(Eq. (18))`/4 0.508320369 0.587785252 13.52 11.38`/10 0.298783216 0.309016994 3.31 3.18`/15 0.204862754 0.207911690 1.47 1.44`/20 0.155145721 0.156434465 0.82 0.82
Equation (12) becomes:
zi = −2φi`
2
hfhbh31n2+ zi−1. (14)
Equation (14) represents the general form of the beam lateraldisplacement equation and is independent of the beam bound-ary conditions. However, z0 must be known to apply theseequations. Therefore, the requirement on this method is thatthe displacement of at least one end of the beam must beknown. For clamped and simply supported boundary condi-tions, the vector {z} of zi represents an approximation of thecurve shown in Fig. 2. For any other boundary conditions, apoint sensor near the origin can be used to find z0.
2.6. Error AnalysisThe beam deflection calculated from the sensor output is
based on the central difference equation Eq. (11). This equa-tion is approximating the slope of the beam deflection curve atthe center of th eith patch. The exact slope can be written as:22
ai =z(x+ ∆x)− z(x−∆x)
2∆x+ Et(z,∆x); (15)
where Et(z,∆x) is the truncation error so using a point xc onthe curve between xi−1 and xi , the truncation error can bewritten as:
Et(z,∆x) =(∆x)
2z′′′ (xc)
6. (16)
For a known slope zi, the error on the deflection at x+ ∆x canbe derived as follows:
z(x+ ∆x) = 2∆xai + z(x−∆x)− 2∆xEt(z,∆x). (17)
So the total error in calculating z(x+ ∆x) is:
E =∆x3z′′′(xc)
3= O(∆x3). (18)
The truncation error is a third order error and therefore a func-tional and accurate sensor can be designed using the designequations presented above with a practical number of patches.Table 1 shows the error calculation results for a simply sup-ported beam of length `. It can be seen that the error is greatlyreduced with the increasing number of sensor patches. Thebeam lateral displacements from Eq. (19) of the simulationsection is the excitation input for the sensor Eq. (7). z is alsoused to calculate the error in Eq. (18) while the beam lateraldisplacements zm from the sensor is calculated using Eq. (14).
3. NUMERICAL SIMULATION
3.1. Numerical Simulation EquationsThe forced lateral vibration steady state response of a beam
can be formulated in a modal superposition form as shown inEq. (19) :
z(x) ∼=m∑
k=1
Wkψk(x); (19)
International Journal of Acoustics and Vibration, Vol. 22, No. 1, 2017 113
M. Zahui, et al.: BEAM VIBRATION DISPLACEMENT CURVE MEASUREMENT
where k is the kth mode number, Wk is the modal participa-tion factor, ψk is the kth mode shape, and m is the maximumnumber of modes used in the approximation. The output of theith patch can be written by using Eqs. (7), (13), and (19) as:
φi ∼= −nhfhbh31
2`
m∑k=1
Wk
xi∫xi−1
∂2ψk
∂x2dx. (20)
To perform the numerical simulation, we will assume that thebeam is excited by a general force vector {f} of unity magni-tude applied at a node and rewrite Eq. (19) in discretized formas:23
{z} ∼=m∑
k=1
{ψk} {ψk}T {f}ω2k − ω2 + jηkω2
k
; (21)
where ω is the excitation frequency, ηk is the structural damp-ing factor of the kth mode, ωk the kth natural frequency, andj2 = −1. It can be shown that
Wk∼=
{ψk} {ψk}T
ω2k − ω2 + jηkω2
k
. (22)
Equation 21 is used to calculate the response of the beam andthe mode participation factor Wk to a unit input force. Theoutput charge of each patch is then calculated using modalcoordinates Wk in Eq. (20). These output charges are thenused in Eq. (10) to calculate the slopes ai at the center of eachpatch before calculating the bean deflection using the central-difference equation (Eq. (12)). The deflection calculated fromthe sensor output charge and referred to as “Measured” is com-pared to the deflection calculated from the mode superpositionequation and referred to as “Actual.” The results of the numer-ical simulation are discussed in the next section.
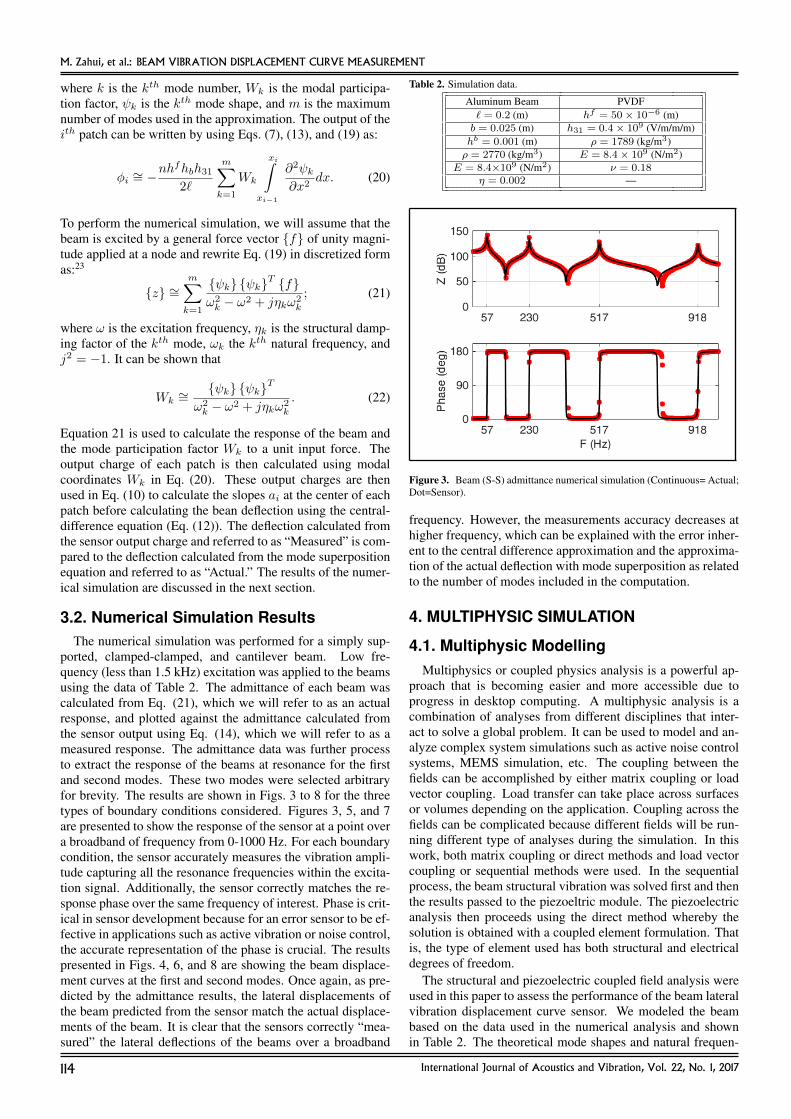
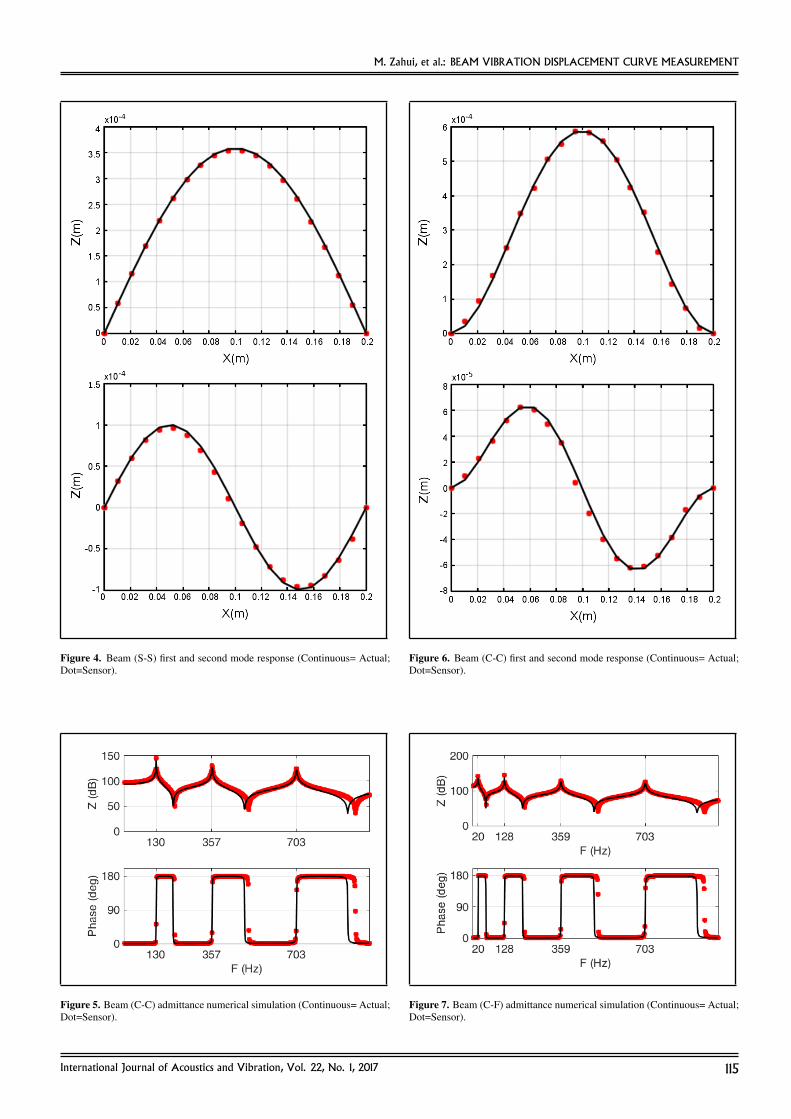
3.2. Numerical Simulation ResultsThe numerical simulation was performed for a simply sup-
ported, clamped-clamped, and cantilever beam. Low fre-quency (less than 1.5 kHz) excitation was applied to the beamsusing the data of Table 2. The admittance of each beam wascalculated from Eq. (21), which we will refer to as an actualresponse, and plotted against the admittance calculated fromthe sensor output using Eq. (14), which we will refer to as ameasured response. The admittance data was further processto extract the response of the beams at resonance for the firstand second modes. These two modes were selected arbitraryfor brevity. The results are shown in Figs. 3 to 8 for the threetypes of boundary conditions considered. Figures 3, 5, and 7are presented to show the response of the sensor at a point overa broadband of frequency from 0-1000 Hz. For each boundarycondition, the sensor accurately measures the vibration ampli-tude capturing all the resonance frequencies within the excita-tion signal. Additionally, the sensor correctly matches the re-sponse phase over the same frequency of interest. Phase is crit-ical in sensor development because for an error sensor to be ef-fective in applications such as active vibration or noise control,the accurate representation of the phase is crucial. The resultspresented in Figs. 4, 6, and 8 are showing the beam displace-ment curves at the first and second modes. Once again, as pre-dicted by the admittance results, the lateral displacements ofthe beam predicted from the sensor match the actual displace-ments of the beam. It is clear that the sensors correctly “mea-sured” the lateral deflections of the beams over a broadband
Table 2. Simulation data.
Aluminum Beam PVDF` = 0.2 (m) hf = 50× 10−6 (m)b = 0.025 (m) h31 = 0.4× 10⁹ (V/m/m/m)hb = 0.001 (m) ρ = 1789 (kg/m3)ρ = 2770 (kg/m3) E = 8.4× 10⁹ (N/m2)
E = 8.4×10⁹ (N/m2) ν = 0.18η = 0.002 —
Figure 3. Beam (S-S) admittance numerical simulation (Continuous= Actual;Dot=Sensor).
frequency. However, the measurements accuracy decreases athigher frequency, which can be explained with the error inher-ent to the central difference approximation and the approxima-tion of the actual deflection with mode superposition as relatedto the number of modes included in the computation.
4. MULTIPHYSIC SIMULATION
4.1. Multiphysic ModellingMultiphysics or coupled physics analysis is a powerful ap-
proach that is becoming easier and more accessible due toprogress in desktop computing. A multiphysic analysis is acombination of analyses from different disciplines that inter-act to solve a global problem. It can be used to model and an-alyze complex system simulations such as active noise controlsystems, MEMS simulation, etc. The coupling between thefields can be accomplished by either matrix coupling or loadvector coupling. Load transfer can take place across surfacesor volumes depending on the application. Coupling across thefields can be complicated because different fields will be run-ning different type of analyses during the simulation. In thiswork, both matrix coupling or direct methods and load vectorcoupling or sequential methods were used. In the sequentialprocess, the beam structural vibration was solved first and thenthe results passed to the piezoeltric module. The piezoelectricanalysis then proceeds using the direct method whereby thesolution is obtained with a coupled element formulation. Thatis, the type of element used has both structural and electricaldegrees of freedom.
The structural and piezoelectric coupled field analysis wereused in this paper to assess the performance of the beam lateralvibration displacement curve sensor. We modeled the beambased on the data used in the numerical analysis and shownin Table 2. The theoretical mode shapes and natural frequen-
114 International Journal of Acoustics and Vibration, Vol. 22, No. 1, 2017
M. Zahui, et al.: BEAM VIBRATION DISPLACEMENT CURVE MEASUREMENT
Figure 4. Beam (S-S) first and second mode response (Continuous= Actual;Dot=Sensor).
Figure 5. Beam (C-C) admittance numerical simulation (Continuous= Actual;Dot=Sensor).
Figure 6. Beam (C-C) first and second mode response (Continuous= Actual;Dot=Sensor).
Figure 7. Beam (C-F) admittance numerical simulation (Continuous= Actual;Dot=Sensor).
International Journal of Acoustics and Vibration, Vol. 22, No. 1, 2017 115
M. Zahui, et al.: BEAM VIBRATION DISPLACEMENT CURVE MEASUREMENT
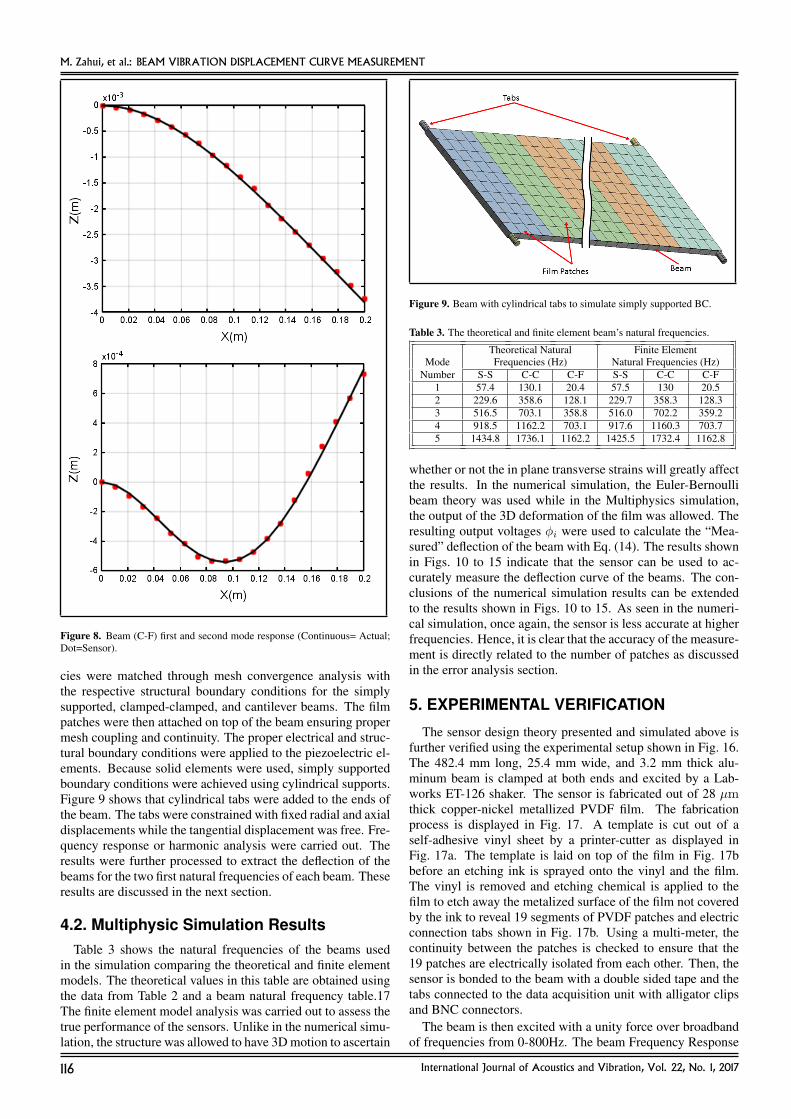
Figure 8. Beam (C-F) first and second mode response (Continuous= Actual;Dot=Sensor).
cies were matched through mesh convergence analysis withthe respective structural boundary conditions for the simplysupported, clamped-clamped, and cantilever beams. The filmpatches were then attached on top of the beam ensuring propermesh coupling and continuity. The proper electrical and struc-tural boundary conditions were applied to the piezoelectric el-ements. Because solid elements were used, simply supportedboundary conditions were achieved using cylindrical supports.Figure 9 shows that cylindrical tabs were added to the ends ofthe beam. The tabs were constrained with fixed radial and axialdisplacements while the tangential displacement was free. Fre-quency response or harmonic analysis were carried out. Theresults were further processed to extract the deflection of thebeams for the two first natural frequencies of each beam. Theseresults are discussed in the next section.
4.2. Multiphysic Simulation ResultsTable 3 shows the natural frequencies of the beams used
in the simulation comparing the theoretical and finite elementmodels. The theoretical values in this table are obtained usingthe data from Table 2 and a beam natural frequency table.17The finite element model analysis was carried out to assess thetrue performance of the sensors. Unlike in the numerical simu-lation, the structure was allowed to have 3D motion to ascertain
Figure 9. Beam with cylindrical tabs to simulate simply supported BC.
Table 3. The theoretical and finite element beam’s natural frequencies.
Theoretical Natural Finite ElementMode Frequencies (Hz) Natural Frequencies (Hz)
Number S-S C-C C-F S-S C-C C-F1 57.4 130.1 20.4 57.5 130 20.52 229.6 358.6 128.1 229.7 358.3 128.33 516.5 703.1 358.8 516.0 702.2 359.24 918.5 1162.2 703.1 917.6 1160.3 703.75 1434.8 1736.1 1162.2 1425.5 1732.4 1162.8
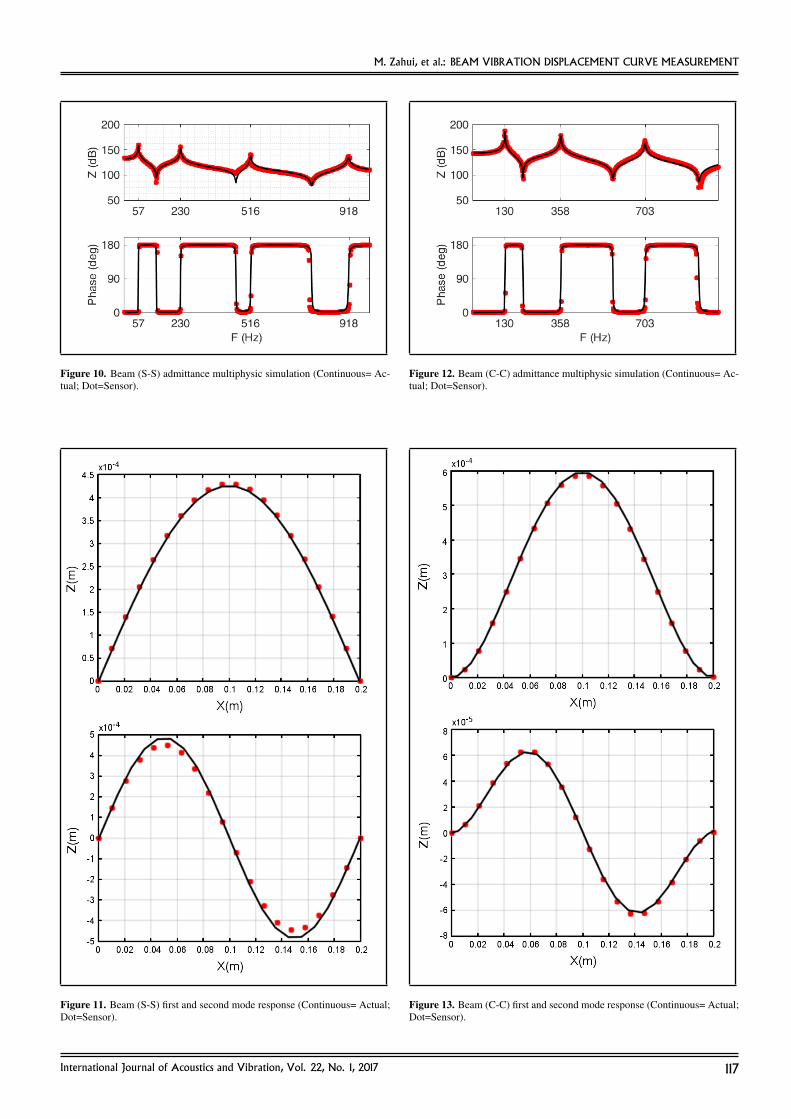
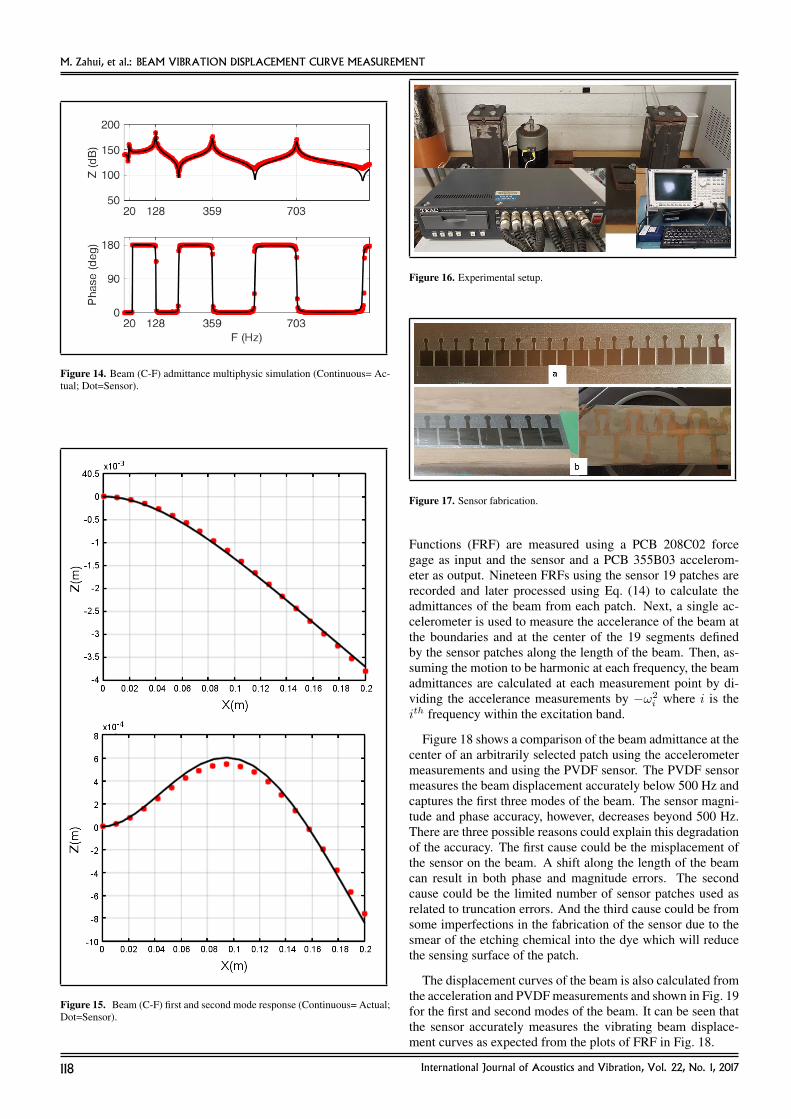
whether or not the in plane transverse strains will greatly affectthe results. In the numerical simulation, the Euler-Bernoullibeam theory was used while in the Multiphysics simulation,the output of the 3D deformation of the film was allowed. Theresulting output voltages φi were used to calculate the “Mea-sured” deflection of the beam with Eq. (14). The results shownin Figs. 10 to 15 indicate that the sensor can be used to ac-curately measure the deflection curve of the beams. The con-clusions of the numerical simulation results can be extendedto the results shown in Figs. 10 to 15. As seen in the numeri-cal simulation, once again, the sensor is less accurate at higherfrequencies. Hence, it is clear that the accuracy of the measure-ment is directly related to the number of patches as discussedin the error analysis section.
5. EXPERIMENTAL VERIFICATION
The sensor design theory presented and simulated above isfurther verified using the experimental setup shown in Fig. 16.The 482.4 mm long, 25.4 mm wide, and 3.2 mm thick alu-minum beam is clamped at both ends and excited by a Lab-works ET-126 shaker. The sensor is fabricated out of 28 µmthick copper-nickel metallized PVDF film. The fabricationprocess is displayed in Fig. 17. A template is cut out of aself-adhesive vinyl sheet by a printer-cutter as displayed inFig. 17a. The template is laid on top of the film in Fig. 17bbefore an etching ink is sprayed onto the vinyl and the film.The vinyl is removed and etching chemical is applied to thefilm to etch away the metalized surface of the film not coveredby the ink to reveal 19 segments of PVDF patches and electricconnection tabs shown in Fig. 17b. Using a multi-meter, thecontinuity between the patches is checked to ensure that the19 patches are electrically isolated from each other. Then, thesensor is bonded to the beam with a double sided tape and thetabs connected to the data acquisition unit with alligator clipsand BNC connectors.
The beam is then excited with a unity force over broadbandof frequencies from 0-800Hz. The beam Frequency Response
116 International Journal of Acoustics and Vibration, Vol. 22, No. 1, 2017
M. Zahui, et al.: BEAM VIBRATION DISPLACEMENT CURVE MEASUREMENT
Figure 10. Beam (S-S) admittance multiphysic simulation (Continuous= Ac-tual; Dot=Sensor).
Figure 11. Beam (S-S) first and second mode response (Continuous= Actual;Dot=Sensor).
Figure 12. Beam (C-C) admittance multiphysic simulation (Continuous= Ac-tual; Dot=Sensor).
Figure 13. Beam (C-C) first and second mode response (Continuous= Actual;Dot=Sensor).
International Journal of Acoustics and Vibration, Vol. 22, No. 1, 2017 117
M. Zahui, et al.: BEAM VIBRATION DISPLACEMENT CURVE MEASUREMENT
Figure 14. Beam (C-F) admittance multiphysic simulation (Continuous= Ac-tual; Dot=Sensor).
Figure 15. Beam (C-F) first and second mode response (Continuous= Actual;Dot=Sensor).
Figure 16. Experimental setup.
Figure 17. Sensor fabrication.
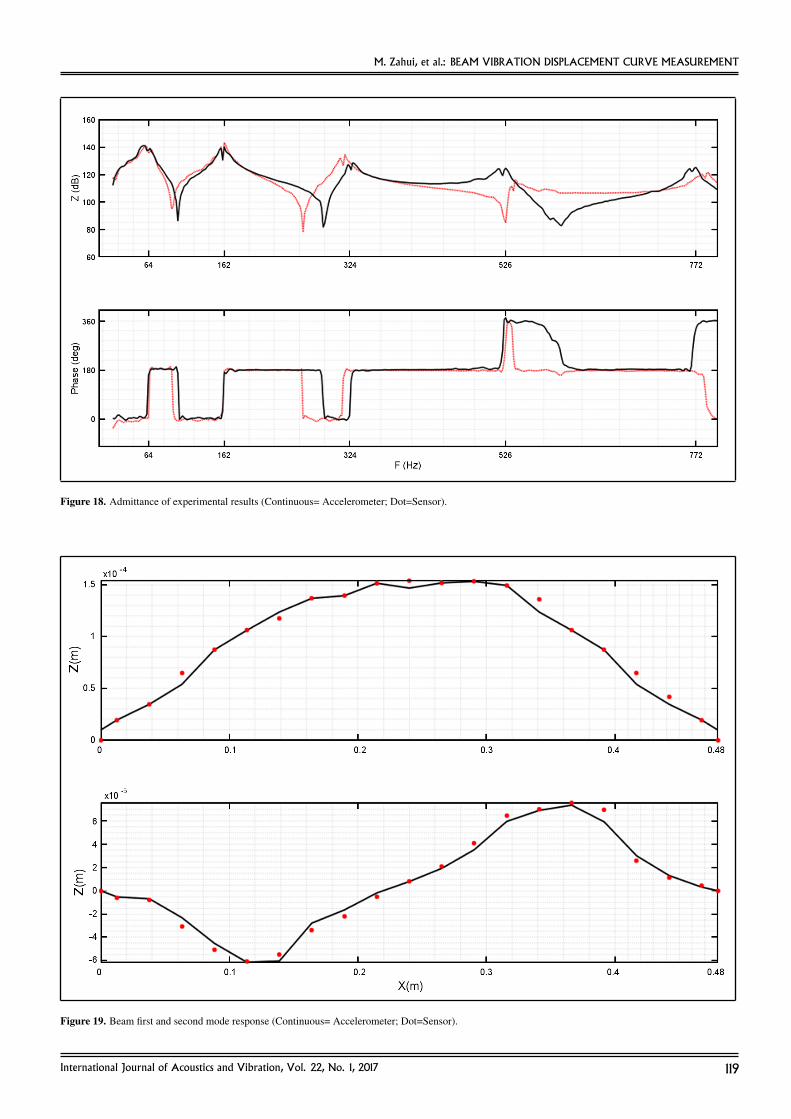
Functions (FRF) are measured using a PCB 208C02 forcegage as input and the sensor and a PCB 355B03 accelerom-eter as output. Nineteen FRFs using the sensor 19 patches arerecorded and later processed using Eq. (14) to calculate theadmittances of the beam from each patch. Next, a single ac-celerometer is used to measure the accelerance of the beam atthe boundaries and at the center of the 19 segments definedby the sensor patches along the length of the beam. Then, as-suming the motion to be harmonic at each frequency, the beamadmittances are calculated at each measurement point by di-viding the accelerance measurements by −ω2
i where i is theith frequency within the excitation band.
Figure 18 shows a comparison of the beam admittance at thecenter of an arbitrarily selected patch using the accelerometermeasurements and using the PVDF sensor. The PVDF sensormeasures the beam displacement accurately below 500 Hz andcaptures the first three modes of the beam. The sensor magni-tude and phase accuracy, however, decreases beyond 500 Hz.There are three possible reasons could explain this degradationof the accuracy. The first cause could be the misplacement ofthe sensor on the beam. A shift along the length of the beamcan result in both phase and magnitude errors. The secondcause could be the limited number of sensor patches used asrelated to truncation errors. And the third cause could be fromsome imperfections in the fabrication of the sensor due to thesmear of the etching chemical into the dye which will reducethe sensing surface of the patch.
The displacement curves of the beam is also calculated fromthe acceleration and PVDF measurements and shown in Fig. 19for the first and second modes of the beam. It can be seen thatthe sensor accurately measures the vibrating beam displace-ment curves as expected from the plots of FRF in Fig. 18.
118 International Journal of Acoustics and Vibration, Vol. 22, No. 1, 2017
M. Zahui, et al.: BEAM VIBRATION DISPLACEMENT CURVE MEASUREMENT
Figure 18. Admittance of experimental results (Continuous= Accelerometer; Dot=Sensor).
Figure 19. Beam first and second mode response (Continuous= Accelerometer; Dot=Sensor).
International Journal of Acoustics and Vibration, Vol. 22, No. 1, 2017 119
M. Zahui, et al.: BEAM VIBRATION DISPLACEMENT CURVE MEASUREMENT
6. CONCLUSIONS
Equations of a beam lateral vibration displacement sensorwere derived using well established one dimensional PVDFoutput charge equations. Bands of the piezoelectric film acrossthe width of the beam output voltages proportional to the slopsof the beam deflection curve at their respective location. Theseslopes were use in a central-difference equation to computethe vibration deflection curve of the beam. Truncation errorsassociated with the central-difference process were estimatedto assert the accuracy of the sensor. The analysis resulted in athird order error term that was confirmed numerically using asimply supported beam.
The proposed sensor was verified through numerical and fi-nite element multiphysics simulation. The numerical simula-tion used mode superposition and discretized models to com-pute the forced vibration responses of the beam over a broadband frequency. These deflection curves were compared to thedeflection curves calculated using the charges from the filmpatches. Next a full 3D coupled physics simulation was car-ried out and the results used to confirm the performance of thesensor.
Furthermore, a clamped-clamped beam experimental setupwas used to verify the performance of the sensor. Chemicaletching process was used to fabricate the sensor and measure-ments were carried out using the sensor and an accelerometer.The results indicate that the 19 patches of film over 482 mmlong beam accurately measured the beam lateral displacementcurve up to the beam third mode.
Therefore, the work presented here proves that PVDF filmcan be effectively used to measure the vibration displacementcurve of beams with various boundary conditions and particu-larly for beam with clamped-clamped boundary conditions.
REFERENCES1 Guigou, C. et al. Active control of sound radiation using
a foam-PVDF-plate passive/active composite device, Inter-national Journal of Acoustics and Vibration, 2 (3), 113–118(1997).
2 Bailey, T. and Hubbard, J. Distributed piezoelectric poly-mer active vibration control of a cantilever beam, Journal ofGuidance, Control, and Dynamics, 8 (5), 605–610, (1985).
3 Bloomfield, P. E. Production of ferroelectric oriented PVDFfilms, Journal of Plastic Film and Sheeting, 4 (2), 123–129,(1998).
4 Miki, H. et al. Reactive ion etching of poly (vinylidenefluoride) and its optimization, International Journal of En-gineering and Technical Research, 3 (3), 327–333, (2015).
5 Omidi, E.and Mahmoodi, S. N. J. Multiple mode spatialvibration reduction in flexible beams using H2- and Hinf-modified positive position feedback, ASME Journal of Vi-bration and Acoustic, 137 (1), 011016-011016-7, (2015).
6 Adamowski, J. C., Buiochi, F., and Higuti, R. T. Ultra-sonic material characterization using large-aperture PVDFreceivers, Ultrasonic, 52 (2), 110–115, (2010).
7 Kryger, M., Eiken, T., and Qin, L. The use ofcombined thermal/pressure polyvinylidene fluoride
film airflow sensor in polysomnography, Springer-Verlag Berlin Heidelberg, 1267–1273, (2013).http://dx.doi.org/10.1007/s11325-013-0832-5
8 Banerjee, T. et al. Active control of radiated soundfrom stiffened plates using IDE-PFC actuators, Interna-tional Journal of Acoustics and Vibration, 18 (3), 109–116,(2013).
9 Tamjidi, et al. PVDF actuator for high-frequency fatiguetest of thin-film metals, IEEJ Transaction on Electronicand Electronic Engineering, 8 (2), 199–205, (2013).
10 Tung, C. Y. Precision microscopic actuations of paraboliccylindrical shell reflectors, ASME Journal of Vibration andAcoustic, 137 (1), (2015).
11 Lee, C. K. and Moon, F. C. Modal sensors/actuators, Trans.ASME, 57, 434–441, (1990).
12 Clark, R. L., Flemming, M. R., and Fuller, C. R. Piezo-electric actuators for distributed vibration excitation of thinplates: A comparison between theory and experiment,ASME Journal of Vibration and Acoustic, 115 (3), 332–339,(1993).
13 Zahui, M., Kamman, J., and Naghshineh, K. Theoreticaldevelopment and experimental validation of local volumedisplacement sensors for a vibrating beam, ASME Journalof Vibration and Acoustics, 123 (1), 110–118, (2001).
14 Ribeiro, P., Alves, L., and Marinho, J. Experimental in-vestigation on the occurrence of internal resonances in aclamped-clamped beam, International Journal of Acous-tics and Vibration, 6 (3), 169–173, (2001).
15 Ding, J. et al. Fatigue life assessment of traffic-signal sup-port structures from an analytical approach and long-termvibration monitoring data, Journal of Structural Engineer-ing, 142 (6), 1–12, (2016).
16 McManus, P. S. et al. Damping in cantilevered traffic sig-nal structures under forced vibration, Journal of StructuralEngineering, 129 (3), 373–382, (2003).
17 Rao, S. , Mechanical vibrations, Addison-Wesley 4th edi-tion, (2004).
18 Salo, J.and Korhonen, I. Calculated estimate of FBG sen-sor’s suitability for beam vibration and strain measuring,Measurement, 47, 178–173, (2014).
19 Tzou, H. S. Piezoelectric Shells, Kluwer Academic Pub-lishers, Dordrecht, Boston, London, (1993).
20 Feng, K.and Shi, Z. Mathematical Theory of Elastic Struc-tures, Springer New York, ISBN 0-387-51326-4, 1981.
21 Zahui, M., and Thomas, R. Design of beam surface dis-placement sensors, ASME International Mechanical Engi-neering Conference and Exposition, 1–7, 2014.
22 Kreyszig, E. Advanced Engineering Mathematics, 10thEdition, ISBN-13: 978-0470458365, 2011.
23 Ewins, D. J. Modal Testing: Theory, Practice and Appli-cation, 2nd Edition, research Studies Press Ltd, Baldock,Hertfordshire, England, 1984.
120 International Journal of Acoustics and Vibration, Vol. 22, No. 1, 2017