Embed Size (px)
Citation preview
1
Bear Stearns 16th Annual Global Credit
ConferenceMay 16, 2007
2
Forward Looking StatementsThe information contained in this presentation, other than historical information, consists of forward-looking statements within the meaning of Section 27A of the Securities Act and Section 21E of the Securities Exchange Act. These statements may involve risks and uncertainties that could cause actual results to differ materially from those described in such statements. These risks and uncertainties include, among others, Six Flags' success in implementing its new business strategy. Although Six Flags believes that the expectations reflected in such forward-looking statements are reasonable, it can give no assurance that such expectations will prove to have been correct. Important factors, including factors impacting attendance, such as local conditions, events, disturbances and terrorist activities, risk of accidents occurring at Six Flags' parks, adverse weather conditions, general economic conditions (including consumer spending patterns), competition, pending, threatened or future legal proceedings and other factors could cause actual results to differ materially from Six Flags' expectations. Reference is made to a more complete discussion of forward-looking statements and applicable risks contained under the caption "Cautionary Note Regarding Forward-Looking Statements" and "Risk Factors" in Six Flags' Annual Report on Form 10-K for the year ended December 31, 2006, which is available free of charge on Six Flags' website http://www.sixflags.com.
3
Introduction to Six Flags
4
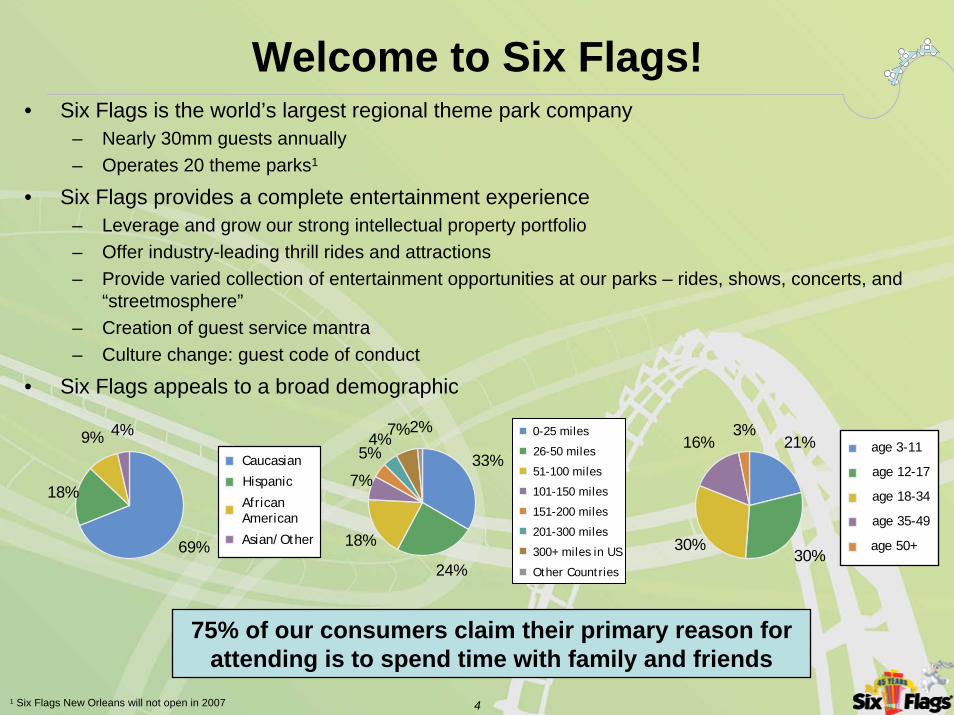
• Six Flags is the world’s largest regional theme park company– Nearly 30mm guests annually – Operates 20 theme parks1
• Six Flags provides a complete entertainment experience – Leverage and grow our strong intellectual property portfolio– Offer industry-leading thrill rides and attractions– Provide varied collection of entertainment opportunities at our parks – rides, shows, concerts, and
“streetmosphere”– Creation of guest service mantra– Culture change: guest code of conduct
• Six Flags appeals to a broad demographic
Welcome to Six Flags!
1 Six Flags New Orleans will not open in 2007
75% of our consumers claim their primary reason for attending is to spend time with family and friends
69%
18%
9% 4%
33%
24%
18%
7%
5%4%
7% 2%21%
30%30%
16%3%
American
Caucasian
Hispanic
African American
Asian/Other
0-25 miles
26-50 miles
51-100 miles
101-150 miles
151-200 miles
201-300 miles
300+ miles in US
Other Countries
age 3-11
age 12-17
age 18-34
age 35-49
age 50+
5
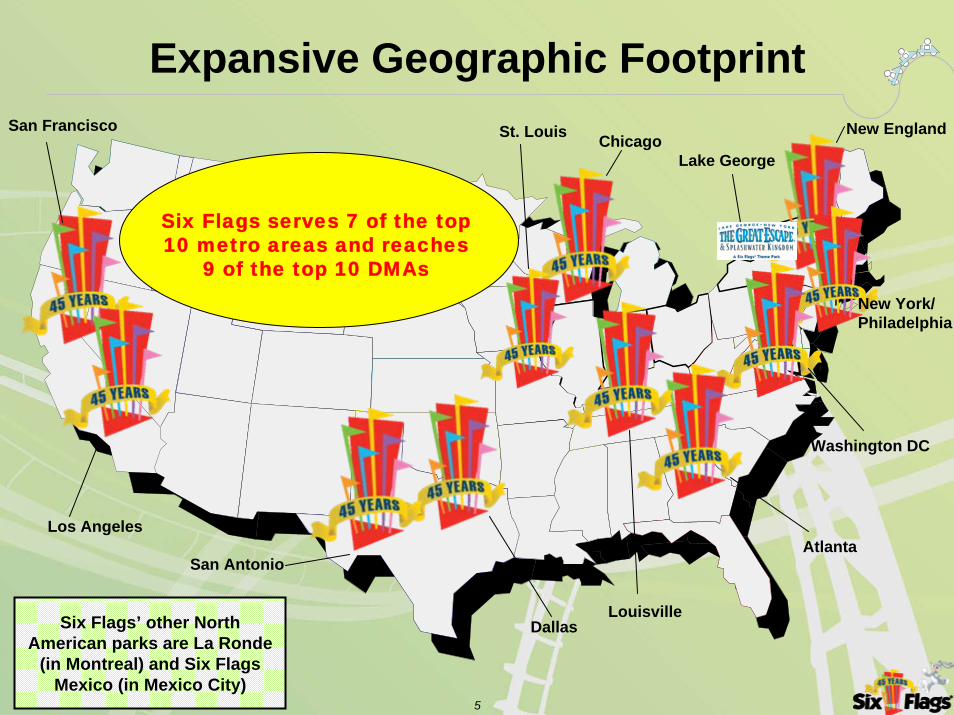
Atlanta
Washington DC
New York/ Philadelphia
Lake GeorgeChicago
Louisville
St. Louis
Dallas
San Antonio
Los Angeles
San Francisco New England
Expansive Geographic Footprint
Six Flags’ other North American parks are La Ronde
(in Montreal) and Six Flags Mexico (in Mexico City)
Six Flags serves 7 of the top 10 metro areas and reaches
9 of the top 10 DMAs
6
New ManagementNew Strategy
Enhanced Growth Profile
7
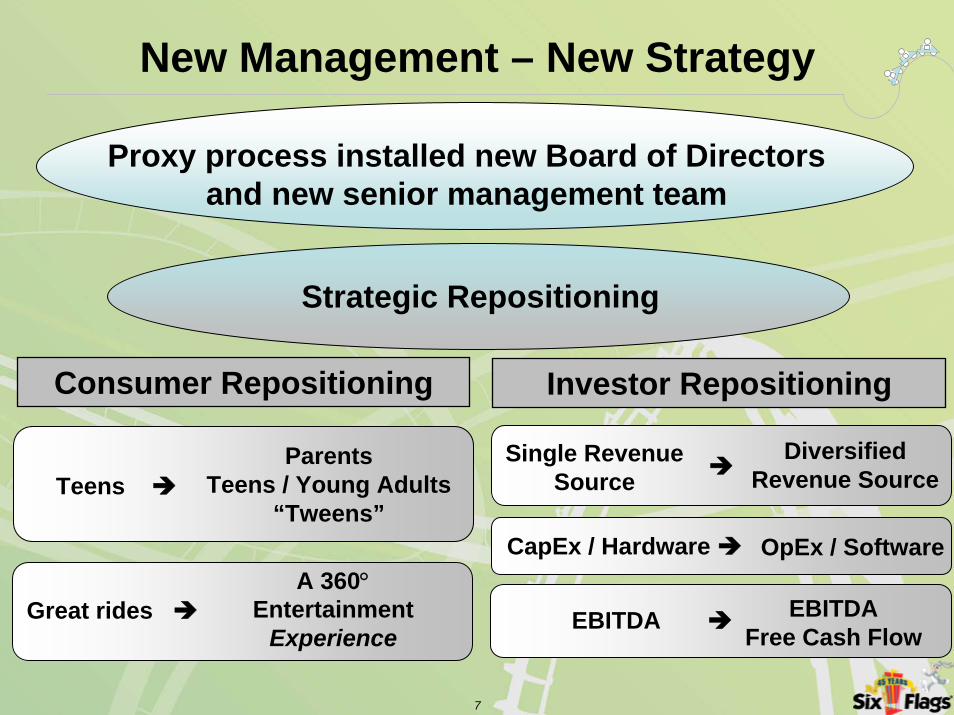
New Management – New Strategy
Proxy process installed new Board of Directors and new senior management team
Strategic Repositioning
Consumer Repositioning Investor Repositioning
Teens
A 360°Entertainment
ExperienceGreat rides
ParentsTeens / Young Adults
“Tweens”
Single RevenueSource
DiversifiedRevenue Source
CapEx / Hardware OpEx / Software
EBITDA EBITDAFree Cash Flow
8
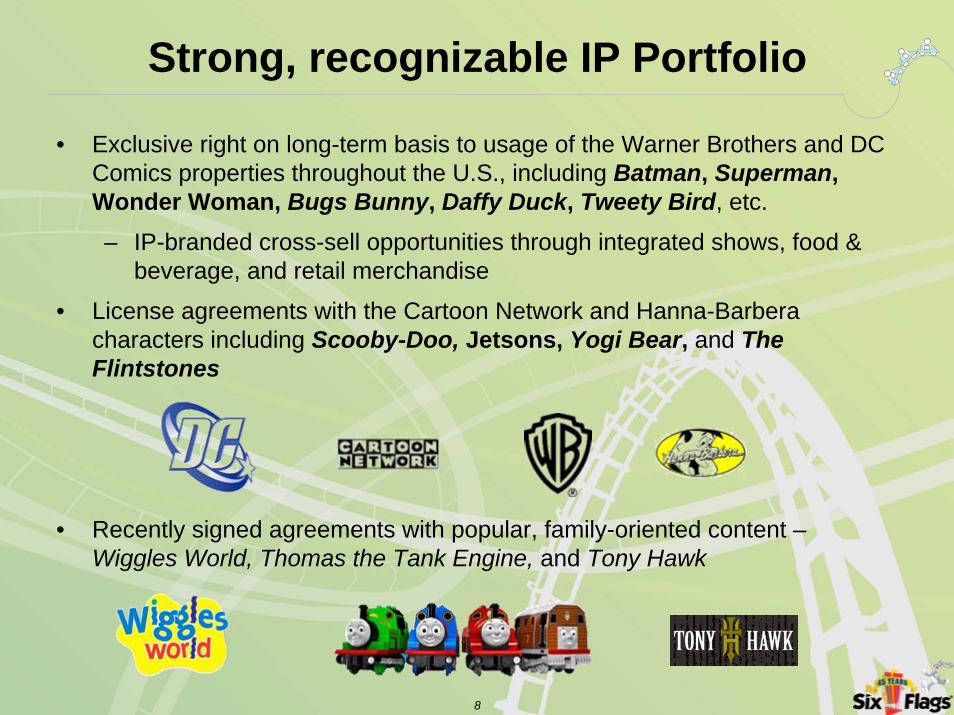
• Exclusive right on long-term basis to usage of the Warner Brothers and DC Comics properties throughout the U.S., including Batman, Superman, Wonder Woman, Bugs Bunny, Daffy Duck, Tweety Bird, etc.
– IP-branded cross-sell opportunities through integrated shows, food & beverage, and retail merchandise
• License agreements with the Cartoon Network and Hanna-Barberacharacters including Scooby-Doo, Jetsons, Yogi Bear, and The Flintstones
• Recently signed agreements with popular, family-oriented content –Wiggles World, Thomas the Tank Engine, and Tony Hawk
Strong, recognizable IP Portfolio
9
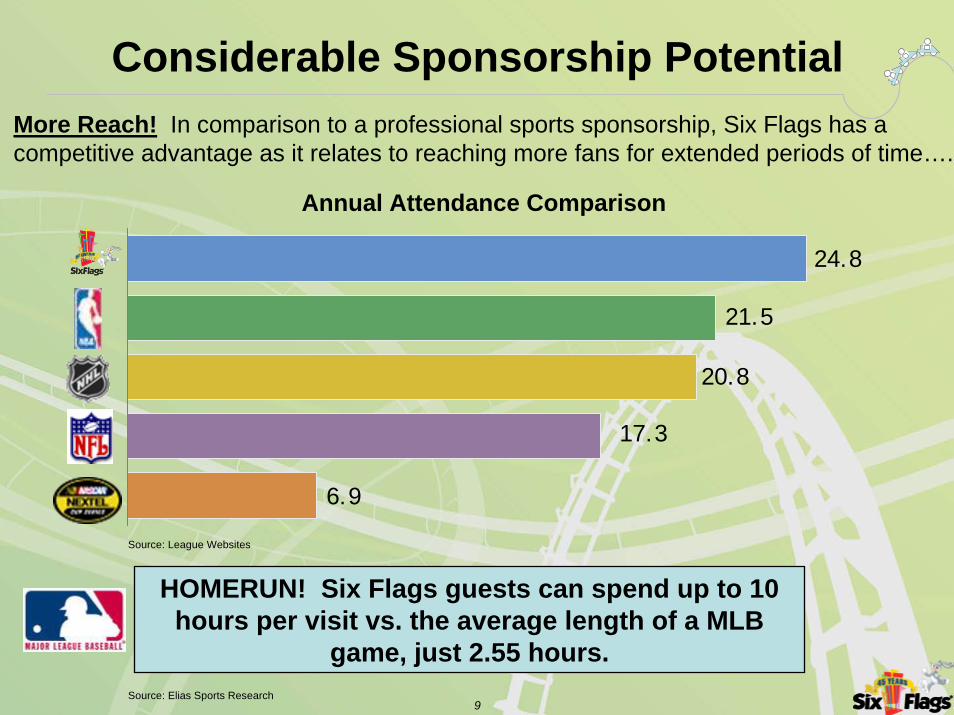
Considerable Sponsorship PotentialMore Reach! In comparison to a professional sports sponsorship, Six Flags has a competitive advantage as it relates to reaching more fans for extended periods of time….
HOMERUN! Six Flags guests can spend up to 10 hours per visit vs. the average length of a MLB
game, just 2.55 hours.
Annual Attendance Comparison
Source: League Websites
Source: Elias Sports Research
24.8
21.5
20.8
17.3
6.9
10
2007 Key Initiatives
11
2007 Key Initiatives
• Increase sponsorships to $38mm and expand corporate alliance partnerships
• Execute a diversified marketing plan
• Grow in-park spending
• Continue to balance the product and improve the guest experience
• Invest in asset maintenance and in building an IT infrastructure
12
2007 Corporate Alliance Agenda
• Build on ’06 momentum– Leverage 25mm attendance to drive corporate sponsorship and alliance deals– Increase revenue to $38mm (up 46%)
• 2007 sales strategy– Secure more national brand relationships– Maximize “Tent-Pole” Special Event Schedule, attracting national and local
sponsorship opportunities– Focus on Local Official Category Partnerships– Leverage the re-emergence of the outdoor category– Take advantage of advertiser shift to non-traditional media
• Categories being pursued– Auto, studios, snack foods, television/cable, and telecom/wireless
• Already secured 5 new corporate alliances this year– Nintendo, Heinz, Chase, Sara Lee, and Johnny Rockets
13
2007 Marketing Strategy
• Execute an enhanced marketing plan– Substantial increase in media budget to drive attendance – Plan is informed by detailed segmentation analysis– Messaging, creative, and medium tailored to three target
audiences– Support with a revamped website and new digital strategy
aimed at growing online sales and enhancing CRM capabilities
– Emphasis on season pass and group sales– Reclaim the outer markets– Build attendance in fringe and weekday periods– Expand the season
14
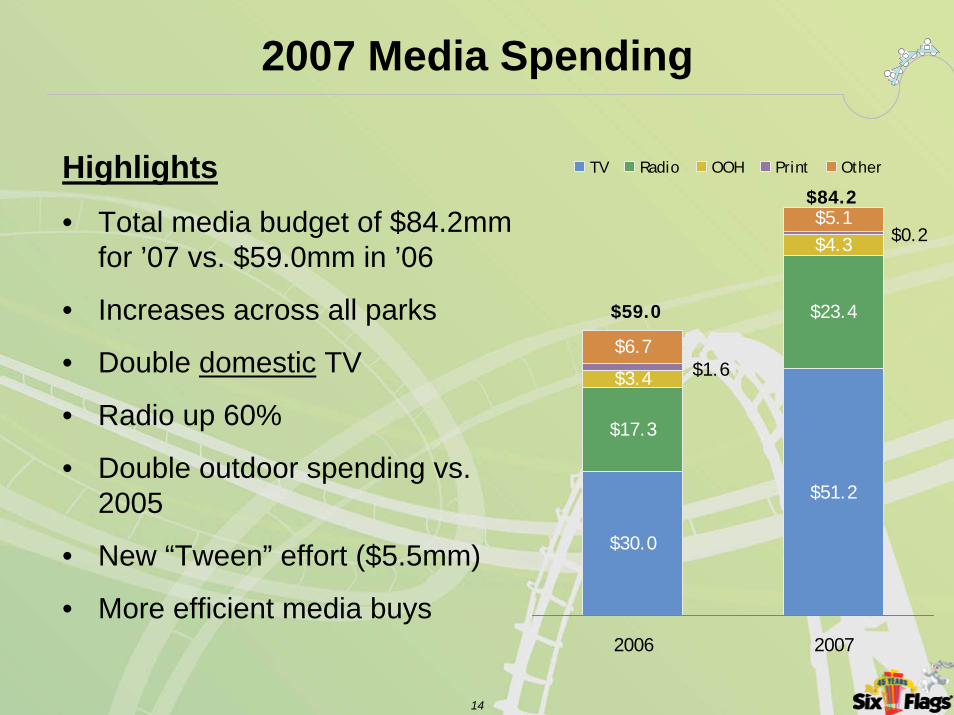
2007 Media Spending
Highlights• Total media budget of $84.2mm
for ’07 vs. $59.0mm in ’06
• Increases across all parks
• Double domestic TV
• Radio up 60%
• Double outdoor spending vs. 2005
• New “Tween” effort ($5.5mm)
• More efficient media buys
$30.0
$51.2
$17.3
$23.4
$3.4
$4.3
$6.7$1.6
$5.1
2006 2007
TV Radio OOH Print Other
$59.0
$84.2
$0.2
15
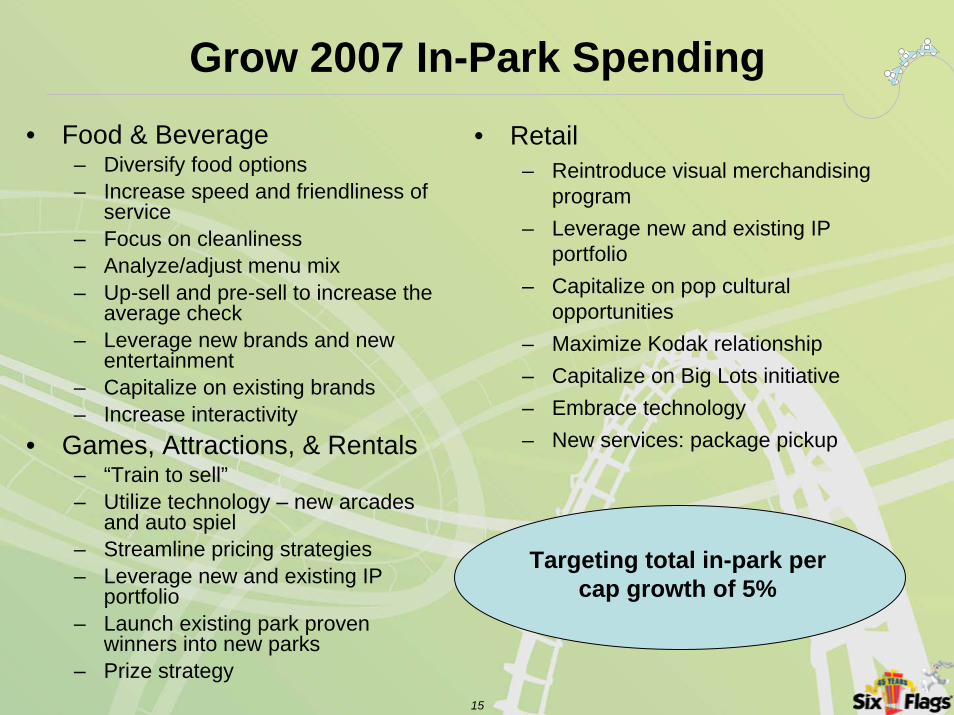
Grow 2007 In-Park Spending• Food & Beverage
– Diversify food options– Increase speed and friendliness of
service– Focus on cleanliness– Analyze/adjust menu mix– Up-sell and pre-sell to increase the
average check– Leverage new brands and new
entertainment– Capitalize on existing brands– Increase interactivity
• Games, Attractions, & Rentals– “Train to sell”– Utilize technology – new arcades
and auto spiel– Streamline pricing strategies– Leverage new and existing IP
portfolio– Launch existing park proven
winners into new parks– Prize strategy
• Retail– Reintroduce visual merchandising
program– Leverage new and existing IP
portfolio– Capitalize on pop cultural
opportunities– Maximize Kodak relationship– Capitalize on Big Lots initiative– Embrace technology– New services: package pickup
Targeting total in-park per cap growth of 5%
16
The Product and the Guest
• Reduced capital program
• Increased opex to fund labor initiatives, including those aimed at hiring, training, incentivizing, and retaining better guest-facing employees
• Focus is now on “software”
• Get back to theming
• Storytelling, storytelling, storytelling
• Make rides and retail initiatives experiential
17
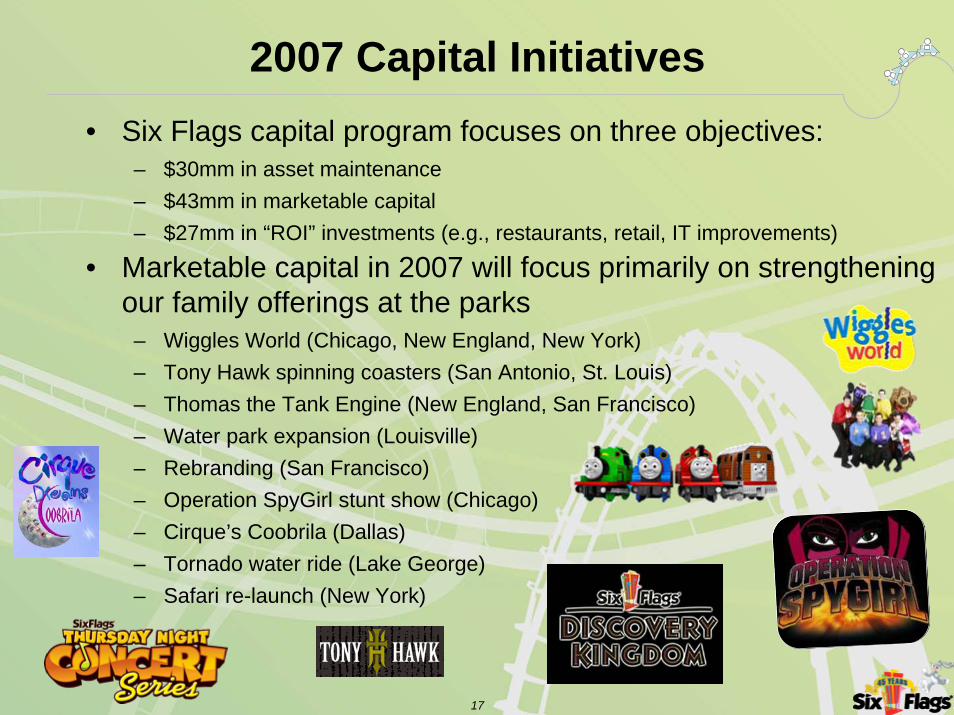
2007 Capital Initiatives• Six Flags capital program focuses on three objectives:
– $30mm in asset maintenance – $43mm in marketable capital– $27mm in “ROI” investments (e.g., restaurants, retail, IT improvements)
• Marketable capital in 2007 will focus primarily on strengtheningour family offerings at the parks
– Wiggles World (Chicago, New England, New York)– Tony Hawk spinning coasters (San Antonio, St. Louis)– Thomas the Tank Engine (New England, San Francisco)– Water park expansion (Louisville)– Rebranding (San Francisco)– Operation SpyGirl stunt show (Chicago)– Cirque’s Coobrila (Dallas)– Tornado water ride (Lake George)– Safari re-launch (New York)
18
Historical and Q1 07 Financials
19
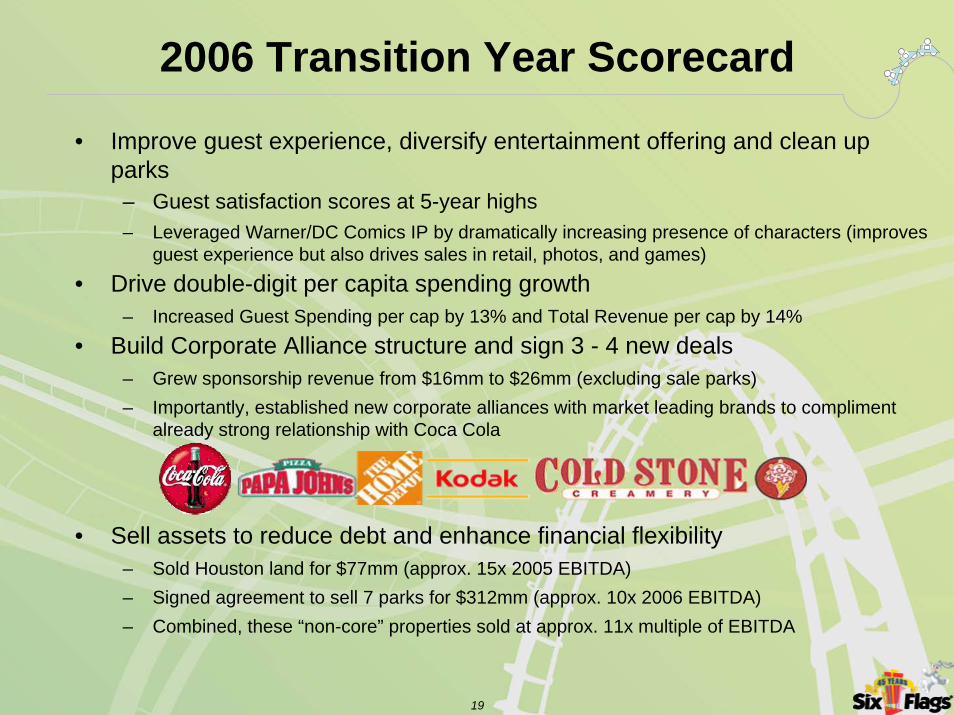
2006 Transition Year Scorecard
• Improve guest experience, diversify entertainment offering and clean up parks
– Guest satisfaction scores at 5-year highs– Leveraged Warner/DC Comics IP by dramatically increasing presence of characters (improves
guest experience but also drives sales in retail, photos, and games)
• Drive double-digit per capita spending growth– Increased Guest Spending per cap by 13% and Total Revenue per cap by 14%
• Build Corporate Alliance structure and sign 3 - 4 new deals– Grew sponsorship revenue from $16mm to $26mm (excluding sale parks)– Importantly, established new corporate alliances with market leading brands to compliment
already strong relationship with Coca Cola
• Sell assets to reduce debt and enhance financial flexibility– Sold Houston land for $77mm (approx. 15x 2005 EBITDA)– Signed agreement to sell 7 parks for $312mm (approx. 10x 2006 EBITDA)– Combined, these “non-core” properties sold at approx. 11x multiple of EBITDA
20
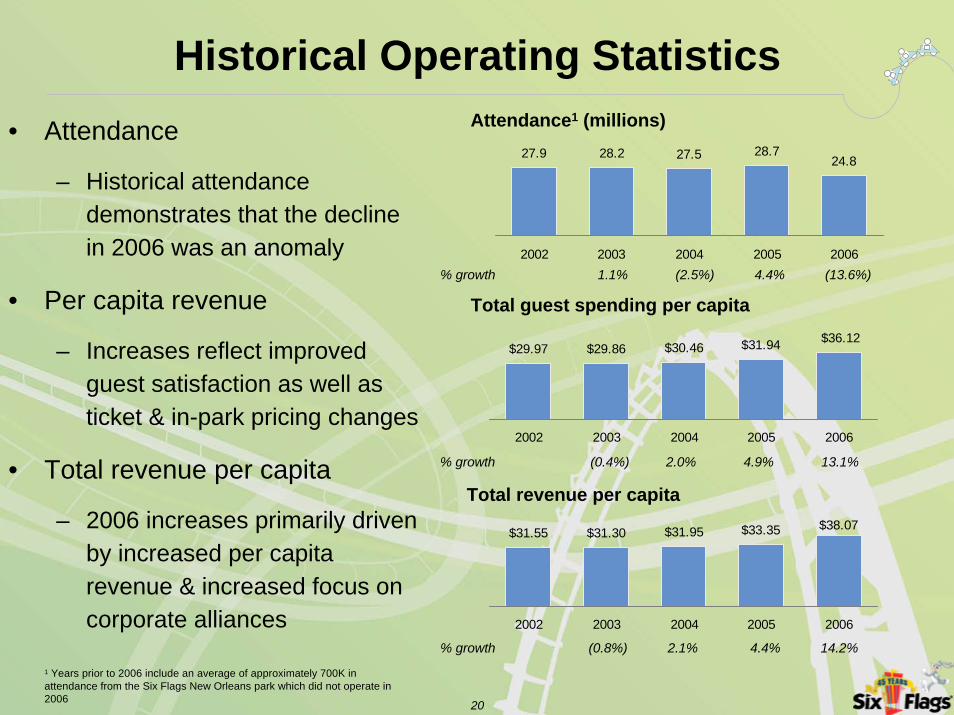
Historical Operating Statistics• Attendance
– Historical attendance demonstrates that the decline in 2006 was an anomaly
• Per capita revenue
– Increases reflect improved guest satisfaction as well as ticket & in-park pricing changes
• Total revenue per capita
– 2006 increases primarily driven by increased per capita revenue & increased focus on corporate alliances
Total guest spending per capita
% growth (0.4%) 2.0% 4.9% 13.1%
% growth 1.1% (2.5%) 4.4% (13.6%)
$29.97 $29.86 $30.46 $31.94 $36.12
2002 2003 2004 2005 2006
Attendance1 (millions)27.9 28.2 27.5 28.7
24.8
2002 2003 2004 2005 2006
Total revenue per capita
% growth (0.8%) 2.1% 4.4% 14.2% 1 Years prior to 2006 include an average of approximately 700K inattendance from the Six Flags New Orleans park which did not operate in 2006
$31.55 $31.30 $31.95 $33.35 $38.07
2002 2003 2004 2005 2006
21
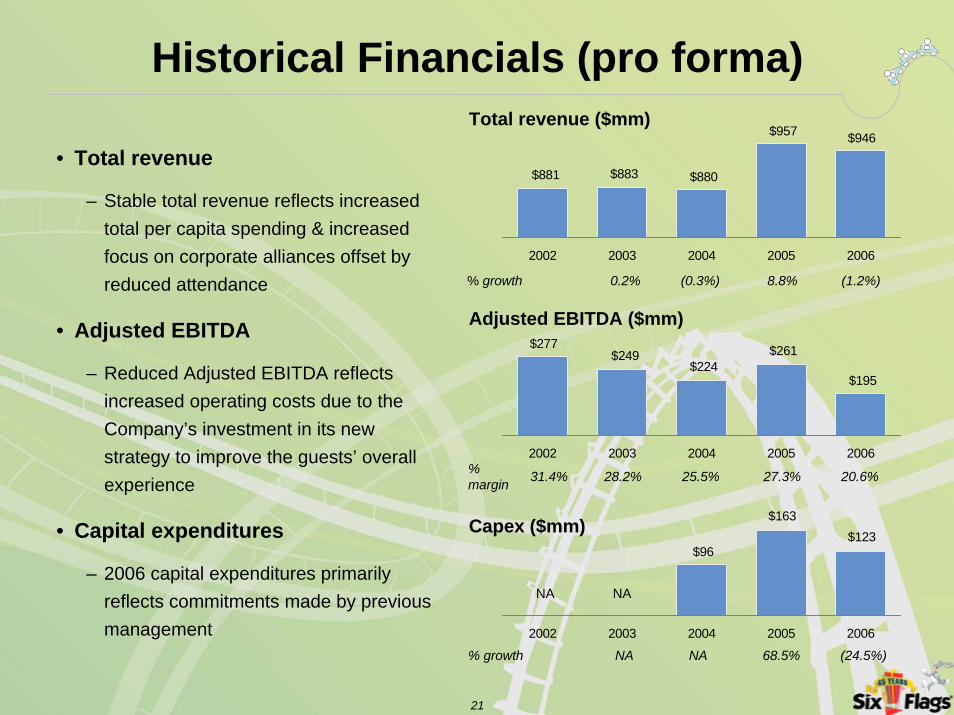
$96$123
$163
2002 2003 2004 2005 2006
Total revenue ($mm)
Adjusted EBITDA ($mm)
Capex ($mm)
% growth 0.2% (0.3%) 8.8% (1.2%)
31.4% 28.2% 25.5% 27.3% 20.6%
% growth NA NA 68.5% (24.5%)
Historical Financials (pro forma)
• Total revenue
– Stable total revenue reflects increased total per capita spending & increased focus on corporate alliances offset by reduced attendance
• Adjusted EBITDA
– Reduced Adjusted EBITDA reflects increased operating costs due to the Company’s investment in its new strategy to improve the guests’ overall experience
• Capital expenditures
– 2006 capital expenditures primarily reflects commitments made by previous management
$881 $883 $880
$946$957
2002 2003 2004 2005 2006
$277$249
$195
$261$224
2002 2003 2004 2005 2006
NA NA
% margin
22
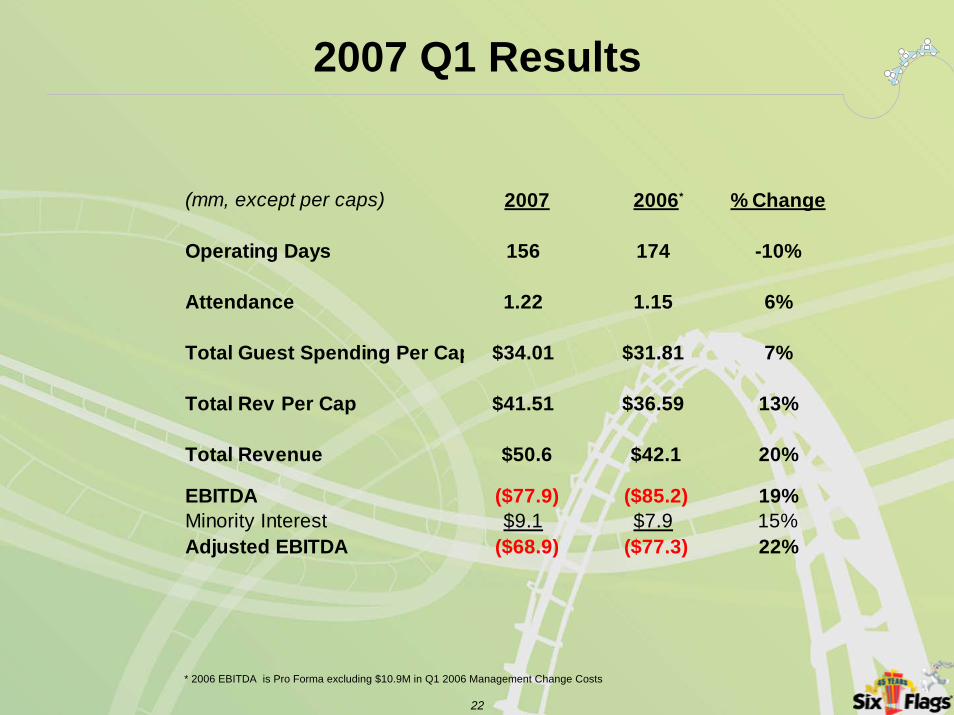
2007 Q1 Results
(mm, except per caps) 2007 2006 % Change
Operating Days 156 174 -10%
Attendance 1.22 1.15 6%
Total Guest Spending Per Cap $34.01 $31.81 7%
Total Rev Per Cap $41.51 $36.59 13%
Total Revenue $50.6 $42.1 20%
EBITDA ($77.9) ($85.2) 19%Minority Interest $9.1 $7.9 15%Adjusted EBITDA ($68.9) ($77.3) 22%
*
* 2006 EBITDA is Pro Forma excluding $10.9M in Q1 2006 Management Change Costs