Embed Size (px)
Citation preview
at SciVerse ScienceDirect
Animal Behaviour 84 (2012) 231e238
Contents lists available
Animal Behaviour
journal homepage: www.elsevier .com/locate/anbehav
Bears ‘count’ too: quantity estimation and comparison in black bears, Ursusamericanus
Jennifer Vonk a,*, Michael J. Beran b,1
aDepartment of Psychology, Oakland University, Rochester, MI, U.S.A.b Language Research Center, Georgia State University, Atlanta, GA, U.S.A.
a r t i c l e i n f o
Article history:Received 10 March 2012Initial acceptance 23 April 2012Final acceptance 27 April 2012Available online 4 June 2012MS. number: A12-00195R
Keywords:areabearnumberquantity estimationratioUrsus americanus
* Correspondence: J. Vonk, Department of PsycholoN Squirrel Rd, Rochester, MI 48309, U.S.A.
E-mail address: [email protected] (J. Vonk).1 E-mail address: [email protected] (M. J. Beran)
0003-3472/$38.00 The Association for the Study of Adoi:10.1016/j.anbehav.2012.05.001
Studies of bear cognition are notably missing from the comparative record despite bears’ large relativebrain size and interesting status as generalist carnivores facing complex foraging challenges, but lackingcomplex social structures. We investigated the numerical abilities of three American black bears, UrsusAmericanus, by presenting discrimination tasks on a touch-screen computer. One bear chose the larger oftwo arrays of dot stimuli, while two bears chose the smaller array of dots. On some trials, the relativenumber of dots was congruent with the relative total area of the two arrays. On other trials, number ofdots was incongruent with area. All of the bears were above chance on trials of both types with staticdots. Despite encountering greater difficulty with dots that moved within the arrays, one bear was able todiscriminate numerically larger arrays of moving dots, and a subset of moving dots fromwithin the largerarray, even when area and number were incongruent. Thus, although the bears used area as a cue toguide their responses, they were also able to use number as a cue. The pattern of performance wassimilar to that found previously with monkeys, and suggests that bears may also show other forms ofsophisticated quantitative abilities.
The Association for the Study of Animal Behaviour. Published by Elsevier Ltd.
Given that bears have the largest relative brain size of anycarnivore (Gittleman 1986) even in comparison to other socialspecies such as canines, about which there is a recent explosion ofresearch (Miklósi et al. 2004; Hare 2007; Kubinyi et al. 2007), it issurprising that there are few published reports of their cognitiveabilities. Other than reports on visual and spatial abilities (Bacon &Burghardt 1976; Tarou 2003; Kelling et al. 2006; Dungl et al. 2008;Perdue et al. 2011) and tool use (Bentley-Condit & Smith 2010;Deecke 2012) nothing is known of their cognitive traits in compar-ison to social species such as corvids (Emery & Clayton 2004; Seedet al. 2009), other large-brained mammals, such as primates(Tomasello&Call 1997; Rosati et al. 2010), andother carnivores, suchas canines (Miklósi et al. 2004; Hare 2007; Kubinyi et al. 2007). Thisis a serious shortcoming in comparative psychology, and remedyingthis shortcoming could allow for better tests of the social intelli-gence (Jolly 1966;Humphrey1976) and foraginghypotheses (Milton1981, 1988). For instance, demonstrating that a nonsocial mammalthat faces significant foraging challenges exhibits the same sorts ofcognitive abilities as more social species within the same ordermay
gy, Oakland University, 2200
.
nimal Behaviour. Published by Els
indicate that adaptive problems faced in the physical environment,such aswith foraging, is a better predictor of these kinds of cognitivetraits, than is social living.
There are many examples of nonsocial animals that face signifi-cant foragingproblems anddemonstrate impressive cognitive skills,such as tool use and observational learning. For example, octopi andcuttlefish have the capacity to make conditional discriminations(Hvorecnyet al. 2007; Ikeda 2009). However, although these speciesalso exhibit problem-solving behaviour similar to that of severalvertebrate species, their strategies sometimes demonstrate fixedbehavioural patterns, rather than significant behavioural flexibility(Fiorito et al. 1998; but also see Mather 2006). Interestingly, Mather(2006) assumed behaviouralflexibility inpart based onflexible preychoice, and this idea suggests that bears make an interesting testcase for assessing such flexibility because bears show flexibility intheir diet (Gittleman 1986). Comparisons of closely related species,such as bears, to other carnivores that vary in their sociality andfeeding regime, would be vastly informative with regard tohypotheses about the relative importance of sociality versusforaging demands. Unfortunately, the data with regard to cognitiveabilities in carnivores, particularly in ursines and felines, is still tooscarce to allow for many direct comparisons.
Clearly, however, it is useful, not only to make comparisonsbetween species that are more closely related, as in the orderCarnivora, but also to those species that are more distantly related,
evier Ltd.
J. Vonk, M. J. Beran / Animal Behaviour 84 (2012) 231e238232
as with primates. Researchers can make inferences about when ina species’ evolutionary history a trait may have been most likely toemerge by examining the presence or absence of such traits inspecies both closely and distantly related. Of course, such infer-ences must be made cautiously with consideration to the possi-bility of convergent evolutionary processes. One can look forconvergence by examining differences in species’ behaviouralecologies, such as arboreal versus terrestrial lifestyles, differentmating strategies, home range size (Perdue et al. 2011) and distri-bution of food resources (Milton 1981). By doing so we can bestdetermine which selective pressures are most likely to have givenrise to different cognitive abilities, such as spatial memory (Tarou2003; Perdue et al. 2011; Zamisch & Vonk, in press), conceptformation (J. Vonk, S. E. Jett & K. W. Mosteller, unpublished data)and social cognition (Hare et al. 2002; Miklósi et al. 2004).
One well-studied area in comparative cognition is quantityestimation by nonhumans. Many species are capable of relativenumerousness judgments (gorillas, Gorilla gorilla: Anderson et al.2005; chimpanzees, Pan troglodytes: Boysen & Berntson 1995;Boysen et al. 1999; Beran 2001; rhesus macaques, Macaca mulatta:Brannon & Terrace 2000; Brannon et al. 2006; Cantlon & Brannon2006; Beran 2007, 2008; capuchins: Judge et al. 2005; Beran2008; lemurs: Santos et al. 2005; squirrel monkeys: Thomas &Chase 1980; dolphins: Jaakkola et al. 2005; Kilian et al. 2003;elephants: B. M. Perdue, C. F. Talbot, A. Stone & M. J. Beran,unpublished data; birds: Roberts & Mitchell 1994; Emmerton et al.1997; Emmerton 1998; Pepperberg 2006; amphibians: Uller et al.2003; fish: Agrillo et al. 2009; Gomez-Laplaza & Gerlai 2011).That is, they are able to choose among sets of items on the basis ofthe quantities or even numbers of items in those sets.
In some cases, food items are the stimuli to be discriminated, andhere it is natural for animals to ‘go formore’ if they can. For example,chimpanzeeswill select the greater number of food items (e.g. Beran& Beran 2004), and salamanders will move towards larger numbersof prey items (Uller et al. 2003). In other cases, however, nonedibleitems are presented for comparison. For example, fish (Agrillo et al.2009; Gomez-Laplaza & Gerlai 2011) have been tested for theirapproach to a larger group of conspecifics. Sometimes, totally arbi-trary stimuli are used, presumably because those stimuli releasesubjects fromprepotent responding as would occur to food items orother naturalistic stimuli. For example, primate and bird species arepresentedwith two arrays of dots on a touch-screen computer, withone array containing a greater number of dots (Emmerton 1998;Beran 2007, 2008) and are required to choose the larger array.Alternatively, they may be required to arrange dot stimuli inascending or descending order (Brannon & Terrace 2000; Brannonet al. 2006; Cantlon & Brannon 2006). The use of arbitrary stimulisuch as dots allows the researcher to control factors such as size ofthe stimuli and area covered by the stimuli in relation to the back-ground. By controlling factors such as size, the researcher is able tocalculate the ratio of area and number between arrays and assesswhich cues the animal is using tomake thediscrimination.However,only social species have been tested in paradigms carefullycontrolling factors such as dot size, ratio, area andmovement of thestimuli (Brannon & Terrace 2000; Brannon et al. 2006; Cantlon &Brannon 2006; Beran 2008). Therefore, it may often be the casethat these species can estimate the relative size or amount of somecommodity but are not necessarily enumerating the specific items.
Some studies indicate that numerical estimation in nonhumanprimate species may be more akin to magnitude estimation thantrue counting. The performance of both rhesus monkeys andcapuchins declines with increased ratio between the quantity intwo sets in tasks presenting two arrays of dots that vary in number,as predicted by Weber’s law, which states that the size of a justnoticeable difference in stimulus intensity is a constant proportion
of the original stimulus magnitude (Brannon & Terrace 2000;Brannon et al. 2006; Cantlon & Brannon 2006; Beran 2008). Forinstance, discriminating between arrays of three dots and six dots iseasier than discriminating between arrays of three dots and fourdots. As the ratios increase, the difference between the two arrays issmaller, making it more difficult to discriminate the arrays ona perceptual basis. However, studies also show that such tasks tapinto numerical abilities as monkeys’ performance remains highwhen the amount or area is not confounded with number, evenwhen enumerating subsets within moving arrays (e.g. Beran 2008).Careful control of such nonnumerical factors can indicate whetherspecies are capable of tracking and individuating items of a set,such as members of their group, and using number to do so versussome other stimulus property. Thus, there is reason to speculatethat this skill might have emerged in particular in social species,such as primates, cetaceans and social birds such as corvids andparrots (Pepperberg 2006). However, it is possible that this isa more evolutionarily ancient capacity that serves as a foundationof numerical cognition and may be shared among other large-brained species that exhibit numerical abilities. One workinghypothesis is that animals that forage over large home ranges mustevolve the ability to discriminate quantities of items, such as foods,to assist them in choices regarding relative costs and benefits oftravel time and energy payoffs. However, one possibility is that theyare very good at assessing quantity or magnitude (approximateamount) for static items, but they do not need to assess numerosity(exact number of items), and, in particular, have not evolved thecapacity for enumerating dynamic stimuli. We test this possibilityfor the first time.
Here, three American black bears chose larger or smaller arraysof static and moving dots, showing effects of ratio and area thatmade their performance quite comparable to that of better-studiedsocial species. One bear was able to choose a smaller subset fromwithin a larger array of moving dots, even when area was notconfounded with number and only number operated as a valid cueto the correct choice. These results from a nonsocial, large-brainedmammal on both static and moving arrays, controlling for area andnumber, indicate that group living is not a prerequisite for thecapacity to make numerousness judgments and even to enumeratesubsets of moving stimuli.
METHODS
Subjects
Three captive adult American black bear siblings (one female andtwo males) were tested. The bears had previously participated instudies of cognitive dissonance (West et al. 2010), spatial memory(Zamisch&Vonk, inpress) and concept formation (J. Vonk, S. E. Jett &K.W.Mosteller, unpublisheddata), although theyhadnotpreviouslybeen tested on tasks assessing quantity estimation or numerosity.The research took place in an off-exhibit area of the bears’ enclosureat the Mobile Zoo in Wilmer, Alabama, U.S.A. Testing of subjectscomplied with the Institutional Animal Care and Use Committee ofthe University of Southern Mississippi (IACUC approval number06091401). The experiments provided a form of enrichment for thesubjects and did not present any risks or adverse effects. Housingand maintenance of the bears at the Mobile Zoo complied withregulations of the U.S. Department of Agriculture.
Materials
The experimental apparatus consisted of a durable PanasonicToughbook laptop computer and a 19-inch, Vartech Armorall,Capacitative, touch-screen monitor welded to the front of a rolling
J. Vonk, M. J. Beran / Animal Behaviour 84 (2012) 231e238 233
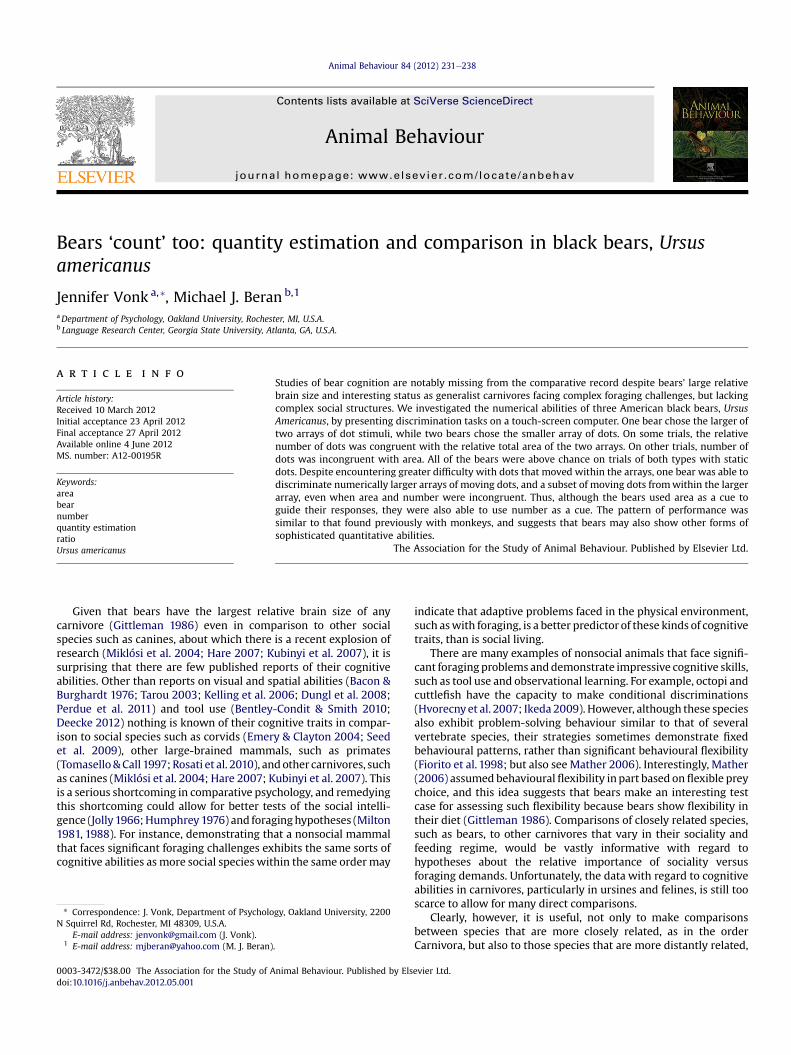
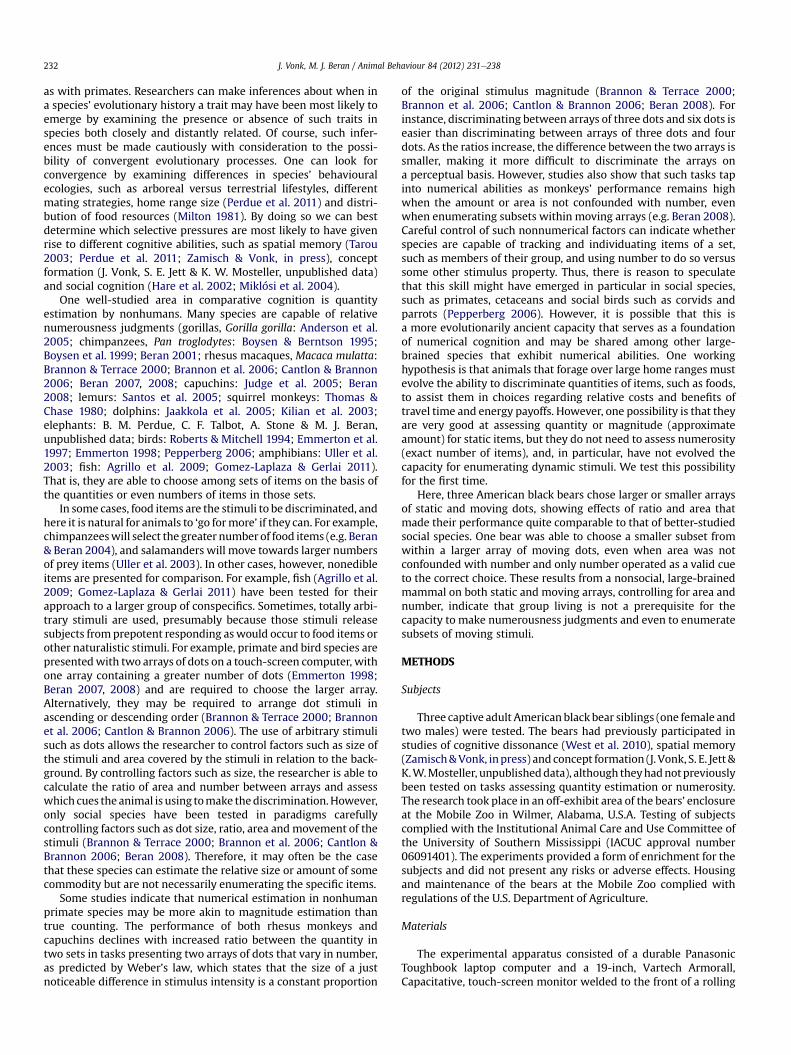
computer cart. Experiments were programmed using Visual Basicfor Windows. Stimuli consisted of dots drawn inside of two out-lined boxes (59.5 � 63.5 mm), which were centred to the left andright of centre screen. The dots within the boxes (hereafter arrays)ranged in number from 1 to 10, and in some conditions, varied bycolour. Each had a randomly assigned diameter of 3e12 mm (Fig.1).Correct responses were followed by a melodic tone and a blankscreen paired with food reinforcement, which consisted of portionsof the bears’ regular zoo diet (fruits, vegetables) and special treatssuch as honey roasted peanuts, banana pellets, dried banana chips,yoghurt covered raisins and wafer cookies. Food was presented byhand by the experimenter. An incorrect response was followed bya buzz tone and a brief time-out with a blank screen.
Procedure
Individual subjects were separated prior to testing, but weretested in the indoor area of their home cages. Subjects could movefreely in their home cages throughout testing sessions. Thus,participationwas entirely voluntary. The computer cart was pushedup against the interior mesh separating the human experimenterfrom the bear, allowing the animal access to the touch-screenmonitor. One of the males (Brutus) had been trained to respondby touching the monitor with his nose, while the female (Bella) andthe other male (Dusty) predominantly used their paws to touch thescreen. The experimenter observed the animal’s responses on thelaptop monitor, which was centred behind the computer cartdirectly behind the touch-screen monitor. The experimenter couldnot see the bear’s face or paws during the trial and did not know thecorrect response until the program provided feedback, and thus,could provide no cues. The experimenter presented the bear witha food reward, as described above, immediately following a correctresponse at a consistent location. Trials continued automaticallyuntil the end of a session.
Training
Bearswere trained todiscriminatebetween twoarrays of dots, bychoosing the array containing the larger (Brutus) or smaller (Dustyand Bella) number of dots. During training, the bears received 8e10sessions per day, 3 days per week. The bears had previously beentrained to perform two-choice discrimination tasks on a touch-screen computer (J. Vonk, S. E. Jett & K. W. Mosteller, unpublisheddata). To train the bears to choose larger or smaller numerical arrays
Figure 1. Example of a trial used to test numerical abilities of American black bears.For each trial, bears chose between two arrays (two outlined boxes with dots) ona computer screen. In this example, the array is incongruent because the array that hasmore dots has the smaller overall area of pixilated dots. This trial also shows how thearrays could be subdivided into subsets for which only black dots were relevant forcomparing the two arrays.
of dots, they were first presented with 20-trial sessions in whichthey were required to choose accurately between arrays of one dotand arrays of three dots for five out of six consecutive trials withina session. If this criterionwasnotmet, thesewere theonly twoarraysthat were presented during the session. Once this criterionwas metwithin a session, the bears were presented with arrays of two dotsversus arrays of six dots until they performed that discriminationcorrectly for five out of six consecutive trials within a session. Thus,they could meet both criteria within a single 20-trial session if theywere correct on five consecutive trials with each discrimination. Itwould thus take them a minimum of 10 trials to achieve this goal ifthey were correct on all 10 of these trials. Having passed bothcriteria, arrays of a varying and randomly determined number ofdots between 1 and 10 were presented, where one set was alwaysnumerically larger than theother. These trials couldoccurwithin thesame 20-trial session if the criterion was met on both simplerdiscriminations within the same session. When the bears reachedthis point, the start of each new session involved a new criterion forthewarm-up discriminations (one versus three, and two versus six)so that instead of having to make five of six correct responses onthese comparisons, the bears were required to meet a criterion ofonly two consecutive correct trials of one dot versus three dots, andtwo consecutive correct trials of two dots versus six dots on eachsession before the variable arrays began to appear. This procedurewas implemented to remind the bears of the task at hand beforemoving on to the more difficult variable trials. The bears wererequired to reach a criterion of 80% correct (16/20 correct trials) onfour consecutive 20-trial sessions that included both the warm-uptrials and more difficult variable trials before moving to 100-trialsessions of variable dot arrays, which comprised the formal testingsessions.
Brutus was trained to choose the array containing more dots,whereas Dusty and Bella were trained to choose the array con-taining fewer dots. Because bears have never been tested fornumerical abilities, we did not make assumptions a priori about theease of performing these discriminations. Although prior researchhas indicated that choosing smaller sets is more difficult thanchoosing larger sets (Boysen & Berntson 1995), such studies havetypically involved real food items. When abstract stimuli are usedin paradigmswhere animals are trained to point to smaller arrays ofreal items, chimpanzees can overcome this bias (Boysen et al. 1999).Researchers have not explicitly compared the performance ofnonhumans when choosing larger versus smaller arrays with static,abstract and nonecologically relevant stimuli. Thus, it was ofinterest to test the assumption that animals generally are predis-posed to choose larger arrays, despite the small sample size.
Brutus was trained to initiate trials by touching a start button,but this procedure led to frustration behaviours for Dusty, so Dustyand Bella were trained without the start button, as this was moresimilar to prior testing for them (J. Vonk, S. E. Jett & K. W. Mosteller,unpublished data). Given that Dusty experienced difficulty duringthe trials and showed an extreme side bias, after 25 sessions withone versus three dots, he was presented with a discriminationconsisting of one dot versus eight dots until he acquired thisdiscrimination (24 sessions). However, having acquired thisdiscrimination, he was rapidly able to meet the criterion of five outof six correct trials with one dot versus three dots, and two dotsversus six dots, and required only two such sessions before movingon to the formal testing phase.
Testing
Static setsBecause the bears had no experience with numerical stimuli,
each bear began testing with static stimuli. On each trial, the bears
J. Vonk, M. J. Beran / Animal Behaviour 84 (2012) 231e238234
were presented with two arrays of dots within a border, identical insize (Fig. 1), that ranged in number from 1 to 10 and that remainedstationary on the screen throughout the trial. The dot arrays wererandomly determined on each trial with the constraint that the twoarrays could not contain equal numbers of dots. On some trials, thedot number was congruent with its overall amount of pixilated area(i.e. the array containing the larger number of dots was also largerin area). On other trials, the dot number was incongruent with itsamount of pixilated area; that is, the array containing more dotscontained a smaller area of pixilation. For Brutus, who was trainedto choose the array with the larger number of dots, using eithernumber or area as a cue would lead to high levels of performanceon congruent trials, but using area as a cue would lead to lowerlevels of performance on incongruent trials. However, for the bearsthat were trained to choose the smaller number of dots, onincongruent trials, choosing the larger area would lead them tochoose correctly, even though this would be in conflict with therule that was being reinforced (i.e. choose smaller number). Ofcourse, if they were operating on the basis of the rule that wasbeing reinforced, but using area rather than number as a cue, theyshould have encountered greater difficulty on incongruent trials,where area and number were incongruent.
The bears received one to three 100-trial sessions two to threetimes per week over a period of 6 months. Brutus and Dusty weregiven 30 100-trial sessions in this static condition. Bella was given20 100-trial sessions with static stimuli, as she was already per-forming at over 75% accuracy on both congruent and incongruenttrials at this point.
Moving setsThe basic procedure for moving sets was the same as that for
static sets, except that, in this experiment, the dots moved on thescreen throughout the trial. Each dot was given a randomly selectedtrajectory and began to move around the screen within its perim-eter area (i.e. the boxes that contained each array of dots withina delineated border) as soon as it appeared. The movement tookplace at one of four randomly selected speeds, and a dot moved ina straight line until it contacted one of thewalls of the outline of thestimulus array, at which point it was redirected, as if it had beendeflected. Thus, the movement appeared chaotic as dots passedthrough each other. All dots appeared at once and were movingsimultaneously. Movement continued until the subject madea response by touching one of the arrays. Brutus and Dustycompleted 30 100-trial sessions with moving stimuli. Bellacompleted 20 sessions, after which she was dropped from testing,given that she showed no signs of improvement with eithercongruent or incongruent sets.
Moving subsetsTo test whether bears could individuate subsets of moving
items, in this experiment the bears were required to enumerateonly a subset of dots within each set of moving dots. Each arraycontained 1e12 dots with all dots moving at randomly determinedspeeds and directions as in the moving sets condition above. Eachdot was randomly assigned a size and colour (black: target set; red:distracter set; see Fig. 1). Both black and red dots moved within thearray. On the basis of previous work on colour discrimination inbears (Bacon & Burghardt 1976; Kelling et al. 2006), we thoughtthat the bears should be able to discriminate easily between blackand red dots. The target sets that were paired on each trial con-tained different numbers of dots. Once again, the target sets couldbe either congruent or incongruent in terms of their number andtotal area. Brutus completed 30 100-trial sessions and Dustycompleted 20 100-trial sessions, after which testing was termi-nated, because Dusty showed no signs of improvement.
Analyses
Separate binary logistic regressions were conducted for eachsubject. Performance (correct/incorrect) was regressed on thepredictors; difference in number (difference), ratio of numberbetween arrays (ratio), ratio of area between arrays (area),congruence (congruent/incongruent) and the interaction ofcongruence with each of the other predictors. Prior to beingentered into the regression, each continuous variable was stan-dardized. The same analyses were performed for each discrimina-tion (static sets, moving sets and moving with subsets). Alpha wasset to 0.05 for all tests.
RESULTS AND DISCUSSION
Training
Brutus and Bella required 22 and 36 20-trial sessions, respec-tively, to complete training. Dusty persisted with a left-side biasand was moved to training with a discrimination of one dot versuseight dots, with 24 20-trial sessions consisting solely of thisdiscrimination until he finally seemed to acquire this discrimina-tion spontaneously. After this point, he rapidly reached criterion onone dot versus three dots and on two dots versus six dots after onlytwo sessions, and proceeded to testing.
Testing
Static stimuliIf the bears could truly use number as a cue, we predicted little
or no effect of congruence, although one might expect thecongruent trials to be easier, because on these trials the bears coulduse both area and number as a cue to guide performance. For Bellaand Dusty, we predicted that performance might be better onincongruent trials if they used the larger area to guide performance,although they were reinforced for choosing the smaller number.We also expected that the ratio would be negatively correlatedwithperformance, given prior work with primates (Brannon & Terrace2000; Brannon et al. 2006; Cantlon & Brannon 2006; Beran 2007,2008). That is, as the ratio of difference between the arraysincreases, performance should worsen.
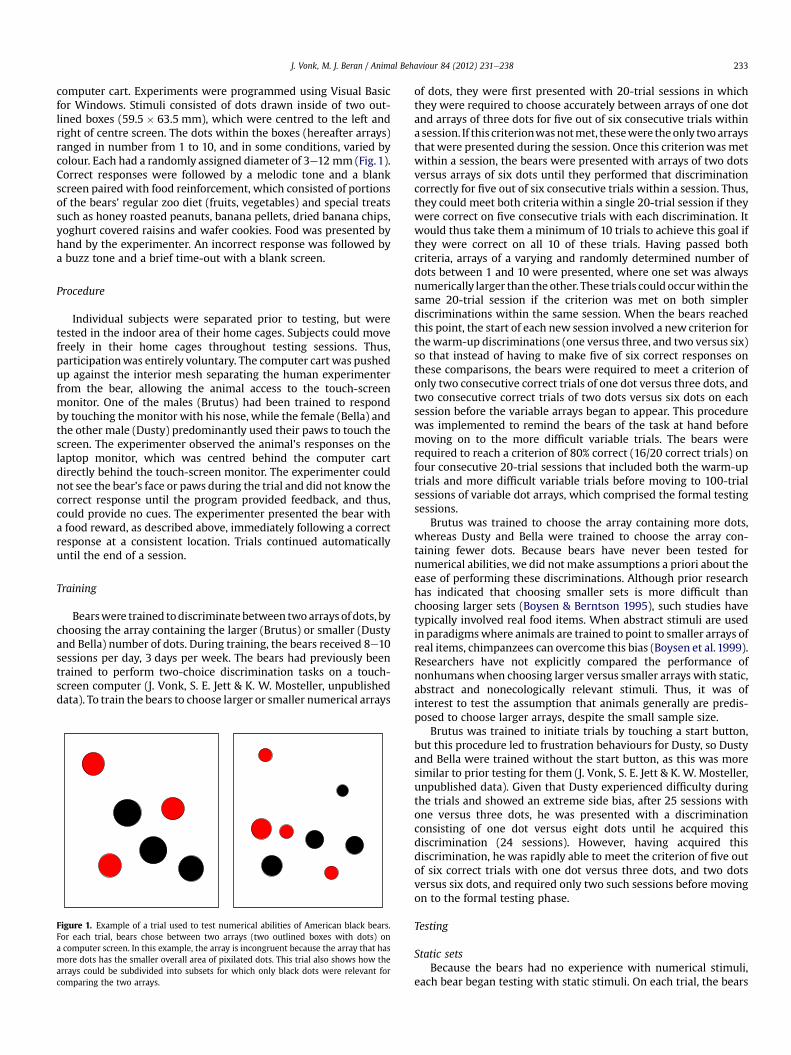
Figure 2 depicts performance as a function of ratio between theareas in the arrays. Brutus performed better, on average, withcongruent trials, as one might expect (b ¼ 0.35, Wald ¼ 3.74,P ¼ 0.05, CI ¼ 0.05e1.42). Area affected Bella’s performance differ-ently on congruent and incongruent trials. For Bella, there wasa main effect of congruence (b ¼ 2.70, Wald ¼ 30.65, P < 0.001,CI ¼ 0.03e 0.18), and congruence interacted with area (b ¼ 2.95,Wald ¼ 75.77, P < 0.001, CI ¼ 9.85e37.20). When separate logisticregressions were conducted for congruent and incongruent trials,area significantly predicted whether trials would be correct or noton both types of trials, but greater area led to worse performanceon incongruent trials (b ¼ �1.13, Wald ¼ 17.62, P < 0.001,CI ¼ 0.19e0.55) and better performance on congruent trials(b ¼ 1.83, Wald ¼ 77.60, P < 0.001, CI ¼ 4.13e9.31). Dusty tended toperform better on incongruent trials, and when ratio was smaller,as with Bella, area affected Dusty’s performance differently onincongruent and congruent trials. There was a main effect ofcongruence (b ¼ �1.42, Wald ¼ 52.50, P < 0.001, CI ¼ 0.17e0.36)and ratio (b ¼ �0.65, Wald ¼ 9.45, P ¼ 0.002, CI ¼ 0.35e0.79), andcongruence interactedwith area (b ¼ 1.55,Wald ¼ 94.36, P < 0.001,CI ¼ 3.45e6.44). When separate logistic regressions were con-ducted for congruent and incongruent trials, larger area led toworse performance on incongruent trials (b ¼ �0.44,Wald ¼ 12.65,

0
10
20
30
40
50
60
70
80
90
100
% C
orre
ct
0
10
20
30
40
50
60
70
80
90
100
0.1 0.2 0.3 0.4 0.5 0.6 0.7 0.8 0.9 1
0.1 0.2 0.3 0.4 0.5 0.6 0.7 0.8 0.9 1
0.1 0.2 0.3 0.4 0.5 0.6 0.7 0.8 0.9 10
10
20
30
40
50
60
70
80
90
100
Ratio of area
(a)
(b)
(c)
Figure 2. Percentage of bears’ correct choices between two arrays with static stimulias a function of the ratio between areas in congruent (open circles) and incongruent(solid squares) trials: (a) Brutus, whose correct choice was the larger ratio, and (b) Bellaand (c) Dusty, whose correct choices were the smaller ratios.
J. Vonk, M. J. Beran / Animal Behaviour 84 (2012) 231e238 235
P < 0.001, CI ¼ 0.5e0.82) and better performance on congruenttrials (b ¼ 1.11, Wald ¼ 120.78, P < 0.001, CI ¼ 2.49e3.70).
Bella and Dusty’s pattern of responding suggests that they werechoosing based on larger area, which allowed them to performbetter on incongruent trials when the smaller number of dotscontained the larger area of pixilation. However, all three bears
reached above-chance levels of performance on both congruentand incongruent trials, so the use of area was not the whole story,and the bears often relied on number rather than area to makecorrect responses (binomial tests: all Ps < 0.001). With these staticdata, only Dusty showed significant effects of ratio, which,according toWeber’s law, indicates analoguemagnitude estimation(see also Dehaene 1992; Feigenson et al. 2004; Beran 2008).Analogue magnitude estimation is thought to operate when indi-viduals must represent large approximate quantities. Errorsgenerally increase in proportion to the size of the set of items forwhich quantity is being estimated (Feigenson et al. 2004).
Moving stimuliOnce again, separate binary logistic regressions were conducted
for each subject. Performance (correct/incorrect) was regressed onthe predictors: difference in number (difference), ratio of numberbetween arrays (ratio), ratio of area between arrays (area),congruence (congruent/incongruent) and the interaction ofcongruencewith each of the other predictors. Herewe expected thesame effects as before; negative relationships between ratio andperformance and perhaps effects of area on performance. We pre-dicted that Brutus might perform slightly better on congruenttrials, while the opposite would be true for Bella and Dusty, aschoosing larger area and smaller number were in conflict oncongruent trials.
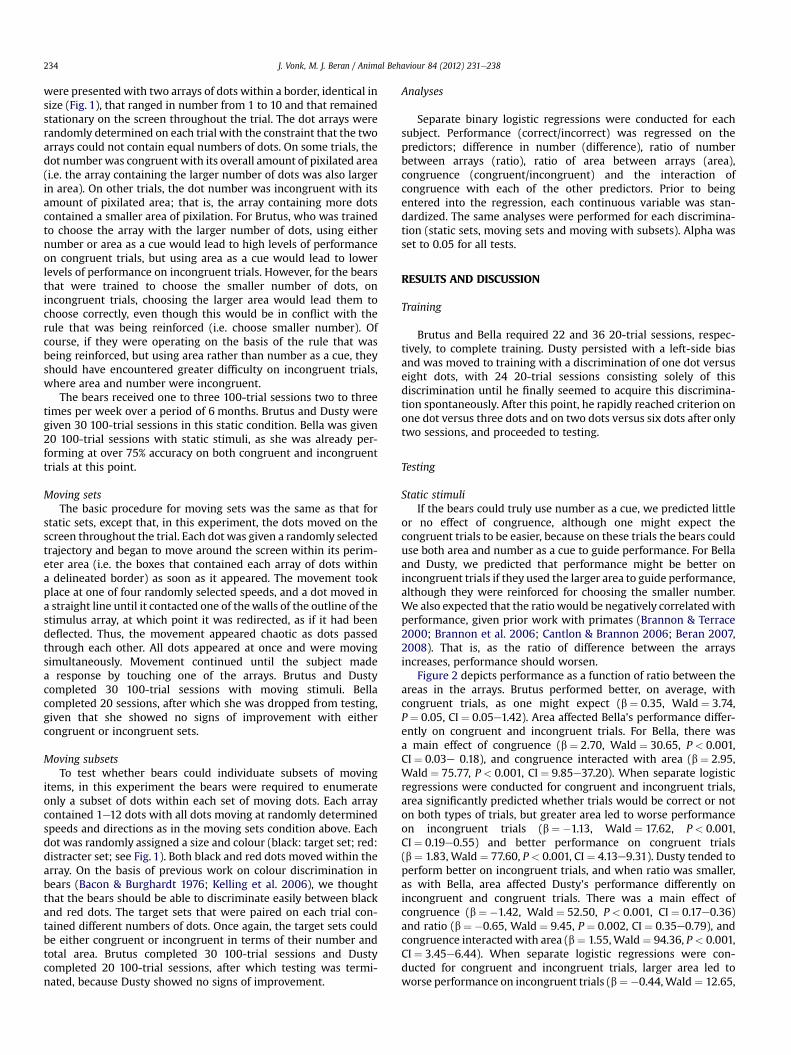
As with static dot arrays, Brutus performed better on congruenttrials when he could use both number and area as a cue, and, likeprimates tested previously, he performed better with smaller ratiosbetween the arrays, main effect of congruence (b ¼ 0.63,Wald ¼ 22.66, P < 0.001, CI ¼ 1.45e2.44) and ratio (b ¼ �0.44,Wald ¼ 13.88, P < 0.001, CI ¼ 0.51e0.81), and an interaction ofcongruence with area (b ¼ �0.71, Wald ¼ 25.48, P < 0.001,CI ¼ 0.38e0.65; Fig. 3). When separate logistic regressions wereconducted for congruent and incongruent trials, larger area pre-dicted better performance on incongruent trials (b ¼ 0.25,Wald ¼ 6.68, P ¼ 0.01, CI ¼ 1.06e1.56) and worse performance oncongruent trials (b ¼ �0.45, Wald ¼ 20.51, P < 0.001,CI ¼ 0.52e0.77). These results indicate that, with moving stimuli,Brutus relied more heavily on area as a cue. Also, ratio was signif-icantly related to his performance, suggesting that he was usingmagnitude estimation to perform the task. Brutus showed theexpected patterns in that he performed better with larger differ-ences in number and smaller ratios between numbers. Figure 3depicts performance as a function of the ratio between numbersof dots in the arrays.
Overall, Bella performed very well on incongruent trials whenshe could choose larger area, but not on congruent trials when areaconflicted with number. There was a significant main effect ofcongruence (b ¼ �1.15, Wald ¼ 51.58, P < 0.001, CI ¼ 0.23e0.43)and significant interactions of congruence with each of the otherpredictors (numerical difference: b ¼ �0.55, Wald ¼ 6.56, P ¼ 0.01,CI ¼ 0.38e0.89; ratio: b ¼ �0.60, Wald ¼ 9.98, P ¼ 0.002,CI ¼ 0.38e0.80; area: b ¼ 0.79, Wald ¼ 25.94, P < 0.001,CI ¼ 1.63e3.00). When separate logistic regressions were con-ducted for congruent and incongruent trials, larger area predictedpoorer performance on incongruent trials (b ¼ �0.31, Wald ¼ 6.66,P ¼ 0.01, CI ¼ 0.58e0.93) and better performance on congruenttrials (b ¼ 0.49, Wald ¼ 23.29, P < 0.001, CI ¼ 1.34e1.99). A greaterdifference between number in the two arrays predicted betterperformance only on incongruent trials (b ¼ 0.47, Wald ¼ 6.16,P ¼ 0.01, CI ¼ 1.10e2.32). A greater ratio predicted worse perfor-mance only on congruent trials (b ¼ �0.45,Wald ¼ 11.20, P ¼ 0.001,CI ¼ 0.49e0.83).
Dusty generally performed better on incongruent trials, and hisperformance was affected differently by the numerical difference,
0
10
20
30
40
50
60
70
80
90
100
% C
orr
ect
0
10
20
30
40
50
60
70
80
90
100(a)
(b)
(c)
0.1 0.2 0.3 0.4 0.5 0.6 0.7 0.8 0.9
0.1 0.2 0.3 0.4 0.5 0.6 0.7 0.8 0.9
0.1 0.2 0.3 0.4 0.5 0.6 0.7 0.8 0.90
20
40
60
80
100
120
Ratio of difference
Figure 3. Percentage of bears’ correct choices between moving stimuli as a function ofthe ratio between numbers in congruent (open circles) and incongruent (solid squares)trials: (a) Brutus, whose correct choice was the larger ratio, and (b) Bella and (c) Dusty,whose correct choices were the smaller ratios.
J. Vonk, M. J. Beran / Animal Behaviour 84 (2012) 231e238236
ratio and area depending onwhether the trials were incongruent orcongruent. There was a main effect of congruence (b ¼ �2.02,Wald ¼ 132.68, P < 0.001, CI ¼ 0.09e0.19), and significant interac-tions of congruence with each of the other predictors (numerical
difference: b ¼ 0.89, Wald ¼ 13.28, P < 0.001, CI ¼ 1.51e3.92; ratio:b ¼ 0.79, Wald ¼ 11.07, P ¼ 0.001, CI ¼ 1.38e3.51; area: b ¼ 2.38,Wald ¼ 193.26, P < 0.001, CI ¼ 7.75e15.18). When separate logisticregressions were conducted for congruent and incongruent trials,greater area led to worse performance on incongruent trials(b ¼ �0.79, Wald ¼ 35.63, P < 0.001, CI ¼ 0.35e0.59) and betterperformance on congruent trials (b ¼ 1.59, Wald ¼ 214.64,P < 0.001, CI ¼ 3.97e6.08). A greater numerical difference tendedto produce lower performance on incongruent trials (b ¼ �0.38,Wald ¼ 2.89, P ¼ 0.09, CI ¼ 0.44e1.06) and higher performance oncongruent trials (b ¼ 0.51, Wald ¼ 26.06, P < 0.001, CI ¼ 1.31e2.03).A greater ratio led to lower performance on both incongruent trials(b ¼ �1.31, Wald ¼ 42.66, P < 0.001, CI ¼ 0.18e0.40) and congruenttrials (b ¼ �0.52, Wald ¼ 16.13, P < 0.001, CI ¼ 0.46e0.77), whichwas the expected result based on past research.
That Bella and Dusty continued to perform very well on incon-gruent trials but very poorly on congruent trials indicated that theywere continuing to use area as a cue, which they could do moreeasily on trials when there was a larger numerical difference anda smaller ratio. However, if area was the only cue they were using,they should have been as far below chance on congruent trials asthey were above chance on incongruent trials, and this was not thecase. It may have been the case that they relied on area when itcould be used as a cue, but attempted to use number to somedegree on some other trials, although they failed to do so reliably.All bears showed the expected patterns of performing better withgreater differences in numerical distance and smaller ratiosbetween the stimuli.
Moving stimuli with subsetsBella was discontinued in the experiment based on her overall
low level of performance with moving stimuli and the need tocontinue testing her in other experiments. Once again, separatebinary logistic regressions were conducted for both Brutus andDusty. Performance (correct/incorrect) was regressed on thepredictors: numerical difference in subsets, ratio of numberbetween subsets in arrays, ratio of area between subsets in arrays,congruence and the interaction of congruence with each of theother predictors.
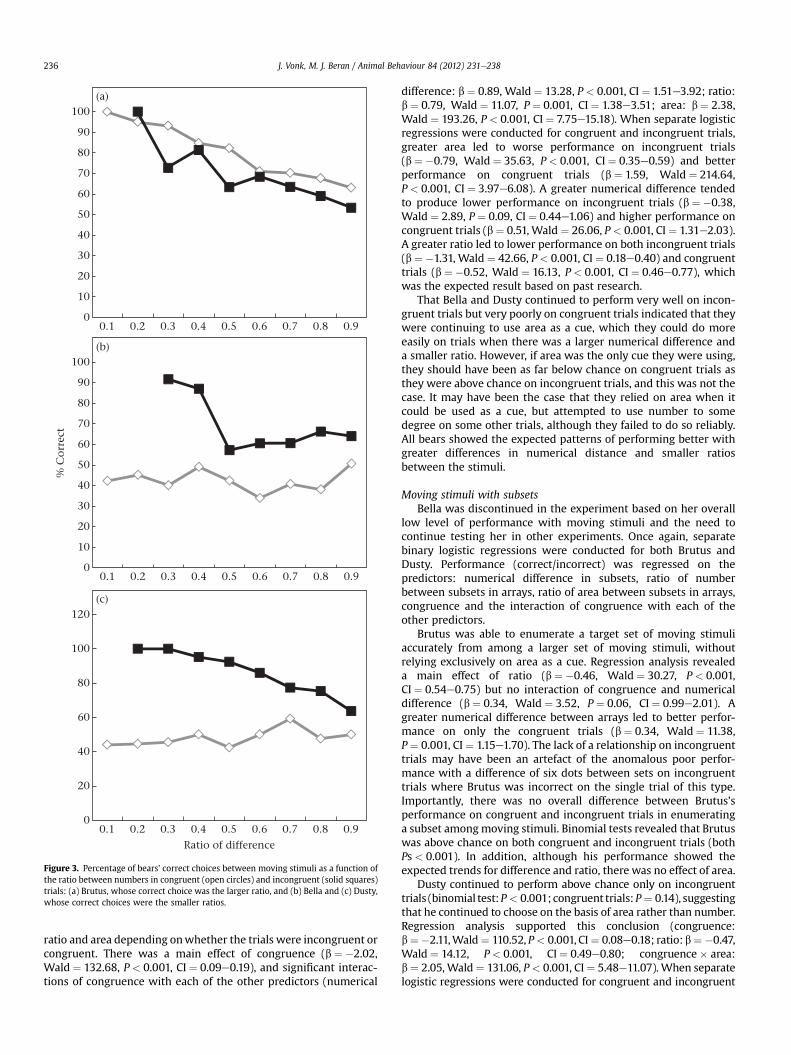
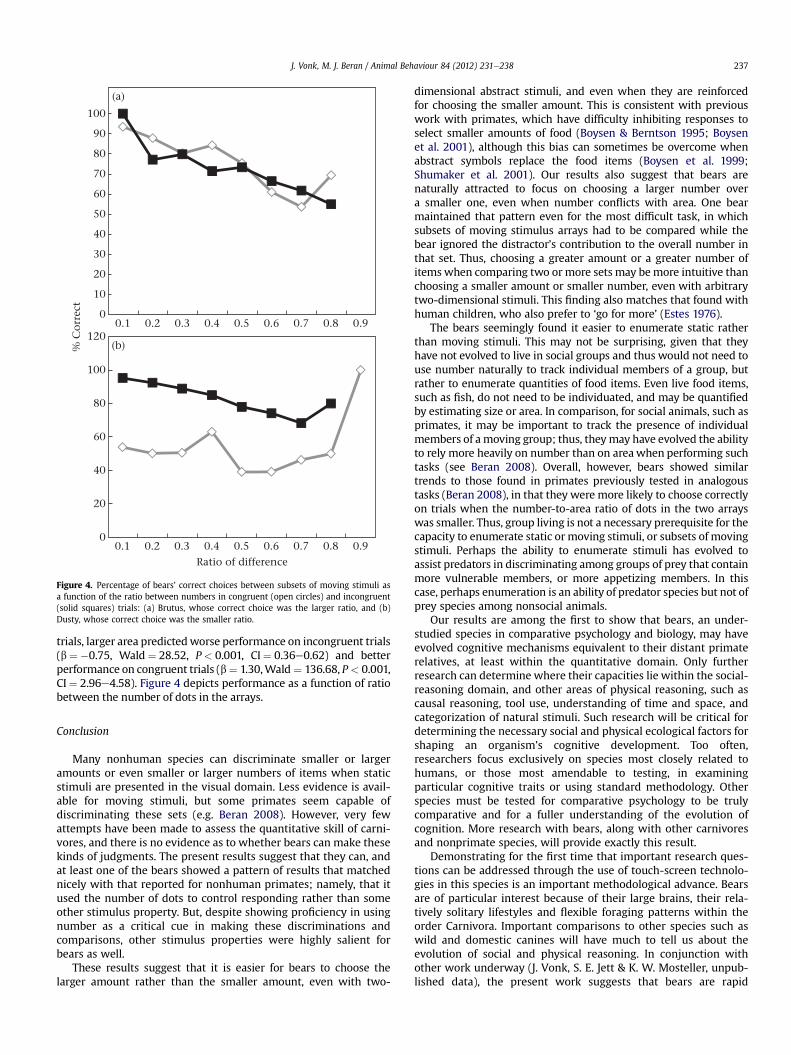
Brutus was able to enumerate a target set of moving stimuliaccurately from among a larger set of moving stimuli, withoutrelying exclusively on area as a cue. Regression analysis revealeda main effect of ratio (b ¼ �0.46, Wald ¼ 30.27, P < 0.001,CI ¼ 0.54e0.75) but no interaction of congruence and numericaldifference (b ¼ 0.34, Wald ¼ 3.52, P ¼ 0.06, CI ¼ 0.99e2.01). Agreater numerical difference between arrays led to better perfor-mance on only the congruent trials (b ¼ 0.34, Wald ¼ 11.38,P ¼ 0.001, CI ¼ 1.15e1.70). The lack of a relationship on incongruenttrials may have been an artefact of the anomalous poor perfor-mance with a difference of six dots between sets on incongruenttrials where Brutus was incorrect on the single trial of this type.Importantly, there was no overall difference between Brutus’sperformance on congruent and incongruent trials in enumeratinga subset amongmoving stimuli. Binomial tests revealed that Brutuswas above chance on both congruent and incongruent trials (bothPs < 0.001). In addition, although his performance showed theexpected trends for difference and ratio, there was no effect of area.
Dusty continued to perform above chance only on incongruenttrials (binomial test:P < 0.001; congruent trials:P¼ 0.14), suggestingthat he continued to choose on the basis of area rather than number.Regression analysis supported this conclusion (congruence:b¼ �2.11,Wald ¼ 110.52, P< 0.001, CI¼ 0.08e0.18; ratio:b¼ �0.47,Wald¼ 14.12, P < 0.001, CI¼ 0.49e0.80; congruence� area:b¼ 2.05, Wald¼ 131.06, P < 0.001, CI¼ 5.48e11.07). When separatelogistic regressions were conducted for congruent and incongruent
0
10
20
30
40
50
60
70
80
90
100
(a)
(b)
0.1 0.2 0.3 0.4 0.5 0.6 0.7 0.8 0.9
0.1 0.2 0.3 0.4 0.5 0.6 0.7 0.8 0.90
20
40
60
80
100
120
% C
orre
ct
Ratio of difference
Figure 4. Percentage of bears’ correct choices between subsets of moving stimuli asa function of the ratio between numbers in congruent (open circles) and incongruent(solid squares) trials: (a) Brutus, whose correct choice was the larger ratio, and (b)Dusty, whose correct choice was the smaller ratio.
J. Vonk, M. J. Beran / Animal Behaviour 84 (2012) 231e238 237
trials, larger area predictedworse performance on incongruent trials(b ¼ �0.75, Wald ¼ 28.52, P< 0.001, CI¼ 0.36e0.62) and betterperformance on congruent trials (b¼ 1.30,Wald ¼ 136.68, P < 0.001,CI¼ 2.96e4.58). Figure 4 depicts performance as a function of ratiobetween the number of dots in the arrays.
Conclusion
Many nonhuman species can discriminate smaller or largeramounts or even smaller or larger numbers of items when staticstimuli are presented in the visual domain. Less evidence is avail-able for moving stimuli, but some primates seem capable ofdiscriminating these sets (e.g. Beran 2008). However, very fewattempts have been made to assess the quantitative skill of carni-vores, and there is no evidence as to whether bears can make thesekinds of judgments. The present results suggest that they can, andat least one of the bears showed a pattern of results that matchednicely with that reported for nonhuman primates; namely, that itused the number of dots to control responding rather than someother stimulus property. But, despite showing proficiency in usingnumber as a critical cue in making these discriminations andcomparisons, other stimulus properties were highly salient forbears as well.
These results suggest that it is easier for bears to choose thelarger amount rather than the smaller amount, even with two-
dimensional abstract stimuli, and even when they are reinforcedfor choosing the smaller amount. This is consistent with previouswork with primates, which have difficulty inhibiting responses toselect smaller amounts of food (Boysen & Berntson 1995; Boysenet al. 2001), although this bias can sometimes be overcome whenabstract symbols replace the food items (Boysen et al. 1999;Shumaker et al. 2001). Our results also suggest that bears arenaturally attracted to focus on choosing a larger number overa smaller one, even when number conflicts with area. One bearmaintained that pattern even for the most difficult task, in whichsubsets of moving stimulus arrays had to be compared while thebear ignored the distractor’s contribution to the overall number inthat set. Thus, choosing a greater amount or a greater number ofitems when comparing two ormore sets may bemore intuitive thanchoosing a smaller amount or smaller number, even with arbitrarytwo-dimensional stimuli. This finding also matches that found withhuman children, who also prefer to ‘go for more’ (Estes 1976).
The bears seemingly found it easier to enumerate static ratherthan moving stimuli. This may not be surprising, given that theyhave not evolved to live in social groups and thus would not need touse number naturally to track individual members of a group, butrather to enumerate quantities of food items. Even live food items,such as fish, do not need to be individuated, and may be quantifiedby estimating size or area. In comparison, for social animals, such asprimates, it may be important to track the presence of individualmembers of a moving group; thus, theymay have evolved the abilityto rely more heavily on number than on areawhen performing suchtasks (see Beran 2008). Overall, however, bears showed similartrends to those found in primates previously tested in analogoustasks (Beran 2008), in that they were more likely to choose correctlyon trials when the number-to-area ratio of dots in the two arrayswas smaller. Thus, group living is not a necessary prerequisite for thecapacity to enumerate static or moving stimuli, or subsets of movingstimuli. Perhaps the ability to enumerate stimuli has evolved toassist predators in discriminating among groups of prey that containmore vulnerable members, or more appetizing members. In thiscase, perhaps enumeration is an ability of predator species but not ofprey species among nonsocial animals.
Our results are among the first to show that bears, an under-studied species in comparative psychology and biology, may haveevolved cognitive mechanisms equivalent to their distant primaterelatives, at least within the quantitative domain. Only furtherresearch can determine where their capacities lie within the social-reasoning domain, and other areas of physical reasoning, such ascausal reasoning, tool use, understanding of time and space, andcategorization of natural stimuli. Such research will be critical fordetermining the necessary social and physical ecological factors forshaping an organism’s cognitive development. Too often,researchers focus exclusively on species most closely related tohumans, or those most amendable to testing, in examiningparticular cognitive traits or using standard methodology. Otherspecies must be tested for comparative psychology to be trulycomparative and for a fuller understanding of the evolution ofcognition. More research with bears, along with other carnivoresand nonprimate species, will provide exactly this result.
Demonstrating for the first time that important research ques-tions can be addressed through the use of touch-screen technolo-gies in this species is an important methodological advance. Bearsare of particular interest because of their large brains, their rela-tively solitary lifestyles and flexible foraging patterns within theorder Carnivora. Important comparisons to other species such aswild and domestic canines will have much to tell us about theevolution of social and physical reasoning. In conjunction withother work underway (J. Vonk, S. E. Jett & K. W. Mosteller, unpub-lished data), the present work suggests that bears are rapid
J. Vonk, M. J. Beran / Animal Behaviour 84 (2012) 231e238238
problem-solvers and are capable of abstract concept formation.These findings should help change the bias of researchers to focuson group living as the driving force for complex cognition. Thattouch screens can be used effectivelywith bears to test awide rangeof cognitive abilities now provides the means to examine moreclosely their cognitive competence in comparison to other morewidely studied species, such as primates, that have been perform-ing computerized tasks for decades. It is exciting to consider thatsuch divergent species can be tested in the same way to promotea fuller picture of comparative cognition and the diverse forcesgiving rise to both similar and distinct traits.
Acknowledgments
We are indebted to the Mobile Zoo, especially its director, JohnHightower. Without his support and assistance, these experimentscould not have been conducted. In addition, special thanks to Ste-phanie Jett for her assistance during data collection and Dr JoanSinnott for her support. This research was supported by the AubreyKeith Lucas and Ella Ginn Lucas Endowment for Faculty ExcellenceAwards (to J.V.), the National Science Foundation (grant number0924811 to M.J.B.) and the National Institutes of Health (grantnumber 060563 to M.J.B.).
References
Agrillo, C., Dadda, M., Serena, G. & Bisazza, A. 2009. Use of number by fish. PLoSOne, 4, e4786, doi:10.1371/journal.pone.0004786.
Anderson, U. S., Stoinski, T. S., Bloomsmith, M. A., Marr, M. J., Smith, A. D. &Maple, T. S. 2005. Relative numerousness judgment and summation in youngand old western lowland gorillas. Journal of Comparative Psychology, 119,285e295.
Bacon, E. S. & Burghardt, G. M. 1976. Learning and color discrimination in theAmerican black bear. International Conference on Bear Research and Manage-ment, 3, 27e36.
Bentley-Condit, V. K. & Smith, E. O. 2010. Animal tool use: current definitions andan updated comprehensive catalog. Behaviour, 147, 185e221.
Beran, M. J. 2001. Summation and numerousness judgments of sequentially pre-sented sets of items by chimpanzees (Pan troglodytes). Journal of ComparativePsychology, 115, 181e191.
Beran, M. J. 2007. Rhesus monkeys (Macaca mulatta) enumerate sequentially pre-sented sets of items using analog numerical representations. Journal of Exper-imental Psychology, Animal Behavior Processes, 33, 42e54.
Beran, M. J. 2008. Monkeys (Macaca mulatta and Cebus apella) track, enumerateand compare multiple sets of moving items. Journal of Experimental Psychology,Animal Behavior Processes, 34, 63e74.
Beran, M. J. & Beran, M. M. 2004. Chimpanzees remember the results of one-by-one addition of food items to sets over extended time periods. PsychologicalScience, 15, 94e99.
Boysen, S. T. & Berntson, G. G. 1995. Responses to quantity: perceptual versuscognitive mechanisms in chimpanzees (Pan troglodytes). Journal of ExperimentalPsychology, Animal Behavior Processes, 21, 82e86.
Boysen, S. T., Mukobi, K. L. & Berntson, G. G.1999. Overcoming response bias usingsymbolic representations of number by chimpanzees (Pan troglodytes). AnimalLearning & Behavior, 27, 229e235.
Boysen, S. T., Berntson, G. G. & Mukabi, K. L. 2001. Size matters; impact of itemsize and quantity on array choice by chimpanzees (Pan troglodytes). Journal ofComparative Psychology, 115, 106e110.
Brannon, E. M. & Terrace, H. S. 2000. Representation of the numerosities 1e9 byrhesus macaques (Macaca mulatta). Journal of Experimental Psychology, AnimalBehavior Processes, 26, 31e49.
Brannon, E. M., Cantlon, J. F. & Terrace, H. S. 2006. The role of references points inordinal numerical comparisons by rhesus macaques (Macaca mulatta). Journalof Experimental Psychology, Animal Behavior Processes, 32, 120e134.
Cantlon, J. F. & Brannon, E. M. 2006. Semantic congruity affects numerical judg-ments similarly in monkeys and humans. Proceedings of the National Academy ofSciences, U.S.A., 102, 16507e16511.
Deecke, V. 2012. Tool-use in the brown bear (Ursus arctos). Animal Cognition,doi:10.1007/s10071-012-0475-0, published online 24 February 2012.
Dehaene, S. 1992. Varieties of numerical abilities. Cognition, 44, 1e42.Dungl, E., Schratter, D. & Huber, L. 2008. Discrimination of face-like patterns in the
giant panda (Ailuropoda melanoleuca). Journal of Comparative Psychology, 122,335e343, doi:10.1037/0735-7036.122.4.335.
Emery, N. J. & Clayton, N. 2004. The mentality of crows: convergent evolution ofintelligence in corvids and apes. Science, 306, 1903e1907.
Emmerton, J. 1998. Numerosity differences and effects of stimulus density onpigeons’ discrimination performance. Animal Learning & Behavior, 26, 243e256.
Emmerton, J., Lohmann, A. & Niemann, J. 1997. Pigeons’ serial ordering ofnumerosity with visual arrays. Animal Learning & Behavior, 25, 234e244.
Estes, K. W. 1976. Nonverbal discrimination of more and fewer elements by chil-dren. Journal of Experimental Child Psychology, 21, 393e405.
Feigenson, L., Dehaene, S. & Spelke, E. 2004. Core systems of number. Trends inCognitive Sciences, 8, 307e314.
Fiorito, G., Biederman, G. B., Davey, V. A. & Gherardi, F. 1998. The role of stimuluspreexposure in problem solving by Octupus vulgaris. Animal Cognition, 1,107e112, doi:10.1007/s100710050015.
Gittleman, J. L. 1986. Carnivore brain size, behavioural ecology, and phylogeny.Journal of Mammalogy, 67, 23e36.
Gomez-Laplaza, L. M. & Gerlai, R. 2011. Can angelfish (Pterophyllum scalare) count?Discrimination among different shoal sizes follows Weber’s law. AnimalCognition, 14, 1e9.
Hare, B. 2007. From nonhuman to human mind: what changed and why? CurrentDirections in Psychological Science, 16, 60e64.
Hare, B., Brown, M., Williamson, C. & Tomasello, M. 2002. The domestication ofsocial cognition in dogs. Science, 298, 1636e1639.
Humphrey, N. K.1976. The social function of intellect. In: Growing Points in Ethology(Ed. by P. P. G. Bateson & R. A. Hinde), pp. 303e317. Cambridge: CambridgeUniversity Press.
Hvorecny, L. M., Grudowski, J. L., Blakeslee, C. J., Simmons, T. L., Roy, P. R.,Brooks, J. A. & Boal, J. G. 2007. Octopuses (Octopus bimaculoides) and cuttle-fishes (Sepia pharaonis, S. officinalis) can conditionally discriminate. AnimalCognition, 10, 449e459, doi:10.1007/s10071-007-0085-4.
Ikeda, Y. 2009. A perspective on the study of cognition and sociality of cephalopodmollusks, a group of intelligent marine invertebrates. Japanese PsychologicalResearch, 51, 146e153, doi:10.1111/j.1468-5884.2009.00401.x.
Jaakkola, K., Fellner, W., Erb, L., Rodriguez, M. & Guarino, E. 2005. Understandingof the concept of numerically ‘less’ by bottlenose dolphins (Tursiops truncatus).Journal of Comparative Psychology, 119, 286e303.
Jolly, A. 1966. Lemur social behaviour and primate intelligence. Science, 153,501e506.
Judge, P. G., Evans, T. A. & Vyas, D. K. 2005. Ordinal representation of numericquantities by brown capuchin monkeys (Cebus apella). Journal of ExperimentalPsychology, Animal Behavior Processes, 31, 79e94.
Kelling, A. S., Synder, R. J., Marr, M. J., Bloomsmith, M. A., Gardner, W. &Maple, T. M. 2006. Color vision in the panda (Ailuropoda melanoleuca). Learning& Behavior, 34, 154e161.
Kilian, A., Yaman, S., von Fersen, L. & Gunturkun, O. 2003. A bottlenose dolphindiscriminates visual stimuli differing innumerosity. Learning&Behavior,31,133e142.
Kubinyi, E., Virányi, Z. & Miklósi, A. 2007. Comparative social cognition: fromwolfand dog to humans. Comparative Cognition & Behavior Reviews, 2, 26e46.
Mather, J. A. 2006. Behaviour development: a cephalopod perspective. InternationalJournal of Comparative Psychology, 19, 98e115.
Miklósi, A., Topál, J. & Csányi, V. 2004. Comparative social cognition: what candogs teach us? Animal Behaviour, 67, 995e1004.
Milton, K. 1981. Distribution patterns of tropical plant foods as an evolutionarystimulus to primatemental development. American Anthropologist, 83, 534e548.
Milton, K. 1988. Foraging behaviour and the evolution of primate intelligence. In:Machiavellian Intelligence: Social Expertise and the Evolution of Intellect inMonkeys, Apes, and Humans (Ed. by R. W. Byrne & A. Whiten), pp. 285e305. NewYork: Clarendon.
Pepperberg, I. M. 2006. Grey parrot numerical competence: a review. AnimalCognition, 9, 377e391.
Perdue, B. M., Synder, R. J., Zhihe, Z., Marr, M. J. & Maple, T. 2011. Sex differencesin spatial ability: a test of the range size hypothesis in the order Carnivora.Biology Letters, 7, 380e383.
Roberts, W. A. & Mitchell, S. 1994. Can a pigeon simultaneously process temporaland numerical information? Journal of Experimental Psychology, Animal BehaviorProcesses, 20, 66e78.
Rosati, A. G., Santos, L. R. & Hare, B. 2010. Primate social cognition: thirty yearsafter Premack and Woodruff. In: Primate Neuroethology (Ed. by A. Ghazanfar &M. Platt), pp. 117e143. Oxford: Oxford University Press.
Santos, L. R., Barnes, J. L. & Mahajan, N. 2005. Expectations about numericalevents in four lemur species Eulemur fulvus, Eulemur mongoz, Lemur catta andVarecia rubra. Animal Cognition, 8, 253e262.
Seed, A., Emery, N. & Clayton, N. 2009. Intelligence in corvids and apes: a case ofconvergent evolution? Ethology, 115, 401e420.
Shumaker, R. W., Palkovich, A. M., Beck, B. B., Guagnano, G. A. & Morowitz, H.2001. Spontaneous use of magnitude discrimination and ordination by theorangutan (Pongo pygmaeus). Journal of Comparative Psychology, 115, 385e391.
Tarou, L. R. 2003. An examination of the role of associative learning and spatialmemory in foraging in two species of bear (family: Ursidae). Ph.D. thesis,Georgia Institute of Technology.
Thomas, R. K. & Chase, L. 1980. Relative numerousness judgments by squirrelmonkeys. Bulletin of the Psychonomic Society, 16, 79e82.
Tomasello, M. & Call, J. 1997. Primate Cognition. New York: Oxford University Press.Uller, C., Jaeger, R., Guidry, G. & Martin, C. 2003. Salamanders (Plethodon cinereus)
go for more: rudiments of number in an amphibian. Animal Cognition, 6,105e112.
West, S., Jett, S. E., Beckman, T. & Vonk, J. 2010. The phylogenetic roots of cognitivedissonance. Journal of Comparative Psychology, 124, 425e432.
Zamisch, V. & Vonk, J. In press. Spatial memory in captive American black bears(Ursus americanus). Journal of Comparative Psychology, doi:10.1037/a0028081.