Embed Size (px)
Citation preview

Fisheries catch reconstruction for the Comoros — Doherty et al. 1
ReconstRucting catches foR the union of the comoRos: uniting histoRical souRces of catch Data foR ngaziDja, nDzuwani anD mwali fRom 1950–2010*
Beau Doherty,1 Melissa Hauzer2 and Frédéric Le Manach1,3†
1 Sea Around Us, Fisheries Centre, University of British Columbia, 2202 Main Mall, Vancouver V6T 1Z4, Canada2 Department of Geography, University of Victoria, Victoria V8W 3P5, Canada
3 Institut de Recherche pour le Développement, UMR212 Ecosystèmes Marins Exploités, Avenue Jean Monnet, CS 30171, 34203 Sète cedex, France
† Current address: BLOOM Association, 77 rue du Faubourg Saint-Denis, 75010 Paris, France
[email protected]; [email protected]; [email protected]
abstRact
Comorian fisheries consist of a small-scale boat fleet of pirogues and motor boats operated by men as well as shore-based fishing by women, both of which have few catch statistics. We compiled historical data on catch rates and the number of boats in the fleet from both grey literature and national statistics, and used these to reconstruct a time series of boat-based catch from 1950–2010. We also estimate catch by women fishers by extrapolating per-capita catch rates from a recently published study on the island of Ngazidja. Catches increased slowly from 1,000 t in 1950 to around 5,000 t in 1980, after which catches increased rapidly due to the increasing number of motorized vessels and the use of FADs offshore. The size of the fleet has grown rapidly since the 1990s and catch estimates are highest from 2005–2010 at around 19,000 t∙year-1. Overall, the reconstructed catches are 1.3 times the figures reported to and by the FAO for the Indian Ocean. Total reconstructed catches consist primarily of Thunnus albacares (yellowfin tuna), Katsuwonus pelamis (skipjack tuna), Sardinella spp. (sardinellas) and Engraulidae (anchovies).
intRoDuction
The Union of the Comoros (referred throughout as 'the Comoros') is an archipelago in the northern Mozambique channel of the Western Indian Ocean that is composed of three islands: Ngazidja (or Grande Comore), Ndzuwani (or Anjouan) and Mwali (or Mohéli; Figure 1). Fisheries in the Comoros consist of a small-scale pirogues and fibreglass motor boat (locally known as barques or vedettes) fleet as well as shore-based subsistence fishing by women. Until the 1980s the boat fleet was almost exclusively non-motorized pirogues using mostly handlines (de San 1983). Catches by this fleet increased in the 1980s, due to the importation of fibreglass motorboats and the use of anchored Fish Aggregating Devices (a-FADs) for fishing further offshore (Cayré 1991; Anon. 2013). The high season fishing months have historically occurred between November and February when tunas migrate around the islands; catches in other months are generally lower (Van Nierop 1985; James 1988).
The fishing conditions on the three islands vary. Ngazidja is surrounded by a narrow coral reef extending about 500 m from shore (Fourmanoir 1954). The reef is generally not very deep, nor is it followed by a large shelf with productive fishing areas for reef species. Fishing here has historically targeted large pelagic species (e.g., sharks,1 tuna, billfish and dolphinfish) in areas about 5–15 km offshore (Fourmanoir 1954). The fishing conditions off Ndzuwani are comparable to Ngazidja, except the productivity of the coral reefs is higher (Fourmanoir 1954). Fishermen from Ndzuwani and Ngazidja frequently fish the waters near Mwali, perhaps even more heavily than local residents (James 1988). Ndzuwani fishers also regularly fish in Mayotte's waters (Maggiorani et al. 1993; Doherty et al. this volume).
* Cite as: Doherty B, Hauzer M and Le Manach F (2015) Reconstructing catches for the Union of the Comoros: uniting historical sources of catch data for Ngazidja, Ndzuwani and Mwali from 1950–2010. Pp. 1–11 In Le Manach F and Pauly D (eds.) Fisheries catch reconstructions in the Western Indian Ocean, 1950–2010. Fisheries Centre Research Reports 23(2). Fisheries Centre, University of British Columbia [ISSN 1198–6727]. 1 Historically there was a targeted fishery for sharks (Fourmanoir 1954), but fishing effort now targets more tuna and it does not appear that there is a fishery targeting sharks specifically. When caught, sharks are finned for the Chinese market and the meat is consumed locally (Kiszka et al. 2008).
EEZ Boundary
Shelf 0 100 km
±
Ngazidja
Mwali
Ndzuwani
Figure 1. Map of the Comoros showing the islands of Ngazidja (Grande Comore), Ndzuwani (Anjouan) and Mwali (Mohéli), the extent of the Exclusive Economic Zone (EEZ), as well as the continental shelf (darker blue).

2
Mwali is the least densely populated island, and its continental shelf extends about 10 km from the coast and harbours much more productive reef fisheries (Fourmanoir 1954). Thus, fisheries in Mwali have historically targeted more reef species (e.g., snappers, groupers and emperors). A marine park was established around the southern half of the island in 2001, extending from the high tide mark to 100 m depth and covering over 400 km2 (Granek and Brown 2005).
Fishing in the Comoros is mostly day trips, as no vessels have refrigerating units (de San 1983; James 1988) and crews are small, usually 1–2 people per boat (WIOMSA 2011). The average crew and boat sizes are larger in Ngazidja, as these vessels often fish further offshore (WIOMSA 2011). Catches are usually landed on shore and sold on the same day (Anon. 2013). There are no restrictions on the amount of fish that may be landed, but fishers rarely catch more than they can consume or sell in one day (Hauzer et al. 2013a).
A survey conducted by the Direction Nationale des Ressources Halieutiques (National Fisheries Department) in 1994 provided the only comprehensive assessment of catch by the small-scale boat fleet, and Hauzer et al. (2013a) provided the only catch estimates for women fishers. Fishers reported declines in catch abundances, mean size and changes in species composition over the last two decades (Hauzer et al. 2013b), but there was a lack of official catch statistics to verify these trends. Other studies during the 1950–2010 period provided estimates of catch rates and the number of boats in the fleets, and were used to reconstruct a time-series of boat-based catch. The size of the fleet has grown rapidly since the 1990s, but data collection and catch statistics has remained limited.
The purpose of this report was to estimate the total marine fisheries catches for the Comoros from 1950 to 2010, using FAO data as the baseline. Reconstructed estimates were compared with FAO landings in an attempt to identify unreported sources of catch and increase transparency in Comorian catch statistics.
the comoRos' fisheRies anD ReconstRuction methoDs
Boat-based catch
We compiled catch and effort data from grey literature and unpublished datasets for select years with available data from 1950–2010. These data were treated as anchor points and linear interpolation of catch rates, and the number of fishing boats were used to estimate gaps in the data between anchor points.
Boat time-series
Table 1 summarizes the boat counts that were available for the small-scale fishing fleets since 1950. In the early 1950s, Fourmanoir (1954) estimated that there were 130 pirogues in the southern villages of Ngazidja. Moal (1962) counted 213 boats in these same villages, representing a ratio of 0.61:1 for boats in 1954 compared to those in 1962. We assumed that the same increase occurred proportionally on other areas of Ngazidja, Ndzuwani and Mwali and applied this ratio to boat counts by Moal (1962) to estimate boat numbers in 1954. There was a large discrepancy in the number of boats recorded in the 1993 and 1994 national survey data. Since we found no explanation to justify this, we used the average number of boats from 1993–1994.
The boat anchor points in Table 1 were converted to a boat per-capita2 rate for each boat type and linear interpolation was used to estimate boats per-capita for years without boat data. This provided a boat per capita time-series from
2 Population statistics for 1960–2012 were available from the World Bank database (http://databank.worldbank.org, Accessed: 06/06/2013) and for 1950 and 1955 from the United Nations database (http://data.un.org, Accessed: 06/06/2013). Missing years in the 1950s were linearly interpolated.
Table 1. Anchor points for the number of boats in the Comoros for various years between 1950–2011.Year Pirogues Motor boatsb Sources
Non-motorized Motorizeda
Ngazidja Ndzuwani Mwali Ngazidja Ndzuwani Mwali Ngazidja Ndzuwani Mwali1954 566 123 36 - - - - - - Fourmanoir (1954)c
1962 928 201d 59 - - - - - - Moal (1962)1979 1,455 970 194 45 30 6 - - - Faharoudine (1979)1983 - - - - - - 15e 25 10e Van Nierop (1985)1987 1,500 1,200 300 - - - 11 18 6 James (1988)1993 2,012 1,391 242 107 120 79 250 92 69 Unpub. data, 1994 survey, Direction National
des Ressources Halieutiques1994 1,748 1,505 247 87 80 54 109 77 392011 1,888 1,864 227 23 25 209 802 708 18 Unpub. data, 2011 boat census, Direction
National des Ressources Halieutiquesf
a Includes Fedawa I.b Includes barques, vedettes, Fedawa II, Yamaha G18, and Japawa). Classification of boat categories are based on boat size, capacity, and horse power (Lablache-Carrara and Laloë 1993; Aboulhalik 1998).c Multiplied 1962 boat numbers by 0.61.d Missing boat data for 3 communities (Vouani, Pomoni and Moya) was estimated using the median value from other communities in Ndzuwani.e Estimated the distribution of vedettes in 1983 for Ngazidja and Mwali. There were originally 50 vedettes supplied (James 1988), 25 of which were originally on Ndzuwani (Van Nierop 1985). f Obtained through SWIOFP database (http://41.206.61.142:8080/statbase_3).

Fisheries catch reconstruction for the Comoros — Doherty et al. 3
1950–2010 that was used to estimate a boat time-series by multiplying per capita boat rates by annual populations on each island (Figure 2).
Catch rates time series
Where available, estimates of annual catch were divided by total boats on the island to estimate an annual catch rate. Otherwise, daily catch rates were multiplied by the number of trips per year to estimate the annual catch for different boat types (Table 2).
Early observations of small-scale fisheries in the Comoros archipelago were well-documented by Fourmanoir (1954). These included catch rates of 50 kg·trip-1 for pirogues fishing twice per week on the southern offshore banks of Mwali, and an average annual catch rate of 5.2 t·pirogue-1. Pirogues fishing every day on the interior reef had an average catch rate of 10 kg·trip-1 and an annual catch rate of 2.6 t·pirogue-1, assuming trips occurred 5 times per week (Table 2).
During this time, a normal week of pelagic fishing by 70 pirogues off Ngazidja landed: 1,500 kg of sharks (Isurus glaucus and Carcharinus longimanus), ten yellowfin tuna (Thunnus albacares) with an average weight of 20 kg, two dolphinfish (Coryphaena hippurus) with an average weight of nine kilos, and four Indo-Pacific sailfish (Istiophorus platypterus). Average lengths of landed sailfish on Ngazidja were 2.9 m (Fourmanoir 1954), and we estimate their average weight as 50 kg per fish using length-weight relationships from FishBase (www.fishbase.org). This yielded a total of 1,918 kg of pelagic fish by 70 boats in one week, or an average weekly catch of 27.4 kg per pirogue. Based on the overall catch composition in the 1994 survey data (unpub. data, Direction Nationale des Ressources Halieutiques), we assumed an additional 20% of annual catches were composed of yellowtail barracuda (Sphyraena flavicauda), oilfish (Ruvettues pretiosus), small pelagics and other reef fish (e.g., Lethrinidae and Carangidae), also documented in catches by Fourmanoir (1954).
Linear interpolation between catch rates was used to fill in gaps. We used the same rates for all three islands where island specific rates were not available. We had no catch rates beyond 1994; however, the majority of boat fishers interviewed by Hauzer et al. (2013a) reported declines in catch abundance and mean fish sizes over the last 20 years. This was not surprising given the large increase in motorized vessels in the small-scale fishing fleet during this time (Figure 2). We assumed catch rates declined by 50% between 1994 and 2010 (Figure 3).
1950 1960 1970 1980 1990 2000 2010
Num
er o
f boa
ts
0
500
1 000
1 500
2 000 Ngazidja
Mwali
Ndzuwani
Ngazidja
Mwali
Ndzuwani
1979 1984 1989 1994 1999 2004 2009 0
30
60
90
120
Ngazidja
Mwali
Ndzuwani
1983 1988 1993 1998 2003 2008 0
600
700
800
900
200
300
400
500
100
Year
A
B
C
Figure 2. Estimated annual number of A) non-motorized pirogues from 1950–2010, B) motorized pirogues from 1979–2010, and C) motor boats from 1983–2010. Solid circles represent anchor points described in Table 1.

4
Shore-based fishing by women
Hauzer et al. (2013a) provided the only estimates of catch by women fishers in the Comoros. Based on data collected from interviews in 2009–2010, the annual catch by women was estimated for three communities on Ngazidja (Table 3). Each community had 80 women fishers and catch estimates for each village ranged from 40–99 tonnes due to the differences in catch rates and the number of full-time fishers. There are another seven communities on the island consisting of women fishers, one of which contains only ten fishers (Hauzer et al. 2013a). We estimated that the other six villages also contained approximately ten women fishers, based on the second author's personal experience. Extrapolated to the entire island of Ngazidja, this yielded an estimate of 255 tonnes for 2010. We converted these 255 tonnes to a shore-based catch per-capita and assumed the same per-capita catch rate for the islands of Mwali and Ndzuwani in 2010.
All women fishers interviewed by Hauzer et al. (2013a) reported declines in catch abundance in the last ten years. We therefore assumed a higher shore-based catch per-capita in 2000, increasing the 2010 per-capita rate by 25%. We used linear interpolation to derive per-capita catch rates from 2001–2009 and maintained the 2000 rate from 1950–1999.
Taxonomic and sectoral breakdown
We maintained the same annual taxonomic compositions for the boat-based reconstructed catch as what was reported to the FAO for the 1970–2010 period. Data reported to the FAO from 1950–1969 had poor taxonomic detail, with 20–70% of the catch reported as 'marine fishes nei' (i.e., unidentified marine fish). To improve the taxonomic breakdown prior to 1970, we reallocated catches of unidentified fish to other taxonomic groups based on the catch composition in the early 1970s, using the average 1971–1973 breakdown from FAO. The assumption here was that new taxa reported in 1971–1973 FAO landings (e.g., Carangidae, Engraulidae, Istiophoridae and Scombriae) were reflective of improved taxonomic reporting rather than new fish species targeted by fisheries. This retained 7%
Table 3. 2010 annual catch estimates for full-time and part-time women fishers on Ngazidja (derived from Hauzer et al. 2013a). Community Annual catch (t) Average catch per year Number of fishers % full time
Full time Part time Full time Part timeChindini 40.2 0.9 0.4 10 70 0.13Hantsindzi 59.7 0.9 0.5 50 30 0.63Mitsamiouli 98.8 1.4 0.7 60 20 0.75Seven other villages 8.1 1.1a 0.5a 5 5 0.50a
a Estimated as average value from the three communities above.
Table 2. Summary of annual catch rate estimates from 1954 to 1994.Year Boat type Daily catch rate
(kg·boat-1) Trips per year Annual catch
rate (t·boat-1)aSources and comments
Ngazidja1954 Non-motorized pirogue 34.3a - 1.8 Fourmanoir (1954)1962 - - 1.5 Moal (1962)1978 - - 1.4 de San (1983)1994 - - 1.7 Unpub. data, 1994 survey, Direction Nationale
des Ressource HalieutiquesMotorized pirogue - - 12.2Motor boat - 23.7
Ndzuwani1962 Non-motorized pirogue - - 3.5 Moal (1962)1979 - - 1.4 de San (1983) 1983–1984 39.7 (high season),
21.8b (low season)104.0 3.0 Van Nierop (1985), James (1988).
Annual catch rate assumes 60% of trips occur in low season and 40% of trips occur in high season (Van Nierop 1985; James 1988)
Motorized pirogue 69.0 (high season), 38.0b (low season)
104.0 5.2
Motor boat 252.4 (high season), 138.9b (low season)
122.0 22.6
1986–1987 Non-motorized pirogue 20.0 104.0 2.1 James (1988)Motor boat 250.0 122.0 30.5
1994 Non-motorized pirogue - - 1.4 Unpub. data, 1994 survey, Direction Nationale des Ressources HalieutiquesMotorized pirogue - - 8.0
Motor boat - - 15.0Mwali1954 Non-motorized pirogue 50 (offshore) and
10 (inshore)104 (offshore)
and 260 (inshore)c3.9 Fourmanoir (1954).
Average of inshore and offshore rate1962 - - 5.1 Moal (1962)1979 - - 2.1 Faharoudine (1979), de San (1983)1994 - - 0.8 Unpub. data, 1994 survey, Direction Nationale
des Ressources HalieutiquesMotorized pirogue - - 4.7Motor boat - - 9.8
a Numbers reflect weekly catch rates observed in October; number of trips per week unknown. b Low-season rate estimated as 55% of high season rate based on ratios from James (1988). c Fourmanoir (1954) indicates these fishers fish every day; here we assume an average of 5 trips per week throughout the year (Van Nierop 1985).

Fisheries catch reconstruction for the Comoros — Doherty et al. 5
of annual catches as 'unidentified marine fish' and reassigned the remainder as anchovies, bigeye tuna, Carangidae, Indian mackerel, Indo-Pacific sailfish, kawakawa, skipjack tuna, swordfish and yellowfin tuna.
The Sea Around Us uses the following fishing sectors in its global catch database: 'industrial' (i.e., large-scale commercial), 'artisanal' (i.e., small-scale commercial), 'subsistence' (i.e., small-scale non-commercial with primary purpose being self- or family-consumption), and 'recreational' (i.e., small-scale non-commercial with the primary purpose being pleasure). For the purposes of the Sea Around Us database, the small-scale shore fishing and boat-based catches were divided into artisanal and subsistence components. Species of higher value, such as tunas (Thunnus spp. and Euthynnus spp.), billfishes (Istiophoridae) and lobsters, were assumed to be primarily sold commercially and thus 80% of this catch was allocated to the 'artisanal' sector. Fish species sold at lower prices, such as small pelagics (Clupeiformes), and marine molluscs, were assumed to be primarily used for take-home consumption and 80% of these catches were allocated as 'subsistence'. For other species where the distinction was not obvious, such as jacks (Carangidae), mackerels (Auxis spp., Rastrelliger spp., Scomberomorus spp.), and other unidentified marine fish, we used an even split, allocating 50% to each small-scale sector. All shore-based catch was allocated as subsistence.
Flags of Convenience
FAO landing data (FishStat 2014) also included catches from the Central Eastern Atlantic (FAO Area 34) from 2007–2012. These landings were composed mostly of pelagic species (primarily Clupeidae, Engraulidae, and Carangidae) as well as a small amount (2%) of demersals. However, as there were no records of any distant water Comorian fishing fleets, these catches were not considered domestic.
Rather, we suspected that these catches were from industrial fishing vessels fishing the high seas using the Comoros as a flag of convenience. As a matter of fact, the Comoros has been previously identified as a potential flag of convenience state for high seas fishing (Gianni and Simpson 2005; Anon. 2013). The FAO fishing vessels finder database (www.fao.org/figis/vrmf/finder; Accessed: June 26, 2014) listed six foreign vessels (Table 4) that have been registered with the Comoros flag between 2004 and 2012. Given the absence of any other information we assumed that these countries were responsible for the FAO reported landings in the Atlantic. We allocated 89% of the pelagic catch to Lithuania
1950 1960 1970 1980 1990 2000 2010 Ca
tch
per p
irogu
e or
boa
t (t)
0
3
4
5
6
Ngazidja
Mwali
Ndzuwani
1979 1984 1989 1994 1999 2004 2009 0
8
10
12
14
1983 1988 1993 1998 2003 2008 0
20
25
30
35
5
10
15
Year
B
C
2
1
A
6
4
2Mwali
Mwali
Ngazidja
Ngazidja
Ndzuwani
Ndzuwani
Figure 3. Estimated annual catch rates (t·boat-1) for A) non-motorized pirogues from 1950–2010, B) motorized pirogues from 1979–2010, and C) motor boats from 1983–2010. Solid circles represent anchor points described in Table 2.

6
and 11% to Netherlands based on the proportion of total tonnage by vessels from these countries using midwater otter trawls. Demersal catches were reallocated to France, the only country with vessels using bottom trawls.
Although we could not confirm that France, Lithuania and Netherlands were responsible for these catches, we are confident that these catches were not from the Comoros fishing fleets and our reallocation is, therefore, more informative than what is currently in the FAO database.
Foreign fisheries
Industrial longliners from Japan have fished in Comorian waters since at least the late 1950s (Moal 1962). Although there were no formal agreements at this time, Japan has contributed funds and equipment (e.g., fiberglass vessels, fishing nets) to develop the Comoros' fisheries over the years (de San 1983; James 1988; Lablache-Carrara and Laloë 1993). Formal agreements with the European Union have been signed in recent years, which allowed up to 45 tuna seiners and 25 longliners from France, Spain, Italy and Portugal to fish for tuna in the Comoros EEZ (Anon. 2013; Eckstein 2014).
Results
Overall, the total reconstructed catches from 1950–2010 were nearly 516,000 t, 96% of which were from the small-scale boat fleet, and 4% of which were from shore-based fishing by women (Figure 4A). Catches increased slowly from 1,000 t in 1950 to around 5,000 t in 1980, after which catch volumes increased rapidly due to the increasing number of motorized vessels and the use of offshore a-FADs. The size of the fleet has grown rapidly since the 1990s and despite decreasing catch rates, catch estimates were the highest from 2005–2010 at around 19,000 t∙year-1. Overall, the reconstructed catches were 1.3 times the landings reported to FAO in the Indian Ocean. Total reconstructed catches consisted primarily of yellowfin tuna, skipjack tuna, sardinellas, and anchovies (Figure 4B). The sectoral assignments suggested that 'artisanal' and 'subsistence' catches accounted for 61% and 39% of total reconstructed catches from 1950–2010, respectively (Figure 4A).
Discussion
The overall discrepancy between the reconstructed domestic catches and the data reported to FAO was mainly due to an increase in catch since 1995, which contributed 54% of the total reconstructed catch (and were 95,000 t higher than what was reported to FAO). In estimating catches for these years, we assumed a 50% decline in catch rates since the 1994 survey by the Direction Nationale des Ressources Halieutiques,which is the only comprehensive assessment of small-scale fisheries in the Comoros.
Table 4. Fishing vessels registered with the Comoros flag in the FAO fishing vessel finder database.Country Boat name Period Gear Length (m) Gross tonnage Lithuania ARAS-1 2009, 2012 Midwater otter trawl 104 4,378
IRVINGA 2011–2013 105 4,407BALANDIS 2011, 2012 109 5,953KOVAS 118 5,979
The Netherlands OCEAAN VII 2012 90 2,624France LA MADONE 2 2004 Bottom trawl and dredging 11 16
0
Boat-based, artisanal5
10
15
20
Boat-based, subsistence
Shore-based, subsistenceA
B
0 1950 1960 1970 1980 1990 2000 2010
Catc
h (t
hous
and
tonn
es)
Year
5
10
15
20
Yellowfin tuna
Skipjack tuna
SardinesAnchovies
OthersJacks
BillfishesOther tunas and mackerels
Figure 4. Reconstructed catches by A) sector and B) major taxa. 'Others' includes lobsters, molluscs, sharks, rays and other unidentified marine fish. See details in Appendix Table A1 and Appendix Table A2.

Fisheries catch reconstruction for the Comoros — Doherty et al. 7
The 2012 dataset produced by FAO (2012; i.e., the dataset used here) showed that catches have steadily decreased from 1994 to around 11,000 t∙year-1 from 2001–2010. This was in stark contrast to the 2010 dataset (FAO 2012), where catches increased from 1994 to 20,500 t∙year-1 in 2008–2010. As we found no catch statistics for this period, the reasons for this change in the FAO data remains unknown. What we do know is that the number of motor boats in the Comoros increased from around 300 in 1994 to about 1,700 in 2011 (Figure 2). Catches in the 2012 FAO data declined by 23% over this same period and, if accurate, would correspond to about a 70% decline in annual catch per boat since 1994 (Figure 5).
Interviews with fishermen confirmed that there has been a decrease in mean fish sizes and perceived catch abundance over the last 20 years (Hauzer et al. 2013b), but by how much we do not know. In these interviews 62% of motorized boat fishers and 55% of pirogue fishers reported declines in fish sizes. Similarly, 50% of motorized boat fishers and 75% of pirogue fishers reported declines in catch abundance. Given that this perception was not consistent among fishers, Hauzer et al. (2013b) suspected that the declines in catch were not drastic. Furthermore, catch figures remained reasonably high in recent years, averaging 22 kg∙day-1 for pirogues and 110 kg∙day-1 for motor boats (Hauzer et al. 2013b). Thus, we think that our assumption of a 50% decline may well be conservative, and catches over this period may actually be higher. Not surprisingly, sensitivity analysis of this assumption shows that catches in the last 15 years would vary considerably depending on the decline in catch rates assumed; thus this is a major source of uncertainty in our estimates (Figure 5). We were not able to provide estimates of uncertainty for the reconstructed totals, as error estimates are unavailable for catch statistics used, including those reported by the FAO.
For most of the 1950–1994 period, we found the 2012 FAO dataset to be a reasonable estimate of boat-based catches. The reconstructed estimates here provide an alternative, but show a similar trend to FAO data. The reconstructed catches yielded per-capita consumption rates of 6–15 kg∙person-1∙year-1 from 1950–1979. These are low for an island country with few other protein sources. However, it is known that throughout the 1950s-1970s, fishing did not satisfy local consumption requirements and large amounts of salted fish were imported from Madagascar and Zanzibar (Fourmanoir 1954; Moal 1962; Faharoudine 1979; Meyer et al. 2006).
Further studies are necessary to improve confidence in our results, notably with regards to the shore-based activities conducted by women fishers. In this study we extrapolated estimates by Hauzer et al. (2013b) for the island of Ngazidja to estimate catches for all of the Comoros and using population data estimated historical catches by this sector. This information provides a preliminary estimate of the scale of these catches, which could be improved through specific studies on the islands of Mwali and Ndzuwani. The importance of such activities for food security and livelihoods is increasingly recognized (Harper et al. 2013; Anon. 2014; Kleiber et al. 2014). Thus, further research is required to better understand the species most affected by these fisheries and well as their social and economical impact.
We found few data on the species composition of catches in the Comoros and much of the data reported to FAO from 1950–1969 was recorded as unidentified marine fish. We attempted to improve the taxonomic detail of these catches, by disaggregating them based on more detailed information in FAO data in the early 1970s. Information on major species caught by fisheries in 1950s (Fourmanoir 1954) and the 1994 national statistics could be used in future efforts to improve Comorian catch statistics and may provide valuable information of changes in species composition over time. For example, approximately 80% of catches on Ngazidja observed by Fourmanoir (1954) over a one-week period were composed of sharks, whereas they accounted for less than 1% of annual catches on Ngazidja in 1994 and fishermen reported that sharks are now rarely seen in catches (M. Hauzer, unpub. data). It is clear that tunas are now the main target species for offshore pelagic fisheries, but sharks likely accounted for a much larger proportion of catches in earlier years and this is not reflected in our estimates. Groupers (Plectropomus pessuliferus,3 Epinephelus merra, Variola louti), snappers (Lutjanus argentimaculatus, Aprion virescens) and emperors (Lethrinus nebulosus, L. olivaceus4) were commonly caught in Mwali reef fisheries in the 1950s (Fourmanoir 1954), but we found no species specific catch statistics for reef fisheries in recent years to compare these with. Interviews with fishermen suggested that some species that were once common are now rarely seen, 3 Plectropomus maculatus listed in Fourmanoir (1954) is a likely misidentification (Froese and Pauly 2014).4 Lethrinus miniatus listed in Fourmanoir (1954) is a likely misidentification (Froese and Pauly 2014).
0
5
10
15
20
25
1950 1960 1970 1980 1990 2000 2010 Ca
tch
(tho
usan
d to
nnes
)
Year
Reported to FAO
Figure 5. Reconstructed boat-based catch compared to other sources of catch data. Solid circles represent estimates observed in the grey literature (Moal 1962; de San 1983; Van Nierop 1985; James 1988; Amoriggi 2010) and the 1994 survey by the Direction National des Ressources Halieutiques. Dashed (75% decline) and dotted (25% decline) lines show sensitivity analysis for different assumptions about the decline in catch rates between 1994–2010.
8
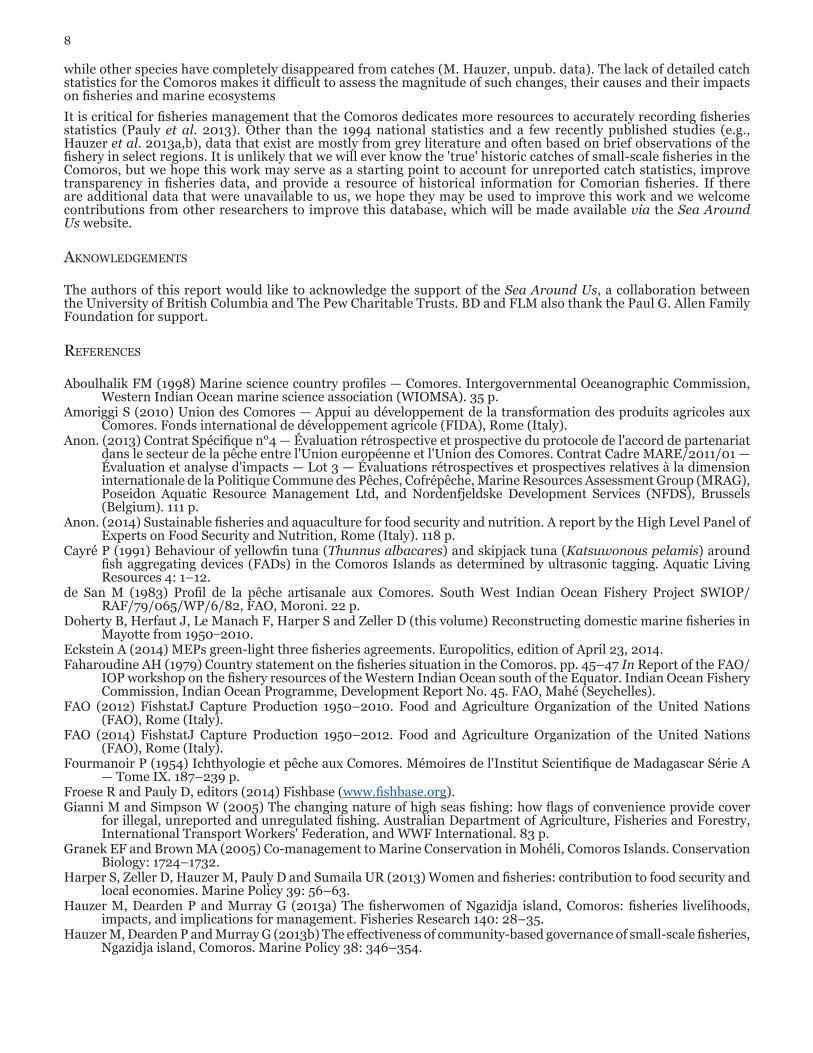
while other species have completely disappeared from catches (M. Hauzer, unpub. data). The lack of detailed catch statistics for the Comoros makes it difficult to assess the magnitude of such changes, their causes and their impacts on fisheries and marine ecosystems
It is critical for fisheries management that the Comoros dedicates more resources to accurately recording fisheries statistics (Pauly et al. 2013). Other than the 1994 national statistics and a few recently published studies (e.g., Hauzer et al. 2013a,b), data that exist are mostly from grey literature and often based on brief observations of the fishery in select regions. It is unlikely that we will ever know the 'true' historic catches of small-scale fisheries in the Comoros, but we hope this work may serve as a starting point to account for unreported catch statistics, improve transparency in fisheries data, and provide a resource of historical information for Comorian fisheries. If there are additional data that were unavailable to us, we hope they may be used to improve this work and we welcome contributions from other researchers to improve this database, which will be made available via the Sea Around Us website.
aknowleDgements
The authors of this report would like to acknowledge the support of the Sea Around Us, a collaboration between the University of British Columbia and The Pew Charitable Trusts. BD and FLM also thank the Paul G. Allen Family Foundation for support.
RefeRences
Aboulhalik FM (1998) Marine science country profiles — Comores. Intergovernmental Oceanographic Commission, Western Indian Ocean marine science association (WIOMSA). 35 p.
Amoriggi S (2010) Union des Comores — Appui au développement de la transformation des produits agricoles aux Comores. Fonds international de développement agricole (FIDA), Rome (Italy).
Anon. (2013) Contrat Spécifique n°4 — Évaluation rétrospective et prospective du protocole de l'accord de partenariat dans le secteur de la pêche entre l'Union européenne et l'Union des Comores. Contrat Cadre MARE/2011/01 — Évaluation et analyse d'impacts — Lot 3 — Évaluations rétrospectives et prospectives relatives à la dimension internationale de la Politique Commune des Pêches, Cofrépêche, Marine Resources Assessment Group (MRAG), Poseidon Aquatic Resource Management Ltd, and Nordenfjeldske Development Services (NFDS), Brussels (Belgium). 111 p.
Anon. (2014) Sustainable fisheries and aquaculture for food security and nutrition. A report by the High Level Panel of Experts on Food Security and Nutrition, Rome (Italy). 118 p.
Cayré P (1991) Behaviour of yellowfin tuna (Thunnus albacares) and skipjack tuna (Katsuwonous pelamis) around fish aggregating devices (FADs) in the Comoros Islands as determined by ultrasonic tagging. Aquatic Living Resources 4: 1–12.
de San M (1983) Profil de la pêche artisanale aux Comores. South West Indian Ocean Fishery Project SWIOP/RAF/79/065/WP/6/82, FAO, Moroni. 22 p.
Doherty B, Herfaut J, Le Manach F, Harper S and Zeller D (this volume) Reconstructing domestic marine fisheries in Mayotte from 1950–2010.
Eckstein A (2014) MEPs green-light three fisheries agreements. Europolitics, edition of April 23, 2014.Faharoudine AH (1979) Country statement on the fisheries situation in the Comoros. pp. 45–47 In Report of the FAO/
IOP workshop on the fishery resources of the Western Indian Ocean south of the Equator. Indian Ocean Fishery Commission, Indian Ocean Programme, Development Report No. 45. FAO, Mahé (Seychelles).
FAO (2012) FishstatJ Capture Production 1950–2010. Food and Agriculture Organization of the United Nations (FAO), Rome (Italy).
FAO (2014) FishstatJ Capture Production 1950–2012. Food and Agriculture Organization of the United Nations (FAO), Rome (Italy).
Fourmanoir P (1954) Ichthyologie et pêche aux Comores. Mémoires de l'Institut Scientifique de Madagascar Série A — Tome IX. 187–239 p.
Froese R and Pauly D, editors (2014) Fishbase (www.fishbase.org).Gianni M and Simpson W (2005) The changing nature of high seas fishing: how flags of convenience provide cover
for illegal, unreported and unregulated fishing. Australian Department of Agriculture, Fisheries and Forestry, International Transport Workers' Federation, and WWF International. 83 p.
Granek EF and Brown MA (2005) Co-management to Marine Conservation in Mohéli, Comoros Islands. Conservation Biology: 1724–1732.
Harper S, Zeller D, Hauzer M, Pauly D and Sumaila UR (2013) Women and fisheries: contribution to food security and local economies. Marine Policy 39: 56–63.
Hauzer M, Dearden P and Murray G (2013a) The fisherwomen of Ngazidja island, Comoros: fisheries livelihoods, impacts, and implications for management. Fisheries Research 140: 28–35.
Hauzer M, Dearden P and Murray G (2013b) The effectiveness of community-based governance of small-scale fisheries, Ngazidja island, Comoros. Marine Policy 38: 346–354.

Fisheries catch reconstruction for the Comoros — Doherty et al. 9
James JRW (1988) Summary of the fisheries and resources information for the Comores. In Sanders MJ, Sparre P and Venema SC (eds.), Proceedings of the workshop on the assessment of the fishery resources in the southwest Indian Ocean. RAF/79/065/WP/41/88/E. FAO/UNDP, Albion (Mauritius).
Kiszka J, Wickel J, Jamon A and Layssac K (2008) Note sur l'exploitation et la capture accidentelle des requins autour de la Grande Comore (Union des Comores), Canal de Mozambique. Document interne — Groupe de Recherche sur les Requins — MAYSHARK. 2 p.
Kleiber D, Harris LM, Vincent AC and Rochet M-J (2014) Improving fisheries estimates by including women's catch in the Central Philippines. Canadian Journal of Fisheries and Aquatic Sciences 71(5): 656–664.
Lablache-Carrara G and Laloë F (1993) Plan d'exécution d'un système d'échantillonnage des captures aux Comores. 46 p.
Maggiorani JM, Minet JP and Taquet M (1993) Situation de la pêche artisanale à Mayotte en 1992–93 — Résultats de l'enquête halieutique (mars 1992 — février 1993) et comparison avec l'enquête halieutique de 1988–89. IFREMER, Collectivité Territoriale de Mayotte — Direction de l'Agriculture et de la Forêt, Service des Pêches. 34 p.
Meyer J, Nelson D, Black D and TANGO International (2006) Comoros: comprehensive food security and vulnerability analysis (CFSVA). World Food Programme (WFP), Vulnerability Analysis and Mapping Branch (ODAV). 62 p.
Moal RA (1962) La pêche aux Comores. Ministère d'état chargé départements et territoires d'outre-mer, France. 78 p.Pauly D (2013) Fisheries: does catch reflect abundance? Nature 494(7437): 303–306.Van Nierop M (1985) Rapport préliminaire sur la performance des embarcations de pêche sur l'île d'Anjouan aux
Comores. RAF/79/065/WP/20/85, SWIOP. Available at: http://www.fao.org/docrep/field/279543.htm#F007 [Accessed: July 16, 2012].
WIOMSA (2011) Migrant fishers and fishing in the Western Indian Ocean: socio-economic dynamics and implications for management. Final report of commissioned research project MASMA/CR/2008/02. 158 p.

10
Appendix Table A1. Total reconstructed catch compared to official data reported to FAO.Year Reconstructed Reported to FAO
Shore-based Boat-based Total Artisanal Subsistence
1950 142 653 347 1,142 8351951 145 659 431 1,235 9351952 148 634 549 1,331 9181953 152 739 542 1,433 8181954 155 796 584 1,535 8181955 158 975 518 1,651 8351956 161 1,052 559 1,772 8351957 164 1,091 643 1,898 7171958 167 1,166 688 2,021 7171959 170 1,143 839 2,152 8171960 173 1,221 896 2,290 8171961 176 1,171 1,087 2,434 8171962 179 1,285 1,115 2,579 9171963 182 1,344 1,165 2,691 9171964 185 1,403 1,217 2,805 9171965 189 1,318 1,407 2,914 9171966 193 1,212 1,617 3,022 8751967 197 1,258 1,678 3,133 8751968 202 1,425 1,619 3,246 1,2351969 206 1,470 1,671 3,347 1,2351970 211 1,420 1,815 3,446 1,6621971 215 1,647 1,672 3,534 2,4701972 220 1,832 1,564 3,616 2,8791973 225 1,985 1,486 3,696 3,2871974 230 2,074 1,472 3,776 4,0471975 237 2,115 1,517 3,869 4,7561976 245 2,315 1,412 3,972 4,8641977 255 2,357 1,470 4,082 5,6211978 265 2,378 1,408 4,051 6,0271979 275 2,821 1,610 4,706 6,4861980 285 3,131 1,732 5,148 6,9521981 295 3,428 1,863 5,586 7,4601982 304 3,711 1,990 6,005 7,9751983 312 6,684 3,540 10,536 8,4941984 321 6,774 3,543 10,638 9,0001985 330 6,136 3,175 9,641 9,5161986 339 5,444 2,773 8,556 9,9711987 348 5,543 2,757 8,648 10,3791988 357 6,349 3,151 9,857 10,9141989 366 7,345 3,282 10,993 10,7521990 375 7,804 3,855 12,034 11,2521991 385 8,321 4,291 12,997 11,5521992 394 8,853 4,597 13,844 12,5911993 403 9,624 4,807 14,834 12,7581994 413 9,191 4,510 14,114 13,5371995 423 9,484 4,756 14,663 13,1091996 434 9,838 4,934 15,206 12,6961997 445 10,110 5,170 15,725 12,5761998 456 10,368 5,358 16,182 12,3171999 468 10,701 5,475 16,644 11,8182000 480 10,770 5,826 17,076 12,0032001 482 11,077 5,895 17,454 11,4252002 485 11,246 6,069 17,800 11,1782003 487 11,314 6,289 18,090 11,0532004 489 11,263 6,587 18,339 10,9872005 491 11,383 6,661 18,535 10,7382006 492 11,393 6,784 18,669 10,4642007 494 11,102 7,156 18,752 10,7242008 495 10,921 7,352 18,768 11,0932009 496 10,803 7,414 18,713 10,8252010 496 10,621 7,449 18,566 10,540

Fisheries catch reconstruction for the Comoros — Doherty et al. 11
Appendix Table A2. Total reconstructed catch by taxa.Year Yellowfin tuna Skipjack tuna Sardines Anchovies Jacks Others1950 477 99 120 44 69 334 1951 463 98 233 43 67 332 1952 396 95 386 47 74 333 1953 479 117 313 58 90 376 1954 516 126 337 62 96 397 1955 701 159 179 66 102 445 1956 754 173 193 71 110 470 1957 735 186 242 89 138 508 1958 783 201 258 95 148 535 1959 735 189 485 89 139 515 1960 782 204 518 95 148 542 1961 714 183 829 81 126 500 1962 788 209 785 96 150 552 1963 821 221 821 101 157 572 1964 857 231 857 105 163 592 1965 759 206 1,188 87 136 538 1966 673 175 1,616 48 74 436 1967 695 185 1,677 49 77 450 1968 822 225 1,479 73 113 535 1969 845 235 1,526 75 116 550 1970 732 202 1,557 195 195 565 1971 865 249 1,209 134 269 808 1972 1,072 319 1,062 118 236 809 1973 1,235 379 950 106 211 815 1974 1,249 397 876 88 219 947 1975 1,269 432 916 76 191 984 1976 1,423 552 766 77 192 963 1977 1,386 607 817 68 170 1,033 1978 1,383 675 754 63 157 1,019 1979 1,607 870 840 68 178 1,142 1980 1,742 1,039 881 70 189 1,227 1981 1,855 1,213 936 71 199 1,312 1982 1,950 1,392 987 79 207 1,391 1983 3,404 2,643 1,733 144 361 2,250 1984 3,345 2,816 1,720 138 355 2,265 1985 2,932 2,668 1,526 117 313 2,084 1986 2,525 2,479 1,327 99 264 1,862 1987 2,498 2,638 1,288 96 256 1,873 1988 2,760 3,134 1,471 113 287 2,092 1989 3,283 3,756 988 494 494 1,978 1990 3,441 3,938 1,036 1,036 518 2,065 1991 3,626 4,149 1,092 1,310 546 2,274 1992 4,000 3,906 1,068 1,068 534 3,268 1993 4,712 3,972 1,131 984 566 3,470 1994 4,643 3,408 1,012 881 506 3,664 1995 4,799 3,615 1,086 978 543 3,642 1996 4,941 3,828 1,163 1,047 570 3,656 1997 4,954 3,951 1,215 1,093 571 3,941 1998 4,987 4,103 1,277 1,149 600 4,066 1999 5,112 4,347 1,300 1,163 616 4,105 2000 4,928 4,339 1,452 1,313 691 4,353 2001 5,040 4,605 1,486 1,263 743 4,318 2002 4,993 4,743 1,549 1,317 775 4,424 2003 4,861 4,816 1,593 1,433 796 4,591 2004 4,682 4,850 1,868 1,543 812 4,583 2005 4,554 4,954 1,680 1,596 1,008 4,742 2006 4,410 5,053 1,737 1,650 1,042 4,776 2007 4,033 4,890 1,958 1,873 1,107 4,891 2008 3,621 4,667 1,894 1,812 1,071 5,704 2009 3,413 4,705 1,935 1,851 1,094 5,714 2010 3,185 4,728 1,972 1,886 1,114 5,680