Embed Size (px)
Citation preview
Beaufort Sea Marine Fish Surveys
Brenda L. Norcross
and
Lorena E. Edenfield
School of Fisheries and Ocean Sciences
University of Alaska Fairbanks
Photo credit: S. Carroll
28th Lowell Wakefield Fisheries Symposium Anchorage, AK March 2013
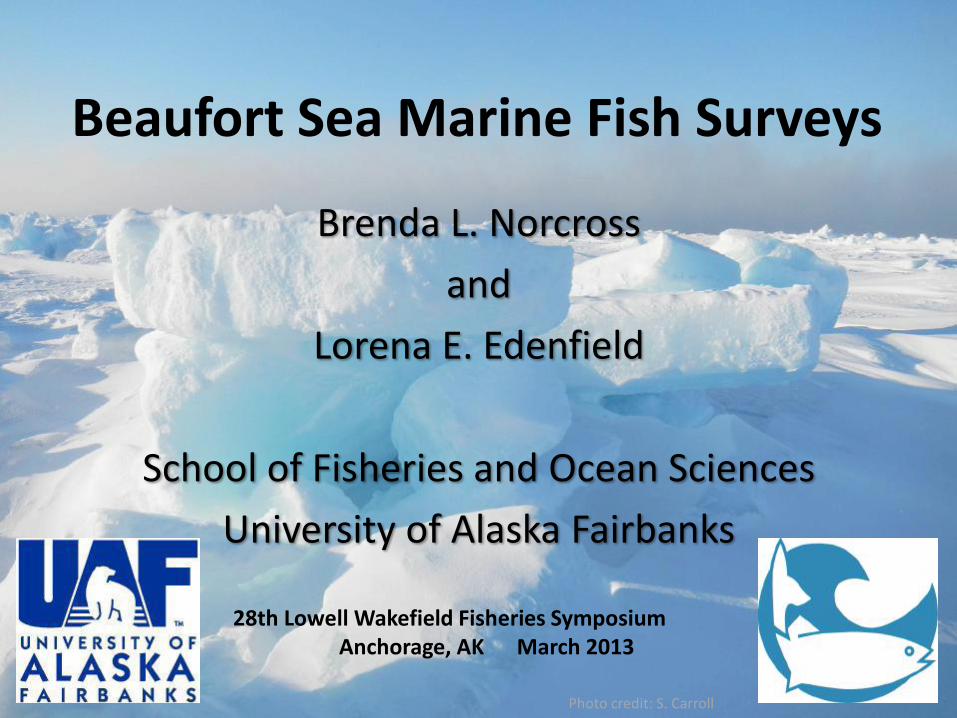
• Establishing benchmark for marine fishes
– Open water sampling
– Multi-year collections
– Under-ice pilot surveys
Objectives
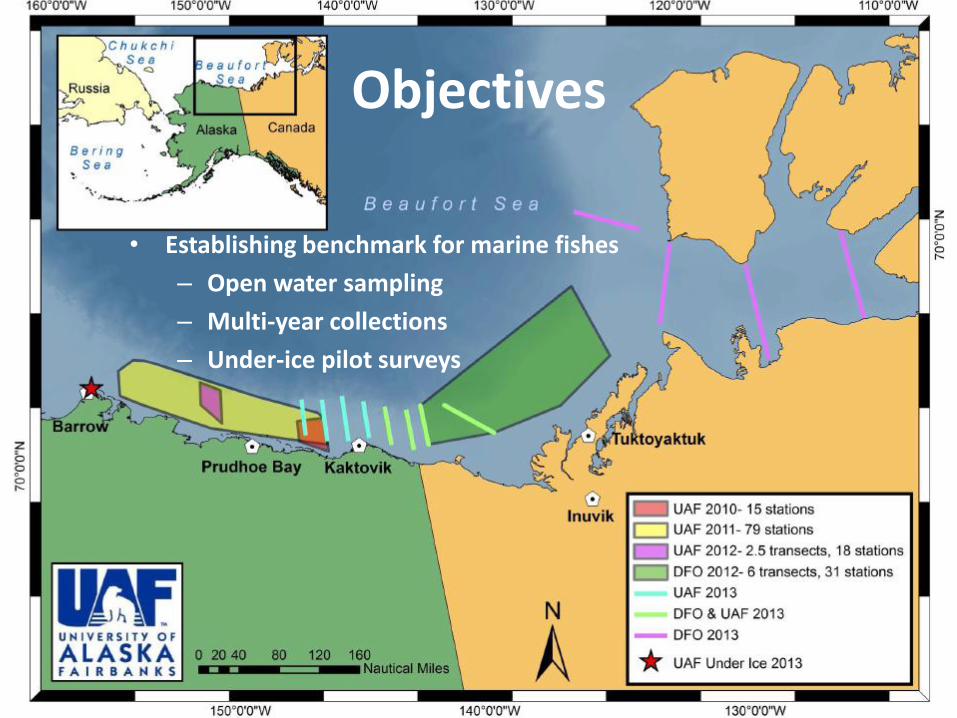
UAF Beaufort Sea surveys completed
• 3 cruises – 2010: WWW1004 (6 days, Westward Wind)
– 2011: BeauFish (21 days, Norseman II)
– 2012: US Transboundary (10 days, Norseman II)
• Sampling gears: – Bottom nets: Fish and Invertebrates
– Midwater nets: Fish and Zooplankton
– Oceanography
– Sediments and Infauna
• 2013: Under Ice (2 sites, Barrow, AK)
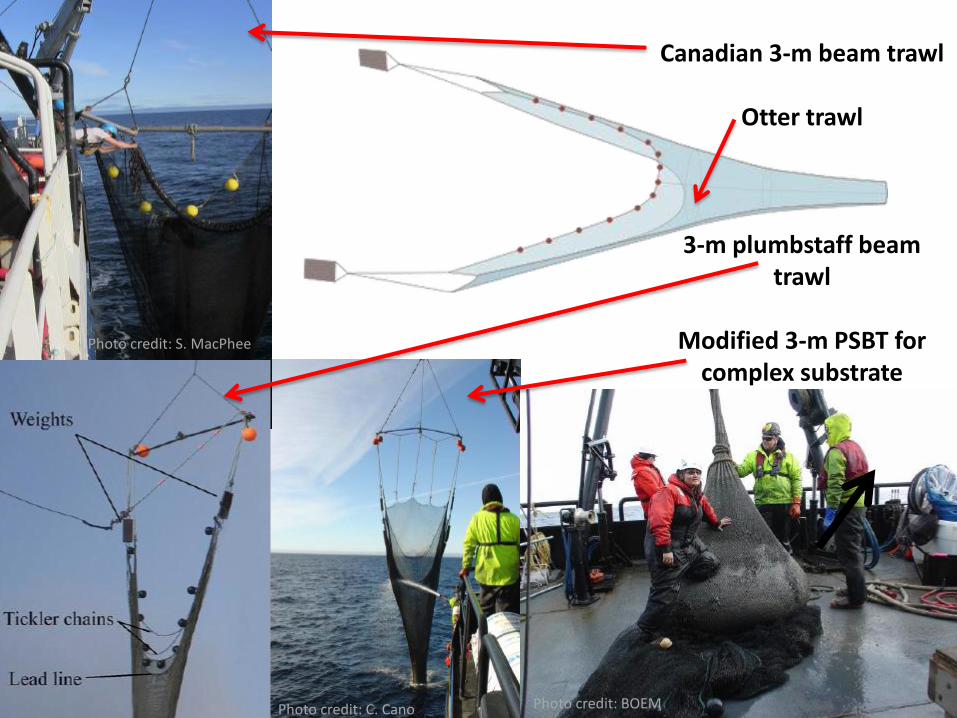
Photo credit: C. Cano
Canadian 3-m beam trawl
Otter trawl
3-m plumbstaff beam trawl
Modified 3-m PSBT for
complex substrate
Photo credit: BOEM
Photo credit: S. MacPhee
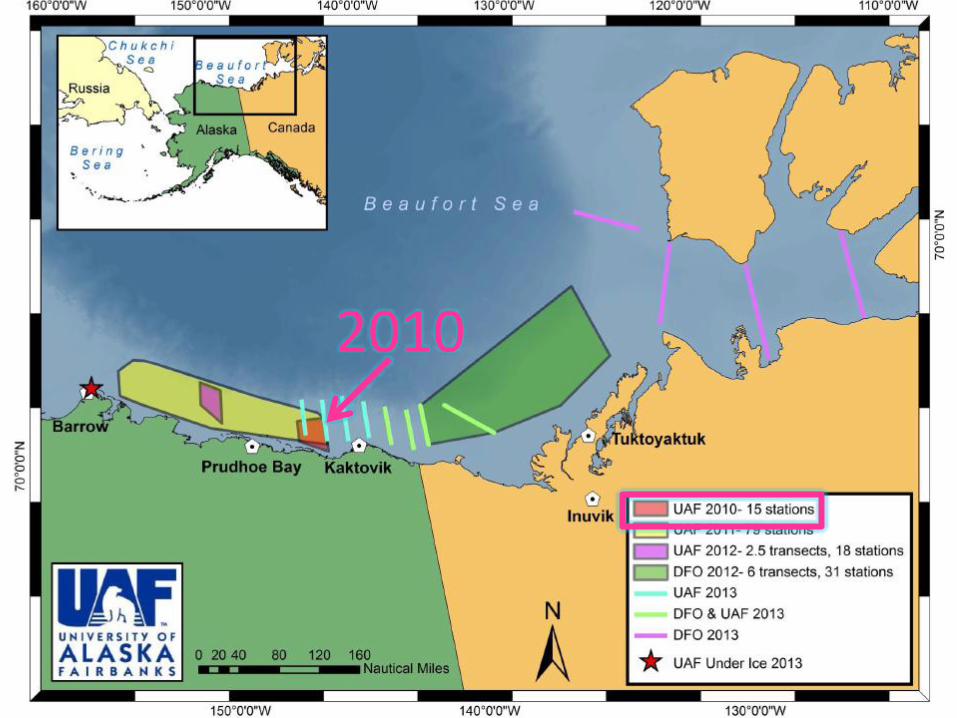
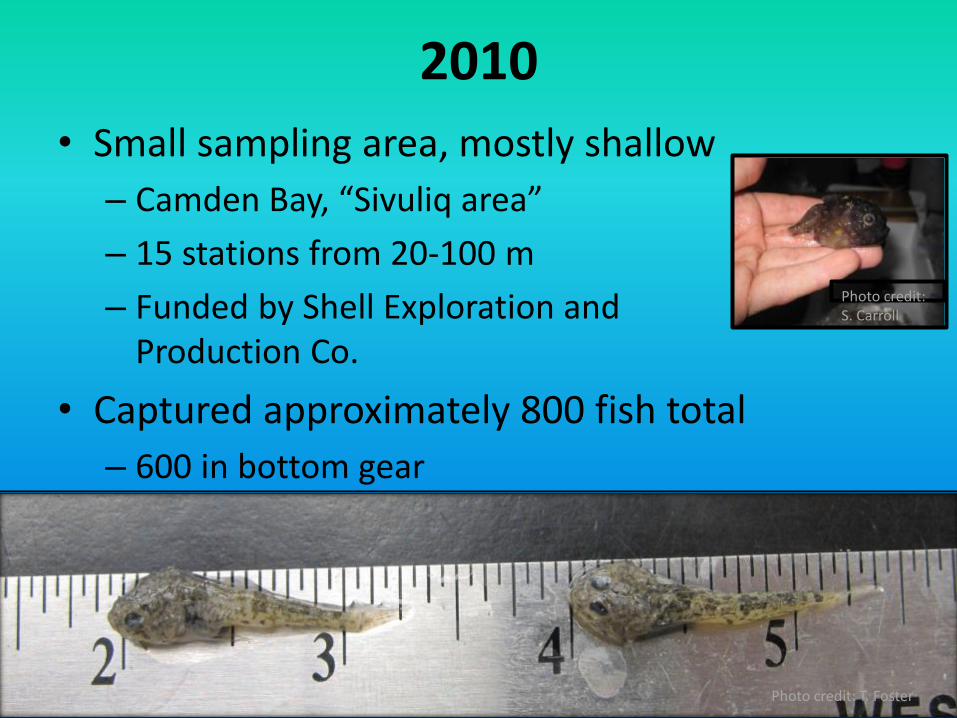
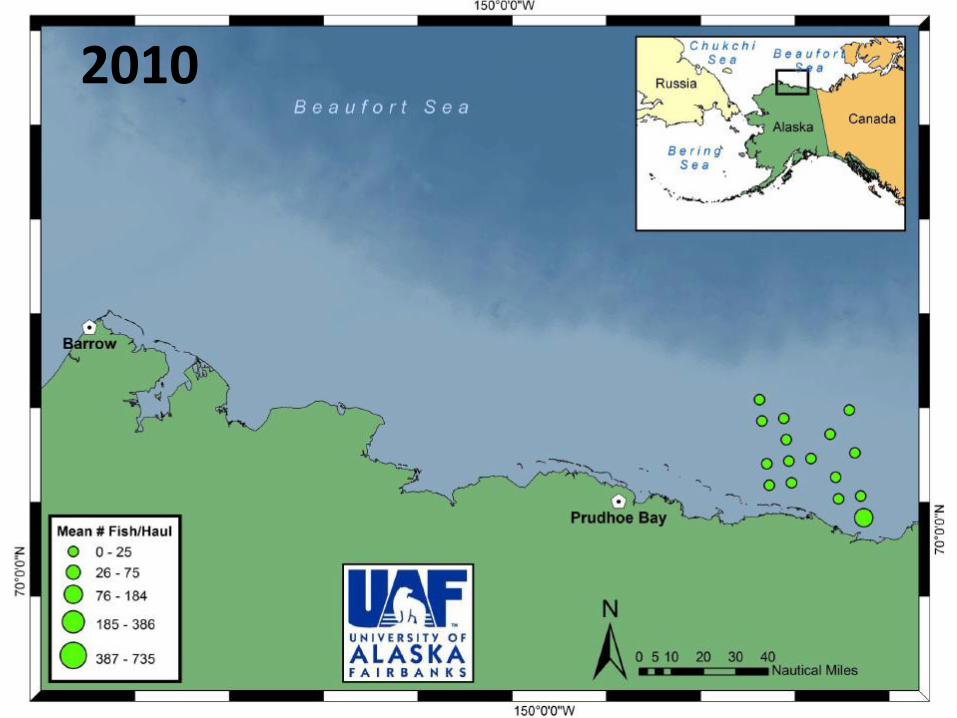
2010
2010
• Small sampling area, mostly shallow
– Camden Bay, “Sivuliq area”
– 15 stations from 20-100 m
– Funded by Shell Exploration and Production Co.
• Captured approximately 800 fish total
– 600 in bottom gear
Photo credit: T. Foster
Photo credit: S. Carroll
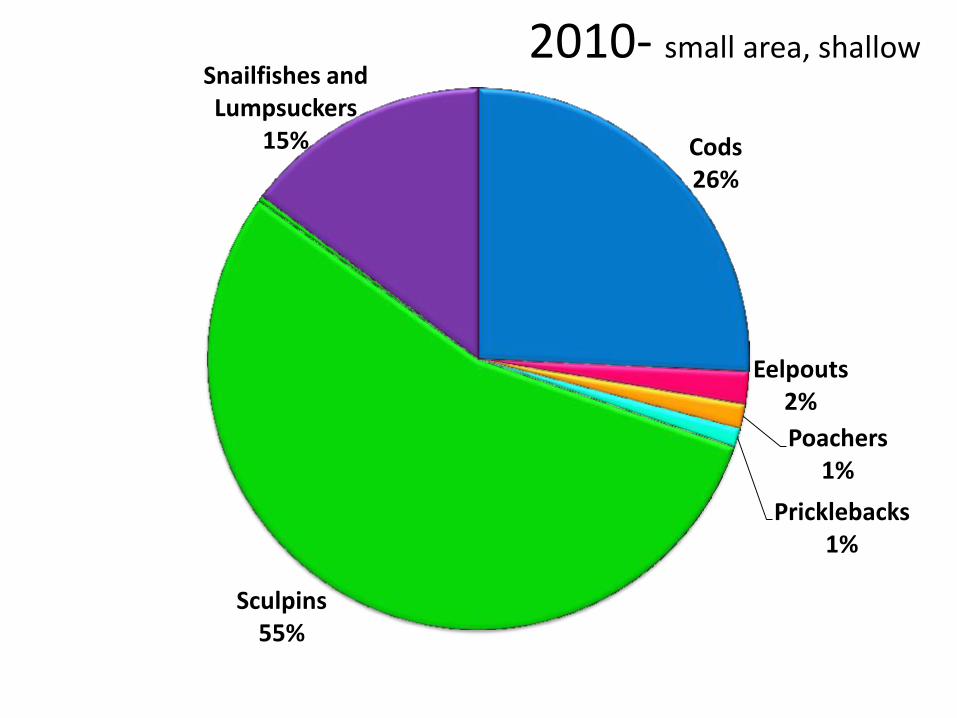
2010- small area, shallow
Cods 26%
Eelpouts 2%
Poachers 1%
Pricklebacks 1%
Sculpins 55%
Snailfishes and Lumpsuckers
15%
2010
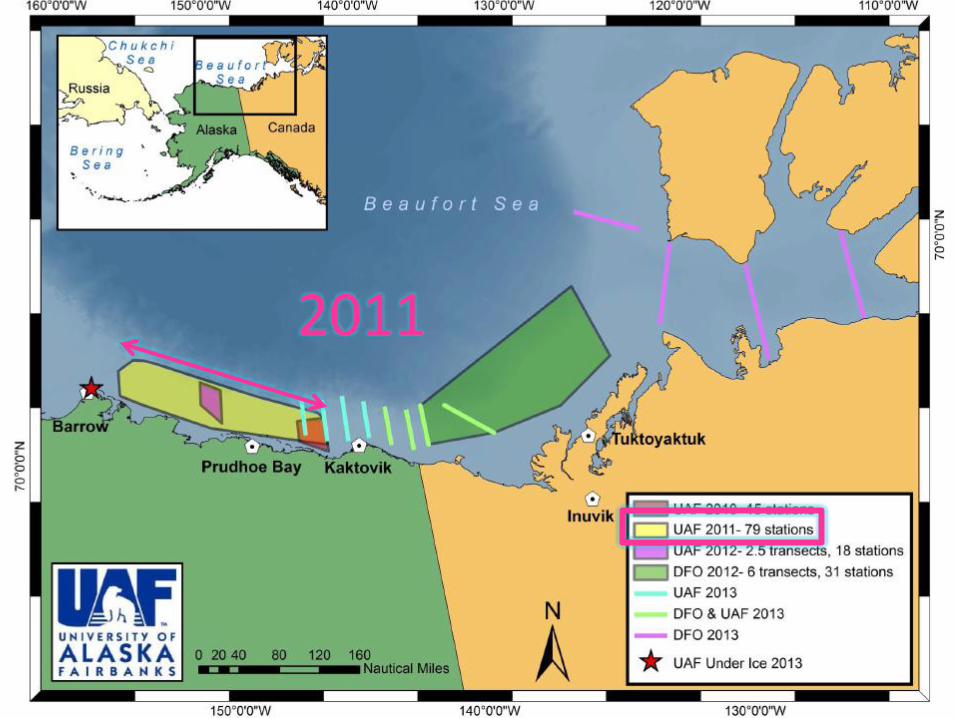
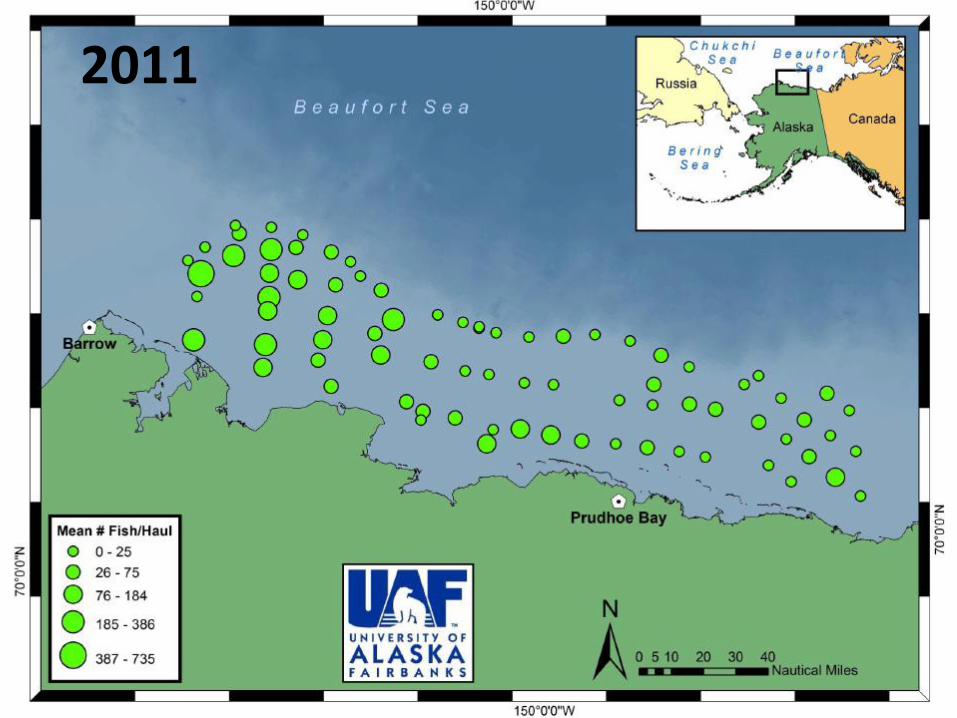
2011
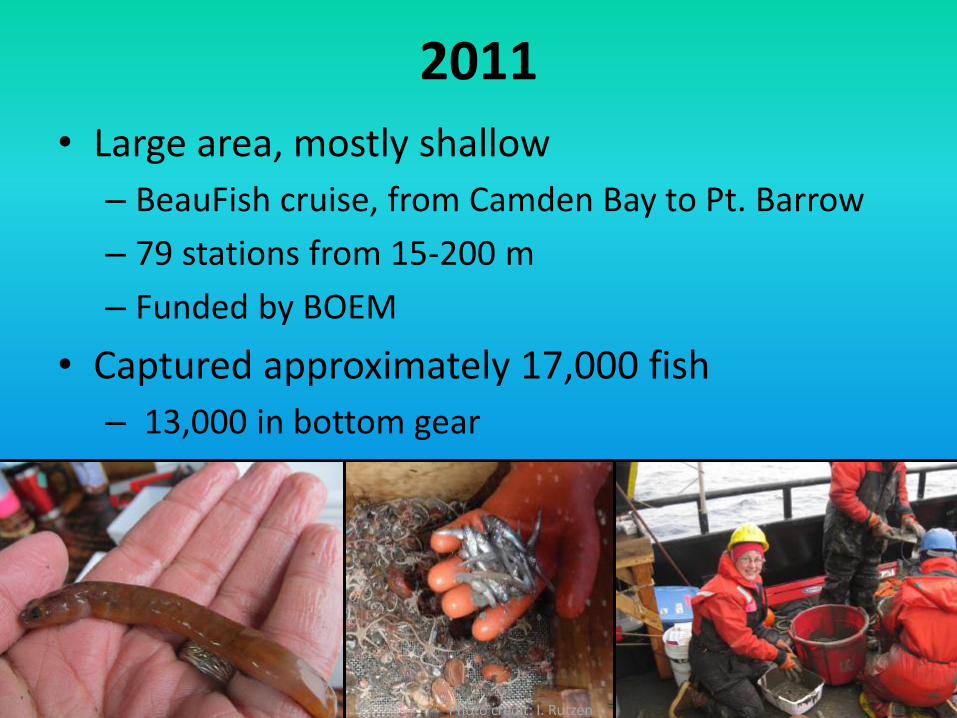
• Large area, mostly shallow
– BeauFish cruise, from Camden Bay to Pt. Barrow
– 79 stations from 15-200 m
– Funded by BOEM
• Captured approximately 17,000 fish
– 13,000 in bottom gear
Photo credit: I. Rutzen
2011
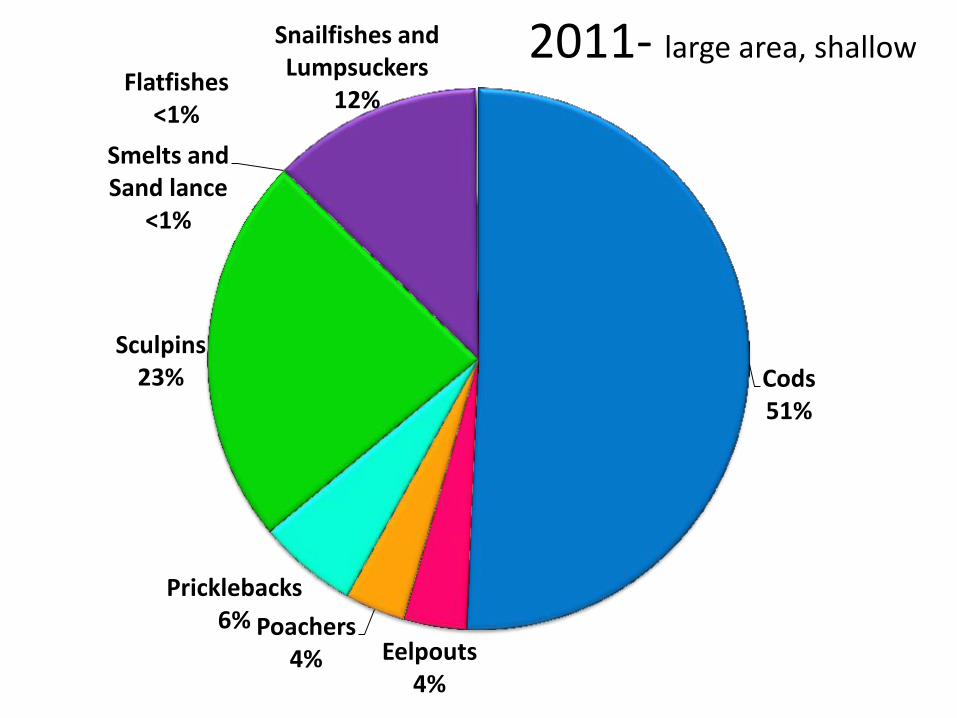
2011- large area, shallow
Cods 51%
Eelpouts 4%
Poachers 4%
Pricklebacks 6%
Sculpins 23%
Smelts and Sand lance
<1%
Snailfishes and Lumpsuckers
12% Flatfishes
<1%
2011
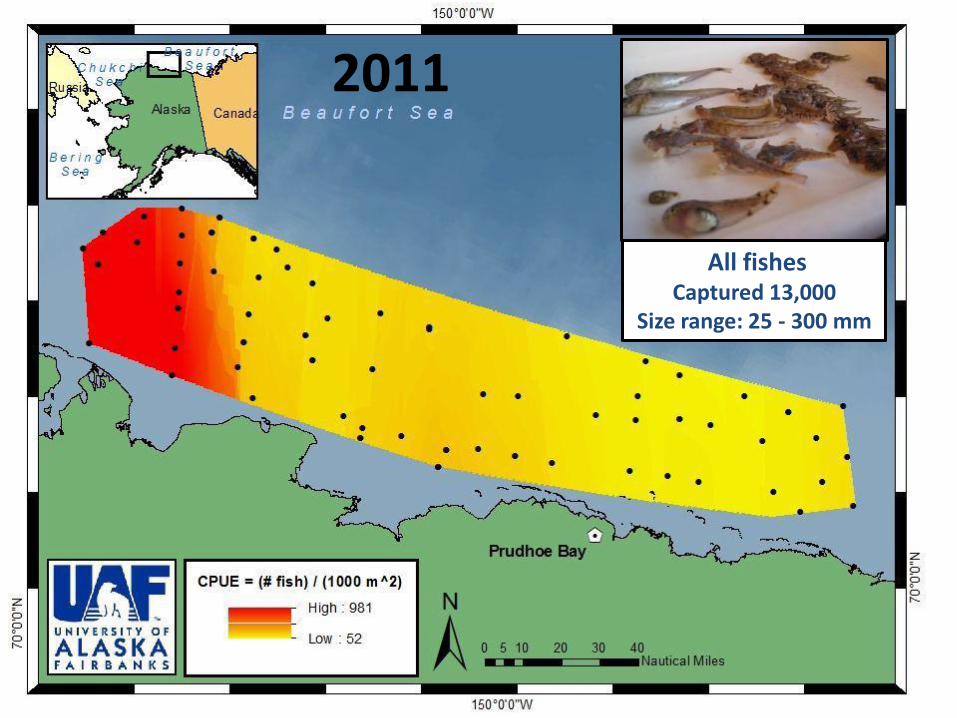
All fishes Captured 13,000
Size range: 25 - 300 mm
2011
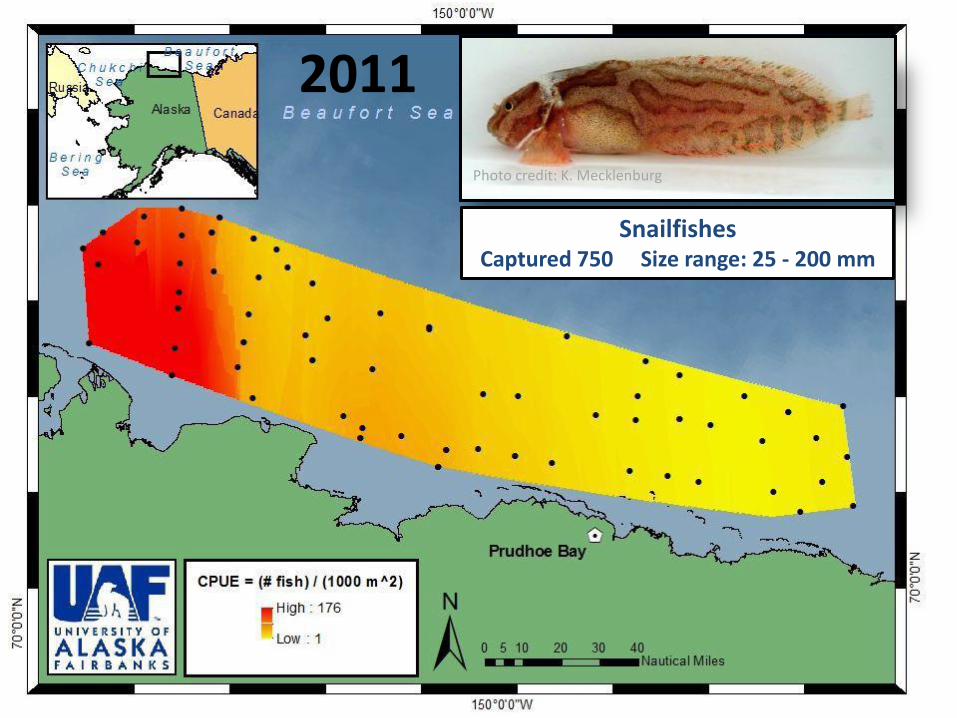
Photo credit: K. Mecklenburg
Snailfishes Captured 750 Size range: 25 - 200 mm
2011
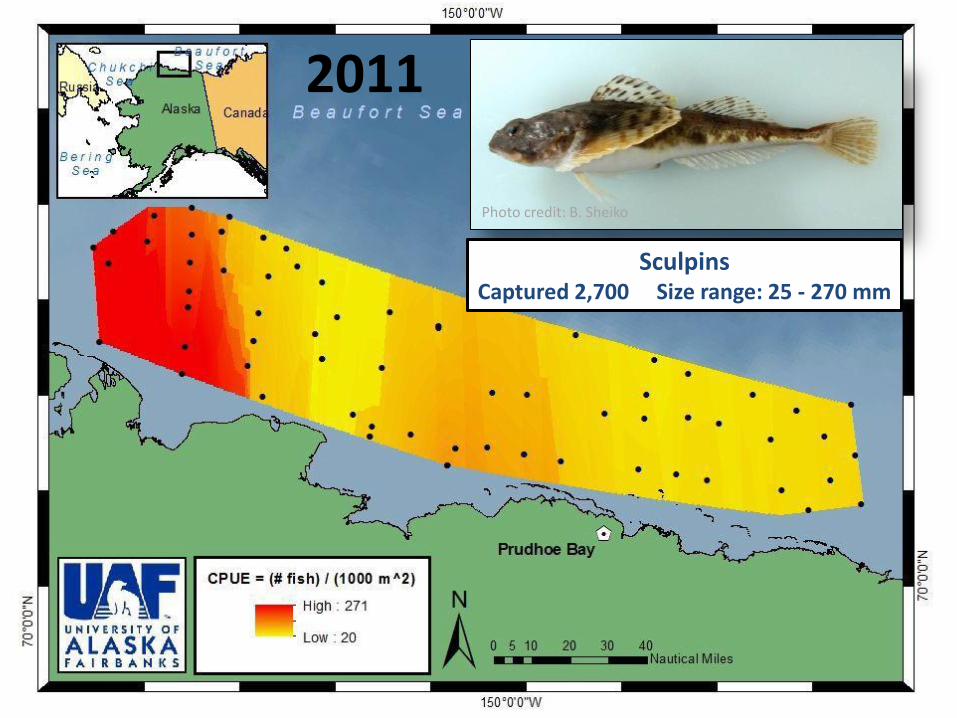
Photo credit: B. Sheiko
Sculpins Captured 2,700 Size range: 25 - 270 mm
2011
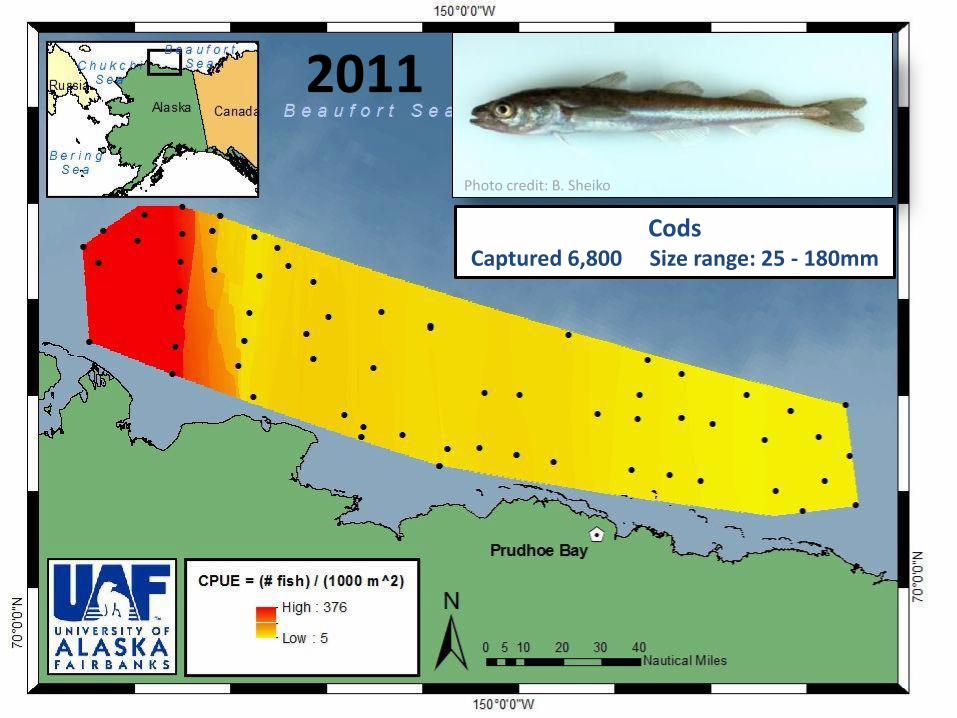
Photo credit: B. Sheiko
Cods Captured 6,800 Size range: 25 - 180mm
2011
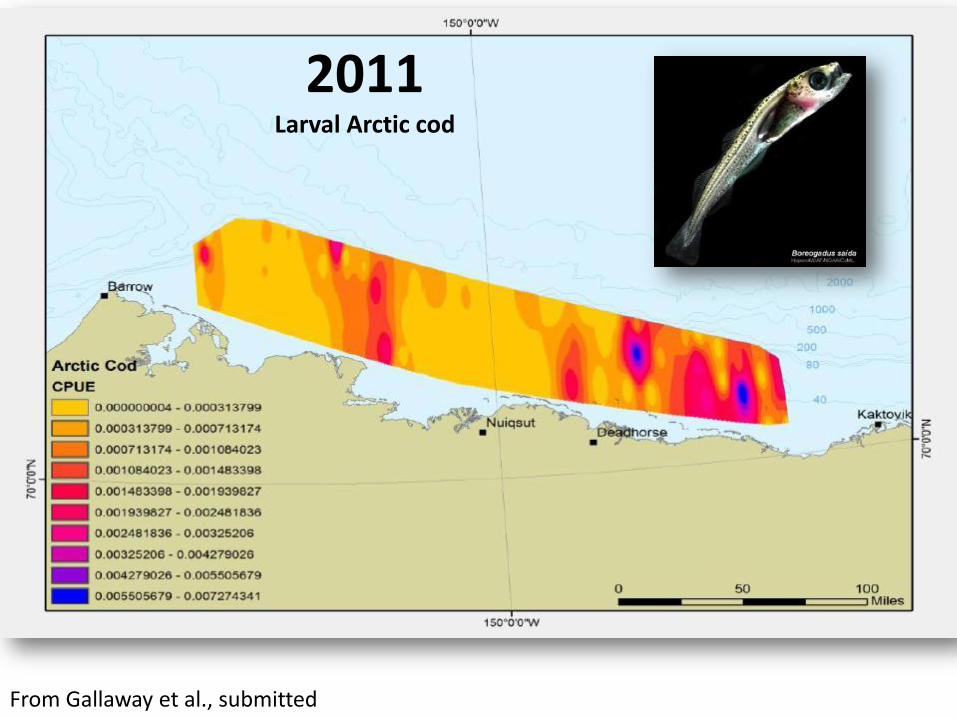
From Gallaway et al., submitted
2011 Larval Arctic cod
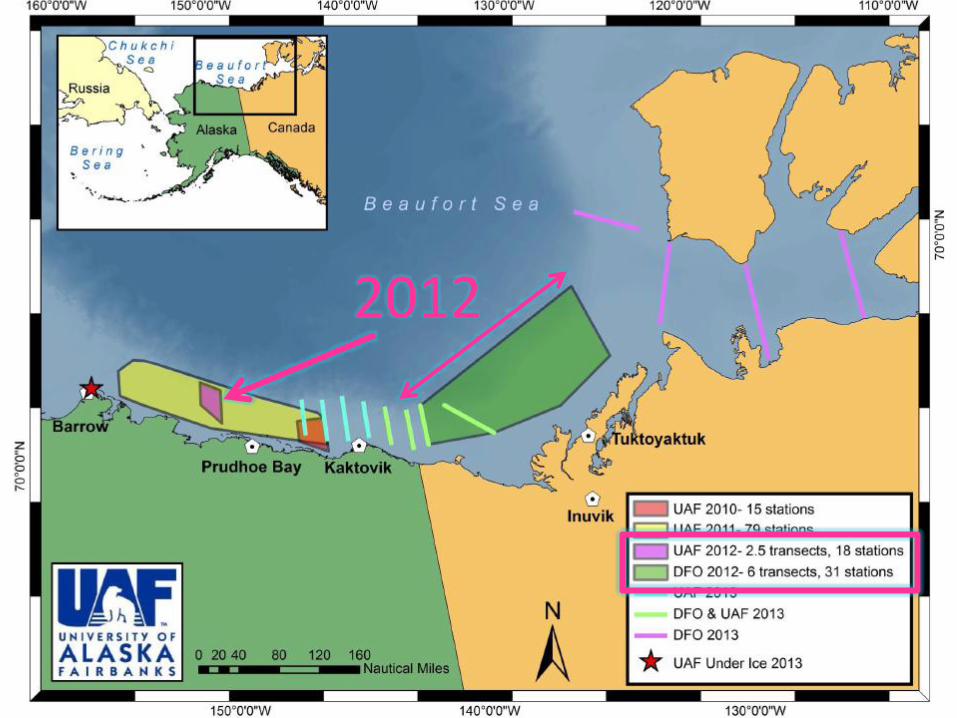
2012
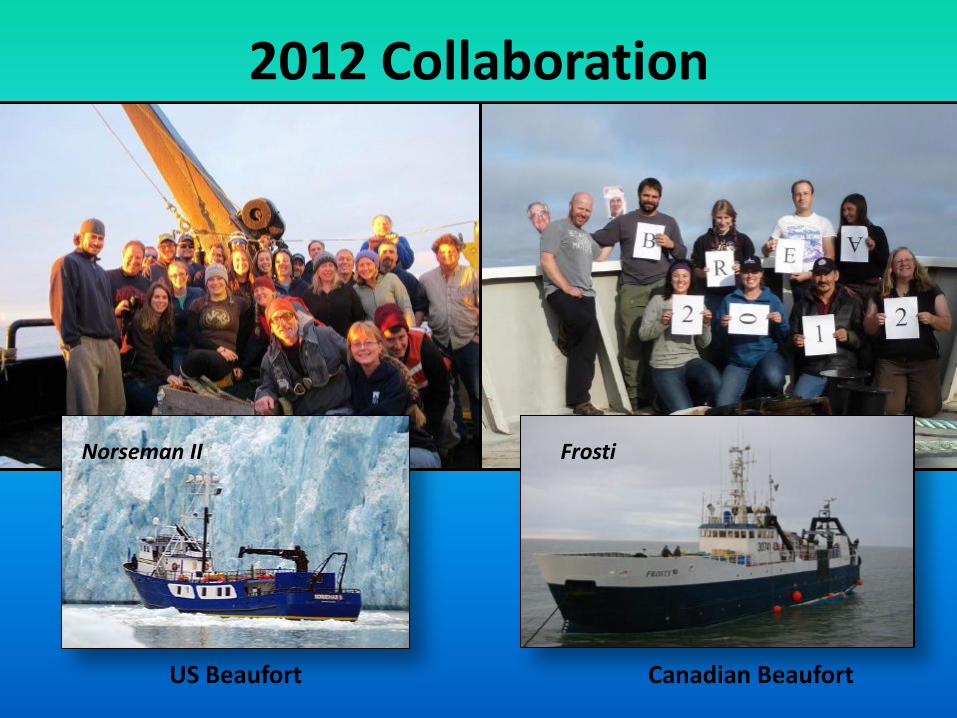
2012 Collaboration
US Beaufort Canadian Beaufort
Norseman II Frosti
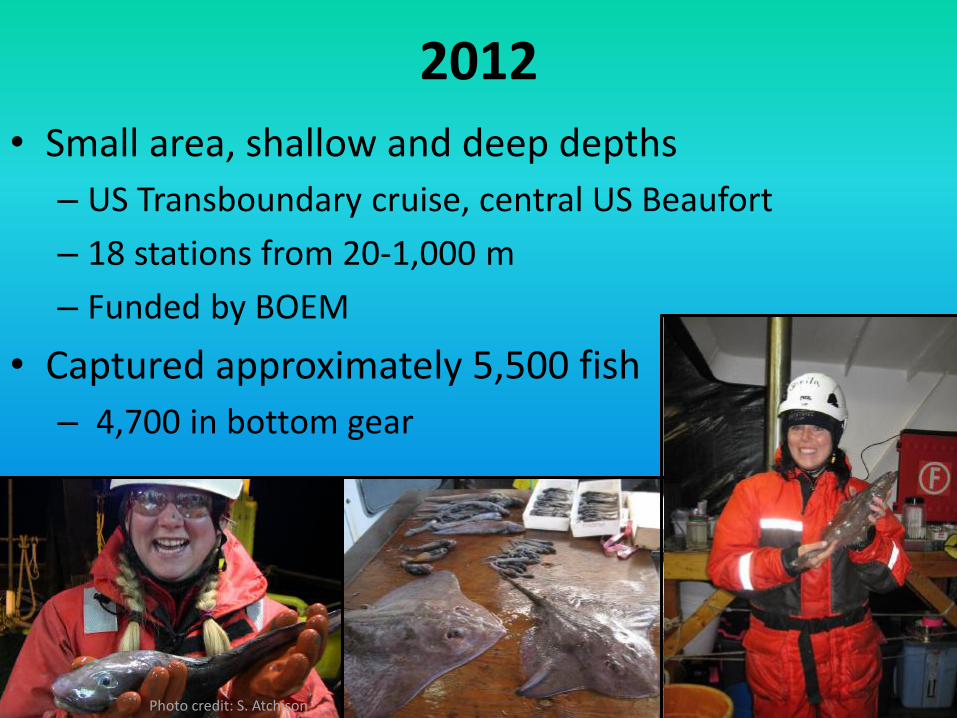
Photo credit: S. Atchison
2012
• Small area, shallow and deep depths
– US Transboundary cruise, central US Beaufort
– 18 stations from 20-1,000 m
– Funded by BOEM
• Captured approximately 5,500 fish
– 4,700 in bottom gear
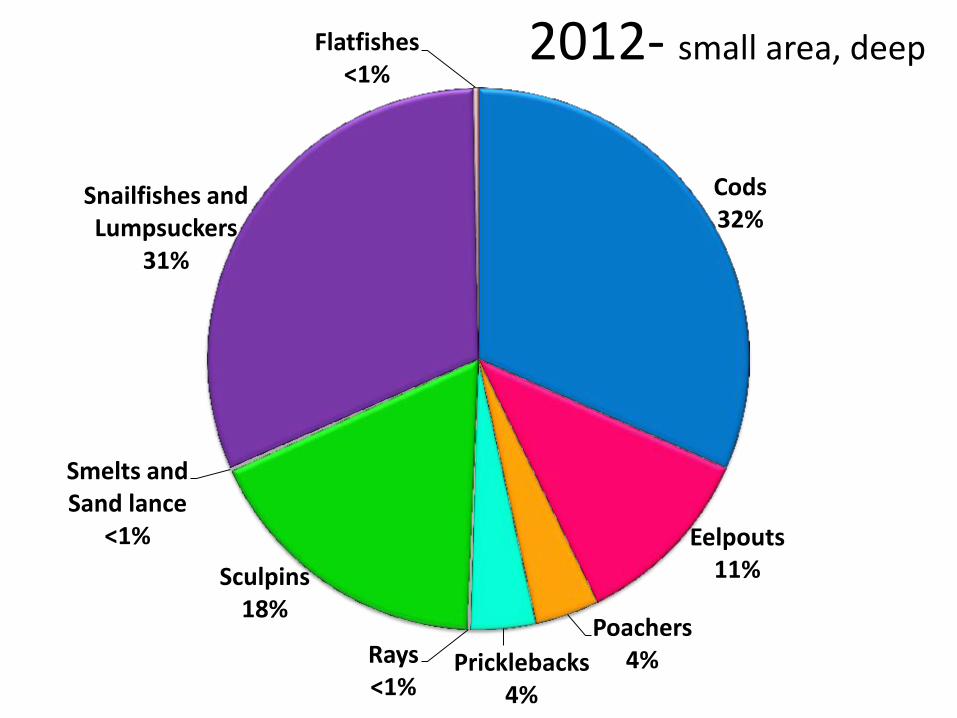
2012- small area, deep
Cods 32%
Eelpouts 11%
Poachers 4% Pricklebacks
4%
Rays <1%
Sculpins 18%
Smelts and Sand lance
<1%
Snailfishes and Lumpsuckers
31%
Flatfishes <1%

2012
0%
20%
40%
60%
80%
100%
20 50 100 200 350 500 1000
Pe
rce
nt
com
po
siti
on
of
catc
h
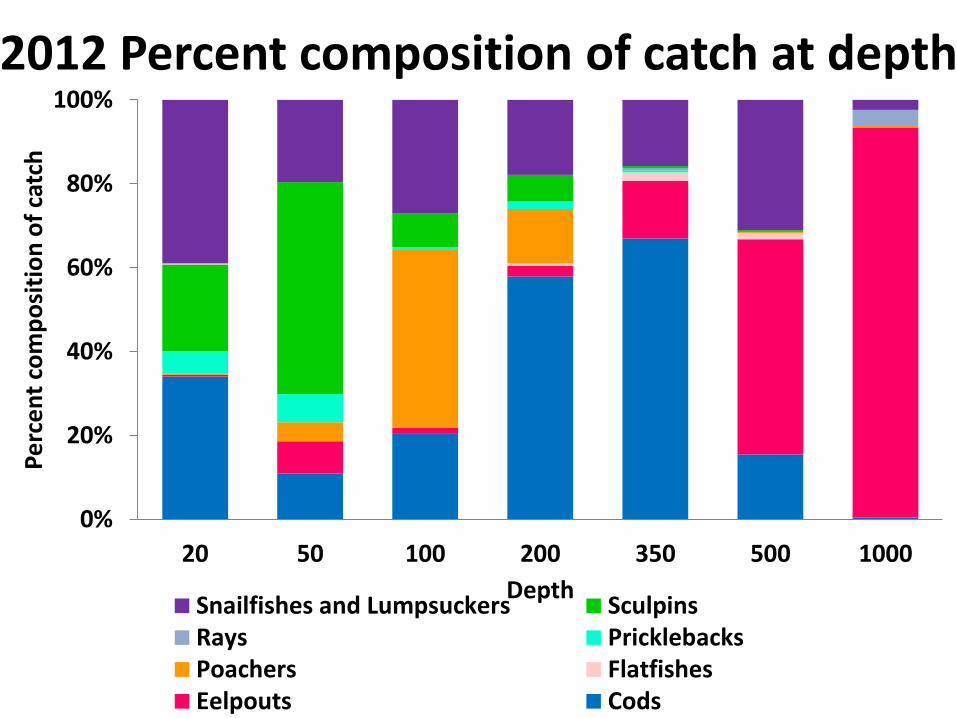
Depth Snailfishes and Lumpsuckers SculpinsRays PricklebacksPoachers FlatfishesEelpouts Cods
2012 Percent composition of catch at depth
0
50
100
150
200
250
300
350
400
450
500
20 50 100 200 350 500 1000
Ave
rage
Le
ngt
h (
mm
)
Depth
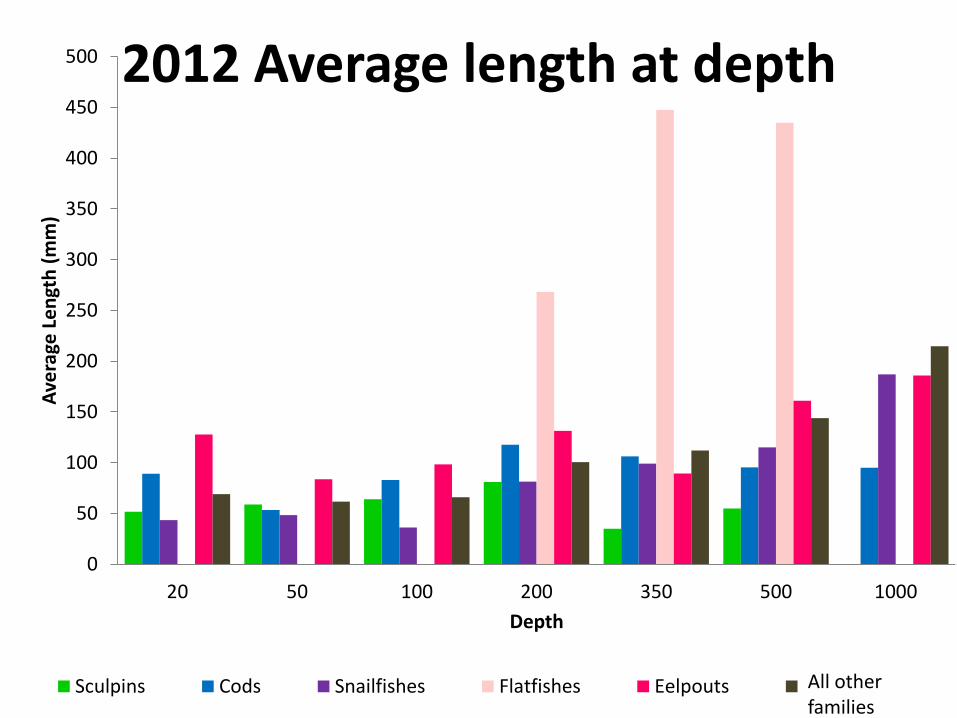
Sculpins Cods Snailfishes Flatfishes Eelpouts All Families
2012 Average length at depth
All other families
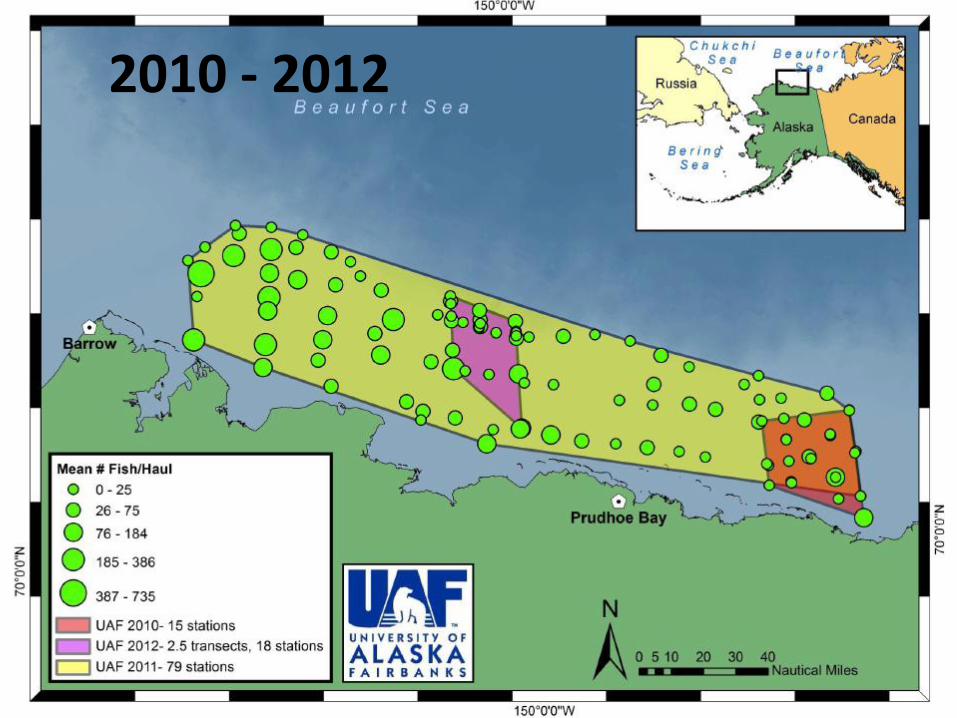
2010 - 2012
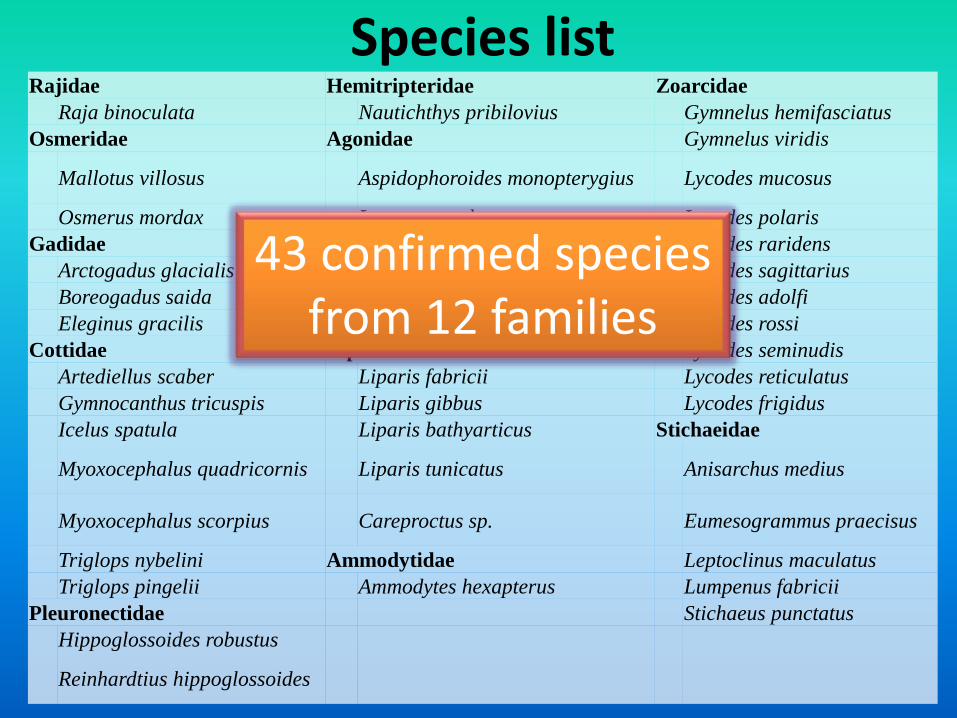
Species list Rajidae Hemitripteridae Zoarcidae
Raja binoculata Nautichthys pribilovius Gymnelus hemifasciatus
Osmeridae Agonidae Gymnelus viridis
Mallotus villosus Aspidophoroides monopterygius Lycodes mucosus
Osmerus mordax Leptagonus decagonus Lycodes polaris
Gadidae Podothecus veternus Lycodes raridens
Arctogadus glacialis Aspidophoroides olrikii Lycodes sagittarius
Boreogadus saida Cyclopteridae Lycodes adolfi
Eleginus gracilis Eumicrotremus derjugini Lycodes rossi
Cottidae Liparidae Lycodes seminudis
Artediellus scaber Liparis fabricii Lycodes reticulatus
Gymnocanthus tricuspis Liparis gibbus Lycodes frigidus
Icelus spatula Liparis bathyarticus Stichaeidae
Myoxocephalus quadricornis Liparis tunicatus Anisarchus medius
Myoxocephalus scorpius Careproctus sp. Eumesogrammus praecisus
Triglops nybelini Ammodytidae Leptoclinus maculatus
Triglops pingelii Ammodytes hexapterus Lumpenus fabricii
Pleuronectidae Stichaeus punctatus
Hippoglossoides robustus
Reinhardtius hippoglossoides
43 confirmed species from 12 families
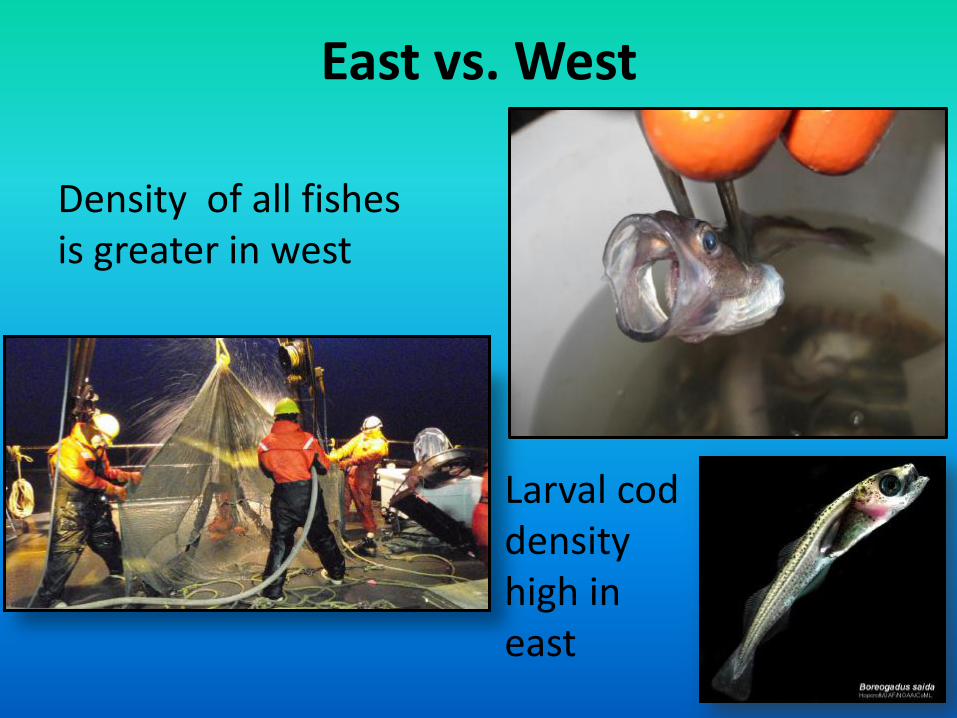
East vs. West
Density of all fishes is greater in west
Larval cod density high in east
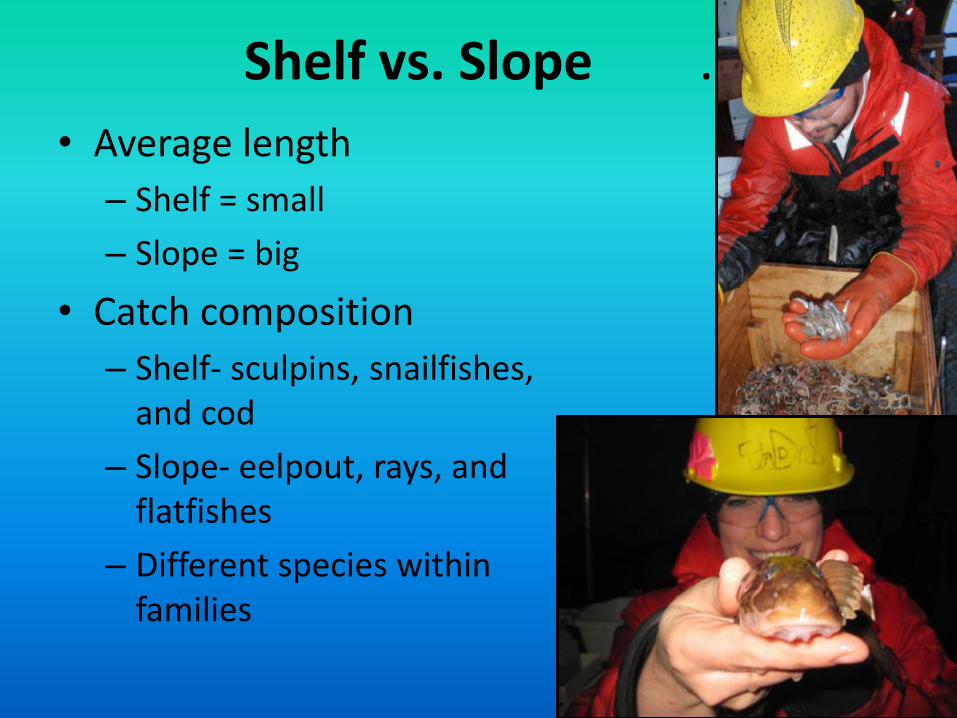
Shelf vs. Slope .
• Average length
– Shelf = small
– Slope = big
• Catch composition
– Shelf- sculpins, snailfishes, and cod
– Slope- eelpout, rays, and flatfishes
– Different species within families
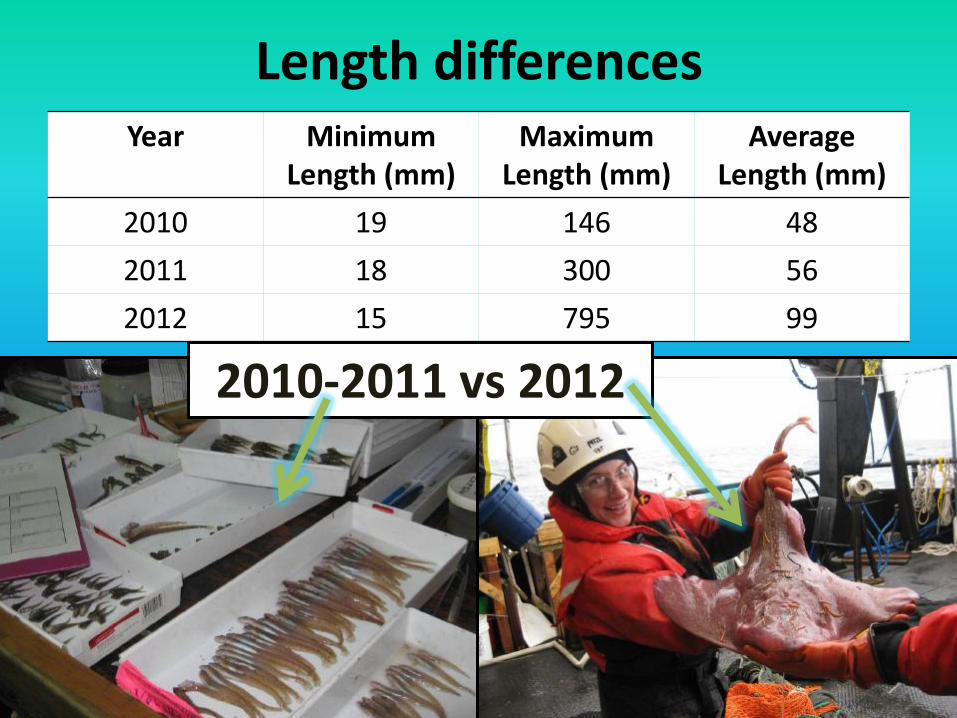
Length differences Year Minimum
Length (mm) Maximum
Length (mm) Average
Length (mm)
2010 19 146 48
2011 18 300 56
2012 15 795 99
2010-2011 vs 2012
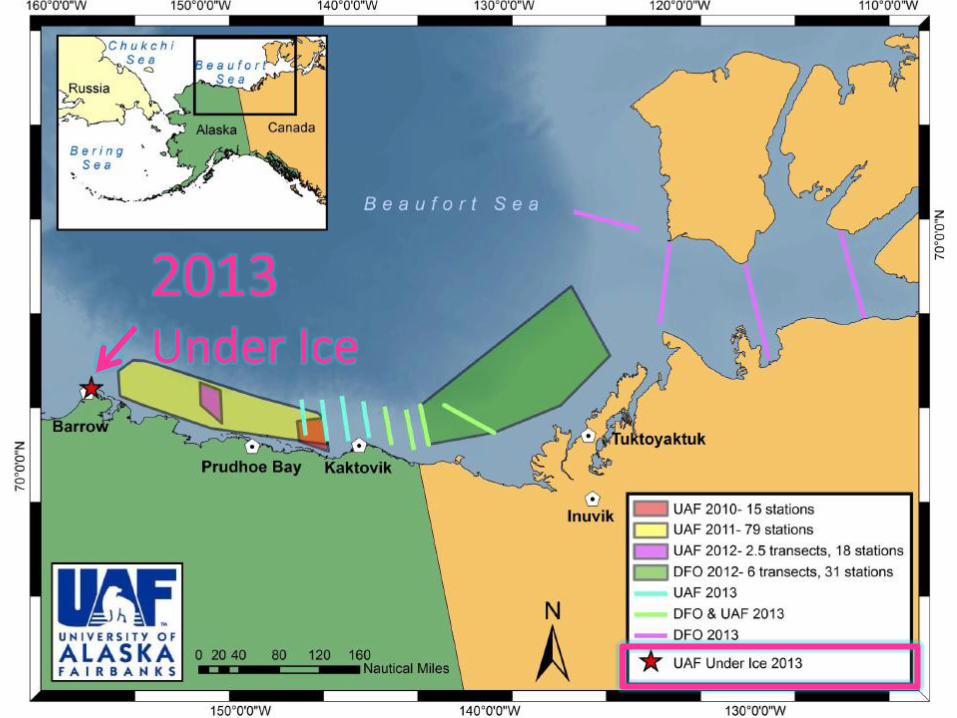
• Map here? Underice map?
2013 Under Ice
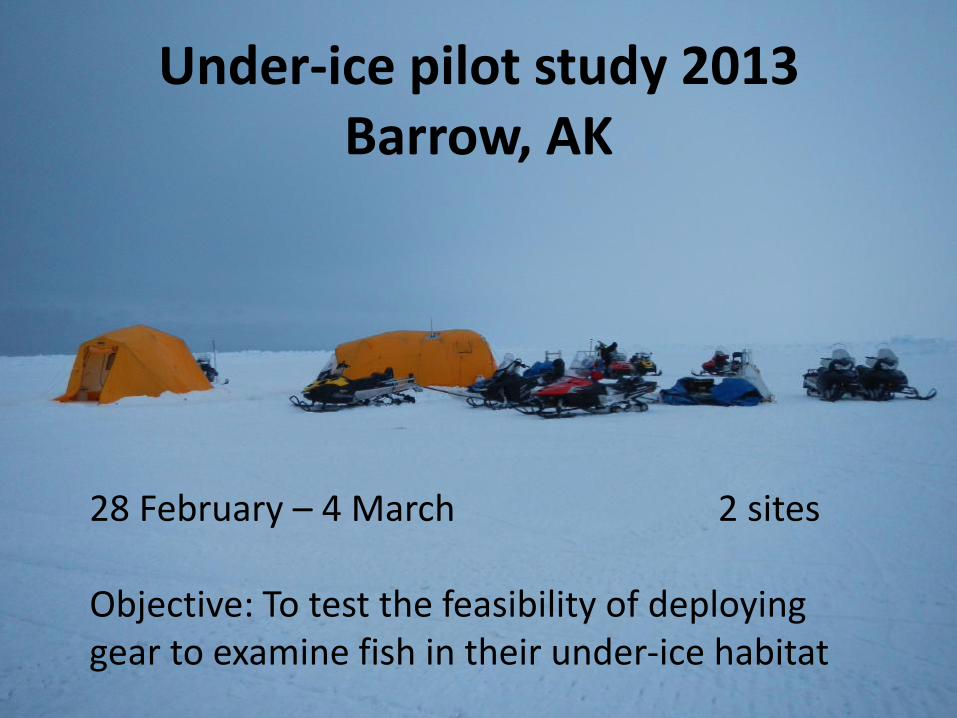
Under-ice pilot study 2013 Barrow, AK
28 February – 4 March 2 sites Objective: To test the feasibility of deploying gear to examine fish in their under-ice habitat
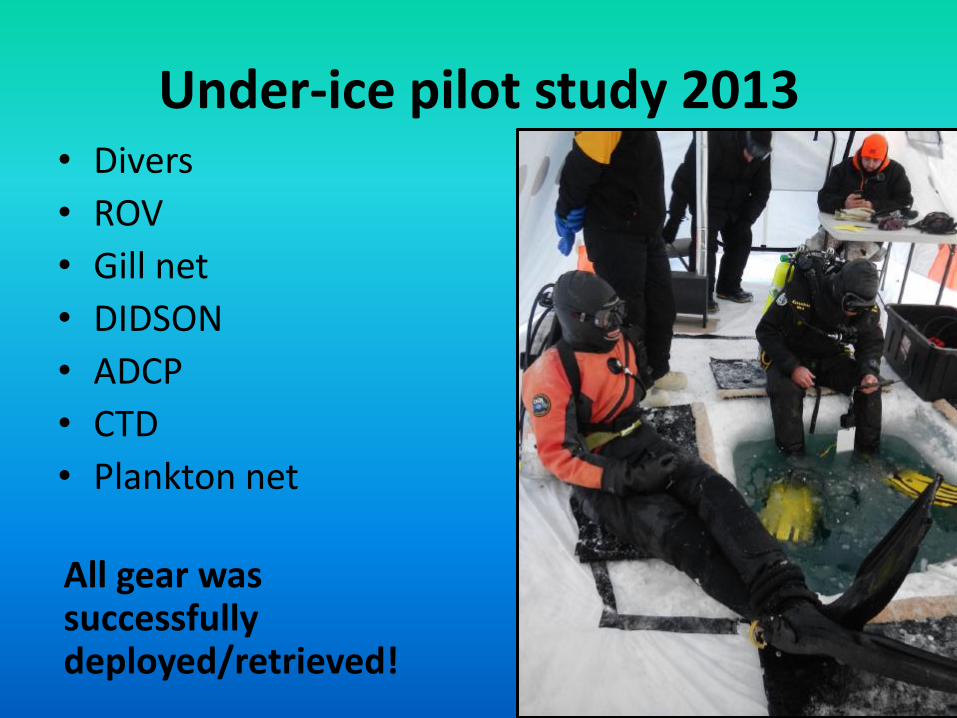
Under-ice pilot study 2013 • Divers
• ROV
• Gill net
• DIDSON
• ADCP
• CTD
• Plankton net
All gear was successfully deployed/retrieved!
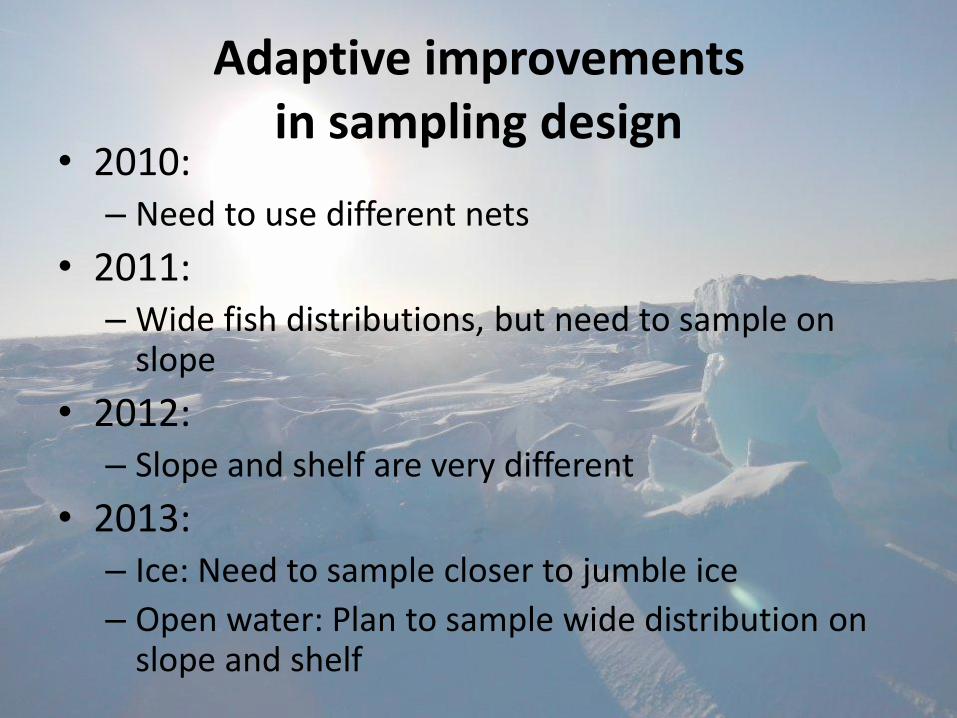
Adaptive improvements in sampling design
• 2010: – Need to use different nets
• 2011: – Wide fish distributions, but need to sample on
slope
• 2012: – Slope and shelf are very different
• 2013: – Ice: Need to sample closer to jumble ice
– Open water: Plan to sample wide distribution on slope and shelf

O
• Map here? Underice map?
2013
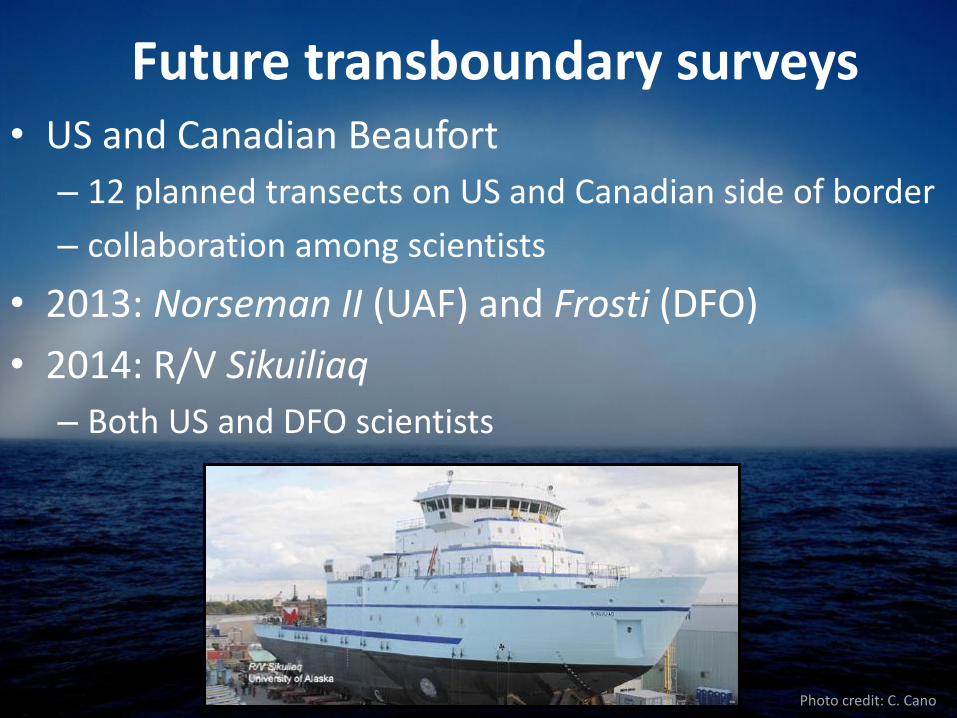
Photo credit: C. Cano
• US and Canadian Beaufort
– 12 planned transects on US and Canadian side of border
– collaboration among scientists
• 2013: Norseman II (UAF) and Frosti (DFO)
• 2014: R/V Sikuiliaq
– Both US and DFO scientists
Future transboundary surveys
Climate-related factors
• Window of opportunity for sampling
• Sampling site availability
• Expect changes in distribution and abundance of fishes
• Food web effects on fish life history
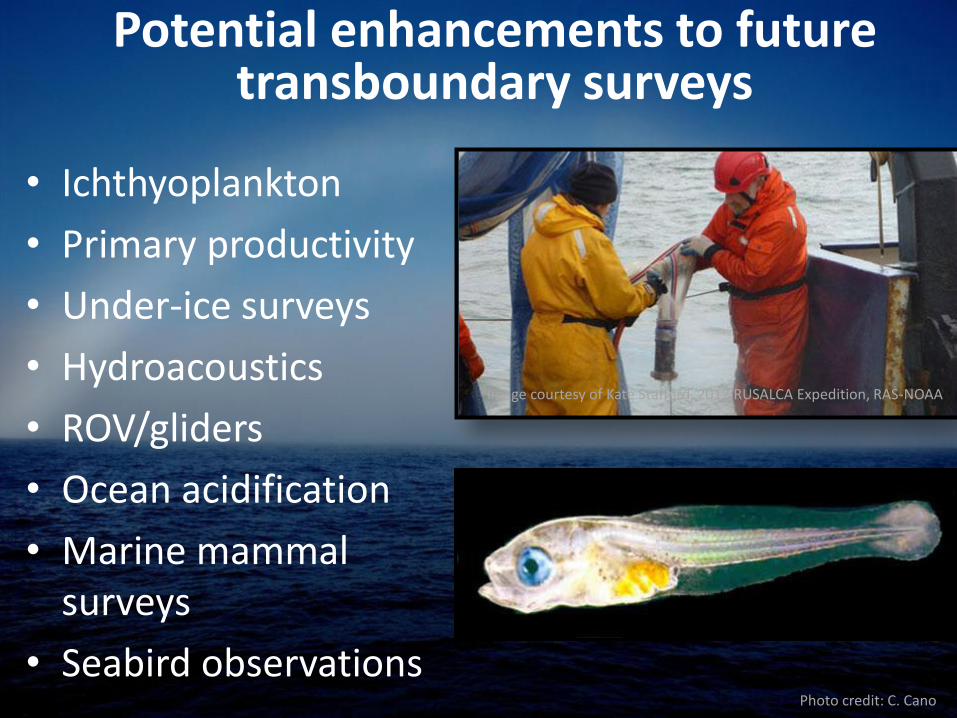
Photo credit: C. Cano
• Ichthyoplankton
• Primary productivity
• Under-ice surveys
• Hydroacoustics
• ROV/gliders
• Ocean acidification
• Marine mammal surveys
• Seabird observations
Potential enhancements to future transboundary surveys
Image courtesy of Kate Stafford, 2012 RUSALCA Expedition, RAS-NOAA
Thanks! • The crews of the Westward Wind (2010) Norseman II
(2011 and 2012)
• The Under-Ice Pilot Study team and the staff of Umiaq, LLC.
• UAF Fisheries Oceanography Lab students and technicians
• BOEM and Shell Exploration and Production Co. for funding
• Canada Department of Fisheries and Oceans