Embed Size (px)
Citation preview

MWEA Annual Conference June 2016
BECOMING A WRRF A STEPWISE PROCESS
Mike Harvey, PE
Why now? – Drivers
Opportunities for Wastewater Utilities
Where to Start – A Stepwise Approach
Midwest Examples
Take Aways
Agenda

Why now? – Drivers
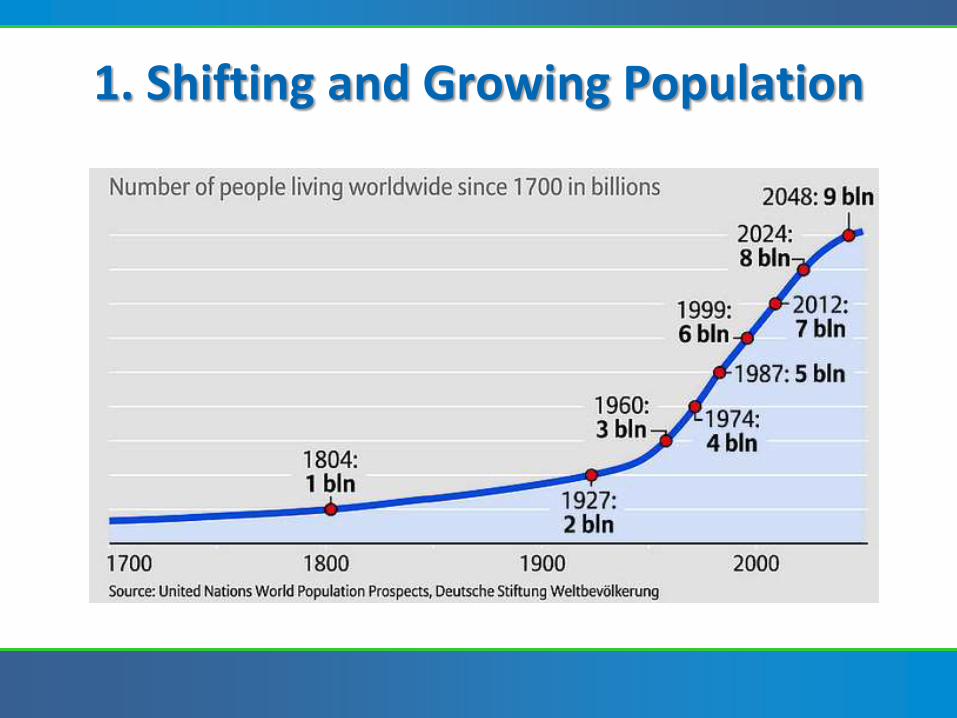
1. Shifting and Growing Population
Issue 1: Nutrient sources
Issue 2: Global nutrient balance(or imbalance!)
– High input, limited recycling
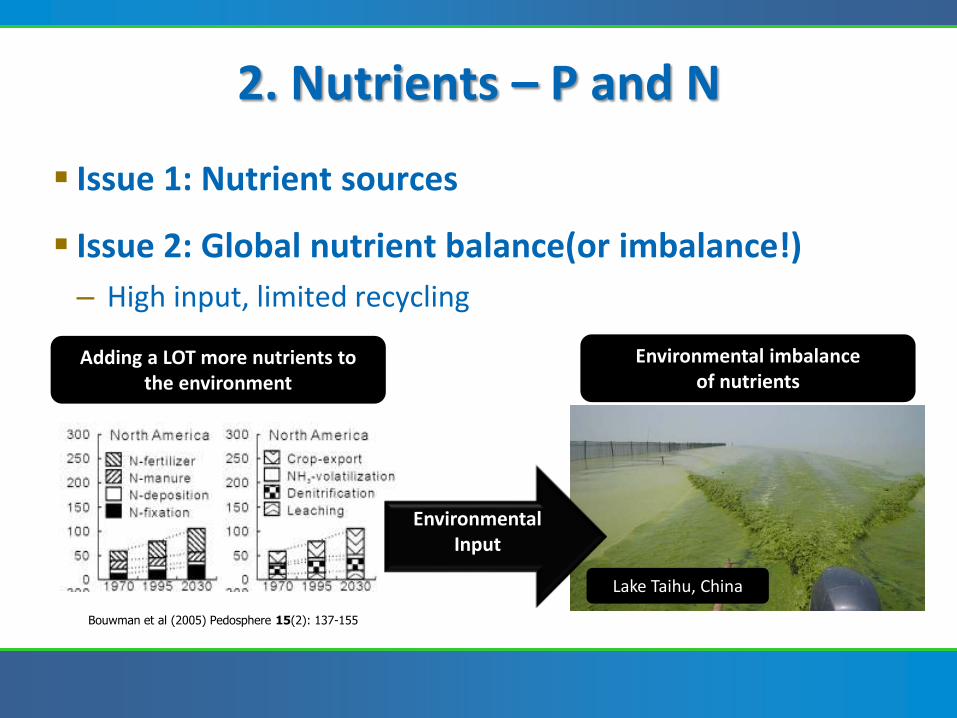
2. Nutrients – P and N
Bouwman et al (2005) Pedosphere 15(2): 137-155
Adding a LOT more nutrients to the environment
Environmental imbalance of nutrients
Environmental Input
Lake Taihu, China
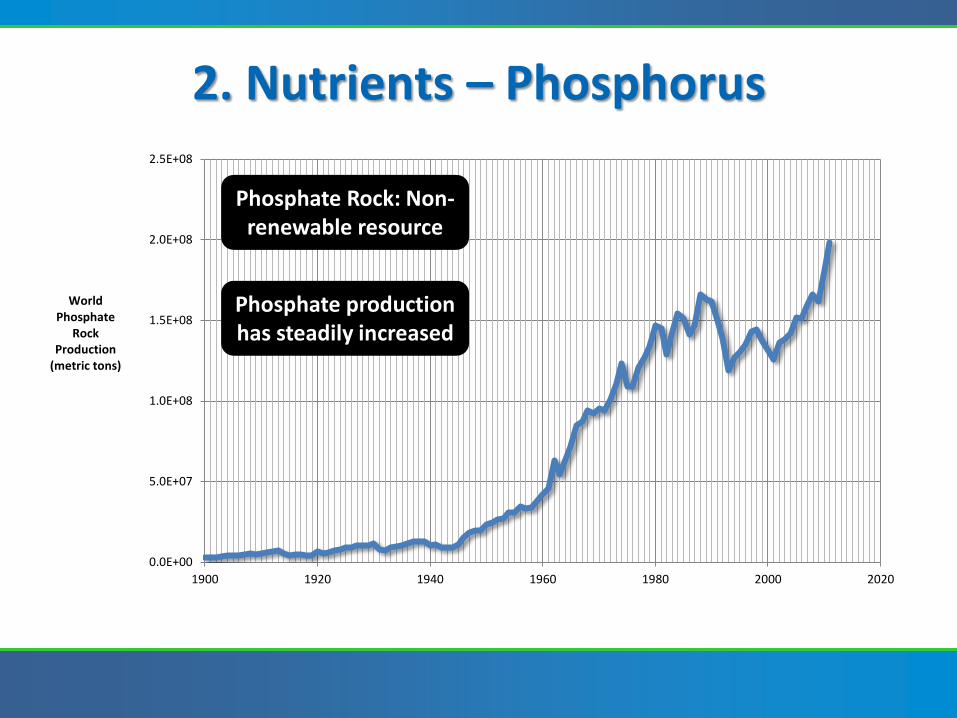
2. Nutrients – Phosphorus
0.0E+00
5.0E+07
1.0E+08
1.5E+08
2.0E+08
2.5E+08
1900 1920 1940 1960 1980 2000 2020
World Phosphate
Rock Production
(metric tons)
Phosphate Rock: Non-renewable resource
Phosphate production has steadily increased
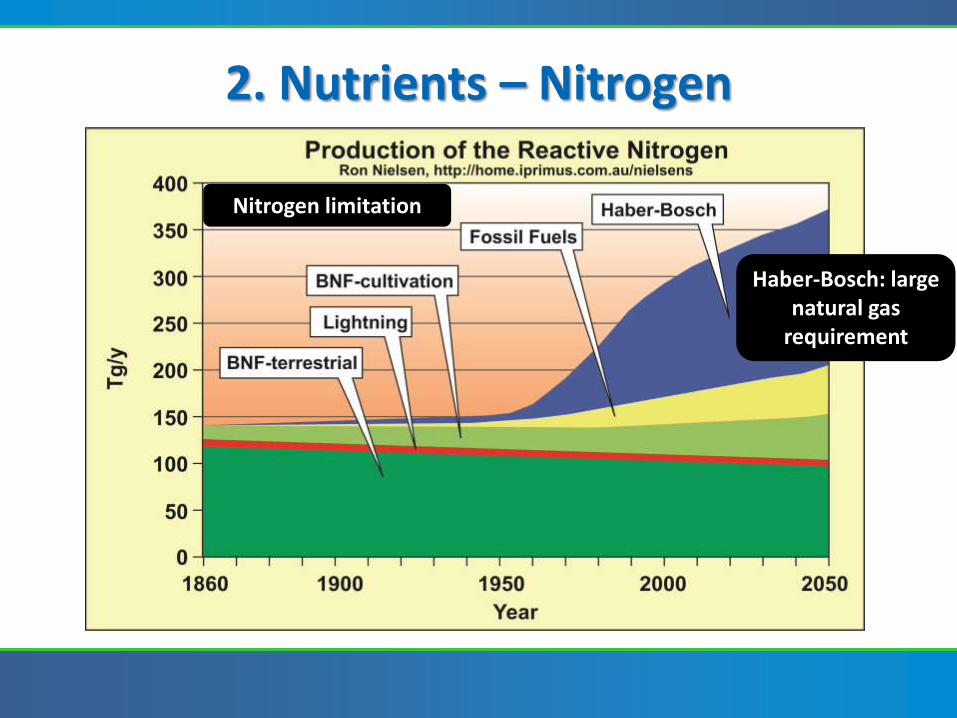
2. Nutrients – Nitrogen
Nitrogen limitation
Haber-Bosch: large natural gas
requirement
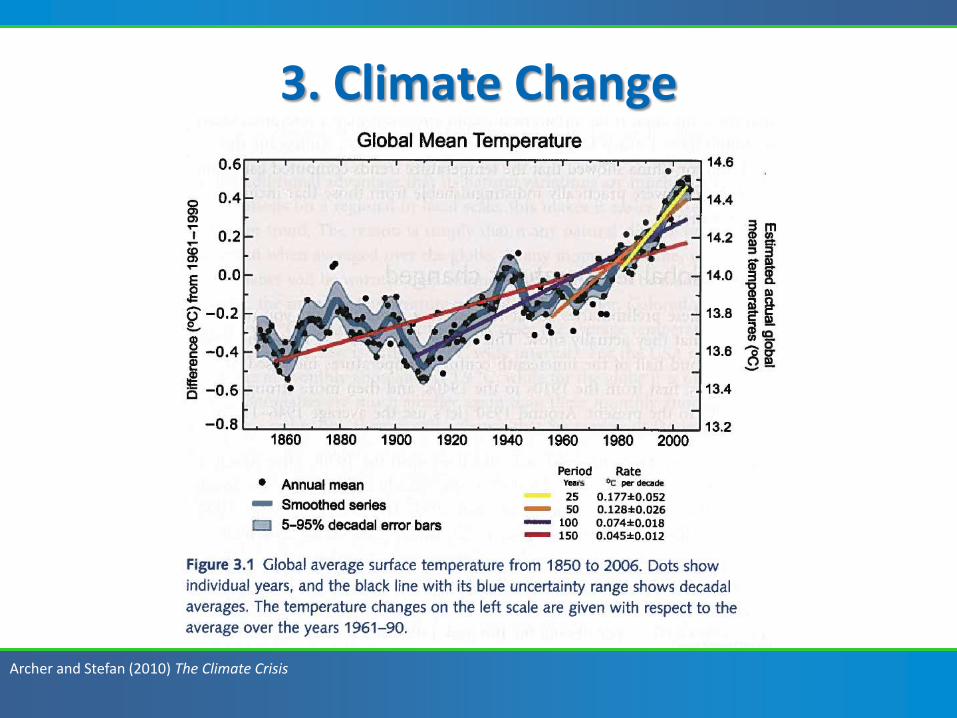
3. Climate Change
Archer and Stefan (2010) The Climate Crisis
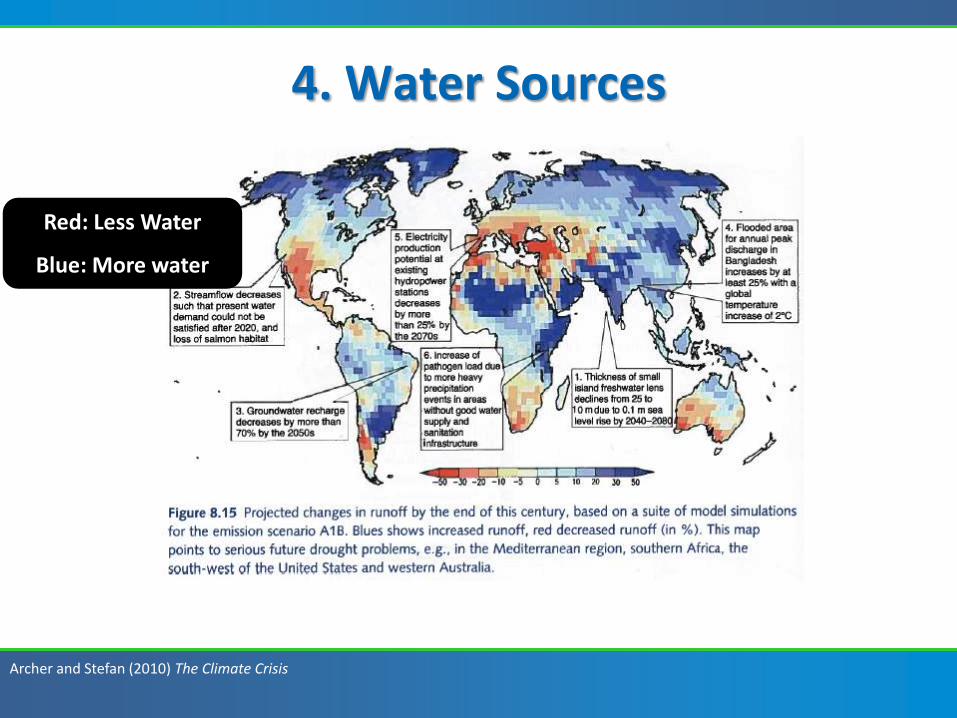
4. Water Sources
Archer and Stefan (2010) The Climate Crisis
Red: Less Water
Blue: More water

Resource Nexus: The Environmental Challenge of the 21st Century
Opportunities for Wastewater Utilities
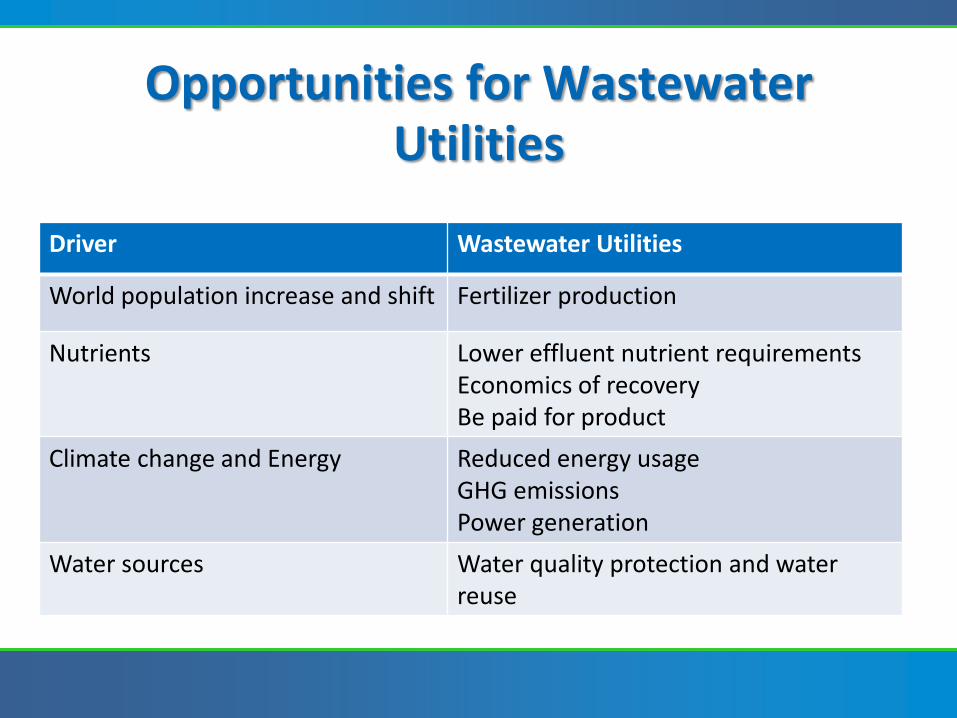
Opportunities for Wastewater Utilities
Driver Wastewater Utilities
World population increase and shift Fertilizer production
Nutrients Lower effluent nutrient requirements Economics of recovery Be paid for product
Climate change and Energy Reduced energy usage GHG emissions Power generation
Water sources Water quality protection and water reuse
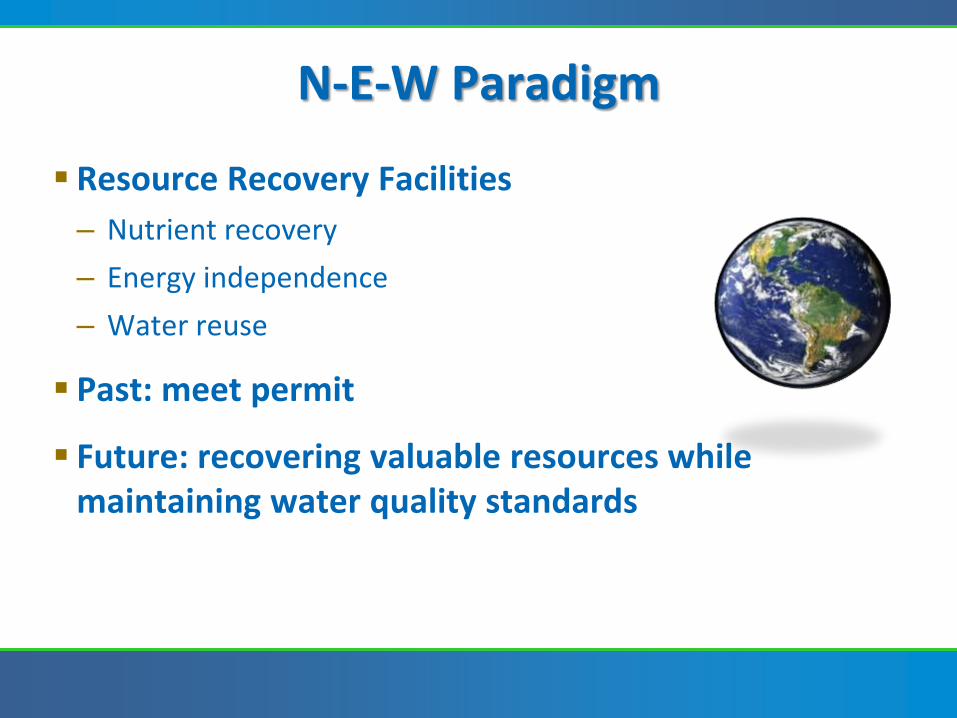
Resource Recovery Facilities
– Nutrient recovery
– Energy independence
– Water reuse
Past: meet permit
Future: recovering valuable resources while maintaining water quality standards
N-E-W Paradigm
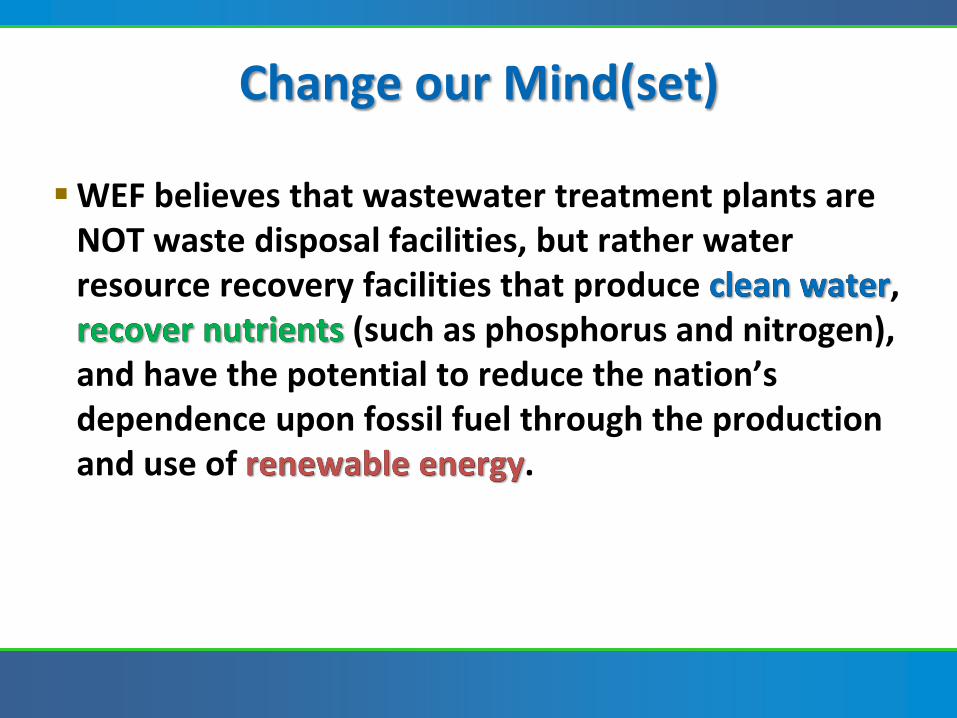
WEF believes that wastewater treatment plants are NOT waste disposal facilities, but rather water resource recovery facilities that produce clean water, recover nutrients (such as phosphorus and nitrogen), and have the potential to reduce the nation’s dependence upon fossil fuel through the production and use of renewable energy.
Change our Mind(set)
clean water recover nutrients
renewable energy
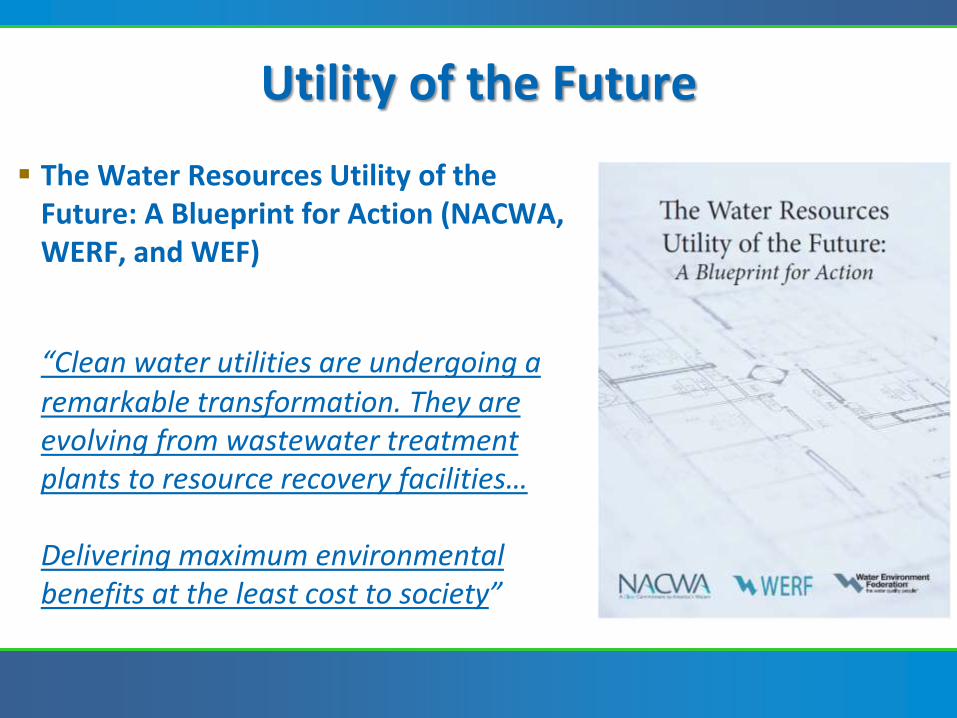
Utility of the Future
The Water Resources Utility of the Future: A Blueprint for Action (NACWA, WERF, and WEF)
“Clean water utilities are undergoing a
remarkable transformation. They are evolving from wastewater treatment plants to resource recovery facilities…
Delivering maximum environmental benefits at the least cost to society”
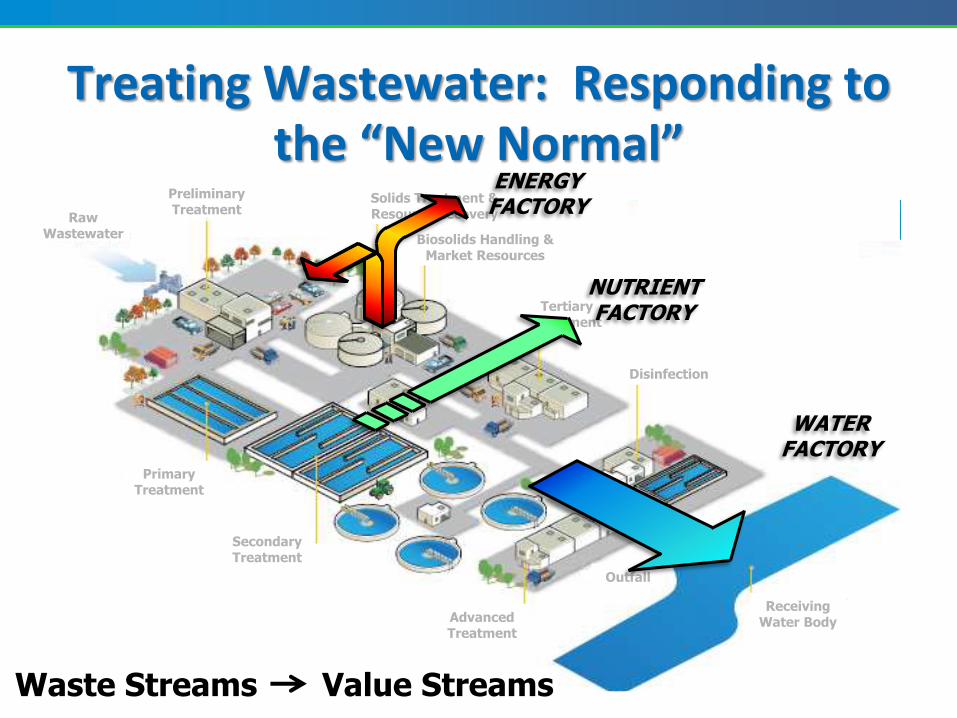
Treating Wastewater: Responding to the “New Normal”
Preliminary Treatment
Raw Wastewater
Solids Treatment & Resource Recovery
Biosolids Handling & Market Resources
Primary Treatment
Secondary Treatment
Advanced Treatment
Tertiary Treatment
Disinfection
Outfall
Receiving Water Body
ENERGY FACTORY
NUTRIENT FACTORY
WATER FACTORY
Waste Streams Value Streams

Where to start – A Stepwise Approach

How Do We Get There?
Stepwise process
Incremental steps that make sense now
Establish vision for the future
Reduce resource use
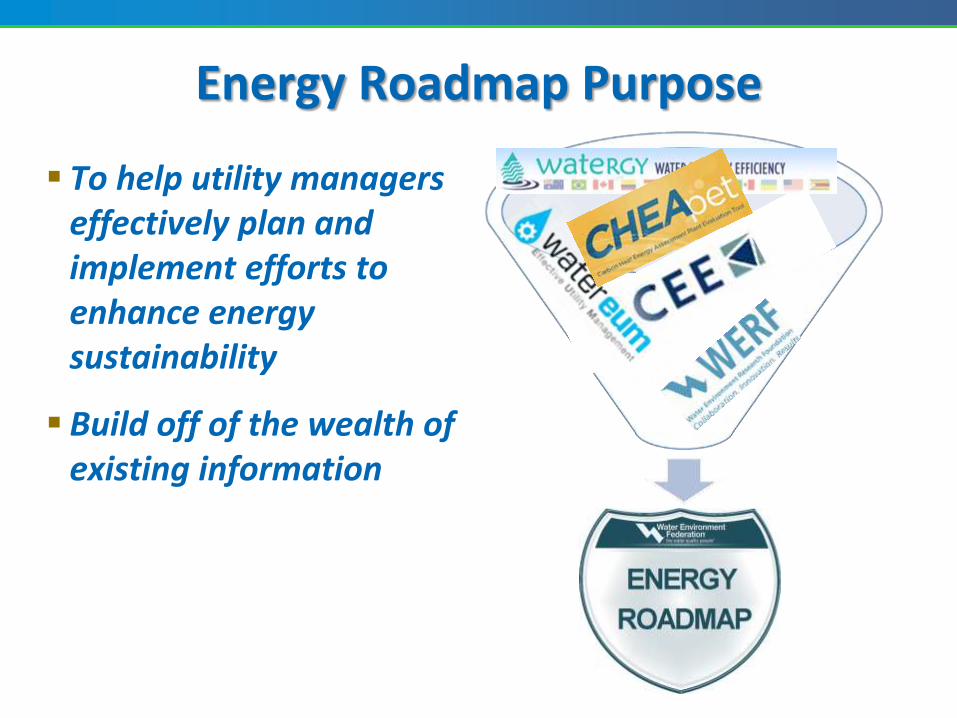
Energy Roadmap Purpose
To help utility managers effectively plan and implement efforts to enhance energy sustainability
Build off of the wealth of existing information
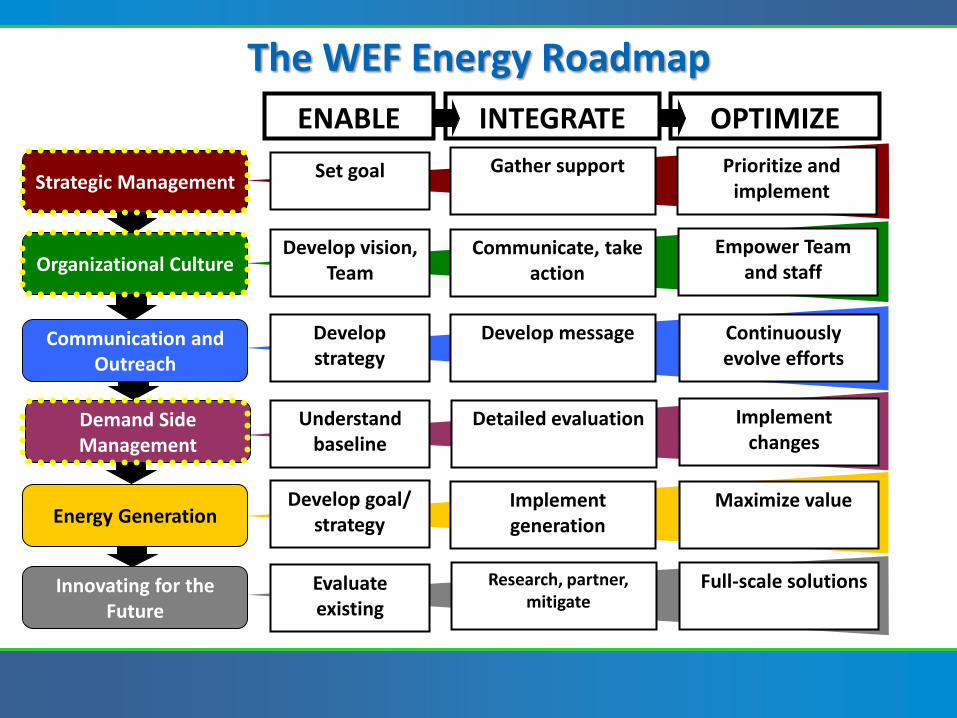
The WEF Energy Roadmap
ENABLE OPTIMIZE INTEGRATE
Strategic Management
Organizational Culture
Communication and Outreach
Demand Side Management
Energy Generation
Innovating for the Future
Develop strategy
Develop message Continuously evolve efforts
Evaluate existing
Research, partner, mitigate
Full-scale solutions
Understand baseline
Detailed evaluation Implement changes
Develop goal/ strategy
Implement generation
Maximize value
Set goal Gather support Prioritize and implement
Develop vision, Team
Communicate, take action
Empower Team and staff
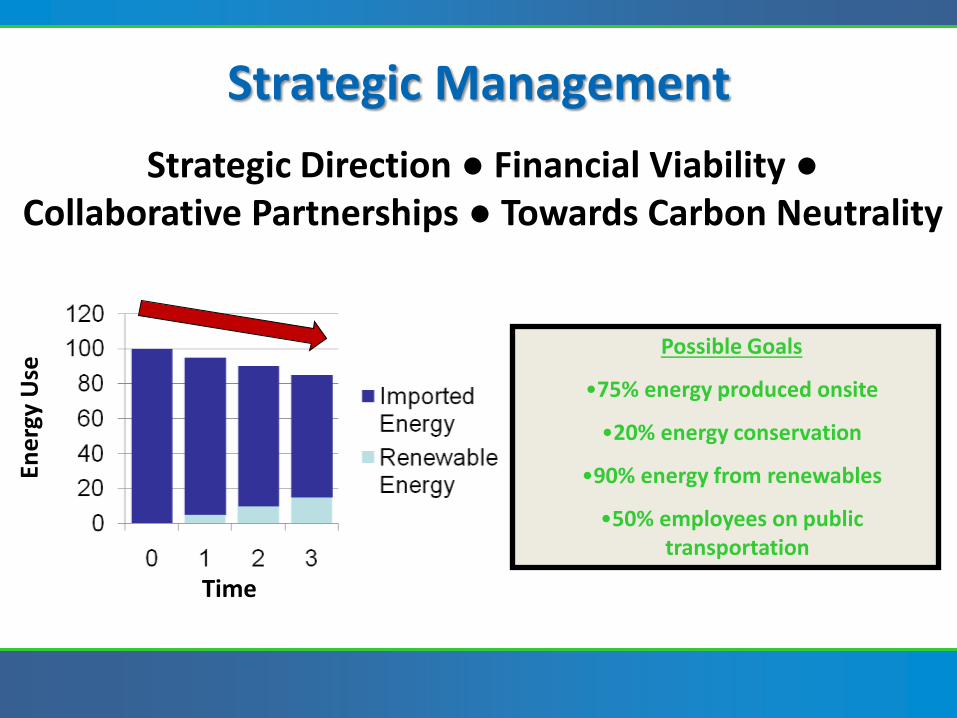
Strategic Management
Strategic Direction ● Financial Viability ● Collaborative Partnerships ● Towards Carbon Neutrality
Possible Goals
•75% energy produced onsite
•20% energy conservation
•90% energy from renewables
•50% employees on public transportation
Time
Ene
rgy
Use
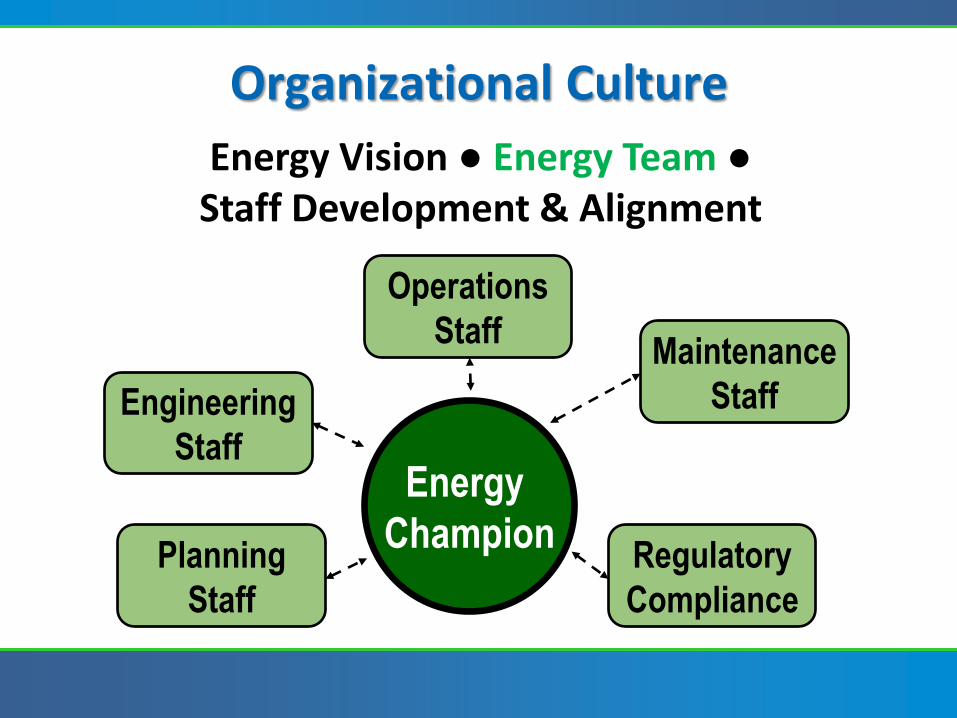
Organizational Culture
Energy Vision ● Energy Team ● Staff Development & Alignment
Energy
Champion Regulatory
Compliance
Maintenance
Staff
Planning
Staff
Engineering
Staff
Operations
Staff
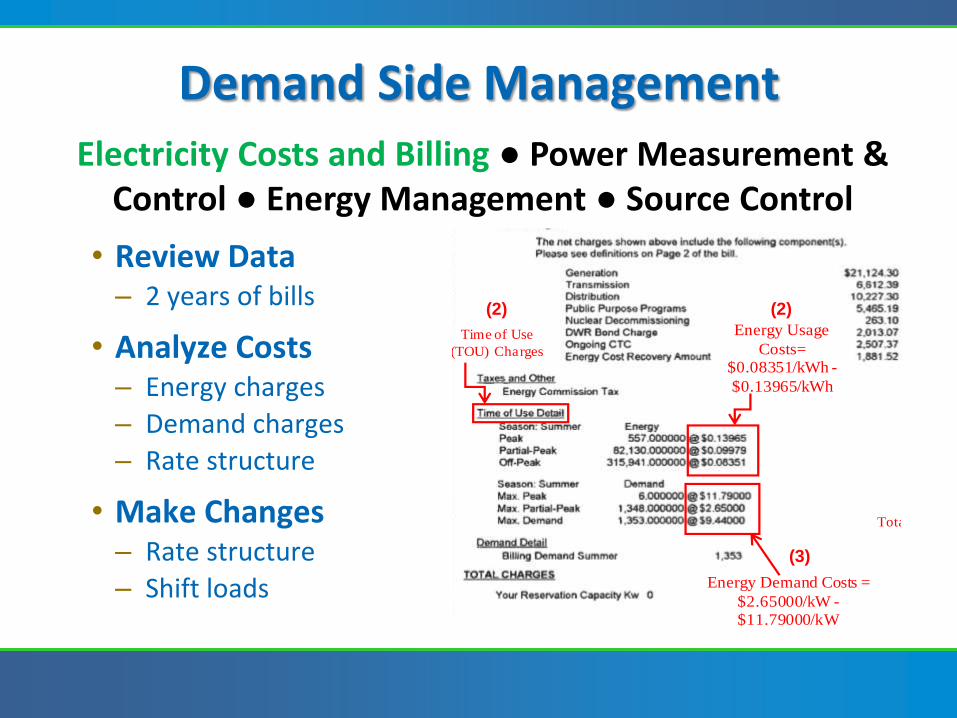
Demand Side Management
• Review Data – 2 years of bills
• Analyze Costs – Energy charges
– Demand charges
– Rate structure
• Make Changes – Rate structure
– Shift loads
Electricity Costs and Billing ● Power Measurement & Control ● Energy Management ● Source Control
Rate
Schedule
Energy Demand Costs =
$2.65000/kW -$11.79000/kW
Energy Usage
Costs= $0.08351/kWh -
$0.13965/kWh
Total Electric Costs =
Time of Use
(TOU) Charges
Billing Period
(1)
(1)
(2) (2)
(3)
(4)
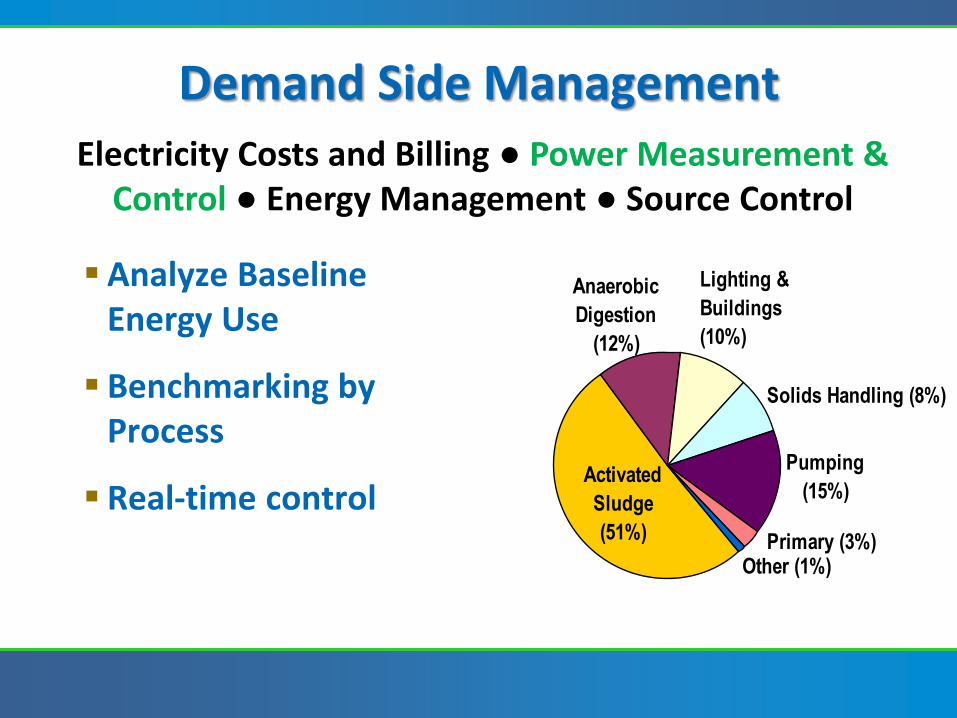
Demand Side Management
Analyze Baseline Energy Use
Benchmarking by Process
Real-time control
Electricity Costs and Billing ● Power Measurement & Control ● Energy Management ● Source Control
Other (1%)Primary (3%)
Pumping
(15%)
Solids Handling (8%)
Lighting &
Buildings
(10%)
Anaerobic
Digestion
(12%)
Activated
Sludge
(51%)
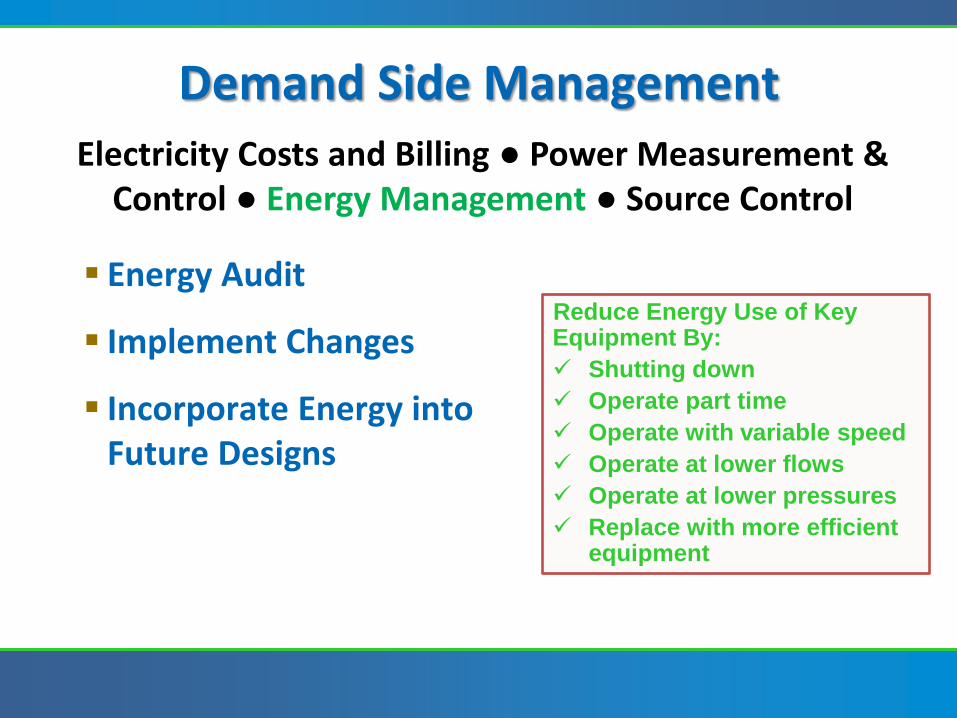
Demand Side Management
Energy Audit
Implement Changes
Incorporate Energy into Future Designs
Electricity Costs and Billing ● Power Measurement & Control ● Energy Management ● Source Control
Reduce Energy Use of Key Equipment By:
Shutting down
Operate part time
Operate with variable speed
Operate at lower flows
Operate at lower pressures
Replace with more efficient equipment
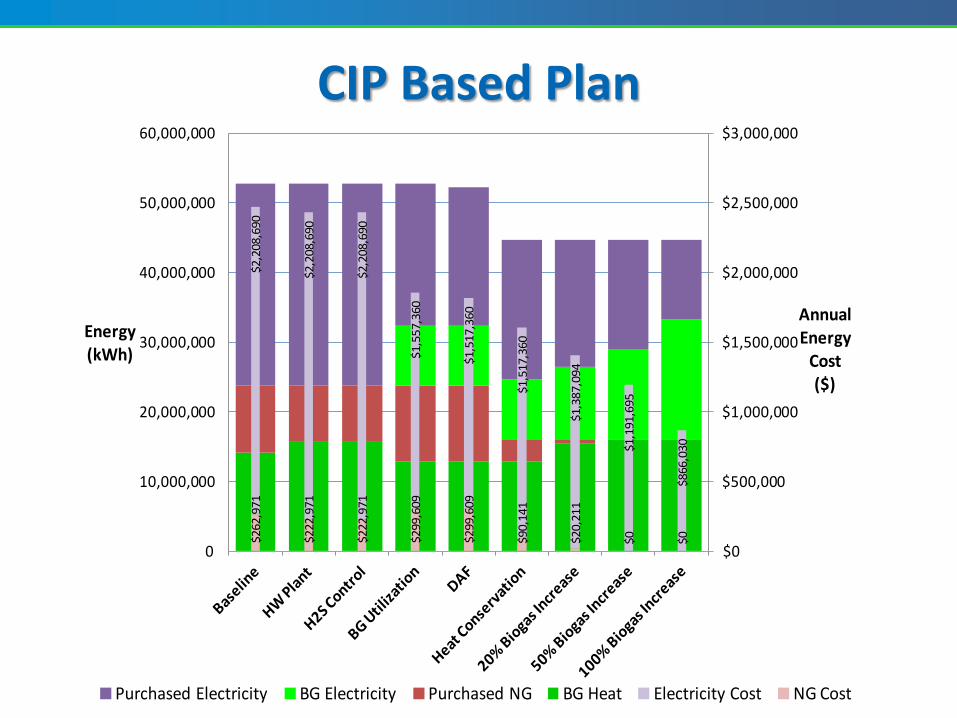
CIP Based Plan
$262
,971
$222
,971
$222
,971
$299
,609
$299
,609
$90,
141
$20,
211
$0 $0
$2,2
08,6
90
$2,2
08,6
90
$2,2
08,6
90
$1,5
57,3
60
$1,5
17,3
60
$1,5
17,3
60
$1,3
87,0
94
$1,1
91,6
95
$866
,030
$0
$500,000
$1,000,000
$1,500,000
$2,000,000
$2,500,000
$3,000,000
0
10,000,000
20,000,000
30,000,000
40,000,000
50,000,000
60,000,000
AnnualEnergy
Cost($)
Energy(kWh)
Purchased Electricity BG Electricity Purchased NG BG Heat Electricity Cost NG Cost
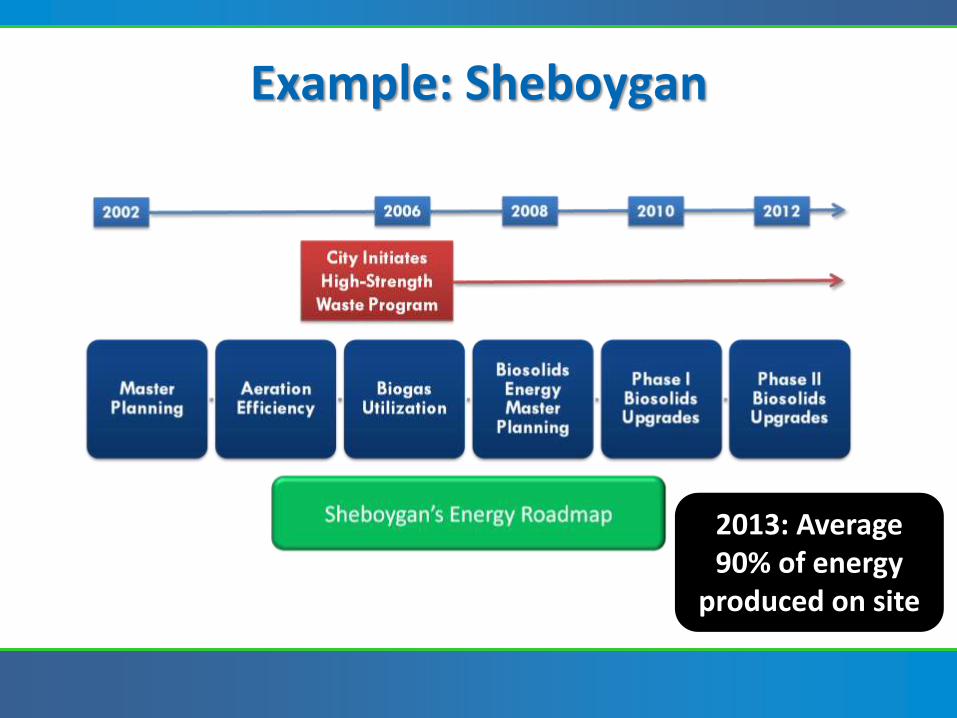
Example: Sheboygan
2013: Average 90% of energy
produced on site
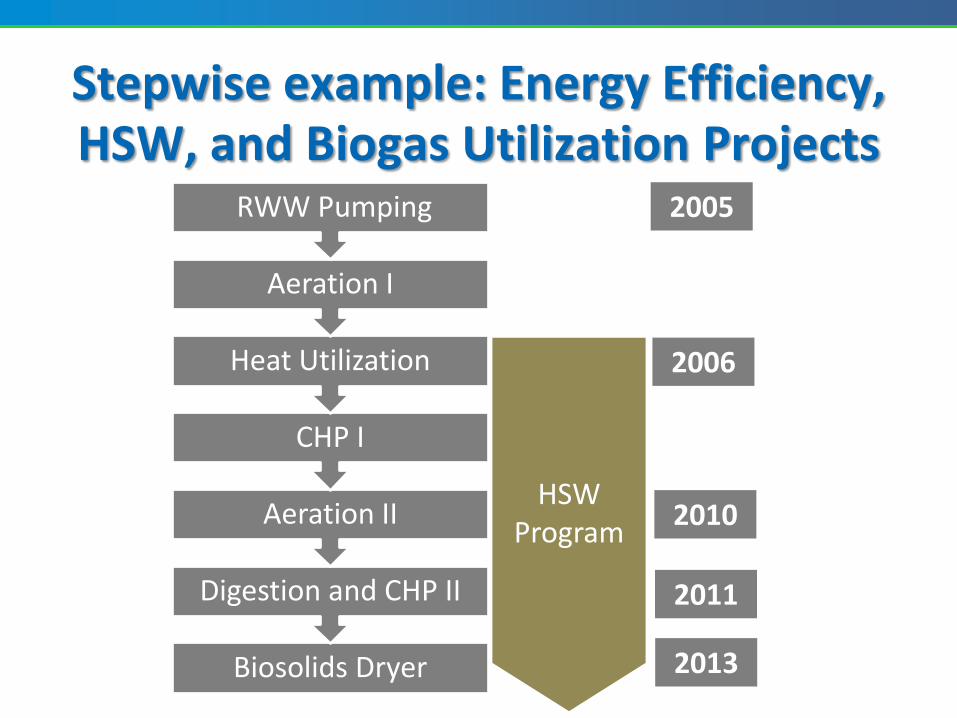
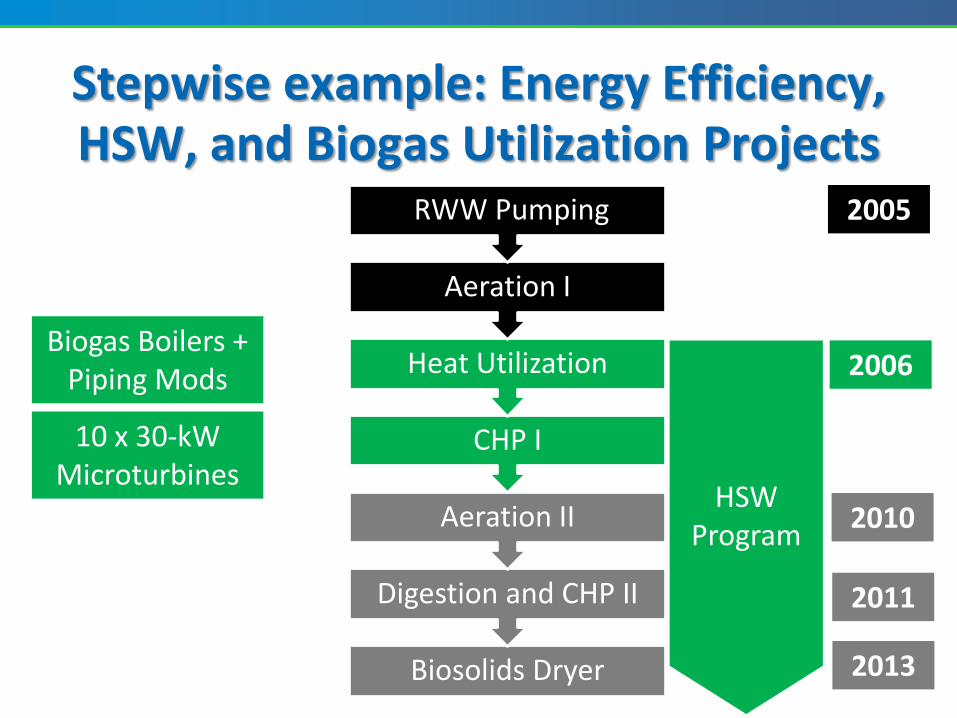
Stepwise example: Energy Efficiency, HSW, and Biogas Utilization Projects
Biosolids Dryer
Digestion and CHP II
Aeration II
CHP I
Heat Utilization
Aeration I
RWW Pumping 2005
2011
HSW Program
2006
2010
2013
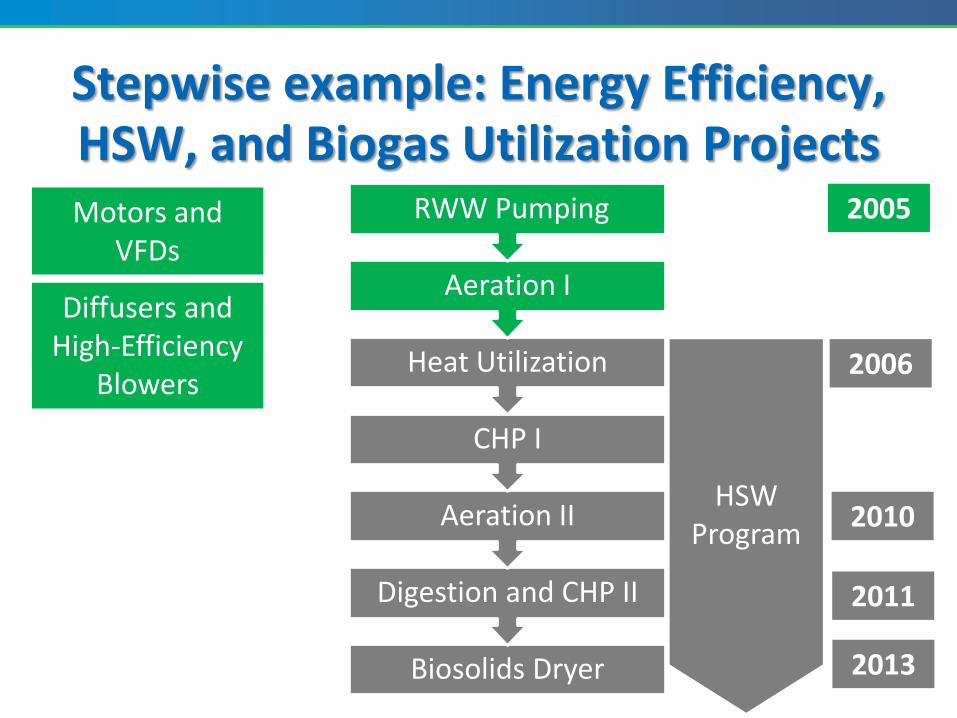
Stepwise example: Energy Efficiency, HSW, and Biogas Utilization Projects
Biosolids Dryer
Digestion and CHP II
Aeration II
CHP I
Heat Utilization
Aeration I
RWW Pumping 2005
2011
HSW Program
2006
2010
2013
Motors and VFDs
Diffusers and High-Efficiency
Blowers
Stepwise example: Energy Efficiency, HSW, and Biogas Utilization Projects
Biosolids Dryer
Digestion and CHP II
Aeration II
CHP I
Heat Utilization
Aeration I
RWW Pumping 2005
2011
HSW Program
2006
2010
2013
10 x 30-kW Microturbines
Biogas Boilers + Piping Mods
Stepwise example: Energy Efficiency, HSW, and Biogas Utilization Projects
Biosolids Dryer
Digestion and CHP II
Aeration II
CHP I
Heat Utilization
Aeration I
RWW Pumping 2005
2011
HSW Program
2006
2010
2013
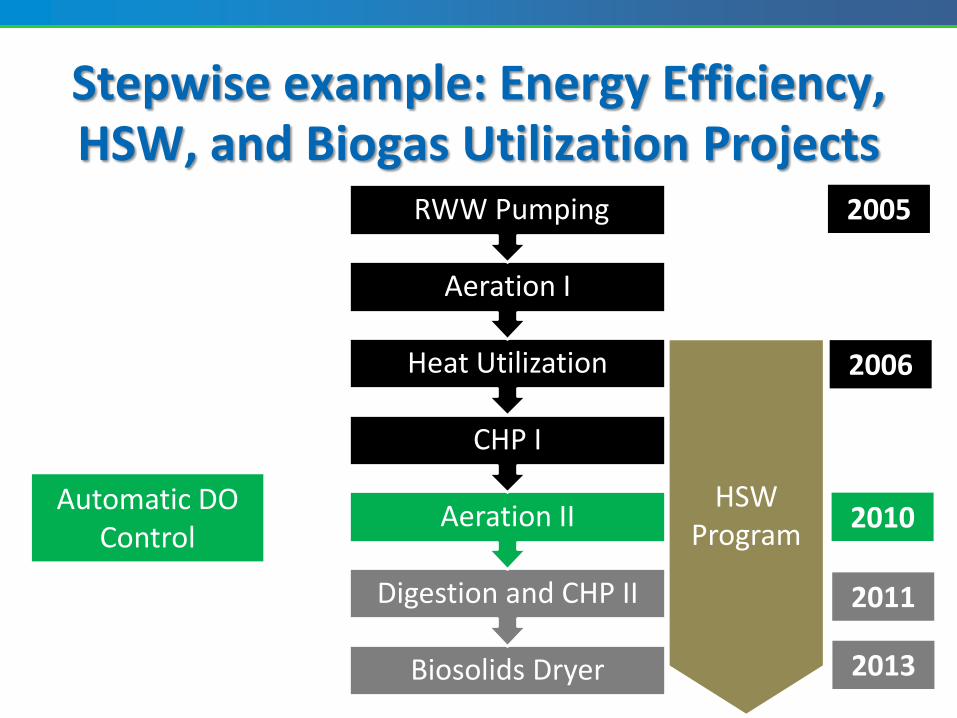
Automatic DO Control
Stepwise example: Energy Efficiency, HSW, and Biogas Utilization Projects
Biosolids Dryer
Digestion and CHP II
Aeration II
CHP I
Heat Utilization
Aeration I
RWW Pumping 2005
2011
HSW Program
2006
2010
2013
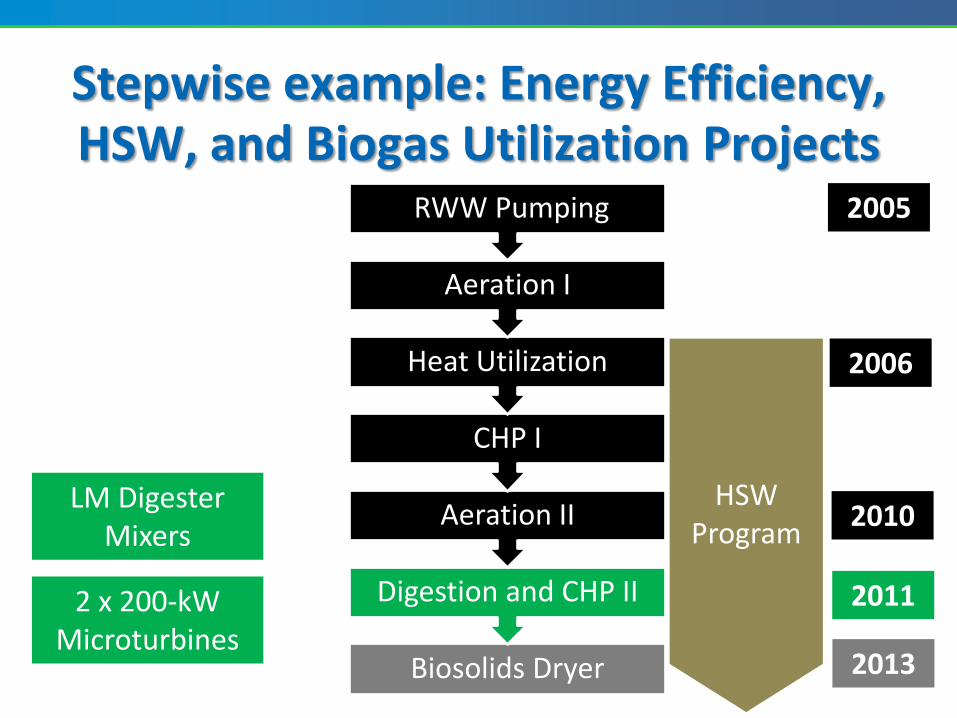
LM Digester Mixers
2 x 200-kW Microturbines
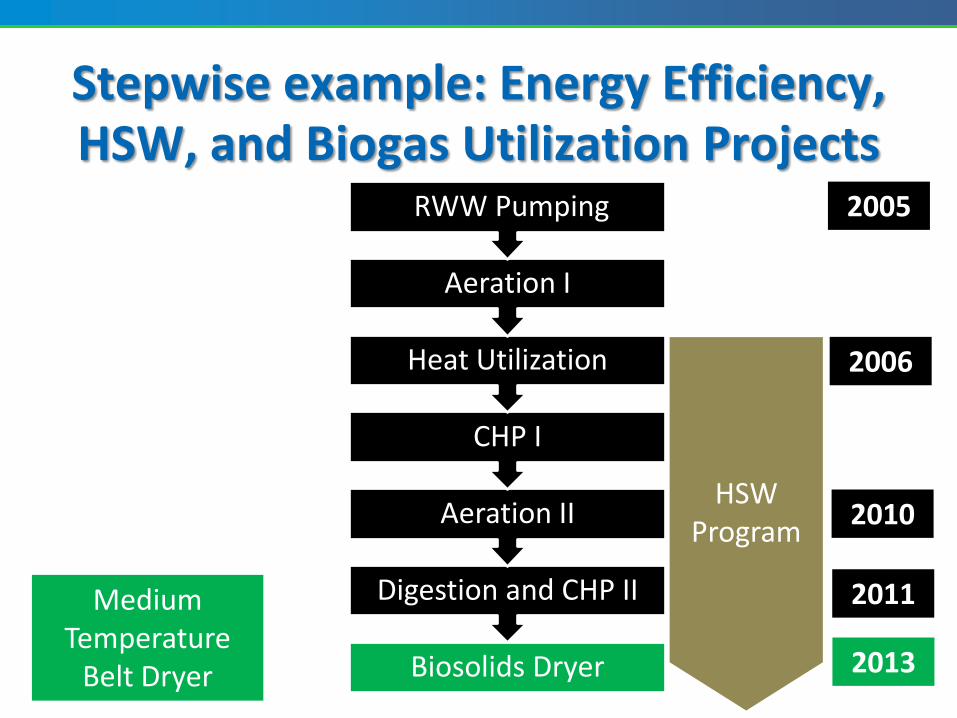
Stepwise example: Energy Efficiency, HSW, and Biogas Utilization Projects
Biosolids Dryer
Digestion and CHP II
Aeration II
CHP I
Heat Utilization
Aeration I
RWW Pumping 2005
2011
HSW Program
2006
2010
2013
Medium Temperature
Belt Dryer
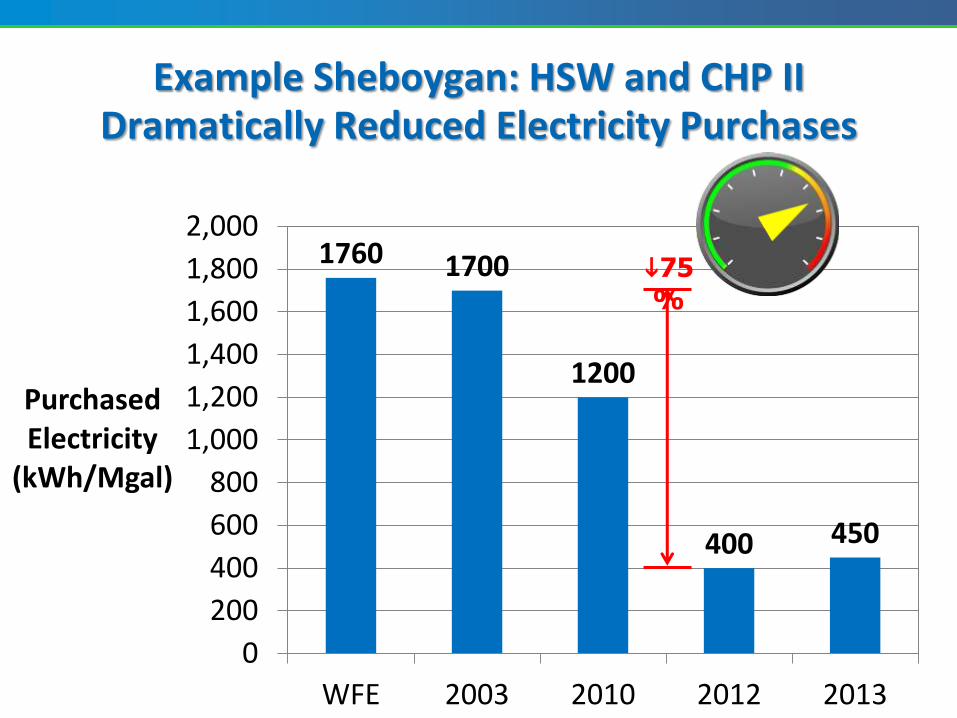
Example Sheboygan: HSW and CHP II Dramatically Reduced Electricity Purchases
1760 1700
1200
400 450
0
200
400
600
800
1,000
1,200
1,400
1,600
1,800
2,000
WFE 2003 2010 2012 2013
Purchased Electricity
(kWh/Mgal)
75%
Resource Recovery in the Midwest
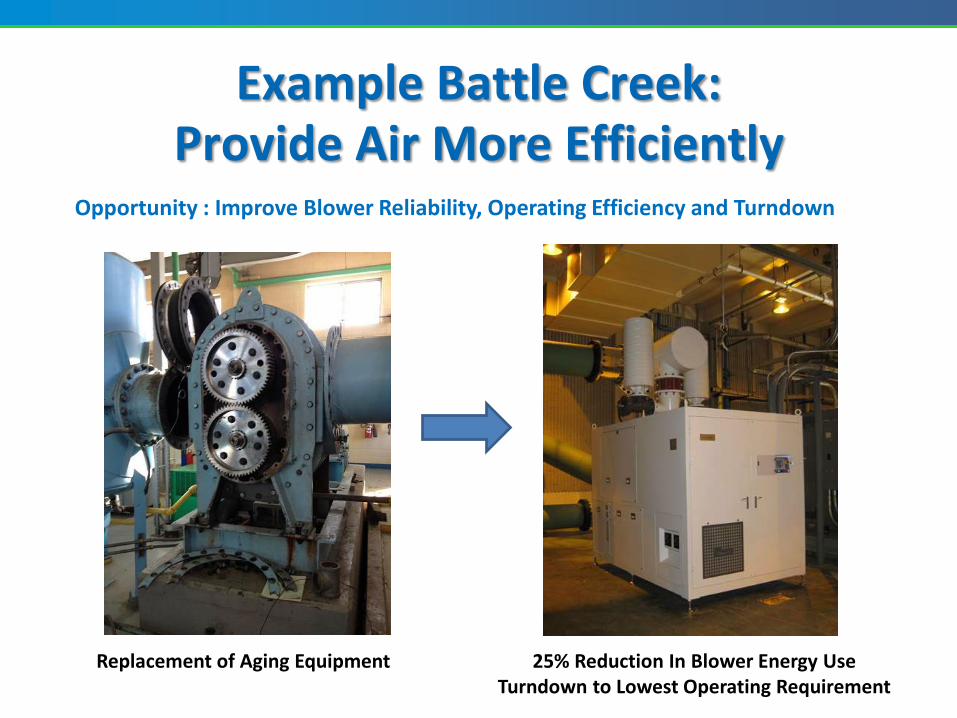
Opportunity : Improve Blower Reliability, Operating Efficiency and Turndown
25% Reduction In Blower Energy Use Turndown to Lowest Operating Requirement
Replacement of Aging Equipment
Example Battle Creek: Provide Air More Efficiently
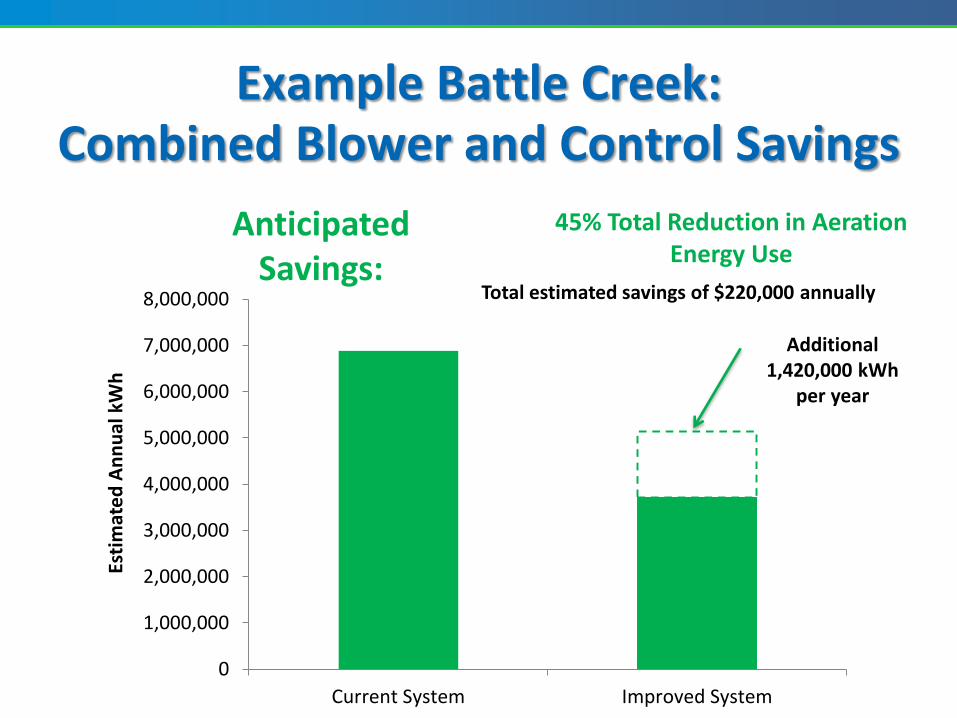
Anticipated Savings:
0
1,000,000
2,000,000
3,000,000
4,000,000
5,000,000
6,000,000
7,000,000
8,000,000
Current System Improved System
Esti
mat
ed
An
nu
al k
Wh
Additional 1,420,000 kWh
per year
45% Total Reduction in Aeration Energy Use
Total estimated savings of $220,000 annually
Example Battle Creek: Combined Blower and Control Savings
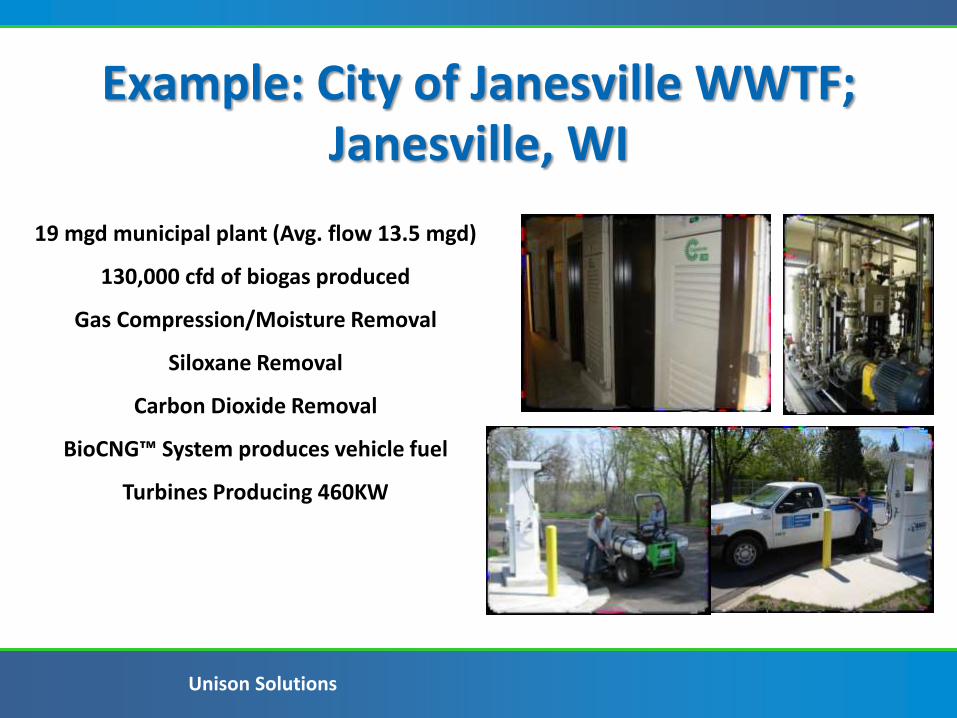
Example: City of Janesville WWTF; Janesville, WI
19 mgd municipal plant (Avg. flow 13.5 mgd)
130,000 cfd of biogas produced
Gas Compression/Moisture Removal
Siloxane Removal
Carbon Dioxide Removal
BioCNG™ System produces vehicle fuel
Turbines Producing 460KW
Unison Solutions
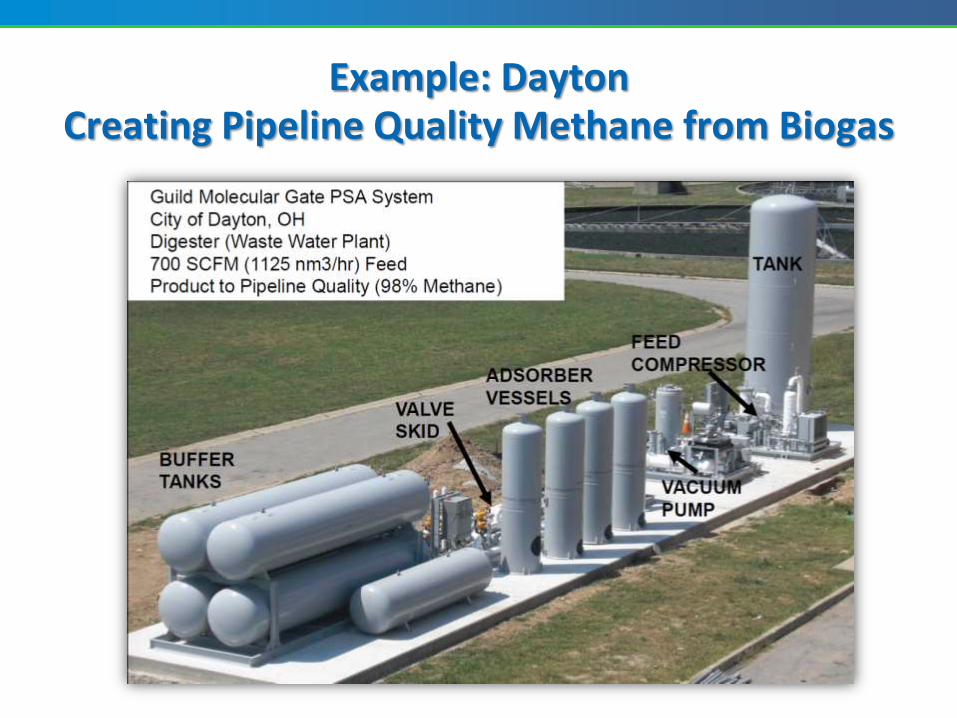
Example: Dayton Creating Pipeline Quality Methane from Biogas
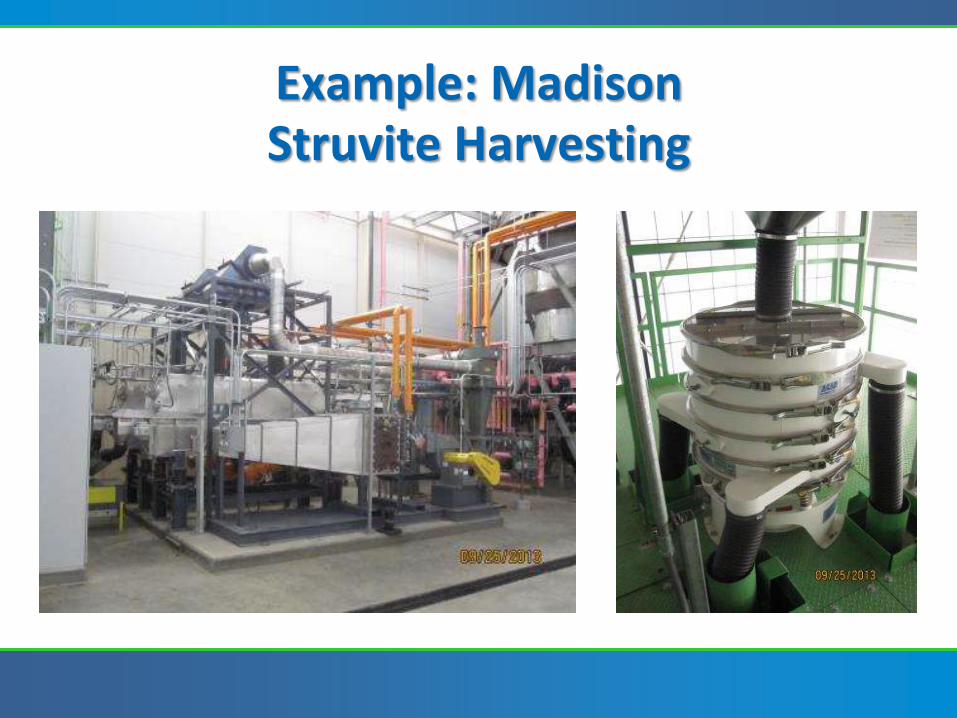
Example: Madison Struvite Harvesting
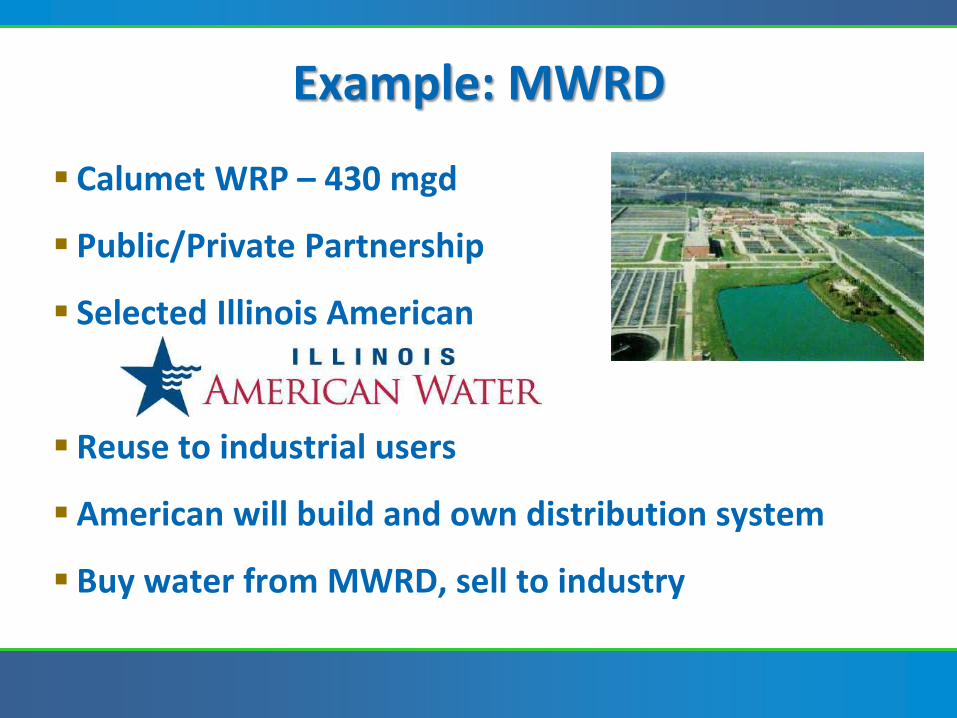
Calumet WRP – 430 mgd
Public/Private Partnership
Selected Illinois American
Reuse to industrial users
American will build and own distribution system
Buy water from MWRD, sell to industry
Example: MWRD
Embrace the opportunity
Lots of great resources
Set a goal
Gain buy-in from staff/leaders
Keep it simple at first
Don’t overlook operational changes
Use savings to fund future projects
Look for rebates
Take Away