Embed Size (px)
Citation preview

Becoming the leader in intelligent cargo handling
Investor presentation, April 2018
April 2018 1Investor presentation
April 2018Investor presentation 2
Content1. Cargotec in brief
2. Investment highlights
3. Kalmar
4. Hiab
5. MacGregor
6. Recent progress
7. Appendix
3
Cargotecin brief
44
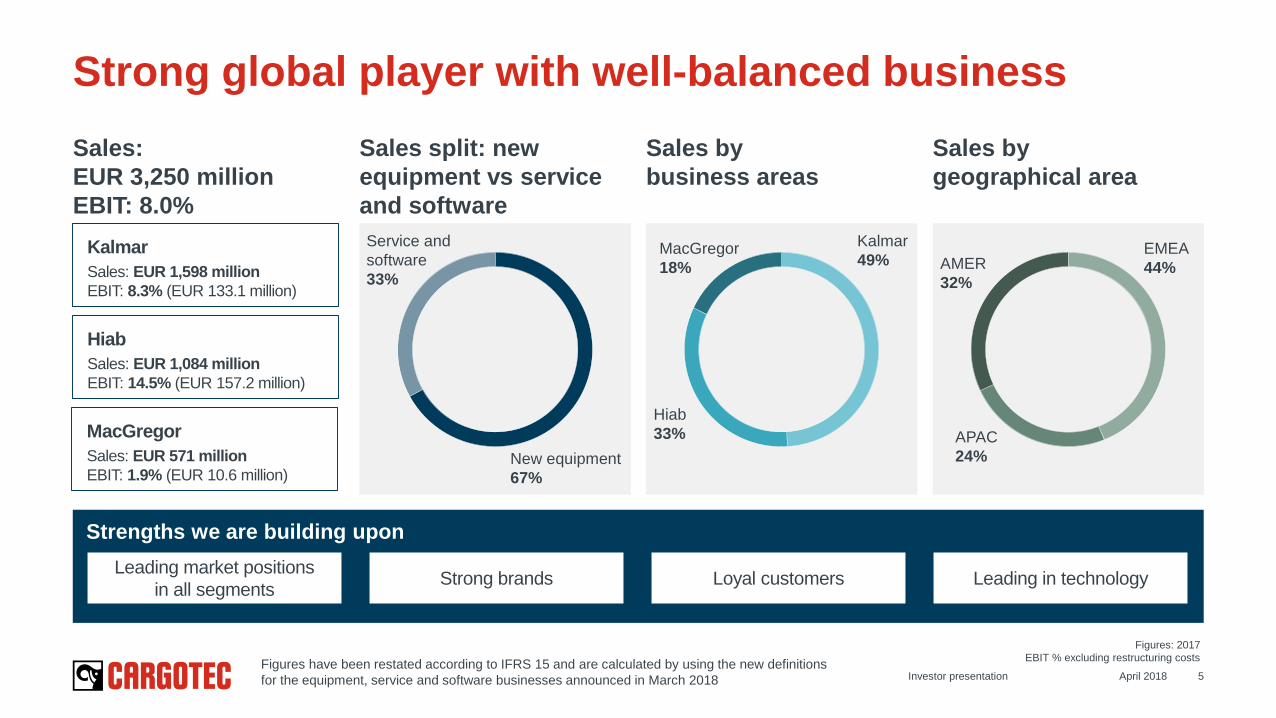
Sales:
EUR 3,250 million
EBIT: 8.0%
Strengths we are building upon
Sales split: new
equipment vs service
and software
April 2018Investor presentation 5
Strong global player with well-balanced business
Sales by
geographical area
Sales by
business areas
Kalmar
49%
Hiab
33%
MacGregor
18% AMER
32%
EMEA
44%
APAC
24%
Service and
software
33%
New equipment
67%
Figures: 2017
EBIT % excluding restructuring costs
Leading market positions
in all segmentsStrong brands Loyal customers Leading in technology
Kalmar
Sales: EUR 1,598 million
EBIT: 8.3% (EUR 133.1 million)
Hiab
Sales: EUR 1,084 million
EBIT: 14.5% (EUR 157.2 million)
MacGregor
Sales: EUR 571 million
EBIT: 1.9% (EUR 10.6 million)
Figures have been restated according to IFRS 15 and are calculated by using the new definitions
for the equipment, service and software businesses announced in March 2018
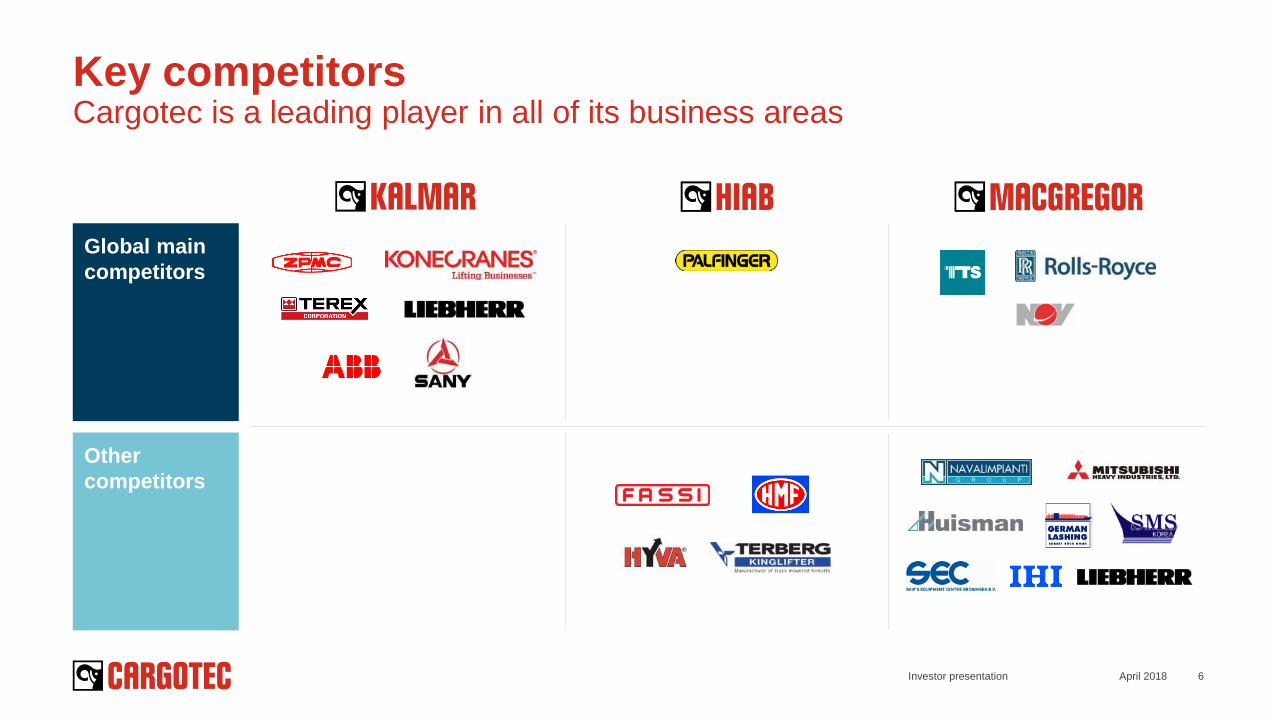
Key competitorsCargotec is a leading player in all of its business areas
April 2018Investor presentation 6
Global main
competitors
Other
competitors
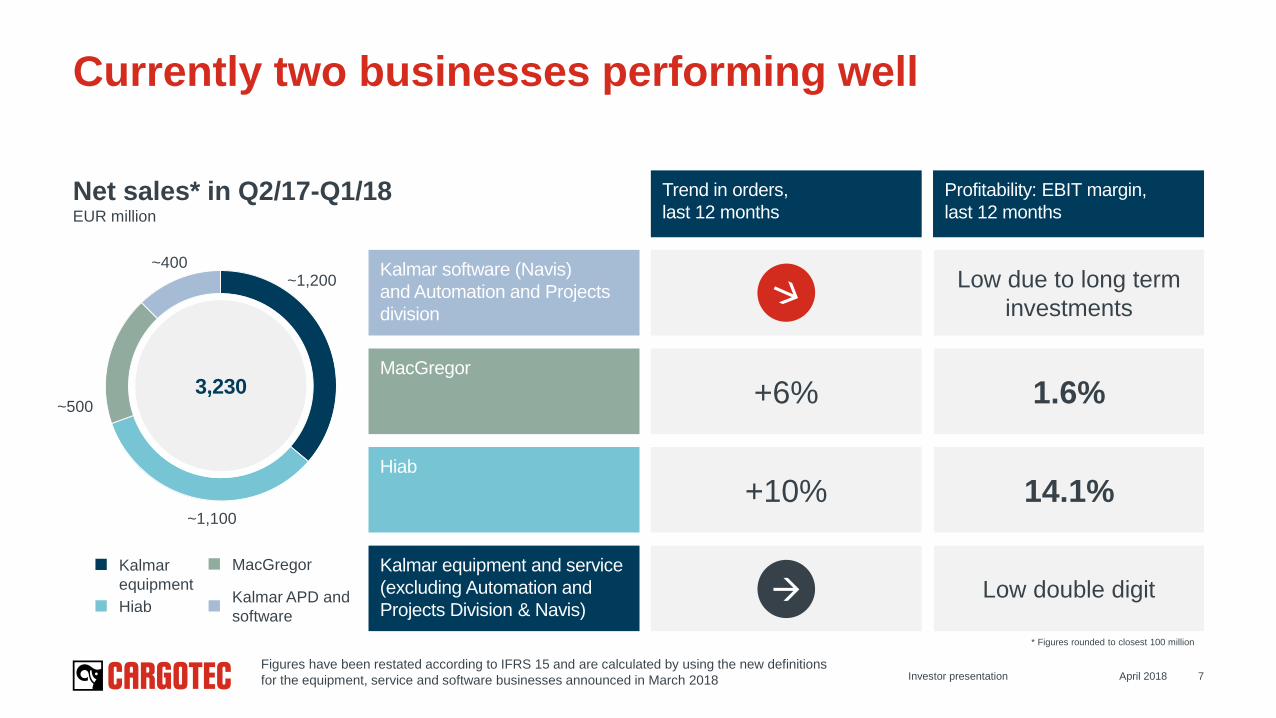
Currently two businesses performing well
April 2018Investor presentation 7
Net sales* in Q2/17-Q1/18EUR million
Trend in orders,
last 12 months
Profitability: EBIT margin,
last 12 months
Kalmar software (Navis)
and Automation and Projects
division
MacGregor
+6%
Hiab
+10%
Kalmar equipment and service
(excluding Automation and
Projects Division & Navis)
Low due to long term
investments
1.6%
14.1%
Low double digit
* Figures rounded to closest 100 million
~1,100
~1,200
3,230
Kalmar
equipment
Hiab
MacGregor
Kalmar APD and
software
~400
~500
Figures have been restated according to IFRS 15 and are calculated by using the new definitions
for the equipment, service and software businesses announced in March 2018
Investment highlights
8

1. Technology leader and strong market
positions, leading brands in markets with
long term growth potential
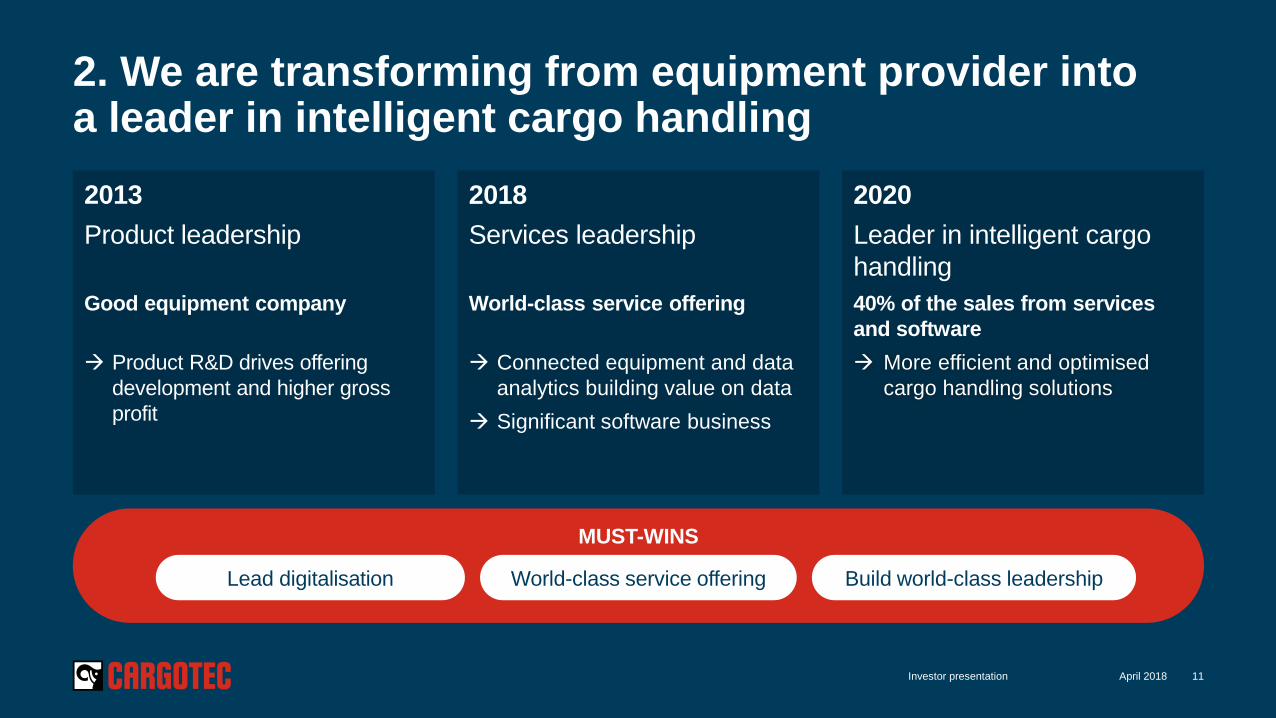
2. Transforming from equipment provider
into the leader in intelligent cargo
handling
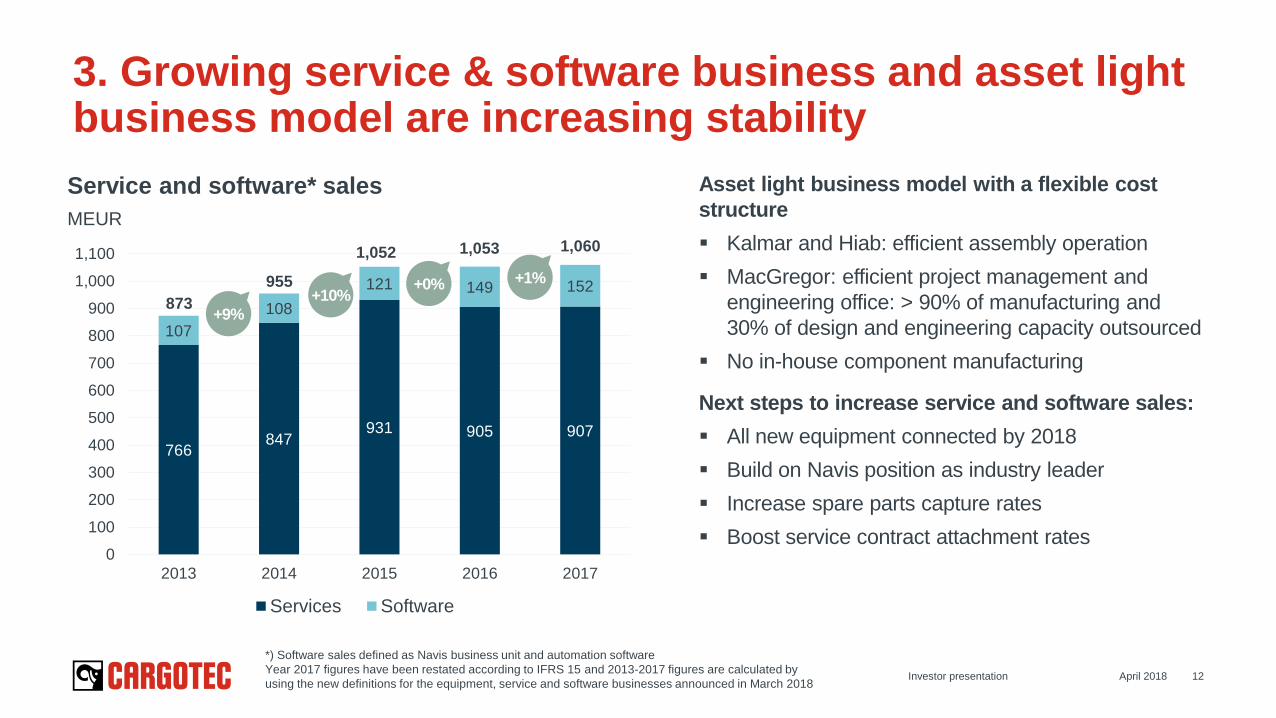
3. Growing service & software business
and asset light business model are
increasing stability
4. Capitalizing global opportunities for
future automation and software growth
5. On track for profitability improvement
and to reach financial targets
Investment highlights: Why invest in Cargotec?
9
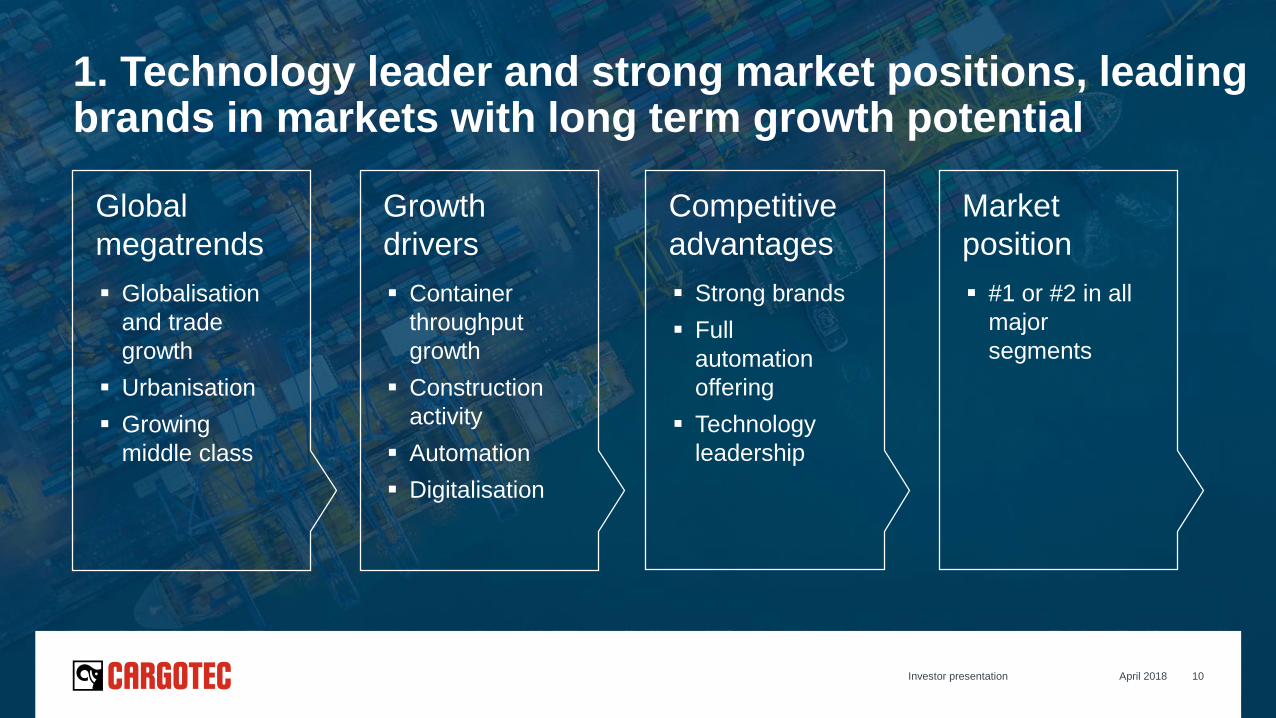
1. Technology leader and strong market positions, leading brands in markets with long term growth potential
April 2018Investor presentation 10
Global
megatrends
Globalisation
and trade
growth
Urbanisation
Growing
middle class
Growth
drivers
Container
throughput
growth
Construction
activity
Automation
Digitalisation
Competitive
advantages
Strong brands
Full
automation
offering
Technology
leadership
Market
position
#1 or #2 in all
major
segments
MUST-WINS
2013
Product leadership
Good equipment company
Product R&D drives offering
development and higher gross
profit
2018
Services leadership
World-class service offering
Connected equipment and data
analytics building value on data
Significant software business
2020
Leader in intelligent cargo
handling
40% of the sales from services
and software
More efficient and optimised
cargo handling solutions
2. We are transforming from equipment provider intoa leader in intelligent cargo handling
April 2018Investor presentation 11
Lead digitalisation World-class service offering Build world-class leadership
April 2018Investor presentation 12
3. Growing service & software business and asset light business model are increasing stability
Asset light business model with a flexible cost
structure
Kalmar and Hiab: efficient assembly operation
MacGregor: efficient project management and
engineering office: > 90% of manufacturing and
30% of design and engineering capacity outsourced
No in-house component manufacturing
Next steps to increase service and software sales:
All new equipment connected by 2018
Build on Navis position as industry leader
Increase spare parts capture rates
Boost service contract attachment rates
Service and software* sales
MEUR
766847
931 905 907
107
108
121 149 152
0
100
200
300
400
500
600
700
800
900
1,000
1,100
2013 2014 2015 2016 2017
Services Software
+9%
+10%+0% +1%
873
955
1,052 1,053 1,060
*) Software sales defined as Navis business unit and automation software
Year 2017 figures have been restated according to IFRS 15 and 2013-2017 figures are calculated by
using the new definitions for the equipment, service and software businesses announced in March 2018

Industry trends support growth
in port automation:
Only 40 terminals (out of 1,200
terminals) are automated or semi-
automated currently globally
Ships are becoming bigger and
the peak loads have become an issue
Increasing focus on safety
Customers require decreasing energy
usage and zero emission ports
Optimum efficiency, space utilization
and reduction of costs are increasingly
important
Shortage and cost of trained and
skilled labour pushes terminals to
automation
April 2018Investor presentation 13
4. Capitalizing global opportunities for future automation and software growth
Significant possibility in port
software:
Container value chain is very
inefficient: total value of waste and
inefficiency estimated at ~EUR 17bn
Over 50% of port software market is
in-house, in long term internal
solutions not competitive
Navis has leading position in
port ERP
Customers consider their automation
decisions carefully
Shipping line consolidation
Utilisation rates of the existing
equipment base
Container throughput volumes
Efficiency of the automation solutions
Automation creates significant cost savings*
Labour costs 60% less labour costs
Total costs 24% less costs
Profit increase 125%
* Change when manual terminal converted into an automated operation
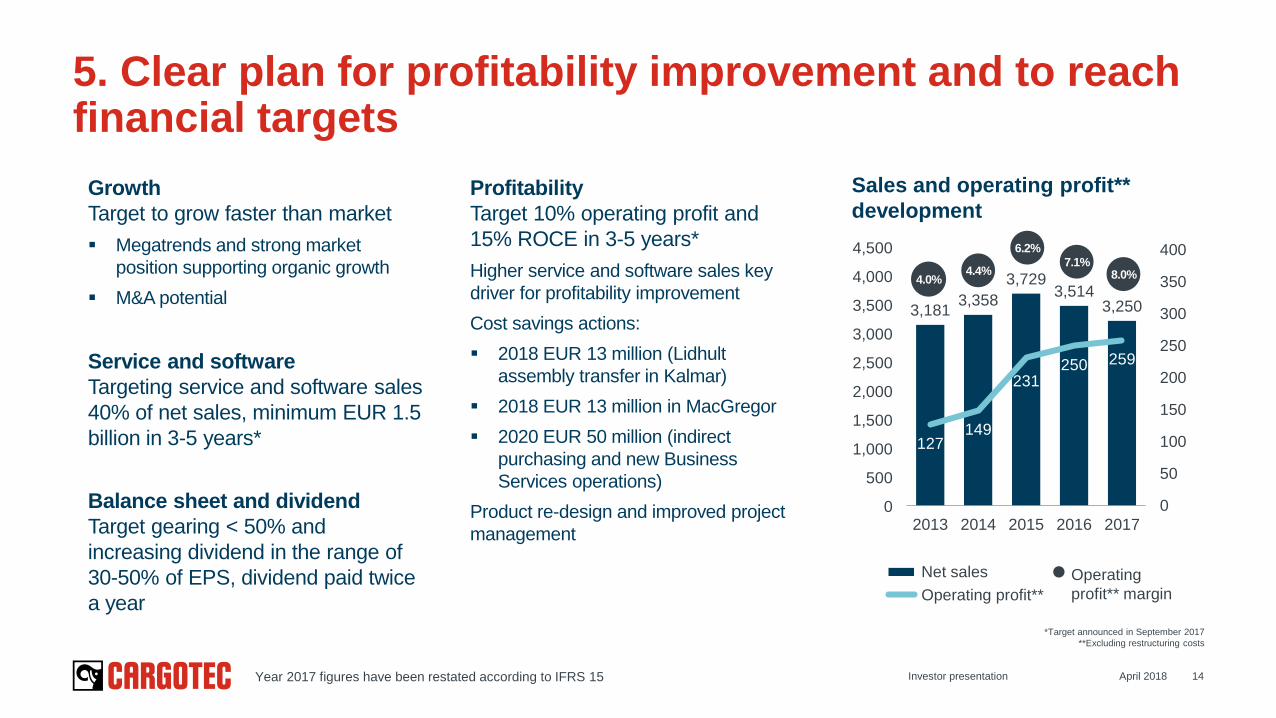
3,1813,358
3,7293,514
3,250
127149
231250 259
0
50
100
150
200
250
300
350
400
2013 2014 2015 2016 2017
Net sales
Operating profit**
5. Clear plan for profitability improvement and to reach financial targets
April 2018Investor presentation 14
Growth
Target to grow faster than market
Megatrends and strong market
position supporting organic growth
M&A potential
Balance sheet and dividend
Target gearing < 50% and
increasing dividend in the range of
30-50% of EPS, dividend paid twice
a year
Profitability
Target 10% operating profit and
15% ROCE in 3-5 years*
Higher service and software sales key
driver for profitability improvement
Cost savings actions:
2018 EUR 13 million (Lidhult
assembly transfer in Kalmar)
2018 EUR 13 million in MacGregor
2020 EUR 50 million (indirect
purchasing and new Business
Services operations)
Product re-design and improved project
management
Sales and operating profit**
development
*Target announced in September 2017
**Excluding restructuring costs
4.0%4.4%
6.2%
7.1%
Operating
profit** margin
4,500
4,000
3,500
3,000
2,500
2,000
1,500
1,000
500
0
Service and software
Targeting service and software sales
40% of net sales, minimum EUR 1.5
billion in 3-5 years*
8.0%
Year 2017 figures have been restated according to IFRS 15

Kalmar
April 2018Investor presentation 1515
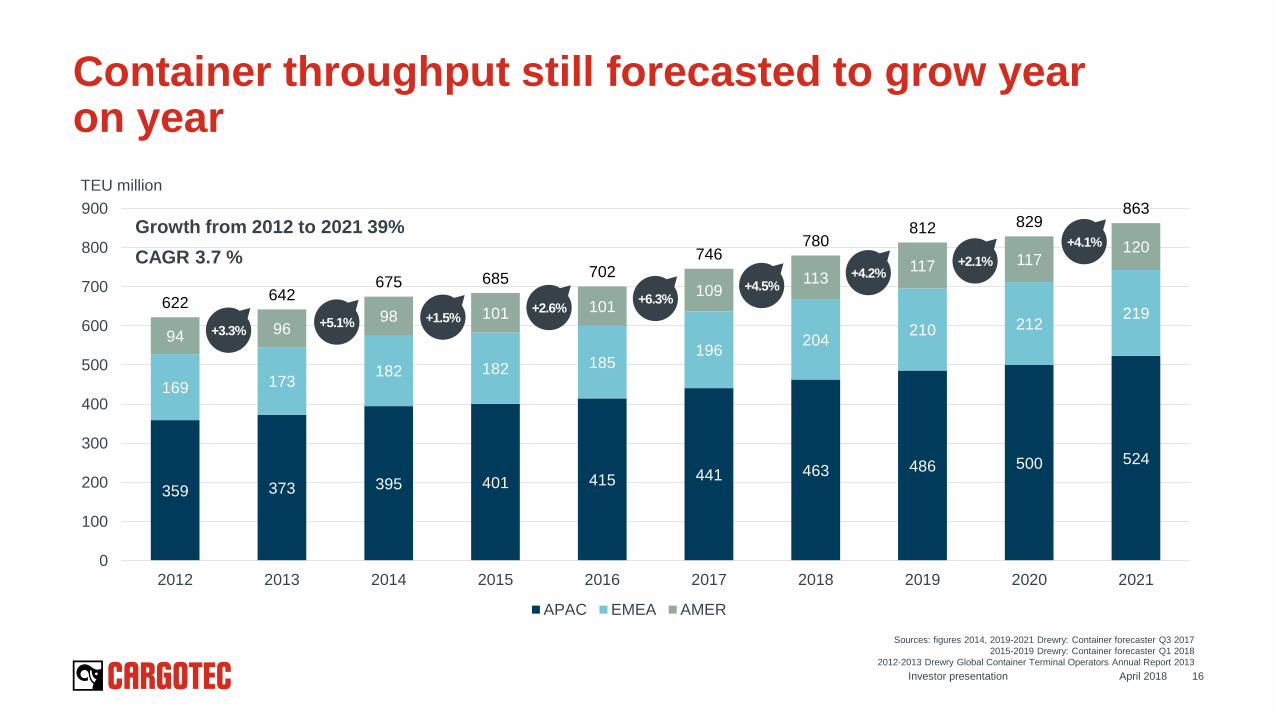
359 373 395 401 415 441 463 486 500 524
169 173182 182 185
196204
210 212219
94 9698 101 101
109113
117 117120
622642
675 685 702746
780812 829
863
0
100
200
300
400
500
600
700
800
900
2012 2013 2014 2015 2016 2017 2018 2019 2020 2021
APAC EMEA AMER
Container throughput still forecasted to grow yearon year
TEU million
+3.3%+5.1% +1.5%
+2.6%+6.3%
+4.5%+4.2%
+2.1%
Growth from 2012 to 2021 39%
CAGR 3.7 %
Sources: figures 2014, 2019-2021 Drewry: Container forecaster Q3 2017
2015-2019 Drewry: Container forecaster Q1 2018
2012-2013 Drewry Global Container Terminal Operators Annual Report 2013
April 2018Investor presentation 16
+4.1%

Flexible and scalable Navis TOS software
April 2018Investor presentation 17
Terminal Logistic System
Truck / Transfer area
ASC stack area
Automatic stacking crane (ASC) area
Automated Horizontal Transportation
Quay crane area
Equipment Equipment
Terminal Operating System (TOS)
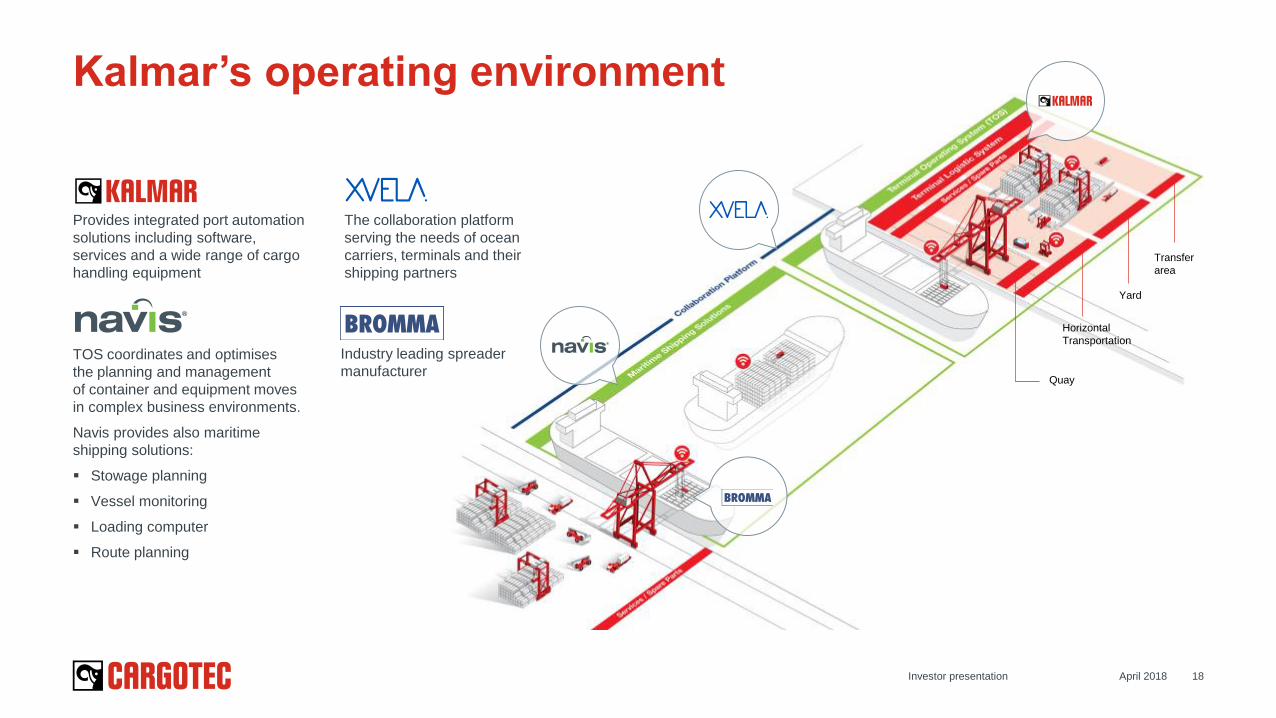
Kalmar’s operating environment
April 2018Investor presentation 18
Provides integrated port automation
solutions including software,
services and a wide range of cargo
handling equipment
TOS coordinates and optimises
the planning and management
of container and equipment moves
in complex business environments.
Navis provides also maritime
shipping solutions:
Stowage planning
Vessel monitoring
Loading computer
Route planning
Quay
Horizontal
Transportation
Yard
Transfer
area
Industry leading spreader
manufacturer
The collaboration platform
serving the needs of ocean
carriers, terminals and their
shipping partners
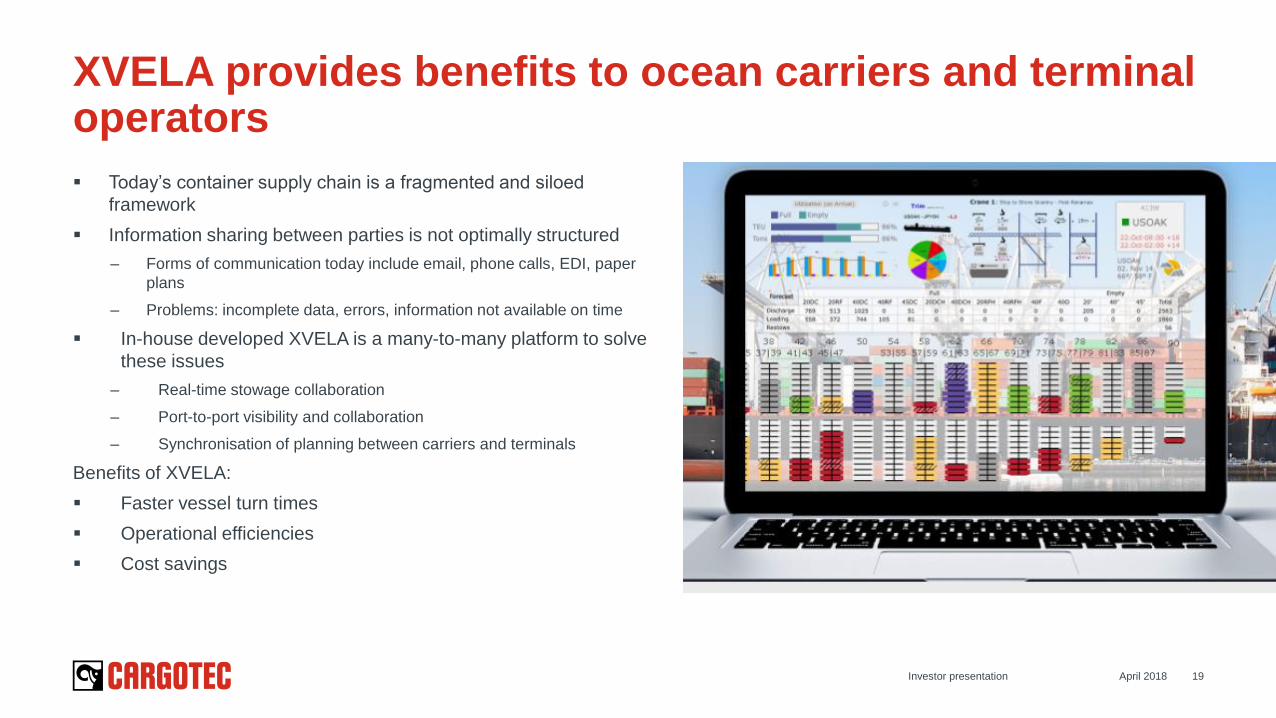
Today’s container supply chain is a fragmented and siloed
framework
Information sharing between parties is not optimally structured
– Forms of communication today include email, phone calls, EDI, paper
plans
– Problems: incomplete data, errors, information not available on time
In-house developed XVELA is a many-to-many platform to solve
these issues
– Real-time stowage collaboration
– Port-to-port visibility and collaboration
– Synchronisation of planning between carriers and terminals
Benefits of XVELA:
Faster vessel turn times
Operational efficiencies
Cost savings
April 2018Investor presentation 19
XVELA provides benefits to ocean carriers and terminal operators
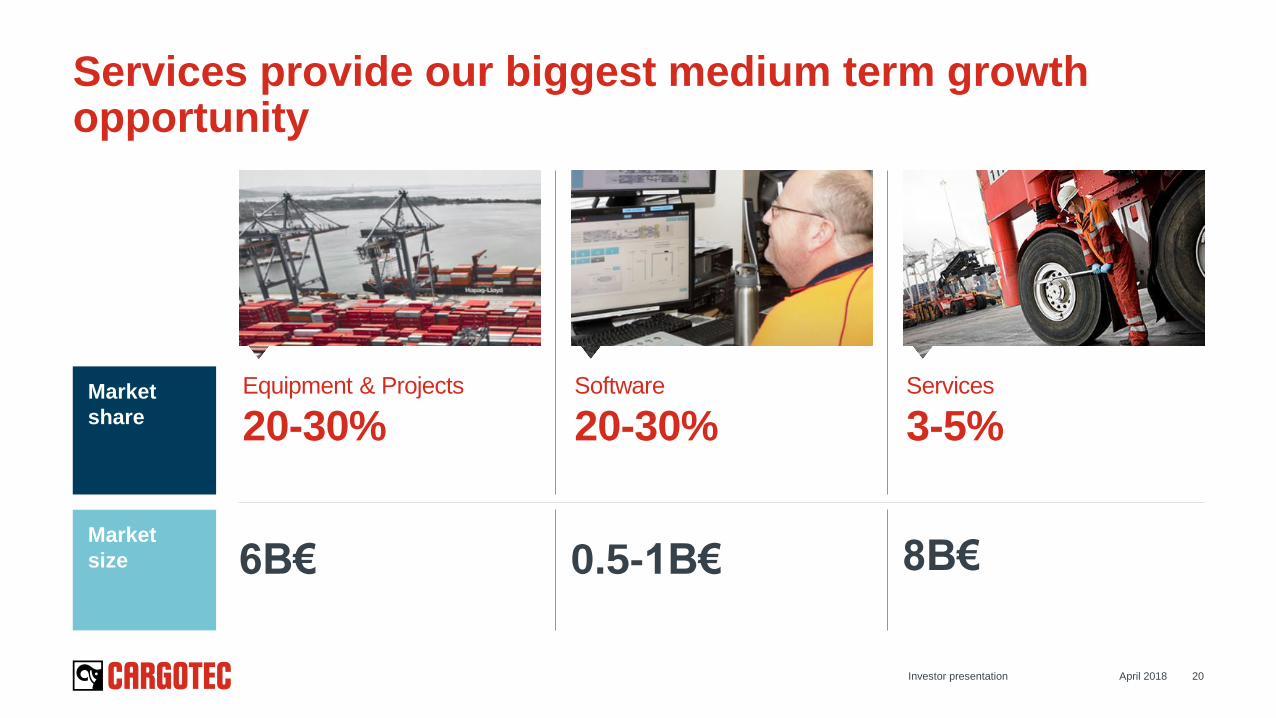
Services provide our biggest medium term growthopportunity
Market
share
Market
size
Services
3-5%
8B€
Equipment & Projects
20-30%
6B€ 0.5-1B€
Software
20-30%
April 2018Investor presentation 20
Hiab
April 2018Investor presentation 2121

EMEA construction outputy/y change (%)
AMER construction outputy/y change (%)
Construction output driving growth opportunity
Oxford Economics: Industry output forecast
3/2018
-3.0 %
-2.0 %
-1.0 %
0.0 %
1.0 %
2.0 %
3.0 %
4.0 %
5.0 %
2010 2012 2014 2016 2018 2020 2022
60
65
70
75
80
85
90
95
100
105
110
115
120
125
Index Change %
-0.5 %
0.0 %
0.5 %
1.0 %
1.5 %
2.0 %
2.5 %
3.0 %
3.5 %
4.0 %
4.5 %
5.0 %
2010 2012 2014 2016 2018 2020 2022
60
65
70
75
80
85
90
95
100
105
110
115
120
125
130
135
Index Change %
April 2018Investor presentation 22
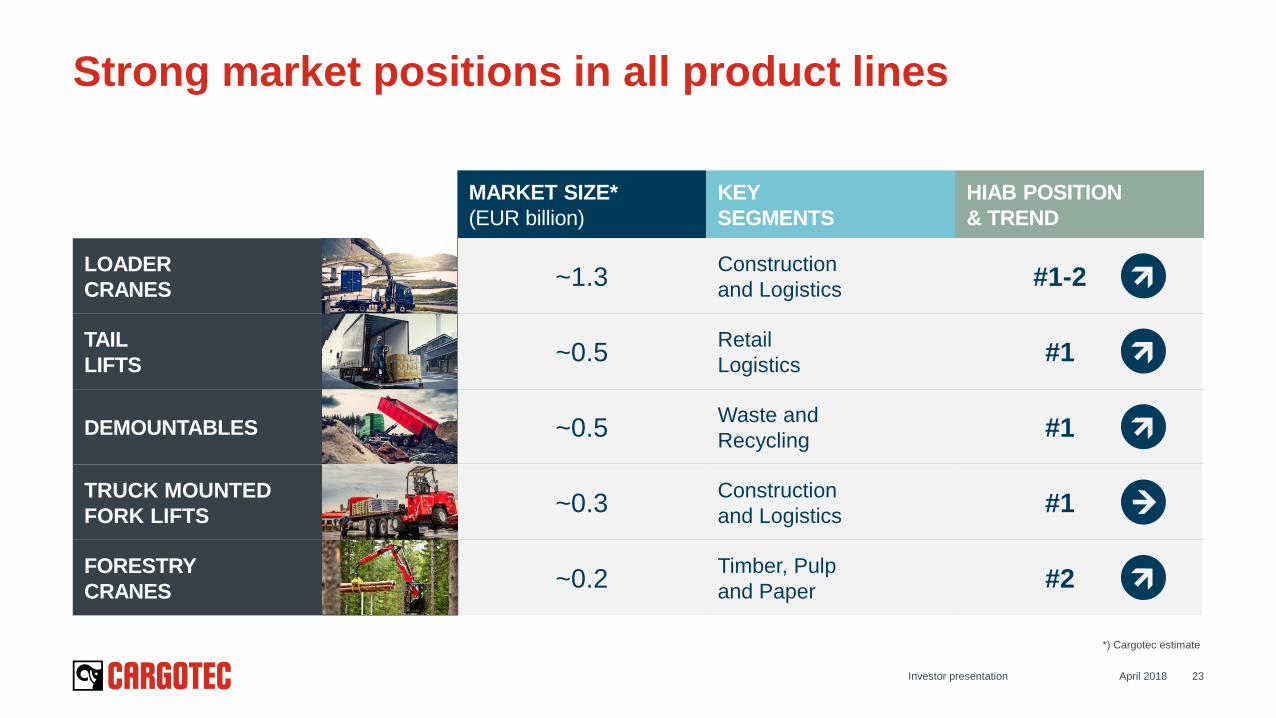
Strong market positions in all product lines
April 2018Investor presentation 23
MARKET SIZE*
(EUR billion)
KEY
SEGMENTS
HIAB POSITION
& TREND
*) Cargotec estimate
~1.3
~0.5
~0.5
~0.3
~0.2
Retail
Logistics
Waste and
Recycling
Construction
and Logistics
Timber, Pulp
and Paper
Construction
and Logistics#1-2
#1
#1
#1
#2
LOADER
CRANES
TAIL
LIFTS
DEMOUNTABLES
TRUCK MOUNTED
FORK LIFTS
FORESTRY
CRANES
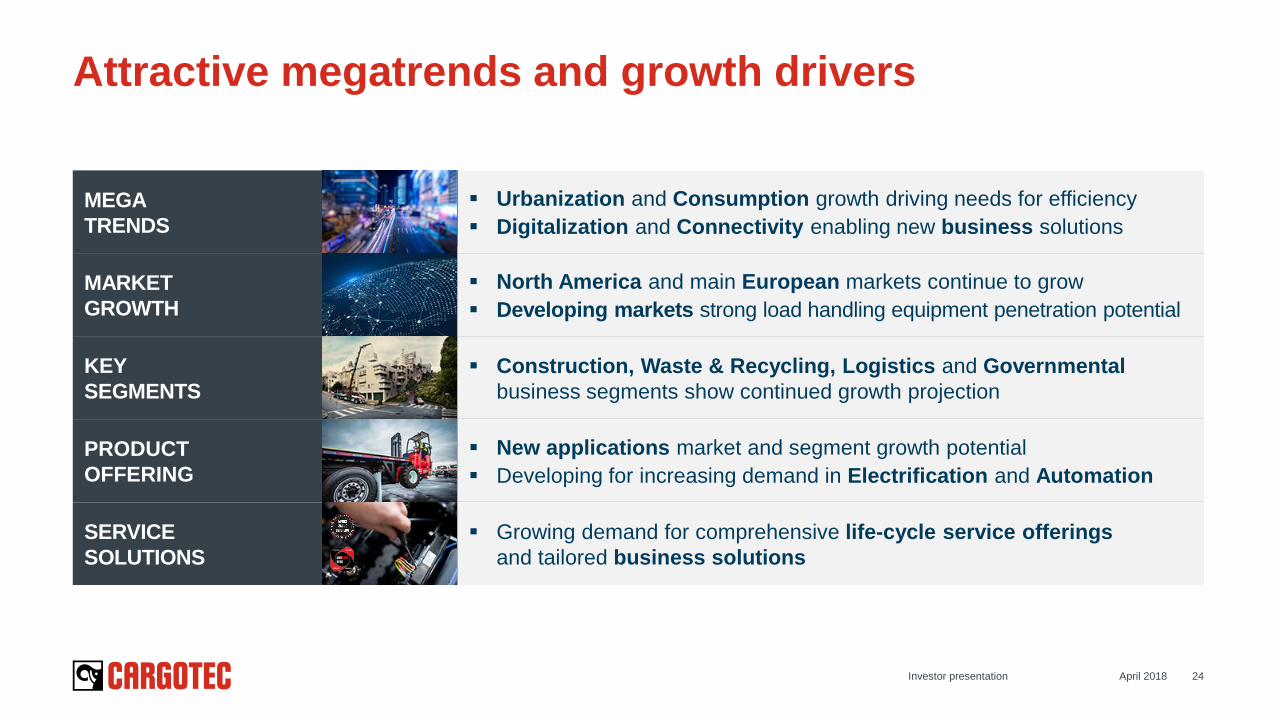
Urbanization and Consumption growth driving needs for efficiency
Digitalization and Connectivity enabling new business solutions
North America and main European markets continue to grow
Developing markets strong load handling equipment penetration potential
Construction, Waste & Recycling, Logistics and Governmental
business segments show continued growth projection
New applications market and segment growth potential
Developing for increasing demand in Electrification and Automation
Growing demand for comprehensive life-cycle service offerings
and tailored business solutions
Attractive megatrends and growth drivers
April 2018Investor presentation 24
MEGA
TRENDS
MARKET
GROWTH
KEY
SEGMENTS
PRODUCT
OFFERING
SERVICE
SOLUTIONS
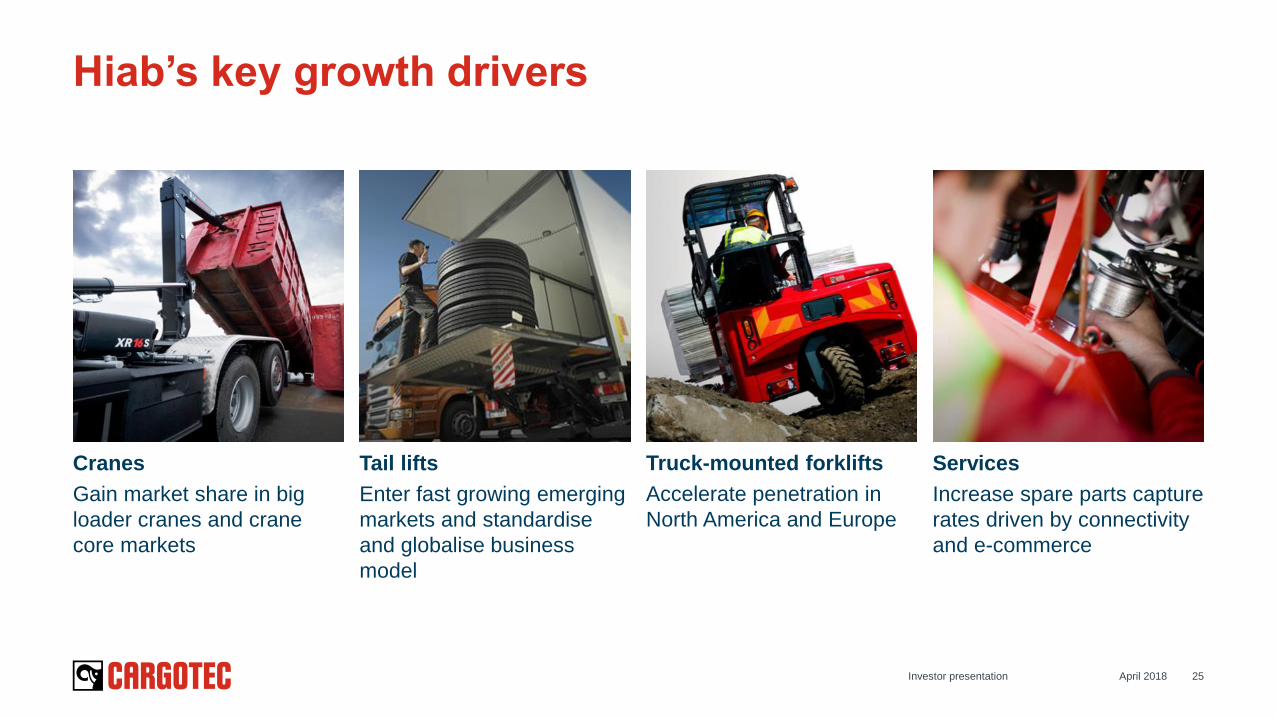
Hiab’s key growth drivers
April 2018Investor presentation 25
Cranes
Gain market share in big
loader cranes and crane
core markets
Tail lifts
Enter fast growing emerging
markets and standardise
and globalise business
model
Truck-mounted forklifts
Accelerate penetration in
North America and Europe
Services
Increase spare parts capture
rates driven by connectivity
and e-commerce
MacGregor
26
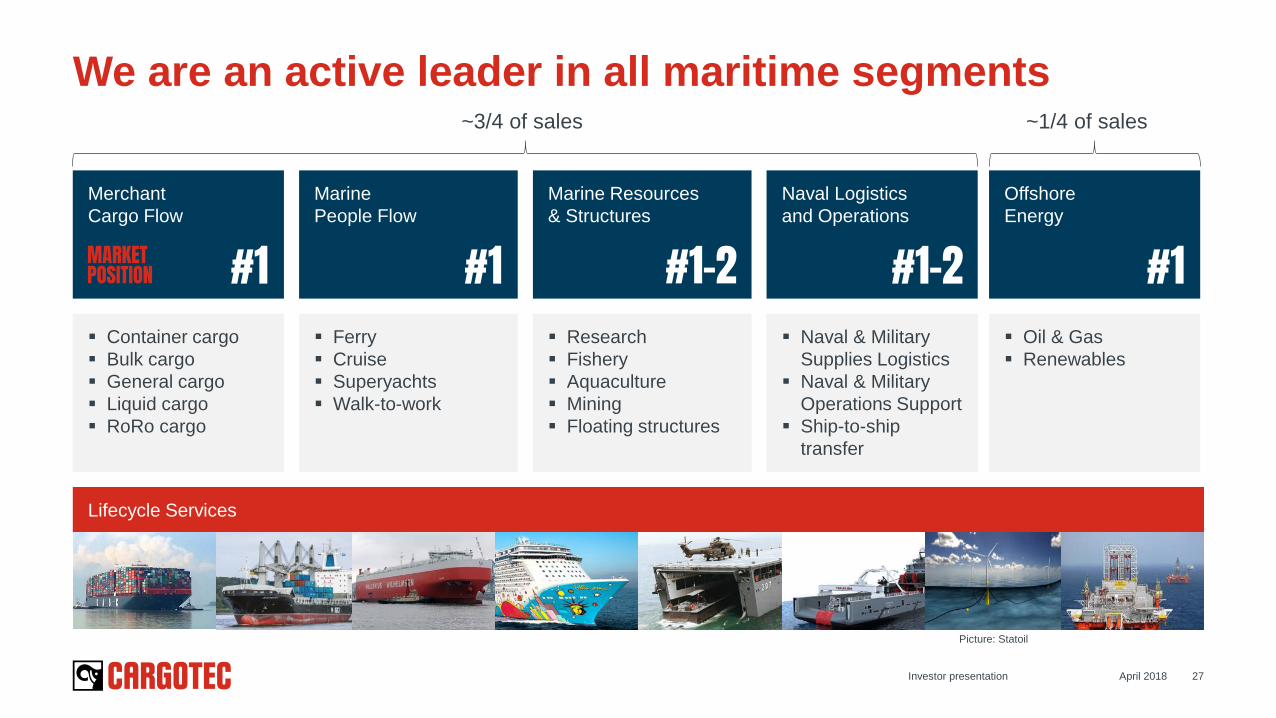
We are an active leader in all maritime segments
April 2018Investor presentation 27
Merchant
Cargo Flow
Marine
People Flow
Offshore
Energy
Marine Resources
& Structures
Naval Logistics
and Operations
Container cargo
Bulk cargo
General cargo
Liquid cargo
RoRo cargo
Ferry
Cruise
Superyachts
Walk-to-work
Oil & Gas
Renewables
Research
Fishery
Aquaculture
Mining
Floating structures
Naval & Military
Supplies Logistics
Naval & Military
Operations Support
Ship-to-ship
transfer
Lifecycle Services
Picture: Statoil
~3/4 of sales ~1/4 of sales
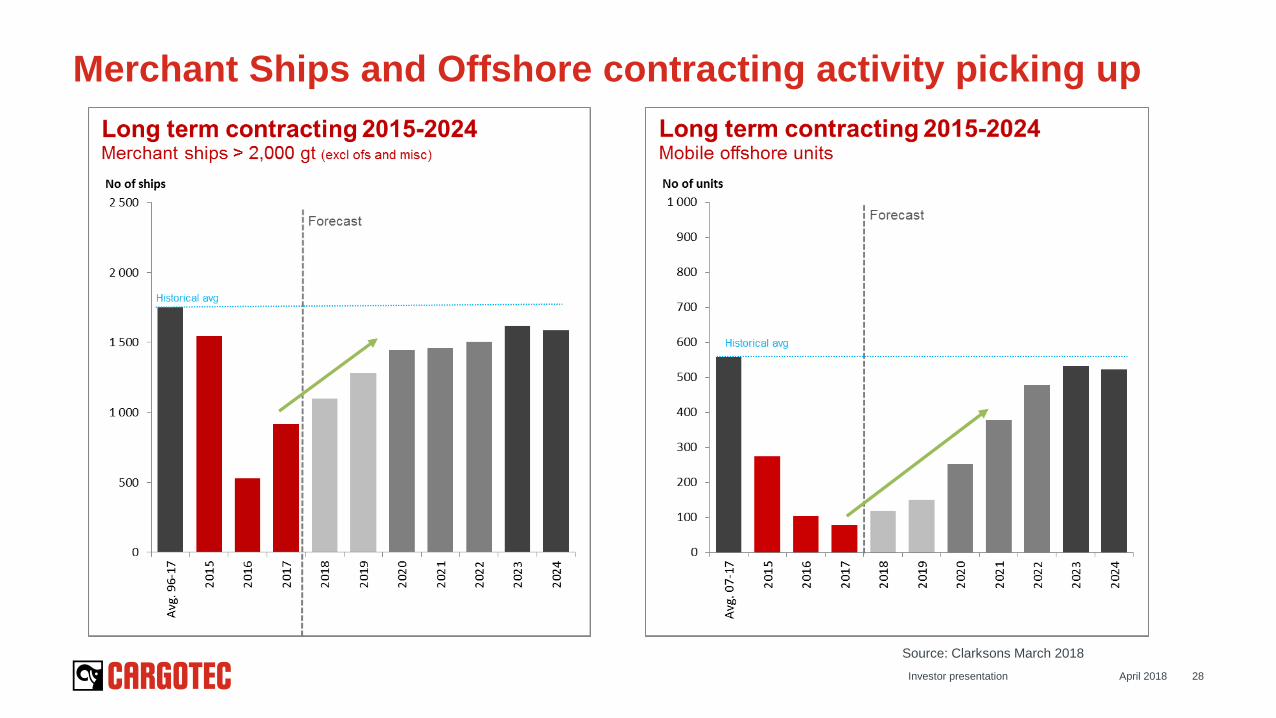
Merchant Ships and Offshore contracting activity picking up
Source: Clarksons March 2018
April 2018Investor presentation 28
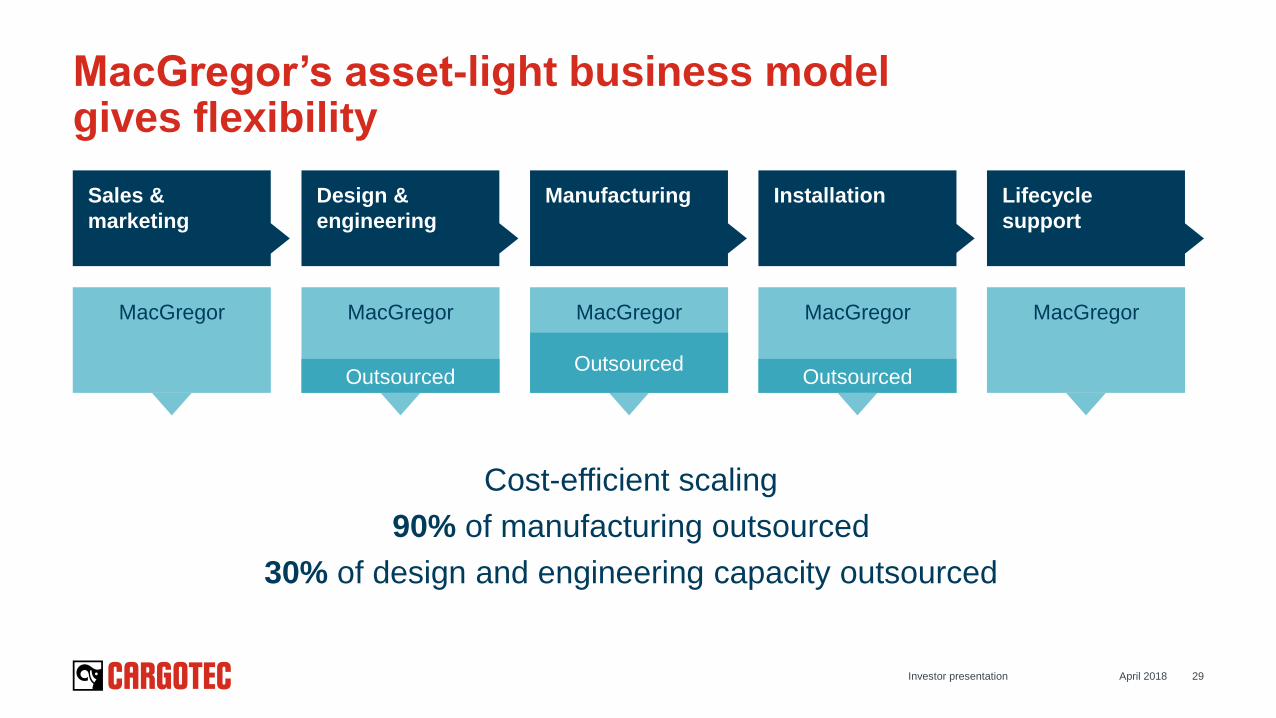
MacGregor’s asset-light business modelgives flexibility
April 2018Investor presentation 29
Sales &
marketing
Design &
engineering
Manufacturing Installation Lifecycle
support
MacGregor MacGregor MacGregor MacGregor MacGregor
OutsourcedOutsourced
Outsourced
Cost-efficient scaling
90% of manufacturing outsourced
30% of design and engineering capacity outsourced
Recent progress
30
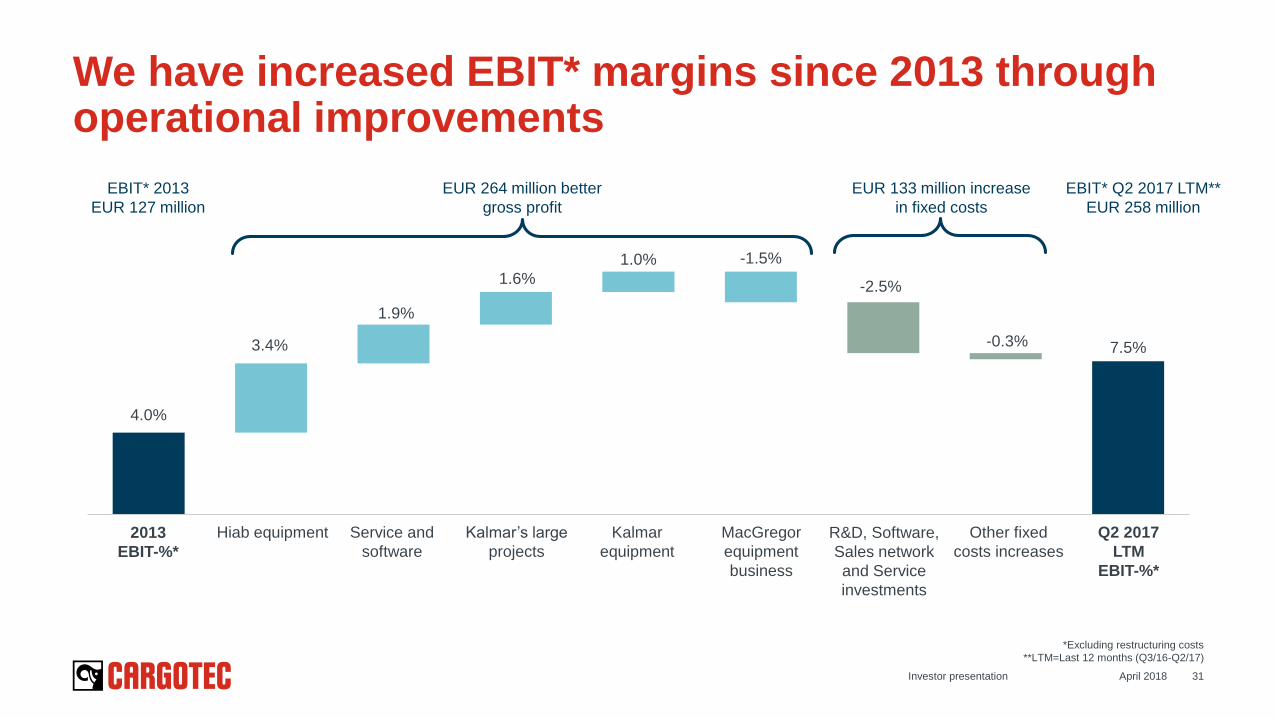
4.0%
7.5%3.4%
1.9%
1.6%
1.0% -1.5%
-2.5%
-0.3%
April 2018Investor presentation 31
We have increased EBIT* margins since 2013 through operational improvements
*Excluding restructuring costs
**LTM=Last 12 months (Q3/16-Q2/17)
2013
EBIT-%*
Hiab equipment Service and
software
Kalmar’s large
projects
Kalmar
equipment
MacGregor
equipment
business
R&D, Software,
Sales network
and Service
investments
Other fixed
costs increases
Q2 2017
LTM
EBIT-%*
EBIT* 2013
EUR 127 million
EUR 264 million better
gross profit
EUR 133 million increase
in fixed costs
EBIT* Q2 2017 LTM**
EUR 258 million
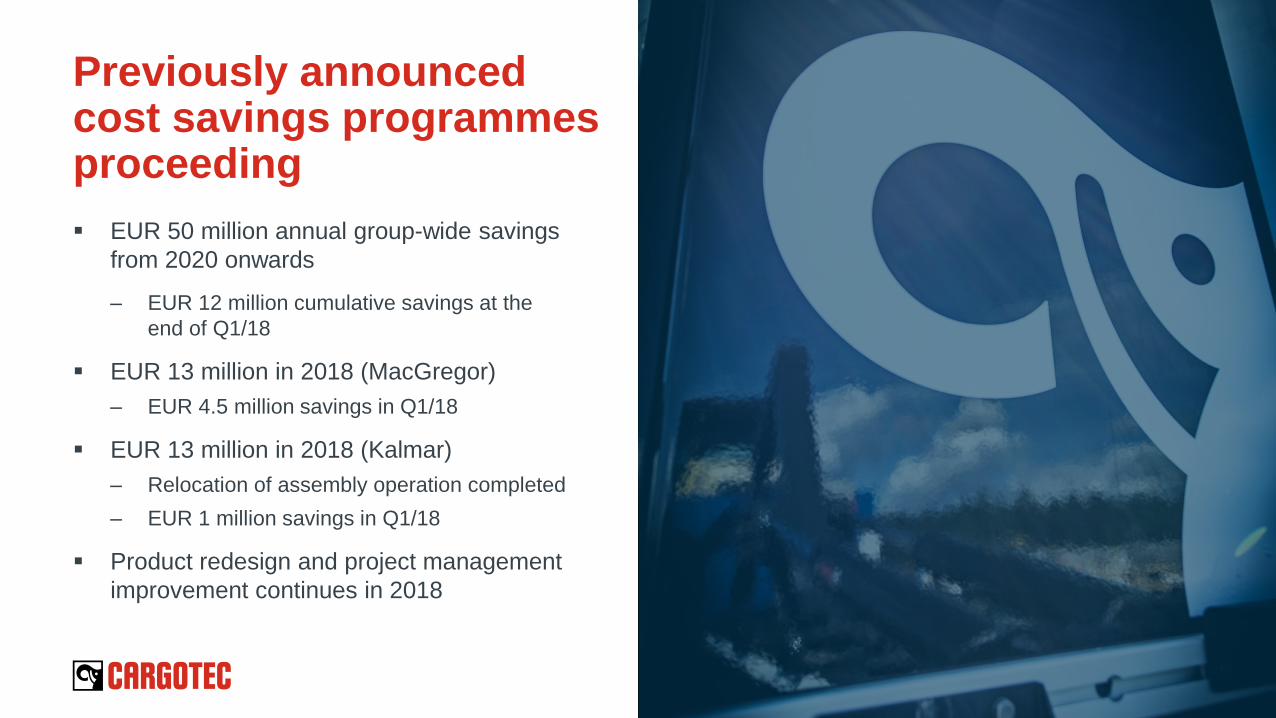
EUR 50 million annual group-wide savings
from 2020 onwards
– EUR 12 million cumulative savings at the
end of Q1/18
EUR 13 million in 2018 (MacGregor)
– EUR 4.5 million savings in Q1/18
EUR 13 million in 2018 (Kalmar)
– Relocation of assembly operation completed
– EUR 1 million savings in Q1/18
Product redesign and project management
improvement continues in 2018
Previously announced cost savings programmes proceeding
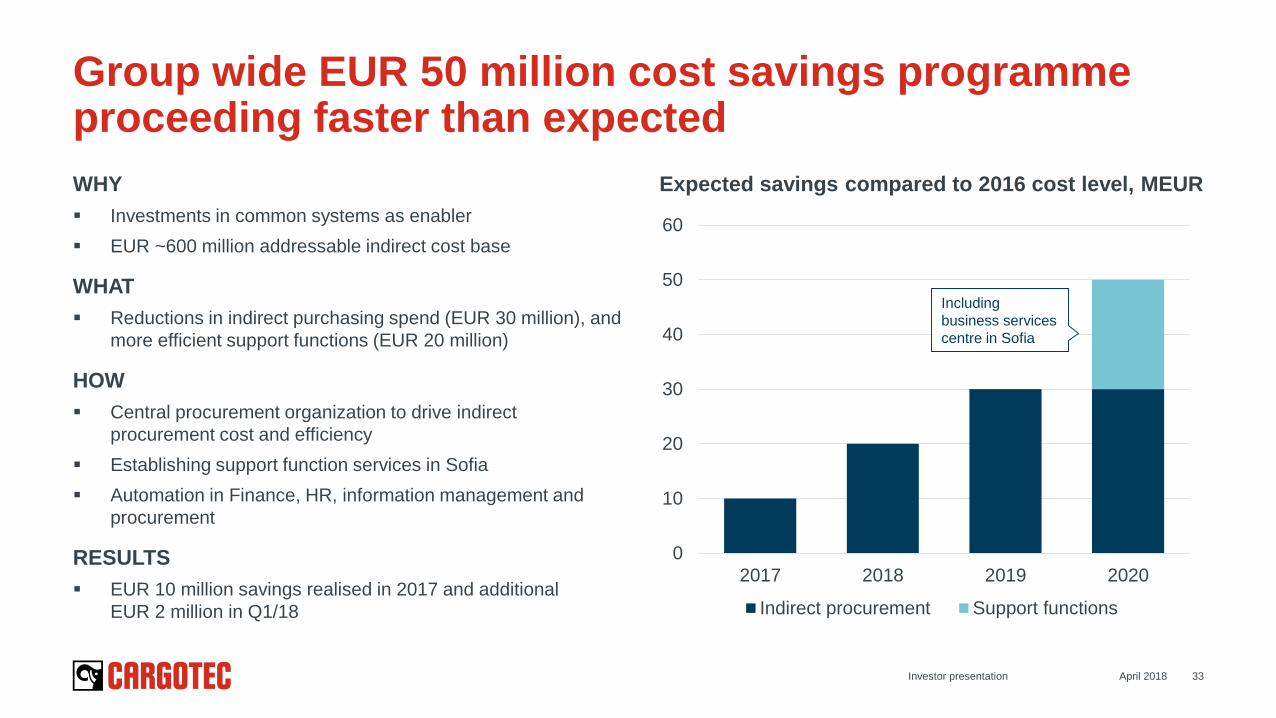
WHY
Investments in common systems as enabler
EUR ~600 million addressable indirect cost base
WHAT
Reductions in indirect purchasing spend (EUR 30 million), and
more efficient support functions (EUR 20 million)
HOW
Central procurement organization to drive indirect
procurement cost and efficiency
Establishing support function services in Sofia
Automation in Finance, HR, information management and
procurement
RESULTS
EUR 10 million savings realised in 2017 and additional
EUR 2 million in Q1/18
0
10
20
30
40
50
60
2017 2018 2019 2020
Indirect procurement Support functions
April 2018Investor presentation 33
Group wide EUR 50 million cost savings programme proceeding faster than expected
Expected savings compared to 2016 cost level, MEUR
Including
business services
centre in Sofia
Savings from consolidation, outsourcing of
certain activities, labour arbitrage and robotics
Scope: Finance, Human Resources,
Information Management and Indirect
Procurement services primarily from Sofia,
Bulgaria
Good progress in establishing Cargotec
Business Services
– Cargotec Business Service (CBS) centre in Sofia,
Bulgaria officially opened 30 January 2018
April 2018Investor presentation 34
We have established Cargotec Business Services in Sofia to improve support function efficiency by EUR 20 million
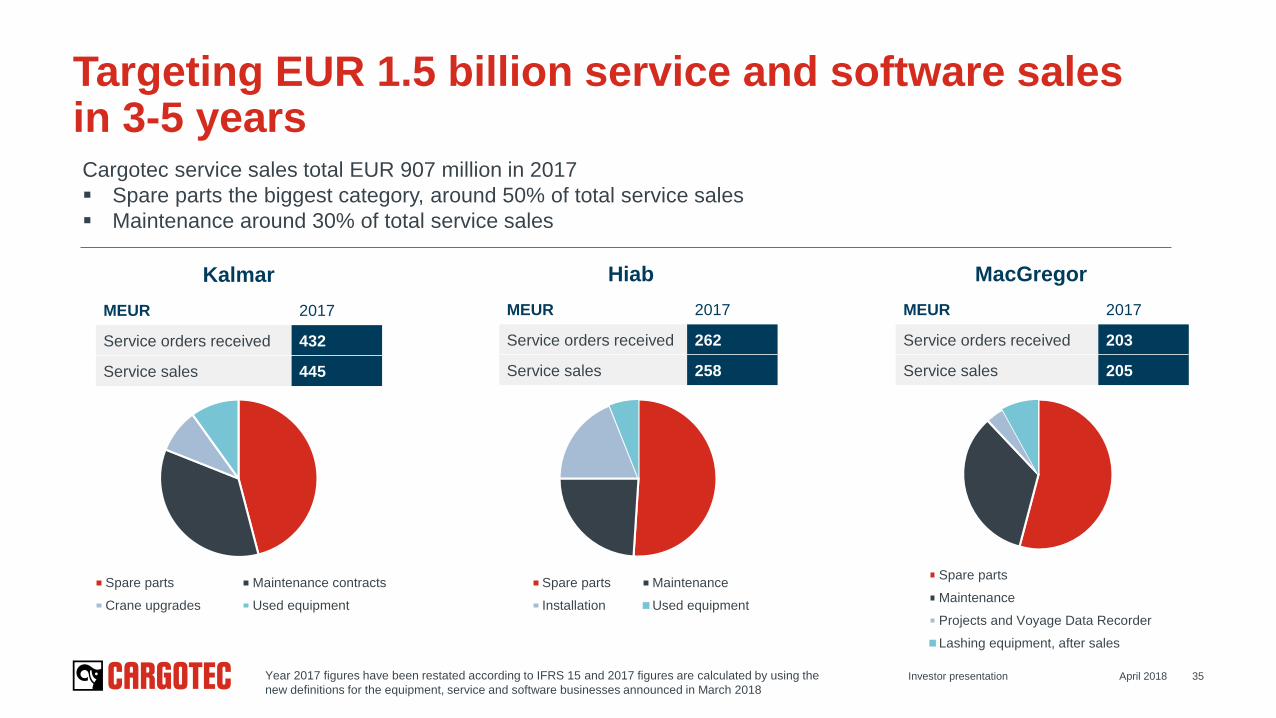
Targeting EUR 1.5 billion service and software sales in 3-5 years
April 2018Investor presentation 35
Spare parts Maintenance contracts
Crane upgrades Used equipment
Spare parts Maintenance
Installation Used equipment
Spare parts
Maintenance
Projects and Voyage Data Recorder
Lashing equipment, after sales
Cargotec service sales total EUR 907 million in 2017
Spare parts the biggest category, around 50% of total service sales
Maintenance around 30% of total service sales
MEUR 2017
Service orders received 432
Service sales 445
Kalmar
MEUR 2017
Service orders received 262
Service sales 258
Hiab
MEUR 2017
Service orders received 203
Service sales 205
MacGregor
Year 2017 figures have been restated according to IFRS 15 and 2017 figures are calculated by using the
new definitions for the equipment, service and software businesses announced in March 2018
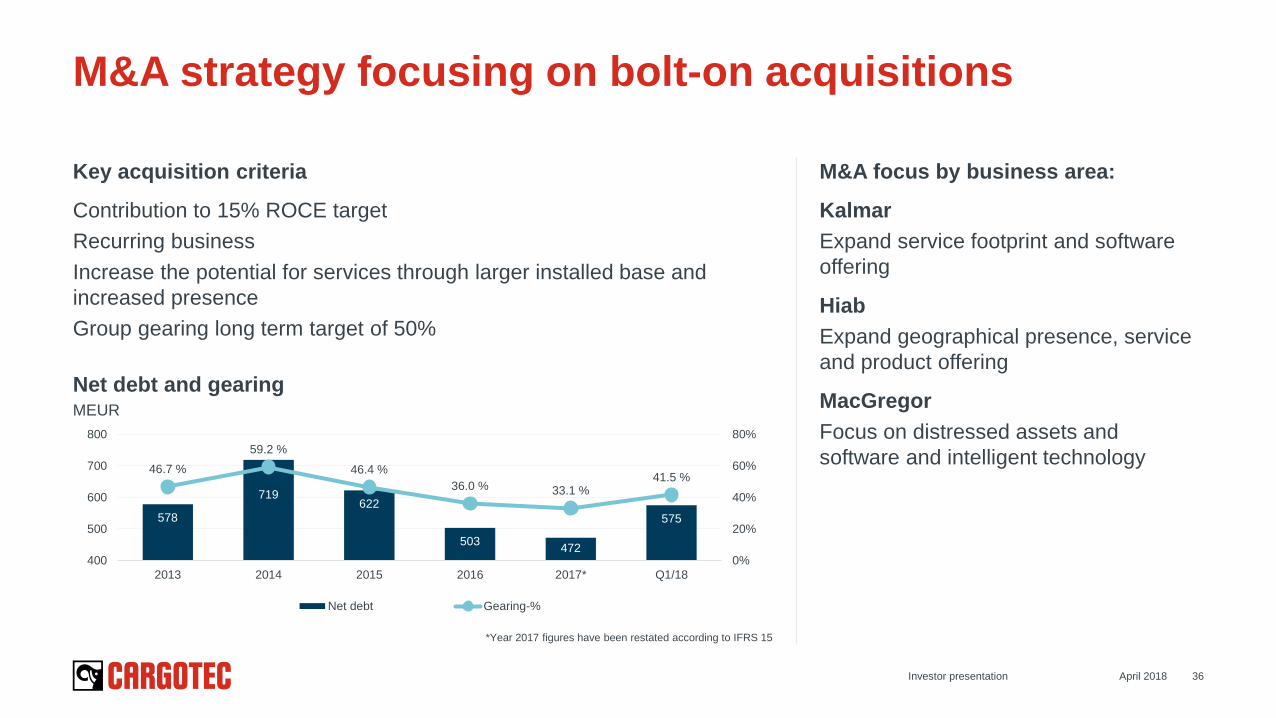
M&A strategy focusing on bolt-on acquisitions
April 2018Investor presentation 36
M&A focus by business area:
Kalmar
Expand service footprint and software
offering
Hiab
Expand geographical presence, service
and product offering
MacGregor
Focus on distressed assets and
software and intelligent technology
578
719622
503472
575
46.7 %
59.2 %
46.4 %
36.0 % 33.1 %41.5 %
0%
20%
40%
60%
80%
400
500
600
700
800
2013 2014 2015 2016 2017* Q1/18
Net debt Gearing-%
Net debt and gearingMEUR
Key acquisition criteria
Contribution to 15% ROCE target
Recurring business
Increase the potential for services through larger installed base and
increased presence
Group gearing long term target of 50%
*Year 2017 figures have been restated according to IFRS 15
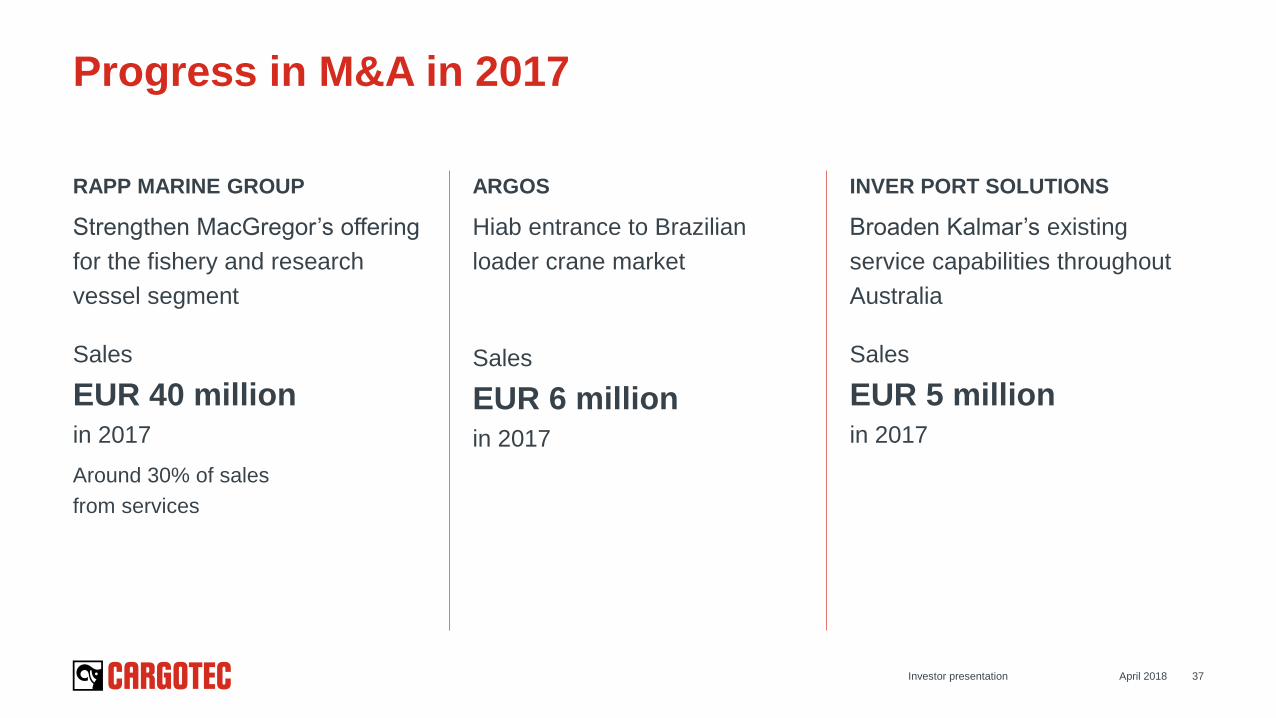
RAPP MARINE GROUP
Strengthen MacGregor’s offering
for the fishery and research
vessel segment
Sales
EUR 40 millionin 2017
Around 30% of sales
from services
INVER PORT SOLUTIONS
Broaden Kalmar’s existing
service capabilities throughout
Australia
Sales
EUR 5 millionin 2017
April 2018Investor presentation 37
Progress in M&A in 2017
ARGOS
Hiab entrance to Brazilian
loader crane market
Sales
EUR 6 millionin 2017
Combination of two highly complementary businesses producing greater scale and
diversification
▪ By acquiring TTS marine and offshore business, Cargotec will strengthen MacGregor's portfolio
and market position in key areas in cargo and load handling markets
The acquisition will strengthen MacGregor’s service growth potential and service installed
base
Position in China through strategic joint ventures with Chinese state owned ship building
companies
Unlocking potential significant synergies
▪ Based on preliminary estimates, potential cost synergies are estimated to be around EUR 30-35
million on annual level and are expected to be reached within 3 years from closing
Acquisition of TTS marine and offshore business announced 8 February 2018
Strategic rationale
38
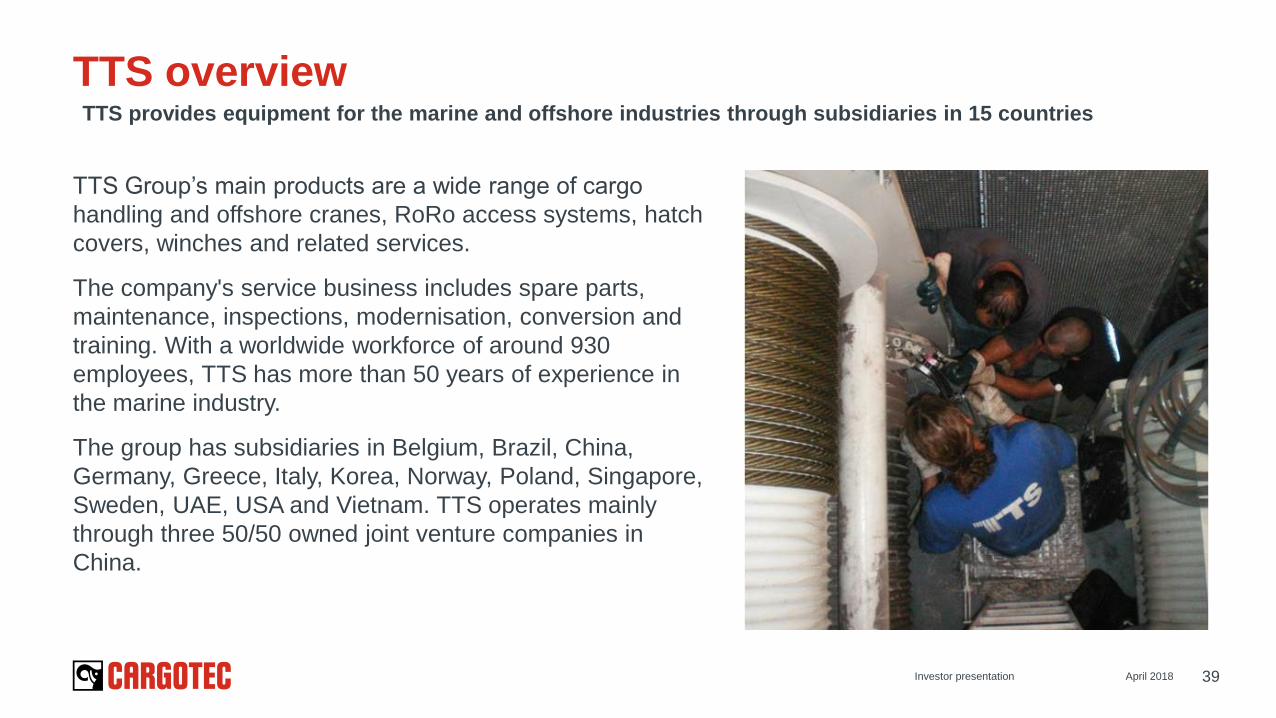
TTS Group’s main products are a wide range of cargo
handling and offshore cranes, RoRo access systems, hatch
covers, winches and related services.
The company's service business includes spare parts,
maintenance, inspections, modernisation, conversion and
training. With a worldwide workforce of around 930
employees, TTS has more than 50 years of experience in
the marine industry.
The group has subsidiaries in Belgium, Brazil, China,
Germany, Greece, Italy, Korea, Norway, Poland, Singapore,
Sweden, UAE, USA and Vietnam. TTS operates mainly
through three 50/50 owned joint venture companies in
China.
TTS overviewTTS provides equipment for the marine and offshore industries through subsidiaries in 15 countries
April 2018Investor presentation 39
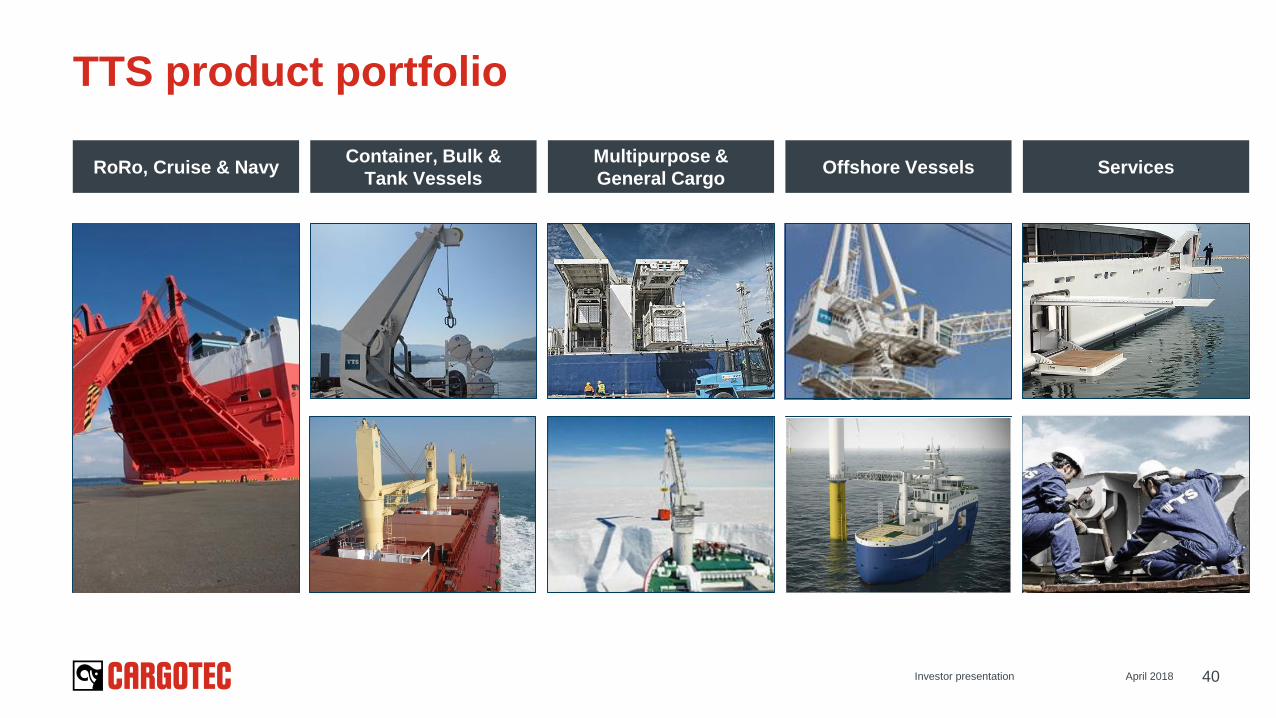
TTS product portfolio
RoRo, Cruise & NavyContainer, Bulk &
Tank Vessels
Multipurpose &
General CargoOffshore Vessels Services
April 2018Investor presentation 40
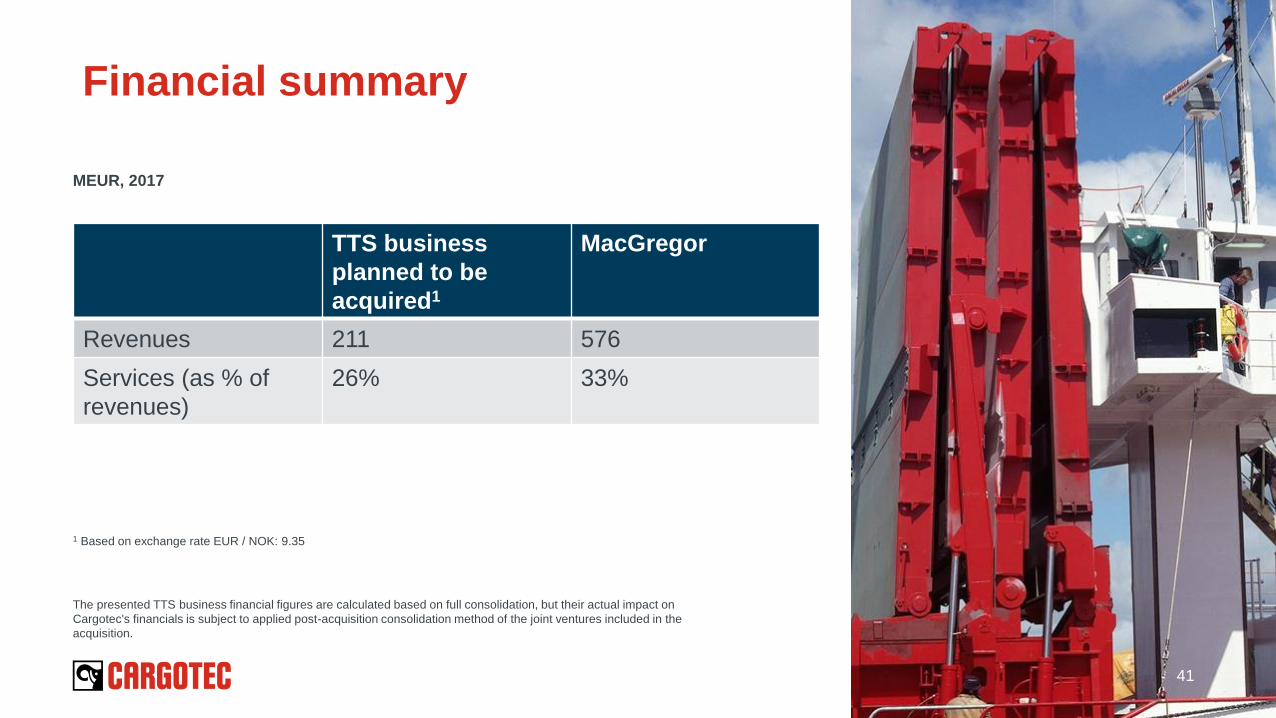
MEUR, 2017
Financial summary
Image: Espen Rønnevik, Woldcam / Statoil
1 Based on exchange rate EUR / NOK: 9.35
The presented TTS business financial figures are calculated based on full consolidation, but their actual impact on
Cargotec's financials is subject to applied post-acquisition consolidation method of the joint ventures included in the
acquisition.
41
TTS business
planned to be
acquired1
MacGregor
Revenues 211 576
Services (as % of
revenues)
26% 33%

Transaction highlights
Acquisition of TTS business
▪ TTS Group ASA and its
shipyard solution business, TTS
Syncrolift AS, are excluded from
the deal
Only certain HQ costs will be
assumed
Total consideration of EUR 87m on
a debt free / cash free basis, with
customary closing adjustments
More than 2/3 of TTS shareholders
supports the transaction and have
committed to vote in favor of the
deal in TTS Group’s Extraordinary
General Meeting. Furthermore,
more than 2/3 of convertible
bondholders have made the same
commitment, if any of their bonds
are converted to shares prior to the
Extraordinary General Meeting
The acquisition is subject to
regulatory approvals from
competition authorities, which are
expected to be received during the
third quarter of 2018
Transaction consideration will be
covered by Cargotec’s available
cash and financing
Transaction terms and
structureFinancing Deal certainty and timing
April 2018Investor presentation 42
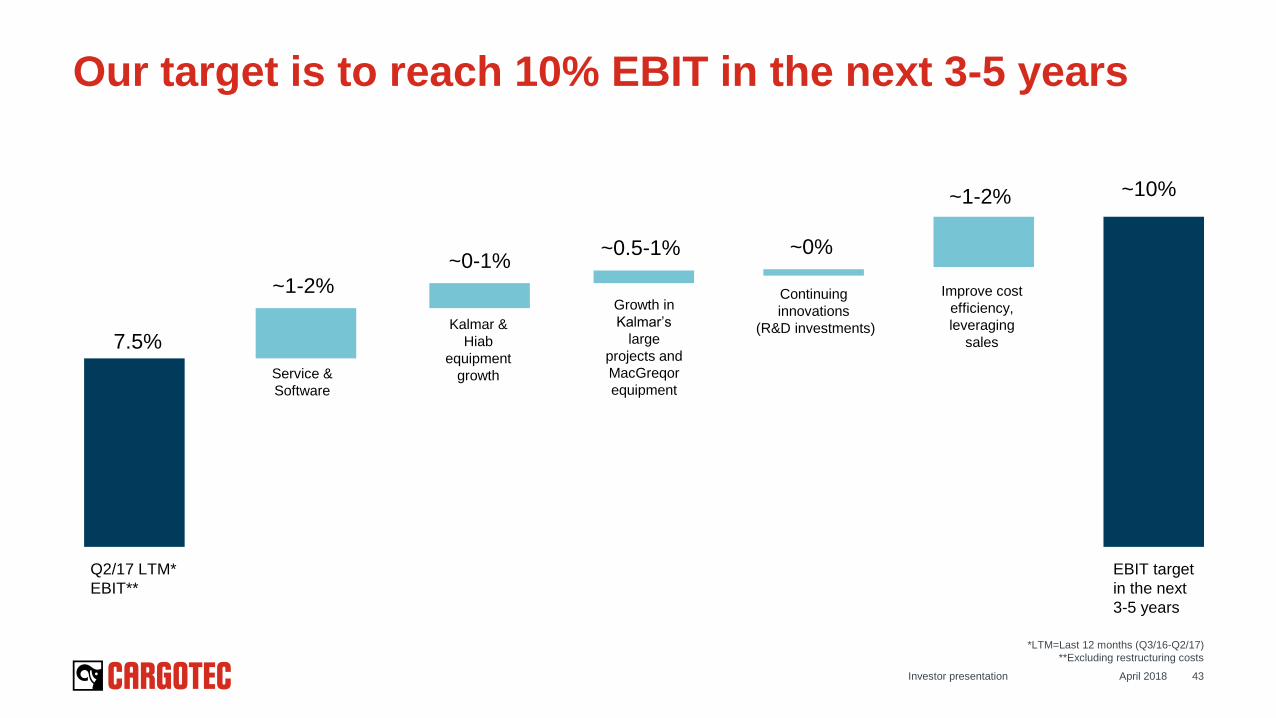
Our target is to reach 10% EBIT in the next 3-5 years
April 2018 43
Q2/17 LTM*
EBIT**
7.5%
Service &
Software
Kalmar &
Hiab
equipment
growth
Growth in
Kalmar’s
large
projects and
MacGreqor
equipment
Continuing
innovations
(R&D investments)
Improve cost
efficiency,
leveraging
sales
~10%
EBIT target
in the next
3-5 years
~1-2%
~0-1%~0.5-1% ~0%
~1-2%
Investor presentation
*LTM=Last 12 months (Q3/16-Q2/17)
**Excluding restructuring costs
April 2018Investor presentation 44
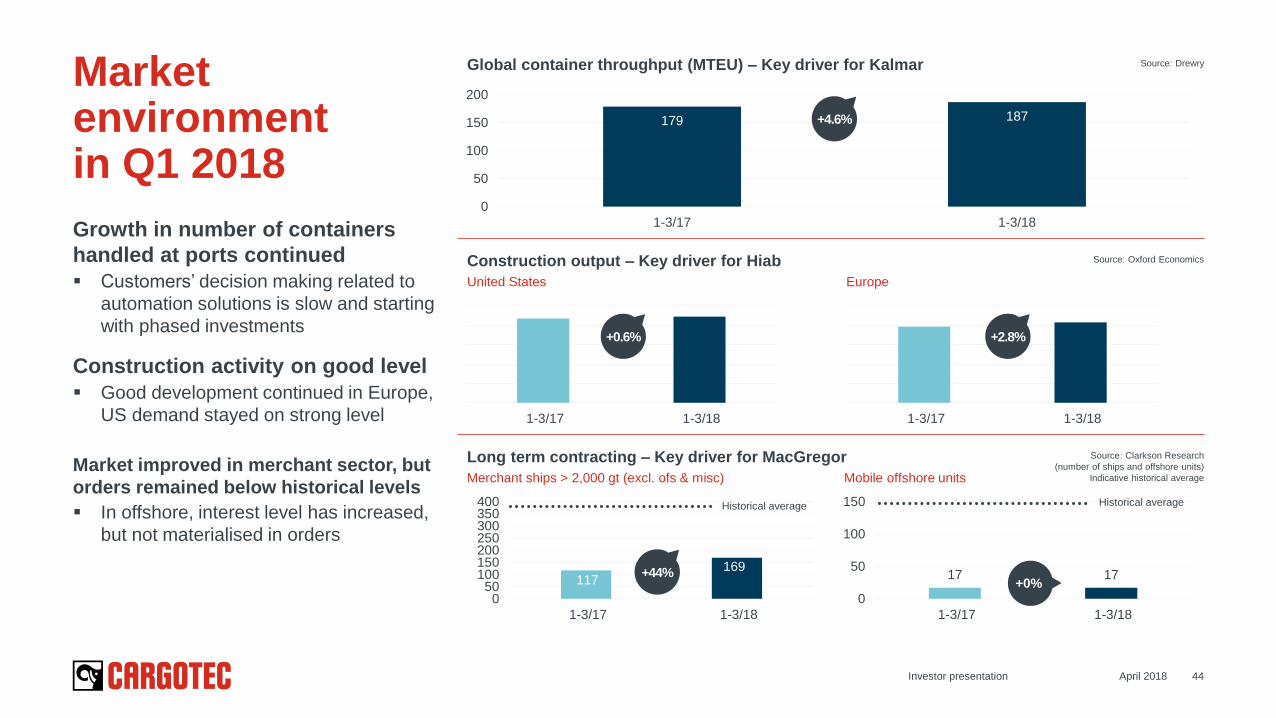
Growth in number of containers
handled at ports continued
Customers’ decision making related to
automation solutions is slow and starting
with phased investments
Construction activity on good level
Good development continued in Europe,
US demand stayed on strong level
Market improved in merchant sector, but
orders remained below historical levels
In offshore, interest level has increased,
but not materialised in orders
Market environmentin Q1 2018
Source: Clarkson Research
(number of ships and offshore units)
Indicative historical average
117169
050
100150200250300350400
1-3/17 1-3/18
17 17
0
50
100
150
1-3/17 1-3/18
1-3/17 1-3/18 1-3/17 1-3/18
179 187
0
50
100
150
200
1-3/17 1-3/18
Long term contracting – Key driver for MacGregor
Construction output – Key driver for Hiab
Global container throughput (MTEU) – Key driver for Kalmar
Merchant ships > 2,000 gt (excl. ofs & misc) Mobile offshore units
United States Europe
Source: Oxford Economics
Source: Drewry
+0.6% +2.8%
+4.6%
Historical average Historical average
+44%+0%
45
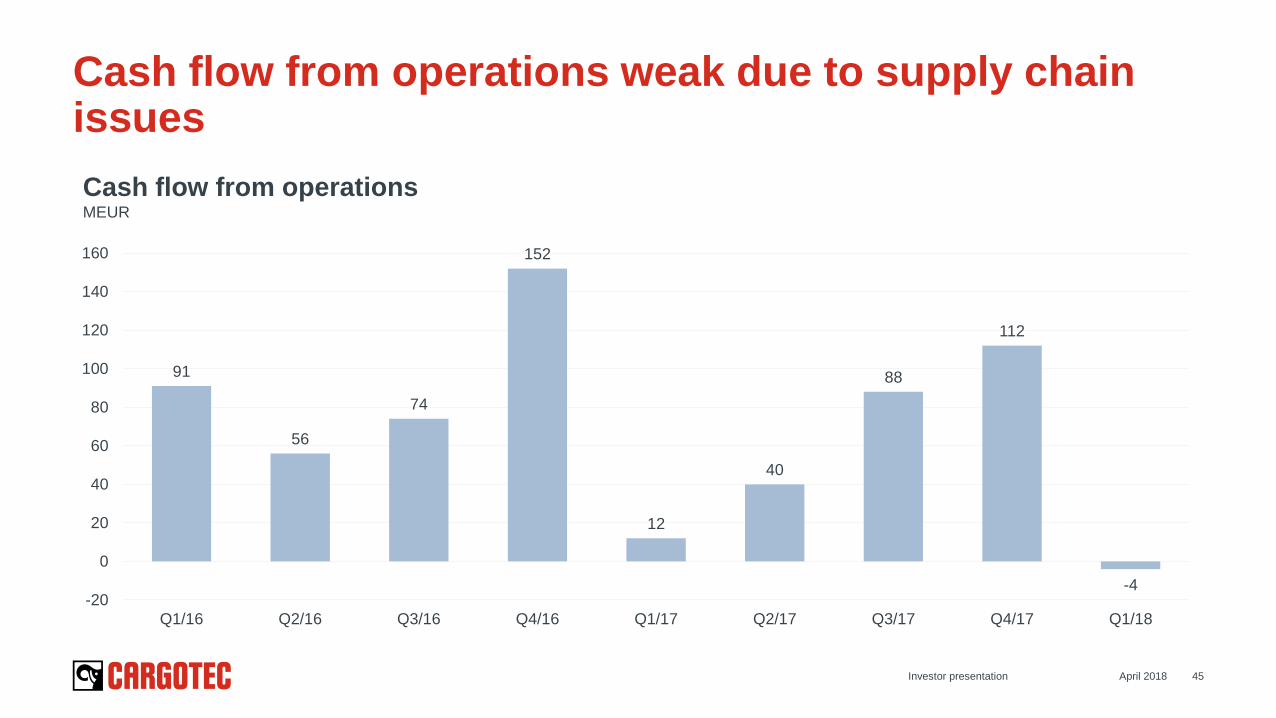
Cash flow from operations weak due to supply chain issues
91
56
74
152
12
40
88
112
-4-20
0
20
40
60
80
100
120
140
160
Q1/16 Q2/16 Q3/16 Q4/16 Q1/17 Q2/17 Q3/17 Q4/17 Q1/18
April 2018Investor presentation
Cash flow from operationsMEUR
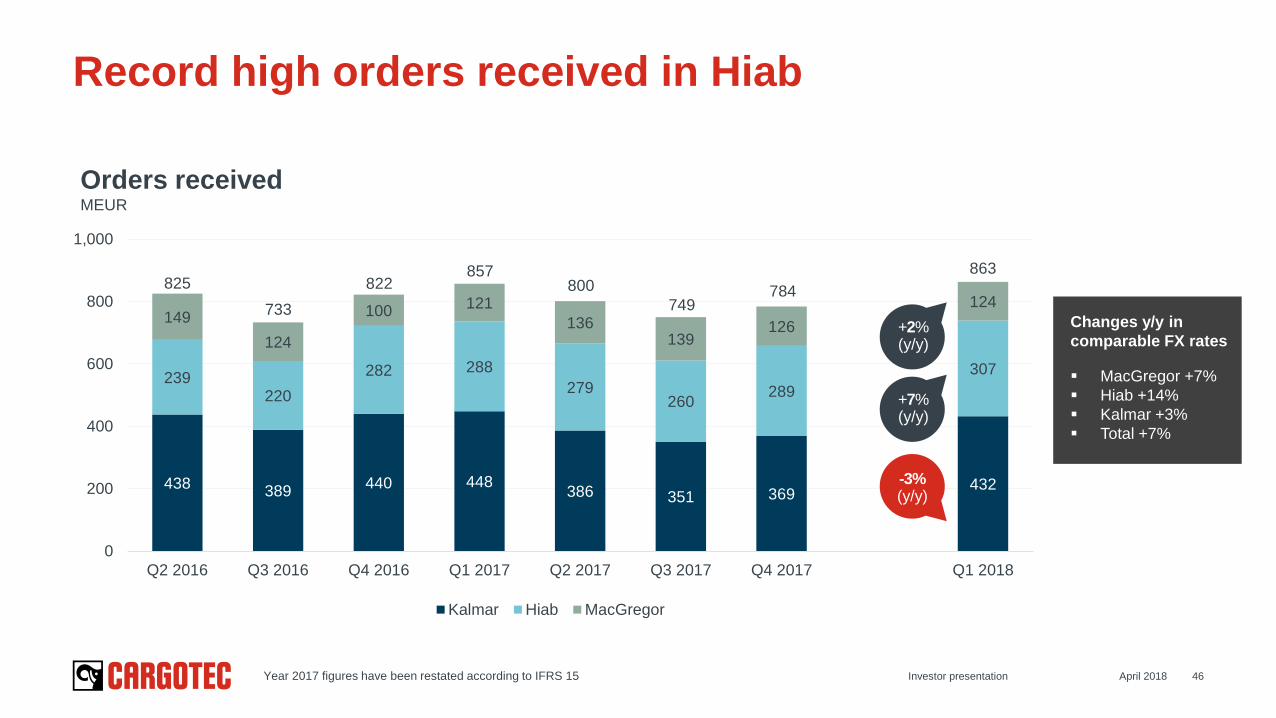
438389
440 448386 351 369
432
239220
282 288
279260
289
307
149
124
100121
136139
126
124
0
200
400
600
800
1,000
Q2 2016 Q3 2016 Q4 2016 Q1 2017 Q2 2017 Q3 2017 Q4 2017 Q1 2018
Kalmar Hiab MacGregor
46
Record high orders received in Hiab
825
733
822
April 2018Investor presentation
Orders receivedMEUR
857800
749784
-3%(y/y)
+7%(y/y)
863
Year 2017 figures have been restated according to IFRS 15
+2%(y/y)
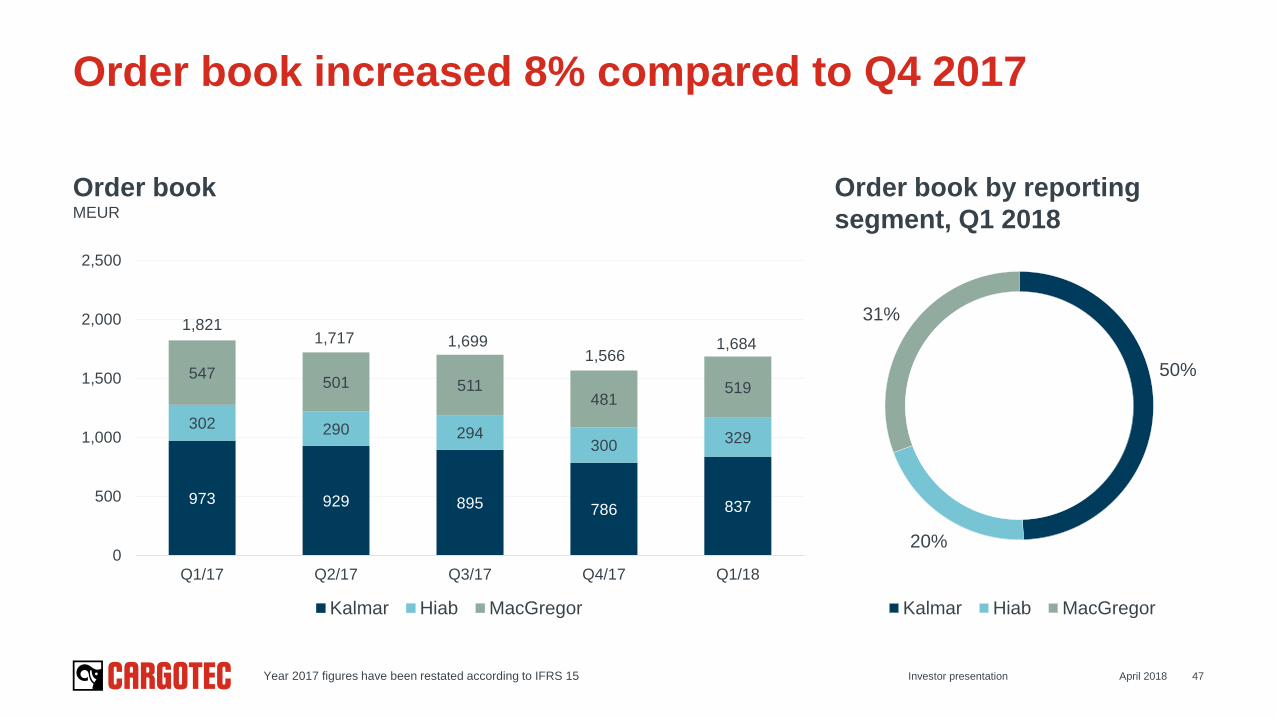
Changes y/y in
comparable FX rates
MacGregor +7%
Hiab +14%
Kalmar +3%
Total +7%
Order bookMEUR
April 2018Investor presentation 47
Order book increased 8% compared to Q4 2017
Order book by reporting
segment, Q1 2018
973 929 895 786 837
302 290 294300
329
547501 511
481519
0
500
1,000
1,500
2,000
2,500
Q1/17 Q2/17 Q3/17 Q4/17 Q1/18
Kalmar Hiab MacGregor
50%
20%
31%
Kalmar Hiab MacGregor
1,8211,717 1,699
1,5661,684
Year 2017 figures have been restated according to IFRS 15
SalesMEUR
Operating profit*MEUR
48
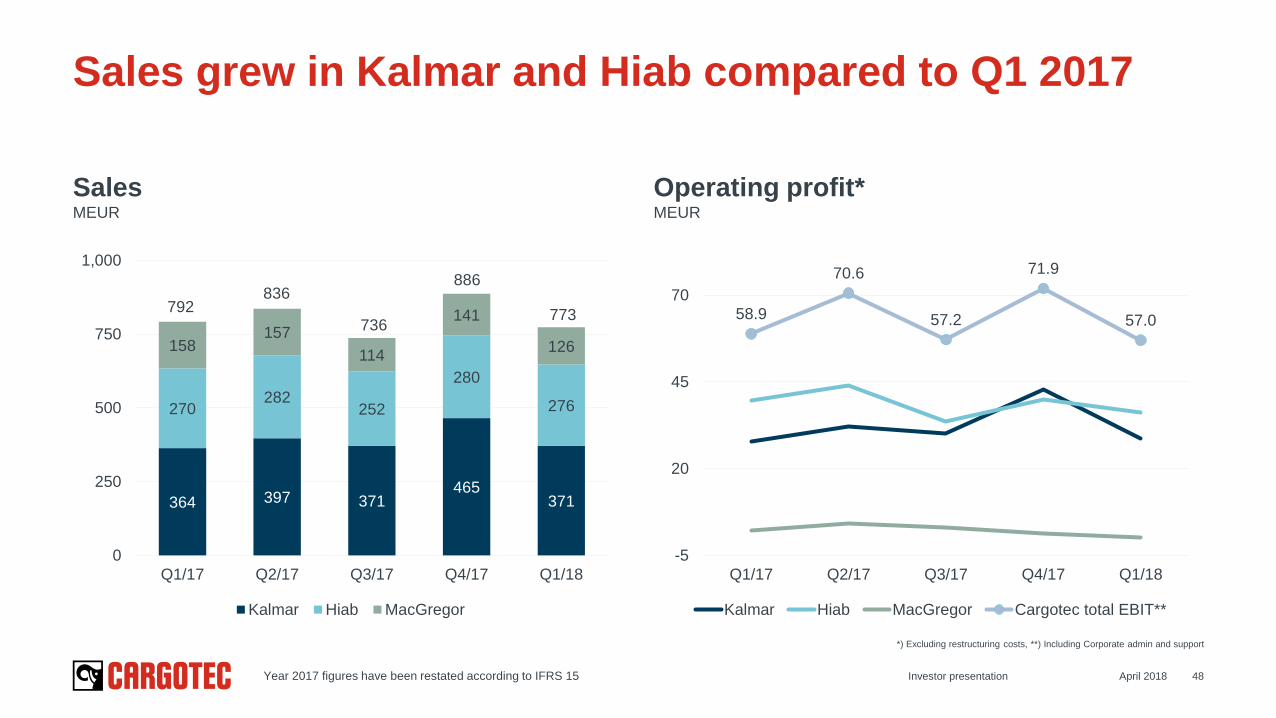
Sales grew in Kalmar and Hiab compared to Q1 2017
364 397 371465
371
270282
252
280
276
158157
114
141
126
0
250
500
750
1,000
Q1/17 Q2/17 Q3/17 Q4/17 Q1/18
Kalmar Hiab MacGregor
836
58.9
70.6
57.2
71.9
57.0
-5
20
45
70
Q1/17 Q2/17 Q3/17 Q4/17 Q1/18
Kalmar Hiab MacGregor Cargotec total EBIT**
*) Excluding restructuring costs, **) Including Corporate admin and support
April 2018Investor presentation
792736
886
773
Year 2017 figures have been restated according to IFRS 15
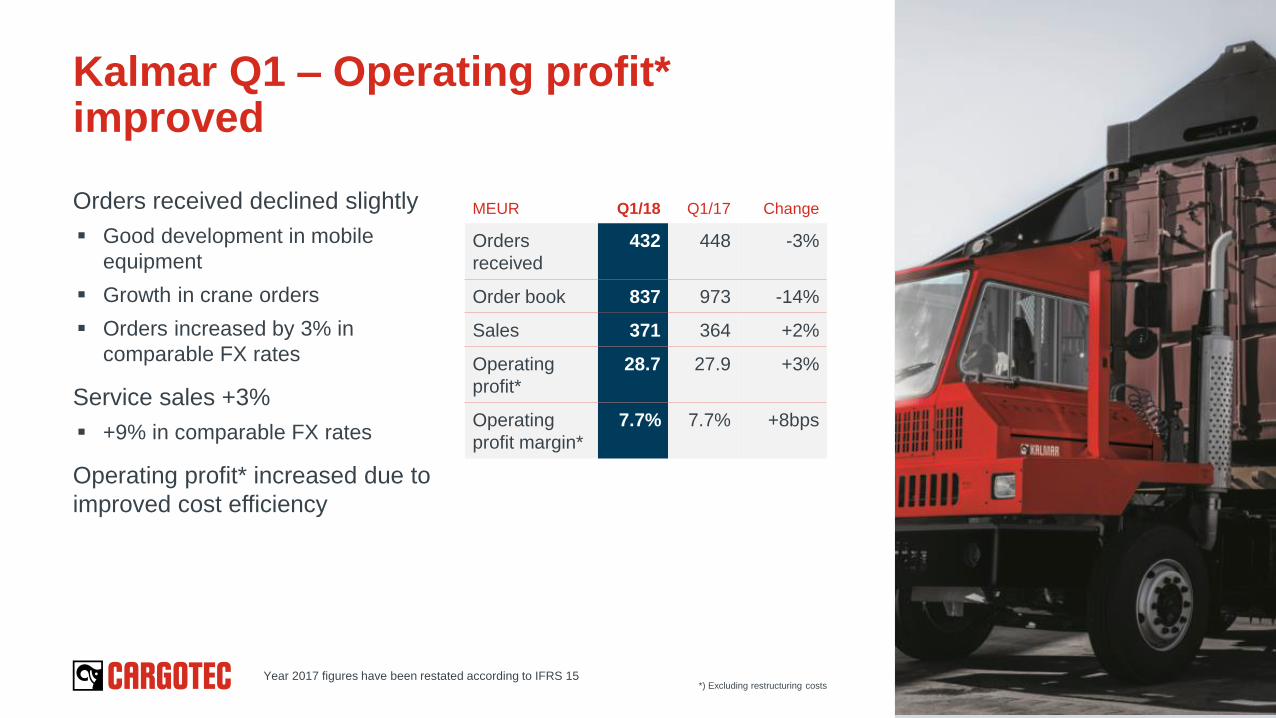
MEUR Q1/18 Q1/17 Change
Orders
received
432 448 -3%
Order book 837 973 -14%
Sales 371 364 +2%
Operating
profit*
28.7 27.9 +3%
Operating
profit margin*
7.7% 7.7% +8bps
Orders received declined slightly
Good development in mobile
equipment
Growth in crane orders
Orders increased by 3% in
comparable FX rates
Service sales +3%
+9% in comparable FX rates
Operating profit* increased due to
improved cost efficiency
Kalmar Q1 – Operating profit* improved
*) Excluding restructuring costsYear 2017 figures have been restated according to IFRS 15
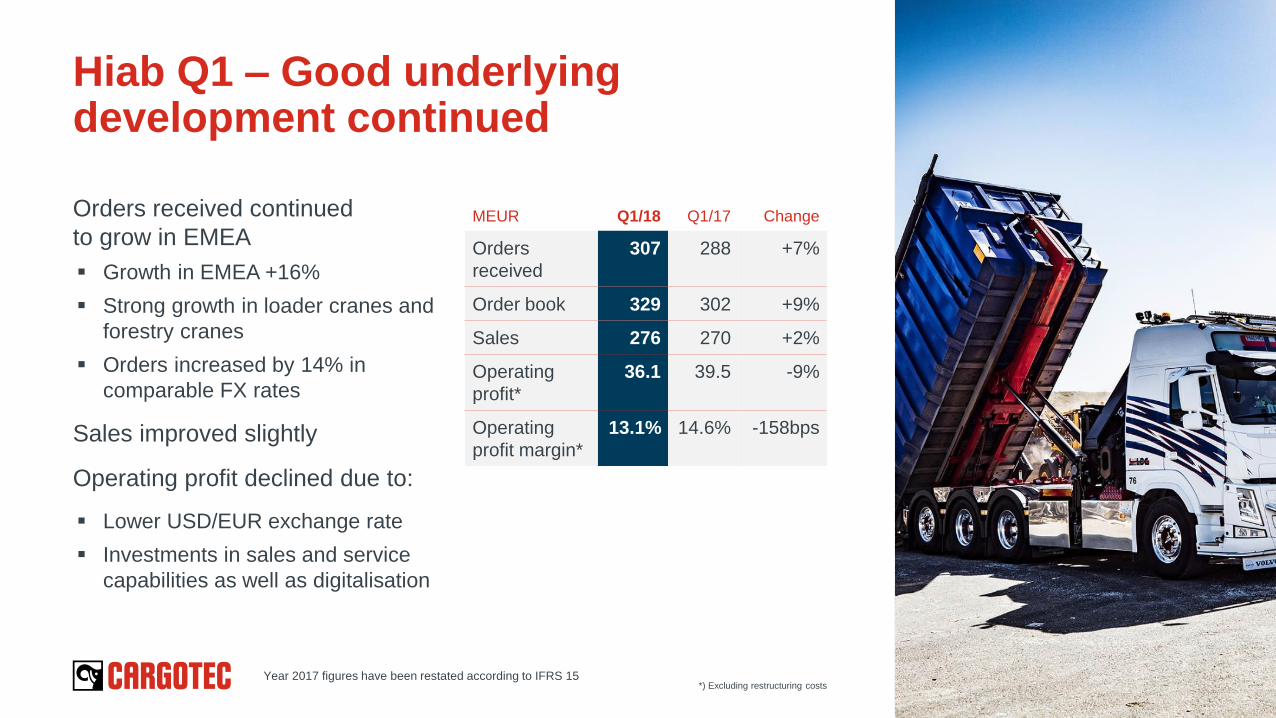
MEUR Q1/18 Q1/17 Change
Orders
received
307 288 +7%
Order book 329 302 +9%
Sales 276 270 +2%
Operating
profit*
36.1 39.5 -9%
Operating
profit margin*
13.1% 14.6% -158bps
Orders received continued
to grow in EMEA
Growth in EMEA +16%
Strong growth in loader cranes and
forestry cranes
Orders increased by 14% in
comparable FX rates
Sales improved slightly
Operating profit declined due to:
Lower USD/EUR exchange rate
Investments in sales and service
capabilities as well as digitalisation
Hiab Q1 – Good underlying development continued
*) Excluding restructuring costsYear 2017 figures have been restated according to IFRS 15

MEUR Q1/18 Q1/17 Change
Orders
received
124 121 +2%
Order book 519 547 -5%
Sales 126 158 -20%
Operating
profit*
0.2 2.2 -91%
Operating
profit margin*
0.2% 1.4% -123bps
Orders received grew in merchant
sector, offshore declined
No large single orders received
during the quarter
Orders increased by 7% in
comparable FX rates
Sales declined both in merchant
and offshore due to low delivery
volumes
Operating profit* decreased due to
lower sales
MacGregor Q1 – Turnaround takes time in long-lead business
*) Excluding restructuring costsYear 2017 figures have been restated according to IFRS 15
April 2018Investor presentation 52
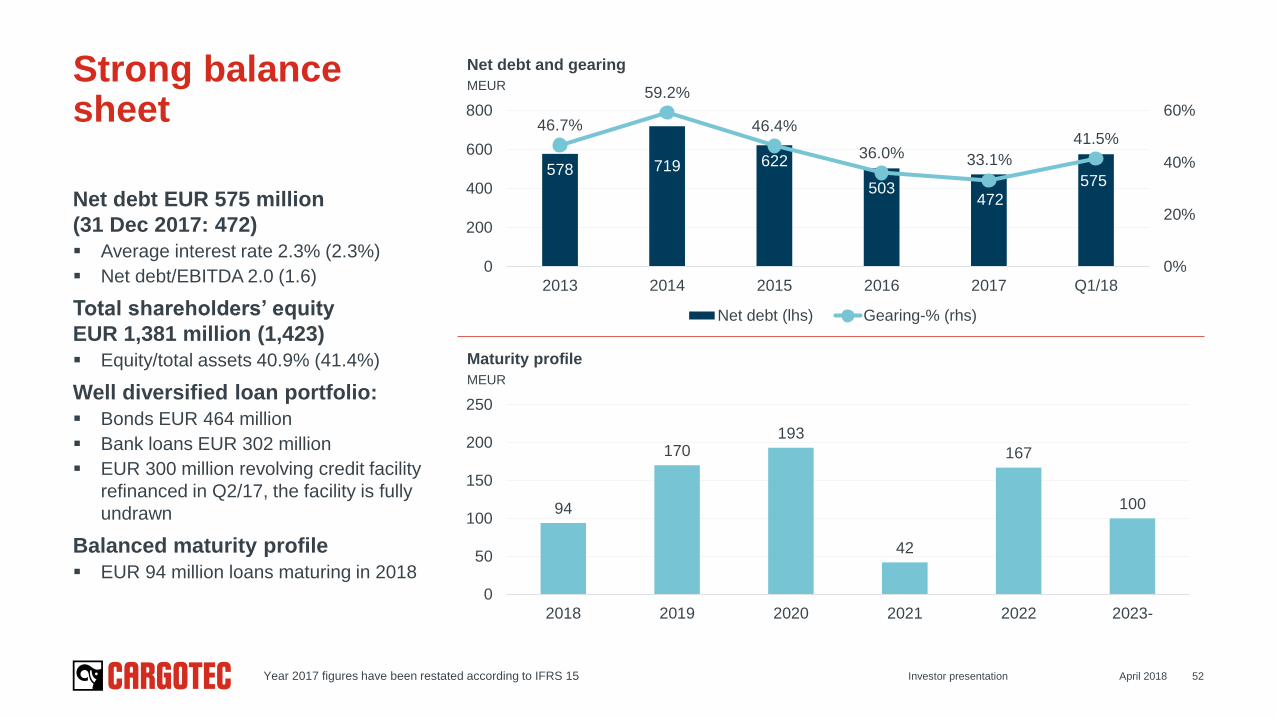
Net debt EUR 575 million
(31 Dec 2017: 472)
Average interest rate 2.3% (2.3%)
Net debt/EBITDA 2.0 (1.6)
Total shareholders’ equity
EUR 1,381 million (1,423)
Equity/total assets 40.9% (41.4%)
Well diversified loan portfolio:
Bonds EUR 464 million
Bank loans EUR 302 million
EUR 300 million revolving credit facility
refinanced in Q2/17, the facility is fully
undrawn
Balanced maturity profile
EUR 94 million loans maturing in 2018
Strong balance sheet
94
170193
42
167
100
0
50
100
150
200
250
2018 2019 2020 2021 2022 2023-
578 719 622
503472
575
46.7%
59.2%
46.4%
36.0%41.5%
0%
20%
40%
60%
0
200
400
600
800
2013 2014 2015 2016 2017 Q1/18
Net debt (lhs) Gearing-% (rhs)
Maturity profile
Net debt and gearing
MEUR
MEUR
Year 2017 figures have been restated according to IFRS 15
33.1%
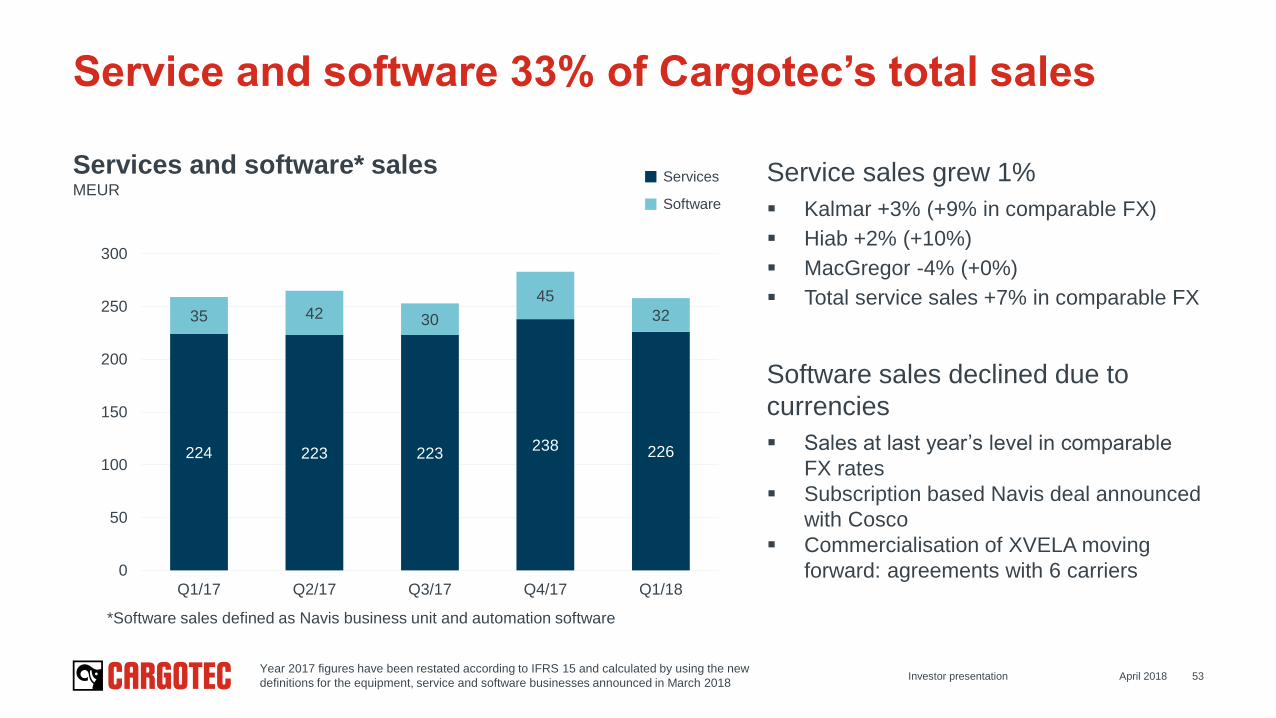
Services and software* salesMEUR
224 223 223238 226
35 42 30
45
32
0
50
100
150
200
250
300
Q1/17 Q2/17 Q3/17 Q4/17 Q1/18
Service sales grew 1%
Kalmar +3% (+9% in comparable FX)
Hiab +2% (+10%)
MacGregor -4% (+0%)
Total service sales +7% in comparable FX
Software sales declined due to
currencies
Sales at last year’s level in comparable
FX rates
Subscription based Navis deal announced
with Cosco
Commercialisation of XVELA moving
forward: agreements with 6 carriers
53
Service and software 33% of Cargotec’s total sales
April 2018Investor presentation
*Software sales defined as Navis business unit and automation software
Services
Software
Year 2017 figures have been restated according to IFRS 15 and calculated by using the new
definitions for the equipment, service and software businesses announced in March 2018
Outlook for 2018
Cargotec reiterates its outlook published on 8 February 2018 and expects its operating profit
excluding restructuring costs for 2018 to improve from 2017 (EUR 258.6 million, IFRS 15
restated).
April 2018Investor presentation 54
Appendix 1. Largest shareholders and financials
2. Sustainability
3. Kalmar
4. Hiab
5. MacGregor
April 2018Investor presentation 5555
14.1 %
12.3 %
10.5 %
3.0 %
60.1 %
Wipunen varainhallinta Oy Mariatorp Oy
Pivosto Oy KONE Foundation
Others
April 2018Investor presentation 56
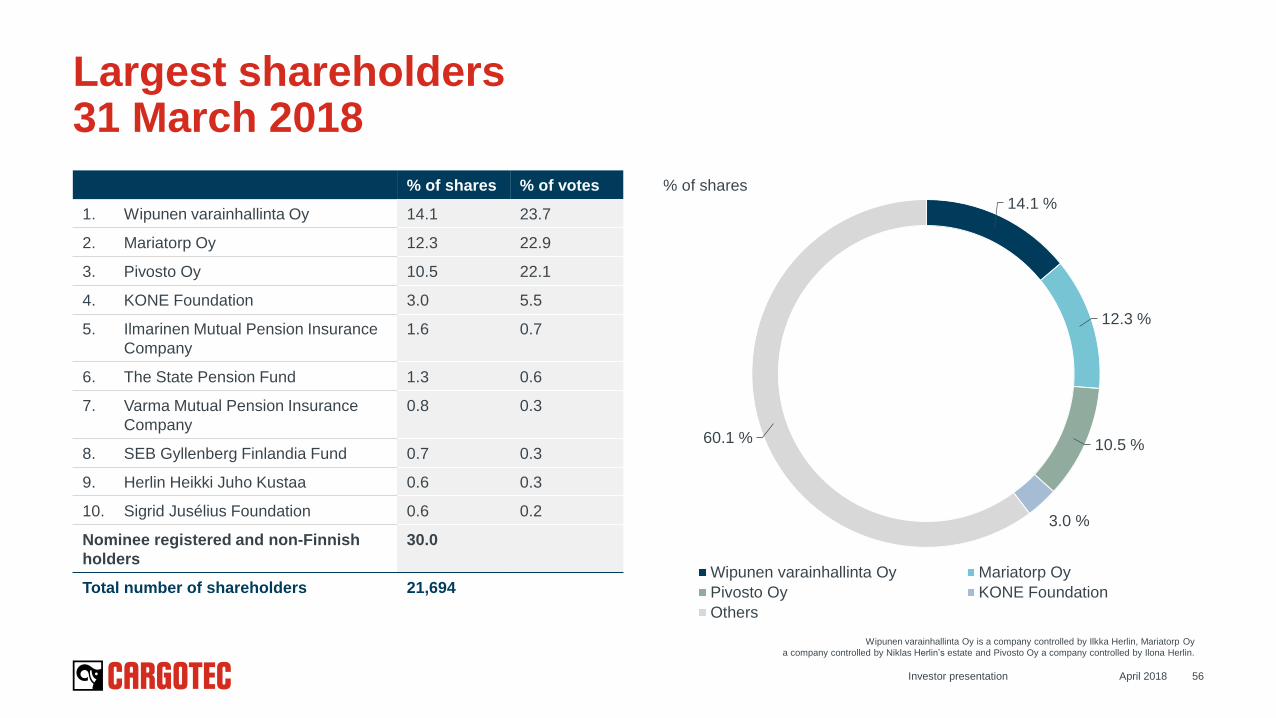
Largest shareholders31 March 2018
% of shares % of votes
1. Wipunen varainhallinta Oy 14.1 23.7
2. Mariatorp Oy 12.3 22.9
3. Pivosto Oy 10.5 22.1
4. KONE Foundation 3.0 5.5
5. Ilmarinen Mutual Pension Insurance
Company
1.6 0.7
6. The State Pension Fund 1.3 0.6
7. Varma Mutual Pension Insurance
Company
0.8 0.3
8. SEB Gyllenberg Finlandia Fund 0.7 0.3
9. Herlin Heikki Juho Kustaa 0.6 0.3
10. Sigrid Jusélius Foundation 0.6 0.2
Nominee registered and non-Finnish
holders
30.0
Total number of shareholders 21,694
Wipunen varainhallinta Oy is a company controlled by Ilkka Herlin, Mariatorp Oy
a company controlled by Niklas Herlin’s estate and Pivosto Oy a company controlled by Ilona Herlin.
% of shares
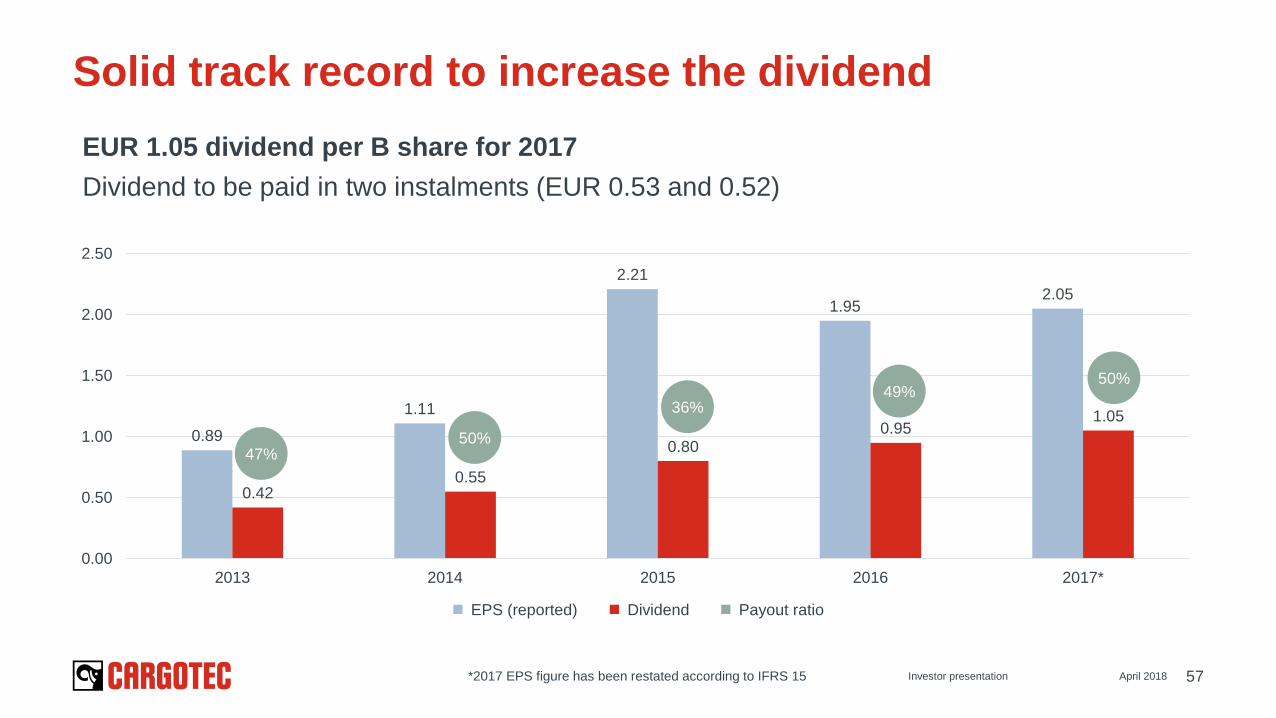
Solid track record to increase the dividend
EUR 1.05 dividend per B share for 2017
Dividend to be paid in two instalments (EUR 0.53 and 0.52)
April 2018Investor presentation 57
Dividend EPS (reported) Payout ratio
0.89
1.11
2.21
1.952.05
0.420.55
0.800.95
1.05
0.00
0.50
1.00
1.50
2.00
2.50
2013 2014 2015 2016 2017*
50%
36%49%
47%
50%
*2017 EPS figure has been restated according to IFRS 15
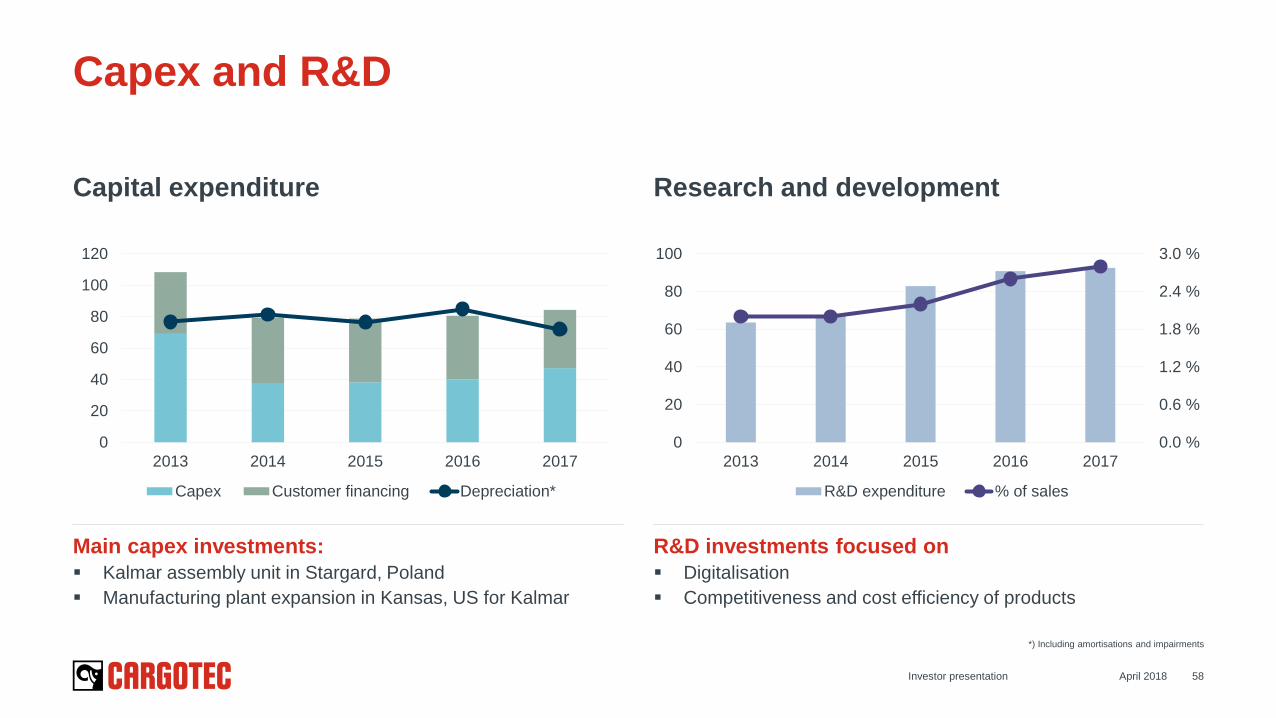
Capital expenditure
0
20
40
60
80
100
120
2013 2014 2015 2016 2017
Capex Customer financing Depreciation*
Research and development
0.0 %
0.6 %
1.2 %
1.8 %
2.4 %
3.0 %
0
20
40
60
80
100
2013 2014 2015 2016 2017
R&D expenditure % of sales
April 2018Investor presentation 58
Capex and R&D
*) Including amortisations and impairments
Main capex investments:
Kalmar assembly unit in Stargard, Poland
Manufacturing plant expansion in Kansas, US for Kalmar
R&D investments focused on
Digitalisation
Competitiveness and cost efficiency of products
59
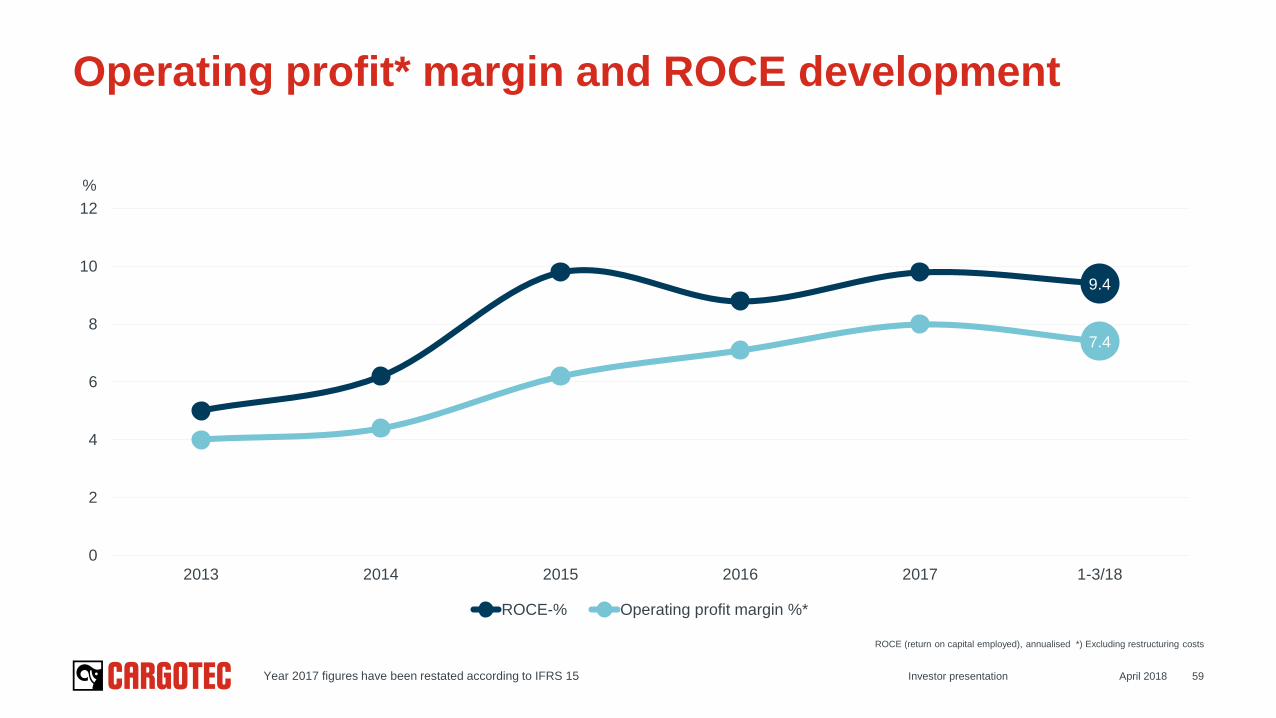
Operating profit* margin and ROCE development
9.4
7.4
0
2
4
6
8
10
12
2013 2014 2015 2016 2017 1-3/18
ROCE-% Operating profit margin %*
April 2018Investor presentation
%
ROCE (return on capital employed), annualised *) Excluding restructuring costs
Year 2017 figures have been restated according to IFRS 15
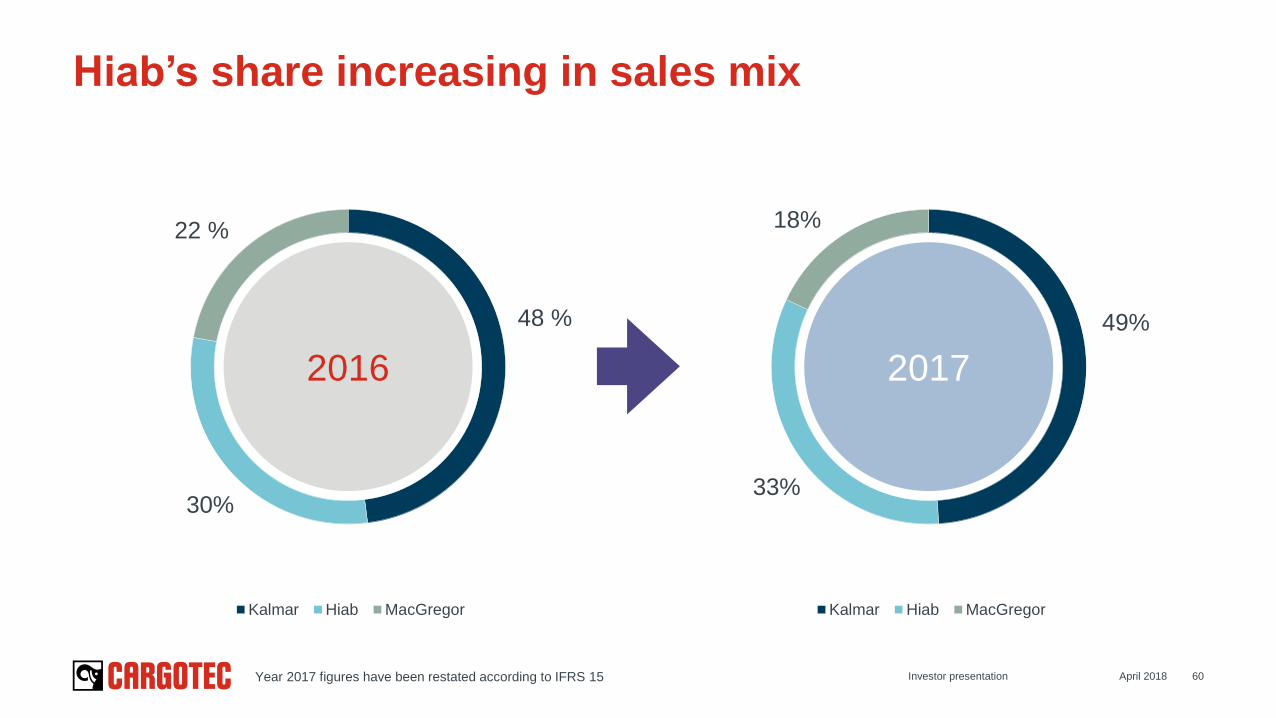
April 2018Investor presentation 60
Hiab’s share increasing in sales mix
(33)
48 %
30%
22 %
Kalmar Hiab MacGregor
49%
33%
18%
Kalmar Hiab MacGregor
2016 2017
Year 2017 figures have been restated according to IFRS 15
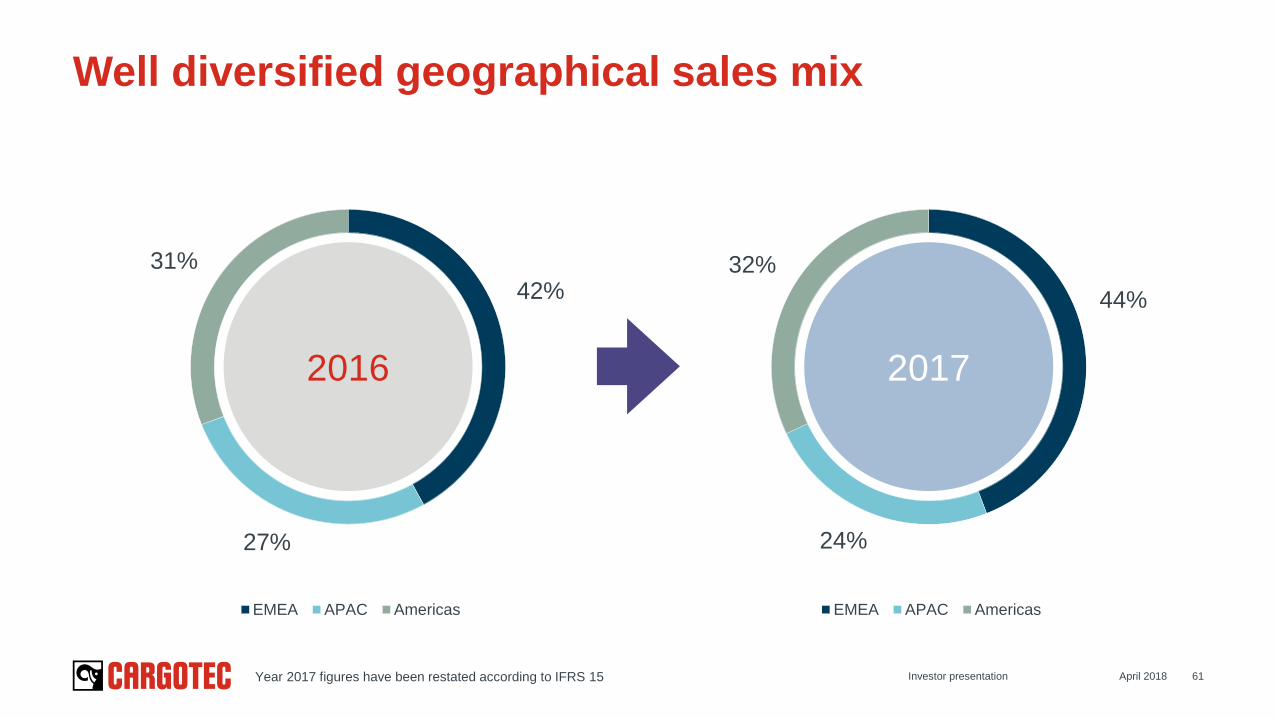
April 2018Investor presentation 61
Well diversified geographical sales mix
(33)
42%
27%
31%
EMEA APAC Americas
44%
24%
32%
EMEA APAC Americas
2016 2017
Year 2017 figures have been restated according to IFRS 15
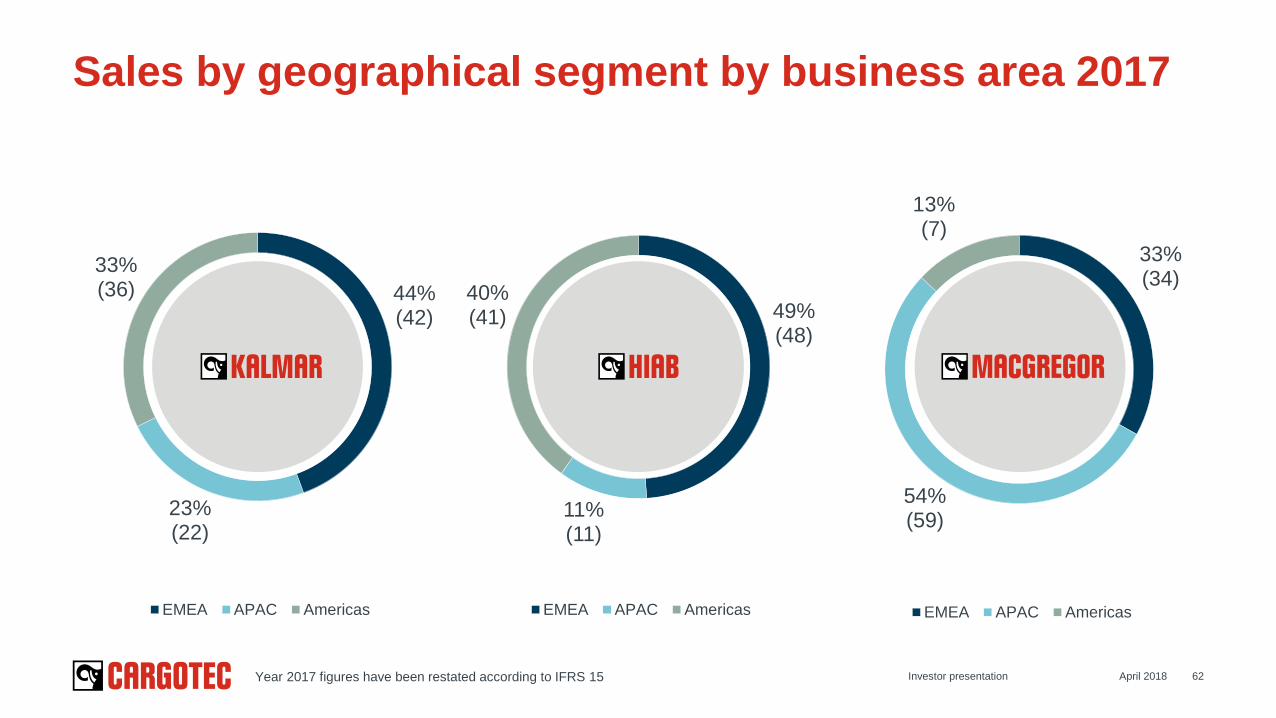
April 2018Investor presentation 62
Sales by geographical segment by business area 2017
44%(42)
23%(22)
33%(36)
EMEA APAC Americas
49%(48)
11%(11)
40%(41)
EMEA APAC Americas
33%(34)
54%(59)
13%(7)
EMEA APAC Americas
Year 2017 figures have been restated according to IFRS 15
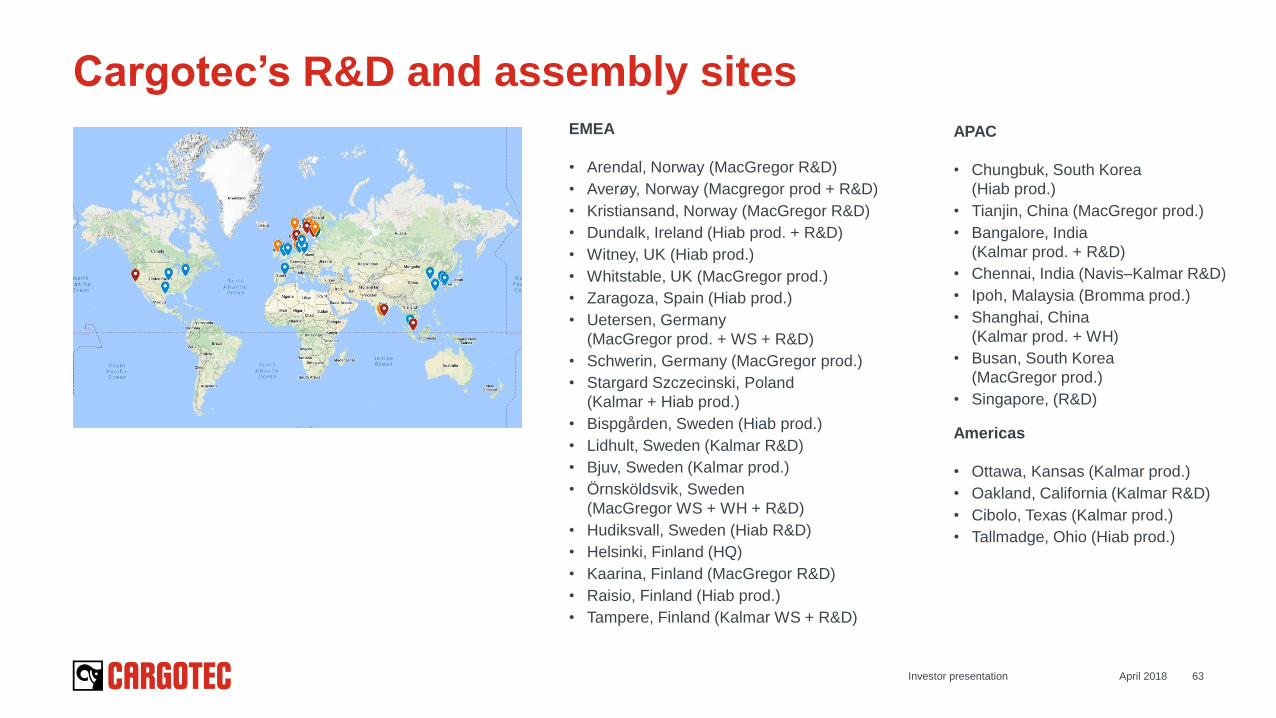
April 2018Investor presentation 63
Cargotec’s R&D and assembly sites
Americas
• Ottawa, Kansas (Kalmar prod.)
• Oakland, California (Kalmar R&D)
• Cibolo, Texas (Kalmar prod.)
• Tallmadge, Ohio (Hiab prod.)
EMEA
• Arendal, Norway (MacGregor R&D)
• Averøy, Norway (Macgregor prod + R&D)
• Kristiansand, Norway (MacGregor R&D)
• Dundalk, Ireland (Hiab prod. + R&D)
• Witney, UK (Hiab prod.)
• Whitstable, UK (MacGregor prod.)
• Zaragoza, Spain (Hiab prod.)
• Uetersen, Germany
(MacGregor prod. + WS + R&D)
• Schwerin, Germany (MacGregor prod.)
• Stargard Szczecinski, Poland
(Kalmar + Hiab prod.)
• Bispgården, Sweden (Hiab prod.)
• Lidhult, Sweden (Kalmar R&D)
• Bjuv, Sweden (Kalmar prod.)
• Örnsköldsvik, Sweden
(MacGregor WS + WH + R&D)
• Hudiksvall, Sweden (Hiab R&D)
• Helsinki, Finland (HQ)
• Kaarina, Finland (MacGregor R&D)
• Raisio, Finland (Hiab prod.)
• Tampere, Finland (Kalmar WS + R&D)
APAC
• Chungbuk, South Korea
(Hiab prod.)
• Tianjin, China (MacGregor prod.)
• Bangalore, India
(Kalmar prod. + R&D)
• Chennai, India (Navis–Kalmar R&D)
• Ipoh, Malaysia (Bromma prod.)
• Shanghai, China
(Kalmar prod. + WH)
• Busan, South Korea
(MacGregor prod.)
• Singapore, (R&D)
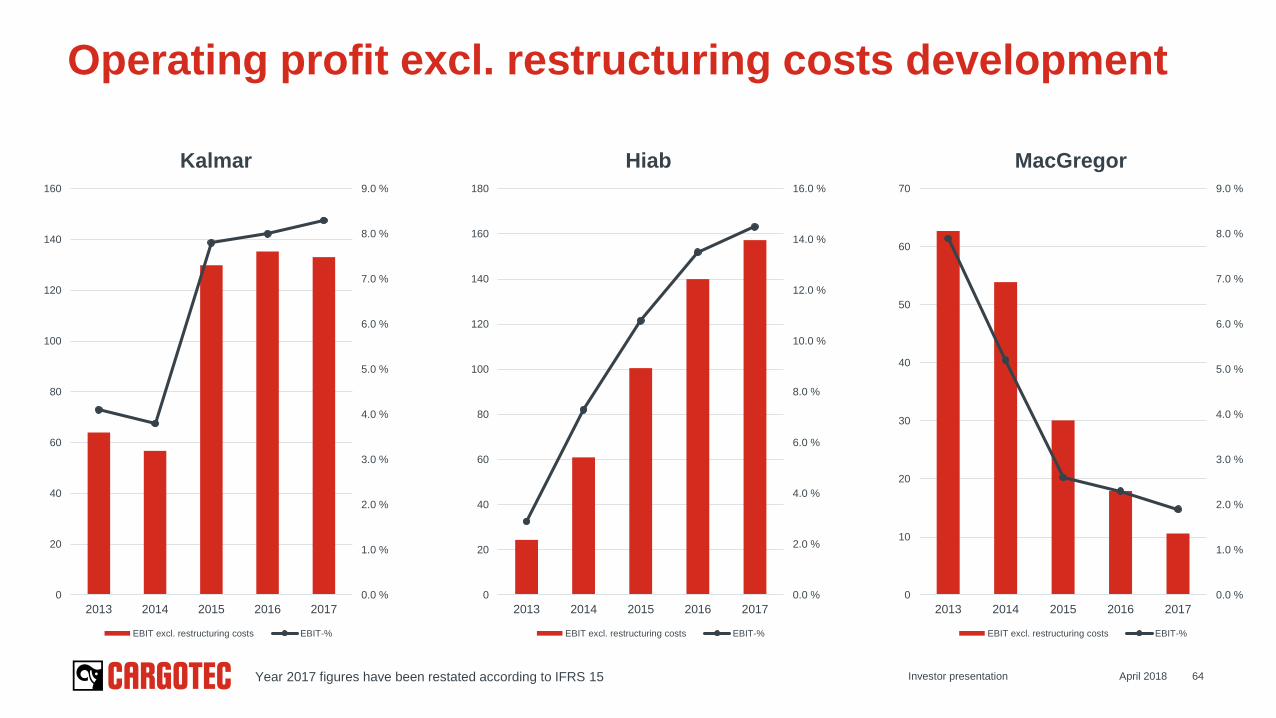
Operating profit excl. restructuring costs development
April 2018 64
0.0 %
1.0 %
2.0 %
3.0 %
4.0 %
5.0 %
6.0 %
7.0 %
8.0 %
9.0 %
0
20
40
60
80
100
120
140
160
2013 2014 2015 2016 2017
Kalmar
EBIT excl. restructuring costs EBIT-%
0.0 %
2.0 %
4.0 %
6.0 %
8.0 %
10.0 %
12.0 %
14.0 %
16.0 %
0
20
40
60
80
100
120
140
160
180
2013 2014 2015 2016 2017
Hiab
EBIT excl. restructuring costs EBIT-%
0.0 %
1.0 %
2.0 %
3.0 %
4.0 %
5.0 %
6.0 %
7.0 %
8.0 %
9.0 %
0
10
20
30
40
50
60
70
2013 2014 2015 2016 2017
MacGregor
EBIT excl. restructuring costs EBIT-%
Investor presentationYear 2017 figures have been restated according to IFRS 15
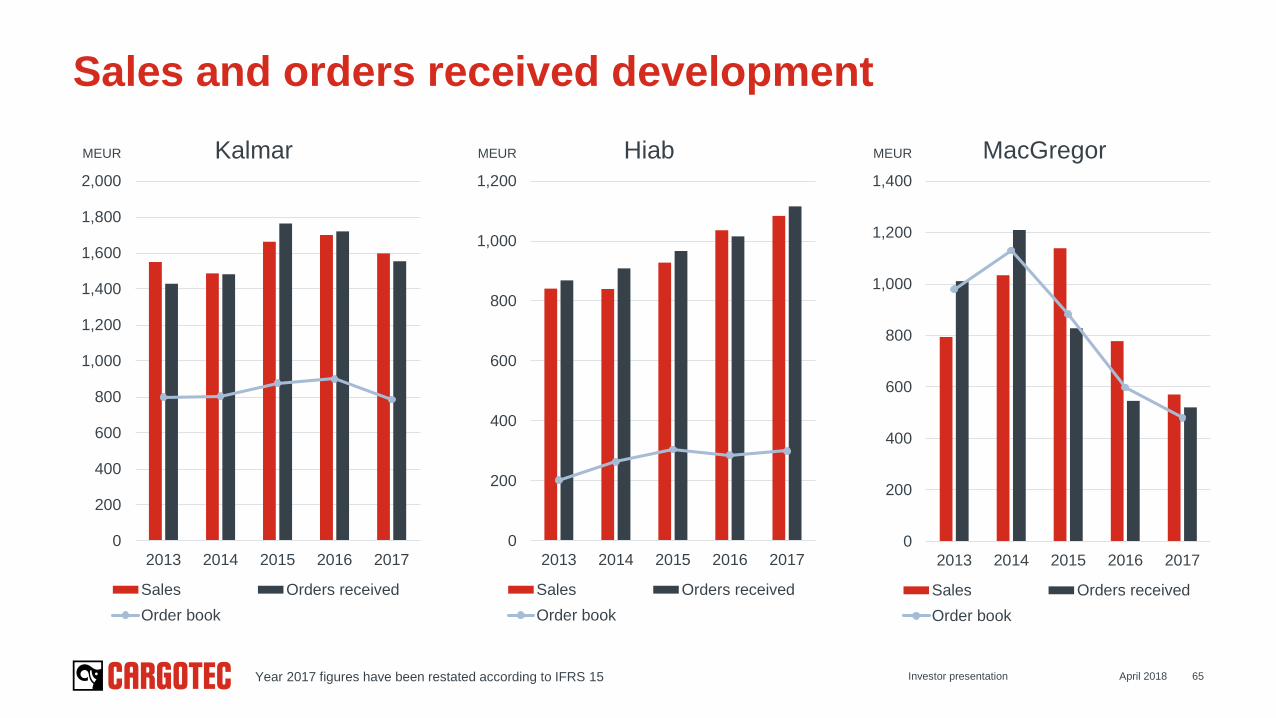
Sales and orders received development
April 2018 65Investor presentation
0
200
400
600
800
1,000
1,200
1,400
1,600
1,800
2,000
2013 2014 2015 2016 2017
Kalmar
Sales Orders received
Order book
0
200
400
600
800
1,000
1,200
2013 2014 2015 2016 2017
Hiab
Sales Orders received
Order book
0
200
400
600
800
1,000
1,200
1,400
2013 2014 2015 2016 2017
MacGregor
Sales Orders received
Order book
MEUR MEUR MEUR
Year 2017 figures have been restated according to IFRS 15
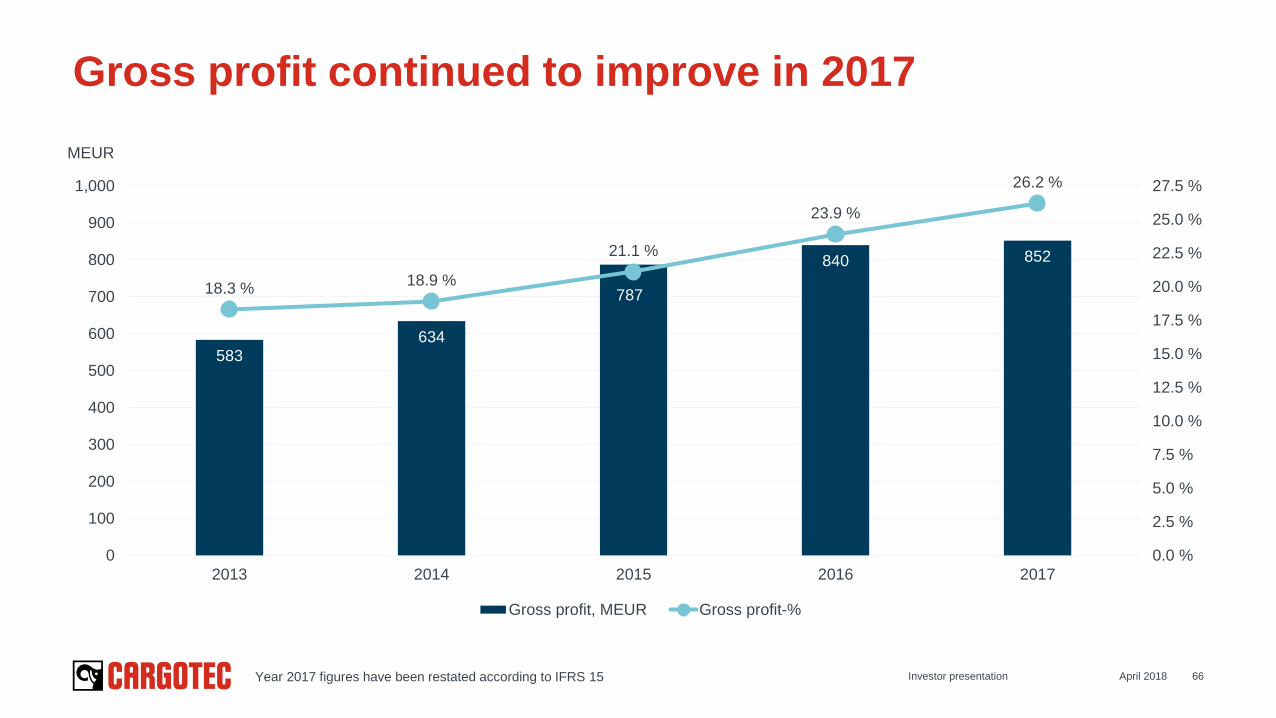
66
Gross profit continued to improve in 2017
583
634
787
840 852
18.3 %18.9 %
21.1 %
23.9 %
26.2 %
0.0 %
2.5 %
5.0 %
7.5 %
10.0 %
12.5 %
15.0 %
17.5 %
20.0 %
22.5 %
25.0 %
27.5 %
0
100
200
300
400
500
600
700
800
900
1,000
2013 2014 2015 2016 2017
Gross profit, MEUR Gross profit-%
April 2018Investor presentation
MEUR
Year 2017 figures have been restated according to IFRS 15
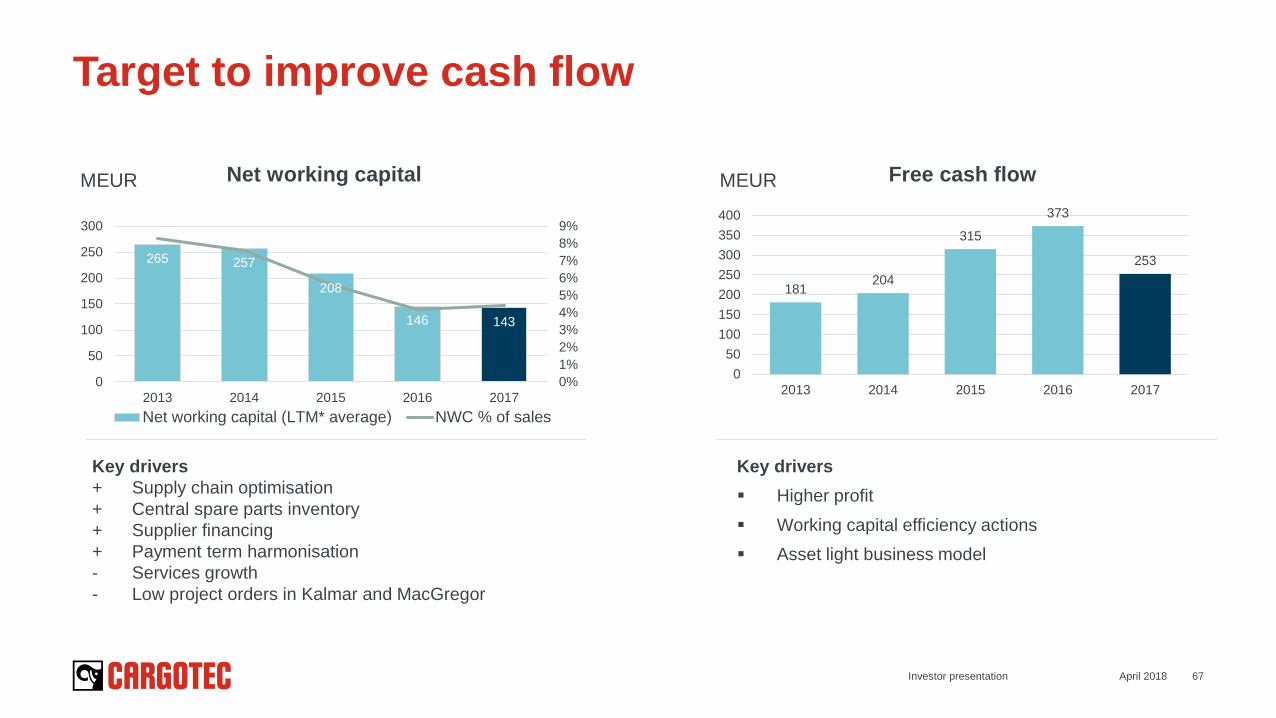
April 2018Investor presentation 67
Target to improve cash flow
181204
315
373
253
0
50
100
150
200
250
300
350
400
2013 2014 2015 2016 2017
MEUR
Key drivers
+ Supply chain optimisation
+ Central spare parts inventory
+ Supplier financing
+ Payment term harmonisation
- Services growth
- Low project orders in Kalmar and MacGregor
Free cash flow
Key drivers
Higher profit
Working capital efficiency actions
Asset light business model
Net working capitalMEUR
265 257
208
146 143
0%
1%
2%
3%
4%
5%
6%
7%
8%
9%
0
50
100
150
200
250
300
2013 2014 2015 2016 2017
Net working capital (LTM* average) NWC % of sales
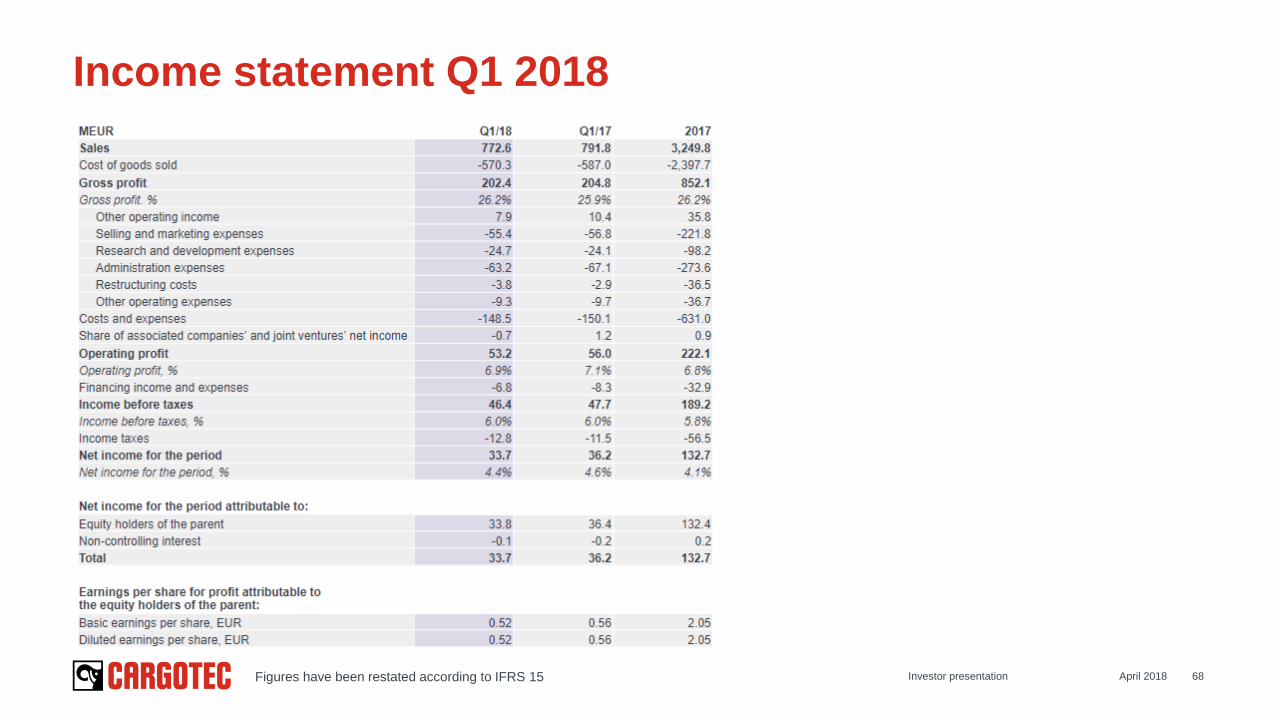
Income statement Q1 2018
Investor presentation 68April 2018Figures have been restated according to IFRS 15
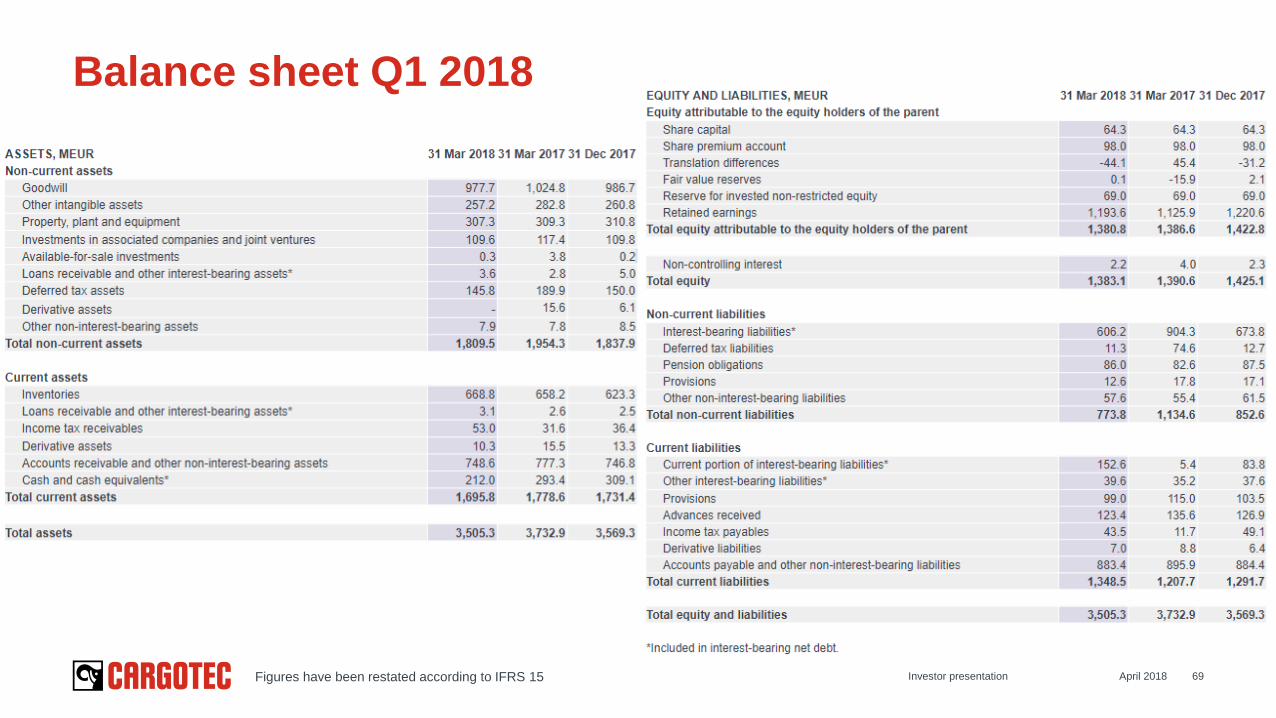
Balance sheet Q1 2018
Investor presentation 69April 2018Figures have been restated according to IFRS 15
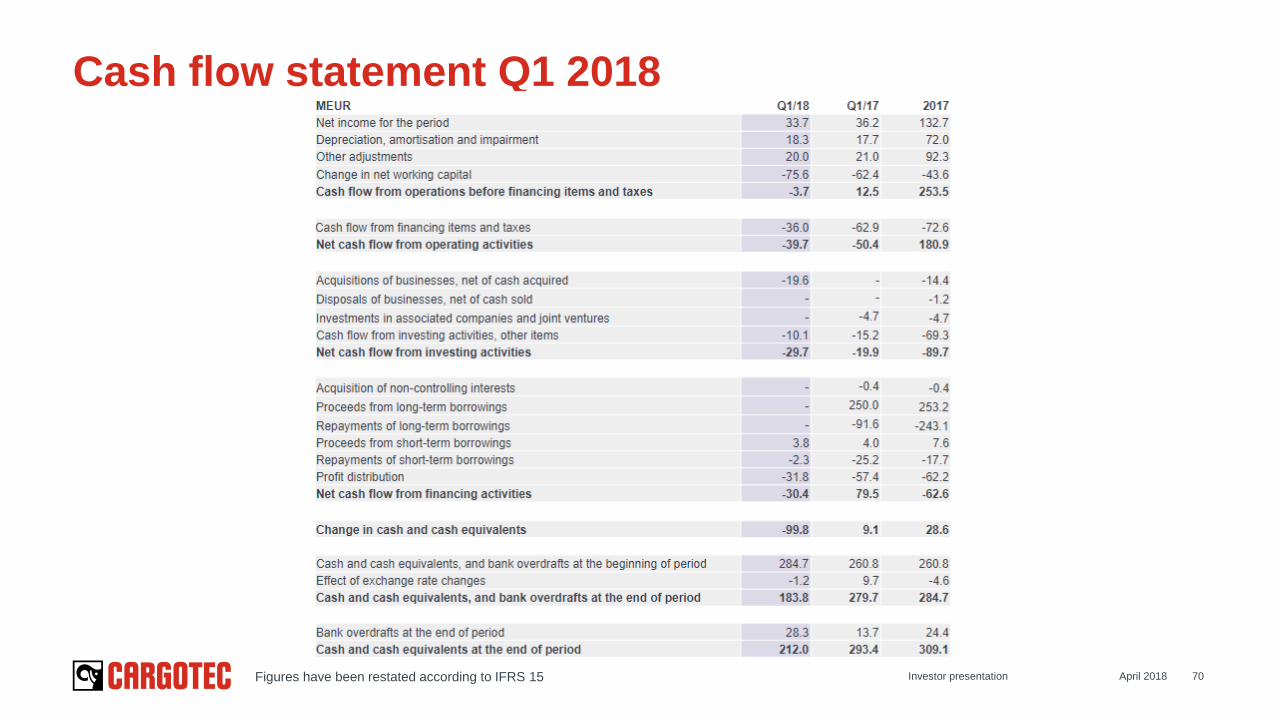
Cash flow statement Q1 2018
Investor presentation 70April 2018Figures have been restated according to IFRS 15
Sustainability
April 2018Investor presentation 71
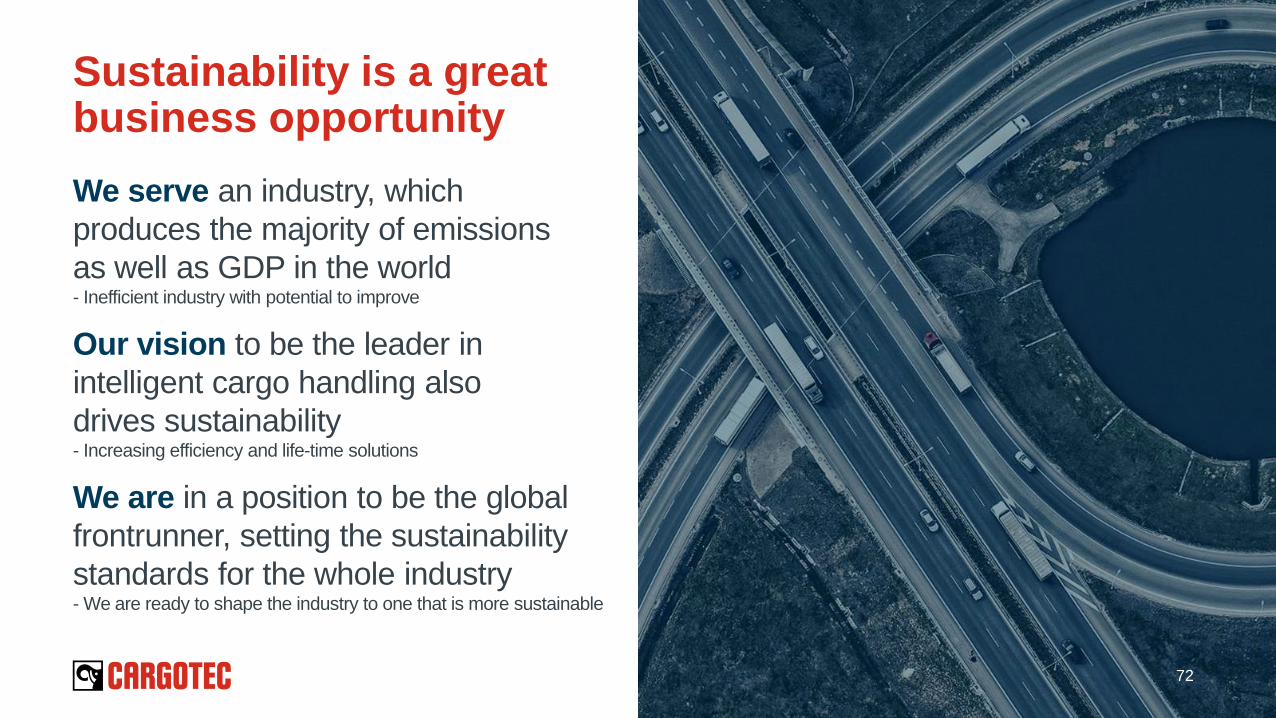
We serve an industry, which
produces the majority of emissions
as well as GDP in the world- Inefficient industry with potential to improve
Our vision to be the leader in
intelligent cargo handling also
drives sustainability- Increasing efficiency and life-time solutions
We are in a position to be the global
frontrunner, setting the sustainability
standards for the whole industry- We are ready to shape the industry to one that is more sustainable
Sustainability is a great business opportunity
72
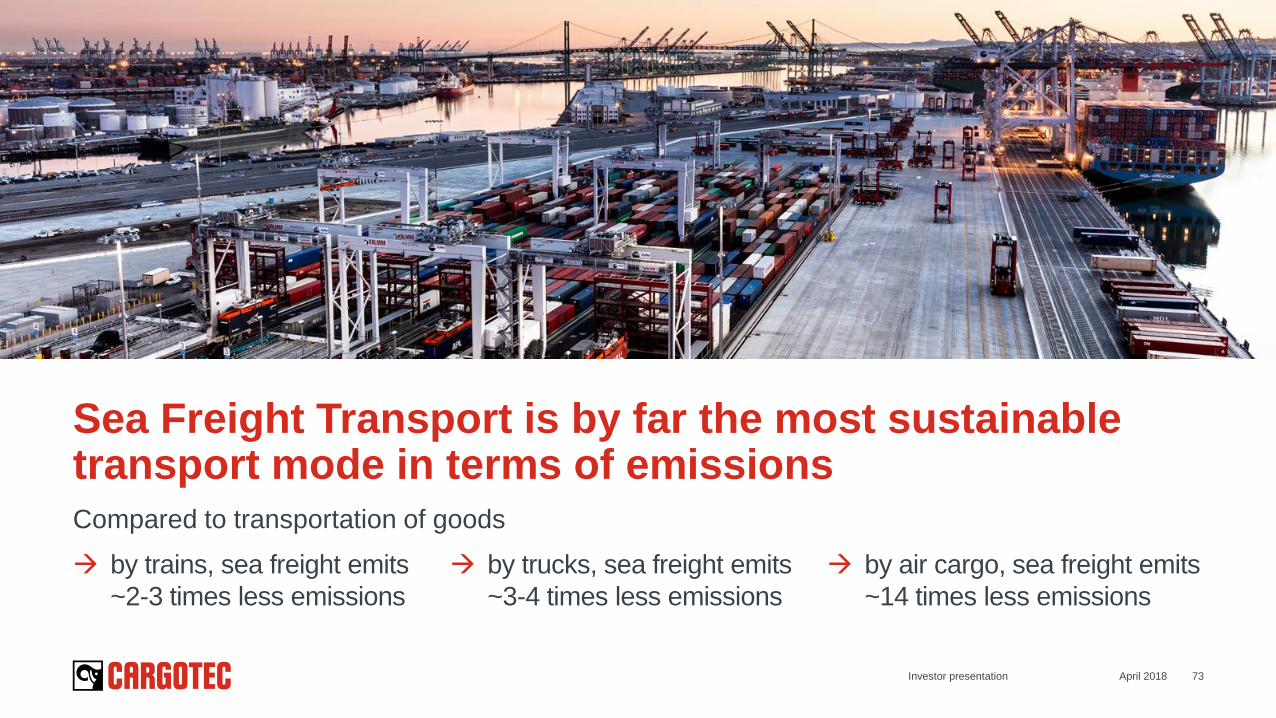
Sea Freight Transport is by far the most sustainable transport mode in terms of emissions
by trains, sea freight emits
~2-3 times less emissions
April 2018Investor presentation 73
by trucks, sea freight emits
~3-4 times less emissions
by air cargo, sea freight emits
~14 times less emissions
Compared to transportation of goods
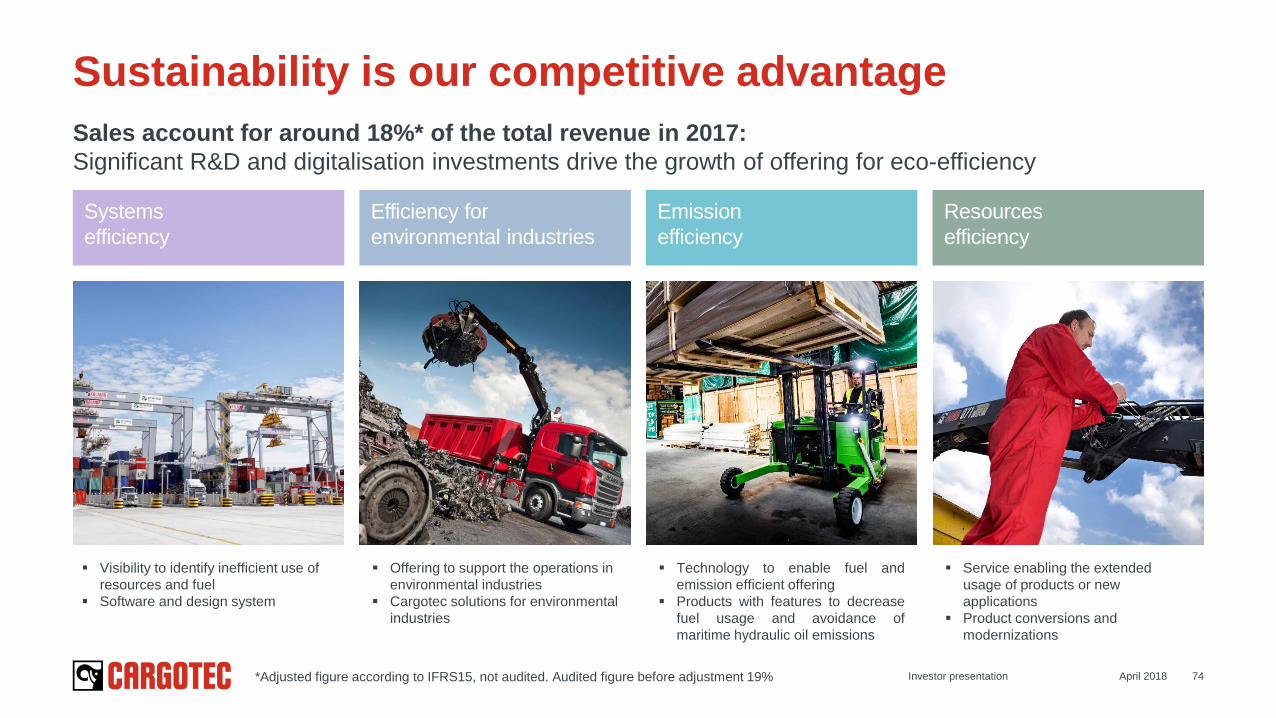
Sales account for around 18%* of the total revenue in 2017:
Significant R&D and digitalisation investments drive the growth of offering for eco-efficiency
April 2018Investor presentation 74
Sustainability is our competitive advantage
Systems
efficiency
Efficiency for
environmental industries
Emission
efficiency
Resources
efficiency
Visibility to identify inefficient use of
resources and fuel
Software and design system
Offering to support the operations in
environmental industries
Cargotec solutions for environmental
industries
Technology to enable fuel and
emission efficient offering
Products with features to decrease
fuel usage and avoidance of
maritime hydraulic oil emissions
Service enabling the extended
usage of products or new
applications
Product conversions and
modernizations
*Adjusted figure according to IFRS15, not audited. Audited figure before adjustment 19%
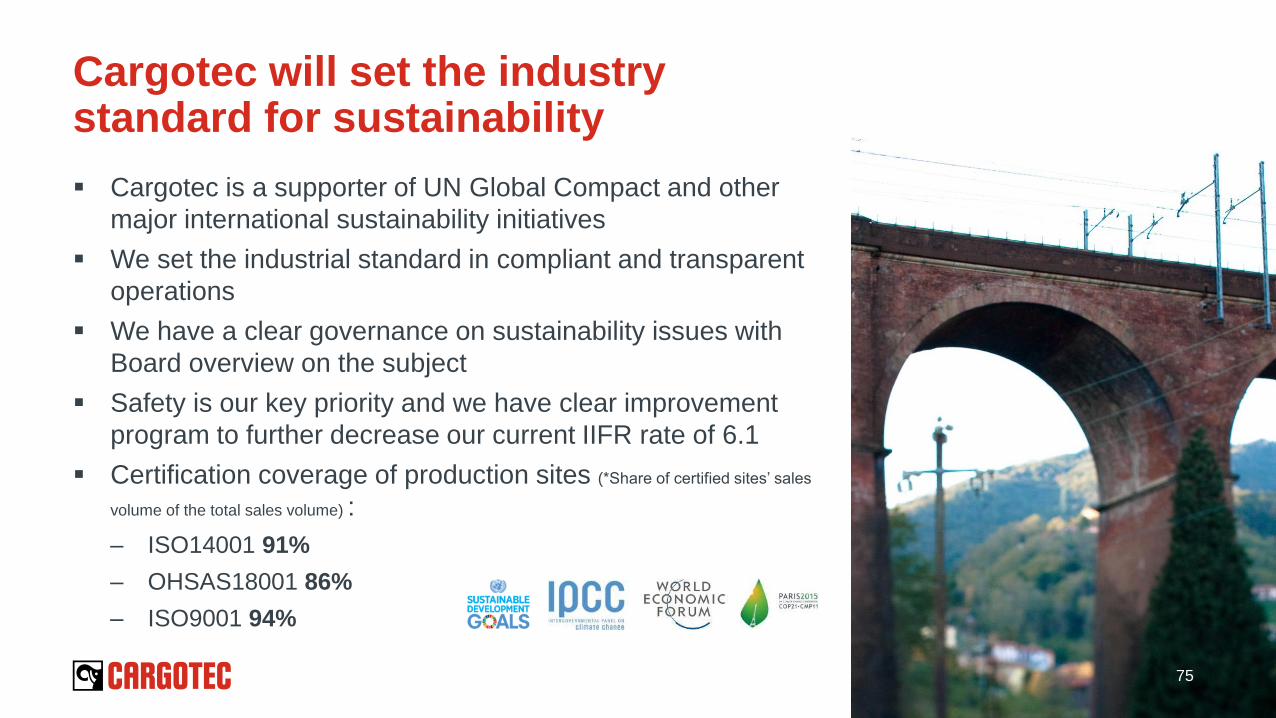
Cargotec is a supporter of UN Global Compact and other
major international sustainability initiatives
We set the industrial standard in compliant and transparent
operations
We have a clear governance on sustainability issues with
Board overview on the subject
Safety is our key priority and we have clear improvement
program to further decrease our current IIFR rate of 6.1
Certification coverage of production sites (*Share of certified sites’ sales
volume of the total sales volume) :
– ISO14001 91%
– OHSAS18001 86%
– ISO9001 94%
Cargotec will set the industry standard for sustainability
75
Kalmar appendix
April 2018Investor presentation 76
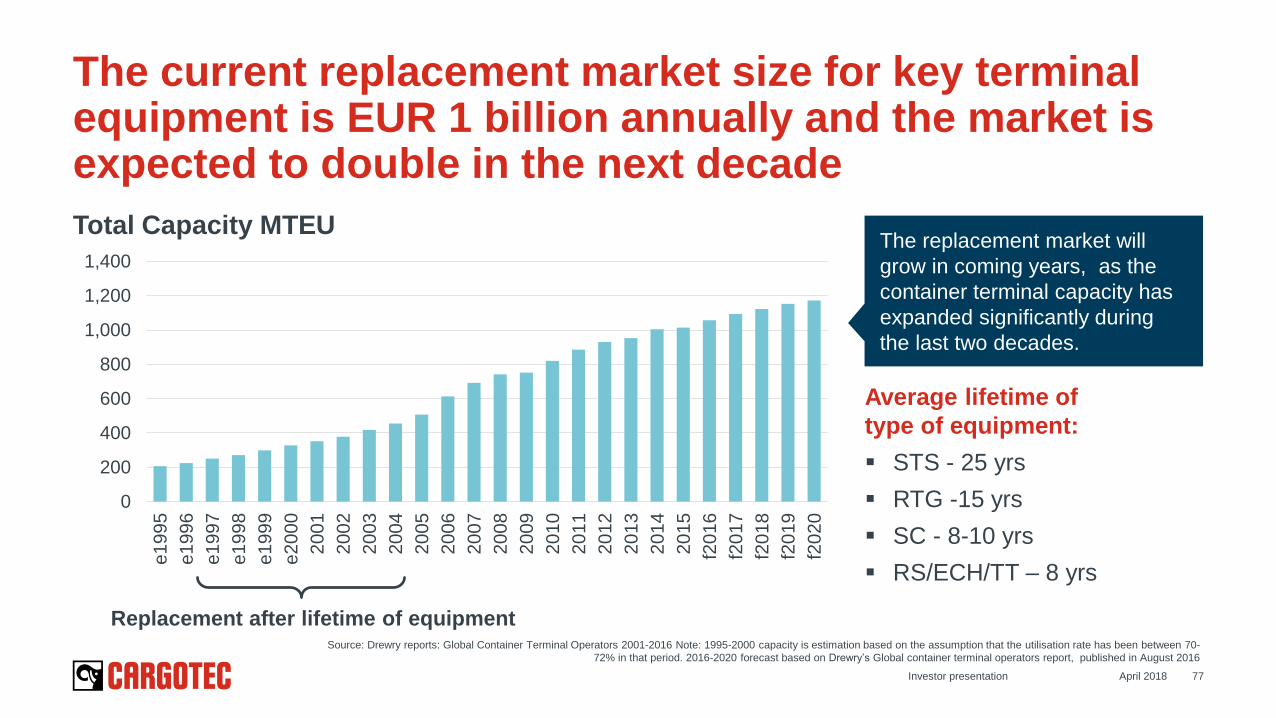
Total Capacity MTEU
The current replacement market size for key terminal equipment is EUR 1 billion annually and the market is expected to double in the next decade
0
200
400
600
800
1,000
1,200
1,400
e1995
e1996
e1997
e1998
e1999
e2000
2001
2002
2003
2004
2005
2006
2007
2008
2009
2010
2011
2012
2013
2014
2015
f20
16
f20
17
f20
18
f20
19
f20
20
Replacement after lifetime of equipment
The replacement market will
grow in coming years, as the
container terminal capacity has
expanded significantly during
the last two decades.
Average lifetime of
type of equipment:
STS - 25 yrs
RTG -15 yrs
SC - 8-10 yrs
RS/ECH/TT – 8 yrs
Source: Drewry reports: Global Container Terminal Operators 2001-2016 Note: 1995-2000 capacity is estimation based on the assumption that the utilisation rate has been between 70-
72% in that period. 2016-2020 forecast based on Drewry’s Global container terminal operators report, published in August 2016
April 2018Investor presentation 77
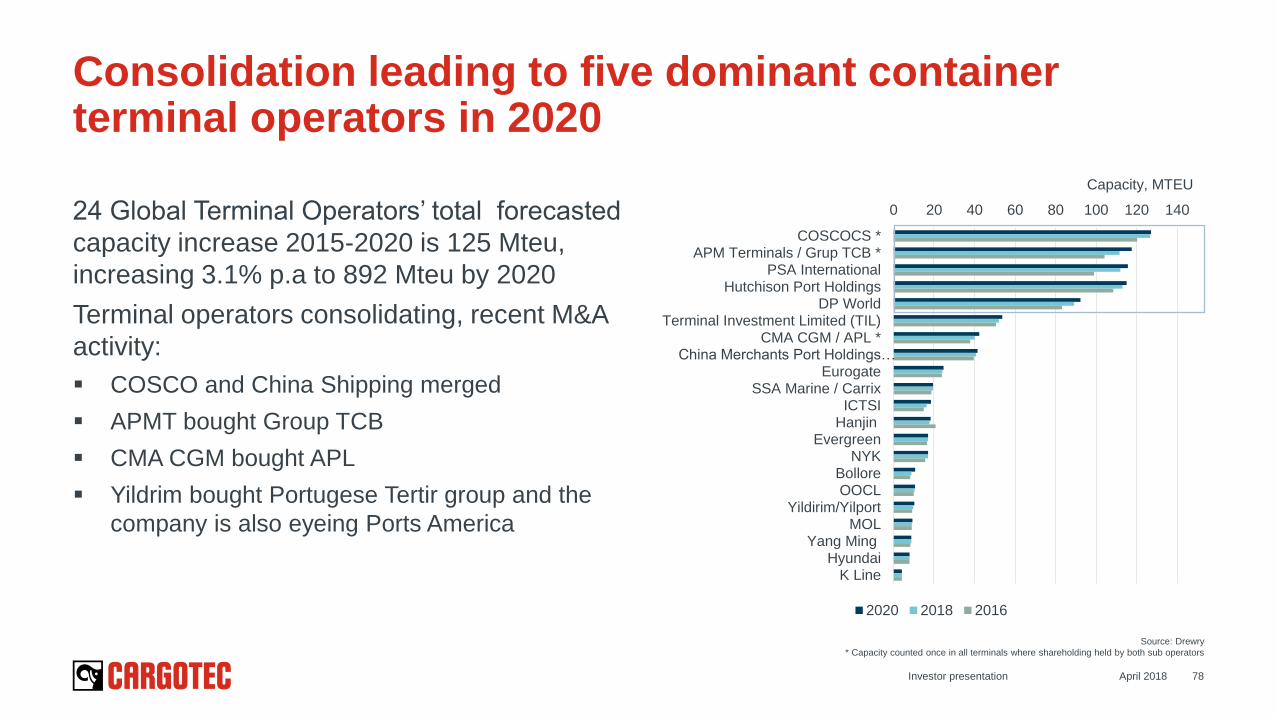
24 Global Terminal Operators’ total forecasted
capacity increase 2015-2020 is 125 Mteu,
increasing 3.1% p.a to 892 Mteu by 2020
Terminal operators consolidating, recent M&A
activity:
COSCO and China Shipping merged
APMT bought Group TCB
CMA CGM bought APL
Yildrim bought Portugese Tertir group and the
company is also eyeing Ports America
April 2018 78
Consolidation leading to five dominant container terminal operators in 2020
Capacity, MTEU
Source: Drewry
* Capacity counted once in all terminals where shareholding held by both sub operators
0 20 40 60 80 100 120 140
COSCOCS *APM Terminals / Grup TCB *
PSA InternationalHutchison Port Holdings
DP WorldTerminal Investment Limited (TIL)
CMA CGM / APL *China Merchants Port Holdings…
EurogateSSA Marine / Carrix
ICTSIHanjin
EvergreenNYK
BolloreOOCL
Yildirim/YilportMOL
Yang MingHyundai
K Line
2020 2018 2016
Investor presentation
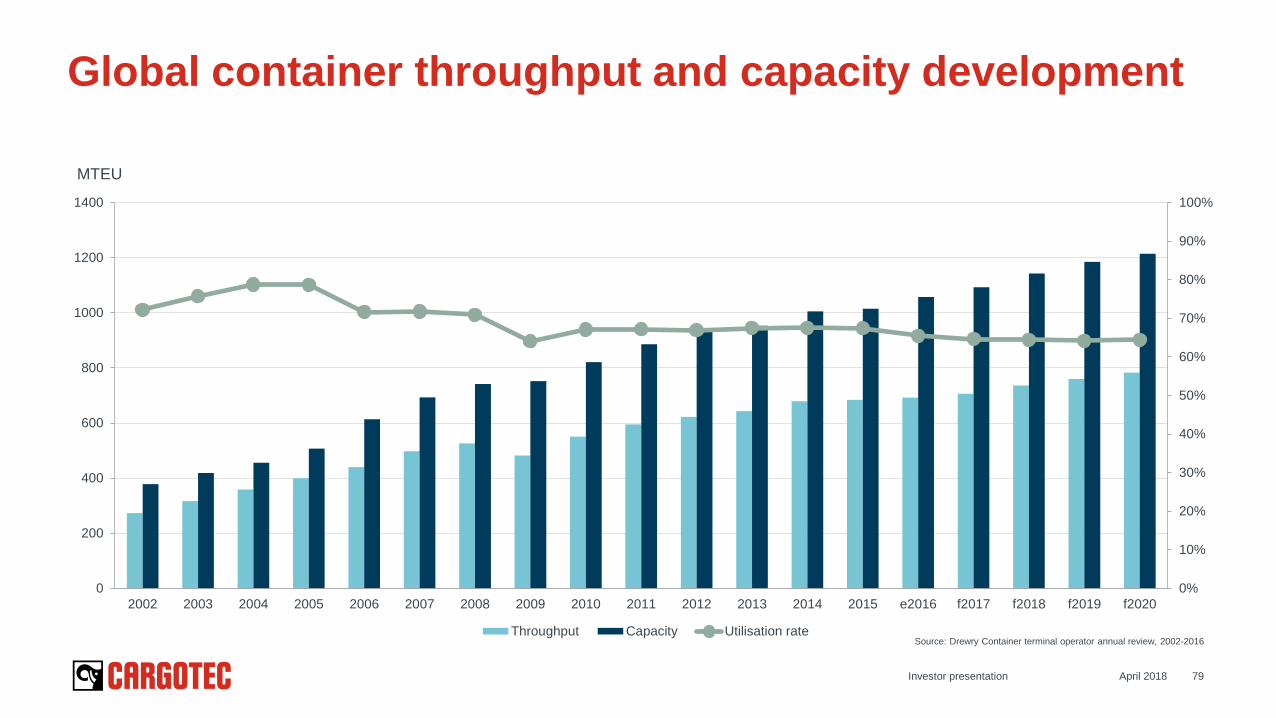
Global container throughput and capacity development
April 2018 79
0%
10%
20%
30%
40%
50%
60%
70%
80%
90%
100%
0
200
400
600
800
1000
1200
1400
2002 2003 2004 2005 2006 2007 2008 2009 2010 2011 2012 2013 2014 2015 e2016 f2017 f2018 f2019 f2020
Throughput Capacity Utilisation rate
MTEU
Source: Drewry Container terminal operator annual review, 2002-2016
Investor presentation
April 2018Investor presentation 80
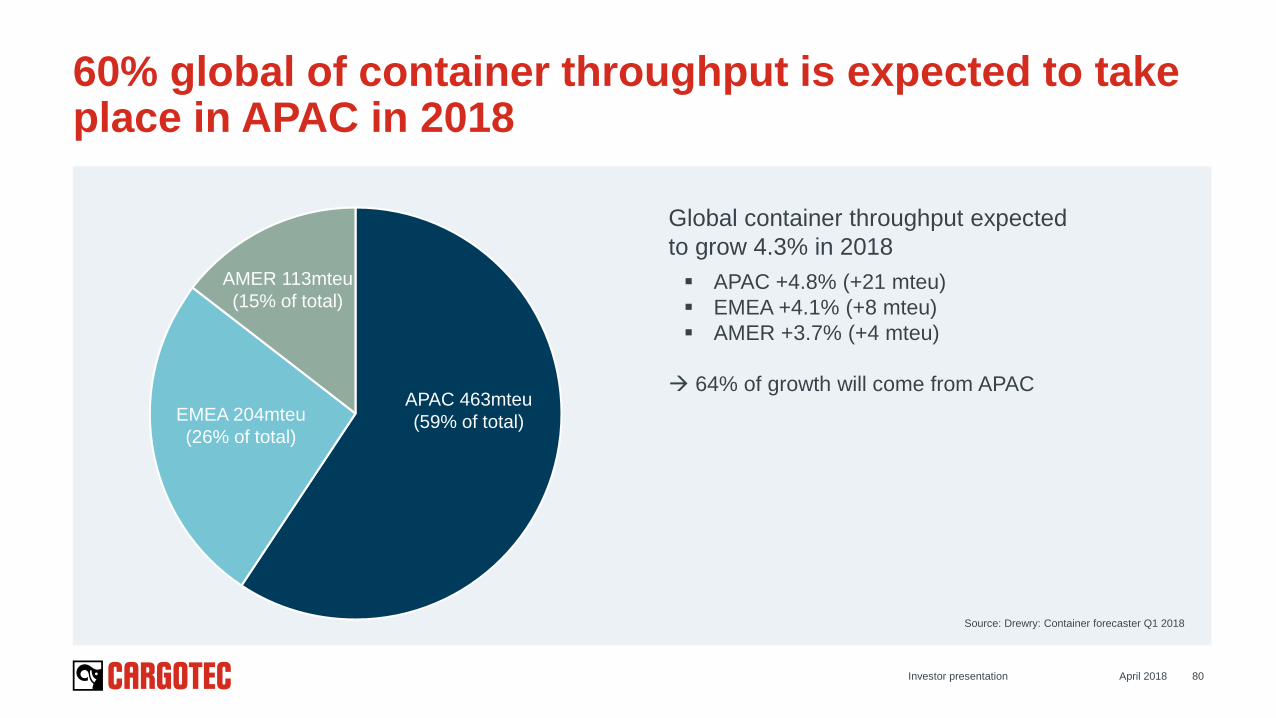
60% global of container throughput is expected to take place in APAC in 2018
APAC 463mteu
(59% of total)EMEA 204mteu
(26% of total)
AMER 113mteu
(15% of total)
Global container throughput expected
to grow 4.3% in 2018
APAC +4.8% (+21 mteu)
EMEA +4.1% (+8 mteu)
AMER +3.7% (+4 mteu)
64% of growth will come from APAC
Source: Drewry: Container forecaster Q1 2018
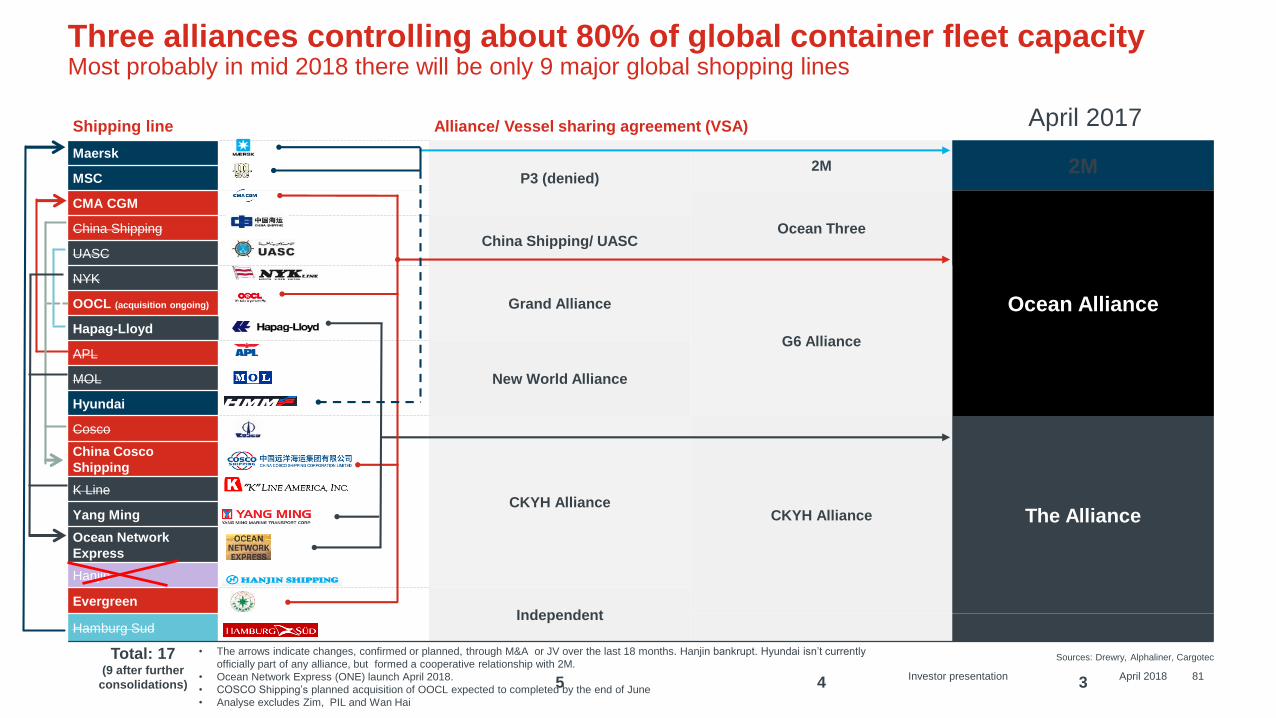
Shipping line Alliance/ Vessel sharing agreement (VSA)
Maersk
P3 (denied)2M 2M
MSC
CMA CGM
Ocean Three
Ocean Alliance
China ShippingChina Shipping/ UASC
UASC
NYK
Grand Alliance
G6 Alliance
OOCL (acquisition ongoing)
Hapag-Lloyd
APL
New World AllianceMOL
Hyundai
Cosco
CKYH AllianceCKYH Alliance The Alliance
China Cosco
Shipping
K Line
Yang Ming
Ocean Network
Express
Hanjin
EvergreenIndependent
Hamburg Sud
Total: 17(9 after further
consolidations) 5 4 3
April 2017
• The arrows indicate changes, confirmed or planned, through M&A or JV over the last 18 months. Hanjin bankrupt. Hyundai isn’t currently
officially part of any alliance, but formed a cooperative relationship with 2M.
• Ocean Network Express (ONE) launch April 2018.
• COSCO Shipping’s planned acquisition of OOCL expected to completed by the end of June
• Analyse excludes Zim, PIL and Wan Hai
81
Three alliances controlling about 80% of global container fleet capacityMost probably in mid 2018 there will be only 9 major global shopping lines
Sources: Drewry, Alphaliner, Cargotec
April 2018Investor presentation
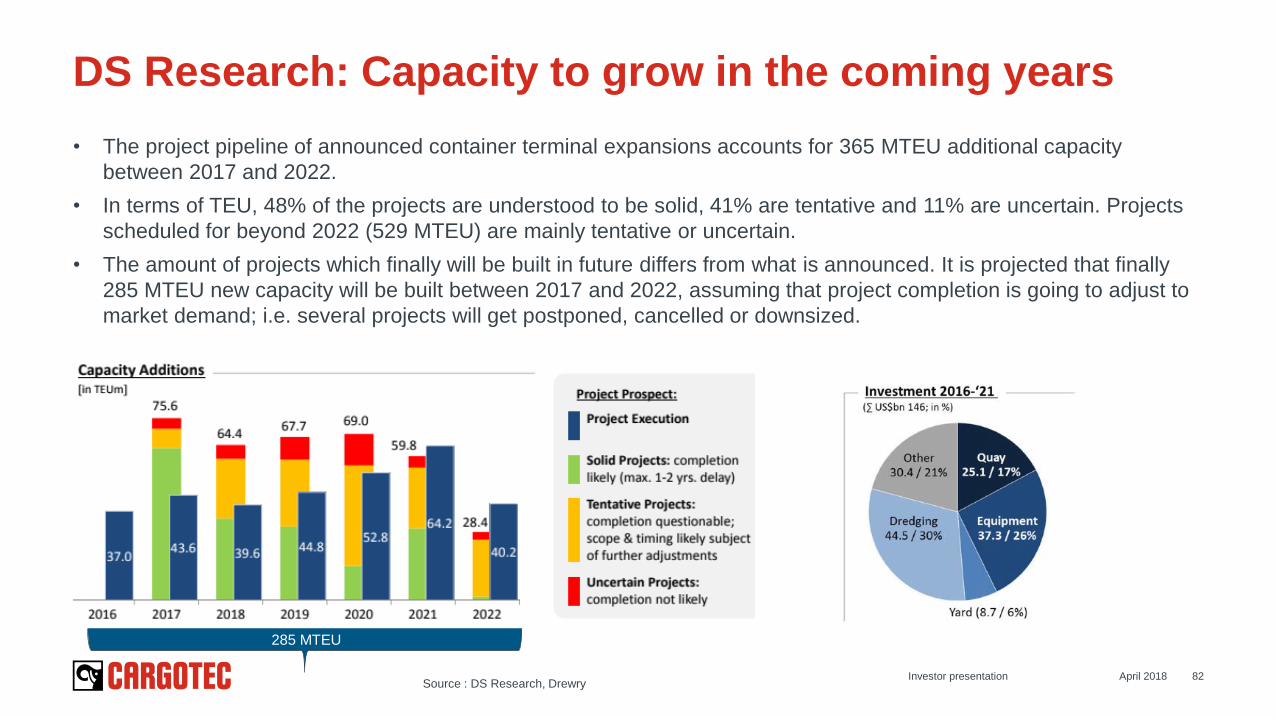
• The project pipeline of announced container terminal expansions accounts for 365 MTEU additional capacity
between 2017 and 2022.
• In terms of TEU, 48% of the projects are understood to be solid, 41% are tentative and 11% are uncertain. Projects
scheduled for beyond 2022 (529 MTEU) are mainly tentative or uncertain.
• The amount of projects which finally will be built in future differs from what is announced. It is projected that finally
285 MTEU new capacity will be built between 2017 and 2022, assuming that project completion is going to adjust to
market demand; i.e. several projects will get postponed, cancelled or downsized.
April 2018 82
DS Research: Capacity to grow in the coming years
Investor presentationSource : DS Research, Drewry
285 MTEU
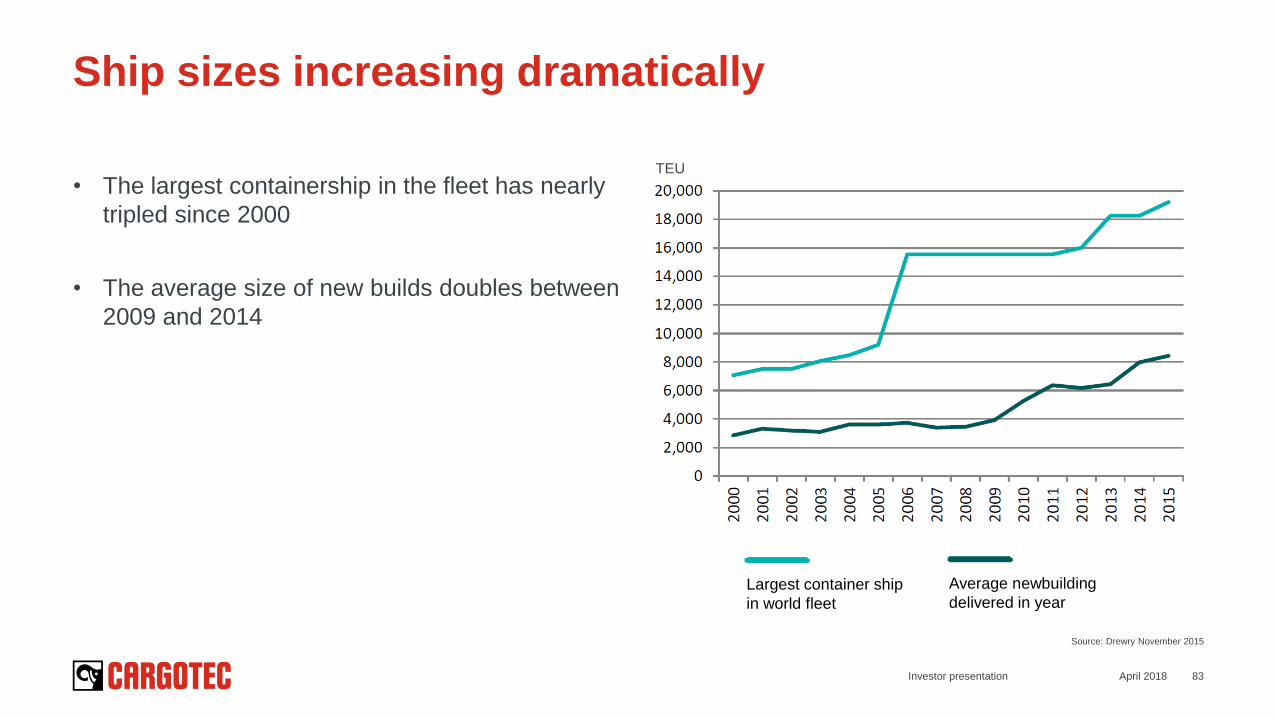
• The largest containership in the fleet has nearly
tripled since 2000
• The average size of new builds doubles between
2009 and 2014
April 2018 83
Ship sizes increasing dramatically
Average newbuilding
delivered in year Largest container ship
in world fleet
Source: Drewry November 2015
Investor presentation
TEU
Hiab appendix
April 2018Investor presentation 84
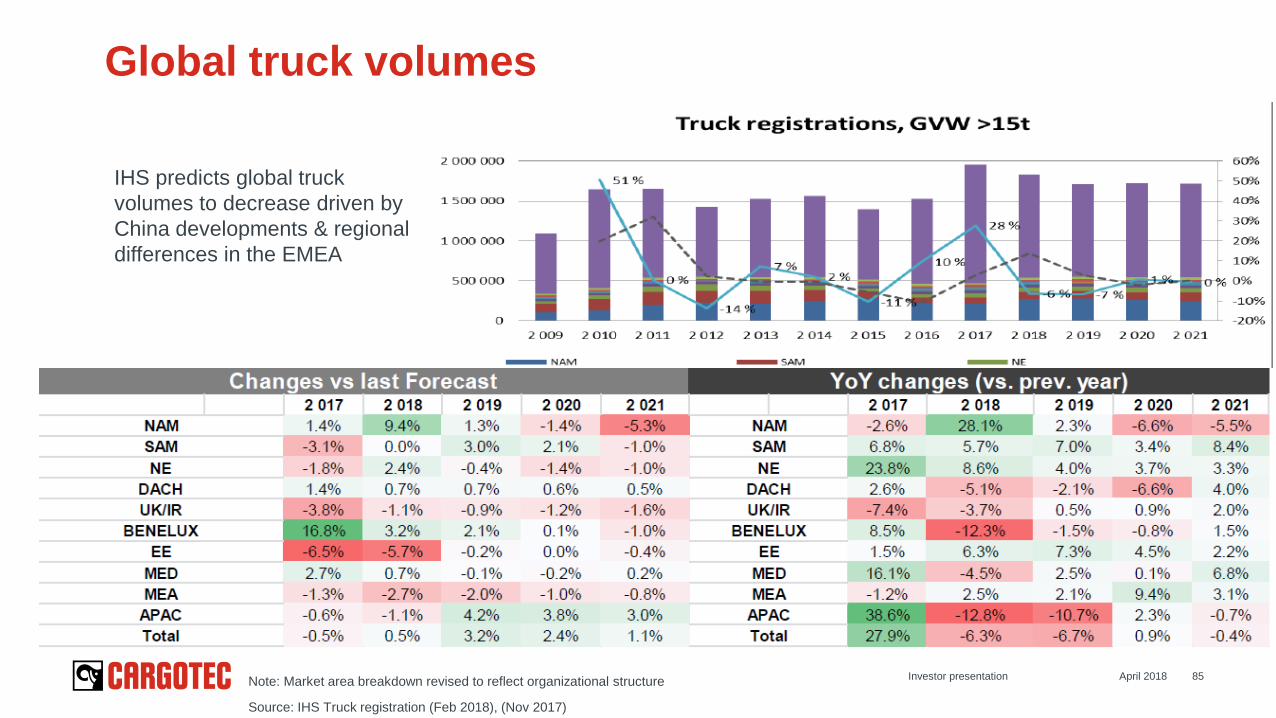
Global truck volumes
Source: IHS Truck registration (Feb 2018), (Nov 2017)
Note: Market area breakdown revised to reflect organizational structure 85
IHS predicts global truck
volumes to decrease driven by
China developments & regional
differences in the EMEA
April 2018Investor presentation
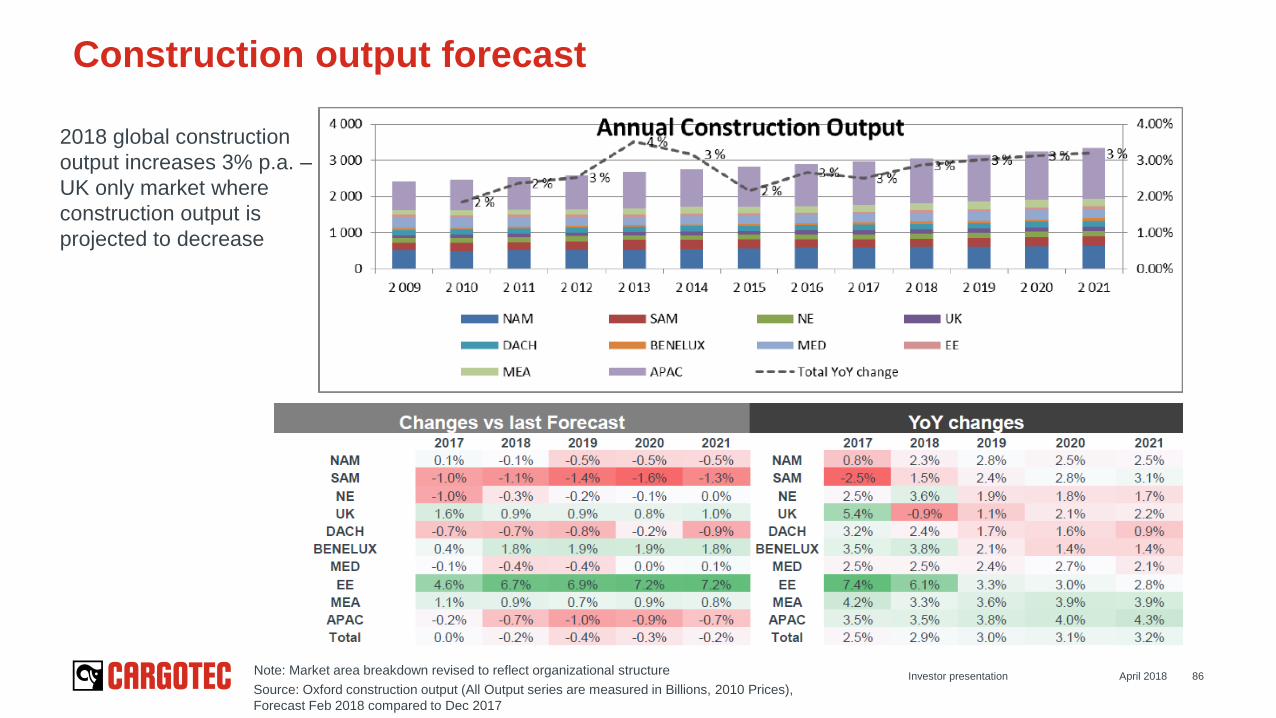
Construction output forecast
Source: Oxford construction output (All Output series are measured in Billions, 2010 Prices),
Forecast Feb 2018 compared to Dec 2017
Note: Market area breakdown revised to reflect organizational structure86April 2018Investor presentation
2018 global construction
output increases 3% p.a. –
UK only market where
construction output is
projected to decrease
MacGregor appendix
April 2018Investor presentation 87
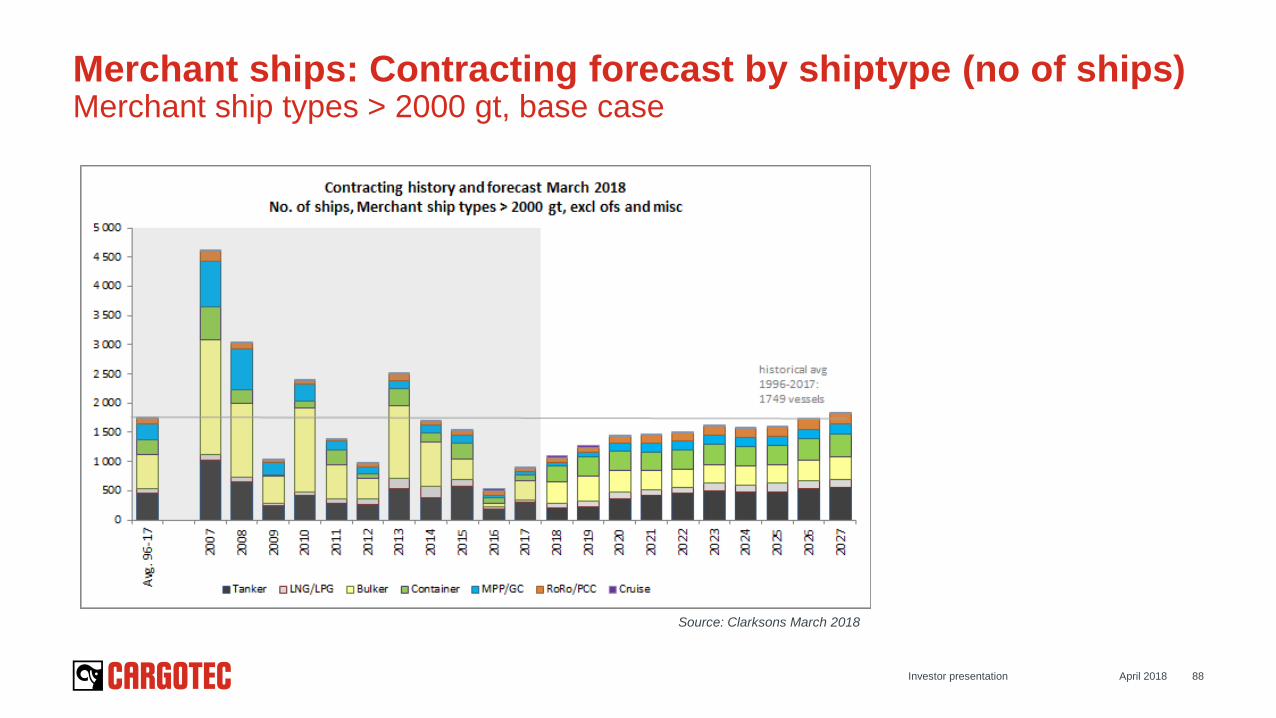
Merchant ships: Contracting forecast by shiptype (no of ships)Merchant ship types > 2000 gt, base case
Source: Clarksons March 2018
April 2018Investor presentation 88
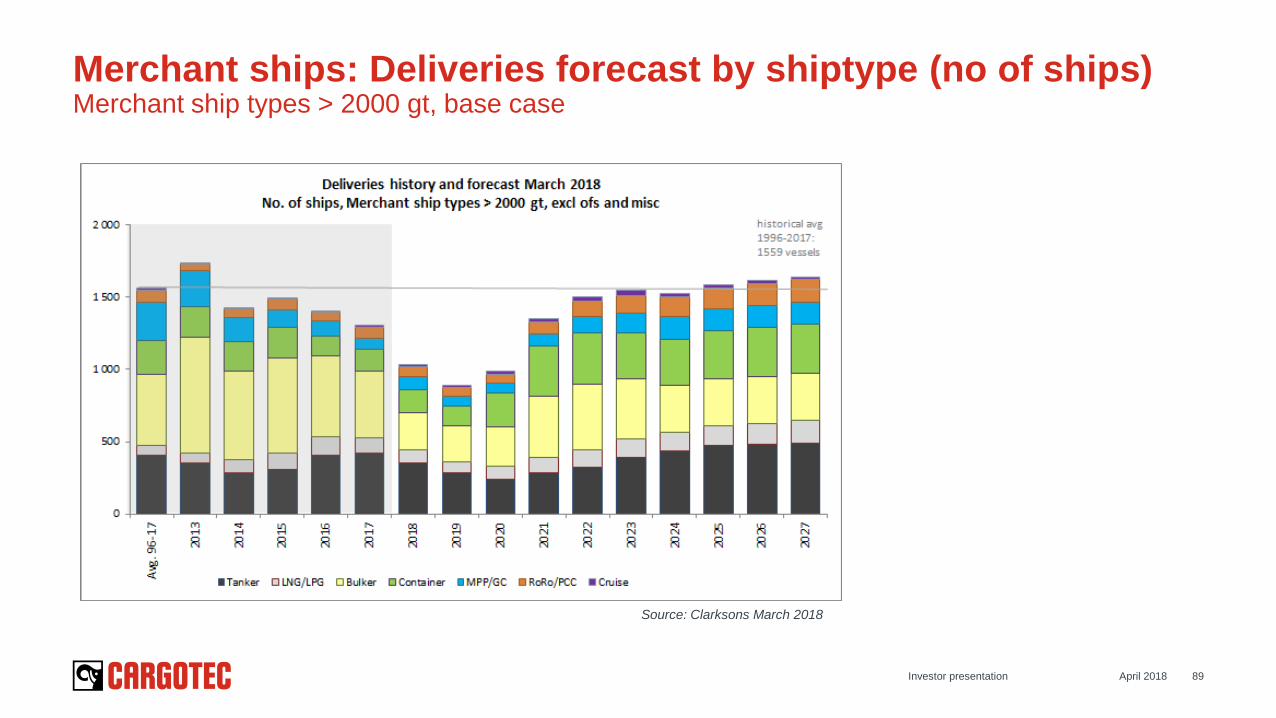
Source: Clarksons March 2018
Merchant ships: Deliveries forecast by shiptype (no of ships)Merchant ship types > 2000 gt, base case
April 2018Investor presentation 89
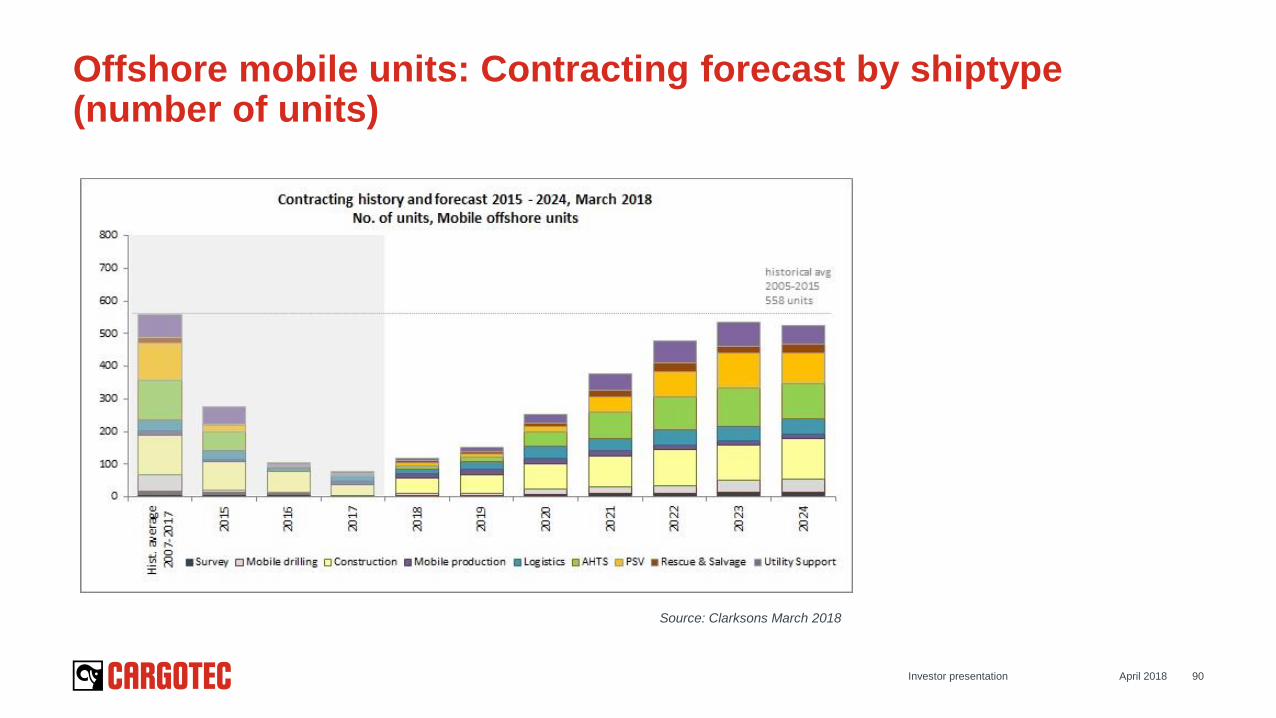
Offshore mobile units: Contracting forecast by shiptype (number of units)
Source: Clarksons March 2018
April 2018Investor presentation 90
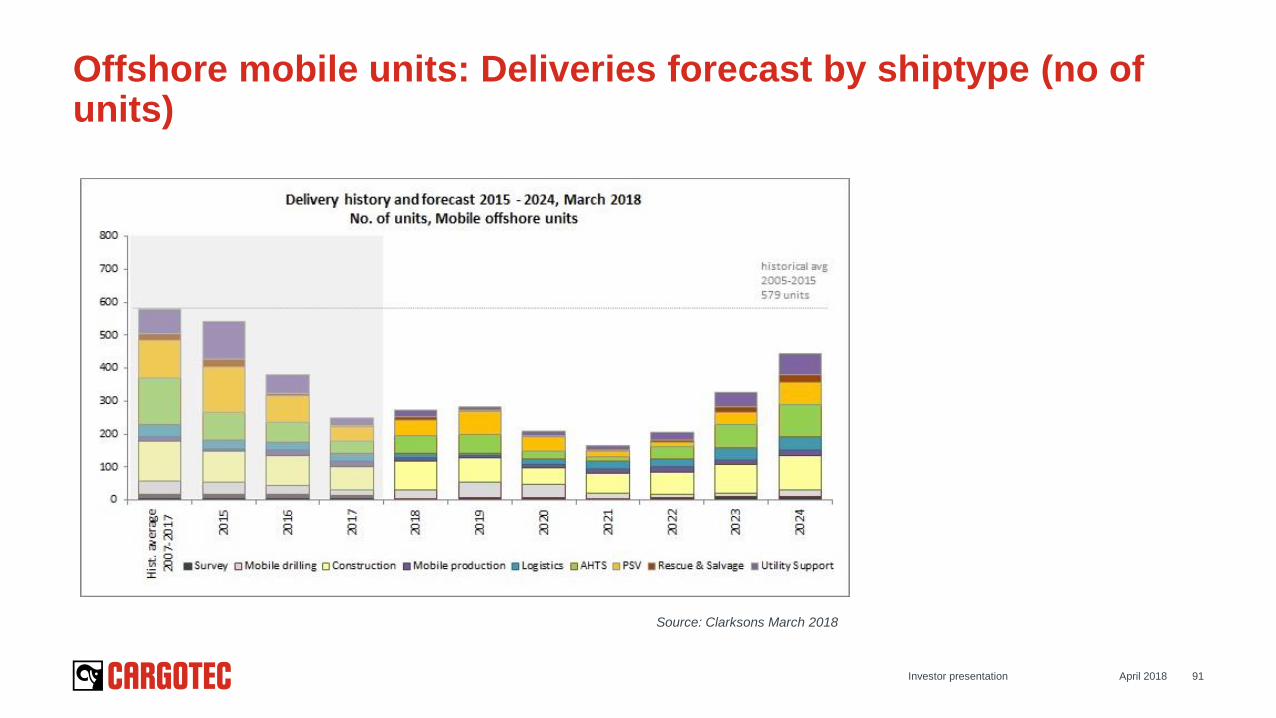
Offshore mobile units: Deliveries forecast by shiptype (no of units)
Source: Clarksons March 2018
April 2018Investor presentation 91
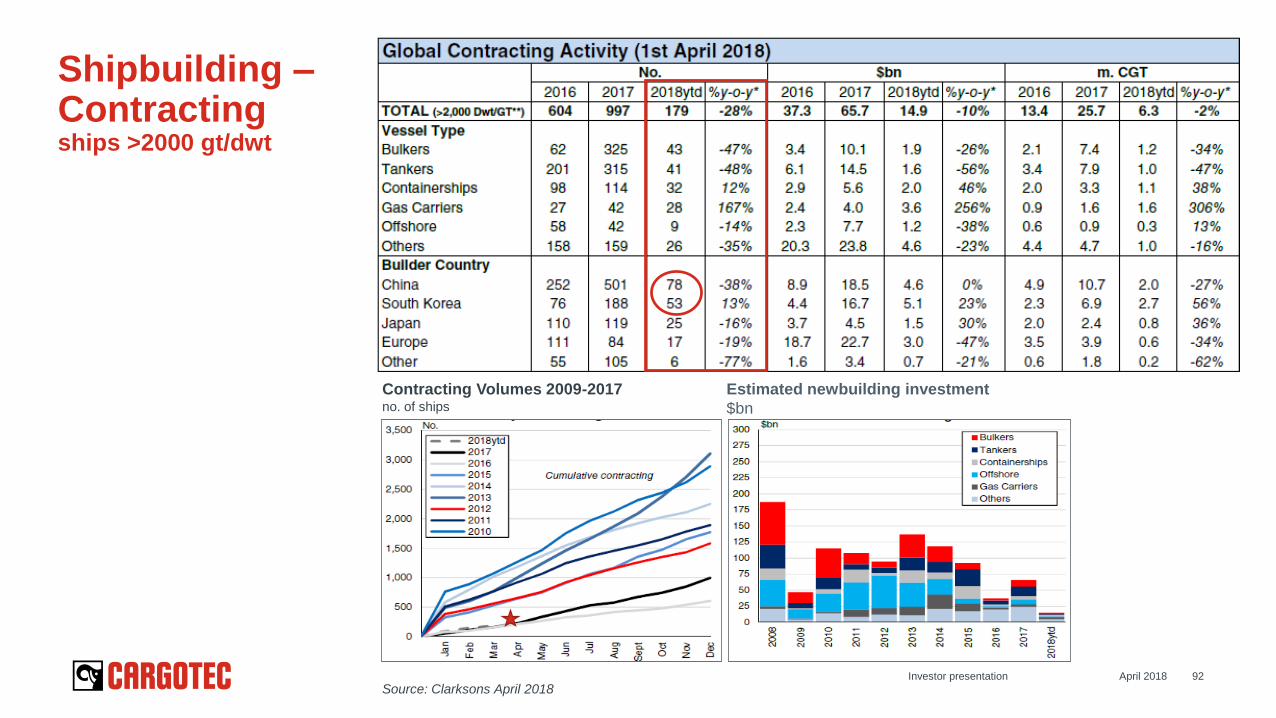
Shipbuilding –Contractingships >2000 gt/dwt
Source: Clarksons April 2018
Contracting Volumes 2009-2017no. of ships
Estimated newbuilding investment
$bn
April 2018Investor presentation 92
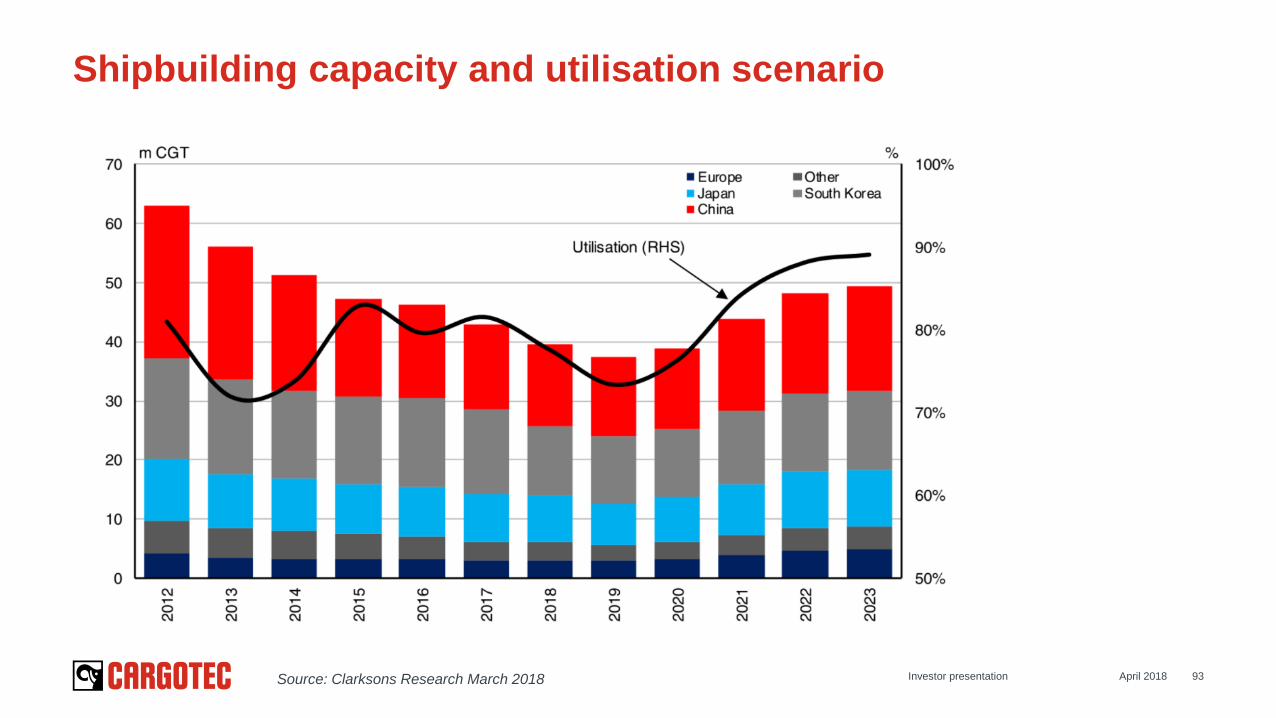
Shipbuilding capacity and utilisation scenario
Source: Clarksons Research March 2018 April 2018Investor presentation 93

Wea
ken
ing
ma
rke
tW
ea
k m
ark
et
Str
on
g m
ark
et
Reco
ve
rin
g m
ark
et
Crude tankers
Dry Bulk
Containers
Offshore
Chemical/Specialised Tankers
LNG
Multipurpose vessels
Car Carriers
Product tankers
LPG Carriers
RoRo/RoPax
Shipping cycle positions; freight/earnings cyclesindicative, timeline of each cycle not defined and varies
Cruise
Markets recovering slowlyMerchant shipping short term more positive outlook, will moderate in longer termOffshore recovery expected to take some more time
Source: Clarksons March 2018
Dry cargo
Oil tanker
Gas carrier
Offshore
Cruise
94
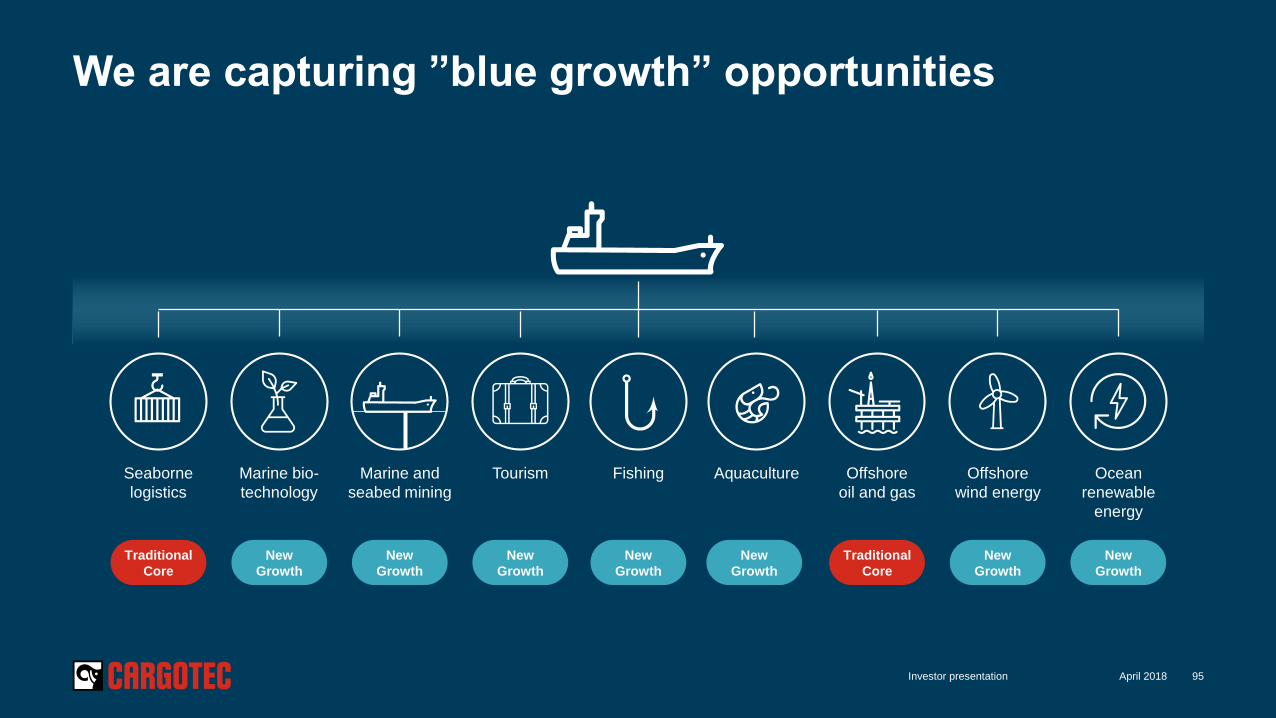
We are capturing ”blue growth” opportunities
Seaborne
logistics
Marine bio-
technology
Marine and
seabed mining
Tourism Fishing Aquaculture Offshore
oil and gas
Offshore
wind energy
Ocean
renewable
energy
Traditional
Core
New
Growth
New
Growth
New
Growth
New
Growth
New
Growth
Traditional
Core
New
Growth
New
Growth
April 2018Investor presentation 95
Disclaimer
April 2018Investor presentation 96
Although forward-looking statements contained in this presentation are based upon what
management of the company believes are reasonable assumptions, there can be no
assurance that forward-looking statements will prove to be accurate, as actual results and
future events could differ materially from those anticipated in such statements. These
statements are not guarantees of future performance and undue reliance should not be placed
on them. The company undertakes no obligation to update forward-looking statements if
circumstances or management’s estimates or opinions should change except as required by
applicable securities laws.
All the discussion topics presented during the session and in the attached material are still in
the planning phase. The final impact on the personnel, for example on the duties of the
existing employees, will be specified only after the legal requirements of each affected
function/ country have been fulfilled in full, including possible informing and/or negotiation
obligations in each function / country.