Embed Size (px)
Citation preview

Send Orders of Reprints at [email protected]
32 The Open Civil Engineering Journal, 2013, 7, 32-49
1874-1495/13 2013 Bentham Open
Open Access
Bed Load Erosion Patterns and Their Effect on the Structural Strength of Rigid Pipes Made of Homogeneous Materials
Hillel Rubin1,*, Dmitry Tokarev1, Eran Rubin2 and Holger Schüttrumpf 3
1Faculty of Civil and Environmental Engineering, Technion – Israel Institute of Technology, Haifa 32000, Israel 2Department of Technology Management, Holon Institute of Technology (HIT), 42 Golomb Street, Holon 5883749, Israel 3Institute of Hydraulic Engineering and Water Resources Management, RWTH Aachen University, Mies-van-der Rohe Str. 1, D- 52056 Aachen, Germany
Abstract: This manuscript concerns the decrease of the structural strength of rigid pipes made of homogeneous materials due to bed load erosion, caused by different concentrations of hard solid particles transported by the sanitary sewage, or surface runoff. Such a phenomenon has been observed in combined sanitary systems (CSS), as well as in force mains de-livering domestic sewage due to the penetration of hard solid particles into the sanitary sewerage system. Field observa-tions have indicated that the low concentrations of solid particles transported with the sewage lead to the formation of a groove at the pipe invert. Experiments carried out in this study have shown that the width of the groove mainly depends on the concentration of the solid particles. Numerical simulations have indicated that bed load erosion resulting from very low concentrations of solid small particles may be more detrimental to the structural strength of the pipe than higher con-centration of such particles.
Keywords: Bed load erosion; concrete pipe failure; bed load erosion pattern; pipe collapse; pipe rupture; pipe crushing; pipe structural strength.
INTRODUCTION
This study has originated from a case history of asbestos-cement (AC) force main collapse occurring in Tel-Aviv area, Israel [1]. At the invert of the collapsed pipe a 20 mm deep and 40 mm wide groove has been found. This groove has been the result of around 30 years of bed load erosion caused by low concentrations of hard solid particles (sand and grav-els) transported with the domestic wastewater delivered through that force main.
In comparison to the broad range of themes connected with sediment transport in water sheds, open channels, ca-nals and pipes, the subject of pipeline abrasion by sediments has been attracted very moderate attention. However, this topic is very much relevant to transport of various types of slurry through pipes [e.g., 2, 3] because the transported high concentration of solid particles of the slurry causes continu-ous decrease of the pipe wall thickness due to its abrasion. Also pipe selection for sewerage and drainage systems con-siders the pipe resistance to abrasion, because this parameter is assumed to affect costs of maintenance and there is a need for rehabilitation or replacement of such systems.
*Address correspondence to the author at the Faculty of Civil and Environ-mental Engineering, Technion – Israel Institute of Technology, Haifa 32000, Israel; Tel: +(972) 4-829-2306; Fax: +(972) 4-822-8898; E-mail: [email protected]
Manufacturers of pipes often support studies aiming to show the advantage of their products by carrying out tests in which the high abrasion resistance of their products is demonstrated [e.g., 3, 4].
With regard to waste water flow, The Engineering Tool Box:
(www.EngineeringToolBox.com) provides the guidelines referring to settling and sedimentation of solids in sewage piping and pumping systems, as well as effects of erosion and abrasion via the linkage:
http://www.engineeringtoolbox.com/sewage-piping-systems-d_568.html
According to the recommendations of this source the flow velocity of the wastewater should exceed certain trou-ble free operation and avoid settling and sedimentation of solids as follows:
For horizontal wastewater pipe systems with solids the speed should exceed 0.9 m/sec.
For wastewater system with organic solids the speed should exceed 0.6 m/sec.
The flow velocity of wastewater must not exceed certain limits to reduce the potential for wear and tear due to the effects of erosion and abrasion as follows:
Bed Load Erosion Patterns and Their Effect on the Structural Strength The Open Civil Engineering Journal, 2013, Volume 7 33
The speed in high-grit sewage handling systems should not exceed 3.6 m/sec.
The flow velocity in sewage systems with low grit con-centrations should not exceed 5.4 m/sec.
It should be noted that The Engineering ToolBox does not refer to patterns of erosion due to bed load or suspended load, and only provides warning against erosion of the pipe wall that originates from the high speed of the sediments moving with the water that is subject to high flow velocity. Further, The Engineering ToolBox gives the impression that the increase of the grit concentration increases the risk of abrasion; and if wastewater flow velocity is lower than 3.6 m/sec then there is no (or very limited) abrasion risk.
The Project Development Design Manual [5] of The Federal Lands Highway identifies two primary causes of early failure in drainage pipe materials:
1) Corrosion, and
2) Abrasion.
Corrosion gradually wears away at the pipe walls by chemical action, and can occur from both the soil and water sides of the pipe. Abrasion wears away at the interior pipe wall by friction from suspended or bed-load sediment. The design manual of polyethylene pipes [6] adds that abrasives – such as stones or debris – can result in mechanical wearing away of the pipe. The extent of the problem depends on the type of abrasive, frequency that the material is in the pipe, velocity of the flow, and the type of pipe material. The effect of abrasives may be seen in the pipe invert where exposure is most severe. Over time, abrasives can result in a loss of pipe strength or reduction in hydraulic quality as they gradually remove wall material. Abrasion is a precursor to accelerated corrosion. The Federal Lands Highway Project Development Design Manual [5] has designed measures of abrasion for typical flow conditions in drainage pipes (rather than a par-ticular design flood) as follows:
Level 1. Nonabrasive conditions exist in areas of no bed load and very low velocities. This is the condition as-sumed for the soil side of drainage pipes.
Level 2. Low abrasive conditions exist in areas of minor bed loads of sand and velocities of 1.5 m/sec or less.
Level 3. Moderate abrasive conditions exist in areas of moderate bed loads of sand and gravel and velocities be-tween 1.5 m/sec and 4.5 m/sec.
Level 4. Severe abrasive conditions exist in areas of heavy bed loads of sand, gravel and rock, and velocities exceeding 4.5 m/sec.
Again it should be noted that like The Engineering Tool-Box, The Federal Lands Highway Project Development De-sign Manual [5] does not refer to patterns of erosion due to bed load or suspended load erosion. It considers that abra-sion risk of the pipe wall increases with the increase of the water flow velocity and the sediment concentration. Further, The Federal Lands Highway Project Development Design Manual [5] gives the impression that abrasion risk always takes place in drainage systems and provides levels of abra-sion, without specifying features typical of the different lev-els of abrasion.
The Department of transportation of California has sup-ported a comprehensive study concerning an evaluation of abrasion resistance of pipe and pipe lining materials [7]. However, the study only refers to corrosion and abrasion of culverts. Further, since effects of pH of the surface runoff are often crucial in most observed cases, the effect of abrasion alone is not clear, and the involvement of all 4 different lev-els of abrasive conditions (in different years and seasons) in most observed cases makes the particular evaluation of the phenomenon of pipe wall abrasion (without corrosion) im-possible.
The Department of Transportation of Colorado has issued corrosion/abrasion guidelines for selecting culvert pipe mate-rials [8]). The report includes a comprehensive literature review of previous studies, handbooks and guidelines con-cerning durability, corrosion and abrasion of drainage pipes and culverts, which had been carried out and issued by de-partments of transportation of various states. Efforts in all these studies, including the study carried out in Colorado are focused on predicting and determining the service life of the pipe that is subject to corrosion and abrasion. Such an inter-est is based on considerations of the pipe wall corrosion and time variation of the pipe wall thickness. Further, none of the studies considers phenomena particularly typical of abrasion caused by the sediments. The report [8] shows the applicabil-ity of some computer codes to predict the service life of various types of pipes.
Testing the effect of abrasion on the wall thickness of a pipe test section and thereby evaluating the abrasion resis-tance of the pipe material can be carried out by several methods. One method is of measuring the loss of the wall thickness due to the effect of sediments moving along the pipe or covered trough test section subject to swinging for a certain time at a certain rate in a Darmstadt swinging appara-tus [e.g., 4, 9, 10]. According to another method we measure the loss of the wall thickness of a pipe test section subject to rotation at a certain speed for a certain time [e.g., 11]. The objective of such measurements is usually to compare the abrasion resistance of different pipe materials without taking into account parameters of the sediments, like particle size, density and concentration. The abrasion resistance in studies concerning this issue is usually defined as the rate of loss of the pipe wall thickness due to the abrasive action.
The concept of abrasion is not limited to flow of water with sediments through pipes. As an example, abrasion resis-tance of construction and coating materials is a common topic. Therefore, measurements of specimens of the pipe material resistance to abrasion are sometimes carried out while assuming the relevance of such tests to resistance of the pipe to abrasion caused by the flow of water with sedi-ments. Such tests are the common hard ball test and the Taber test [e.g., 12]. Taber test involves mounting a flat specimen of the pipe material to a turntable platform that rotates on a vertical axis at a fixed speed. Two Taber abra-sive wheels, which are applied at a specific pressure, are lowered onto the specimen surface. Characteristic rub-wear action is produced by contact of the test specimen against the sliding rotation of the two abrading wheels. As the turntable rotates, the wheels are driven by the sample in opposite di-rections about a horizontal axis displaced tangentially from
34 The Open Civil Engineering Journal, 2013, Volume 7 Rubin et al.
the axis of the sample. One abrading wheel rubs the speci-men outward toward the periphery and the other; inward toward the center while a vacuum system removes loose debris during the test.
Stabik et al. [12] carried out a study with U-PVC pipes and polypropylene pipes filled with 30% CaCO3 by applying in parallel three different methods of measuring the abrasion resistance of the pipe material:
1) Covered trough test sections with Darmstadt swinging apparatus, partially filled with water and sediments,
2) Taber test, and
3) Ball hardness test.
In the partially full covered trough test section the water and the abrading material were subject to swinging. In such a procedure the test section abrasion could not be distributed uniformly along the test section. Therefore the trough wall thickness losses varied along the length of the trough test section; maximum losses took place at the center of the test section, and minimum losses took place at the edges of the test section. Tests of U-PVC pipes with Darmstadt apparatus showed higher resistance to abrasion than tests with poly-propylene filled with 30% CaCO3. Opposite results were obtained with Taber method. Experiments of ball hardness showed higher hardness of polypropylene filled with 30% CaCO3 than for U-PVC. The experimental study of Stabik et al. [12] indicates that higher hardness results of the material are not necessarily connected with higher abrasion resis-tance.
The brief survey represented in preceding paragraphs indicates:
1) The common approach assumes that abrasion risk increases with the concentration of hard sediments transported with water through the pipeline,
2) Measurements of the pipe material properties that may seem relevant to bed load erosion are not neces-sarily connected with the abrasion due to sediment transport with water flowing through the pipe, and
3) The common approach considers that abrasion risk is demonstrated by the decrease of the pipe wall thick-ness due to the bed load erosion, with no reference to the pattern of the bed load erosion.
A previous study [1] incorporates an analysis of the ef-fect of bed load erosion on the structural strength of the AC force main due to the development of the groove at its invert. That type of analysis is applicable to various types of rigid pipes made of homogeneous materials of low and medium resistance to abrasion, like concrete and AC. The objective of the present study is to follow the effect of parameters of the solid particles on the pattern of the groove developed at the pipe invert and to analyze the dependence of the pipe structural strength on the shape of the groove that develops at the pipe invert.
FIELD OBSERVATIONS
The first case history concerns a force main in Tel-Aviv area, which is made of AC pipes whose inner diameter is 1,250 mm and the wall thickness of 70 mm, in which waste-water with extremely low concentrations of hard solids (sand and gravels) is transported [1].
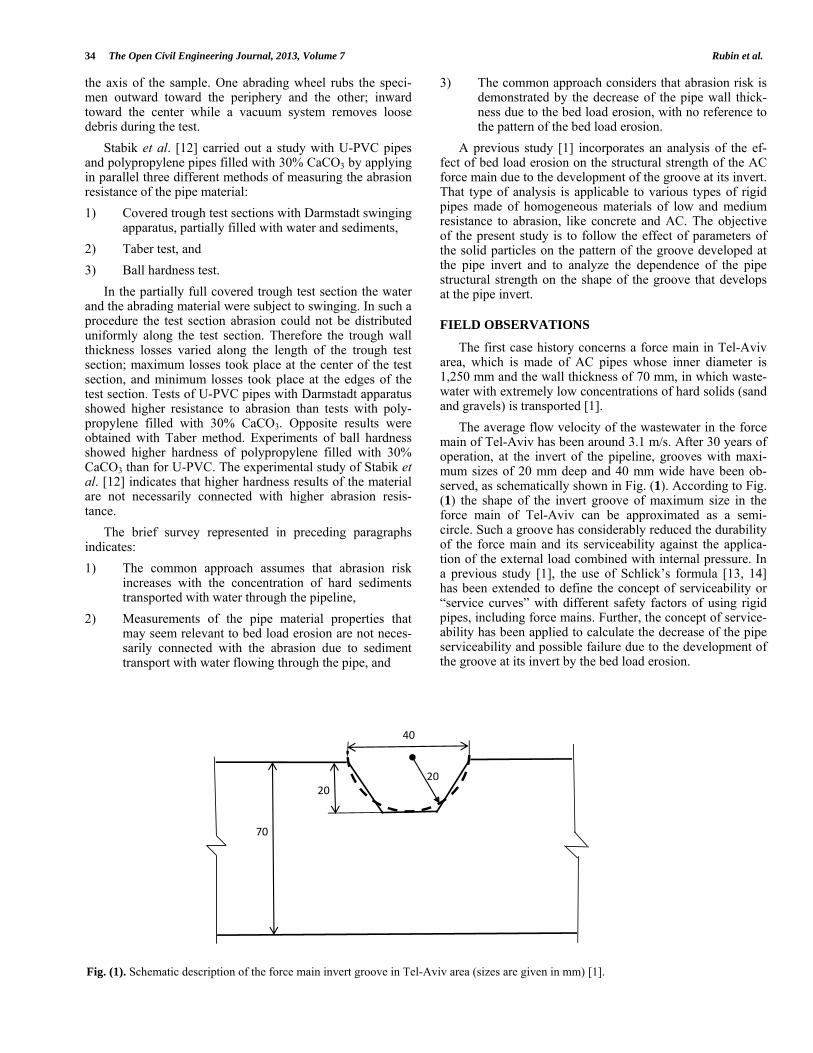
The average flow velocity of the wastewater in the force main of Tel-Aviv has been around 3.1 m/s. After 30 years of operation, at the invert of the pipeline, grooves with maxi-mum sizes of 20 mm deep and 40 mm wide have been ob-served, as schematically shown in Fig. (1). According to Fig. (1) the shape of the invert groove of maximum size in the force main of Tel-Aviv can be approximated as a semi-circle. Such a groove has considerably reduced the durability of the force main and its serviceability against the applica-tion of the external load combined with internal pressure. In a previous study [1], the use of Schlick’s formula [13, 14] has been extended to define the concept of serviceability or “service curves” with different safety factors of using rigid pipes, including force mains. Further, the concept of service-ability has been applied to calculate the decrease of the pipe serviceability and possible failure due to the development of the groove at its invert by the bed load erosion.
Fig. (1). Schematic description of the force main invert groove in Tel-Aviv area (sizes are given in mm) [1].
40
2020
70

Bed Load Erosion Patterns and Their Effect on the Structural Strength The Open Civil Engineering Journal, 2013, Volume 7 35
The second case history of groove development at the force main invert considered by reference [1] has occurred in Vancouver, British Columbia, Canada [15, 16]. In this case the force main has been made of prestressed concrete com-prising part of the combined sanitary system (CSS). In such a sewerage system a single sewer network is used for con-veying surface runoff and wastewater [15]. Therefore, every rain storm leads to flow of surface runoff with hard solid particles mixed with the raw wastewater through the force mains. However, before arriving at the force main the wastewater mixed with surface runoff has passed through a settling system. Therefore the concentration of hard solid particles in wastewater flowing through the force main is very low. The flow velocity range of the wastewater through the force main has been 1.4 – 3.3 m/s. In this case, after 20 years of operation the force main has been subject to several failure events, namely breakage of pieces of the pipe wall and eruption of sewage on the street. These events resulted from the development of grooves at the invert of the force main as shown in Fig. (2). In this case the pipes have been made of prestressed concrete, and the developed groove has allowed direct contact between the steel bars and the flowing wastewater. This contact has led to intensive corrosion of the steel bars and wires leading to fractures and breakage of the concrete pipe wall. Also in this case the maximum depth of the observed groove has been approximately half a circle.
LABORATORY EXPERIMENTS
Abrasion resistance tests of pipe materials have been reported by various studies [e.g., 4, 6, 9, 10, 11] in which the Darmstadt rocker apparatus with various test procedures have been applied.
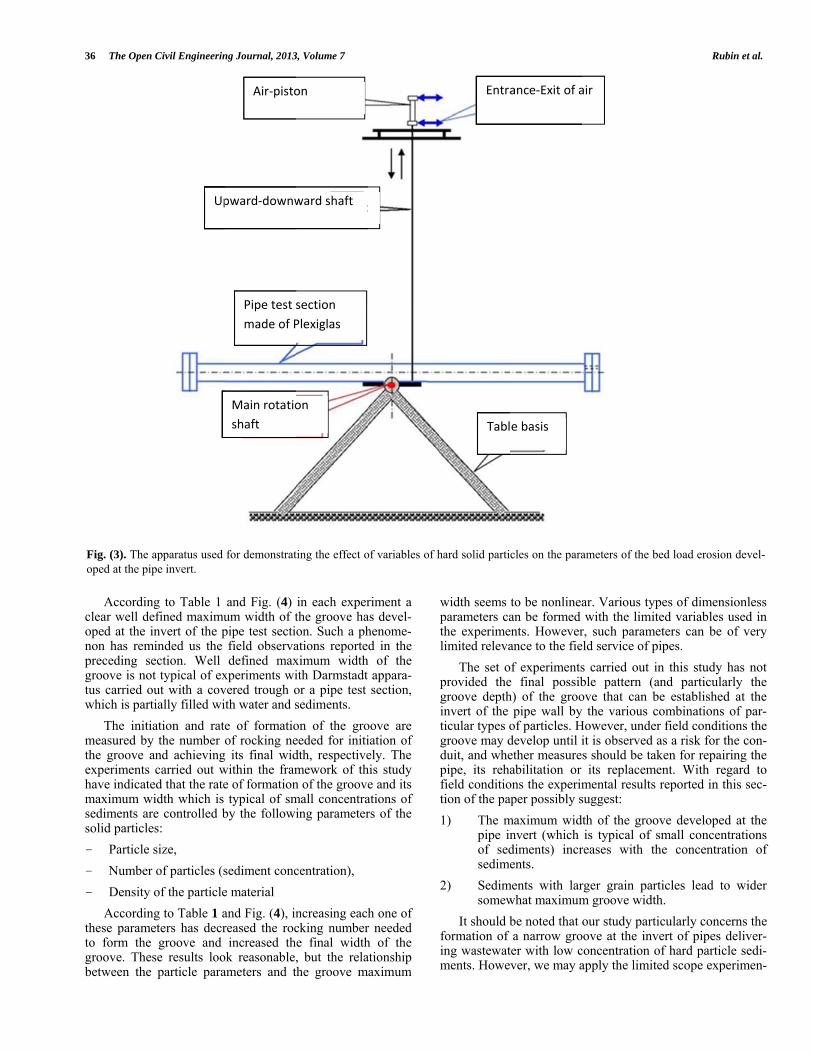
In the present study we have constructed the apparatus shown in Fig. (3) to carry out the specific set of experiments required to demonstrate the effect of small concentrations of solid hard particles characterized by various variables on the parameters of the bed load erosion developed at the pipe invert.
It should be noted that experiments carried out in this study with the apparatus shown in Fig. (3) do not simulate the sediment abrasion in flow through pipes, for example
fine sediments, like sand which are usually transported as bed load or even suspended load in pipe flow, are not subject to rocking in our experimental setup. However, by carrying out tests with the apparatus shown in Fig. (3) it is possible to follow some basic characteristics of the process leading to the groove formation at the pipe test section invert, as de-scribed in following paragraphs.
The pipe test section of the apparatus shown in Fig. (3) has been made of Plexiglas; with length 1,250 mm, internal diameter 54 mm, wall thickness 3 mm. Both ends of the pipe test section have been equipped with caps allowing complete filling of the pipe test section with water and solid particles before carrying out the test and cleanup of the test section from air and impurities. The pipe test section has been sub-ject to a rocking angle of ± 22.50 resulting from the upward and downward movements of the vertical shaft. During the test section rocking, the water in the test section is at rest, and only the hard solid particles are moving at the invert of the test section from one end to the other end and vice versa.
Our objective has been to identify the effect of the den-sity, size and number of hard particles on the size and on the rate of development of the groove that develops at the invert of the pipe test section. Before starting the experiments the internal side of several Plexiglas pipe test sections has been painted with several mixtures of acrylic paint layers whose total thickness 0.6 mm. For our experiments we use the fol-lowing types of solid spherical particles, to which surface fine sand is glued to increase their roughness:
- Spheres made of steel whose diameters were: 4, 6, 15 mm.
- Spheres made of glass whose diameters were: 13, 18 mm.
- Spheres made of lead whose diameter was: 9 mm.
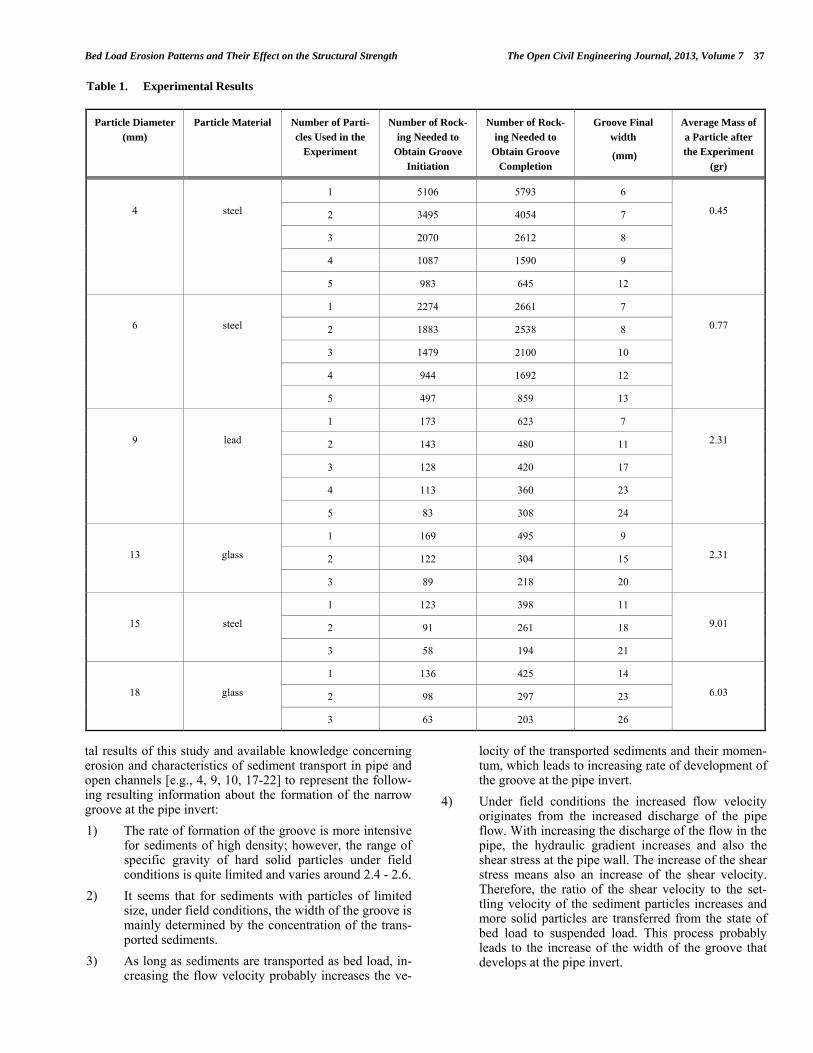
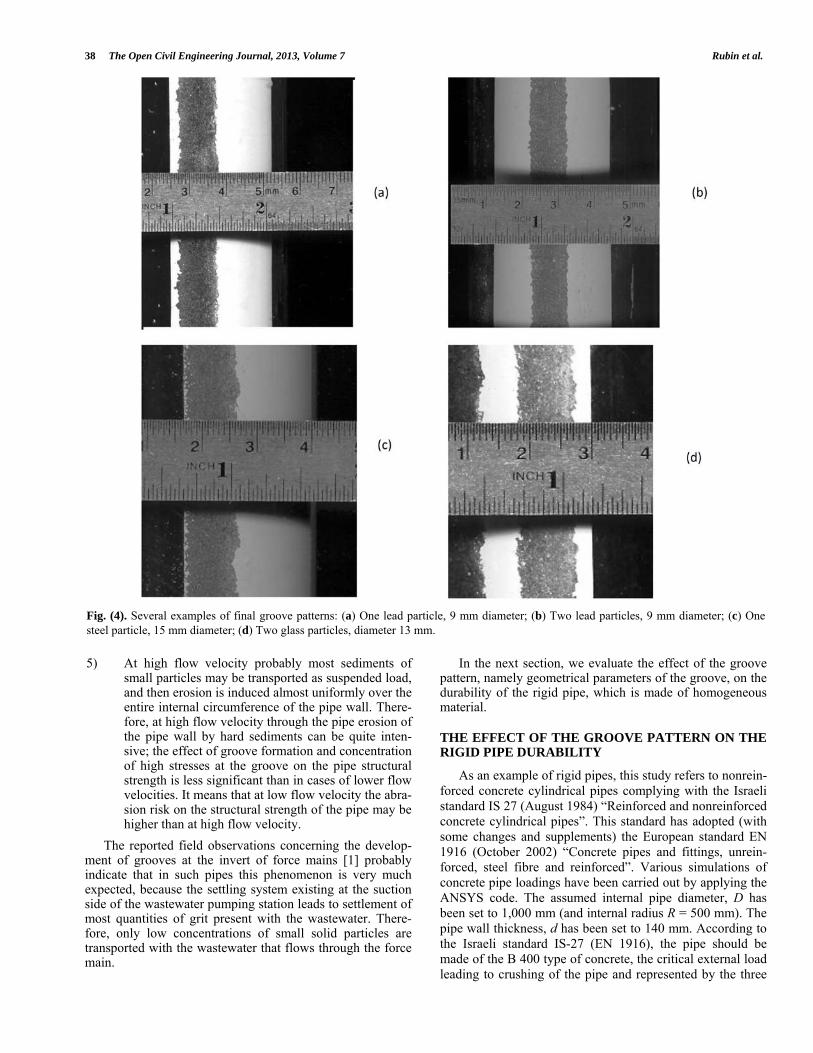
The spherical particles with various numbers have been inserted into the pipe test section, and then the pipe test sec-tion is completely filled with water and connected to the ap-paratus for carrying out the rocking experiment. Results of the experiments are summarized in Table 1. Fig. (4) shows some examples of final grooves formed during the experi-ments.
Fig. (2). The groove developed at the invert of the force main in Vancouver [16].
36 The Open Civil Engineering Journal, 2013, Volume 7 Rubin et al.
According to Table 1 and Fig. (4) in each experiment a clear well defined maximum width of the groove has devel-oped at the invert of the pipe test section. Such a phenome-non has reminded us the field observations reported in the preceding section. Well defined maximum width of the groove is not typical of experiments with Darmstadt appara-tus carried out with a covered trough or a pipe test section, which is partially filled with water and sediments.
The initiation and rate of formation of the groove are measured by the number of rocking needed for initiation of the groove and achieving its final width, respectively. The experiments carried out within the framework of this study have indicated that the rate of formation of the groove and its maximum width which is typical of small concentrations of sediments are controlled by the following parameters of the solid particles:
- Particle size,
- Number of particles (sediment concentration),
- Density of the particle material
According to Table 1 and Fig. (4), increasing each one of these parameters has decreased the rocking number needed to form the groove and increased the final width of the groove. These results look reasonable, but the relationship between the particle parameters and the groove maximum
width seems to be nonlinear. Various types of dimensionless parameters can be formed with the limited variables used in the experiments. However, such parameters can be of very limited relevance to the field service of pipes.
The set of experiments carried out in this study has not provided the final possible pattern (and particularly the groove depth) of the groove that can be established at the invert of the pipe wall by the various combinations of par-ticular types of particles. However, under field conditions the groove may develop until it is observed as a risk for the con-duit, and whether measures should be taken for repairing the pipe, its rehabilitation or its replacement. With regard to field conditions the experimental results reported in this sec-tion of the paper possibly suggest:
1) The maximum width of the groove developed at the pipe invert (which is typical of small concentrations of sediments) increases with the concentration of sediments.
2) Sediments with larger grain particles lead to wider somewhat maximum groove width.
It should be noted that our study particularly concerns the formation of a narrow groove at the invert of pipes deliver-ing wastewater with low concentration of hard particle sedi-ments. However, we may apply the limited scope experimen-
Fig. (3). The apparatus used for demonstrating the effect of variables of hard solid particles on the parameters of the bed load erosion devel-oped at the pipe invert.
Up
Air‐pisto
pward‐downw
Pipe test s
made of P
Main rotatio
shaft
on
ward shaft
section
Plexiglas
on
Entra
Tabl
ance‐Exit of a
e basis
air
Bed Load Erosion Patterns and Their Effect on the Structural Strength The Open Civil Engineering Journal, 2013, Volume 7 37
tal results of this study and available knowledge concerning erosion and characteristics of sediment transport in pipe and open channels [e.g., 4, 9, 10, 17-22] to represent the follow-ing resulting information about the formation of the narrow groove at the pipe invert:
1) The rate of formation of the groove is more intensive for sediments of high density; however, the range of specific gravity of hard solid particles under field conditions is quite limited and varies around 2.4 - 2.6.
2) It seems that for sediments with particles of limited size, under field conditions, the width of the groove is mainly determined by the concentration of the trans-ported sediments.
3) As long as sediments are transported as bed load, in-creasing the flow velocity probably increases the ve-
locity of the transported sediments and their momen-tum, which leads to increasing rate of development of the groove at the pipe invert.
4) Under field conditions the increased flow velocity originates from the increased discharge of the pipe flow. With increasing the discharge of the flow in the pipe, the hydraulic gradient increases and also the shear stress at the pipe wall. The increase of the shear stress means also an increase of the shear velocity. Therefore, the ratio of the shear velocity to the set-tling velocity of the sediment particles increases and more solid particles are transferred from the state of bed load to suspended load. This process probably leads to the increase of the width of the groove that develops at the pipe invert.
Table 1. Experimental Results
Particle Diameter (mm)
Particle Material Number of Parti-cles Used in the
Experiment
Number of Rock-ing Needed to
Obtain Groove Initiation
Number of Rock-ing Needed to
Obtain Groove Completion
Groove Final width
(mm)
Average Mass of a Particle after the Experiment
(gr)
1 5106 5793 6
2 3495 4054 7
3 2070 2612 8
4 1087 1590 9
4
steel
5 983 645 12
0.45
1 2274 2661 7
2 1883 2538 8
3 1479 2100 10
4 944 1692 12
6
steel
5 497 859 13
0.77
1 173 623 7
2 143 480 11
3 128 420 17
4 113 360 23
9
lead
5 83 308 24
2.31
1 169 495 9
2 122 304 15
13
glass
3 89 218 20
2.31
1 123 398 11
2 91 261 18
15
steel
3 58 194 21
9.01
1 136 425 14
2 98 297 23
18
glass
3 63 203 26
6.03
38 The Open Civil Engineering Journal, 2013, Volume 7 Rubin et al.
5) At high flow velocity probably most sediments of small particles may be transported as suspended load, and then erosion is induced almost uniformly over the entire internal circumference of the pipe wall. There-fore, at high flow velocity through the pipe erosion of the pipe wall by hard sediments can be quite inten-sive; the effect of groove formation and concentration of high stresses at the groove on the pipe structural strength is less significant than in cases of lower flow velocities. It means that at low flow velocity the abra-sion risk on the structural strength of the pipe may be higher than at high flow velocity.
The reported field observations concerning the develop-ment of grooves at the invert of force mains [1] probably indicate that in such pipes this phenomenon is very much expected, because the settling system existing at the suction side of the wastewater pumping station leads to settlement of most quantities of grit present with the wastewater. There-fore, only low concentrations of small solid particles are transported with the wastewater that flows through the force main.
In the next section, we evaluate the effect of the groove pattern, namely geometrical parameters of the groove, on the durability of the rigid pipe, which is made of homogeneous material.
THE EFFECT OF THE GROOVE PATTERN ON THE RIGID PIPE DURABILITY
As an example of rigid pipes, this study refers to nonrein-forced concrete cylindrical pipes complying with the Israeli standard IS 27 (August 1984) “Reinforced and nonreinforced concrete cylindrical pipes”. This standard has adopted (with some changes and supplements) the European standard EN 1916 (October 2002) “Concrete pipes and fittings, unrein-forced, steel fibre and reinforced”. Various simulations of concrete pipe loadings have been carried out by applying the ANSYS code. The assumed internal pipe diameter, D has been set to 1,000 mm (and internal radius R = 500 mm). The pipe wall thickness, d has been set to 140 mm. According to the Israeli standard IS-27 (EN 1916), the pipe should be made of the B 400 type of concrete, the critical external load leading to crushing of the pipe and represented by the three
Fig. (4). Several examples of final groove patterns: (a) One lead particle, 9 mm diameter; (b) Two lead particles, 9 mm diameter; (c) One steel particle, 15 mm diameter; (d) Two glass particles, diameter 13 mm.
Bed Load Erosion Patterns and Their Effect on the Structural Strength The Open Civil Engineering Journal, 2013, Volume 7 39
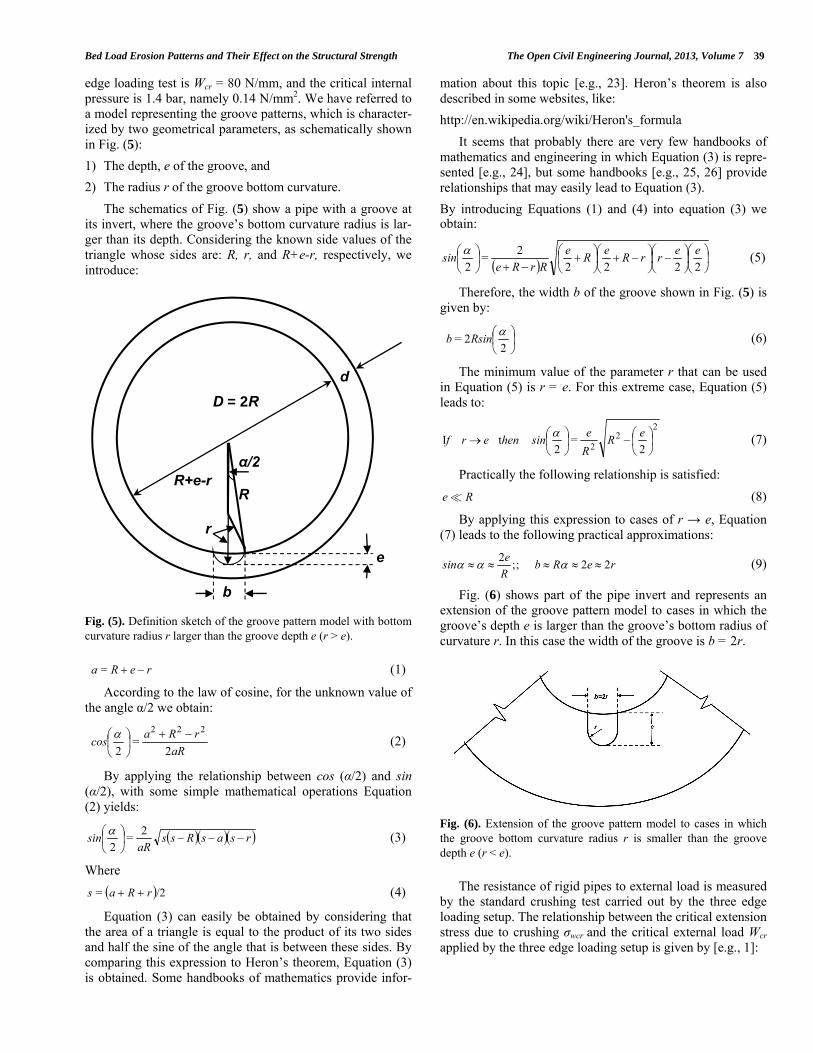
edge loading test is Wcr = 80 N/mm, and the critical internal pressure is 1.4 bar, namely 0.14 N/mm2. We have referred to a model representing the groove patterns, which is character-ized by two geometrical parameters, as schematically shown in Fig. (5):
1) The depth, e of the groove, and
2) The radius r of the groove bottom curvature.
The schematics of Fig. (5) show a pipe with a groove at its invert, where the groove’s bottom curvature radius is lar-ger than its depth. Considering the known side values of the triangle whose sides are: R, r, and R+e-r, respectively, we introduce:
Fig. (5). Definition sketch of the groove pattern model with bottom curvature radius r larger than the groove depth e (r > e).
reRa = (1)
According to the law of cosine, for the unknown value of the angle α/2 we obtain:
aR
rRacos
2=
2
222
(2)
By applying the relationship between cos (α/2) and sin (α/2), with some simple mathematical operations Equation (2) yields:
rsasRssaR
sin
2
=2
(3)
Where
/2= rRas (4)
Equation (3) can easily be obtained by considering that the area of a triangle is equal to the product of its two sides and half the sine of the angle that is between these sides. By comparing this expression to Heron’s theorem, Equation (3) is obtained. Some handbooks of mathematics provide infor-
mation about this topic [e.g., 23]. Heron’s theorem is also described in some websites, like:
http://en.wikipedia.org/wiki/Heron's_formula
It seems that probably there are very few handbooks of mathematics and engineering in which Equation (3) is repre-sented [e.g., 24], but some handbooks [e.g., 25, 26] provide relationships that may easily lead to Equation (3).
By introducing Equations (1) and (4) into equation (3) we obtain:
2222
2=
2
eerrR
eR
e
RrResin
(5)
Therefore, the width b of the groove shown in Fig. (5) is given by:
22=
Rsinb (6)
The minimum value of the parameter r that can be used in Equation (5) is r = e. For this extreme case, Equation (5) leads to:
22
2 2=
2tI
eR
R
esinhenerf
(7)
Practically the following relationship is satisfied:
Re (8)
By applying this expression to cases of r → e, Equation (7) leads to the following practical approximations:
reRbR
esin 22;;
2 (9)
Fig. (6) shows part of the pipe invert and represents an extension of the groove pattern model to cases in which the groove’s depth e is larger than the groove’s bottom radius of curvature r. In this case the width of the groove is b = 2r.
Fig. (6). Extension of the groove pattern model to cases in which the groove bottom curvature radius r is smaller than the groove depth e (r < e).
The resistance of rigid pipes to external load is measured by the standard crushing test carried out by the three edge loading setup. The relationship between the critical extension stress due to crushing σwcr and the critical external load Wcr applied by the three edge loading setup is given by [e.g., 1]:
D = 2R
d
e
b
α/2
R R+e-r
r

40 The Open Civil Engineering Journal, 2013, Volume 7 Rubin et al.
2
53=
d
dDnWcrwcr (10)
Where
n = coefficient whose value is 0.318
D = internal pipe diameter
d = pipe wall thickness
The relationship between the critical extension stress due to internal pressure σpcr and the critical internal pressure pcr, according to the thin ring assumption is given by:
d
dDpcrpcr 2
= (11)
By introducing the required values of the standard IS 27 (EN 1916), namely Wcr = 80 N/mm, D = 1,000 mm, d = 140 mm into Equation (10), we obtain σwcr = 4.70 N/mm2. By introducing those values of D, d and pcr = 0.014 N/mm2 into Equation (11), we obtain σpcr = 0.58 N/mm2. It means that extension stress due to internal pressure is considerably more destructive than extension stress originating from external load. It also indicates that the maximum extension stress and the pattern of the extension stress distribution in the pipe wall determine its failure. However the combined effect of external load and internal pressure leading to failure of the rigid pipe can be approximated by using Schlicks’ formula [13], which is given by:
1=2
crcr p
p
W
W (12)
or:
2
1=
crcr W
W
p
p (13)
Equation (13) represents the failure curve of rigid pipes, which are subject to external load combined with internal pressure. The failure curve can be depicted in the W – p plane. Points with values of W and p that are located below the failure curve represent pipes providing service with some safety conditions. Along the failure curve represented by Equation (13) the critical extension stress varies from 0.58 N/mm2 for pure internal pressure to 4.57 N/mm2 for pure external load. This curve for a pipe with no groove is shown in Fig. (7). In the plane W – p, points with values of the ex-ternal load W and the internal pressure p that are located un-derneath the failure curve represented by Equation (13) de-scribe conditions in which the pipes provide service with some safety factors. For various such points it is possible to claim the pipe serviceability is given by service curves with safety factors K-s. Each one of the service curves is mathe-matically represented by:
0=12
crcr p
pK
W
WK (14)
Fig. (7). The failure curve (with K = 1) and two service curves with safety factors K = 1.5 and K = 2 for a concrete pipe with no groove that satisfies the requirements of the standard IS 27 (EN 1916) (D = 1.000 mm, d = 140 mm).
0
0.2
0.4
0.6
0.8
1
1.2
1.4
0 10 20 30 40 50 60 70 80
K = 1
K = 1.5
K = 2
W [N/mm]
p
[bar]
Bed Load Erosion Patterns and Their Effect on the Structural Strength The Open Civil Engineering Journal, 2013, Volume 7 41
Where K is the safety factor. Equation (14) depicted on the W - p plane provides the graphical presentation of the service curve, which extends between the zero value of the external load (where the internal pressure obtains its maximum value) to the maximum value of the external load (where the inter-nal pressure vanishes). Equation (14) leads to the expression for the safety factor K:
22
22=
crcrcr W
W
p
p
p
pK (15)
The value of the safety factor can be calculated by apply-ing Equation (15) with the known values of Wcr, pcr, W, and p. Equation (15) cannot be used for the extreme case of W = 0, because in this case the first term of Equation (14) van-ishes and it stops to be a second order equation whose solu-tion is represented by Equation (15). However the minimum value of W represents the weight of the pipe filled with wa-ter.
Fig. (7) shows the failure curve (for K = 1) and two ser-vice curves referring to K = 1.5 and K = 2 for a concrete pipe satisfying the standard IS 27 (EN 1916) whose inner diame-ter is D = 1,000 mm and wall thickness d = 140 mm. The larger is the safety factor; the lower is the service curve.
Based on field observations [1] we have assumed that the approximation of Equations (12) or (13) can also be applied to calculate the serviceability of a pipe with a groove at its invert resulting from bed load erosion. However, values of Wcr and pcr for such a pipe are reduced by the presence of the groove, and depend on its pattern. Therefore, as has been stated before, within the framework of this study we have carried out numerous simulations with ANSYS code to ob-
tain quantitative information about the failure of rigid pipes with various groove patterns.
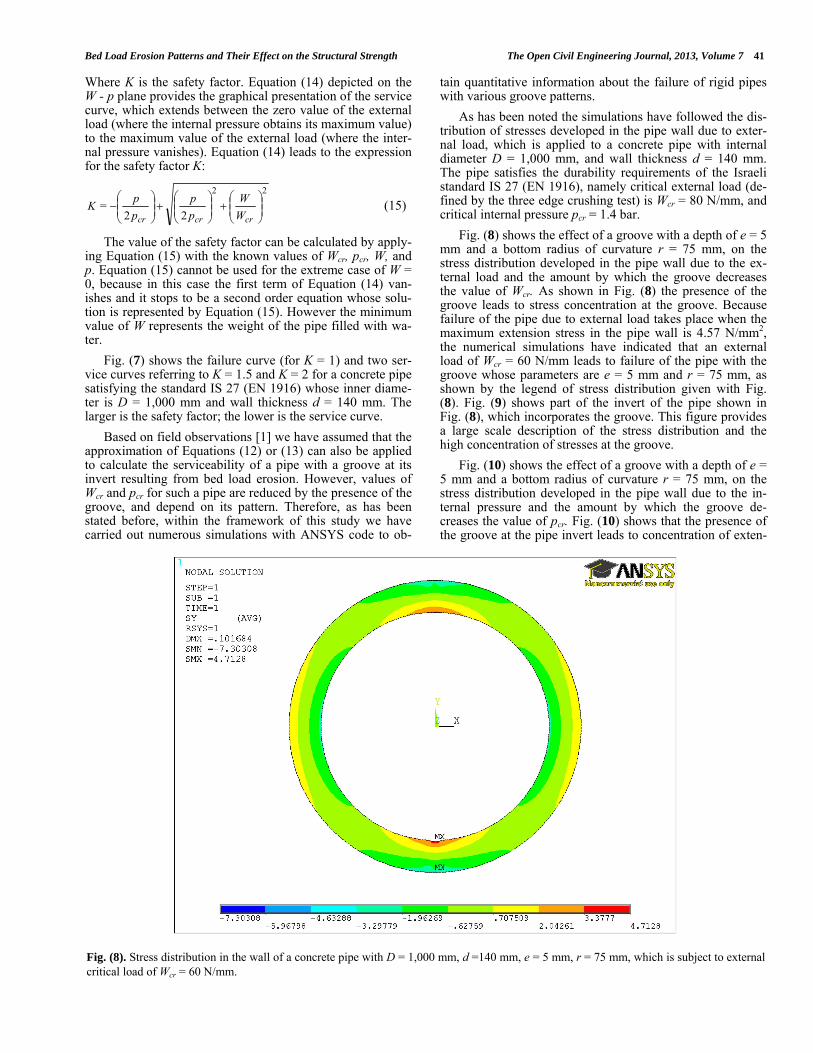
As has been noted the simulations have followed the dis-tribution of stresses developed in the pipe wall due to exter-nal load, which is applied to a concrete pipe with internal diameter D = 1,000 mm, and wall thickness d = 140 mm. The pipe satisfies the durability requirements of the Israeli standard IS 27 (EN 1916), namely critical external load (de-fined by the three edge crushing test) is Wcr = 80 N/mm, and critical internal pressure pcr = 1.4 bar.
Fig. (8) shows the effect of a groove with a depth of e = 5 mm and a bottom radius of curvature r = 75 mm, on the stress distribution developed in the pipe wall due to the ex-ternal load and the amount by which the groove decreases the value of Wcr. As shown in Fig. (8) the presence of the groove leads to stress concentration at the groove. Because failure of the pipe due to external load takes place when the maximum extension stress in the pipe wall is 4.57 N/mm2, the numerical simulations have indicated that an external load of Wcr = 60 N/mm leads to failure of the pipe with the groove whose parameters are e = 5 mm and r = 75 mm, as shown by the legend of stress distribution given with Fig. (8). Fig. (9) shows part of the invert of the pipe shown in Fig. (8), which incorporates the groove. This figure provides a large scale description of the stress distribution and the high concentration of stresses at the groove.
Fig. (10) shows the effect of a groove with a depth of e = 5 mm and a bottom radius of curvature r = 75 mm, on the stress distribution developed in the pipe wall due to the in-ternal pressure and the amount by which the groove de-creases the value of pcr. Fig. (10) shows that the presence of the groove at the pipe invert leads to concentration of exten-
Fig. (8). Stress distribution in the wall of a concrete pipe with D = 1,000 mm, d =140 mm, e = 5 mm, r = 75 mm, which is subject to external critical load of Wcr = 60 N/mm.
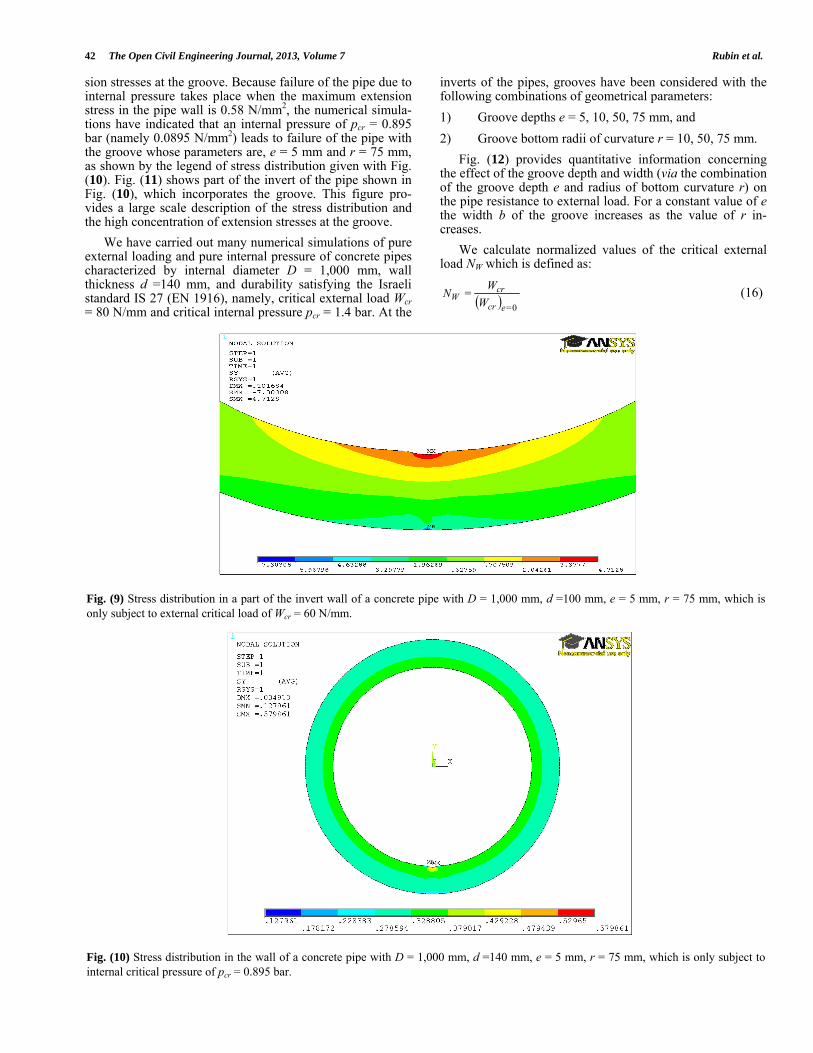
42 The Open Civil Engineering Journal, 2013, Volume 7 Rubin et al.
sion stresses at the groove. Because failure of the pipe due to internal pressure takes place when the maximum extension stress in the pipe wall is 0.58 N/mm2, the numerical simula-tions have indicated that an internal pressure of pcr = 0.895 bar (namely 0.0895 N/mm2) leads to failure of the pipe with the groove whose parameters are, e = 5 mm and r = 75 mm, as shown by the legend of stress distribution given with Fig. (10). Fig. (11) shows part of the invert of the pipe shown in Fig. (10), which incorporates the groove. This figure pro-vides a large scale description of the stress distribution and the high concentration of extension stresses at the groove.
We have carried out many numerical simulations of pure external loading and pure internal pressure of concrete pipes characterized by internal diameter D = 1,000 mm, wall thickness d =140 mm, and durability satisfying the Israeli standard IS 27 (EN 1916), namely, critical external load Wcr = 80 N/mm and critical internal pressure pcr = 1.4 bar. At the
inverts of the pipes, grooves have been considered with the following combinations of geometrical parameters:
1) Groove depths e = 5, 10, 50, 75 mm, and
2) Groove bottom radii of curvature r = 10, 50, 75 mm.
Fig. (12) provides quantitative information concerning the effect of the groove depth and width (via the combination of the groove depth e and radius of bottom curvature r) on the pipe resistance to external load. For a constant value of e the width b of the groove increases as the value of r in-creases.
We calculate normalized values of the critical external load NW which is defined as:
0=
=ecr
crW W
WN (16)
Fig. (9) Stress distribution in a part of the invert wall of a concrete pipe with D = 1,000 mm, d =100 mm, e = 5 mm, r = 75 mm, which is only subject to external critical load of Wcr = 60 N/mm.
Fig. (10) Stress distribution in the wall of a concrete pipe with D = 1,000 mm, d =140 mm, e = 5 mm, r = 75 mm, which is only subject to internal critical pressure of pcr = 0.895 bar.

Bed Load Erosion Patterns and Their Effect on the Structural Strength The Open Civil Engineering Journal, 2013, Volume 7 43
Fig. (13) is basically similar to Fig. (12), but refers to the normalized external load NW.
Both Fig. (12) and Fig. (13) indicate that the groove de-veloped at the invert of the rigid pipe decreases the pipe re-sistance to external load. However, the following phenomena characterize this decrease:
1) The effect of reducing the pipe resistance to external load by the groove decreases with an increase of the width of the groove.
2) The effect of the groove increases very significantly at small groove depths; it increases more moderately (and almost linearly) at large groove depths. As an
example, according to Fig. (13) in the case of a groove with r = 10 mm the value of NW decreases from 1 to less than 0.4 (a decrease of 60%) with the variation of the groove depth from e = 0 to e = 10 mm; whereas between e = 10 mm and e = 70 mm, the value of NW changes from less than 0.4 to around 0.2, namely a decrease from 60% to 80%.
3) It is possible to roughly classify two possible practical ranges of groove depths: 1) small depths, and 2) large depths. In the first range the effect of the groove strongly increases with the groove depth; in the sec-ond range the effect of the groove increases more moderately with the increase of the groove depth.
Fig. (11). Stress distribution in a part of the invert wall of a concrete pipe with D = 1,000 mm, d =140 mm, e = 5 mm, r = 75 mm, which is subject to internal critical pressure of pcr = 0.895 bar.
Fig. (12). The decrease of the pipe resistance to external load due to the depth e of the groove for various values of the groove bottom radius of curvature r (concrete pipe D = 1,000 mm, d = 140 mm).
0
10
20
30
40
50
60
70
80
0 10 20 30 40 50 60 70e [mm]
r = 75 mm
r = 50 mm
r = 10 mm
Wcr [N/mm]

44 The Open Civil Engineering Journal, 2013, Volume 7 Rubin et al.
Fig. (14) provides quantitative information concerning the effect of reducing the pipe resistance to internal pressure due to the groove depth and width (via the combination of the groove depth e and the radius of bottom curvature r). Similarly to the case of pure external load also for pure in-ternal pressure we should take into account that for a con-stant value of e the width b of the groove increases with the increase of r.
We calculate normalized values of the critical internal pressure Np which is defined as:
0=
=ecr
crp p
pN (17)
Fig. (15) is basically similar to Fig. (14), but refers to the normalized internal pressure Np.
Both Fig. (14) and Fig. (15) indicate that the groove de-veloped at the invert of the rigid pipe decreases the pipe re-sistance to internal pressure. Importantly, the following phe-nomena characterize this decrease:
1) The effect of the groove reducing the pipe resistance to internal pressure decreases with an increase of the width of the groove.
2) The effect of the groove reducing the pipe resistance to internal pressure increases very significantly in small
groove depths; it increases more moderately (and almost linearly) in large groove depths. As an example, accord-ing to Fig. (15), in the case of a groove with r = 10 mm the value of Np decreases from 1 to less than 0.3 (a de-crease of around 70%) when the groove’s depth varies from e = 0 to e = 10 mm; whereas between e = 10 mm and e = 70 mm, the value of Np changes from less than 0.7 to around 0.08, namely a decrease from around 70% to a decrease of around 90%.
3) Comparing results for Np with those for NW shown in Fig. (13), it seems that the effect of the groove on reducing the pipe resistance to internal pressure is more significant than its effect on reducing the pipe resistance to external load.
4) Also for the groove reducing the pipe resistance to inter-nal pressure it is possible to roughly classify two possible practical ranges of groove depths: 1) small depths, and 2) large depths. In the first range the effect of the groove strongly increases with the groove depth; in the second range the effect of the groove increases more moderately with the increase of the groove depth.
Figs. (12-15) indicate that the groove effect on the pipe resistance to internal pressure is more significant than its effect on the pipe resistance to external load. It means that the development of the groove at the pipe invert changes the
Fig. (13). The decrease of the normalized critical external load due to the depth e of the groove for various values of the groove bottom ra-dius of curvature r (concrete pipe D = 1,000 mm, d = 140 mm.
0
0.1
0.2
0.3
0.4
0.5
0.6
0.7
0.8
0.9
1
0 10 20 30 40 50 60 70e [mm]
NW
r = 10 mm
r = 50 mm
r = 75 mm

Bed Load Erosion Patterns and Their Effect on the Structural Strength The Open Civil Engineering Journal, 2013, Volume 7 45
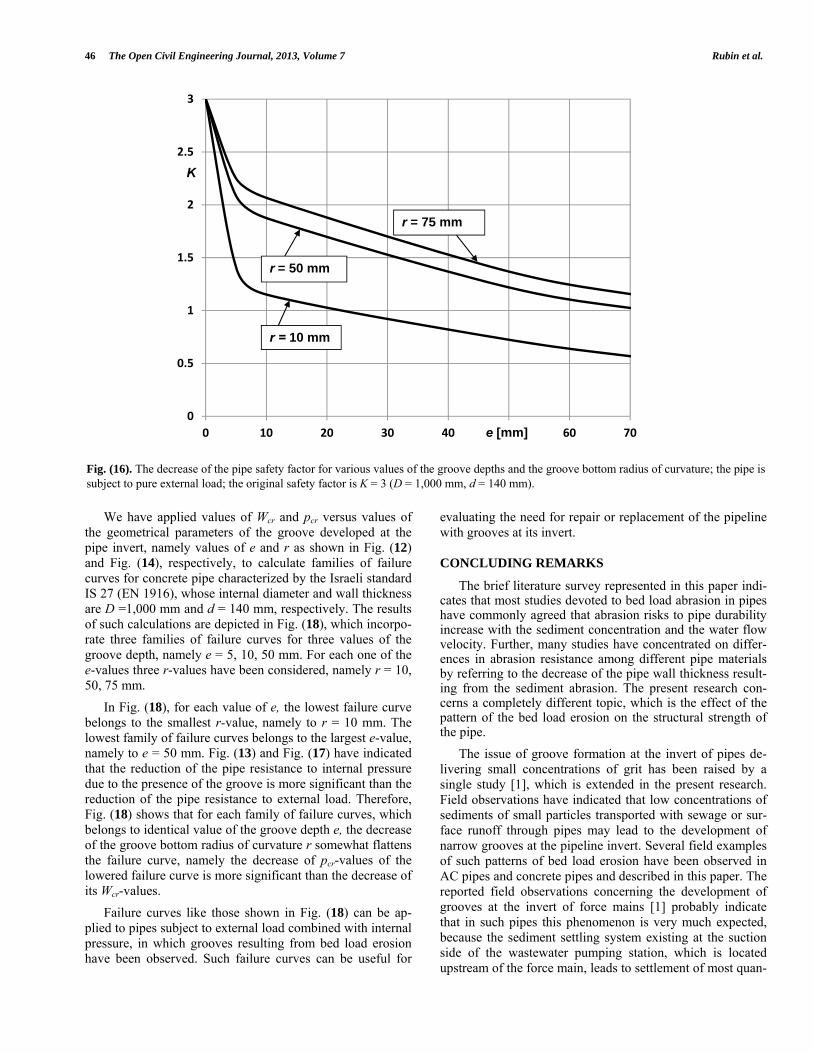
shape of the pipe failure curve, its potential new service curves, and therefore such effects should be demonstrated by some effects on the decrease of the original factor of safety of the pipe service. Fig. (16) provides an example that shows the decrease of the pipe factor of safety from its original value K = 3 due to the groove development when the pipe is subject to pure external load. Fig. (17) provides another ex-
ample that shows the decrease of the pipe factor of safety from its original value K = 3 due to the groove development when the pipe is subject to pure internal pressure. Rates of decrease of safety factors shown in Fig. (17) are significantly higher. For cases of pipes subject to external load combined with internal pressure Equation (15) should be applied for calculating the decrease of the pipe safety factor.
Fig. (14). The decrease of the pipe resistance to internal pressure due to the depth e of the groove for various values of the groove bottom radius of curvature r (concrete pipe D = 1,000 mm, d = 140 mm).
Fig. (15). The decrease of the normalized critical internal pressure due to the depth e of the groove for various values of the groove bottom radius of curvature r (concrete pipe D = 1,000 mm, d = 140 mm).
0
0.2
0.4
0.6
0.8
1
1.2
1.4
0 10 20 30 40 50 60 70e [mm]
r= 10 mm
r= 50 mm
r= 75 mm
Pc [bar]
0
0.1
0.2
0.3
0.4
0.5
0.6
0.7
0.8
0.9
1
0 10 20 30 40 50 60 70
Np
e [mm]
r = 75 mm
r = 50 mm
r = 10 mm
46 The Open Civil Engineering Journal, 2013, Volume 7 Rubin et al.
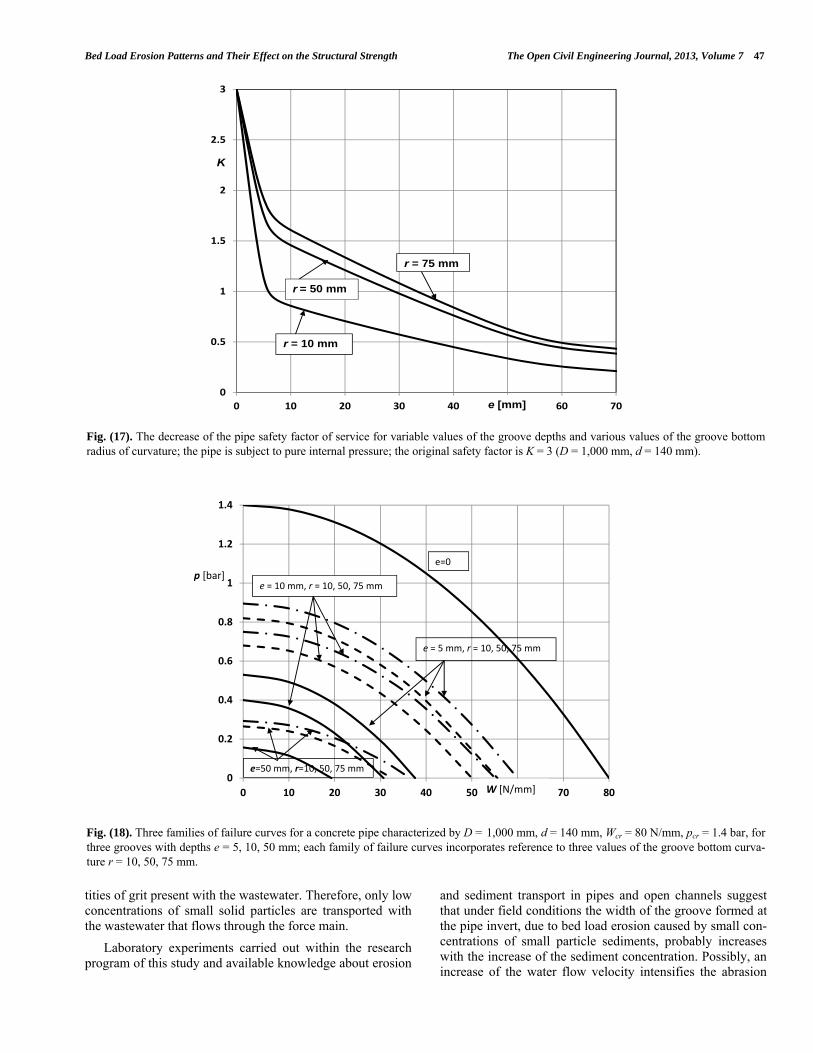
We have applied values of Wcr and pcr versus values of the geometrical parameters of the groove developed at the pipe invert, namely values of e and r as shown in Fig. (12) and Fig. (14), respectively, to calculate families of failure curves for concrete pipe characterized by the Israeli standard IS 27 (EN 1916), whose internal diameter and wall thickness are D =1,000 mm and d = 140 mm, respectively. The results of such calculations are depicted in Fig. (18), which incorpo-rate three families of failure curves for three values of the groove depth, namely e = 5, 10, 50 mm. For each one of the e-values three r-values have been considered, namely r = 10, 50, 75 mm.
In Fig. (18), for each value of e, the lowest failure curve belongs to the smallest r-value, namely to r = 10 mm. The lowest family of failure curves belongs to the largest e-value, namely to e = 50 mm. Fig. (13) and Fig. (17) have indicated that the reduction of the pipe resistance to internal pressure due to the presence of the groove is more significant than the reduction of the pipe resistance to external load. Therefore, Fig. (18) shows that for each family of failure curves, which belongs to identical value of the groove depth e, the decrease of the groove bottom radius of curvature r somewhat flattens the failure curve, namely the decrease of pcr-values of the lowered failure curve is more significant than the decrease of its Wcr-values.
Failure curves like those shown in Fig. (18) can be ap-plied to pipes subject to external load combined with internal pressure, in which grooves resulting from bed load erosion have been observed. Such failure curves can be useful for
evaluating the need for repair or replacement of the pipeline with grooves at its invert.
CONCLUDING REMARKS
The brief literature survey represented in this paper indi-cates that most studies devoted to bed load abrasion in pipes have commonly agreed that abrasion risks to pipe durability increase with the sediment concentration and the water flow velocity. Further, many studies have concentrated on differ-ences in abrasion resistance among different pipe materials by referring to the decrease of the pipe wall thickness result-ing from the sediment abrasion. The present research con-cerns a completely different topic, which is the effect of the pattern of the bed load erosion on the structural strength of the pipe.
The issue of groove formation at the invert of pipes de-livering small concentrations of grit has been raised by a single study [1], which is extended in the present research. Field observations have indicated that low concentrations of sediments of small particles transported with sewage or sur-face runoff through pipes may lead to the development of narrow grooves at the pipeline invert. Several field examples of such patterns of bed load erosion have been observed in AC pipes and concrete pipes and described in this paper. The reported field observations concerning the development of grooves at the invert of force mains [1] probably indicate that in such pipes this phenomenon is very much expected, because the sediment settling system existing at the suction side of the wastewater pumping station, which is located upstream of the force main, leads to settlement of most quan-
Fig. (16). The decrease of the pipe safety factor for various values of the groove depths and the groove bottom radius of curvature; the pipe is subject to pure external load; the original safety factor is K = 3 (D = 1,000 mm, d = 140 mm).
0
0.5
1
1.5
2
2.5
3
0 10 20 30 40 50 60 70e [mm]
r = 10 mm
r = 50 mm
r = 75 mm
K
Bed Load Erosion Patterns and Their Effect on the Structural Strength The Open Civil Engineering Journal, 2013, Volume 7 47
tities of grit present with the wastewater. Therefore, only low concentrations of small solid particles are transported with the wastewater that flows through the force main.
Laboratory experiments carried out within the research program of this study and available knowledge about erosion
and sediment transport in pipes and open channels suggest that under field conditions the width of the groove formed at the pipe invert, due to bed load erosion caused by small con-centrations of small particle sediments, probably increases with the increase of the sediment concentration. Possibly, an increase of the water flow velocity intensifies the abrasion
Fig. (17). The decrease of the pipe safety factor of service for variable values of the groove depths and various values of the groove bottom radius of curvature; the pipe is subject to pure internal pressure; the original safety factor is K = 3 (D = 1,000 mm, d = 140 mm).
Fig. (18). Three families of failure curves for a concrete pipe characterized by D = 1,000 mm, d = 140 mm, Wcr = 80 N/mm, pcr = 1.4 bar, for three grooves with depths e = 5, 10, 50 mm; each family of failure curves incorporates reference to three values of the groove bottom curva-ture r = 10, 50, 75 mm.
0
0.5
1
1.5
2
2.5
3
0 10 20 30 40 50 60 70e [mm]
K
r = 10 mm
r = 50 mm
r = 75 mm
0
0.2
0.4
0.6
0.8
1
1.2
1.4
0 10 20 30 40 50 60 70 80W [N/mm]
e=50 mm, r=10, 50, 75 mm
e=0
p [bar] e = 10 mm, r = 10, 50, 75 mm
e = 5 mm, r = 10, 50, 75 mm
W [N/mm]
48 The Open Civil Engineering Journal, 2013, Volume 7 Rubin et al.
effect of the transported sediments, but on the other hand the increased flow velocity may lead to transfer of particles from the state of bed load to the state of suspended load and thereby the groove width increases, and the risk of abrasion to the structural strength of the pipe decreases.
The developed groove pattern has been represented by a model useful for carrying out the structural analysis of the pipe with the groove at its invert. This model is characterized by two geometrical parameters: 1) the groove’s depth, and 2) the groove’s bottom radius of curvature. The groove’s width is determined by these parameters according to simple geo-metrical relationships. We have carried out numerous nu-merical simulations with ANSYS code to characterize the effect of the groove parameters on the pipe durability, namely structural strength and resistance to external load and/or internal pressure. The major outcomes of our simula-tions are:
1) The groove considerably reduces the pipe resistance to external load as well as to internal pressure, due to stress concentration at the groove; the durability re-duction is more effective on internal pressure than on external load.
2) The pipe durability reduction due to the presence of the groove is most effective for narrow grooves; therefore, very low concentrations of small particle sediments transported with the sewage or surface runoff may lead to high risks of the pipe failure due to bed load erosion.
3) By applying formulas based on the extension of Schlick’s formula it is possible to calculate the effect of the groove developed at the pipe invert on its factor of safety for proper service.
4) By applying formulas based on the extension of Schlick’s formula it is possible to obtain families of failure curves for pipes subject to external load com-bined with internal pressure, in which grooves result-ing from bed load erosion have been observed. Such curves represent the decrease of the pipe serviceabil-ity due to bed load erosion and can be useful for evaluating the need for repair or replacement of a pipeline because grooves are developed at its invert due to bed load erosion.
CONFILICT OF INTEREST
The author(s) confirm that this article content has no con-flicts of interest.
ACKNOWLEDGEMENTS
This study has been supported by the Umbrella Research Cooperation of RWTH Aachen University and Technion – Israel Institute of Technology devoted to “Sustainable Urban Development”.
The authors thank Eng. Gideon Zac, formerly General Manager of Dan Area Communities Consortium for provid-ing basic field data and helpful discussions. We are grateful to Prof. Robert Levy of Ben-Gurion University of the Negev for his help and guidance with using the ANSYS code for
the numerical simulations required by this study. The authors appreciate very much the important information, as well as photos concerning issues of this study given by Eng. Paul Wilting, Senior Project Engineer, Greater Vancouver Re-gional District. Helpful comments and discussions with Prof. Thomas O’Rourke of Cornell University are deeply appreci-ated.
REFERENCES
[1] H. Rubin, D. Tokarev, and H. Schüttrumpf, “The effect of low concentrations of bedload on the erosion pattern and the structural strength of rigid force mains”, The Open Civil Engineering Jour-nal, vol. 4, pp. 105-115, 2010
[2] A. Tohyama, T. Takaoka, H. Furukawa, H. Hori, T., Fukui, and Y. Minami, “Development of abrasion-resistant pipe (NK-SL80) for slurry transportation systems”, NKK Technical Review, no. 85, pp. 16-22, 2001.
[3] American Concrete Pipe Association, “Abrasion a concern in fiber cement pipe”, Dispatch, vol.1, pp. 1-4, 2005.
[4] L. H. Gabriel, Abrasion Resistance of Polyethylene and Other Pipes. CA: California State University: Sacramento, 1990.
[5] Federal Land Highway, The Federal Lands Highway Project De-velopment Design Manual, Chapter 7 – Hydrology and Hydraulics. Department of Transportation, Washington, DC, 2012.
[6] L. H. Gabriel, Corrugated Polyethylene Pipe Design Manual & Installation Guide, Chapter 7 Durability and Life Service. CPPA, Plastic Pipe Institute (PPI), Irving TX, 2012.
[7] G. DeCou, and P. Davies, Evaluation of Abrasion Resistance of Pipe and Pipe Lining Materials, Final Report, FHWA/CA/TL – CA01-0173 EA 680442, Department of Transportation. MS 28. Of-fice of Highway Drainage Design: Sacramento, CA, 2007.
[8] A. Molinas, and A. Mommandi, Development of New Corro-sion/Abrasion Guidelines for Selection of Culvert Pipe Materials, Report No. CDOT-2009-11, Final Report, Colorado Department of Transportation, DTD Applied Research and Innovation Branch. Fort Collins, CO: Colorado State University and Hydrau-Tech, Inc., 2009.
[9] L. H. Gabriel, A Study of Invert Wear of Ultra-Rib PVC Profile Pipes. California State University: Sacramento, CA, 1992.
[10] V. Heggemoen, and H. Jonsson, Abrasion Resistance Test. Sande-fjord, Norway: Flowtite Technology AS, 1997.
[11] National Clay Pipe Institute (NCPI), “Abrasion resistance of sewer pipe materials”, TN, no. 02-17, 2002.
[12] J. Stabik, M. Makselon, and H. Tomanek, “Erosion resistance testing of plastic pipes”, Journal of Achievements in Materials and Manufacturing Engineering, vol. 25, pp. 47-50, 2007.
[13] W. J. Schlick, Supporting Strength of Cast-Iron Pipe for Water Service, Bulletin No. 146. Ames, Iowa: Iowa State College, 1940.
[14] ISO-2785, Directives for Selection of Asbestos-Cement Pipes Sub-ject to External Loads with or without Internal Pressure. Geneva, Switzerland: International Organization for Standardization (ISO), 1986.
[15] Greater Vancouver Sewerage and Drainage District, Incident report – Release of wastewater through Overflows to Burrard Inlet, Re-port Prepared for Ministry of Environment, Lands and Parks Envi-ronmental Protection. Vancouver, Canada: Sewerage and Drainage District, September 2000.
[16] P. Wilting, Records of Force Main Failure in Vancouver. Vancou-ver, Canada: Greater Vancouver Regional District (presently, “Metro Vancouver”), Personal Communication, 2004.
[17] W. R. Crabtree, “Sediment in sewers”, Journal of the Institution of Water and Environmental Management, vol. 3, pp. 569-578, 1989.
[18] M. Verbanck, “Sewer sediment and its relation with the quality characteristics of combined sewer flows”, Water Science and Technology, vol. 22, pp. 247-257, 1990.
[19] R. M. Ashley, “Review of data on sediment in sewers”, Seminar on Sediment in Sewers at Hydraulics Research, Wallingford, UK, 11 April 1991.
Bed Load Erosion Patterns and Their Effect on the Structural Strength The Open Civil Engineering Journal, 2013, Volume 7 49
[20] R. M. Ashley, and M. A. Verbanck, ”Mechanics of sewer sediment erosion and transport”, Journal of Hydraulic Research, vol. 34, pp. 753-770, 1996.
[21] A. J. Raudkivi, Loose Boundary Hydraulics. A. A. Belkema Pub-lishers, Lisse, Netherlands: 1998.
[22] M. H. Garcia, Ed., Sedimentation Engineering Processes, Meas-urements, Modeling and Practice, ASCE Manuals and Reports of Engineering Practice No. 110. Reston, VA: ASCE, 2007.
[23] C. E. Pearson, Ed., Handbook of Applied Mathematics – Selected Results and Methods. Van Nostrand: New York:, 1974, p. 28
[24] G. A. Korn, and T. M. Korn, Mathematical Handbook for Scientists and Engineers – Definitions Theorems and Formulas for Reference and Review. McGraw-Hill: New York, 1968, p. 887.
[25] I. N. Bronshtein, and K. A. Semendyayev, Handbook of Mathemat-ics. Van Nostrand Reinhold: New York, 1985, p. 183.
[26] T. Baumeister, and L. S. Marks, Eds., Standard Handbook for Mechanical Engineers. McGraw-Hill: New York, 1967, p. 2-44.
Received: February 07, 2013 Revised: April 05, 2013 Accepted: April 08, 2013
© Rubin et al.; Licensee Bentham Open.
This is an open access article licensed under the terms of the Creative Commons Attribution Non-Commercial License (http://creativecommons.org/licenses/ by-nc/3.0/) which permits unrestricted, non-commercial use, distribution and reproduction in any medium, provided the work is properly cited.


![Automated Health Alerts Using In-Home Sensor Data for … · 2016-06-23 · A pneumatic bed sensor [21] is installed on the bed mattress and used to capture sleep patterns. The bed](https://img.pdfslide.net/doc/110x75/5f7b7fe74f11c00c710513b2/automated-health-alerts-using-in-home-sensor-data-for-2016-06-23-a-pneumatic-bed.jpg)