Embed Size (px)
Citation preview
Bed load transport in turbulent flow at the grain scale:Experiments and modeling
E. Lajeunesse,1 L. Malverti,1 and F. Charru2
Received 10 December 2009; revised 8 June 2010; accepted 22 June 2010; published 1 October 2010.
[1] We report an experimental investigation of the motion of bed load particles understeady and spatially uniform turbulent flow above a flat sediment bed of uniform grainsize. Using a high‐speed video imaging system, we recorded the trajectories of the movingparticles and measured their velocity and the length and duration of their flights, as wellas the surface density of the moving particles. Our observations show that entrainedparticles exhibit intermittent motion composed of the succession of periods of “flight” andperiods of rest. During one flight, a particle may go through phases of reptation, duringwhich it moves in nearly persistent contact with the rough bed, and phases of saltation,during which it travels sufficiently high above the bed to reach high velocities. Thedistributions of longitudinal and transverse particle velocities obey a decreasing exponentialand a Gaussian law, respectively. Interestingly, these observations are similar to thosepreviously reported for viscous flows. The experimental results presented here support theerosion‐deposition model of Charru (2006) and allow the calibration of the involvedcoefficients. In particular, noting t*, the Shields number, and t*c, the threshold Shieldsnumber, we find that (1) the surface density of moving particles increases linearly witht* − t*c; (2) the average particle velocity increases linearly with t*1/2 − t*c
1/2, with a finitenonzero value at the threshold; (3) the flight duration scales with a characteristic settlingtime with no significant dependence on either t* or the settling Reynolds number; and(4) the flight length increases linearly with t*1/2 − t*c
1/2. The results presented in this papershould provide a valuable physical framework to describe bed form development inturbulent flows.
Citation: Lajeunesse, E., L. Malverti, and F. Charru (2010), Bed load transport in turbulent flow at the grain scale: Experimentsand modeling, J. Geophys. Res., 115, F04001, doi:10.1029/2009JF001628.
1. Introduction
[2] Bed load transport, which results from the motion ofparticles rolling, sliding or traveling in a succession of lowjumps or “saltations” along the bed of a stream, is of fun-damental importance for river morphodynamics. It mayindeed represent an important fraction of the total sedimentflux transported in a river (up to 60%), especially in gravelbed rivers [Métivier et al., 2004; Meunier et al., 2006; Liuet al., 2008]. Many aspects of morphologic changes in riversare governed by bed load transport, including bank erosion,bed forms and the rate at which the river incises relief [Yalin,1977; Dietrich and Smith, 1984; Gomez, 1991; Graf andAltinakar, 1996; Yalin and Ferreira da Silva, 2001]. Despitethe large number of works addressing the problem (and sum-marized hereafter), bed load transport remains poorly under-stood to this day with two important consequences for earth
sciences: (1) landscape evolution models still rely on empir-ical laws with no physical basis [Crave and Davy, 2001;Braun and Sambridge, 1997; Carretier and Lucazeau, 2005];(2) estimates of denudation rates from transport data oftenneglect the contribution of bed load or involve arbitraryassumptions about its importance [Ahnert, 1970; Summerfieldand Hulton, 1994].[3] Most of the laws for bed load transport proposed in the
literature consist of semiempirical equations derived from afit of data acquired in flume experiments, with few con-sideration of the physics at the grain scale. Accordingly, ourobjective in this paper is to describe bed load transport at thegrain scale. This was achieved by developing an experi-mental apparatus allowing the investigation of the motion ofbed load particles under steady and spatially uniform tur-bulent flow above a flat sediment bed of uniform grain size.As discussed in the following, the originality of our approachwith respect to previous investigations is that (1) our experi-ments are interpretedwithin the frame of an erosion‐depositionmodel proposed by Charru [2006], thus determining thechoice of the measured quantities, the measurement methods,and the way to analyze the data, and (2) contrarily to themajority of bed load transport laws proposed in the literature,
1Laboratoire de Dynamique des Fluides Geologiques, Institut dePhysique du Globe de Paris, Paris, France.
2Institut de Mécanique des Fluides de Toulouse, CNRS/Université deToulouse, Toulouse, France.
Copyright 2010 by the American Geophysical Union.0148‐0227/10/2009JF001628
JOURNAL OF GEOPHYSICAL RESEARCH, VOL. 115, F04001, doi:10.1029/2009JF001628, 2010
F04001 1 of 16
the model of Charru [2006] accounts for a relaxation effectwhich strongly influences the development of bed forms.[4] One way to formulate the problem of sediment trans-
port in rivers and to identify the relevant controlling para-meters is to proceed to dimensional analysis. The volumetricsediment transport rate per unit river width qs is expected todepend on eight parameters involving three dimensions(length, time, mass): the fluid density r, the sediment densityrs, the kinematic viscosity of water n, the gravitationalacceleration g, the flow depth H, the bed slope S, the char-acteristic sediment diameter D (usually the median diameterof the sediment bed), and the shear velocity u*, defined fromthe shear stress exerted by the fluid flow on the river bed byt = ru*2. Dimensional analysis leads to the followingrelation for the dimensionless sediment transport rate
q* ¼ f �*;Res;R; S;H
D
� �; ð1Þ
where
q* ¼ qsffiffiffiffiffiffiffiffiffiffiffiRgD3
p ; ð2Þ
�* ¼ u*2
RgD; ð3Þ
Res ¼ffiffiffiffiffiffiffiffiffiffiffiRgD3
p�
; ð4Þ
R ¼ �s � �
�: ð5Þ
[5] The Shields number t* is a dimensionless shear stress[Shields, 1936], and Res is a settling Reynolds numberdefined with the characteristic settling velocity Vs =
ffiffiffiffiffiffiffiffiffiRgD
p.
Note that the particle Reynolds number Re* = u*D/n isrelated to the above numbers by Re* = Res
ffiffiffiffiffi�*
p.
[6] Determining the function f which relates q* to the setof parameters t*,Res, R, S andH/D has been the goal of a hugenumber of works either theoretical [Duboys, 1879; Einstein,1950; Bagnold, 1956, 1973; Ashida and Michiue, 1973;Engelund and Fredsoe, 1976; Bridge and Dominic, 1984],
experimental [Meyer‐Peter and Müller, 1948; Fernandez‐Luque and Van Beek, 1976; Wong, 2003; Recking et al.,2009] or based on the analysis of field data [Bagnold, 1980;Gomez, 1991]. Commonly cited bed load transport laws arelisted in Table 1. Although no relationship has gained uni-versal acceptance, some general features are accepted.[7] 1. Most formulas involve a threshold value of the
Shields number t*c below which no sediment is transported,depending on Res and S [Shields, 1936; Wiberg and Smith,1987; Lamb et al., 2008].[8] 2. They all predict the same dependence q* / t*3/2
sufficiently far from the threshold i.e., in the limit t* � t*c.[9] Two main groups can be distinguished. The first
one predicts q* / (t* − t*c)3/2 [Meyer‐Peter and Müller,
1948; Einstein, 1950; Fernandez‐Luque and Van Beek,1976; Wong, 2003] whereas the second one proposes q* /(t* − t*c) (
ffiffiffiffiffi�*
p−
ffiffiffiffiffiffi�c*
p) [Ashida and Michiue, 1973;
Engelund and Fredsoe, 1976; Bridge and Dominic, 1984].These laws provide similar predictions far from thresholdbut exhibit significant differences close to threshold.[10] An alternative way to consider the problem of bed
load transport is to consider that qs can be written
qs ¼ �v n V ; ð6Þ
where n (dimensions [L]−2) is the surface density of movingparticles i.e., the number of moving particles per unit bedarea, V is their averaged velocity, and dv is the volume of anindividual particle. A better insight into the problem of bedload transport can be gained from the separate modeling ofV and n, that is, the determination of their dependence on theparameters t*, Res, R, S and H/D.[11] This approach has motivated several investigations of
bed load transport at the grain scale. Francis [1973], Abbottand Francis [1977] and later Hu [1996] and Lee and Hsu[1994] investigated experimentally the trajectory of an iso-lated grain propelled by a water stream over a nonerodiblebed. A second group of investigators studied the trajectoriesof bed load particles over an erodible bed [Fernandez‐Luque and Van Beek, 1976; Van Rijn, 1984; Nino andGarcia, 1994; Charru et al., 2004]. All these authors con-cluded that small saltation jumps are the main form of bedload motion and tried to characterize the variation with Dand t* of the average saltation height hs, saltation length Ls
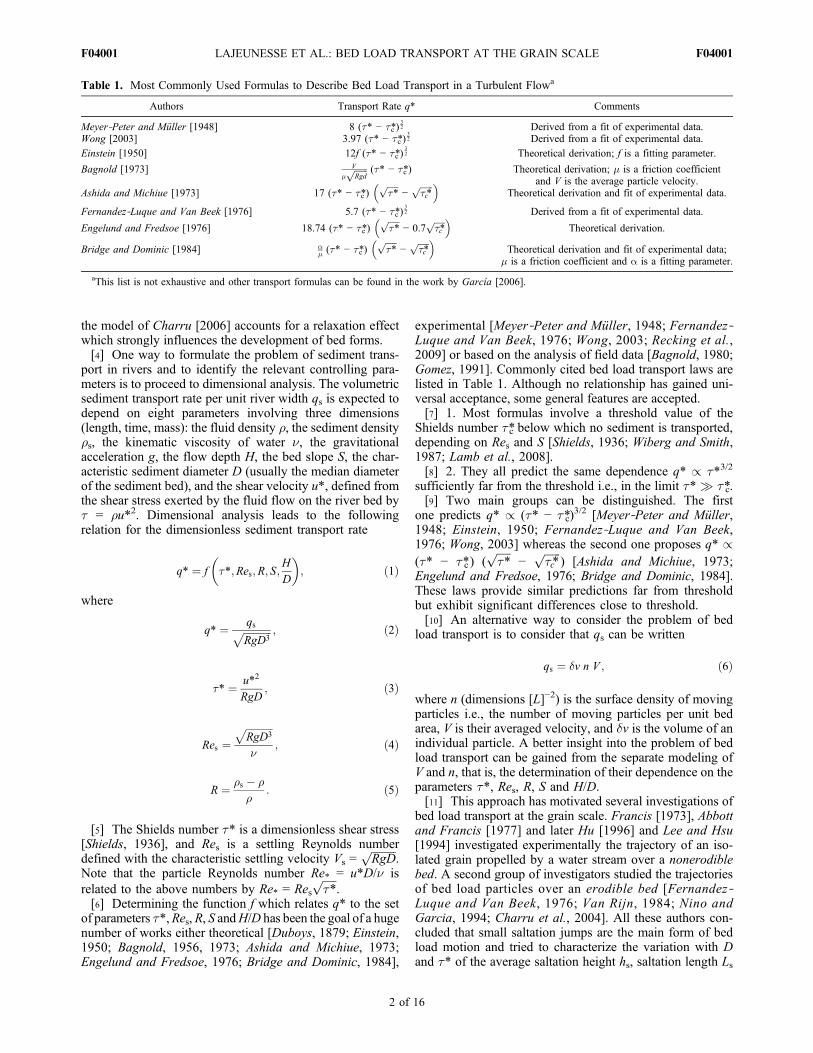
Table 1. Most Commonly Used Formulas to Describe Bed Load Transport in a Turbulent Flowa
Authors Transport Rate q* Comments
Meyer‐Peter and Müller [1948] 8 (t* − t*c )32 Derived from a fit of experimental data.
Wong [2003] 3.97 (t* − t*c )32 Derived from a fit of experimental data.
Einstein [1950] 12f (t* − t*c )32 Theoretical derivation; f is a fitting parameter.
Bagnold [1973] V�
ffiffiffiffiffiffiRgd
p (t* − t*c ) Theoretical derivation; m is a friction coefficientand V is the average particle velocity.
Ashida and Michiue [1973] 17 (t* − t*c )� ffiffiffiffiffi
�*p
−ffiffiffiffiffiffi�c*
p �Theoretical derivation and fit of experimental data.
Fernandez‐Luque and Van Beek [1976] 5.7 (t* − t*c )32 Derived from a fit of experimental data.
Engelund and Fredsoe [1976] 18.74 (t* − t*c )� ffiffiffiffiffi
�*p
− 0.7ffiffiffiffiffi�c*
p �Theoretical derivation.
Bridge and Dominic [1984] �� (t* − t*c )
� ffiffiffiffiffi�*
p−
ffiffiffiffiffi�c*
p �Theoretical derivation and fit of experimental data;
m is a friction coefficient and a is a fitting parameter.
aThis list is not exhaustive and other transport formulas can be found in the work by García [2006].
LAJEUNESSE ET AL.: BED LOAD TRANSPORT AT THE GRAIN SCALE F04001F04001
2 of 16
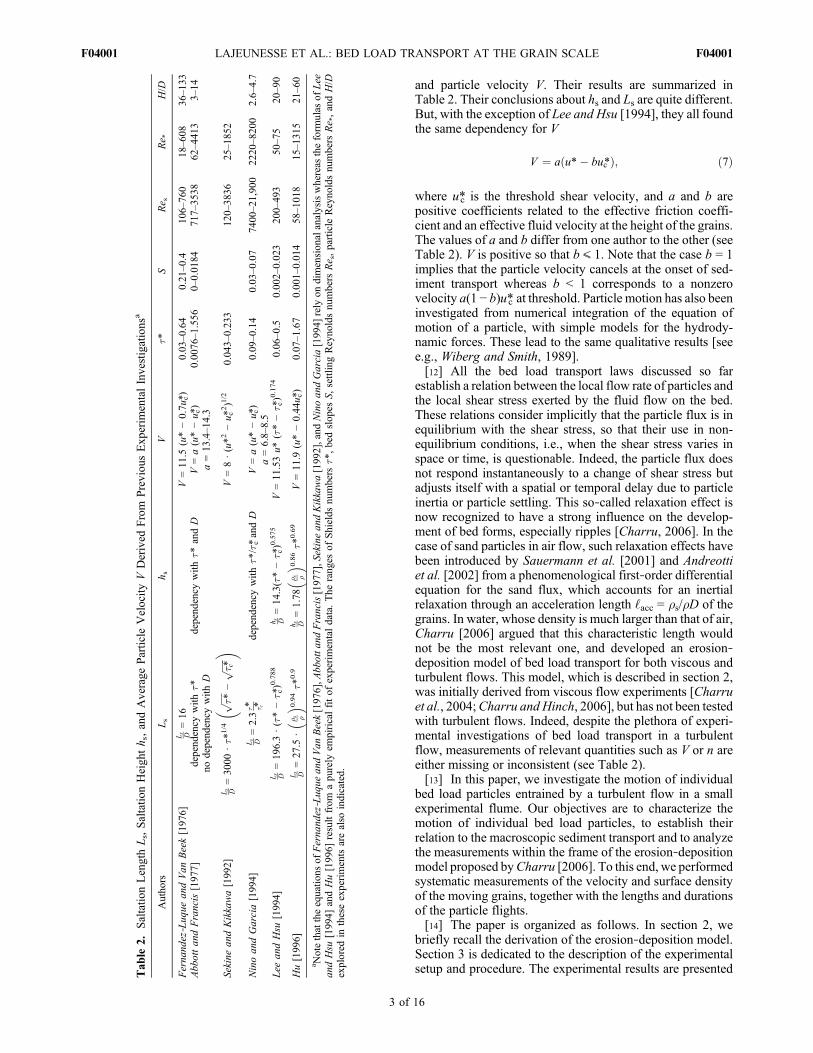
and particle velocity V. Their results are summarized inTable 2. Their conclusions about hs and Ls are quite different.But, with the exception of Lee and Hsu [1994], they all foundthe same dependency for V
V ¼ a u*� buc*ð Þ; ð7Þ
where u*c is the threshold shear velocity, and a and b arepositive coefficients related to the effective friction coeffi-cient and an effective fluid velocity at the height of the grains.The values of a and b differ from one author to the other (seeTable 2). V is positive so that b ⩽ 1. Note that the case b = 1implies that the particle velocity cancels at the onset of sed-iment transport whereas b < 1 corresponds to a nonzerovelocity a(1 − b)u*c at threshold. Particle motion has also beeninvestigated from numerical integration of the equation ofmotion of a particle, with simple models for the hydrody-namic forces. These lead to the same qualitative results [seee.g., Wiberg and Smith, 1989].[12] All the bed load transport laws discussed so far
establish a relation between the local flow rate of particles andthe local shear stress exerted by the fluid flow on the bed.These relations consider implicitly that the particle flux is inequilibrium with the shear stress, so that their use in non-equilibrium conditions, i.e., when the shear stress varies inspace or time, is questionable. Indeed, the particle flux doesnot respond instantaneously to a change of shear stress butadjusts itself with a spatial or temporal delay due to particleinertia or particle settling. This so‐called relaxation effect isnow recognized to have a strong influence on the develop-ment of bed forms, especially ripples [Charru, 2006]. In thecase of sand particles in air flow, such relaxation effects havebeen introduced by Sauermann et al. [2001] and Andreottiet al. [2002] from a phenomenological first‐order differentialequation for the sand flux, which accounts for an inertialrelaxation through an acceleration length ‘acc = rs/rD of thegrains. In water, whose density is much larger than that of air,Charru [2006] argued that this characteristic length wouldnot be the most relevant one, and developed an erosion‐deposition model of bed load transport for both viscous andturbulent flows. This model, which is described in section 2,was initially derived from viscous flow experiments [Charruet al., 2004;Charru and Hinch, 2006], but has not been testedwith turbulent flows. Indeed, despite the plethora of experi-mental investigations of bed load transport in a turbulentflow, measurements of relevant quantities such as V or n areeither missing or inconsistent (see Table 2).[13] In this paper, we investigate the motion of individual
bed load particles entrained by a turbulent flow in a smallexperimental flume. Our objectives are to characterize themotion of individual bed load particles, to establish theirrelation to the macroscopic sediment transport and to analyzethe measurements within the frame of the erosion‐depositionmodel proposed byCharru [2006]. To this end, we performedsystematic measurements of the velocity and surface densityof the moving grains, together with the lengths and durationsof the particle flights.[14] The paper is organized as follows. In section 2, we
briefly recall the derivation of the erosion‐deposition model.Section 3 is dedicated to the description of the experimentalsetup and procedure. The experimental results are presentedT
able
2.Saltatio
nLengthLs,Saltatio
nHeigh
th s,andAverage
Particle
Velocity
VDerived
From
Previou
sExp
erim
entalInvestigations
a
Autho
rsLs
h sV
t*S
Re s
Re *
H/D
Ferna
ndez‐Luq
uean
dVan
Beek[197
6]Ls D=16
V=11
.5(u*−0.7u* c)
0.03
–0.64
0.21
–0.4
106–76
018
–608
36–133
Abb
ottan
dFrancis[197
7]depend
ency
with
t*depend
ency
with
t*andD
V=a(u*−u* c)
0.00
76–1.556
0–0.01
8471
7–35
3862
–441
33–
14no
depend
ency
with
Da=13
.4–14.3
Sekine
andKikkawa[199
2]Ls D=30
00·t*
1/4
�ffiffiffiffiffi �*
p−
ffiffiffiffiffiffi � c*
p�
V=8·(u*2
−u* c
2)1/2
0.04
3–0.23
312
0–38
3625
–185
2
Ninoan
dGarcia[199
4]Ls D=2.3�*� c*
depend
ency
with
t*/t* candD
V=a(u*−u* c)
0.09
–0.14
0.03
–0.07
7400–2
1,90
022
20–820
02.6–
4.7
a=6.8–
8.5
Lee
andHsu
[199
4]Ls D=19
6.3·(t*−t* c)0.788
h s D=14
.3(t*−t* c)0.575
V=11
.53u*
(t*−t* c)0.174
0.06
–0.5
0.00
2–0.02
320
0–49
350
–75
20–90
Hu[199
6]Ls D=27
.5·� �
s �
� 0.94t*
0.9
h s D=1.78
� �s �
� 0.86t*
0.69
V=11
.9(u*−0.44
u* c)
0.07
–1.67
0.00
1–0.01
458
–101
815
–131
521
–60
a Notethattheequatio
nsof
Ferna
ndez‐Luq
uean
dVan
Beek[197
6],A
bbotta
ndFrancis[197
7],S
ekinean
dKikkawa[199
2],and
Ninoan
dGarcia[199
4]rely
ondimension
alanalysiswhereas
theform
ulas
ofLee
andHsu
[199
4]andHu[199
6]resultfrom
apu
rely
empiricalfitof
experimentaldata.The
rang
esof
Shields
numbers
t*,bedslop
esS,
settlingReyno
ldsnu
mbers
Re s,particle
Reyno
ldsnu
mbers
Re *,andH/D
explored
intheseexperimentsarealso
indicated.
LAJEUNESSE ET AL.: BED LOAD TRANSPORT AT THE GRAIN SCALE F04001F04001
3 of 16

in section 4 and discussed in section 5. The paper ends witha summary of the results and conclusions.
2. Erosion‐Deposition Model for Bed Loadin a Turbulent Stream
[15] As stated by equation (6), the bed load flux is pro-portional to n, the surface density of moving particles. Forsteady and spatially uniform flow, this density correspondsto dynamical equilibrium between the particles eroded fromthe fixed bed and deposited onto it. For unsteady or non-uniform flow, such as that over ripples or dunes, this equi-libriummay be broken, and the variation of n(x, t) is governedby the conservation equation [Charru and Hinch, 2006]
@n
@t¼ _ne � _nd � @ðnV Þ
@x: ð8Þ
This equation states that the variation rate of n is related toexchanges with the fixed bed, through the erosion rate _ne andthe deposition rate _nd (both with dimension [L]−2[T]−1), and tothe divergence of the bed load flux nV (Figure 1). To solvethis equation, the mean particle velocity V and the erosion anddeposition rates need to be modeled.[16] The erosion and deposition rates can be determined
from dimensional analysis as follows. As known from pre-vious experiments and confirmed by the results presented inthe following sections, particles within the moving layer havean intermittent behavior, composed of periods of motion,hereafter called “flights,” with mean velocity V and charac-teristic duration td, alternating with periods of rest. Duringthe deposition time td all particles stop once, so that thedeposition rate can be written
_nd ¼ n
td: ð9Þ
The deposition time is controlled by gravity and expected toscale with the settling time D/Vs where Vs is the settlingvelocity. Thus, td can be written as
1
td¼ cd
Vs
D; ð10Þ
where cd is a deposition coefficient to be determined fromexperiments.
[17] Erosion of a particle, which occupies the typical areaD2, occurs on a typical hydrodynamic timescale te, and canbe written as
_ne ¼ 1
D2te: ð11Þ
The erosion time te can be thought as that needed for a par-ticle, submitted to the force (t − tc)D
2, to escape the smalltrough or potential well where it is trapped, and reach some“escape velocity”which we take, for the sake of simplicity, tobe the settling velocity Vs. Then, the time te can be definedfrom the inertial balance
�s D3 Vs
te¼ ce ð� � �cÞD2; ð12Þ
where ce is an erosion coefficient to be determined from ex-periments, as cd. Note that another possible choice for tewould be D/(u* − u*c), which is a timescale of the flow at thescale of the particle. However, as discussed below, this choiceleads to a wrong prediction for n.[18] Finally, the particle velocity can be modeled as pro-
posed by Bagnold [1973], from a balance between thehydrodynamic force on a particle and a Coulomb frictionforce, leading to equation (7). The latter can be rewritten interms of the Shields number,
V � VcffiffiffiffiffiffiffiffiffiRgD
p ¼ affiffiffiffiffi�*
p�
ffiffiffiffiffi�c*
p� �; ð13Þ
where Vc, the particle velocity at the threshold of bed loadtransport, and the coefficient a have to be determined fromexperiments.
2.1. Steady and Uniform Flow Above a FlatTopography: The Saturated Regime
[19] Let us now consider two situations of particularinterest. The first one is that of a steady and spatially uniformflow above a flat topography, where the erosion and depo-sition rates balance each other. Then, from (9) and (11),together with (10) and (12), the equilibrium or saturateddensity of moving particles is found to be
nsatD2 ¼ td
te¼ ce
cd
� � �c�sV 2
s
: ð14Þ
This equation predicts in particular a linear dependence of nwith the bed shear stress (t − tc). It can be rewritten in termsof the Shields number,
nsatD2 ¼ ce
cd�*� �c*ð Þ: ð15Þ
In this saturated regime, the sediment flux corresponds to thesaturated value,
qsat ¼ �v nsatV ; ð16Þ
with the particle density nsat given by (15) and the velocity Vby (13).
2.2. Steady Flow Over Varying Topography
[20] The second situation of interest is that of steadyflow over varying topography. Then, assuming that the
Figure 1. Sketch of the particle fluxes in a strip of themoving layer, of length dx and width unity.
LAJEUNESSE ET AL.: BED LOAD TRANSPORT AT THE GRAIN SCALE F04001F04001
4 of 16

particles have negligible inertia so that their velocity V adaptsinstantaneously to the shear stress, the erosion‐depositionequation (8) gives the following relaxation equation for theparticle flux qs:
‘d@qs@x
¼ qsat � qs; ð17Þ
where
‘d ¼ V td ð18Þ
is a deposition length. As shown below, this deposition lengthis closely related to the length traveled by a particle duringone flight. It can be noted that this equation has the same formas that proposed by Andreotti et al. [2002], but with a dif-ferent saturation length.[21] As stated in section 1, one objective of the experi-
ments presented below is to test the consistency of the abovemodel and determine the involved coefficients: a and Vc forthe velocity and cd and ce for the erosion and depositionrates. For the sake of simplicity, the settling velocity will betaken as Vs =
ffiffiffiffiffiffiffiffiffiRgD
p, which amounts to neglecting the weak
dependence of the drag coefficient with the Reynolds number(the numerical value of
ffiffiffiffiffiffiffiffiffiRgD
pcorresponds to the settling
velocity of a sand grain of diameter 0.65 mm in water).
3. Experimental Apparatus and Procedure
3.1. Setup
[22] The experiments were carried out in a rectangularinclinable flume of width W = 9.6 cm and length 240 cm(Figure 2a) partially filled with an erodible bed of quartzgrains of density rs = 2650 kg m−3 (R = 1.65). An experimentwas started by preparing a flat bed of sediment of thickness
several centimeters (typically 10 cm). The sediment bed wasflattened by sweeping a rake, whose tilt and height wereconstrained by two rails parallel to the channel. The bedslope S was measured with a digital inclinometer withaccuracy 0.1°. Once the bed was ready, water was injected bya pump at the upstream flume inlet with constant dischargeW qw, where qw is the discharge per unit width, measuredwith a flowmeter (accuracy 0.01 L min−1). To prevent anydisturbance of the bed, water was not injected as a pointsource but rather it overflowed smoothly onto the flume bedvia a small reservoir (see Figures 2a and 2b). The reservoirextended across the full width of the channel and thereforeguaranteed a uniform flow injection across the channelwidth. For all runs the discharge was high enough for theflow to fill the whole width of the flume.[23] At the flume outlet, particles transported by the flow
settled out in an overflow tank with constant water level.The tank rested on a high‐precision scale (accuracy 0.1 g)connected to a computer that recorded the weight every tenseconds. The sediment discharge per unit river width qs wasdeduced from the sediment cumulative mass. Figure 2cshows the mass of sediment accumulated in the overflowtank as a function of time during a typical experimental run.The initiation of the flow was followed by a transitory phaseduring which the mass of sediment collected at the flumeoutlet increased rapidly. After about two minutes, a steadystate was reached characterized by a linear increase in thecumulative sediment mass with time indicating a constantsediment discharge (Figure 2c). All the measurementsdescribed hereafter were performed during this steady stateregime and as long as the bed was flat. Our experimentscorrespond therefore to the case of a steady and uniformflow above a flat topography.
Figure 2. (a) Photo and (b) schematics of the experimental setup. (c) Example of the cumulated sedi-ment mass recorded as a function of time at the flume outlet. (d) Size distribution of the grains for series 1(triangles), 2 (squares), and 3 (circles).
LAJEUNESSE ET AL.: BED LOAD TRANSPORT AT THE GRAIN SCALE F04001F04001
5 of 16

[24] Because we did not feed sediment at the flow inlet, anerosion wave slowly propagated from the inlet toward theoutlet of the flume. All our experiments were stopped wellbefore this degradation wave had reached the middle of theflume where the measurements were performed, so that thiswave never interfered with our results. At the end of eachexperimental run, the slope of the flume bed measured atseveral locations all along the channel using the digitalinclinometer was indeed equal to the initial slope, within theexperimental precision.[25] The water depth H was measured from the deviation
of a laser sheet, as sketched in Figure 2b, with precision of±1 mm. This depth was found to be constant along thesection of the flume within the experimental precision.Assuming that the depth‐averaged flow velocity was uniformin the spanwise direction, this velocity was given by U =qw/H, with precision of 10%.[26] The influence of the grain size, and therefore Res, on
sediment transport was investigated by performing threeseries of experiments, each of them involving a bed ofquartz grains of different granulometric distribution plottedin Figure 2d. D10, D50 and D90 were equal to 0.94, 1.15 and1.4 mm for the first series of experiments; 1.92, 2.24 and 2.6mm for the second ones; and 4.52, 5.5 and 6.7 mm for thethird ones, respectively. The bed granulometric distributionwas therefore rather peaked around D50 for each series ofexperiments. As a result, our experiments avoid complexeffects usually associated with an extended granulometriccomposition.
3.2. Characterization of the Flow
[27] For each series of experiments, 8 to 15 runs wereperformed with bed slopes ranging from 0.2° to 6° andwater discharges ranging from 2 to 32 L min−1 (see Table 3).The corresponding flow Reynolds number Re = qw/n variedbetween 1500 and 6000, well above the threshold of tran-sition from laminar to turbulent flow (which is of the orderof 500 in open channel flows [Allen, 1985; Lajeunesse et al.,2010]). In all our experiments, the flow was therefore tur-bulent. The particle Reynolds number Re*, which measuresthe ratio of the bed roughness to the thickness of the viscoussublayer, varied in the range 12 to 500 allowing us to exploreboth the transitional and the hydraulically rough regime.Finally, H/D varied in the range 2 to 10 which crosses thetransition from “roughness layer” dominated to “deep” flows(at H/D = 4, approximately) (see Table 3).[28] The vertical velocity profile of the flow was measured
for several experimental runs using the Particle ImagingVelocity (PIV) method [Adrian, 1991]. Neutrally buoyanttracers (hollow glass beads) were introduced in the flow andilluminated by a vertical laser sheet. Side‐view images of theflow were acquired using a high‐speed camera (1000 framesper second, 1024 × 1024 pixels). The size of the imaged zonewas chosen to be slightly larger than the maximum lengthtraveled by the tracer particles between two images. The
images were processed to compute the instantaneous velocityfields. The time‐averaged velocity field was then determinedby averaging over 100 consecutive instantaneous fields(convergence was achieved after 40 fields).[29] The profile of the time‐averaged streamwise velocity
was found to satisfy the logarithmic law
uðzÞ ¼ u*
�ln
z
z0
� �; ð19Þ
where z is the distance above the bed, � = 0.41 is the VonKàrmàn constant, and z0 is the hydrodynamic roughness. Anexample of velocity profile is shown in Figure 3a. In thatcase, a fit of the profile with equation (19) leads to u* = 24 ±2 cm/s and z0 = 4.1 ± 0.5 10−3 mm ≈ D/28, a value typical ofthe hydraulically rough regime.
3.3. Shear Stress Exerted on the Sediment Bed
[30] The flow depth being uniform, the streamwise bedshear stress can be approximated by
� ¼ �gRhS; ð20Þ
where Rh = HW/(2H + W) is the hydraulic radius. Fromequation (20), it follows that the Shields number and theshear velocity are respectively given by
�* ¼ RhS
RDð21Þ
u* ¼ffiffiffi�
�
r¼
ffiffiffiffiffiffiffiffiffiffigRhS
p: ð22Þ
Note that for the run shown in Figure 3a, the shear velocitycalculated from equation (22) leads to u* = 28 cm s−1, whichis close to the value u* = 24 cm s−1 obtained by fitting thevelocity profile with equation (19), ignoring the small side-wall corrections related to the large aspect ratio W/H.[31] Our experimental setup does not permit simultaneous
measurements of the flow velocity and bed load particlevelocity. For this reason, t* and u* were estimated inthe following from the measurements of H and S usingequations (21) and (22). The Chézy coefficients Cz = U/u*calculated for each run are plotted as a function of the ratioH/D in Figure 3b. Interestingly, we find Cz ≈ 10, which isclose to the measured value in many natural rivers asillustrated by the field data plotted in Figure 3b.
3.4. Characterization of the Motion of the Particles
[32] Under the action of the flow, a fraction of the bedparticles were put into motion. They moved followingintermittent trajectories composed of a succession of periodsof rest and periods of motion as discussed in more detail insection 4. Bed load was the sole mode of sediment transportin our flume; we never observed any suspended load, as
Table 3. Range of Parameters Explored for Each Series of Experiments
Series D (mm) S Res t* Re* H/D t*c Symbol
1 1.15 0.0017–0.07 156.9 0.006–0.24 12–77 7–10 0.016 ± 0.03 triangle2 2.24 0.01–0.068 426.5 0.02–0.15 65–179 4–6 0.023 ± 0.002 square3 5.50 0.04–0.12 1646 0.037–0.096 317–510 1.5–2 0.037 ± 0.001 circle
LAJEUNESSE ET AL.: BED LOAD TRANSPORT AT THE GRAIN SCALE F04001F04001
6 of 16

expected for the range of Rouse number Ro = Vs/�u* /1/
ffiffiffiffiffi�*
pexplored in our experiments (Ro was varied between
5 and 30).[33] A high‐speed camera (250 frames per second, 1024 ×
1024 pixels) positioned vertically above the bed was used totrack the motion of the sediment particles. About 10% ofthese were dyed black. This allowed us to track their positionfrom frame to frame, with time resolution of 0.04 s, using aparticle tracking algorithm. The data were then processed tocalculate the streamwise and transverse particle velocities.The spatial resolution was such that the particle diameterwas about 50 pixels and the size of the field of view of theorder of 20 × 20 particle diameters. With these conditions,we were able to determine the position of the center of massof a particle on an image with a precision of 0.05 mm.
However the oscillations of the water surface, which are themain source of experimental error, degraded the accuracy ofthese measurements by causing an apparent movement ofparticles at rest. The corresponding false velocities werecalibrated for each experimental run by computing thisapparent velocity. This allowed definition of a cutoff velocityin the range 10–30 mm s−1, depending on the water flow rate,below which the particle was considered to be at rest (i.e., thevelocity measurement was not taken into account).[34] The same particle tracking algorithm was used to
compute the lengths and durations of the particle flights.However, the size of the field of view had to be increased to177.3 × 85.6 mm2 in order to remain much larger than thecharacteristic particle flight length. The camera recordedthe motion of the particles from above, not from the side ofthe flume. Measurements of the vertical velocity componentand of the saltation height were therefore not feasible.[35] Finally the surface density of moving particles was
measured for each experimental run by counting manuallythe total number of particles (whether dyed or not) movingbetween two successive frames within the field of view, andaveraging over a sufficiently large number of frames for themean to converge. As mentioned above, a resting grain mayappear to be in motion because of the slight oscillations ofthe water surface. However, such an apparent displacementfluctuates around zero and exhibits as many negative aspositive values. This is not the case if the particle actuallymoves. To determine reliably whether a particle is at rest ornot, we correlated the displacement of each examined particleon several images.
4. Experimental Results
[36] A sample of trajectories of the moving grains is shownon Figure 4a. The position along the streamwise x axis andthe streamwise velocity component of one of the grains arealso plotted as a function of time in Figures 4b and 4c. Thesedata are representative of the general observations. Only asmall fraction of the sediment bed particles is entrained by theflow. These bed load particles exhibit intermittent behavior:periods of motion, called “flights” and characterized by ahighly fluctuating velocity, alternate with periods of rest.
4.1. Surface Density of Moving Particles
[37] Let us first focus on the surface density of movingparticles n. Our observations show that, for each of the threeseries, n vanishes below a well‐defined threshold value ofthe Shields number t*, and increases linearly with t* abovethe threshold value. It seems therefore natural to define thecritical Shields number t*c from this threshold value belowwhich n vanishes.[38] A linear fit of n versus t* leads to the values of t*c
reported in Table 3 and plotted in the inset of Figure 5. Notsurprisingly, these values coincide with those deduced fromdirect measurement of the sediment flux using the scale atthe flume outlet. They are consistent with the threshold valuesreported by other investigators (see the compilation byBuffington and Montgomery [1997]) which vary in the range0.012 < t*c < 0.05 within the range 20 < Re* < 320corresponding to the inception of motion in our experiments.As shown in Figure 5, they are also close to the values pre-dicted from the Brownlie correlation [Brownlie, 1981].
Figure 3. (a) Vertical velocity profile u(z) for Series 1, witht* = 0.041, Res = 156.9,H/D = 8,H/W = 0.1, and S = 0.0087.The plain curve represents the logarithmic fit of the data.(b) Chézy coefficients Cz = U/u* as a function of H/D forSeries 1 (triangles), 2 (squares), and 3 (circles). Stars repre-sent field data measured in four rivers (North Saskatche-wan River, Elbow River, Oak Creek, and Sagehen River)and extracted from the databases of Brownlie [1981] andBagnold [1980].
LAJEUNESSE ET AL.: BED LOAD TRANSPORT AT THE GRAIN SCALE F04001F04001
7 of 16
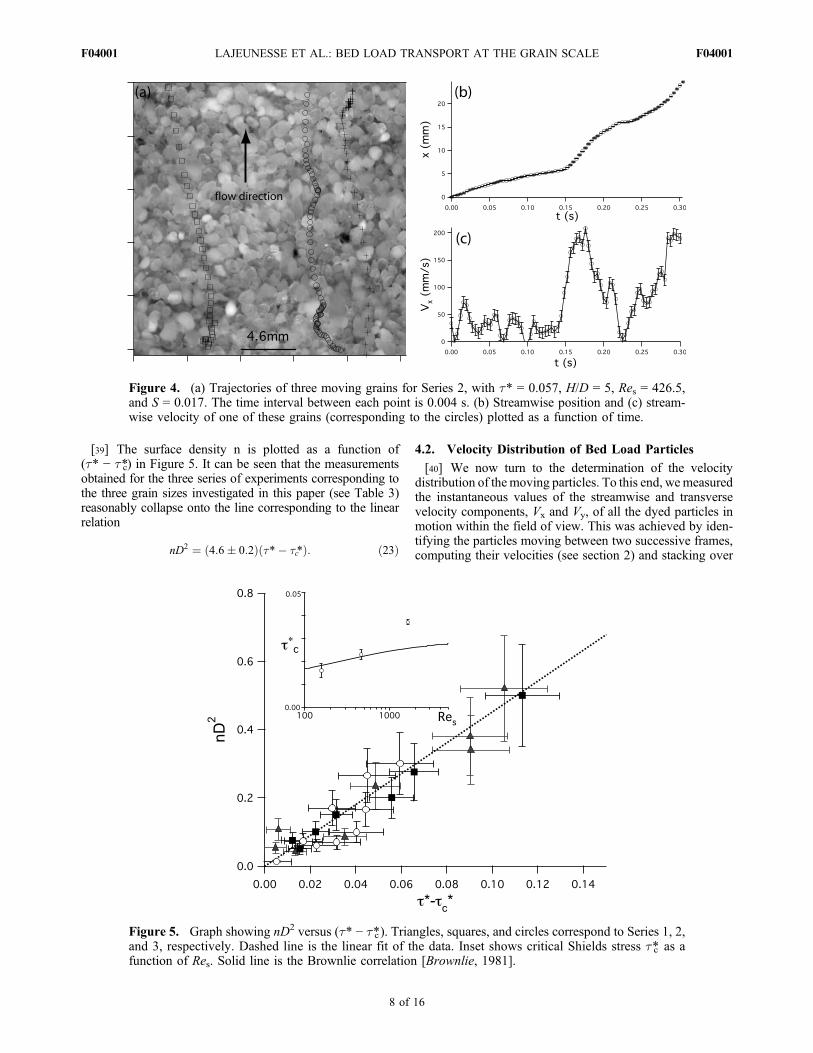
[39] The surface density n is plotted as a function of(t* − t*c) in Figure 5. It can be seen that the measurementsobtained for the three series of experiments corresponding tothe three grain sizes investigated in this paper (see Table 3)reasonably collapse onto the line corresponding to the linearrelation
nD2 ¼ ð4:6� 0:2Þð�*� �c*Þ: ð23Þ
4.2. Velocity Distribution of Bed Load Particles
[40] We now turn to the determination of the velocitydistribution of themoving particles. To this end, wemeasuredthe instantaneous values of the streamwise and transversevelocity components, Vx and Vy, of all the dyed particles inmotion within the field of view. This was achieved by iden-tifying the particles moving between two successive frames,computing their velocities (see section 2) and stacking over
Figure 5. Graph showing nD2 versus (t* − t*c). Triangles, squares, and circles correspond to Series 1, 2,and 3, respectively. Dashed line is the linear fit of the data. Inset shows critical Shields stress t*c as afunction of Res. Solid line is the Brownlie correlation [Brownlie, 1981].
Figure 4. (a) Trajectories of three moving grains for Series 2, with t* = 0.057, H/D = 5, Res = 426.5,and S = 0.017. The time interval between each point is 0.004 s. (b) Streamwise position and (c) stream-wise velocity of one of these grains (corresponding to the circles) plotted as a function of time.
LAJEUNESSE ET AL.: BED LOAD TRANSPORT AT THE GRAIN SCALE F04001F04001
8 of 16

a suitable number of frames for convergence. This methodrequires a suitable definition of a moving particle, taken asone with velocity greater than the cutoff velocity defined insection 2. Several thousands of velocity measurements werethus performed for each experiment, allowing us to estimateexperimentally the probability density functions (PDF) ofVx and Vy, samples of which are shown in Figure 6. Notethat these distributions concern only the moving particles,i.e., those with velocity larger than the cutoff velocity. Ifthe resting particles were taken into account, the distributionwould of course exhibit a sharp and discontinuous peak atV = 0 because the number of particles at rest far exceedsthat of moving grains.[41] For the explored range of parameters, the PDFs of Vx
were found to decrease monotically to zero (Figure 6a) andare well fitted by the exponential law
PðVxÞ ¼ 1
Ve�Vx=V ; ð24Þ
where V is the averaged streamwise particle velocity.[42] As a first approximation, the PDFs of Vy are rea-
sonably well fitted by a Gaussian function centered on zero,as shown in Figure 6b,
PðVyÞ ¼ 1ffiffiffi
p�Vy
e� Vy
�Vy
� �2
: ð25Þ
The average transverse velocity component is 0, which isconsistent with a particle trajectory mainly oriented along theflow direction. The width of the Gaussian dVy characterizesthe order of magnitude of the velocity fluctuations along they axis and reflects the stochastic deviations of the particle offthe main streamwise motion due to their interactions with therough bed of sediment. These deviations are, on average,symmetric with respect to the main flow direction. The ratiodVy/V is plotted as a function of (u* − u*c)/Vs in Figure 7a. Itranges between 0.2 and 1 and decreases when t* increases;however, the trend is vague. Finally, a closer examination of
Figure 6b suggests that the tails of the PDFs of Vy are thickerthan Gaussian. This result is consistent with the model ofGanti et al. [2010], suggesting that the particles spread alongthe y axis following an anomalous diffusion process.[43] Interestingly these results are identical to those obtained
by Charru et al. [2004] for bed load particles entrained by aviscous flow, not turbulent. This suggests that particle motionis dominated by the mean value of the bed shear stress, andthat fluid velocity fluctuations are not important. However,this conclusion might be wrong very near the threshold in thefully rough regime (t* ≈ t*c, Re* > 70), where turbulent burstsmay maintain a small particle transport rate.[44] For each experimental run, the mean particle velocity
V was computed from the PDF of Vx using equation (24).As shown in Figure 7b, measurements of the dimensionlessvelocity V/Vs converge onto a single line when plotted as afunction of (u* − u*c)/Vs. Thus the particle velocity can bewritten
V � Vc
Vs¼ a
u*� uc*
Vs; Vs ¼
ffiffiffiffiffiffiffiffiffiRgD
p; ð26Þ
which is identical to (13). Fitting the data, the slope a andthe threshold velocity Vc are found to be
a ¼ 4:4� 0:2;Vc
Vs¼ 0:11� 0:03: ð27Þ
The above result suggests that the velocity is discontinuousat the threshold of sediment transport, particles movingthere with a nonzero velocity Vc. This result is supported bythe experimental observation that, close to the threshold, aparticle, once dislodged from the sediment bed, does not stopimmediately but may travel over some distance. It is alsoconsistent with the hysteretic nature of the threshold of motionfirst evidenced by Hjülstrom [1935] and with observations ofthe motion of a single particle on a fixed bed by Francis[1973] and Abbott and Francis [1977].[45] Although our data demonstrate unambiguously that a
particle exhibits a nonzero velocity Vc, at the threshold of
Figure 6. (a) Experimental probability density functions (PDFs) of Vx for t* = 0.103, Res = 426,H/D = 5,and S = 0.042. Inset shows the same data represented on a semilog plot. (b) Corresponding PDFs of Vy.
LAJEUNESSE ET AL.: BED LOAD TRANSPORT AT THE GRAIN SCALE F04001F04001
9 of 16

sediment transport, determining this velocity precisely remainsan experimental challenge. Vc is indeed extremely sensitive tothe definition of t*c: a 10% change of t*c results in a 30%change of Vc. The difficulty to precisely estimate t*c mightexplain the important differences between the values of thecoefficient b of equation (7) available in the literature (seeTable 2).[46] Our particle velocity measurements are compared to
ones from four previous investigations in Figure 8a whereV/Vs is plotted as a function of u*/Vs (unfortunately, the valueof u*c was not available for several data sets, preventing usfrom plotting the data as a function of (u* − u*c)/Vs). Two ofthese data sets were obtained by tracking the motion of a
single grain moving above a rigid nonerodible rough bed[Lee and Hsu, 1994; Abbott and Francis, 1977]. The otherones, including the present study, correspond to erodible beds[Fernandez‐Luque and Van Beek, 1976; Nino and Garcia,1994]. Each of these authors performed several series ofexperiments working with different grain sizes and densitiesso that, altogether, these data span the range 100–22,000 forRes and 0.01–1 for t*.[47] Figure 8a shows that V/Vs increases linearly with
u*/Vs for each series of data in accordance with equation (26).A fit of each series of data by this equation allows the com-putation of the coefficient a. The results are displayed inFigure 8b. Two different trends are visible depending on the
Figure 8. (a) Average particle velocity V/Vs versus u*/Vs measured by various authors (see the legend onthe graph). The data of Abbott and Francis [1977] and Lee and Hsu [1994] correspond to the case of asingle grain moving above a rigid rough bed. Those of Fernandez‐Luque and Van Beek [1976], Nino andGarcia [1994], and the present study correspond to an erodible bed. (b) Velocity coefficient a as afunction of Res. The symbols are identical to the one used in Figure 8a.
Figure 7. Graphs showing (a) dVy/V and (b) average particle velocity V/Vs as a function of (u* − u*c)/Vs,with Vs =
ffiffiffiffiffiffiffiffiffiRgD
p. Triangles, squares, and circles correspond to series 1, 2, and 3, respectively. Solid line
represents linear fit of the data.
LAJEUNESSE ET AL.: BED LOAD TRANSPORT AT THE GRAIN SCALE F04001F04001
10 of 16

nature of the bed. For a single grain entrained above a rigidrough bed [Abbott and Francis, 1977; Lee and Hsu, 1994],a = 13.2 ± 0.6 within the explored range of Res (130 < Res <3200). In the case of an erodible bed (data ofNino and Garcia[1994] and the present study), a = 5.0 ± 0.6 for an even largerrange of Res (160 < Res < 22000). To summarize, particlesentrained by the flow move more slowly above a mobile bedthan above a rigid one.[48] This observation is apparently contradicted by the
data of Fernandez‐Luque and Van Beek [1976]. Indeed,although these data correspond to an erodible bed, they aremuch closer to those for a nonerodible bed (Figure 8a). Aplausible explanation is that Fernandez‐Luque and VanBeek [1976] estimated the average particle velocity fromthe time required by the particles to cover a fixed distance.This method is likely to ignore movements smaller than thisfixed distance and may therefore bias the data. Indeed, asnoted by the authors themselves [Fernandez‐Luque and VanBeek, 1976, p. 135], “we obviously followed those particlesthat were carried in suspension at almost the same velocityand not those particles that were just being eroded and had amuch lower transport velocity.”
4.3. Characteristic Length and Duration of the Flights
[49] As already discussed, sediment particles exhibit anintermittent behavior composed of a succession of periodsof motion or “flights” and periods of rest. Using particletracking, we measured the durations T and the lengths L ofthese flights for all experimental runs. As described insection 3.4, the size of the observation window had to beincreased in order to guarantee that it was larger than themaximum flight length recorded. These measurements hadto be performed using a semiautomatic procedure allowingus to check manually that a given particle was correctlytracked from frame to frame. They were therefore timeconsuming and the number of data was not enough to obtainfully converged PDFs. Nevertheless, the histograms of Tand L, examples of which are shown in Figure 9, exhibitwell‐defined peaks corresponding to the most probable flightduration hTi and flight length hLi, respectively. We also notethat the two histograms in Figure 9 are not symmetric but are
skewed toward long durations and lengths so that the meanis slightly larger than the most probable value.[50] The most probable flight durations hTi, normalized
by the characteristic settling time D/Vs = (D/Rg)1/2, areplotted in Figure 10a. The dimensionless settling time variestypically between 7 and 12, with no clear variation witheither (u* − u*c)/Vs or Res. A fit of the data leads to
hTiffiffiffiffiffiffiffiffiffiffiffiffiD=Rg
p ¼ 10:6� 0:7: ð28Þ
[51] Turning to the most probable flight length, Figure 10bshows that it increases with the shear velocity according to thelinear relation
hLiD
¼ ð70� 2Þ u*� uc*
Vs; ð29Þ
with no significant dependence of the numerical coefficienton Res for the range investigated in this paper (namely 150 <Res < 1650).[52] Table 2 summarizes the results of previous investiga-
tions by Fernandez‐Luque and Van Beek [1976], Abbott andFrancis [1977], Sekine and Kikkawa [1992], Nino andGarcia [1994], Lee and Hsu [1994], and Hu [1996].Although these authors come to different predictions, all butFernandez‐Luque and Van Beek [1976] report an increaseof hLi/D with t* or equivalently u*. The reason why theresults of Fernandez‐Luque and Van Beek [1976] are dif-ferent is that they calculated the average flight length fromthe cumulative distribution over their whole data sets, whichincluded several flow rates; such a calculation cannot, ofcourse, evidence any variation of flight length with u*.Therefore, we ignore the results of Fernandez‐Luque andVan Beek [1976] in the following.[53] Among the remaining studies, only Nino and Garcia
[1994] and Lee and Hsu [1994] provide the values of u*c thatallow direct comparison with our data. Nino and Garcia[1994] performed two series of experiments with beds com-posed of mobile sediments of sizes 15 and 31 mm (about ten
Figure 9. (a) PDF of flight durations normalized byffiffiffiffiffiffiffiffiffiffiffiffiD=Rg
p. (b) PDF of flight lengths normalized by
D. Parameters are D = 1.15 mm (series 1), t* = 0.06, H/D = 9, Res = 156.9, and S = 0.01.
LAJEUNESSE ET AL.: BED LOAD TRANSPORT AT THE GRAIN SCALE F04001F04001
11 of 16

times as large as in our experiments), corresponding to Resequal to 7400 and 21,900, respectively. Their data plotted onFigure 10b exhibit a good agreement with our own mea-surements except for one data point for the smallest value ofu* − u*c, which stands above the regression line. This point ishowever close to the threshold and is therefore very sensitiveto the exact value of u*c, which Nino and Garcia [1994] didnot measure but deduced from the Shields curve. A less than10% change of the value of u*c is enough to bring the datapoint in question back onto our experimental data trend. Theresults of Nino and Garcia [1994] are therefore in goodagreement with our own observations, thus extending thevalidity of equation (29) to values of Res as far as 21,900.[54] As for Lee and Hsu [1994], they investigated the case
of a single particle entrained above a rigid rough bed. Theirdata plotted on Figure 10b appear to increase linearly withu* − u*c as predicted by equation (29). However the flightlengths reported for a single particle above a rigid bed aremuch larger than in the case of a mobile bed. This obser-vation is consistent with the fact that particles move fasterabove a rigid bed than above a mobile one as discussed insection 4.2.
4.4. Rolling and Saltation
[55] The experimental results presented up to now, includingflight lengths and durations, have been discussed withoutdistinction of the kind of motion, rolling, sliding or saltation,of the particles. Thanks to the high spatial and temporalresolutions, two different kinds of motion can be distin-guished by plotting the instantaneous velocity Vx of a particleas a function of its position x, as shown in Figure 11.[56] The first type of motion corresponds to rolling. It
involves particles that strongly interact with the bed. Asshown in Figure 11a, their motion is characterized by smallvelocities (typically Vx < 100 mm s−1) which vary as afunction of x with a periodicity on the order of the grainsize D. The variations are almost symmetrical with anacceleration phase roughly equal to the deceleration phase.
Figure 11. Streamwise velocity component as a functionof the downstream coordinate x for (a) a rolling particleand (b) a saltating particle. These data were obtained duringthe same experimental run with D = 2.24 mm (series 2), t* =0.057, H/D = 5, Re = 426.5, and S = 0.017. Note the changeof scale, particularly along the x axis, between the two plots.
Figure 10. (a) Most probable flight duration, hTi/ ffiffiffiffiffiffiffiffiffiffiffiffiD=Rg
p, and (b) most probable flight length, hLi/D, as a
function of (u* − u*c)/Vs. Dashed line shows linear fit. Triangles, squares, and circles correspond to series 1,2, and 3, respectively. Diamonds represent data from Nino and Garcia [1994] for an erodible bed. Crossesrepresent data from Lee and Hsu [1994] for a single grain on a fixed rough bed.
LAJEUNESSE ET AL.: BED LOAD TRANSPORT AT THE GRAIN SCALE F04001F04001
12 of 16

Direct observations confirm that these particles remain innearly persistent contact with the bed. The observed period-icity clearly reflects the length scale of the bed roughness, onthe order of the grain size.[57] Saltation, the second kind of motion, is illustrated in
Figure 11b. It is characterized by much longer flights with ashort phase of large acceleration (up to 0.9 g on a typicaldistance on the order of D) and a longer phase where thevelocity decreases more slowly. Saltation involves fastparticles (typically Vx > 100 mm s−1) traveling sufficientlyhigh above the bed for their trajectories not to be perturbedby the bed roughness.[58] Recall that we did not perform systematic measure-
ments of the motion of the particles from the side of theflume. The distinction we establish between rolling andsaltation is therefore primarily based on the shape of the Vx
versus x curves. However, we consider that our interpreta-tion is supported by the results of Charru et al. [2007], whoinvestigated experimentally the trajectories of a few parti-cles entrained by a laminar flow above a rough bed. Theyrecovered the same two distinctive Vx versus x types ofcurve as in our experiments. Using two cameras, whichallowed them to observe the particle trajectories from bothabove and the side of the flume, they demonstrated that Vx
versus x curves similar to those displayed in Figure 11a docorrespond to rolling, whereas trajectories of the type shownin Figure 11b correspond to saltation.[59] Finally, let us note that direct observation shows that
during one flight, the same particle may undergo phases ofrolling and phases of saltation. The proportion of saltating orrolling particles was measured by counting the total numberof dyed particles rolling between two successive frames,comparing this number to the total number of moving dyedparticles, and averaging over a sufficient number of frames.A particle was considered to be rolling if its velocity plottedas a function of x presented the same kind of oscillations asin Figure 11a. The results, plotted in Figure 12, indicate thatthe sediment transport is strongly dominated by saltation,
which represents from 70% to 100% of the particles inmotion. In particular, the proportion of saltating particlesremains high close to the threshold of sediment transport.This observation contradicts the commonly accepted scenarioaccording to which the majority of particles are rolling andsliding for t* ≈ t*c and saltation progressively becomes thedominant mode of motion as t* increases [Van Rijn, 1984].
5. Summary and Discussion
[60] Let us summarize our experimental results on themotion of bed load particles in a steady and uniform turbulentflow above a flat topography. In this equilibrium, or saturated,regime, the erosion and deposition rates balance each other.Our observations show that the particles entrained by theflow exhibit an intermittent behavior composed of a suc-cession of periods of motion with a highly fluctuatingvelocity, called “flights,” and periods of rest. During oneflight, a particle may successively go through phases ofrolling and sliding (a kind of motion also called reptation instudies of aeolian transport) during which it moves in nearlypersistent contact with the rough bed, and phases of saltation,during which it travels sufficiently high above the bed toreach high velocities. Our main quantitative results aredivided into six parts: (1) threshold, (2) density of movingparticles, (3) particle velocity distributions, (4) mean particlevelocity, (5) flight duration, and (6) flight length.[61] 1. Particles begin to move at Shields stress larger than
a threshold t*c, which was determined from the extrapolationto zero of the surface density of moving particles. Thisthreshold was found to be in agreement with previous resultsin the explored range of sedimentation Reynolds number,160 < Res < 1650 (see Table 3 and the inset of Figure 5).[62] 2. Above the threshold, the number of moving par-
ticles per unit bed area, n, increases linearly with t* − t*c(see equation (23) and Figure 5). This result is consistentwith the erosion‐deposition model presented in section 2.From the identification of the measured density (23) withthe saturated density (15) predicted by the model, the ratioof the erosion and deposition coefficients is found to be
cecd
¼ 4:6� 0:2: ð30Þ
This ratio has no significant dependence on the settlingReynolds number. The linear dependence of nD2 on t* − t*cis also consistent with the indirect measurements performedby Fernandez‐Luque and Van Beek [1976], who found alower coefficient 1.8 for t* − t*c < 0.1. As mentioned insection 2, another erosion time could be defined on dimen-sional grounds, te = D/(u* − u*c), instead of the accelerationtime defined by the momentum balance (12). This choicewould lead to n/ u* − u*c, which clearly does not agree withthe measurements reported in Figure 5.[63] 3. The experimental PDFs of longitudinal and trans-
verse particle velocities in a turbulent flow obey a decreasingexponential law and a Gaussian law, respectively (seeFigure 6). This result is similar to the observations of Charruet al. [2004] for viscous flows. This similarity suggests thatparticle motion is dominated by the mean value of the bedshear stress, and that the particle velocity distributions arelargely independent of the fluid velocity fluctuations.
Figure 12. Proportion of bed load particles moving by sal-tation as a function of (t* − t*c). Triangles, squares, and cir-cles correspond to the experimental series 1, 2, and 3,respectively.
LAJEUNESSE ET AL.: BED LOAD TRANSPORT AT THE GRAIN SCALE F04001F04001
13 of 16

[64] 4. The dimensionless mean particle velocity V/Vs
increases linearly with the dimensionless shear velocityu*/Vs =
ffiffiffiffiffi�*
p, where Vs =
ffiffiffiffiffiffiffiffiffiRgD
pis a characteristic sedi-
mentation velocity (see equation (26) and Figure 7b). Theslope of the linear law and velocity at threshold are given by
a ¼ 4:4� 0:2;Vc
Vs¼ 0:11� 0:03:
Again, no significant dependence was noted on the settlingReynolds number, which was varied in the range 157 < Res <1646. This velocity law fully agrees with equation (13),which arises from a simple force balance. The above value ofthe coefficient a is close to that of previous investigations,which found a in the range 4.4–5.5 for an even larger rangeof settling Reynolds number (see Figure 8). This coefficientis much lower than that over a rough nonerodible bed, whichwas found to be 13.2 ± 0.6 in the range 130 < Res < 3200:Particles therefore move more slowly above a mobile bedthan above a rigid one. This result shows that the effectivefriction coefficient on a moving bed is higher, or, in otherwords, that the momentum transfer to the bed is enhanced.[65] 5. The distribution of the durations of particle flights
exhibits a well‐defined peak corresponding to the mostprobable duration hTi (see Figure 9a). Once normalized withthe settling time D/Vs, hTi was found to be independent ofboth t* and Res in the range of parameters explored (seeequation (28) and Figure 10a). Identification of this flightduration with the settling time (10) introduced in the erosion‐deposition model provides the following value for thedeposition coefficient:
cd ¼ 0:094� 0:006: ð31Þ
From this estimate of the deposition coefficient andequation (30) for the ratio ce/cd, the erosion coefficient isfound to be
ce ¼ 0:43� 0:05: ð32Þ
[66] 6. As for flight durations, the distribution of the lengthsof particle flights exhibits a well‐defined peak correspondingto the most probable length hLi (see Figure 9b). This mostprobable flight length, once normalized with the particlediameter D, increases linearly with (u* − u*c)/Vs (seeequation (29) and Figure 10b).[67] Finally, all the experimental results support the
erosion‐deposition model presented in section 2, and allowthe calibration of the coefficients: the deposition coefficientinvolved in the deposition rate (9) is given by (31), the erosioncoefficient involved in the erosion rate (11) is given by (32),and the velocity coefficients involved in the velocity law (13)are given by (27). Remarkably these four coefficient areconstants: their dependence on the dimensionless para-meters is too weak to be measured, within the experimentaluncertainties and the range of parameters explored. In par-ticular, they appear to be the same for the hydraulicallysmooth, transitional, and hydraulically rough regimes.[68] From the above results, we can now determine the
deposition length ‘d and the saturated particle flux qsat
involved in the dynamical equation (17) for sediment trans-port over varying topography. Indeed, although the experi-ments reported here have been conducted under steady andspatially uniform flow conditions, ‘d and qsat only depend onequilibrium quantities.[69] The deposition length ‘d may be determined in
two slightly different ways. The first one is to use itsdefinition (18), ‘d = Vtd, with the mean particle velocity givenby (26) and the settling time given by (10). Hence,
‘dD
¼ 1
cd
aðu*� uc*Þ þ Vc
Vs; ð33Þ
where, from (27) and (31), a/cd = 47 and Vc/cdVs = 1.2. Thislaw predicts that, at threshold, the flight length is on the orderof one particle diameter, as expected; however, for practicalpurposes, the small additive constant Vc/cdVs may beneglected. The second way is to identify the deposition lengthwith the most probable flight length (29), giving
‘dD
¼ 70u*� uc*
Vs: ð34Þ
Ignoring the small correction Vc/cdVs in (33), the two esti-mations of ‘d are the same, except for the numerical coeffi-cients which differ by about 40%. This difference reflects thefact that T, L and V are not independent stochastic variables,so that the most probable flight length hLi is not equal to theproduct VhTi of the mean velocity and the most probableflight time. Intuitively, we expect that longer flights corre-spond to particles reaching higher altitudes where the flowis faster. As a result, the PDFs of velocities should becorrelated with the PDFs of flights durations, short flightdurations corresponding to small velocities whereas long flightdurations would correspond to larger velocities. Exploringthis scenario would require the computation of the joint dis-tribution of particle velocities and flight durations, whichcannot be done with our too small data set.[70] The determination of the saturated particle flux qsat
involved in the dynamical sediment transport law (17) isstraightforward: it is the product of the surface density (23)of moving particles and the mean particle velocity (26).Hence,
qsatffiffiffiffiffiffiffiffiffiffiffiRgD3
p ¼ 10:6 �*� �c*ð Þffiffiffiffiffi�*
p�
ffiffiffiffiffiffi�c*
pþ 0:025
� �: ð35Þ
The last numerical coefficient, although physically signifi-cant since it represents the nonzero particle velocity atthreshold, may be neglected for practical purposes.[71] Equation (35) for qsat has been tested against direct
measurements of the sediment transport rate at the flumeoutlet, performed with the scale (see section 3). Equation (35)does not involve any adjustable parameter (all the coefficientshave been determined experimentally) and the measure-ments with the scale are independent of all the quantitiesmeasured from image acquisition (t*c, a, ce, cd, …). Thescale measurements, along with the curve corresponding toequation (35), are shown in Figure 13 for series 1 and 2. Itappears that the agreement is remarkable. Note that ignoring
LAJEUNESSE ET AL.: BED LOAD TRANSPORT AT THE GRAIN SCALE F04001F04001
14 of 16

the coefficient 0.025 in (35) (dashed line in Figure 13) haslittle effect.
6. Conclusion
[72] Up to now, the majority of the bed load transportlaws proposed in the literature have been focused on theestablishment of a relation between the local volumetricflow rate of particles and the local shear stress exerted by thefluid flow on the bed. These relations implicitly considerthat the particle flux is in equilibrium with the shear stress,and consequently ignore any relaxation effect, although thelatter is now recognized to control the development of bedforms, especially ripples [Charru, 2006].[73] In order to overcome this limitation, Charru et al.
[2004] developed an erosion‐deposition model of bed loadtransport under viscous flow, which accounts for a relaxationeffect related to the time needed for a particle to settle once itis entrained in the fluid flow. This model was shown tosuccessfully predict the development of ripples and rhomboidpatterns created by viscous flows [Charru et al., 2004;Devauchelle et al., 2010a, 2010b]. An extension of the modelto turbulent flows was proposed by Charru [2006] (seesection 2). However, despite the plethora of experimentalinvestigations of bed load transport in turbulent flow, thismodel has not been tested so far, since measurements of therelevant quantities are either missing or inconsistent.[74] The primary objective of this paper was to determine
the coefficients of the erosion‐deposition model for turbulentflows. To this end, we investigated the motion of bed loadparticles in a steady and spatially uniform turbulent flowabove a flat bed of particles with uniform size. Using a high‐speed video imaging system, we visualized the trajectories ofthe entrained grains and measured their velocity, the lengthand duration of their flights and the surface density of movingparticles. As far as we know, this study is the first to achievesuch measurements.[75] The experimental results support the erosion‐deposition
model of Charru [2006] and allowed the calibration of theinvolved coefficients. These results confirm the idea that it is
the erosion rate which locally depends on the shear stress, notthe sediment flux. The flux results from a local mass balancebetween advected, eroded and deposited particles. The tur-bulent erosion‐deposition model needs now to be testedagainst the development of bed forms, ripples and dunes, aswas done in the laminar case. This is a work in progress.[76] Finally, note that the dynamics of the sediment trans-
port in the immediate vicinity of the threshold remains anopen problem. Here, the available measurements exhibit largescatter, as do the predictions of transport rate relations. Dif-ficulties can be expected to arise not only from the hydro-dynamics (the effect of turbulent bursts), but also from thegeometry of the disordered bed. The preparation of the bed,and slow phenomena such as armoring, segregation on apolydisperse bed, or slow variations along the channel, arelikely to be of importance. This analysis remains to be done.
[77] Acknowledgments. We thank Y. Gamblin and A. Vieira fortheir technical assistance in designing and realizing the experimental apparatus.We are in debt to A. Limare for her help in setting up the PIV data acquisitionsystem. We gratefully acknowledge support by the Agence Nationale de laRecherche through contract NANR‐09‐RISK‐004/GESTRANS. This is IPGPcontribution 3020.
ReferencesAbbott, J., and J. Francis (1977), Saltation and suspension trajectories ofsolid grains in a water stream, Philos. Trans. R. Soc. London A, 284,225–254.
Adrian, R. (1991), Particle imaging techniques for experimental fluidmechanics, Ann. Rev. Fluid Mech., 23, 261–304.
Ahnert, F. (1970), Functional relationships between denudation, relief, anduplift in large mid‐latitude drainage basins, Am. J. Sci., 268, 243–263.
Allen, J. (1985), Principles of Physical Sedimentology, Allen and Unwin,London.
Andreotti, B., P. Claudin, and S. Douady (2002), Selection of dune shapesand velocities—Part 2: A two‐dimensional modelling, Eur. Phys. J. B,28(3), 341–352.
Ashida, K., and M. Michiue (1973), Studies on bed‐load transport rate inopen channel flows, in Proceedings of the International Associationfor Hydraulic Research International Symposium on River Mechanics,9–12 January 1973, Bangkok, Thailand, pp. 407–417, Asian Inst. ofTechnol., Bangkok.
Bagnold, R. (1956), The flow of cohesionless grains in fluids, Philos.Trans. R. Soc. London A, 249, 235–297.
Figure 13. Dimensionless transport rate qs/ffiffiffiffiffiffiffiffiffiffiffiRgD3
pversus t* for (a) series 1 and (b) series 2. Points are
measurements from the scale at the flume outlet. Solid lines represent equation (35), and dashed linesrepresent equation (35) with the last numerical coefficient set to zero.
LAJEUNESSE ET AL.: BED LOAD TRANSPORT AT THE GRAIN SCALE F04001F04001
15 of 16

Bagnold, R. (1973), The nature of saltation and of ‘bed‐load’ transport inwater, Proc. R. Soc. London, Ser. A, 332, 473–504.
Bagnold, R. (1980), An empirical correlation of bedload transport rate influmes and natural rivers, Proc. R. Soc. London, Ser. A, 372, 453–473.
Braun, J., and M. Sambridge (1997), Modelling landscape evolution ongeological time scales: a new method based on irregular spatial discreti-zation, Basin Res., 9(1), 27–52.
Bridge, J. S., and D. F. Dominic (1984), Bed load grain velocity and sedimenttransport rates, Water Resour. Res., 20, 476–490.
Brownlie, W. (1981), Compilation of alluvial channel data: Laboratory andfield, technical report, W. M. Keck Lab. of Hydraul. and Water Resour.,Div. of Eng. and Appl. Sci., Calif. Inst. of Technol., Pasadena.
Buffington, J., and D. Montgomery (1997), A systematic analysis of eightdecades of incipient motion studies, with special reference to gravel‐bedded rivers, Water Resour. Res., 33, 1993–2029.
Carretier, S., and F. Lucazeau (2005), Response times in a mountain‐piedmont system. Results of a numerical model, Geophys. Res. Abstr., 7,03902.
Charru, F. (2006), Selection of the ripple length on a granular bed shearedby a liquid flow, Phys. Fluids, 18, 121508, doi:10.1063/1.2397005.
Charru, F., and E. Hinch (2006), Ripple formation on a particle bed shearedby a viscous liquid. Part 1. Steady flow, J. Fluid Mech., 550, 111–121.
Charru, F., H. Mouilleron, and O. Eiff (2004), Erosion and deposition ofparticles on a bed sheared by a viscous flow, J. Fluid Mech., 519, 55–80.
Charru, F., E. Larrieu, J.‐B. Dupont, and R. Zenit (2007),Motion of a particlenear a rough wall in a viscous shear flow, J. Fluid Mech., 570, 431–453.
Crave, A., and P. Davy (2001), A stochastic “precipiton”model for simulatingerosion/sedimentation dynamics, Comput. Geosci., 27(7), 815–827.
Devauchelle, O., L. Malverti, E. Lajeunesse, C. Josserand, P. Lagree, andK. N. Thu‐Lam (2010a), Stability of bedforms in laminar flows withfree‐surface: From bars to ripples, J. Fluid Mech., 642, 329–348.
Devauchelle, O., L. Malverti, É. Lajeunesse, C. Josserand, P. Lagrée, andF. Métivier (2010b), Rhomboid beach pattern: A laboratory investigation,J. Geophys. Res., 115, F02017, doi:10.1029/2009JF001471.
Dietrich, W., and J. Smith (1984), Bed load transport in a river meander,Water Resour. Res., 20(10), 1355–1380.
Duboys, S. (1879), Le rhone et les rivieres à lit affoillable, Ann. PontsChaussees, Ser., 5, 18, 141–195.
Einstein, H. (1950), The bed‐load function for sediment transportation inopen channel flows, Tech. Bull. 1026, U.S. Dep. of Agric., Washington,D. C.
Engelund, F., and J. Fredsoe (1976), A sediment transpot model for straightalluvial channels, Nord. Hydrol., 7(5), 293–306.
Fernandez‐Luque, R., and R. Van Beek (1976), Erosion and transport ofbed‐load sediment, J. Hydraul. Res., 14, 127–144.
Francis, J. (1973), Experiments on the motion of solitary grains along thebed of a water‐stream, Proc. R. Soc. London, Ser. A, 332, 443–471.
Ganti, V., M. Meerschaert, E. Foufoula‐Georgiou, E. Viparelli, andG. Parker (2010), Normal and anomalous diffusion of gravel tracer parti-cles in rivers, J. Geophys. Res., 115, F00A12, doi:10.1029/2008JF001222.
García, M. (2006), ASCE Manual of Practice 110—Sedimentation Engi-neering: Processes, Measurements, Modeling, and Practice, in Examiningthe Confluence of Environmental and Water Concerns: Proceedings ofthe World Environmental and Water Resource Congress 2006, editedby R. Graham, p. 94, doi:10.1061/40856(200)94, Am. Soc. of Civ.Eng., Reston, Va.
Gomez, B. (1991), Bedload transport, Earth Sci. Rev., 31(2), 89–132.Graf, W., and M. Altinakar (1996), Hydraulique Fluviale: Écoulement nonPermanent et Phénomènes de Transport, Eyrolles, Paris.
Hjülstrom, F. (1935), Studies of the morphological activity of rivers asillustrated by the River Fyris, Bull. Geol. Inst. Univ. Uppsala, 25,221–527.
Hu, C. (1996), Bed‐load transport. I: Mechnical chararcteristics, J. Hydraul.Eng., 122, 245–254.
Lajeunesse, E., et al. (2010), Fluvial and submarine morphodynamics oflaminar and near‐laminar flows: A synthesis, Sedimentology, 57, 1–26.
Lamb, M., W. Dietrich, and J. Venditti (2008), Is the critical shields stressfor incipient sediment motion dependent on channel‐bed slope?, J. Geophys.Res., 113, F02008, doi:10.1029/2007JF000831.
Lee, H., and I. Hsu (1994), Investigation saltating particle motions, J. Hydraul.Eng., 120, 831–845.
Liu, Y., F. Metivier, E. Lajeunesse, P. Lancien, C. Narteau, and P. Meunier(2008), Measuring bed load in gravel bed mountain rivers: Averagingmethods and sampling strategies, Geodin. Acta, 21, 81–92.
Métivier, F., P. Meunier, M. Moreira, A. Crave, C. Chaduteau, B. Ye, andG. Liu (2004), Transport dynamics and morphology of a high mountainstream during the peak flow season: The Ürümqi River (Chinese TianShan), in River Flow 2004, vol. 1, pp. 770–777, A. A. Balkema, Leiden,Netherlands.
Meunier, P., F. Metivier, E. Lajeunesse, A. S. Meriaux, and J. Faure (2006),Flow pattern and sediment transport in a braided river: The “torrent deSt Pierre” (French Alps), J. Hydrol., 330, 496–505.
Meyer‐Peter, E., and R. Müller (1948), Formulas for bed‐load transport,paper presented at 2nd Meeting of International Association for HydraulicResearch, Int. Assoc. for Hydraul. Res., Stockholm.
Nino, Y., and M. Garcia (1994), Gravel saltation: 1. Experiments, WaterResour. Res., 30, 1907–1914.
Recking, A., P. Frey, A. Paquier, and P. Belleudy (2009), An experimentalinvestigation of mechanisms involved in bed load sheet production andmigration, J. Geophys. Res., 114, F03010, doi:10.1029/2008JF000990.
Sauermann, G., K. Kroy, and H. Herrmann (2001), Continuum saltationmodel for sand dunes, Phys. Rev. E., 64, 31,305–31,305.
Sekine, M., and H. Kikkawa (1992), Mechanics of saltating grains. II,J. Hydraul. Eng., 118, 536–558.
Shields, I. (1936), Anwendung der ahnlichkeitmechanik und der turbulenz-forschung auf die gescheibebewegung, Mitt. Preuss Vers. WasserbauSchiffbau, 26, 5–24.
Summerfield, M., and N. Hulton (1994), Natural controls of fluvial denu-dation rates in major world drainage basins, J. Geophys. Res., 99,13,871–13,883.
Van Rijn, L. (1984), Sediment transport, part i: bed load transport,J. Hydraul. Eng., 110, 1431–1456.
Wiberg, P., and J. Smith (1987), Calculations of the critical shear stress formotion of uniform and heterogeneous sediments, Water Resour. Res., 23,1471–1480.
Wiberg, P., and J. D. Smith (1989), Model for calculating bed load transportof sediment, J. Hydraul. Eng., 115, 101–123.
Wong, M. (2003), Does the bedload equation of Meyer‐Peter and Müller fitits own data?, paper presented at 30th Congress of the International Asso-ciation for Hydraulic Research, Int. Assoc. of Hydraul. Res., Thessaloniki,Greece.
Yalin, M. (1977),Mechanics of Sediment Transport, Pergamon, New York.Yalin, M., and A. Ferreira da Silva (2001), Fluvial Processes, Int. Assoc. ofHydraul. Eng. and Res., Delft, Netherlands.
F. Charru, Institut de Mécanique des Fluides de Toulouse, CNRS/Université de Toulouse, 1 Allée du Professeur Camille Soula, F‐31400Toulouse, France.E. Lajeunesse and L. Malverti, Laboratoire de Dynamique des Fluides
Geologiques, Institut de Physique du Globe de Paris, 4 Place Jussieu,F‐75252 Paris CEDEX 05, France. ([email protected]; [email protected])
LAJEUNESSE ET AL.: BED LOAD TRANSPORT AT THE GRAIN SCALE F04001F04001
16 of 16