Embed Size (px)
Citation preview
MARKET SNAPSHOTS
August 2019Beef & Sheep
MLA INDUSTRY INSIGHTS i
MARKET SNAPSHOTS
Beef & Sheep
FOR FURTHER INFORMATION VISIT US ONLINE AT:www.mla.com.au or email us at: [email protected]
© Meat & Livestock Australia, 2019. ABN 39 081 678 364. MLA makes no representations as to the accuracy of any information or advice contained in MLA’s Market snapshot and excludes all liability, whether in contract, tort (including negligence or breach of statutory duty) or otherwise as a result of reliance by any person on such information or advice. All use of MLA publications, reports and information is subject to MLA’s Market Report and Information Terms of Use. Please read our terms of use carefully and ensure you are familiar with its content.
ContentsAustralia 1
Japan 5
North America 11
Korea 19
Greater China 25
South-East Asia 35
Middle East and Northern Africa (MENA) 42
European Union (EU) 49
MLA INDUSTRY INSIGHTS August 2019 ii
MARKET SNAPSHOT l BEEF & SHEEPMEAT
MLA MARKET SNAPSHOT BEEF AND SHEEPMEAT AUSTRALIA August 2019 1
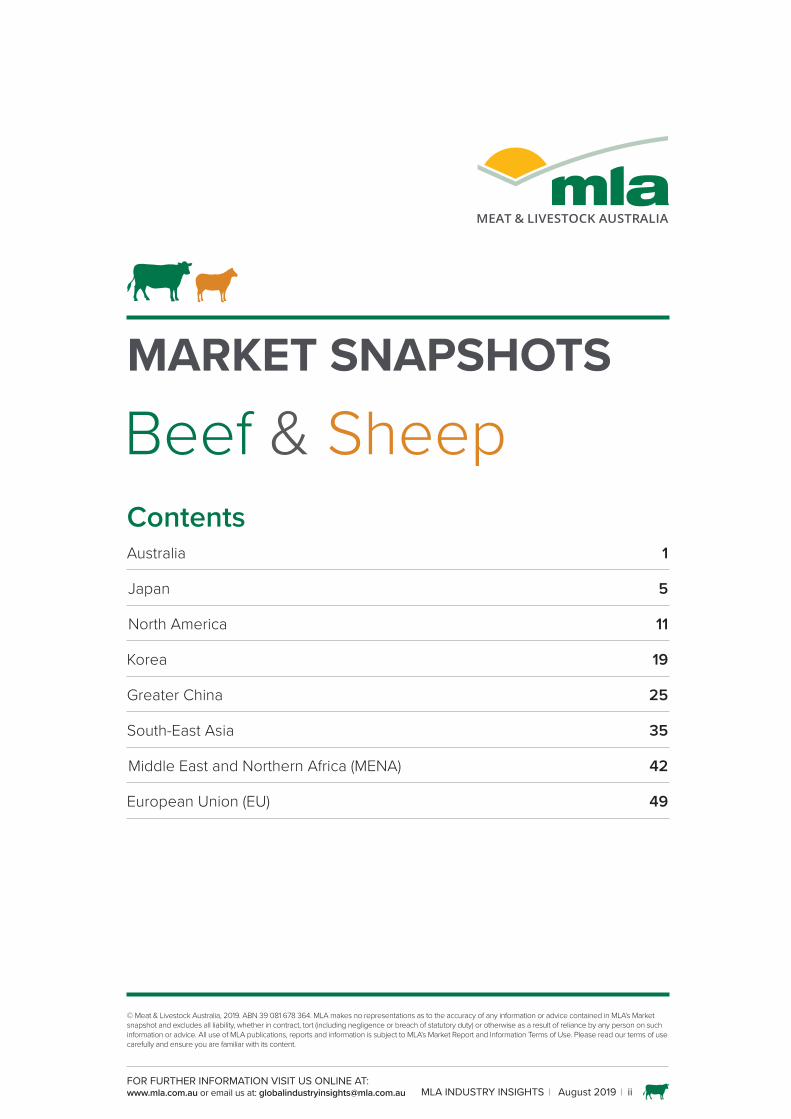
The domestic market is the largest destination for Australian red meat; however, a changing demography and competitive pressures from other proteins remain strong. Targeted messaging on provenance, quality, environmental credentials and animal welfare – along with food integrity and transparency – provide opportunities to enhance consumer preferences for red meat and grow community trust.
Population Households earning* >US$35k/year
Households earning* >US$50k/year
Households earning* >US$75k/year
25.1in 2019
26.3in 2023
10.0in 2019
10.9in 2023
8.4in 2019
9.5in 2023
5.1in 2019
6.3in 2023
in million Source: Fitch Solutions, 2019 estimate and 2023 forecast
in million households Source: Fitch Solutions, 2019 estimate and 2023 forecast
in million households Source: Fitch Solutions, 2019 estimate and 2023 forecast
in million households Source: Fitch Solutions, 2019 estimate and 2023 forecast
*Disposable income: earnings after taxes and social security charges.
Australian domestic market is the largest destination for Australian beef, consistently consuming almost 30% of total beef production volume.
Australia is also the largest market for Australian sheepmeat, consuming about 35% of total production. Lamb occupies 95% of domestic distribution, while the majority of mutton produced is exported to overseas markets.
Australia Meat consumption 109.6kg per capita*total meat protein**
Pork
0.42 0.46
1.251.44
0.68 0.69
0.24 0.25
Poultry Beef Sheepmeat
27.0kg per capita*
8.6kg per capita*
2019 2023
in million tonnes cwt * 2019e per person per year in cwt ** Excluding fish/seafood Source: Fitch Solutions (2019 estimate and 2023 forecast), OECD Agriculture Statistics: OECD-FAO Agricultural Outlook (Edition 2018), GIRA
Beef domestic utilisation (share of produced volume)
Sheepmeat domestic utilisation (share of produced volume)
Retail fresh meat value share
0.58 0.63
2008
-09
2009
-10
2010
-11
2011-
12
2012
-13
2013
-14
2014
-15
2015
-16
2016
-17
2017
-18
2017
-18*
2018
-19*
705
683
769
675
643713
750
725
617
637
59074
5
1,329
1,429
1,326
1,977
1,416
1,397 1,4
89 1,732
1,716
1,586
1,4371,3
79
585
1,554
‘000 tonnes cwt
Domestic consumption Exports
0.58 0.63
2008
-09
2009
-10
2010
-11
2011-
12
2012
-13
2013
-14
2014
-15
2015
-16
2016
-17
2017
-18
2017
-18*
2018
-19*
705 26
3
248
233
232
216
230
220 24
6
212
202
216
1,329
373
327
488
438
324
411 48
3
467
523
477
299
169
517
‘000 tonnes cwt
Domestic consumption Exports
2019 Beef – 35% (0.9) Chicken – 30% (1.1) Lamb – 12% (-0.8) Pork – 12% (0.6) Seafood – 9% (-0.2) Other – 3% (-0.3)
Source: DAWR, ABS, IHS Markit, MLA calculations*FYTD (July to May)
Source: DAWR, ABS, IHS Markit, MLA calculations*FYTD (July to May)
Source: Nielsen Homescan, MAT to 15/06/2019 (year-on-year change)
Australian retail meat price (¢/kg)
Single person households
Median age in Australia
0
500
1000
1500
2000
Jun-
00
Jun-
02
Jun-
04
Jun-
06
Jun-
08
Jun-
10
Jun-
12
Jun-
14
Jun-
16
Jun-
18
Beef Lamb Chicken Pork
2.63 million 2.67 million
2.85 million
2018 2019e 2023f
Source: ABARES, calculated using ABS data Source: Fitch Solutions Source: Fitch Solutions
1998 2019e 2050f
34.7years
37.7years
41.8years
MLA MARKET SNAPSHOT BEEF AND SHEEPMEAT AUSTRALIA August 2019 2
CONSUMERS
• Australian consumer demand for beef is impacted by many factors such as demographic shifts, income growth and changes in people’s attitudes and beliefs towards food from family, friends and the media.
• Overall awareness of beef is high among Australians. Beef is the biggest animal protein type ranked by value and has also grown on year-ago levels. (Source: MLA Global Consumer Tracker Australia, 2018, Nielsen Homescan).
Protein image profiles
Beef Lamb Chicken Pork Seafood
Easy everyday Goodness A little bit special Source: MLA Global Tracker Australia, 2018* Tick = Area of strength vs other proteins
• Beef’s strengths are around its perception of being a ‘trusted quality’ product. It’s also perceived as ‘suitable for everyday meals’ when compared to other proteins such as lamb, seafood and pork, but is behind chicken on this measure (Source: MLA Global Consumer Tracker Australia, 2018).
• There’s an opportunity to increase beef’s appeal by reinforcing quick, easy and convenient ways that it can be prepared for everyday healthy meals, especially when it comes to boosting consumers’ confidence in preparing beef (Source: MLA Global Consumer Tracker Australia, 2018).
FOODSERVICE • Beef is the third largest fresh meat protein consumed through
foodservice in value terms and has been growing steadily year-on-year (Source: RIRDC/Fresh Agenda, Global Data).
• The foodservice sector is a key channel for beef and sources approximately 28% of domestic beef and veal supply (Source: RIRDC/Fresh Agenda).
• The foodservice landscape is large and competitive, with around 87,000 places to eat out. It’s highly fragmented, with many individual companies having a small market share.
• Australians spend 40% of food expenditure on ‘eating out’ and this percentage is growing. Many factors contribute to the choice to eat out or not – mostly occasion-based. Having children in the household indicates a higher level of convenient solutions like takeaways or delivery, which has contributed to the rise of quick service restaurants, supermarket meals-to-go and food delivery.
• Within foodservice, beef has a 12% value share in restaurants and pubs/bars in 2016. However beef’s share is under threat from lower cost proteins such as chicken and pork.
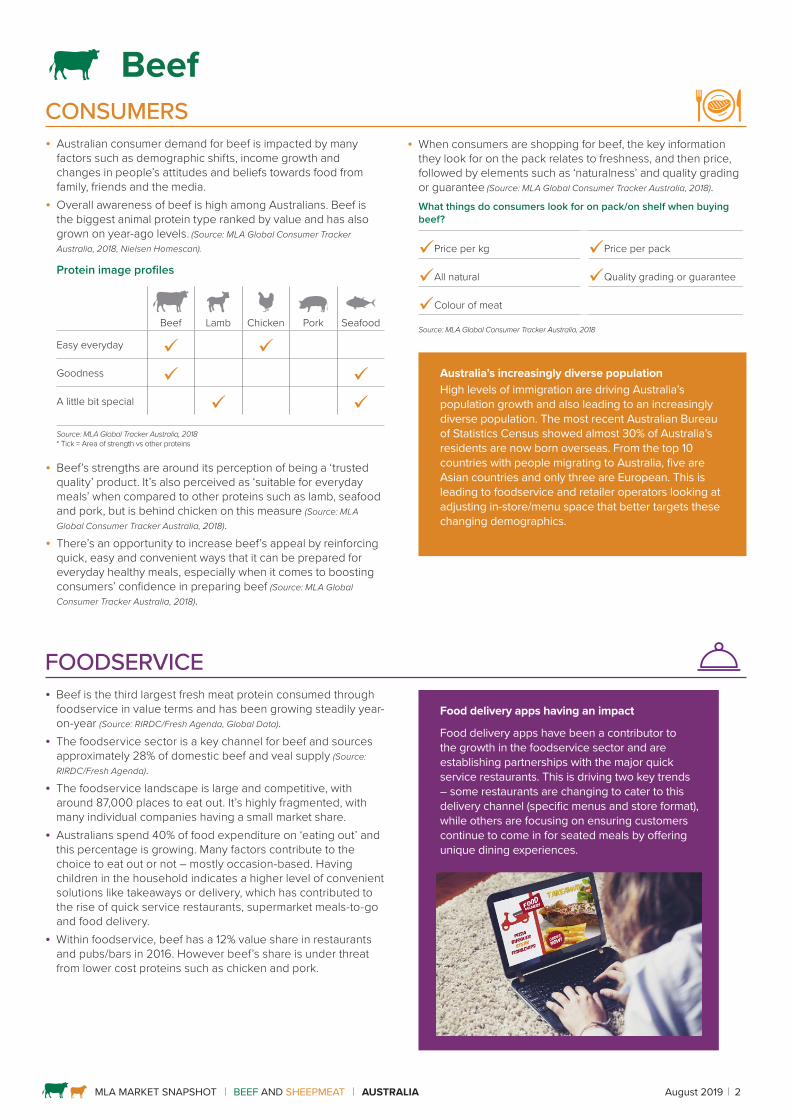
Food delivery apps having an impact
Food delivery apps have been a contributor to the growth in the foodservice sector and are establishing partnerships with the major quick service restaurants. This is driving two key trends – some restaurants are changing to cater to this delivery channel (specific menus and store format), while others are focusing on ensuring customers continue to come in for seated meals by offering unique dining experiences.
Beef
• When consumers are shopping for beef, the key information they look for on the pack relates to freshness, and then price, followed by elements such as ‘naturalness’ and quality grading or guarantee (Source: MLA Global Consumer Tracker Australia, 2018).What things do consumers look for on pack/on shelf when buying beef?
Price per kg Price per pack
All natural Quality grading or guarantee
Colour of meat
Source: MLA Global Consumer Tracker Australia, 2018
Australia’s increasingly diverse populationHigh levels of immigration are driving Australia’s population growth and also leading to an increasingly diverse population. The most recent Australian Bureau of Statistics Census showed almost 30% of Australia’s residents are now born overseas. From the top 10 countries with people migrating to Australia, five are Asian countries and only three are European. This is leading to foodservice and retailer operators looking at adjusting in-store/menu space that better targets these changing demographics.
MLA MARKET SNAPSHOT BEEF AND SHEEPMEAT AUSTRALIA August 2019 3
RETAIL • Total fresh meat is the largest supermarket category (excluding
liquor & tobacco) and plays a key role in driving store traffic and store loyalty (Source: Nielsen Homescan).
• Beef had the highest share of retail sales of any meat in the last 12 months, with around a 34% share of fresh meat sales (by value) (Source: Nielsen Homescan).
• Beef is a critical product for retailers, with the average grocery basket typically worth $35, it jumps to around $90 when the basket includes beef (Source: Nielsen Homescan).
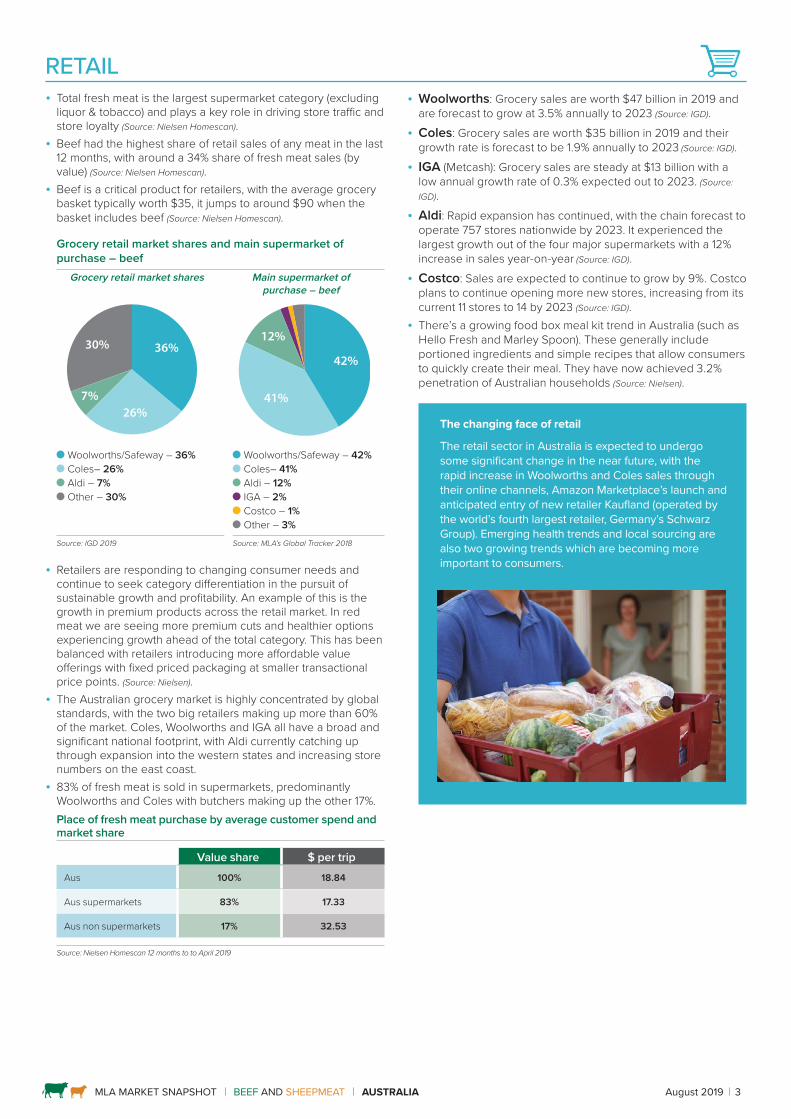
Grocery retail market shares and main supermarket of purchase – beef
Grocery retail market shares Main supermarket of purchase – beef
36%
26%7%
30%42%
41%
12%
Woolworths/Safeway – 36% Coles– 26% Aldi – 7% Other – 30%
Woolworths/Safeway – 42% Coles– 41% Aldi – 12% IGA – 2% Costco – 1% Other – 3%
Source: IGD 2019 Source: MLA’s Global Tracker 2018
• Retailers are responding to changing consumer needs and continue to seek category differentiation in the pursuit of sustainable growth and profitability. An example of this is the growth in premium products across the retail market. In red meat we are seeing more premium cuts and healthier options experiencing growth ahead of the total category. This has been balanced with retailers introducing more affordable value offerings with fixed priced packaging at smaller transactional price points. (Source: Nielsen).
• The Australian grocery market is highly concentrated by global standards, with the two big retailers making up more than 60% of the market. Coles, Woolworths and IGA all have a broad and significant national footprint, with Aldi currently catching up through expansion into the western states and increasing store numbers on the east coast.
• 83% of fresh meat is sold in supermarkets, predominantly Woolworths and Coles with butchers making up the other 17%.Place of fresh meat purchase by average customer spend and market share
Value share $ per tripAus 100% 18.84
Aus supermarkets 83% 17.33
Aus non supermarkets 17% 32.53
Source: Nielsen Homescan 12 months to to April 2019
• Woolworths: Grocery sales are worth $47 billion in 2019 and are forecast to grow at 3.5% annually to 2023 (Source: IGD).
• Coles: Grocery sales are worth $35 billion in 2019 and their growth rate is forecast to be 1.9% annually to 2023 (Source: IGD).
• IGA (Metcash): Grocery sales are steady at $13 billion with a low annual growth rate of 0.3% expected out to 2023. (Source: IGD).
• Aldi: Rapid expansion has continued, with the chain forecast to operate 757 stores nationwide by 2023. It experienced the largest growth out of the four major supermarkets with a 12% increase in sales year-on-year (Source: IGD).
• Costco: Sales are expected to continue to grow by 9%. Costco plans to continue opening more new stores, increasing from its current 11 stores to 14 by 2023 (Source: IGD).
• There’s a growing food box meal kit trend in Australia (such as Hello Fresh and Marley Spoon). These generally include portioned ingredients and simple recipes that allow consumers to quickly create their meal. They have now achieved 3.2% penetration of Australian households (Source: Nielsen).
The changing face of retail
The retail sector in Australia is expected to undergo some significant change in the near future, with the rapid increase in Woolworths and Coles sales through their online channels, Amazon Marketplace’s launch and anticipated entry of new retailer Kaufland (operated by the world’s fourth largest retailer, Germany’s Schwarz Group). Emerging health trends and local sourcing are also two growing trends which are becoming more important to consumers.
MLA MARKET SNAPSHOT BEEF AND SHEEPMEAT AUSTRALIA August 2019 4
SheepmeatCONSUMERS
• Lamb remains one of Australia’s favourite proteins and has a unique role in the national diet of Australians, being one of the largest per capita consumers of lamb in the world (Source: OECD).
• As awareness of lamb is high among Australians, the main opportunity sits with increasing frequency of purchase and demonstrating the value of lamb so people are happy to pay more, and thus keep consuming lamb. (Source: MLA Global Consumer Tracker Australia, 2018).
• Consumers perceive lamb as ‘special’ relative to other proteins and are often choosing lamb as it ‘tastes delicious’. However, there is an opportunity to focus on lamb’s versatility and recipes that are easy to prepare (Source: MLA Global Consumer Tracker Australia, 2018).
FOODSERVICE • Within foodservice, lamb is strong in the dining-out segment,
which currently accounts for 60% of the foodservice lamb volume, with an opportunity to expand in the takeaway channel (Source: RIRDC/Fresh Agenda).
• A key trend for lamb has been the emergence of fast casual outlets that have forced up expectations of consumers. This trend has created a race among traditional quick service restaurants operators to ‘premiumise’ their brands and offering – including the removal of additives and introduction of natural ingredients (Source: GlobalData).
• Cuisines/food concepts are very diverse in Australia and lamb is regarded as a good protein source to fit most cuisines.
• There are also opportunities in new concepts – presenting lamb in non-traditional ways beyond roasts and premium grilling cuts – such as protein bowls, burritos and salads.
• When consumers are shopping for lamb, the key information they look for on-pack relates to freshness (meat colour and use-by date) and then price (Source: MLA Global Consumer Tracker Australia, 2018).
What things do consumers look for on pack/on shelf when buying sheepmeat?
All natural Colour of meat
Price per kg Quality grading or guarantee
Price per packSource: MLA Global Consumer Tracker Australia, 2018
RETAIL • In retail, lamb has a similar market share to pork, with around 12%
share of fresh meat sales (by value) in the last 12 months, behind beef and chicken (Source: Nielsen Homescan).
• Lamb buyers are premium buyers to retailers with the average grocery basket value typically worth $35, it jumps to around $100 when the basket includes lamb (Source: Nielsen Homescan 12 months to to April 2019).
• More than 85% of lamb is purchased via Coles and Woolworths, but other supermarkets (e.g. Costco) are growing both share and absolute sales (source: Nielsen Homescan 12 months to to April 2019).
• Australia’s consumption of lamb has come under pressure in the last year, as volatile supply and strong international demand combined to drive domestic prices into record territory.
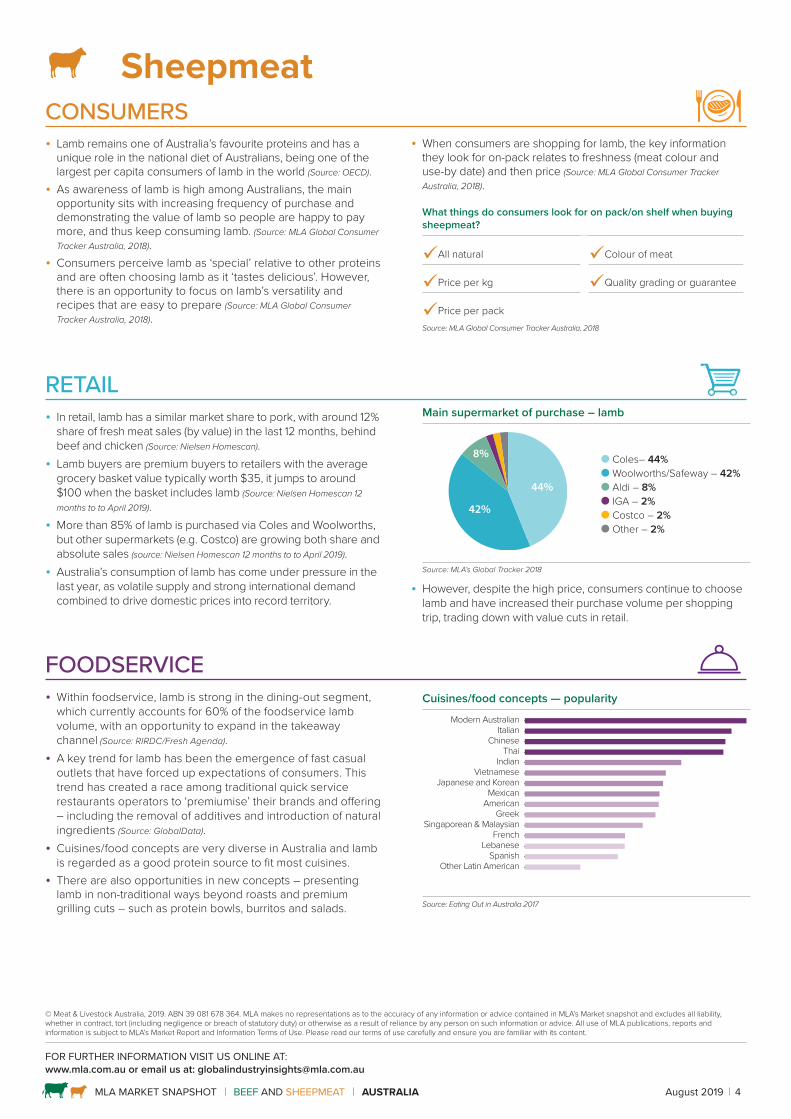
Main supermarket of purchase – lamb
44%
42%
8% Coles– 44% Woolworths/Safeway – 42% Aldi – 8% IGA – 2% Costco – 2% Other – 2%
Source: MLA’s Global Tracker 2018
• However, despite the high price, consumers continue to choose lamb and have increased their purchase volume per shopping trip, trading down with value cuts in retail.
Cuisines/food concepts — popularity
Source: Eating Out in Australia 2017
Other Latin AmericanSpanish
LebaneseFrench
Singaporean & MalaysianGreek
AmericanMexican
Japanese and KoreanVietnamese
IndianThai
ChineseItalian
Modern Australian
FOR FURTHER INFORMATION VISIT US ONLINE AT:www.mla.com.au or email us at: [email protected]
© Meat & Livestock Australia, 2019. ABN 39 081 678 364. MLA makes no representations as to the accuracy of any information or advice contained in MLA’s Market snapshot and excludes all liability, whether in contract, tort (including negligence or breach of statutory duty) or otherwise as a result of reliance by any person on such information or advice. All use of MLA publications, reports and information is subject to MLA’s Market Report and Information Terms of Use. Please read our terms of use carefully and ensure you are familiar with its content.
MARKET SNAPSHOT l BEEF & SHEEPMEAT
MLA MARKET SNAPSHOT BEEF AND SHEEPMEAT JAPAN August 2019 5
Globally, Japan has the second highest number of households earning disposable income over US$35,000/year after the US, with a highly sophisticated supply chain infrastructure. While the country’s population and economic growth are subdued compared with many neighbouring markets in Asia, its affluent and urbanised consumers will continue to demand high volumes of quality imported proteins, such as Australian red meat.
Population Households earning* >US$35k/year
Households earning* >US$50k/year
Households earning* >US$75k/year
126.9in 2019
125.3in 2023
28.7in 2019
39.0in 2023
14.7in 2019
24.1in 2023
5.2in 2019
9.8in 2023
in million Source: Fitch Solutions, 2019 estimate and 2023 forecast
in million households Source: Fitch Solutions, 2019 estimate and 2023 forecast
in million households Source: Fitch Solutions, 2019 estimate and 2023 forecast
in million households Source: Fitch Solutions, 2019 estimate and 2023 forecast
*Disposable income: earnings after taxes and social security charges.
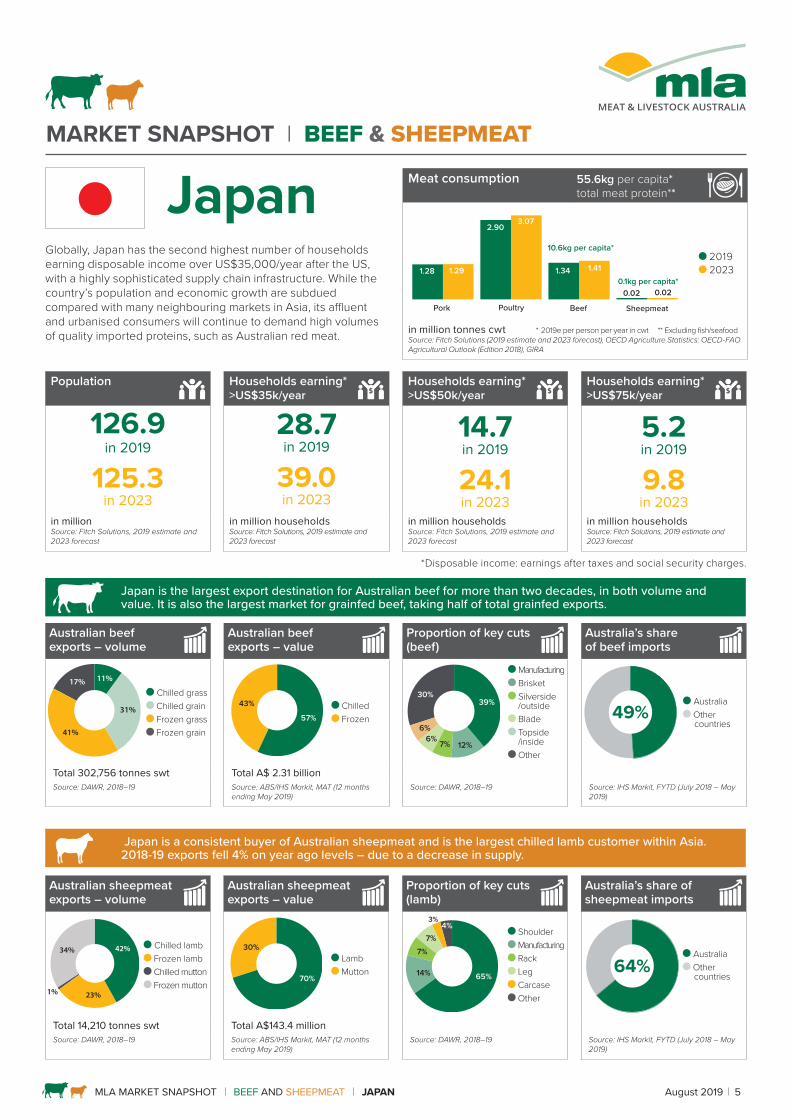
Japan is the largest export destination for Australian beef for more than two decades, in both volume and value. It is also the largest market for grainfed beef, taking half of total grainfed exports.
Japan is a consistent buyer of Australian sheepmeat and is the largest chilled lamb customer within Asia. 2018-19 exports fell 4% on year ago levels – due to a decrease in supply.
Japan Meat consumption 55.6kg per capita*total meat protein**
Pork
1.28 1.29
2.903.07
1.34 1.41
0.02 0.02
Poultry Beef Sheepmeat
10.6kg per capita*
0.1kg per capita*
2019 2023
in million tonnes cwt * 2019e per person per year in cwt ** Excluding fish/seafood Source: Fitch Solutions (2019 estimate and 2023 forecast), OECD Agriculture Statistics: OECD-FAO Agricultural Outlook (Edition 2018), GIRA
Australian beef exports – volume
Australian beef exports – value
Proportion of key cuts (beef)
Australia’s share of beef imports
11%
31%
41%
17% Chilled grass Chilled grain Frozen grass Frozen grain
57%
43% Chilled Frozen
39%
6%
30%
7% 12%
6%
Manufacturing Brisket Silverside /outside Blade Topside /inside Other
49% Australia Other
countries
Total 302,756 tonnes swt Total A$ 2.31 billionSource: DAWR, 2018–19 Source: ABS/IHS Markit, MAT (12 months
ending May 2019)Source: DAWR, 2018–19 Source: IHS Markit, FYTD (July 2018 – May
2019)
Australian sheepmeat exports – volume
Australian sheepmeat exports – value
Proportion of key cuts (lamb)
Australia’s share of sheepmeat imports
42%
23%
34%
1%
Chilled lamb Frozen lamb Chilled mutton Frozen mutton
70%
30% Lamb Mutton 65%
7%4%
7%
14%
3%
Shoulder Manufacturing Rack Leg Carcase Other
64% Australia Other
countries
Total 14,210 tonnes swt Total A$143.4 millionSource: DAWR, 2018–19 Source: ABS/IHS Markit, MAT (12 months
ending May 2019)Source: DAWR, 2018–19 Source: IHS Markit, FYTD (July 2018 – May
2019)
MLA MARKET SNAPSHOT BEEF AND SHEEPMEAT JAPAN August 2019 6
CONSUMERS
• Japanese consumers consider beef the most premium protein and associate it with good taste and being a family favourite. While beef lags behind pork for versatility and convenience, it is an indispensable part of the Japanese diet, underpinned by a strong emotional connection and a unique flavour experience.
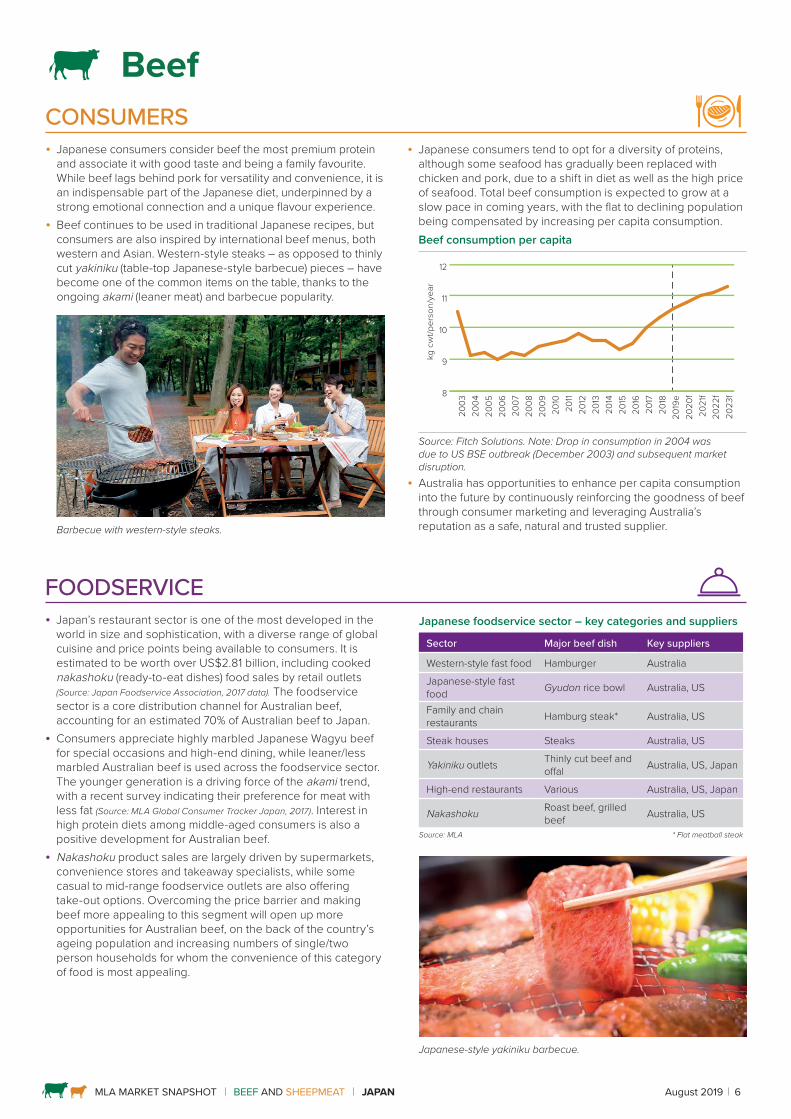
• Beef continues to be used in traditional Japanese recipes, but consumers are also inspired by international beef menus, both western and Asian. Western-style steaks – as opposed to thinly cut yakiniku (table-top Japanese-style barbecue) pieces – have become one of the common items on the table, thanks to the ongoing akami (leaner meat) and barbecue popularity.
Barbecue with western-style steaks.
FOODSERVICE • Japan’s restaurant sector is one of the most developed in the
world in size and sophistication, with a diverse range of global cuisine and price points being available to consumers. It is estimated to be worth over US$2.81 billion, including cooked nakashoku (ready-to-eat dishes) food sales by retail outlets (Source: Japan Foodservice Association, 2017 data). The foodservice sector is a core distribution channel for Australian beef, accounting for an estimated 70% of Australian beef to Japan.
• Consumers appreciate highly marbled Japanese Wagyu beef for special occasions and high-end dining, while leaner/less marbled Australian beef is used across the foodservice sector. The younger generation is a driving force of the akami trend, with a recent survey indicating their preference for meat with less fat (Source: MLA Global Consumer Tracker Japan, 2017). Interest in high protein diets among middle-aged consumers is also a positive development for Australian beef.
• Nakashoku product sales are largely driven by supermarkets, convenience stores and takeaway specialists, while some casual to mid-range foodservice outlets are also offering take-out options. Overcoming the price barrier and making beef more appealing to this segment will open up more opportunities for Australian beef, on the back of the country’s ageing population and increasing numbers of single/two person households for whom the convenience of this category of food is most appealing.
Japanese foodservice sector – key categories and suppliers
Sector Major beef dish Key suppliers
Western-style fast food Hamburger Australia
Japanese-style fast food Gyudon rice bowl Australia, US
Family and chain restaurants Hamburg steak* Australia, US
Steak houses Steaks Australia, US
Yakiniku outlets Thinly cut beef and offal Australia, US, Japan
High-end restaurants Various Australia, US, Japan
Nakashoku Roast beef, grilled beef Australia, US
Source: MLA * Flat meatball steak
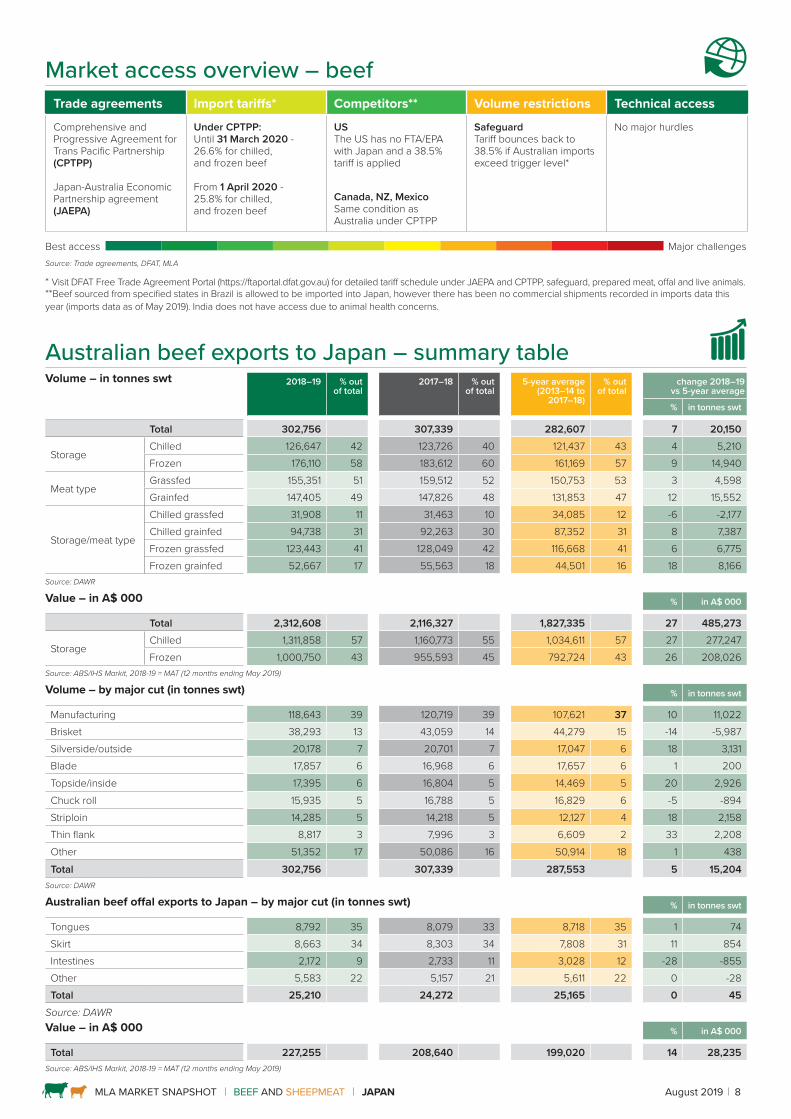
Japanese-style yakiniku barbecue.
Beef
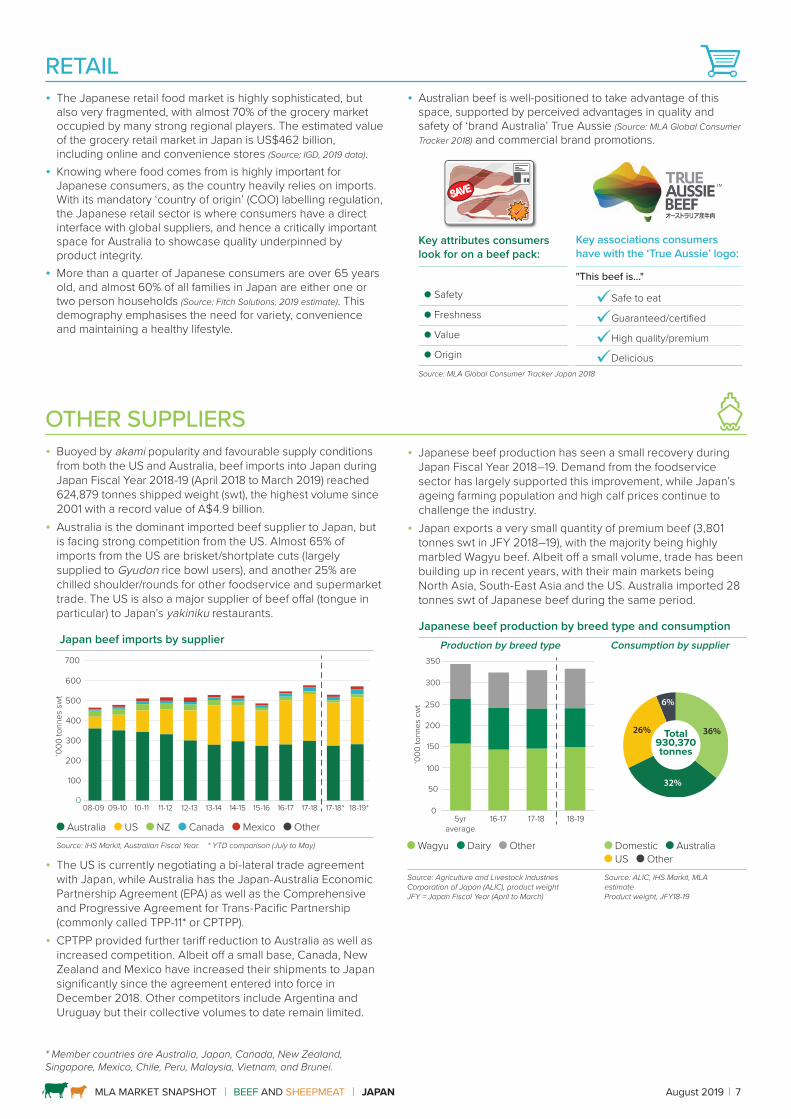
• Japanese consumers tend to opt for a diversity of proteins, although some seafood has gradually been replaced with chicken and pork, due to a shift in diet as well as the high price of seafood. Total beef consumption is expected to grow at a slow pace in coming years, with the flat to declining population being compensated by increasing per capita consumption.Beef consumption per capita
kg c
wt/p
erso
n/ye
ar
2003
2004
2005
2006
2007
2008
2009
2010
2011
2012
2013
2014
2015
2016
2017
2018
2019
e20
20f
2021
f20
22f
2023
f8
9
10
11
12
Source: Fitch Solutions. Note: Drop in consumption in 2004 was due to US BSE outbreak (December 2003) and subsequent market disruption.
• Australia has opportunities to enhance per capita consumption into the future by continuously reinforcing the goodness of beef through consumer marketing and leveraging Australia’s reputation as a safe, natural and trusted supplier.
MLA MARKET SNAPSHOT BEEF AND SHEEPMEAT JAPAN August 2019 7
RETAIL • The Japanese retail food market is highly sophisticated, but
also very fragmented, with almost 70% of the grocery market occupied by many strong regional players. The estimated value of the grocery retail market in Japan is US$462 billion, including online and convenience stores (Source: IGD, 2019 data).
• Knowing where food comes from is highly important for Japanese consumers, as the country heavily relies on imports. With its mandatory ‘country of origin’ (COO) labelling regulation, the Japanese retail sector is where consumers have a direct interface with global suppliers, and hence a critically important space for Australia to showcase quality underpinned by product integrity.
• More than a quarter of Japanese consumers are over 65 years old, and almost 60% of all families in Japan are either one or two person households (Source: Fitch Solutions, 2019 estimate). This demography emphasises the need for variety, convenience and maintaining a healthy lifestyle.
• Australian beef is well-positioned to take advantage of this space, supported by perceived advantages in quality and safety of ‘brand Australia’ True Aussie (Source: MLA Global Consumer Tracker 2018) and commercial brand promotions.
Key attributes consumers look for on a beef pack:
Key associations consumers have with the ‘True Aussie’ logo:
"This beef is..." ● Safety Safe to eat ● Freshness Guaranteed/certified ● Value High quality/premium ● Origin DeliciousSource: MLA Global Consumer Tracker Japan 2018
OTHER SUPPLIERS • Buoyed by akami popularity and favourable supply conditions
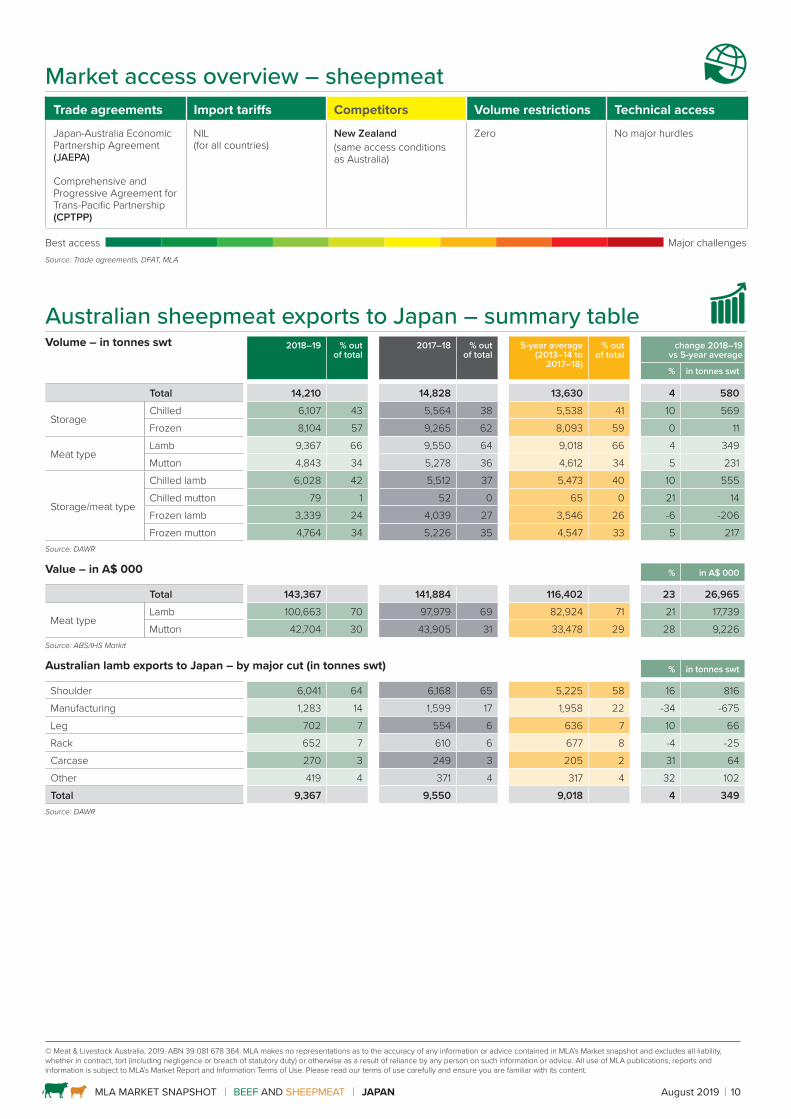
from both the US and Australia, beef imports into Japan during Japan Fiscal Year 2018-19 (April 2018 to March 2019) reached 624,879 tonnes shipped weight (swt), the highest volume since 2001 with a record value of A$4.9 billion.
• Australia is the dominant imported beef supplier to Japan, but is facing strong competition from the US. Almost 65% of imports from the US are brisket/shortplate cuts (largely supplied to Gyudon rice bowl users), and another 25% are chilled shoulder/rounds for other foodservice and supermarket trade. The US is also a major supplier of beef offal (tongue in particular) to Japan’s yakiniku restaurants.
Japan beef imports by supplier
‘000
tonn
es s
wt
0
100
200
300
400
500
600
700other
Mexico
Canada
NZ
US
Australia
09-1008-09 10-11 11-12 12-13 13-14 14-15 15-16 16-17 17-18 17-18* 18-19*
Australia US NZ Canada Mexico OtherSource: IHS Markit, Australian Fiscal Year. * YTD comparison (July to May)
• The US is currently negotiating a bi-lateral trade agreement with Japan, while Australia has the Japan-Australia Economic Partnership Agreement (EPA) as well as the Comprehensive and Progressive Agreement for Trans-Pacific Partnership (commonly called TPP-11* or CPTPP).
• CPTPP provided further tariff reduction to Australia as well as increased competition. Albeit off a small base, Canada, New Zealand and Mexico have increased their shipments to Japan significantly since the agreement entered into force in December 2018. Other competitors include Argentina and Uruguay but their collective volumes to date remain limited.
• Japanese beef production has seen a small recovery during Japan Fiscal Year 2018–19. Demand from the foodservice sector has largely supported this improvement, while Japan’s ageing farming population and high calf prices continue to challenge the industry.
• Japan exports a very small quantity of premium beef (3,801 tonnes swt in JFY 2018–19), with the majority being highly marbled Wagyu beef. Albeit off a small volume, trade has been building up in recent years, with their main markets being North Asia, South-East Asia and the US. Australia imported 28 tonnes swt of Japanese beef during the same period.
Japanese beef production by breed type and consumptionProduction by breed type Consumption by supplier
‘000
tonn
es c
wt
0
50
100
150
200
250
300
350other
Dairy
Wagyu
5yraverage
17-18 18-1916-17
Total 930,370tonnes
36%26%
32%
6%
Wagyu Dairy Other Domestic Australia US Other
Source: Agriculture and Livestock Industries Corporation of Japan (ALIC), product weight JFY = Japan Fiscal Year (April to March)
Source: ALIC, IHS Markit, MLA estimate Product weight, JFY18-19
* Member countries are Australia, Japan, Canada, New Zealand, Singapore, Mexico, Chile, Peru, Malaysia, Vietnam, and Brunei.
MLA MARKET SNAPSHOT BEEF AND SHEEPMEAT JAPAN August 2019 8
Market access overview – beef Trade agreements Import tariffs* Competitors** Volume restrictions Technical access
Comprehensive and Progressive Agreement for Trans Pacific Partnership(CPTPP)
Japan-Australia Economic Partnership agreement (JAEPA)
Under CPTPP:Until 31 March 2020 - 26.6% for chilled, and frozen beef
From 1 April 2020 - 25.8% for chilled, and frozen beef
USThe US has no FTA/EPA with Japan and a 38.5% tariff is applied
Canada, NZ, MexicoSame condition as Australia under CPTPP
SafeguardTariff bounces back to 38.5% if Australian imports exceed trigger level*
No major hurdles
Best access Major challengesSource: Trade agreements, DFAT, MLA
* Visit DFAT Free Trade Agreement Portal (https://ftaportal.dfat.gov.au) for detailed tariff schedule under JAEPA and CPTPP, safeguard, prepared meat, offal and live animals.**Beef sourced from specified states in Brazil is allowed to be imported into Japan, however there has been no commercial shipments recorded in imports data this year (imports data as of May 2019). India does not have access due to animal health concerns.
Australian beef exports to Japan – summary table Volume – in tonnes swt 2018–19 % out
of total2017–18 % out
of total5-year average
(2013–14 to 2017–18)
% out of total
change 2018–19 vs 5-year average
% in tonnes swt
Total 302,756 307,339 282,607 7 20,150
StorageChilled 126,647 42 123,726 40 121,437 43 4 5,210Frozen 176,110 58 183,612 60 161,169 57 9 14,940
Meat typeGrassfed 155,351 51 159,512 52 150,753 53 3 4,598Grainfed 147,405 49 147,826 48 131,853 47 12 15,552
Storage/meat type
Chilled grassfed 31,908 11 31,463 10 34,085 12 -6 -2,177Chilled grainfed 94,738 31 92,263 30 87,352 31 8 7,387Frozen grassfed 123,443 41 128,049 42 116,668 41 6 6,775Frozen grainfed 52,667 17 55,563 18 44,501 16 18 8,166
Source: DAWR
Value – in A$ 000 % in A$ 000
Total 2,312,608 2,116,327 1,827,335 27 485,273
StorageChilled 1,311,858 57 1,160,773 55 1,034,611 57 27 277,247 Frozen 1,000,750 43 955,593 45 792,724 43 26 208,026
Source: ABS/IHS Markit, 2018-19 = MAT (12 months ending May 2019)
Volume – by major cut (in tonnes swt) % in tonnes swt
Manufacturing 118,643 39 120,719 39 107,621 37 10 11,022 Brisket 38,293 13 43,059 14 44,279 15 -14 -5,987 Silverside/outside 20,178 7 20,701 7 17,047 6 18 3,131 Blade 17,857 6 16,968 6 17,657 6 1 200 Topside/inside 17,395 6 16,804 5 14,469 5 20 2,926 Chuck roll 15,935 5 16,788 5 16,829 6 -5 -894 Striploin 14,285 5 14,218 5 12,127 4 18 2,158 Thin flank 8,817 3 7,996 3 6,609 2 33 2,208 Other 51,352 17 50,086 16 50,914 18 1 438 Total 302,756 307,339 287,553 5 15,204
Source: DAWR
Australian beef offal exports to Japan – by major cut (in tonnes swt) % in tonnes swt
Tongues 8,792 35 8,079 33 8,718 35 1 74Skirt 8,663 34 8,303 34 7,808 31 11 854Intestines 2,172 9 2,733 11 3,028 12 -28 -855Other 5,583 22 5,157 21 5,611 22 0 -28Total 25,210 24,272 25,165 0 45
Source: DAWRValue – in A$ 000 % in A$ 000
Total 227,255 208,640 199,020 14 28,235Source: ABS/IHS Markit, 2018-19 = MAT (12 months ending May 2019)

MLA MARKET SNAPSHOT BEEF AND SHEEPMEAT JAPAN August 2019 9
SheepmeatCONSUMERS
• Sheepmeat has a minor but relatively established presence in Japan, in comparison to other niche proteins such as goatmeat and game meat. Lamb resonates with the market’s tradition of seeking a variety of foods that deliver enjoyment, but also nutritional balance in the diet.
• Consumers appreciate lamb’s eating quality, but also think lamb is hard to buy and not as versatile as other proteins (Source: MLA Global Consumer Tracker Japan, 2018). Current per capita sheepmeat consumption is extremely low, indicating scope for future growth.
• Making lamb more accessible in an everyday environment remains a priority in a market where people place great emphasis on convenience, underpinned by the country’s ageing population and increasing number of single/two person households.
FOODSERVICE • Australian lamb consumption to date has been largely led by
Genghis Khan (sheepmeat barbecue on a table-top grill) outlets. They are particularly popular in Hokkaido (the north island of Japan) among locals and visiting tourists. New Genghis Khan venues have opened in major cities as well, largely focused on young consumers.
• Coincidentally, the number of mid to high-end restaurants serving lamb as a point of difference has been increasing, as
Attributes important for all proteins and lamb associations
What attributes are important for Japanese consumers (all proteins)?
What associations do consumers have to lamb?
My/my family’s favourite Tastes delicious
Easy to prepare Low in fat
Consistent quality standards High nutritional value
Easy to purchase Meat is tender
Meat is tender My/my family’s favouriteSource: MLA Global Consumer Tracker Japan, 2018
RETAIL • Lack of familiarity and knowledge of how to cook lamb are
major reasons for Japanese shoppers not purchasing lamb in the retail channel (Source: MLA Global Consumer Tracker Japan, 2018). While major retailers in Tokyo are gradually increasing their shelf space for lamb, New Zealand has a competitive presence in the sector with its smaller-sized bone-in (lamb cutlet) products. Along with cutlets, Japanese-style lamb recipes and marinated products using Japanese flavours are
OTHER SUPPLIERS • The Japanese sheepmeat industry remains very small* and
hence sheepmeat demand in Japan has been, and will continue to be, filled by imports.
Sheepmeat imports by supplier
0
5
10
15
20
25
30other
New Zealand
Australia
18-19*
17-18*
17-18
16-1715-1614-15
13-14
12-1311-12
10-1109-10
08-09
‘000
tonn
es s
wt
Australia NZ OtherSource: IHS Markit, *FYTD comparison (July to May)
perceived as more ‘accessible’ than western-style dishes and are popular among shoppers.
• When at the shelf, consumers look for markers of guaranteed safety, freshness, and value (Source: MLA Global Consumer Tracker Japan, 2018). Country of origin labelling is mandatory at Japanese retail level, and provides opportunities to promote Australia as a safe, trusted and quality supplier of sheepmeat via ‘brand Australia’ (True Aussie) and commercial brand promotions.
• Australia is the dominant imported sheepmeat supplier to Japan, but is facing strong competition from New Zealand, which has the same access conditions. The US gained sheepmeat access to Japan in late 2018, but commercial volumes have been limited to date.
Sheepmeat imports from New Zealand
Chilled boneless – 35% Chilled bone-in – 10% Frozen boneless – 33% Frozen bone-in – 9% Carcases – 13%
Total 7,848 tonnes swt Average value A$10.20/kg
Source: IHS Markit, MAT (June 2018 to May 2019)
* Last production data recorded in Japan was 2009, at 184 tonnes cwt.
grilled meat and global flavours are becoming a mainstream dining choice among Japan’s sophisticated urban professionals.
• Lamb is regarded as healthy and topical among young social media followers, with some restaurants offering both Genghis Khan and shabu-shabu hot-pot style, or serving chilled lamb to promote its high quality.
MLA MARKET SNAPSHOT BEEF AND SHEEPMEAT JAPAN August 2019 10
Market access overview – sheepmeat Trade agreements Import tariffs Competitors Volume restrictions Technical access
Japan-Australia Economic Partnership Agreement (JAEPA)
Comprehensive and Progressive Agreement for Trans-Pacific Partnership(CPTPP)
NIL(for all countries)
New Zealand(same access conditions as Australia)
Zero No major hurdles
Best access Major challengesSource: Trade agreements, DFAT, MLA
Australian sheepmeat exports to Japan – summary table Volume – in tonnes swt 2018–19 % out
of total2017–18 % out
of total5-year average
(2013–14 to 2017–18)
% out of total
change 2018–19 vs 5-year average
% in tonnes swt
Total 14,210 14,828 13,630 4 580
StorageChilled 6,107 43 5,564 38 5,538 41 10 569Frozen 8,104 57 9,265 62 8,093 59 0 11
Meat typeLamb 9,367 66 9,550 64 9,018 66 4 349Mutton 4,843 34 5,278 36 4,612 34 5 231
Storage/meat type
Chilled lamb 6,028 42 5,512 37 5,473 40 10 555Chilled mutton 79 1 52 0 65 0 21 14Frozen lamb 3,339 24 4,039 27 3,546 26 -6 -206Frozen mutton 4,764 34 5,226 35 4,547 33 5 217
Source: DAWR
Value – in A$ 000 % in A$ 000
Total 143,367 141,884 116,402 23 26,965
Meat typeLamb 100,663 70 97,979 69 82,924 71 21 17,739Mutton 42,704 30 43,905 31 33,478 29 28 9,226
Source: ABS/IHS Markit
Australian lamb exports to Japan – by major cut (in tonnes swt) % in tonnes swt
Shoulder 6,041 64 6,168 65 5,225 58 16 816Manufacturing 1,283 14 1,599 17 1,958 22 -34 -675Leg 702 7 554 6 636 7 10 66Rack 652 7 610 6 677 8 -4 -25Carcase 270 3 249 3 205 2 31 64Other 419 4 371 4 317 4 32 102Total 9,367 9,550 9,018 4 349
Source: DAWR
© Meat & Livestock Australia, 2019. ABN 39 081 678 364. MLA makes no representations as to the accuracy of any information or advice contained in MLA’s Market snapshot and excludes all liability, whether in contract, tort (including negligence or breach of statutory duty) or otherwise as a result of reliance by any person on such information or advice. All use of MLA publications, reports and information is subject to MLA’s Market Report and Information Terms of Use. Please read our terms of use carefully and ensure you are familiar with its content.
MARKET SNAPSHOT l BEEF & SHEEPMEAT
MLA MARKET SNAPSHOT BEEF AND SHEEPMEAT NORTH AMERICA August 2019 11
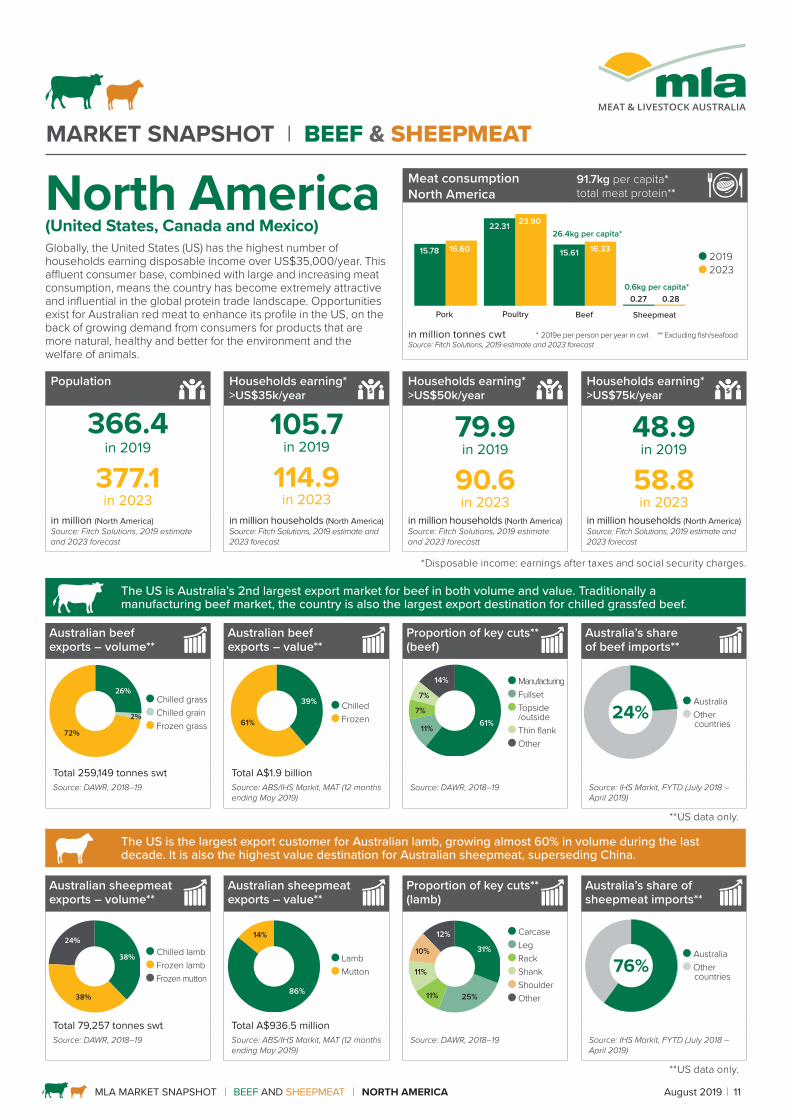
Globally, the United States (US) has the highest number of households earning disposable income over US$35,000/year. This affluent consumer base, combined with large and increasing meat consumption, means the country has become extremely attractive and influential in the global protein trade landscape. Opportunities exist for Australian red meat to enhance its profile in the US, on the back of growing demand from consumers for products that are more natural, healthy and better for the environment and the welfare of animals.
Population Households earning* >US$35k/year
Households earning* >US$50k/year
Households earning* >US$75k/year
366.4in 2019
377.1in 2023
105.7in 2019
114.9in 2023
79.9in 2019
90.6in 2023
48.9in 2019
58.8in 2023
in million (North America) Source: Fitch Solutions, 2019 estimate and 2023 forecast
in million households (North America) Source: Fitch Solutions, 2019 estimate and 2023 forecast
in million households (North America) Source: Fitch Solutions, 2019 estimate and 2023 forecastt
in million households (North America) Source: Fitch Solutions, 2019 estimate and 2023 forecast
*Disposable income: earnings after taxes and social security charges.
The US is Australia’s 2nd largest export market for beef in both volume and value. Traditionally a manufacturing beef market, the country is also the largest export destination for chilled grassfed beef.
The US is the largest export customer for Australian lamb, growing almost 60% in volume during the last decade. It is also the highest value destination for Australian sheepmeat, superseding China.
North America(United States, Canada and Mexico)
Meat consumption North America
91.7kg per capita*total meat protein**
Pork
15.78 16.60
22.31 23.90
15.61 16.33
0.27 0.28
Poultry Beef Sheepmeat
26.4kg per capita*
0.6kg per capita*
2019 2023
in million tonnes cwt * 2019e per person per year in cwt ** Excluding fish/seafood Source: Fitch Solutions, 2019 estimate and 2023 forecast
Australian beef exports – volume**
Australian beef exports – value**
Proportion of key cuts** (beef)
Australia’s share of beef imports**
26%
2%
72%
Chilled grass Chilled grain Frozen grass
39%
61%
Chilled Frozen 61%
7%
14%
7%
11%
Manufacturing Fullset Topside /outside Thin flank Other
24% Australia Other
countries
Total 259,149 tonnes swt Total A$1.9 billionSource: DAWR, 2018–19 Source: ABS/IHS Markit, MAT (12 months
ending May 2019)Source: DAWR, 2018–19 Source: IHS Markit, FYTD (July 2018 –
April 2019)
**US data only.
Australian sheepmeat exports – volume**
Australian sheepmeat exports – value**
Proportion of key cuts** (lamb)
Australia’s share of sheepmeat imports**
38%
38%
24% Chilled lamb Frozen lamb Frozen mutton
86%
14%
Lamb Mutton
31%
11%
12%
10%
25%11%
Carcase Leg Rack Shank Shoulder Other
76% Australia Other
countries
Total 79,257 tonnes swt Total A$936.5 millionSource: DAWR, 2018–19 Source: ABS/IHS Markit, MAT (12 months
ending May 2019)Source: DAWR, 2018–19 Source: IHS Markit, FYTD (July 2018 –
April 2019)
**US data only.
MLA MARKET SNAPSHOT BEEF AND SHEEPMEAT NORTH AMERICA August 2019 12
CONSUMERS
• The US is one of the largest global consumers of animal protein, with the level of meat consumption near maturity. Going forward, the category’s growth will be more from value instead of volume.
• Beef consumption has increased since 2015, in-line with higher US beef production and a return to a more favourable price point for US consumers, alongside a significantly improved economy. However, the strongest growth has been realised in the ‘better for me’ category which includes grassfed beef and beef with no added hormones or antibiotics.
• The majority of US consumers would consider buying imported beef and are aware of grassfed beef.
Awareness of different types of beef – top 4 in US
Grassfed beef
Organic beef
Regular or conventional beef
Hormone-free beef
80
71
69
55
Source: MLA Global Consumer Tracker US, 2018
• Two-thirds of US shoppers are looking for ‘better for me’ options at the meat case and tie production claims to both their own health and animal welfare.
FOODSERVICE • Total foodservice growth is stable, especially for full service
restaurants. However, retail foodservice has seen strong expansion.
• Manufacturing beef for burgers and other processed beef products make up a large proportion of Australian beef sold into the foodservice sector in the US, while chilled grassfed beef is largely destined for full service restaurants and retail.
• Grassfed beef is most common in fast-casual and fine dining restaurants however, growth is solid across all segments, tripling within the last 10 years. In fact, US industry researcher, Datassential predicts grassfed beef will grow by 27.9% over the next four years to achieve 4.9% penetration across foodservice operations overall.
Penetration by restaurant segment – Grassfed beef
All
Fine dining
Fast casual
Casual
MidscaleQuick servicerestaurant
5%
8%
4%
2%
3%
1%
(+99%)
(+163%)
(+97%)
(+87 %)
(+54%)
(+++%)
(Bracket percentage) = 4 year % change 2017 vs. 2013Source: Dataessential, beef and lamb menu analysis, 2018
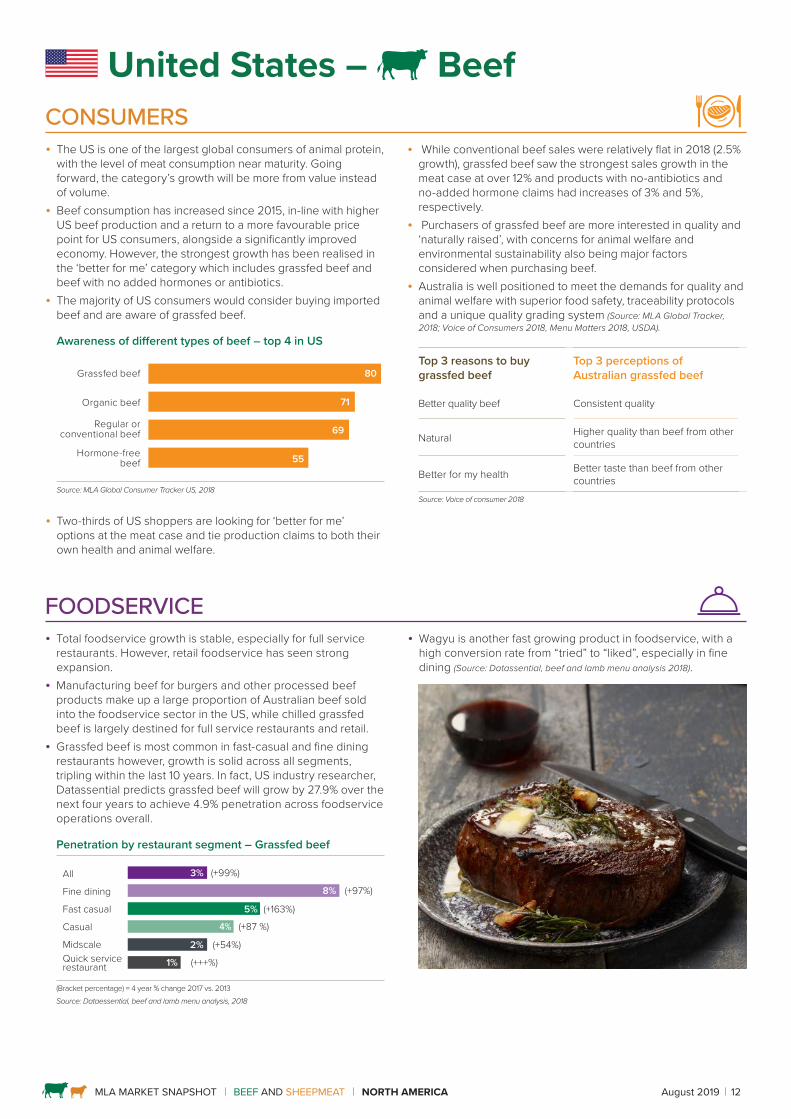
• Wagyu is another fast growing product in foodservice, with a high conversion rate from “tried” to “liked”, especially in fine dining (Source: Datassential, beef and lamb menu analysis 2018).
• While conventional beef sales were relatively flat in 2018 (2.5% growth), grassfed beef saw the strongest sales growth in the meat case at over 12% and products with no-antibiotics and no-added hormone claims had increases of 3% and 5%, respectively.
• Purchasers of grassfed beef are more interested in quality and ‘naturally raised’, with concerns for animal welfare and environmental sustainability also being major factors considered when purchasing beef.
• Australia is well positioned to meet the demands for quality and animal welfare with superior food safety, traceability protocols and a unique quality grading system (Source: MLA Global Tracker, 2018; Voice of Consumers 2018, Menu Matters 2018, USDA).
Top 3 reasons to buy grassfed beef
Top 3 perceptions of Australian grassfed beef
Better quality beef Consistent quality
Natural Higher quality than beef from other countries
Better for my health Better taste than beef from other countries
Source: Voice of consumer 2018
United States – Beef
MLA MARKET SNAPSHOT BEEF AND SHEEPMEAT NORTH AMERICA August 2019 13
RETAIL • Although grassfed beef in US retail is a relatively small offering,
it has seen some of the strongest growth in the meat case with predictions indicating no slow down in demand for the coming year. While ground grassfed beef is now quite common, demand for higher value chilled grassfed beef is increasing. Some of the most popular cuts include tenderloin, striploin and rib eye.
• Limited ‘country of origin’ labelling at point of purchase is challenging for Australian product to be differentiated in the sector with retailers preferring ‘local’ callouts in their meat case. On the contrary, research indicates US consumers consider Australia as aspirational and able to deliver ethical production claims on their grassfed beef purchases.
Where do shoppers buy Australian beef
Supermarket – 63% Butcher – 16% Club warehouse – 9% Online – 6% Direct from farmer’s market – 1% Other – 6%
Source: MLA Global Tracker US, 2018
• Reflecting the retail environment in the US, supermarkets are the main purchase channel for Australian grassfed beef followed by independent and regional butchers, online retailers like Amazon, and warehouse club stores such as Costco. Interestingly, Trader Joe’s and Whole Foods shoppers are more likely to know the origins of their grassfed beef compared with the average supermarket shopper, representing an opportunity for Australian beef to increase origin awareness and preference.
• Australian grassfed beef is perceived to provide higher quality steak than other imported products, with Costco and Whole Foods the most trusted sources for high-quality steak (Source: MLA Global Tracker, 2018, Voice of consumers 2018, Grassfed Shop-a-long research, 2018).
Motivation to choose and eat beef – top 5 Important themes ranked by relative importance
Freshness
Natural
Value
Quality/safety
Environmental
Source: MLA Global Consumer Tracker US, 2018
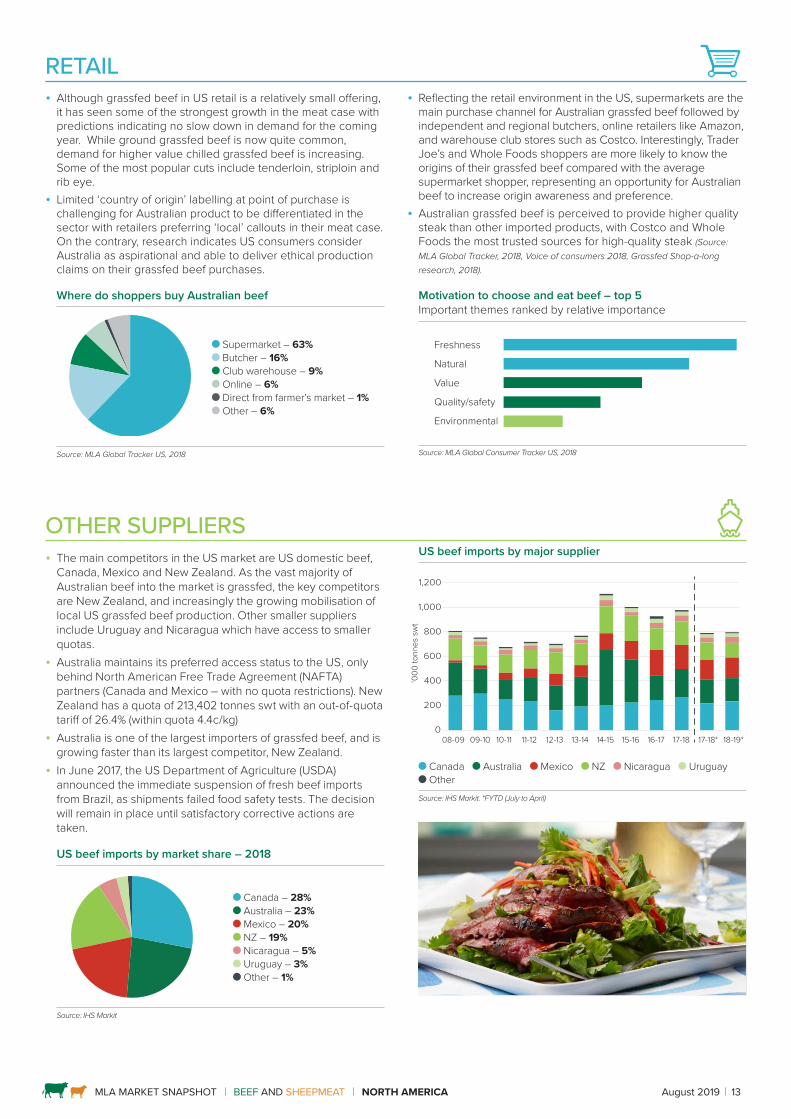
OTHER SUPPLIERS • The main competitors in the US market are US domestic beef,
Canada, Mexico and New Zealand. As the vast majority of Australian beef into the market is grassfed, the key competitors are New Zealand, and increasingly the growing mobilisation of local US grassfed beef production. Other smaller suppliers include Uruguay and Nicaragua which have access to smaller quotas.
• Australia maintains its preferred access status to the US, only behind North American Free Trade Agreement (NAFTA) partners (Canada and Mexico – with no quota restrictions). New Zealand has a quota of 213,402 tonnes swt with an out-of-quota tariff of 26.4% (within quota 4.4c/kg)
• Australia is one of the largest importers of grassfed beef, and is growing faster than its largest competitor, New Zealand.
• In June 2017, the US Department of Agriculture (USDA) announced the immediate suspension of fresh beef imports from Brazil, as shipments failed food safety tests. The decision will remain in place until satisfactory corrective actions are taken.
US beef imports by market share – 2018
Canada – 28% Australia – 23% Mexico – 20% NZ – 19% Nicaragua – 5% Uruguay – 3% Other – 1%
Source: IHS Markit
US beef imports by major supplier
‘000
tonn
es s
wt
0
200
400
600
800
1,000
1,200Other
Uruguay
Nicaragua
New Zealand
Mexico
Australia
Canada09-1008-09 10-11 11-12 12-13 13-14 14-15 15-16 16-17 17-18 17-18* 18-19*
Canada Australia Mexico NZ Nicaragua Uruguay Other
Source: IHS Markit. *FYTD (July to April)
MLA MARKET SNAPSHOT BEEF AND SHEEPMEAT NORTH AMERICA August 2019 14
Canada – Beef
Mexico – Beef
CONSUMERS
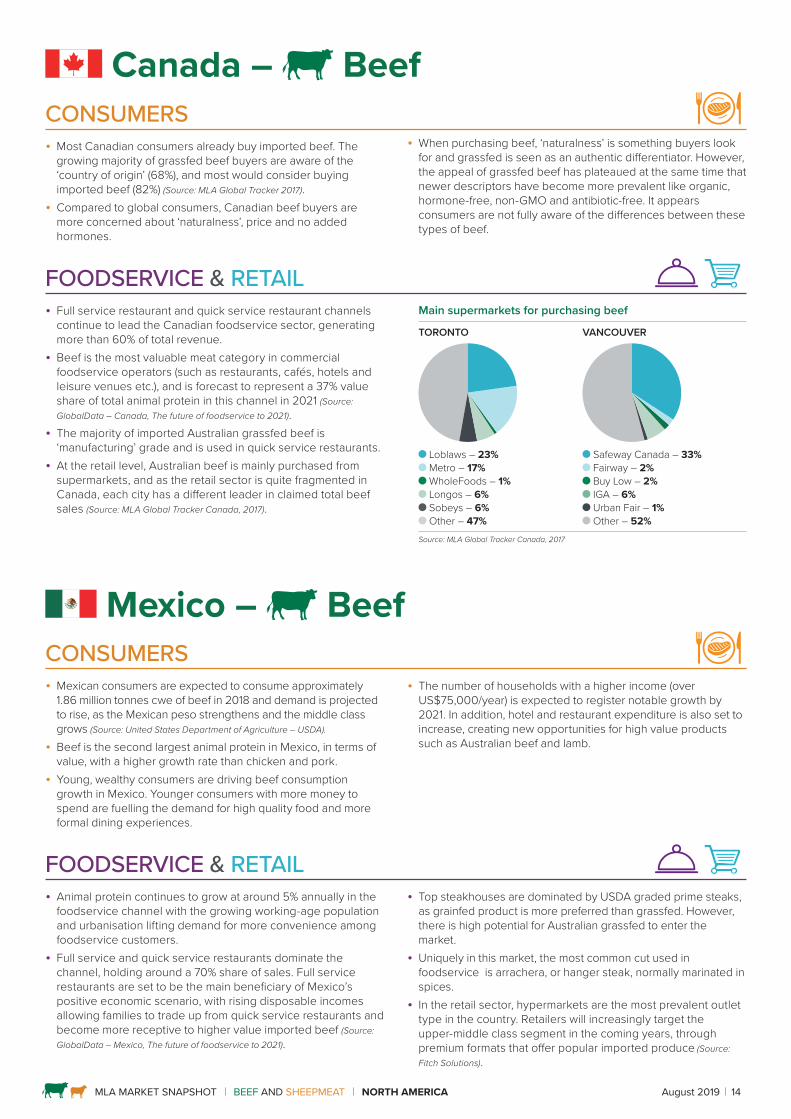
• Most Canadian consumers already buy imported beef. The growing majority of grassfed beef buyers are aware of the ‘country of origin’ (68%), and most would consider buying imported beef (82%) (Source: MLA Global Tracker 2017).
• Compared to global consumers, Canadian beef buyers are more concerned about ‘naturalness’, price and no added hormones.
• When purchasing beef, ‘naturalness’ is something buyers look for and grassfed is seen as an authentic differentiator. However, the appeal of grassfed beef has plateaued at the same time that newer descriptors have become more prevalent like organic, hormone-free, non-GMO and antibiotic-free. It appears consumers are not fully aware of the differences between these types of beef.
FOODSERVICE & RETAIL • Full service restaurant and quick service restaurant channels
continue to lead the Canadian foodservice sector, generating more than 60% of total revenue.
• Beef is the most valuable meat category in commercial foodservice operators (such as restaurants, cafés, hotels and leisure venues etc.), and is forecast to represent a 37% value share of total animal protein in this channel in 2021 (Source: GlobalData – Canada, The future of foodservice to 2021).
• The majority of imported Australian grassfed beef is ‘manufacturing’ grade and is used in quick service restaurants.
• At the retail level, Australian beef is mainly purchased from supermarkets, and as the retail sector is quite fragmented in Canada, each city has a different leader in claimed total beef sales (Source: MLA Global Tracker Canada, 2017).
Main supermarkets for purchasing beef
TORONTO VANCOUVER
Loblaws – 23% Metro – 17% WholeFoods – 1% Longos – 6% Sobeys – 6% Other – 47%
Safeway Canada – 33% Fairway – 2% Buy Low – 2% IGA – 6% Urban Fair – 1% Other – 52%
Source: MLA Global Tracker Canada, 2017
CONSUMERS
• Mexican consumers are expected to consume approximately 1.86 million tonnes cwe of beef in 2018 and demand is projected to rise, as the Mexican peso strengthens and the middle class grows (Source: United States Department of Agriculture – USDA).
• Beef is the second largest animal protein in Mexico, in terms of value, with a higher growth rate than chicken and pork.
• Young, wealthy consumers are driving beef consumption growth in Mexico. Younger consumers with more money to spend are fuelling the demand for high quality food and more formal dining experiences.
• The number of households with a higher income (over US$75,000/year) is expected to register notable growth by 2021. In addition, hotel and restaurant expenditure is also set to increase, creating new opportunities for high value products such as Australian beef and lamb.
FOODSERVICE & RETAIL • Animal protein continues to grow at around 5% annually in the
foodservice channel with the growing working-age population and urbanisation lifting demand for more convenience among foodservice customers.
• Full service and quick service restaurants dominate the channel, holding around a 70% share of sales. Full service restaurants are set to be the main beneficiary of Mexico’s positive economic scenario, with rising disposable incomes allowing families to trade up from quick service restaurants and become more receptive to higher value imported beef (Source: GlobalData – Mexico, The future of foodservice to 2021).
• Top steakhouses are dominated by USDA graded prime steaks, as grainfed product is more preferred than grassfed. However, there is high potential for Australian grassfed to enter the market.
• Uniquely in this market, the most common cut used in foodservice is arrachera, or hanger steak, normally marinated in spices.
• In the retail sector, hypermarkets are the most prevalent outlet type in the country. Retailers will increasingly target the upper-middle class segment in the coming years, through premium formats that offer popular imported produce (Source: Fitch Solutions).
MLA MARKET SNAPSHOT BEEF AND SHEEPMEAT NORTH AMERICA August 2019 15
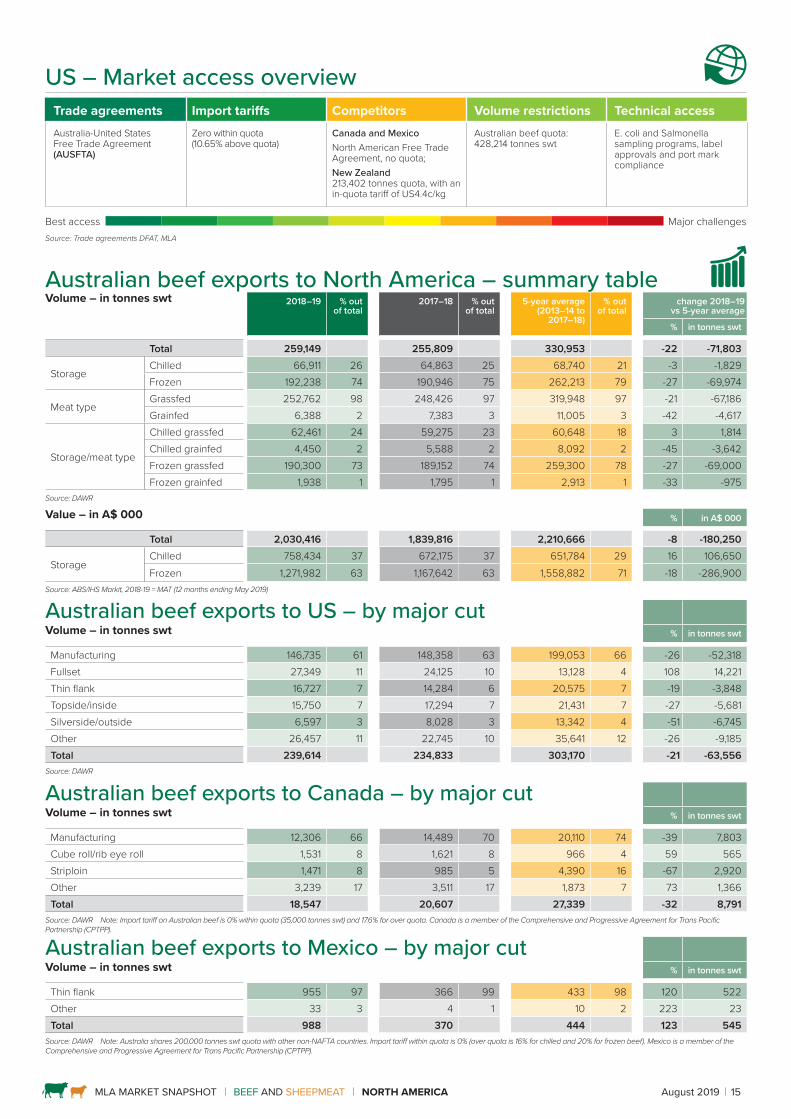
US – Market access overview Trade agreements Import tariffs Competitors Volume restrictions Technical accessAustralia-United States Free Trade Agreement (AUSFTA)
Zero within quota (10.65% above quota)
Canada and MexicoNorth American Free Trade Agreement, no quota;New Zealand 213,402 tonnes quota, with an in-quota tariff of US4.4c/kg
Australian beef quota: 428,214 tonnes swt
E. coli and Salmonella sampling programs, label approvals and port mark compliance
Best access Major challengesSource: Trade agreements DFAT, MLA
Australian beef exports to North America – summary table Volume – in tonnes swt 2018–19 % out
of total2017–18 % out
of total5-year average
(2013–14 to 2017–18)
% out of total
change 2018–19 vs 5-year average
% in tonnes swt
Total 259,149 255,809 330,953 -22 -71,803
StorageChilled 66,911 26 64,863 25 68,740 21 -3 -1,829Frozen 192,238 74 190,946 75 262,213 79 -27 -69,974
Meat typeGrassfed 252,762 98 248,426 97 319,948 97 -21 -67,186Grainfed 6,388 2 7,383 3 11,005 3 -42 -4,617
Storage/meat type
Chilled grassfed 62,461 24 59,275 23 60,648 18 3 1,814Chilled grainfed 4,450 2 5,588 2 8,092 2 -45 -3,642Frozen grassfed 190,300 73 189,152 74 259,300 78 -27 -69,000Frozen grainfed 1,938 1 1,795 1 2,913 1 -33 -975
Source: DAWR
Value – in A$ 000 % in A$ 000
Total 2,030,416 1,839,816 2,210,666 -8 -180,250
StorageChilled 758,434 37 672,175 37 651,784 29 16 106,650Frozen 1,271,982 63 1,167,642 63 1,558,882 71 -18 -286,900
Source: ABS/IHS Markit, 2018-19 = MAT (12 months ending May 2019)
Australian beef exports to US – by major cutVolume – in tonnes swt % in tonnes swt
Manufacturing 146,735 61 148,358 63 199,053 66 -26 -52,318 Fullset 27,349 11 24,125 10 13,128 4 108 14,221 Thin flank 16,727 7 14,284 6 20,575 7 -19 -3,848 Topside/inside 15,750 7 17,294 7 21,431 7 -27 -5,681 Silverside/outside 6,597 3 8,028 3 13,342 4 -51 -6,745 Other 26,457 11 22,745 10 35,641 12 -26 -9,185 Total 239,614 234,833 303,170 -21 -63,556
Source: DAWR
Australian beef exports to Canada – by major cutVolume – in tonnes swt % in tonnes swt
Manufacturing 12,306 66 14,489 70 20,110 74 -39 7,803Cube roll/rib eye roll 1,531 8 1,621 8 966 4 59 565Striploin 1,471 8 985 5 4,390 16 -67 2,920Other 3,239 17 3,511 17 1,873 7 73 1,366Total 18,547 20,607 27,339 -32 8,791
Source: DAWR Note: Import tariff on Australian beef is 0% within quota (35,000 tonnes swt) and 17.6% for over quota. Canada is a member of the Comprehensive and Progressive Agreement for Trans Pacific Partnership (CPTPP).
Australian beef exports to Mexico – by major cutVolume – in tonnes swt % in tonnes swt
Thin flank 955 97 366 99 433 98 120 522Other 33 3 4 1 10 2 223 23Total 988 370 444 123 545
Source: DAWR Note: Australia shares 200,000 tonnes swt quota with other non-NAFTA countries. Import tariff within quota is 0% (over quota is 16% for chilled and 20% for frozen beef). Mexico is a member of the Comprehensive and Progressive Agreement for Trans Pacific Partnership (CPTPP).

MLA MARKET SNAPSHOT BEEF AND SHEEPMEAT NORTH AMERICA August 2019 16
CONSUMERS
• Lamb remains a niche and unfamiliar protein to almost 40% of US consumers, driven by the lack of familiarity, taste concerns and limited knowledge on how to prepare it, however, US consumers are progressively increasing their willingness to try lamb, particularly the millennial generation.
• Lamb has been regarded as a seasonal food for specific holidays and often eaten out-of-home. The majority of consumers who eat lamb when dining out are more likely to try cooking lamb at home, if it is available locally.
• Without any real knowledge of lamb, Americans are much more likely to consider ‘naturalness’, safety and freshness ahead of ‘country of origin’ when purchasing lamb.
• Consumers who purchase chilled lamb are generally premium shoppers, spend more in store and prefer healthier, home-cooked items. Lamb chops and roasts are the most frequently purchased cuts (Source: Nielsen behaviour analysis; Voice of Consumer 2018).
• Lamb consumption patterns vary across the eight cities surveyed by MLA’s global consumer research, with San Francisco, Florida, New York City and Los Angeles having above average consumption.
FOODSERVICE • Lamb growth has been somewhat mixed across foodservice
operations but strong gains were made in fine dining, which in the long term could drive the foodservice industry toward greater lamb menu placement and, in turn, consumer adoption.
• The US foodservice industry itself, is experiencing flux, with a decline in the number of full service restaurants as well as upheaval in fast casual restaurants, which will present challenges as lamb is poised to grow.
• Driven by changing demographics and the shift in demand for more convenient and affordable lamb options such as lamb burgers, meatballs and kebabs, is becoming more common on US menus.
• It is estimated that 60% of total Australian lamb imports are consumed in the foodservice channel.
• The penetration of lamb on US restaurant menus has grown steadily over the last decade underpinned by growth in casual and quick service restaurants. (Source: Datassential menu monitor, 2019).
Quick service restaurants (QSR) are increasing appearance of lamb on menus
All
Fine dining
Casual
MidscaleQuick servicerestaurantFast casual
25%
58%
17%
8%
20%
4%
(+3%)
(+7%)
(+3%)
(-9 %)
(+18%)
(-24%)
(Bracket percentage) = 4 year % change 2017 vs. 2013Source: Dataessential, beef and lamb menu analysis, 2018
• Another interesting growth area is the non-commercial long-term care segment, which saw 14% penetration of lamb in the area in 2018; reflecting an older, more affluent demographic’s demand for natural, healthy and interesting protein options (Source: Datassential menu monitor, 2018).
Top five factors influencing lamb purchases and top five barriers to purchasing lamb
Important factors influencing lamb purchase – top 5
Reasons don’t buy lamb – top 5
Price Don’t know how to cook lamb
Colour of meat Too expensive
All natural It is not available where I shop
USDA grade or a rating from another independent grading system
Not familiar with lamb enough to buy
Natural ingredients I like the taste but other family members don’t
Source: Voice of consumer 2018
• Australia has started to close the gap and has increased consumer awareness and frequency of consumption compared to both American and New Zealand lamb.
Lamb popularity increasesInterest in international cuisines and upscaling traditional American fare, has been driving lamb menu placement recently. Ethnic cuisines are likely to be a key tool in driving lamb usage and those ethnic cuisines poised to grow over the next few years are heavier users of lamb – mostly Middle Eastern and North African.Lamb has also gained some ground with consumers through more familiar and approachable applications such as burgers and flatbreads, although the versatility of lamb is underleveraged currently in foodservice. Continuing to place lamb in comfortable and familiar applications could facilitate experimentation among consumers and make it a more relevant protein for a broader array of operators. (Source: Datassential, Menu Matters beef and lamb 2018).
United States – Sheepmeat
MLA MARKET SNAPSHOT BEEF AND SHEEPMEAT NORTH AMERICA August 2019 17
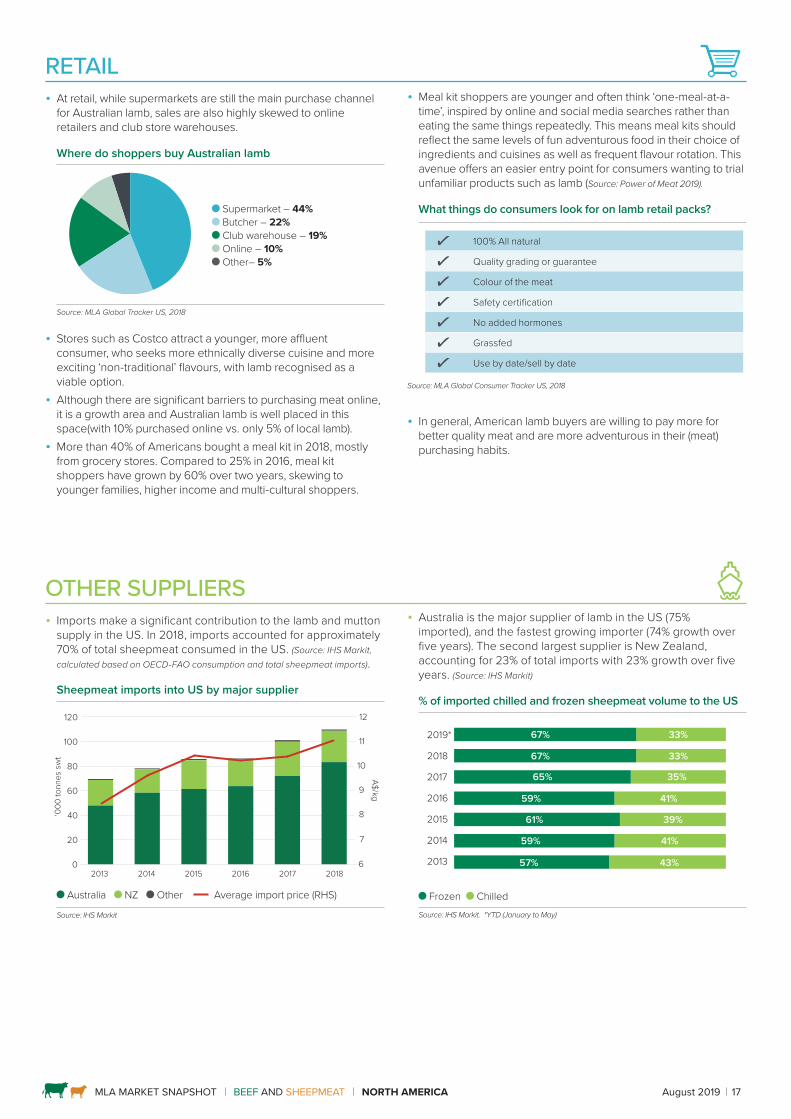
RETAIL • At retail, while supermarkets are still the main purchase channel
for Australian lamb, sales are also highly skewed to online retailers and club store warehouses.
Where do shoppers buy Australian lamb
Supermarket – 44% Butcher – 22% Club warehouse – 19% Online – 10% Other– 5%
Source: MLA Global Tracker US, 2018
• Stores such as Costco attract a younger, more affluent consumer, who seeks more ethnically diverse cuisine and more exciting ‘non-traditional’ flavours, with lamb recognised as a viable option.
• Although there are significant barriers to purchasing meat online, it is a growth area and Australian lamb is well placed in this space(with 10% purchased online vs. only 5% of local lamb).
• More than 40% of Americans bought a meal kit in 2018, mostly from grocery stores. Compared to 25% in 2016, meal kit shoppers have grown by 60% over two years, skewing to younger families, higher income and multi-cultural shoppers.
OTHER SUPPLIERS • Imports make a significant contribution to the lamb and mutton
supply in the US. In 2018, imports accounted for approximately 70% of total sheepmeat consumed in the US. (Source: IHS Markit, calculated based on OECD-FAO consumption and total sheepmeat imports).
Sheepmeat imports into US by major supplier
201820172016201520142013
‘000
tonn
es s
wt
0
20
40
60
80
100
120Other
New Zealand
Australia
6
7
8
9
10
11
12
A$/kg
Australia NZ Other Average import price (RHS)
Source: IHS Markit
• Meal kit shoppers are younger and often think ‘one-meal-at-a-time’, inspired by online and social media searches rather than eating the same things repeatedly. This means meal kits should reflect the same levels of fun adventurous food in their choice of ingredients and cuisines as well as frequent flavour rotation. This avenue offers an easier entry point for consumers wanting to trial unfamiliar products such as lamb (Source: Power of Meat 2019).
What things do consumers look for on lamb retail packs?
100% All natural
Quality grading or guarantee
Colour of the meat
Safety certification
No added hormones
Grassfed
Use by date/sell by date
Source: MLA Global Consumer Tracker US, 2018
• In general, American lamb buyers are willing to pay more for better quality meat and are more adventurous in their (meat) purchasing habits.
• Australia is the major supplier of lamb in the US (75% imported), and the fastest growing importer (74% growth over five years). The second largest supplier is New Zealand, accounting for 23% of total imports with 23% growth over five years. (Source: IHS Markit)
% of imported chilled and frozen sheepmeat volume to the US
2019*
2018
2017
2016
2015
2014
2013
59%
61% 39%
59% 41%
57% 43%
41%
65% 35%
67% 33%
67% 33%
Frozen Chilled Source: IHS Markit. *YTD (January to May)
MLA MARKET SNAPSHOT BEEF AND SHEEPMEAT NORTH AMERICA August 2019 18
© Meat & Livestock Australia, 2019. ABN 39 081 678 364. MLA makes no representations as to the accuracy of any information or advice contained in MLA’s Market snapshot and excludes all liability, whether in contract, tort (including negligence or breach of statutory duty) or otherwise as a result of reliance by any person on such information or advice. All use of MLA publications, reports and information is subject to MLA’s Market Report and Information Terms of Use. Please read our terms of use carefully and ensure you are familiar with its content.
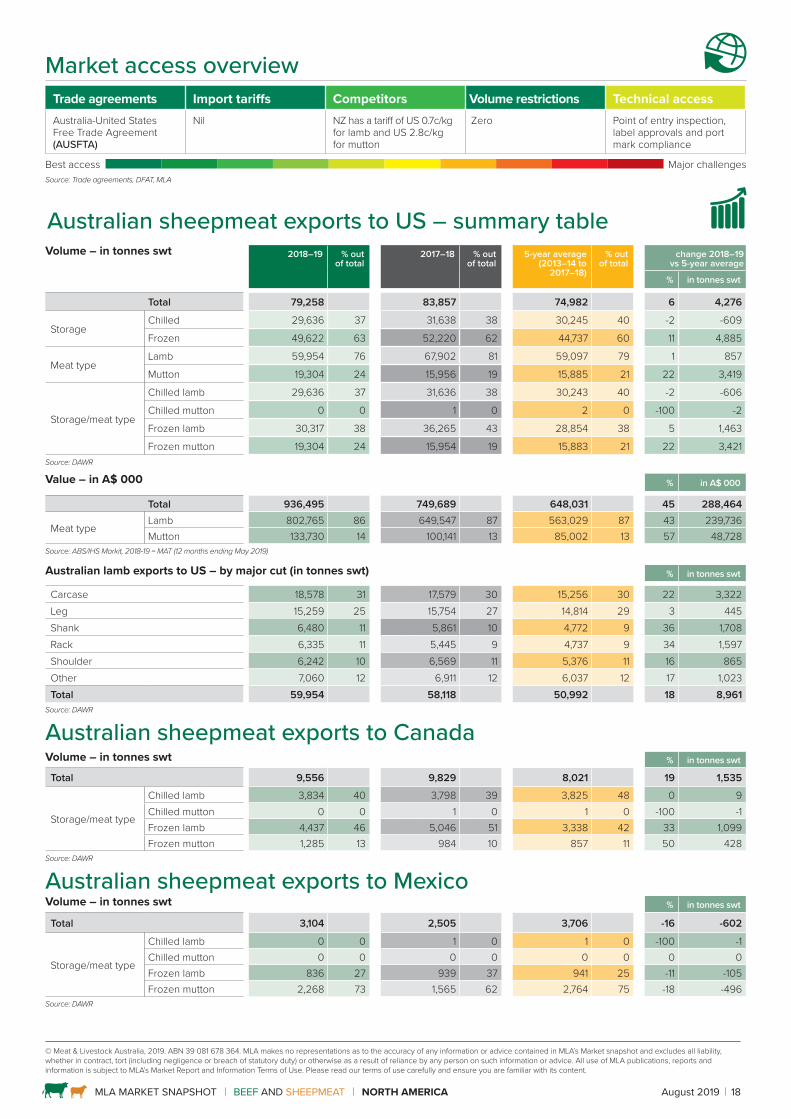
Market access overview Trade agreements Import tariffs Competitors Volume restrictions Technical accessAustralia-United States Free Trade Agreement (AUSFTA)
Nil NZ has a tariff of US 0.7c/kg for lamb and US 2.8c/kg for mutton
Zero Point of entry inspection, label approvals and port mark compliance
Best access Major challengesSource: Trade agreements, DFAT, MLA
Australian sheepmeat exports to US – summary table Volume – in tonnes swt
2018–19 % out of total
2017–18 % out of total
5-year average (2013–14 to
2017–18)
% out of total
change 2018–19 vs 5-year average
% in tonnes swt
Total 79,258 83,857 74,982 6 4,276
StorageChilled 29,636 37 31,638 38 30,245 40 -2 -609
Frozen 49,622 63 52,220 62 44,737 60 11 4,885
Meat typeLamb 59,954 76 67,902 81 59,097 79 1 857
Mutton 19,304 24 15,956 19 15,885 21 22 3,419
Storage/meat type
Chilled lamb 29,636 37 31,636 38 30,243 40 -2 -606
Chilled mutton 0 0 1 0 2 0 -100 -2
Frozen lamb 30,317 38 36,265 43 28,854 38 5 1,463
Frozen mutton 19,304 24 15,954 19 15,883 21 22 3,421Source: DAWR
Value – in A$ 000 % in A$ 000
Total 936,495 749,689 648,031 45 288,464
Meat typeLamb 802,765 86 649,547 87 563,029 87 43 239,736 Mutton 133,730 14 100,141 13 85,002 13 57 48,728
Source: ABS/IHS Markit, 2018-19 = MAT (12 months ending May 2019)
Australian lamb exports to US – by major cut (in tonnes swt) % in tonnes swt
Carcase 18,578 31 17,579 30 15,256 30 22 3,322 Leg 15,259 25 15,754 27 14,814 29 3 445 Shank 6,480 11 5,861 10 4,772 9 36 1,708 Rack 6,335 11 5,445 9 4,737 9 34 1,597Shoulder 6,242 10 6,569 11 5,376 11 16 865Other 7,060 12 6,911 12 6,037 12 17 1,023 Total 59,954 58,118 50,992 18 8,961
Source: DAWR
Australian sheepmeat exports to CanadaVolume – in tonnes swt % in tonnes swt
Total 9,556 9,829 8,021 19 1,535
Storage/meat type
Chilled lamb 3,834 40 3,798 39 3,825 48 0 9 Chilled mutton 0 0 1 0 1 0 -100 -1 Frozen lamb 4,437 46 5,046 51 3,338 42 33 1,099 Frozen mutton 1,285 13 984 10 857 11 50 428
Source: DAWR
Australian sheepmeat exports to MexicoVolume – in tonnes swt % in tonnes swt
Total 3,104 2,505 3,706 -16 -602
Storage/meat type
Chilled lamb 0 0 1 0 1 0 -100 -1 Chilled mutton 0 0 0 0 0 0 0 0 Frozen lamb 836 27 939 37 941 25 -11 -105 Frozen mutton 2,268 73 1,565 62 2,764 75 -18 -496
Source: DAWR
MARKET SNAPSHOT l BEEF & SHEEPMEAT
MLA MARKET SNAPSHOT BEEF AND SHEEPMEAT KOREA August 2019 19
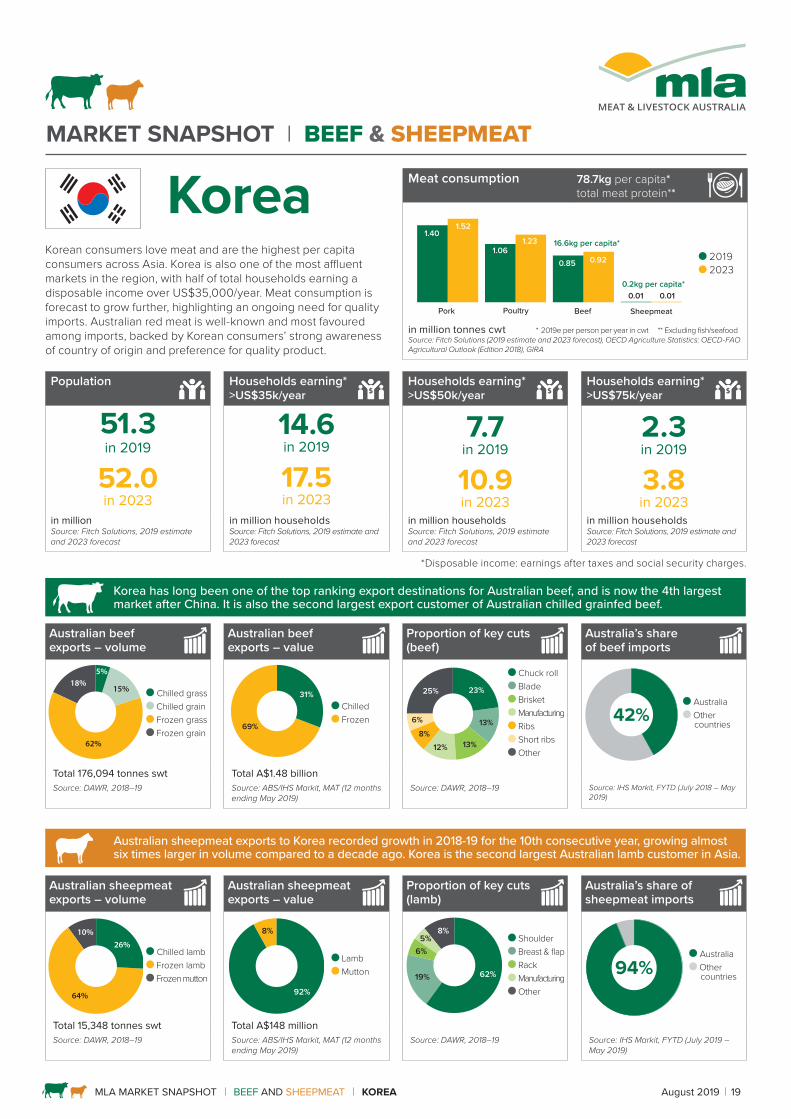
Korean consumers love meat and are the highest per capita consumers across Asia. Korea is also one of the most affluent markets in the region, with half of total households earning a disposable income over US$35,000/year. Meat consumption is forecast to grow further, highlighting an ongoing need for quality imports. Australian red meat is well-known and most favoured among imports, backed by Korean consumers’ strong awareness of country of origin and preference for quality product.
Population Households earning* >US$35k/year
Households earning* >US$50k/year
Households earning* >US$75k/year
51.3in 2019
52.0in 2023
14.6in 2019
17.5in 2023
7.7in 2019
10.9in 2023
2.3in 2019
3.8in 2023
in million Source: Fitch Solutions, 2019 estimate and 2023 forecast
in million households Source: Fitch Solutions, 2019 estimate and 2023 forecast
in million households Source: Fitch Solutions, 2019 estimate and 2023 forecast
in million households Source: Fitch Solutions, 2019 estimate and 2023 forecast
*Disposable income: earnings after taxes and social security charges.
Korea has long been one of the top ranking export destinations for Australian beef, and is now the 4th largest market after China. It is also the second largest export customer of Australian chilled grainfed beef.
Australian sheepmeat exports to Korea recorded growth in 2018-19 for the 10th consecutive year, growing almost six times larger in volume compared to a decade ago. Korea is the second largest Australian lamb customer in Asia.
Korea Meat consumption 78.7kg per capita*total meat protein**
Pork
1.401.52
1.061.23
0.85 0.92
0.01 0.01
Poultry Beef Sheepmeat
16.6kg per capita*
0.2kg per capita*
2019 2023
in million tonnes cwt * 2019e per person per year in cwt ** Excluding fish/seafood Source: Fitch Solutions (2019 estimate and 2023 forecast), OECD Agriculture Statistics: OECD-FAO Agricultural Outlook (Edition 2018), GIRA
Australian beef exports – volume
Australian beef exports – value
Proportion of key cuts (beef)
Australia’s share of beef imports
5%
15%
62%
18% Chilled grass Chilled grain Frozen grass Frozen grain
31%
69%
Chilled Frozen
23%
8%
25%
12% 13%
6% 13%
Chuck roll Blade Brisket Manufacturing Ribs Short ribs Other
42% Australia Other
countries
Total 176,094 tonnes swt Total A$1.48 billionSource: DAWR, 2018–19 Source: ABS/IHS Markit, MAT (12 months
ending May 2019)Source: DAWR, 2018–19 Source: IHS Markit, FYTD (July 2018 – May
2019)
Australian sheepmeat exports – volume
Australian sheepmeat exports – value
Proportion of key cuts (lamb)
Australia’s share of sheepmeat imports
26%
64%
10%
Chilled lamb Frozen lamb Frozen mutton
92%
8%
Lamb Mutton 62%
6%
8%
19%
5% Shoulder Breast & flap Rack Manufacturing Other
94% Australia Other
countries
Total 15,348 tonnes swt Total A$148 millionSource: DAWR, 2018–19 Source: ABS/IHS Markit, MAT (12 months
ending May 2019)Source: DAWR, 2018–19 Source: IHS Markit, FYTD (July 2019 –
May 2019)
MLA MARKET SNAPSHOT BEEF AND SHEEPMEAT KOREA August 2019 20
CONSUMERS
• Among imported beef, Australian beef is the most favoured by Korean consumers (Source: MLA Global Consumer Tracker Korea, 2018), while highly marbled domestic Hanwoo is generally regarded as the most superior. Beef in general is considered a premium protein, and the market’s per capita beef consumption is the highest in Asia (Source: Fitch Solutions)*.
• Pork is the most consumed meat in Korea, but chicken consumption is forecast to grow fastest, backed by its affordable price and versatility for pre-prepared meals.
• Country of origin is very important to Korean beef buyers, as the country relies on imports for about 64% of its beef requirements (Source: Fitch Solutions).* 2019 data and 2023 forecast, total of beef, excludes Australia, New Zealand (NZ) and Hong Kong.
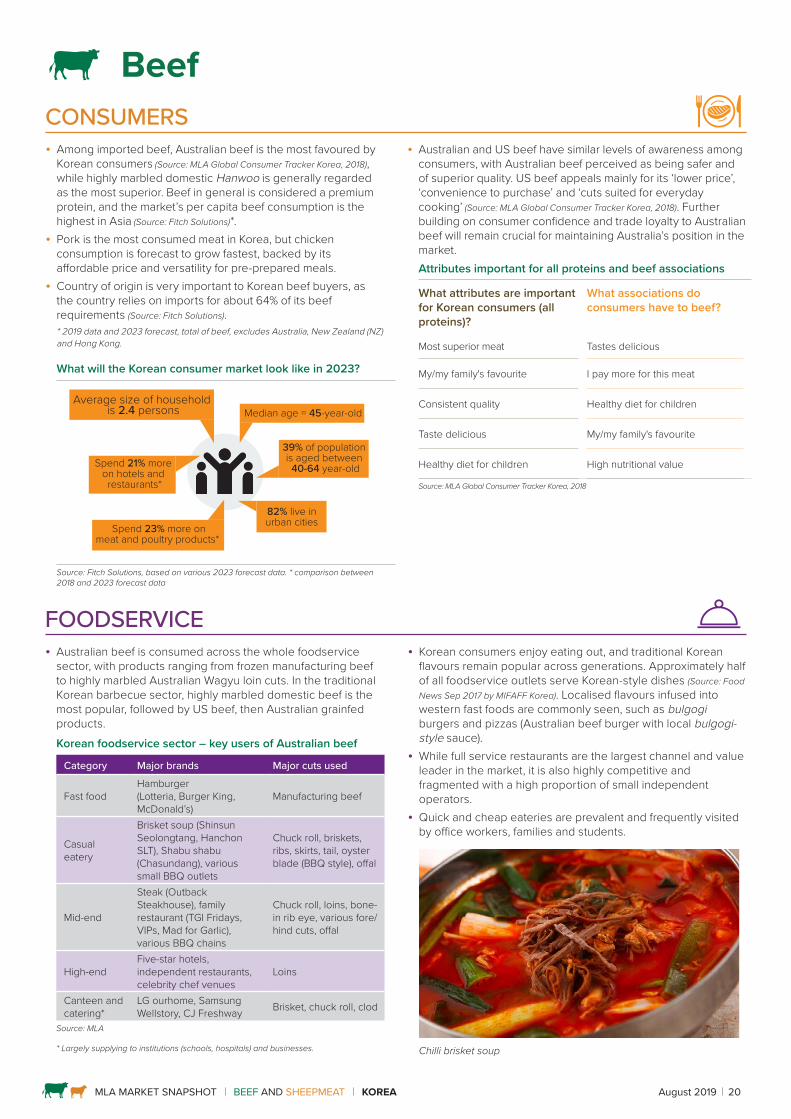
What will the Korean consumer market look like in 2023?
Average size of household is 2.4 persons
Spend 21% more on hotels and restaurants*
Spend 23% more onmeat and poultry products*
39% of population is aged between
40-64 year-old
82% live inurban cities
Median age = 45-year-old
Source: Fitch Solutions, based on various 2023 forecast data. * comparison between 2018 and 2023 forecast data
FOODSERVICE • Australian beef is consumed across the whole foodservice
sector, with products ranging from frozen manufacturing beef to highly marbled Australian Wagyu loin cuts. In the traditional Korean barbecue sector, highly marbled domestic beef is the most popular, followed by US beef, then Australian grainfed products.Korean foodservice sector – key users of Australian beef
Category Major brands Major cuts used
Fast foodHamburger (Lotteria, Burger King, McDonald’s)
Manufacturing beef
Casual eatery
Brisket soup (Shinsun Seolongtang, Hanchon SLT), Shabu shabu (Chasundang), various small BBQ outlets
Chuck roll, briskets, ribs, skirts, tail, oyster blade (BBQ style), offal
Mid-end
Steak (Outback Steakhouse), family restaurant (TGI Fridays, VIPs, Mad for Garlic), various BBQ chains
Chuck roll, loins, bone-in rib eye, various fore/hind cuts, offal
High-endFive-star hotels, independent restaurants, celebrity chef venues
Loins
Canteen and catering*
LG ourhome, Samsung Wellstory, CJ Freshway Brisket, chuck roll, clod
Source: MLA
* Largely supplying to institutions (schools, hospitals) and businesses.
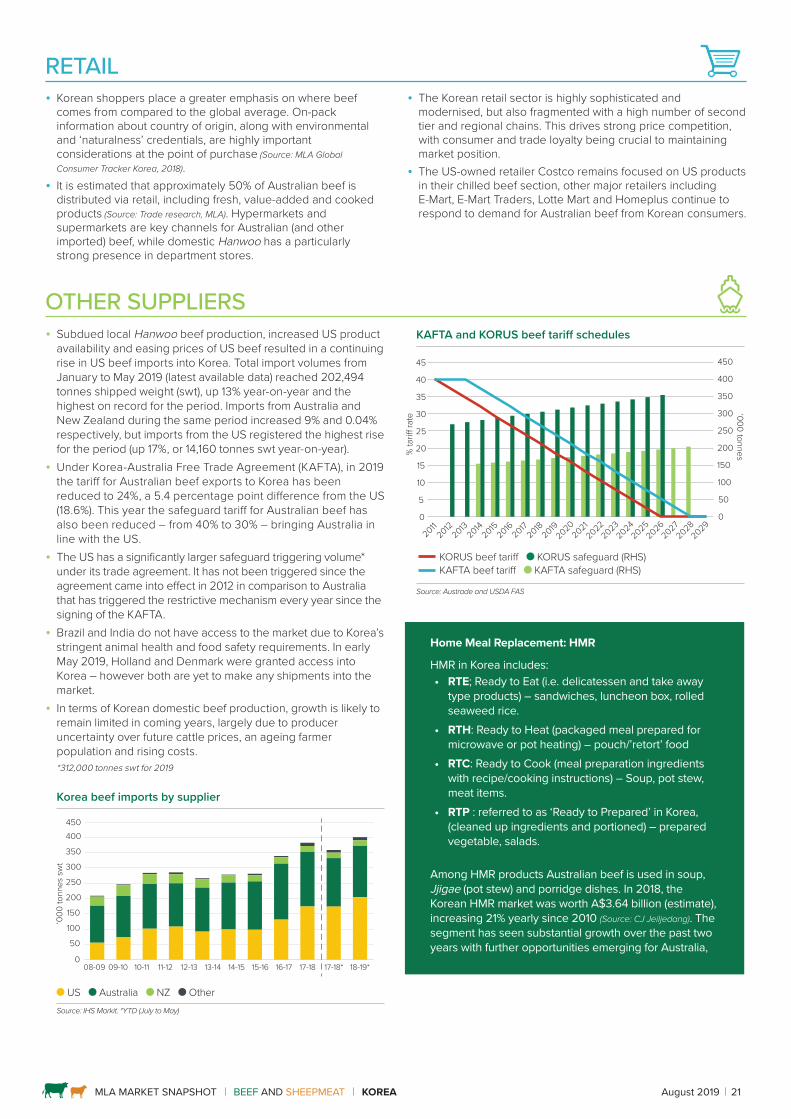
• Korean consumers enjoy eating out, and traditional Korean flavours remain popular across generations. Approximately half of all foodservice outlets serve Korean-style dishes (Source: Food News Sep 2017 by MIFAFF Korea). Localised flavours infused into western fast foods are commonly seen, such as bulgogi burgers and pizzas (Australian beef burger with local bulgogi-style sauce).
• While full service restaurants are the largest channel and value leader in the market, it is also highly competitive and fragmented with a high proportion of small independent operators.
• Quick and cheap eateries are prevalent and frequently visited by office workers, families and students.
Chilli brisket soup
Beef
• Australian and US beef have similar levels of awareness among consumers, with Australian beef perceived as being safer and of superior quality. US beef appeals mainly for its ‘lower price’, ‘convenience to purchase’ and ‘cuts suited for everyday cooking’ (Source: MLA Global Consumer Tracker Korea, 2018). Further building on consumer confidence and trade loyalty to Australian beef will remain crucial for maintaining Australia’s position in the market.Attributes important for all proteins and beef associations
What attributes are important for Korean consumers (all proteins)?
What associations do consumers have to beef?
Most superior meat Tastes delicious
My/my family's favourite I pay more for this meat
Consistent quality Healthy diet for children
Taste delicious My/my family's favourite
Healthy diet for children High nutritional value
Source: MLA Global Consumer Tracker Korea, 2018
MLA MARKET SNAPSHOT BEEF AND SHEEPMEAT KOREA August 2019 21
RETAIL • Korean shoppers place a greater emphasis on where beef
comes from compared to the global average. On-pack information about country of origin, along with environmental and ‘naturalness’ credentials, are highly important considerations at the point of purchase (Source: MLA Global Consumer Tracker Korea, 2018).
• It is estimated that approximately 50% of Australian beef is distributed via retail, including fresh, value-added and cooked products (Source: Trade research, MLA). Hypermarkets and supermarkets are key channels for Australian (and other imported) beef, while domestic Hanwoo has a particularly strong presence in department stores.
• The Korean retail sector is highly sophisticated and modernised, but also fragmented with a high number of second tier and regional chains. This drives strong price competition, with consumer and trade loyalty being crucial to maintaining market position.
• The US-owned retailer Costco remains focused on US products in their chilled beef section, other major retailers including E-Mart, E-Mart Traders, Lotte Mart and Homeplus continue to respond to demand for Australian beef from Korean consumers.
OTHER SUPPLIERS • Subdued local Hanwoo beef production, increased US product
availability and easing prices of US beef resulted in a continuing rise in US beef imports into Korea. Total import volumes from January to May 2019 (latest available data) reached 202,494 tonnes shipped weight (swt), up 13% year-on-year and the highest on record for the period. Imports from Australia and New Zealand during the same period increased 9% and 0.04% respectively, but imports from the US registered the highest rise for the period (up 17%, or 14,160 tonnes swt year-on-year).
• Under Korea-Australia Free Trade Agreement (KAFTA), in 2019 the tariff for Australian beef exports to Korea has been reduced to 24%, a 5.4 percentage point difference from the US (18.6%). This year the safeguard tariff for Australian beef has also been reduced – from 40% to 30% – bringing Australia in line with the US.
• The US has a significantly larger safeguard triggering volume* under its trade agreement. It has not been triggered since the agreement came into effect in 2012 in comparison to Australia that has triggered the restrictive mechanism every year since the signing of the KAFTA.
• Brazil and India do not have access to the market due to Korea’s stringent animal health and food safety requirements. In early May 2019, Holland and Denmark were granted access into Korea – however both are yet to make any shipments into the market.
• In terms of Korean domestic beef production, growth is likely to remain limited in coming years, largely due to producer uncertainty over future cattle prices, an ageing farmer population and rising costs.*312,000 tonnes swt for 2019
Korea beef imports by supplier
‘000
tonn
es s
wt
0
50
100
150
200
250
300
350
400450
09-1008-09 10-11 11-12 12-13 13-14 14-15 15-16 16-17 17-18 17-18* 18-19*
US Australia NZ OtherSource: IHS Markit. *YTD (July to May)
KAFTA and KORUS beef tariff schedules
0
50
100
150
250
300
350
400
0
5
10
15
20
25
30
35
40
45
‘000 tonnes% ta
ri� ra
te
20172018
20192020
20212022
20232024
20252026
20272028
20292011
20122013
20142015
2016
450
200
KORUS beef tariff KORUS safeguard (RHS) KAFTA beef tariff KAFTA safeguard (RHS)
Source: Austrade and USDA FAS
Home Meal Replacement: HMR
HMR in Korea includes:• RTE; Ready to Eat (i.e. delicatessen and take away
type products) – sandwiches, luncheon box, rolled seaweed rice.
• RTH: Ready to Heat (packaged meal prepared for microwave or pot heating) – pouch/’retort’ food
• RTC: Ready to Cook (meal preparation ingredients with recipe/cooking instructions) – Soup, pot stew, meat items.
• RTP : referred to as ‘Ready to Prepared’ in Korea, (cleaned up ingredients and portioned) – prepared vegetable, salads.
Among HMR products Australian beef is used in soup, Jjigae (pot stew) and porridge dishes. In 2018, the Korean HMR market was worth A$3.64 billion (estimate), increasing 21% yearly since 2010 (Source: CJ Jeiljedang). The segment has seen substantial growth over the past two years with further opportunities emerging for Australia,
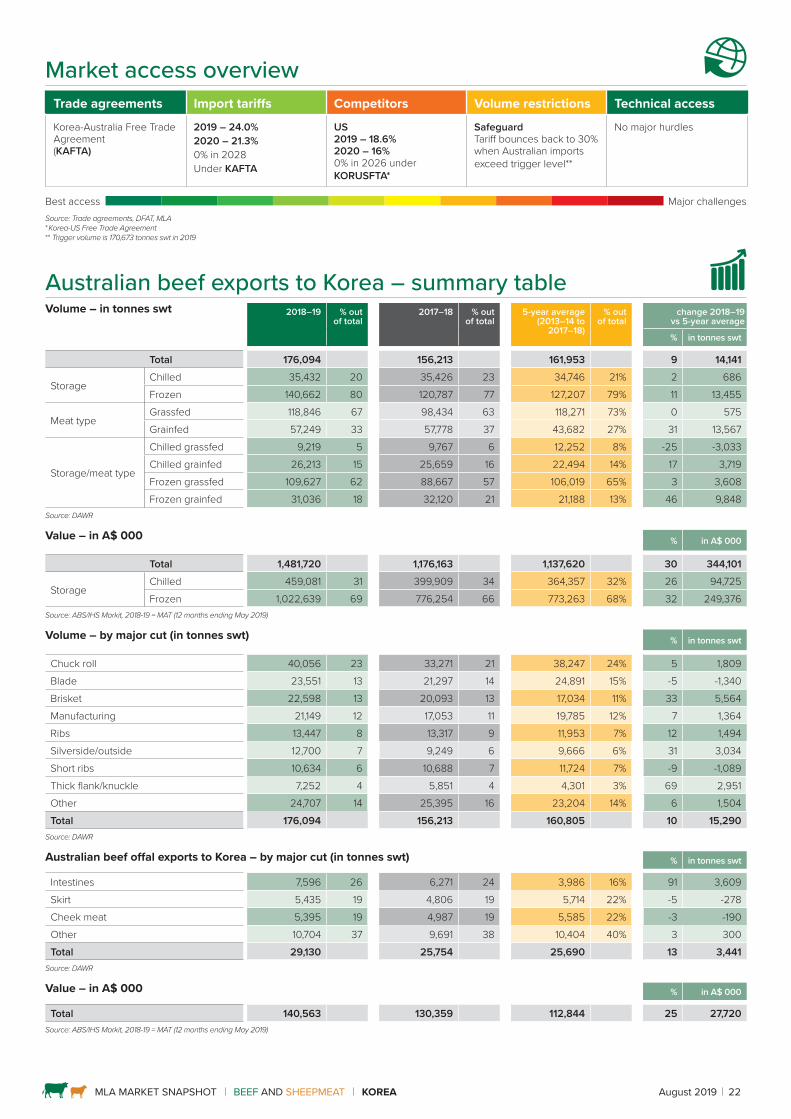
MLA MARKET SNAPSHOT BEEF AND SHEEPMEAT KOREA August 2019 22
Market access overview Trade agreements Import tariffs Competitors Volume restrictions Technical access
Korea-Australia Free Trade Agreement (KAFTA)
2019 – 24.0%2020 – 21.3%0% in 2028Under KAFTA
US2019 – 18.6%2020 – 16%0% in 2026 under KORUSFTA*
SafeguardTariff bounces back to 30% when Australian imports exceed trigger level**
No major hurdles
Best access Major challengesSource: Trade agreements, DFAT, MLA * Korea-US Free Trade Agreement** Trigger volume is 170,673 tonnes swt in 2019
Australian beef exports to Korea – summary table Volume – in tonnes swt 2018–19 % out
of total2017–18 % out
of total5-year average
(2013–14 to 2017–18)
% out of total
change 2018–19 vs 5-year average
% in tonnes swt
Total 176,094 156,213 161,953 9 14,141
StorageChilled 35,432 20 35,426 23 34,746 21% 2 686Frozen 140,662 80 120,787 77 127,207 79% 11 13,455
Meat typeGrassfed 118,846 67 98,434 63 118,271 73% 0 575Grainfed 57,249 33 57,778 37 43,682 27% 31 13,567
Storage/meat type
Chilled grassfed 9,219 5 9,767 6 12,252 8% -25 -3,033Chilled grainfed 26,213 15 25,659 16 22,494 14% 17 3,719Frozen grassfed 109,627 62 88,667 57 106,019 65% 3 3,608Frozen grainfed 31,036 18 32,120 21 21,188 13% 46 9,848
Source: DAWR
Value – in A$ 000 % in A$ 000
Total 1,481,720 1,176,163 1,137,620 30 344,101
StorageChilled 459,081 31 399,909 34 364,357 32% 26 94,725 Frozen 1,022,639 69 776,254 66 773,263 68% 32 249,376
Source: ABS/IHS Markit, 2018-19 = MAT (12 months ending May 2019)
Volume – by major cut (in tonnes swt) % in tonnes swt
Chuck roll 40,056 23 33,271 21 38,247 24% 5 1,809 Blade 23,551 13 21,297 14 24,891 15% -5 -1,340 Brisket 22,598 13 20,093 13 17,034 11% 33 5,564 Manufacturing 21,149 12 17,053 11 19,785 12% 7 1,364 Ribs 13,447 8 13,317 9 11,953 7% 12 1,494 Silverside/outside 12,700 7 9,249 6 9,666 6% 31 3,034 Short ribs 10,634 6 10,688 7 11,724 7% -9 -1,089 Thick flank/knuckle 7,252 4 5,851 4 4,301 3% 69 2,951 Other 24,707 14 25,395 16 23,204 14% 6 1,504 Total 176,094 156,213 160,805 10 15,290
Source: DAWR
Australian beef offal exports to Korea – by major cut (in tonnes swt) % in tonnes swt
Intestines 7,596 26 6,271 24 3,986 16% 91 3,609 Skirt 5,435 19 4,806 19 5,714 22% -5 -278 Cheek meat 5,395 19 4,987 19 5,585 22% -3 -190 Other 10,704 37 9,691 38 10,404 40% 3 300 Total 29,130 25,754 25,690 13 3,441
Source: DAWR
Value – in A$ 000 % in A$ 000
Total 140,563 130,359 112,844 25 27,720 Source: ABS/IHS Markit, 2018-19 = MAT (12 months ending May 2019)
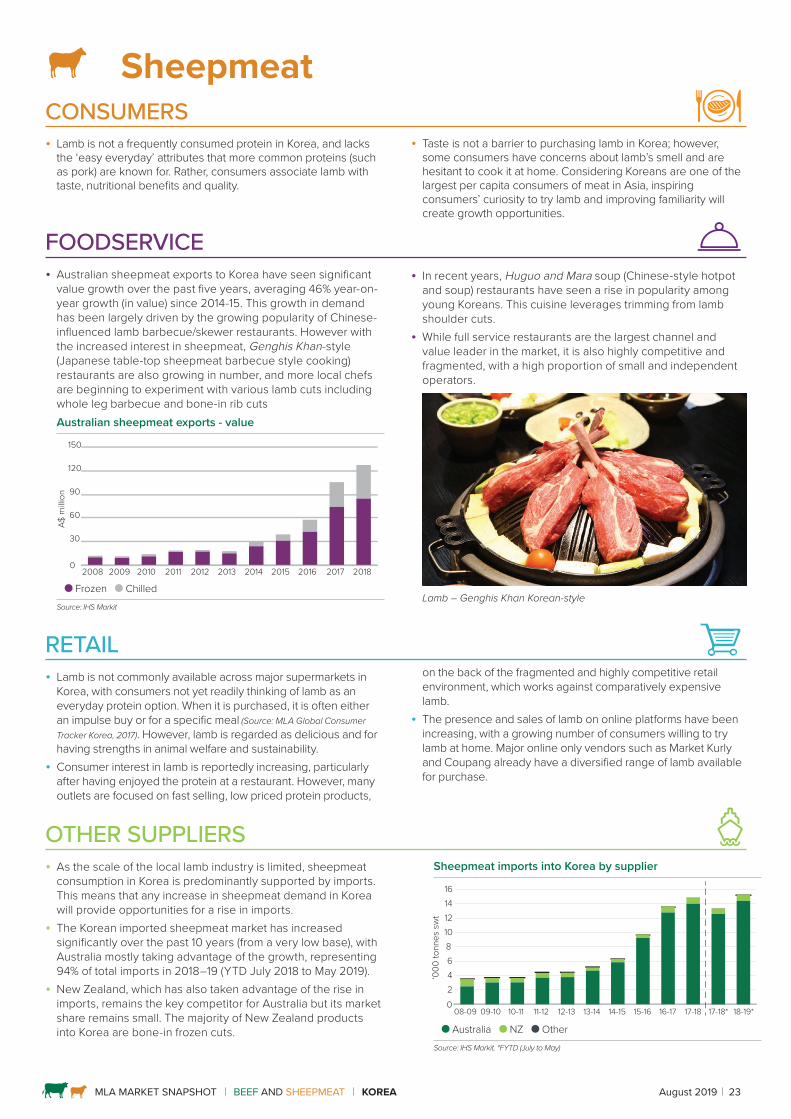
MLA MARKET SNAPSHOT BEEF AND SHEEPMEAT KOREA August 2019 23
SheepmeatCONSUMERS
• Lamb is not a frequently consumed protein in Korea, and lacks the ‘easy everyday’ attributes that more common proteins (such as pork) are known for. Rather, consumers associate lamb with taste, nutritional benefits and quality.
FOODSERVICE • Australian sheepmeat exports to Korea have seen significant
value growth over the past five years, averaging 46% year-on-year growth (in value) since 2014-15. This growth in demand has been largely driven by the growing popularity of Chinese-influenced lamb barbecue/skewer restaurants. However with the increased interest in sheepmeat, Genghis Khan-style (Japanese table-top sheepmeat barbecue style cooking) restaurants are also growing in number, and more local chefs are beginning to experiment with various lamb cuts including whole leg barbecue and bone-in rib cuts Australian sheepmeat exports - value
0
30
60
90
120
150
201820172016 2015 2014 2013 2012 2011 2010 2009 2008
A$ m
illion
Frozen ChilledSource: IHS Markit
• Taste is not a barrier to purchasing lamb in Korea; however, some consumers have concerns about lamb’s smell and are hesitant to cook it at home. Considering Koreans are one of the largest per capita consumers of meat in Asia, inspiring consumers’ curiosity to try lamb and improving familiarity will create growth opportunities.
RETAIL • Lamb is not commonly available across major supermarkets in
Korea, with consumers not yet readily thinking of lamb as an everyday protein option. When it is purchased, it is often either an impulse buy or for a specific meal (Source: MLA Global Consumer Tracker Korea, 2017). However, lamb is regarded as delicious and for having strengths in animal welfare and sustainability.
• Consumer interest in lamb is reportedly increasing, particularly after having enjoyed the protein at a restaurant. However, many outlets are focused on fast selling, low priced protein products,
OTHER SUPPLIERS • As the scale of the local lamb industry is limited, sheepmeat
consumption in Korea is predominantly supported by imports. This means that any increase in sheepmeat demand in Korea will provide opportunities for a rise in imports.
• The Korean imported sheepmeat market has increased significantly over the past 10 years (from a very low base), with Australia mostly taking advantage of the growth, representing 94% of total imports in 2018–19 (YTD July 2018 to May 2019).
• New Zealand, which has also taken advantage of the rise in imports, remains the key competitor for Australia but its market share remains small. The majority of New Zealand products into Korea are bone-in frozen cuts.
on the back of the fragmented and highly competitive retail environment, which works against comparatively expensive lamb.
• The presence and sales of lamb on online platforms have been increasing, with a growing number of consumers willing to try lamb at home. Major online only vendors such as Market Kurly and Coupang already have a diversified range of lamb available for purchase.
Sheepmeat imports into Korea by supplier
0246810121416
other
New Zealand
Australia
‘000
tonn
es s
wt
09-1008-09 10-11 11-12 12-13 13-14 14-15 15-16 16-17 17-18 17-18* 18-19*
Australia NZ OtherSource: IHS Markit. *FYTD (July to May)
• In recent years, Huguo and Mara soup (Chinese-style hotpot and soup) restaurants have seen a rise in popularity among young Koreans. This cuisine leverages trimming from lamb shoulder cuts.
• While full service restaurants are the largest channel and value leader in the market, it is also highly competitive and fragmented, with a high proportion of small and independent operators.
Lamb – Genghis Khan Korean-style
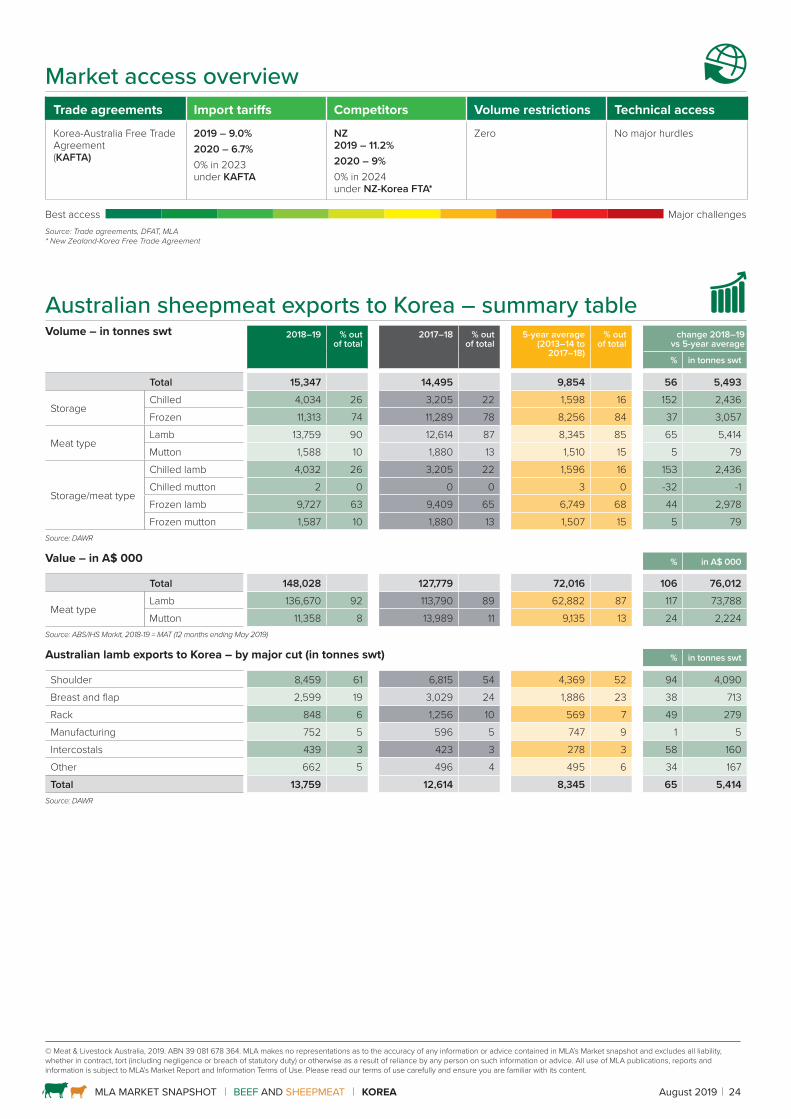
MLA MARKET SNAPSHOT BEEF AND SHEEPMEAT KOREA August 2019 24
Market access overview Trade agreements Import tariffs Competitors Volume restrictions Technical access
Korea-Australia Free Trade Agreement (KAFTA)
2019 – 9.0%2020 – 6.7% 0% in 2023 under KAFTA
NZ2019 – 11.2%2020 – 9%0% in 2024 under NZ-Korea FTA*
Zero No major hurdles
Best access Major challengesSource: Trade agreements, DFAT, MLA * New Zealand-Korea Free Trade Agreement
Australian sheepmeat exports to Korea – summary table Volume – in tonnes swt 2018–19 % out
of total2017–18 % out
of total5-year average
(2013–14 to 2017–18)
% out of total
change 2018–19 vs 5-year average
% in tonnes swt
Total 15,347 14,495 9,854 56 5,493
StorageChilled 4,034 26 3,205 22 1,598 16 152 2,436 Frozen 11,313 74 11,289 78 8,256 84 37 3,057
Meat typeLamb 13,759 90 12,614 87 8,345 85 65 5,414 Mutton 1,588 10 1,880 13 1,510 15 5 79
Storage/meat type
Chilled lamb 4,032 26 3,205 22 1,596 16 153 2,436 Chilled mutton 2 0 0 0 3 0 -32 -1 Frozen lamb 9,727 63 9,409 65 6,749 68 44 2,978 Frozen mutton 1,587 10 1,880 13 1,507 15 5 79
Source: DAWR
Value – in A$ 000 % in A$ 000
Total 148,028 127,779 72,016 106 76,012
Meat typeLamb 136,670 92 113,790 89 62,882 87 117 73,788 Mutton 11,358 8 13,989 11 9,135 13 24 2,224
Source: ABS/IHS Markit, 2018-19 = MAT (12 months ending May 2019)
Australian lamb exports to Korea – by major cut (in tonnes swt) % in tonnes swt
Shoulder 8,459 61 6,815 54 4,369 52 94 4,090 Breast and flap 2,599 19 3,029 24 1,886 23 38 713 Rack 848 6 1,256 10 569 7 49 279 Manufacturing 752 5 596 5 747 9 1 5 Intercostals 439 3 423 3 278 3 58 160 Other 662 5 496 4 495 6 34 167 Total 13,759 12,614 8,345 65 5,414
Source: DAWR
© Meat & Livestock Australia, 2019. ABN 39 081 678 364. MLA makes no representations as to the accuracy of any information or advice contained in MLA’s Market snapshot and excludes all liability, whether in contract, tort (including negligence or breach of statutory duty) or otherwise as a result of reliance by any person on such information or advice. All use of MLA publications, reports and information is subject to MLA’s Market Report and Information Terms of Use. Please read our terms of use carefully and ensure you are familiar with its content.
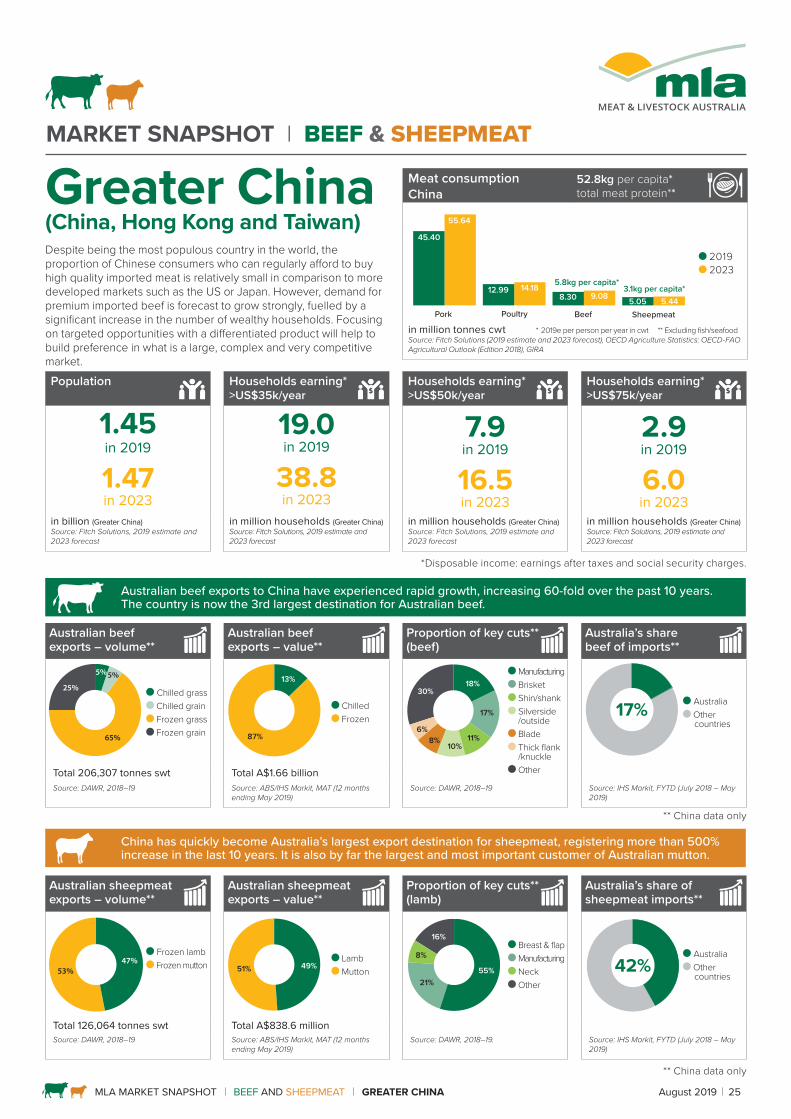
MARKET SNAPSHOT l BEEF & SHEEPMEAT
MLA MARKET SNAPSHOT BEEF AND SHEEPMEAT GREATER CHINA August 2019 25
Despite being the most populous country in the world, the proportion of Chinese consumers who can regularly afford to buy high quality imported meat is relatively small in comparison to more developed markets such as the US or Japan. However, demand for premium imported beef is forecast to grow strongly, fuelled by a significant increase in the number of wealthy households. Focusing on targeted opportunities with a differentiated product will help to build preference in what is a large, complex and very competitive market.Population Households earning*
>US$35k/year Households earning* >US$50k/year
Households earning* >US$75k/year
1.45 in 2019
1.47in 2023
19.0in 2019
38.8in 2023
7.9in 2019
16.5in 2023
2.9in 2019
6.0in 2023
in billion (Greater China) Source: Fitch Solutions, 2019 estimate and 2023 forecast
in million households (Greater China) Source: Fitch Solutions, 2019 estimate and 2023 forecast
in million households (Greater China)Source: Fitch Solutions, 2019 estimate and 2023 forecast
in million households (Greater China) Source: Fitch Solutions, 2019 estimate and 2023 forecast
*Disposable income: earnings after taxes and social security charges.
Australian beef exports to China have experienced rapid growth, increasing 60-fold over the past 10 years. The country is now the 3rd largest destination for Australian beef.
China has quickly become Australia’s largest export destination for sheepmeat, registering more than 500% increase in the last 10 years. It is also by far the largest and most important customer of Australian mutton.
Greater China (China, Hong Kong and Taiwan)
Meat consumptionChina
52.8kg per capita*total meat protein**
Pork
45.40
55.64
12.99 14.188.30 9.08 5.05 5.44
Poultry Beef Sheepmeat
5.8kg per capita*3.1kg per capita*
2019 2023
in million tonnes cwt * 2019e per person per year in cwt ** Excluding fish/seafood Source: Fitch Solutions (2019 estimate and 2023 forecast), OECD Agriculture Statistics: OECD-FAO Agricultural Outlook (Edition 2018), GIRA
Australian beef exports – volume**
Australian beef exports – value**
Proportion of key cuts** (beef)
Australia’s share beef of imports**
5%5%
65%
25% Chilled grass Chilled grain Frozen grass Frozen grain
13%
87%
Chilled Frozen
18%
10%
30%
11%
17%
8%6%
Manufacturing Brisket Shin/shank Silverside /outside Blade Thick flank /knuckle Other
17% Australia Other
countries
Total 206,307 tonnes swt Total A$1.66 billionSource: DAWR, 2018–19 Source: ABS/IHS Markit, MAT (12 months
ending May 2019)Source: DAWR, 2018–19 Source: IHS Markit, FYTD (July 2018 – May
2019)
Australian sheepmeat exports – volume**
Australian sheepmeat exports – value**
Proportion of key cuts** (lamb)
Australia’s share of sheepmeat imports**
47%53%
Frozen lamb Frozen mutton 49%51%
Lamb Mutton 55%
8%
16%
21%
Breast & flap Manufacturing Neck Other
42% Australia Other
countries
Total 126,064 tonnes swt Total A$838.6 millionSource: DAWR, 2018–19 Source: ABS/IHS Markit, MAT (12 months
ending May 2019)Source: DAWR, 2018–19. Source: IHS Markit, FYTD (July 2018 – May
2019)
** China data only
** China data only

MLA MARKET SNAPSHOT BEEF AND SHEEPMEAT GREATER CHINA August 2019 26
CONSUMERS
• In China, beef comprises a small proportion of dietary protein compared to pork, fish and chicken. However, with rising incomes and continued urbanisation, per capita beef consumption is forecast to increase from 6.7kg in 2017e to 8.1kg in 2027f (Source: GIRA).
• In addition to growth in beef consumption volume, the China market will also see growth in consumption value, as more consumers can afford to seek higher quality product.
China beef sales value growth even stronger than volume growth
% g
row
th y
ear-o
n-ye
ar
-10
-5
0
5
10
15
20
25
30 Beef & veal consumption, % y-o-y
Beef, sales, CNYmn, % growth y-o-y
2019f20
1320
14e20
15e20
16e20
18e20
17e20
20f
2021f
2022
f20
12
Beef, sales, CNYmn, % growth y-o-y Beef and veal consumption, % y-o-y
Source: Fitch Solutions
• Chinese consumers consider beef a superior protein that is a family favourite, with high nutritional value and great taste. Barriers to more frequent consumption, apart from price, are driven by perceptions that beef is considered more difficult to prepare, less fresh and less tender compared to other proteins.
FOODSERVICE • As a comparatively less familiar but premium protein, estimates
are that about half the beef in China is consumed outside the home (Source: GIRA), where consumers enjoy trying different cuisines.
• MLA estimates that around two-thirds of Australian beef goes into further processing items such as hot pot rolls, burgers, meatballs and sausages, much of it going into the foodservice sector.
Growing popularity of other Asian cuisines has increased beef consumption.
• Australian beef has a strong, established presence in China’s premium western-style foodservice sector, as well as some upscale hot pot restaurant chains, where differentiation based on quality and country of origin is important to diners.
• Developments in the foodservice sector such as the growth in popularity of steakhouse restaurants, Korean and Japanese cuisine and home delivery services are presenting more opportunities for Australian beef.
Foodservice consumption of beef by affluent* consumers
%
0
10203040506070
80
Fullservice
restaurant(Mid tier)
Hotel(4-Star
or above)
Leisure/entertain-
mentvenue
Fullservice
restaurant (Top tier)
Fullservice
restaurant (Lower tier)
Bar/nightclub
QSR/fast food
(Westernchains)
QSR/fast food(Localchains)
Cafe/Teahouse
Hotel(3-star
or below)
74%
48%
33% 31%24% 22% 21% 19%
12% 9%
Source: MLA China Attractive Cities Study, 2016. Consumed beef in the past month at. *Consumers living in households earning >RMB80,000 monthly. Top tier: >RMB300/head. Mid-Tier: RMB51-300/head. Lower Tier: <RMB50/head
China – Beef
• Beef and beef offal are used in a variety of slow-cooked, stir fry, soup, dumpling and hot pot dishes. In urban upper middle class households, there is increasing exposure to western-style steaks, sausages, pasta dishes and burgers, particularly via foodservice but also at home.
• There’s a growing number of affluent consumers demanding higher quality branded beef products that offer higher safety, more consistent quality, more nutritional value and better taste. Australia is well-positioned to meet this demand as a widely-recognised and well-regarded supplier of premium beef.
Affluent* Chinese consumer perceptions of Australian beef
Is the most superior beef
Industry is environmentally sustainable
The meat is usually tender
More nutritious
The animal is well-cared for
Guaranteed safe to eat
The fat is nicely marbled
Consistent quality standards
48%
48%
48%
46%
49%
49%
45%
42%
Source: MLA Global Consumer Tracker, 2018. % Agree. *Consumers living in households earning >RMB200,000 p.a. in Beijing, Shanghai, Guangzhou, Shenzhen, Chengdu and Chongqing cities
• Busy urban consumers are also increasingly seeking convenience without having to compromise on quality and freshness, leading to growth in premium convenience food solutions.
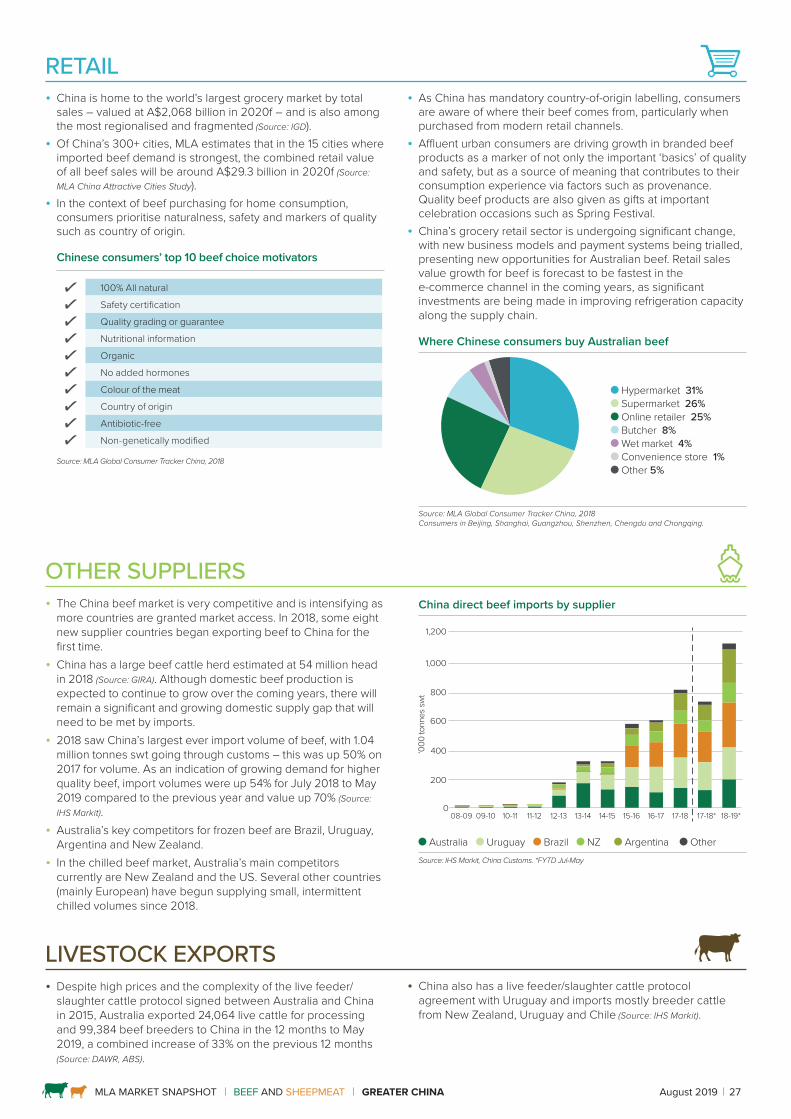
MLA MARKET SNAPSHOT BEEF AND SHEEPMEAT GREATER CHINA August 2019 27
RETAIL • China is home to the world’s largest grocery market by total
sales – valued at A$2,068 billion in 2020f – and is also among the most regionalised and fragmented (Source: IGD).
• Of China’s 300+ cities, MLA estimates that in the 15 cities where imported beef demand is strongest, the combined retail value of all beef sales will be around A$29.3 billion in 2020f (Source: MLA China Attractive Cities Study).
• In the context of beef purchasing for home consumption, consumers prioritise naturalness, safety and markers of quality such as country of origin.
Chinese consumers’ top 10 beef choice motivators
100% All natural
Safety certification
Quality grading or guarantee
Nutritional information
Organic
No added hormones
Colour of the meat
Country of origin
Antibiotic-free
Non-genetically modified
Source: MLA Global Consumer Tracker China, 2018
• As China has mandatory country-of-origin labelling, consumers are aware of where their beef comes from, particularly when purchased from modern retail channels.
• Affluent urban consumers are driving growth in branded beef products as a marker of not only the important ‘basics’ of quality and safety, but as a source of meaning that contributes to their consumption experience via factors such as provenance. Quality beef products are also given as gifts at important celebration occasions such as Spring Festival.
• China’s grocery retail sector is undergoing significant change, with new business models and payment systems being trialled, presenting new opportunities for Australian beef. Retail sales value growth for beef is forecast to be fastest in the e-commerce channel in the coming years, as significant investments are being made in improving refrigeration capacity along the supply chain.
Where Chinese consumers buy Australian beef
Hypermarket 31% Supermarket 26% Online retailer 25% Butcher 8% Wet market 4% Convenience store 1% Other 5%
Source: MLA Global Consumer Tracker China, 2018 Consumers in Beijing, Shanghai, Guangzhou, Shenzhen, Chengdu and Chongqing.
OTHER SUPPLIERS • The China beef market is very competitive and is intensifying as
more countries are granted market access. In 2018, some eight new supplier countries began exporting beef to China for the first time.
• China has a large beef cattle herd estimated at 54 million head in 2018 (Source: GIRA). Although domestic beef production is expected to continue to grow over the coming years, there will remain a significant and growing domestic supply gap that will need to be met by imports.
• 2018 saw China’s largest ever import volume of beef, with 1.04 million tonnes swt going through customs – this was up 50% on 2017 for volume. As an indication of growing demand for higher quality beef, import volumes were up 54% for July 2018 to May 2019 compared to the previous year and value up 70% (Source: IHS Markit).
• Australia’s key competitors for frozen beef are Brazil, Uruguay, Argentina and New Zealand.
• In the chilled beef market, Australia’s main competitors currently are New Zealand and the US. Several other countries (mainly European) have begun supplying small, intermittent chilled volumes since 2018.
China direct beef imports by supplier
‘000
tonn
es s
wt
0
200
400
600
800
1,000
1,200
Other
Argentina
New Zealand
Brazil
Uruguay
Australia
09-1008-09 10-11 11-12 12-13 13-14 14-15 15-16 16-17 17-18 17-18* 18-19*
Australia Uruguay Brazil NZ Argentina OtherSource: IHS Markit, China Customs. *FYTD Jul-May
LIVESTOCK EXPORTS • Despite high prices and the complexity of the live feeder/
slaughter cattle protocol signed between Australia and China in 2015, Australia exported 24,064 live cattle for processing and 99,384 beef breeders to China in the 12 months to May 2019, a combined increase of 33% on the previous 12 months (Source: DAWR, ABS).
• China also has a live feeder/slaughter cattle protocol agreement with Uruguay and imports mostly breeder cattle from New Zealand, Uruguay and Chile (Source: IHS Markit).
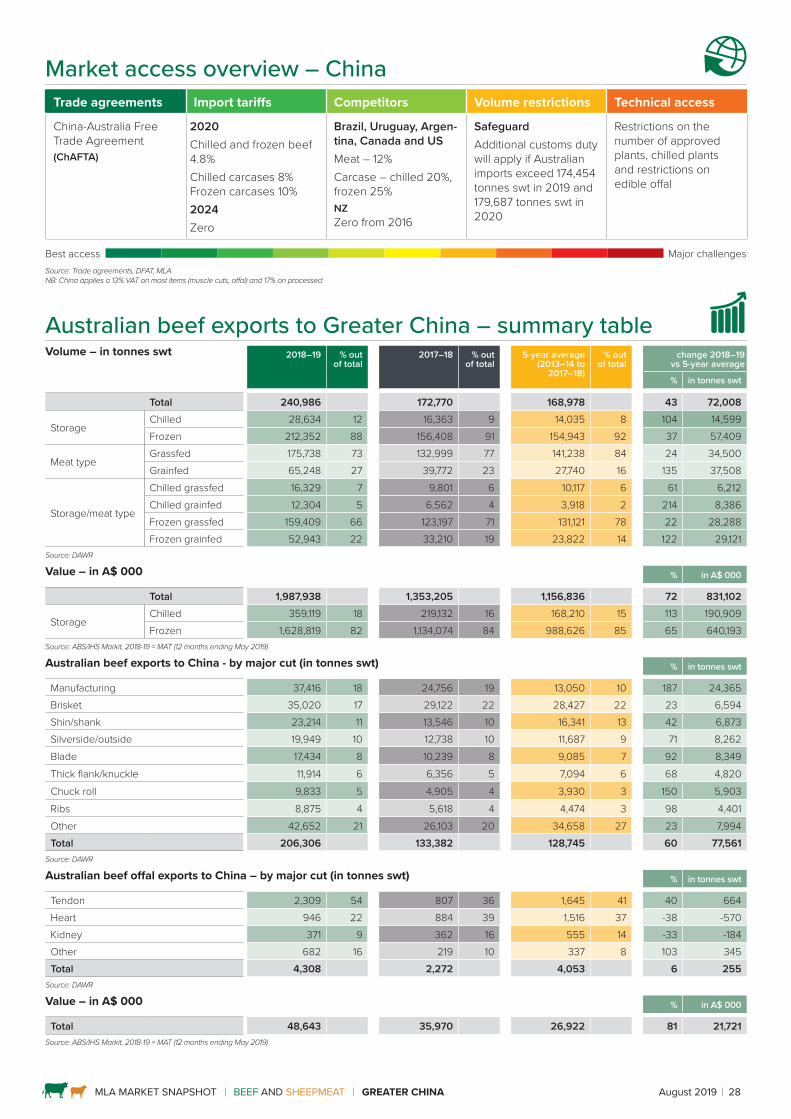
MLA MARKET SNAPSHOT BEEF AND SHEEPMEAT GREATER CHINA August 2019 28
Market access overview – China Trade agreements Import tariffs Competitors Volume restrictions Technical access
China-Australia Free Trade Agreement(ChAFTA)
2020Chilled and frozen beef 4.8% Chilled carcases 8% Frozen carcases 10%2024Zero
Brazil, Uruguay, Argen-tina, Canada and USMeat – 12%Carcase – chilled 20%, frozen 25%NZZero from 2016
SafeguardAdditional customs duty will apply if Australian imports exceed 174,454 tonnes swt in 2019 and 179,687 tonnes swt in 2020
Restrictions on the number of approved plants, chilled plants and restrictions on edible offal
Best access Major challengesSource: Trade agreements, DFAT, MLA NB: China applies a 13% VAT on most items (muscle cuts, offal) and 17% on processed
Australian beef exports to Greater China – summary table Volume – in tonnes swt 2018–19 % out
of total2017–18 % out
of total5-year average
(2013–14 to 2017–18)
% out of total
change 2018–19 vs 5-year average
% in tonnes swt
Total 240,986 172,770 168,978 43 72,008
StorageChilled 28,634 12 16,363 9 14,035 8 104 14,599 Frozen 212,352 88 156,408 91 154,943 92 37 57,409
Meat typeGrassfed 175,738 73 132,999 77 141,238 84 24 34,500 Grainfed 65,248 27 39,772 23 27,740 16 135 37,508
Storage/meat type
Chilled grassfed 16,329 7 9,801 6 10,117 6 61 6,212 Chilled grainfed 12,304 5 6,562 4 3,918 2 214 8,386 Frozen grassfed 159,409 66 123,197 71 131,121 78 22 28,288 Frozen grainfed 52,943 22 33,210 19 23,822 14 122 29,121
Source: DAWR
Value – in A$ 000 % in A$ 000
Total 1,987,938 1,353,205 1,156,836 72 831,102
StorageChilled 359,119 18 219,132 16 168,210 15 113 190,909 Frozen 1,628,819 82 1,134,074 84 988,626 85 65 640,193
Source: ABS/IHS Markit, 2018-19 = MAT (12 months ending May 2019)
Australian beef exports to China - by major cut (in tonnes swt) % in tonnes swt
Manufacturing 37,416 18 24,756 19 13,050 10 187 24,365 Brisket 35,020 17 29,122 22 28,427 22 23 6,594 Shin/shank 23,214 11 13,546 10 16,341 13 42 6,873 Silverside/outside 19,949 10 12,738 10 11,687 9 71 8,262 Blade 17,434 8 10,239 8 9,085 7 92 8,349 Thick flank/knuckle 11,914 6 6,356 5 7,094 6 68 4,820 Chuck roll 9,833 5 4,905 4 3,930 3 150 5,903 Ribs 8,875 4 5,618 4 4,474 3 98 4,401 Other 42,652 21 26,103 20 34,658 27 23 7,994 Total 206,306 133,382 128,745 60 77,561
Source: DAWR
Australian beef offal exports to China – by major cut (in tonnes swt) % in tonnes swt
Tendon 2,309 54 807 36 1,645 41 40 664Heart 946 22 884 39 1,516 37 -38 -570Kidney 371 9 362 16 555 14 -33 -184Other 682 16 219 10 337 8 103 345Total 4,308 2,272 4,053 6 255
Source: DAWR
Value – in A$ 000 % in A$ 000
Total 48,643 35,970 26,922 81 21,721Source: ABS/IHS Markit, 2018-19 = MAT (12 months ending May 2019)

MLA MARKET SNAPSHOT BEEF AND SHEEPMEAT GREATER CHINA August 2019 29
SUMMARY• Taiwan has been a significant and consistent market for
Australian beef over the past two decades.• Beef consumption has increased in recent years, driven by a
large young adult population with growing disposable incomesand more openness to western-style foods. Total beef importsreached an all-time high of 129,906 tonnes shipped weight (swt)for the year to May 2019.
• Taiwan consumers appreciate Australian beef, particularly for itssafety and quality consistency.
• MLA estimates that around 70% of Australian beef goes into themarket’s foodservice sector, with shin/shank and intercostalcuts used in slow wet-cooking for local style dishes andthin-sliced product used in hot pot and shabu-shabu stylerecipes.
Taiwan’s famous dish of beef soup noodles.
Taiwan – Beef
• The western-style fine dining segment has grown in recentyears, using premium beef cuts such as cube roll/rib eye roll,striploin and tenderloin. Some consumer segments havedeveloped a preference for highly marbled beef such as USprime, Australian Wagyu and Japanese Wagyu, while othersseek quality, leaner grassfed beef.
• As a wealthy and urbanised population, Taiwan’s retail sector isquite mature by global standards, with Australian beef boughtmostly from hypermarkets and supermarkets.
• Australia’s main competitor in the market is the US, followed byNew Zealand.
Taiwan total beef imports by supplier
0
20
40
60
80
100
120
‘000
tonn
es s
wt
09-1008-09 10-11 11-12 12-13 13-14 14-15 15-16 16-17 17-18 17-18* 18-19*
US Australia NZ Other**
Source: IHS Markit *FYTD Jul-Apr**Other includes: Paraguay, Nicaragua, Panama, Honduras, Costa Rica and Canada.
Market access overview – Taiwan Trade agreements Import tariffs Competitors Volume restrictions Technical access
N/A NT* $10/kg 15% tariff on offal
US, Japan and Canada access the same as AustraliaParaguay, El Salvador, Honduras, Panama, Guatemala, Nicaragua, New Zealand and Singapore 0% tariff on beef
Zero No major hurdles
Best access Major challengesSource: Trade agreements, DFAT, MLA.
* New Taiwan Dollar
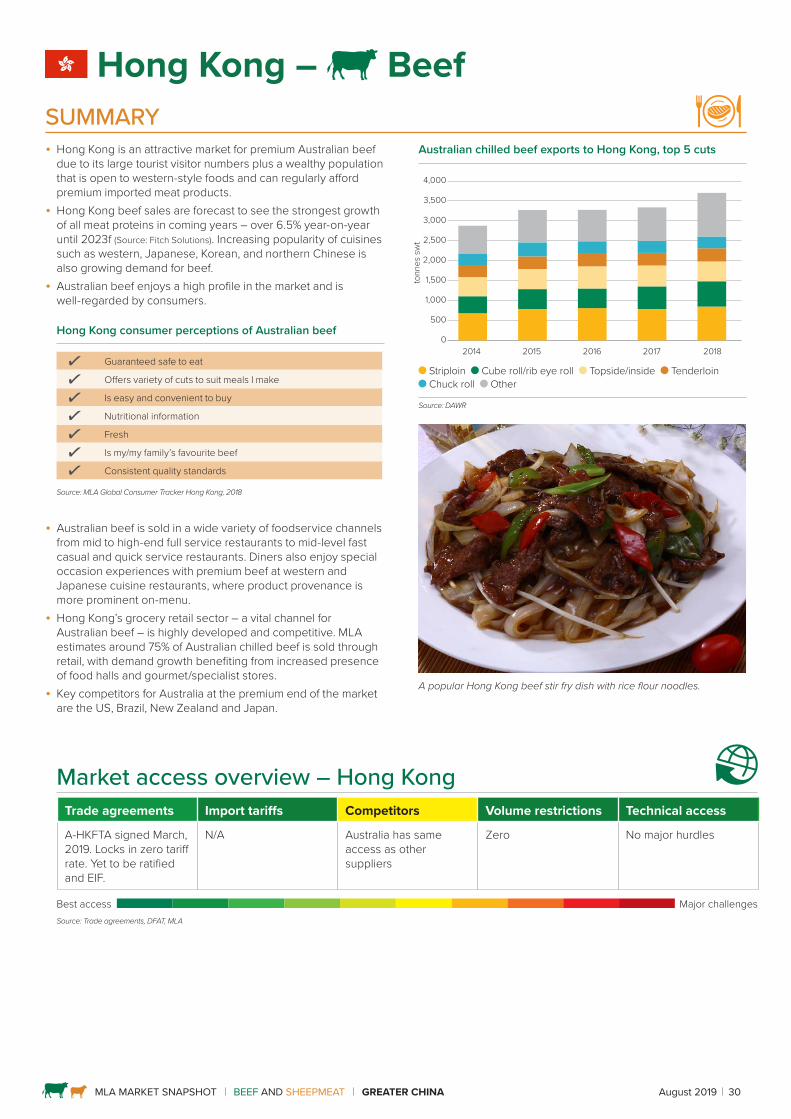
MLA MARKET SNAPSHOT BEEF AND SHEEPMEAT GREATER CHINA August 2019 30
SUMMARY• Hong Kong is an attractive market for premium Australian beef
due to its large tourist visitor numbers plus a wealthy populationthat is open to western-style foods and can regularly affordpremium imported meat products.
• Hong Kong beef sales are forecast to see the strongest growthof all meat proteins in coming years – over 6.5% year-on-yearuntil 2023f (Source: Fitch Solutions). Increasing popularity of cuisinessuch as western, Japanese, Korean, and northern Chinese isalso growing demand for beef.
• Australian beef enjoys a high profile in the market and iswell-regarded by consumers.
Hong Kong consumer perceptions of Australian beef
Guaranteed safe to eat
Offers variety of cuts to suit meals I make
Is easy and convenient to buy
Nutritional information
Fresh
Is my/my family’s favourite beef
Consistent quality standards
Source: MLA Global Consumer Tracker Hong Kong, 2018
• Australian beef is sold in a wide variety of foodservice channelsfrom mid to high-end full service restaurants to mid-level fastcasual and quick service restaurants. Diners also enjoy specialoccasion experiences with premium beef at western andJapanese cuisine restaurants, where product provenance ismore prominent on-menu.
• Hong Kong’s grocery retail sector – a vital channel forAustralian beef – is highly developed and competitive. MLAestimates around 75% of Australian chilled beef is sold throughretail, with demand growth benefiting from increased presenceof food halls and gourmet/specialist stores.
• Key competitors for Australia at the premium end of the marketare the US, Brazil, New Zealand and Japan.
Hong Kong – Beef
Australian chilled beef exports to Hong Kong, top 5 cuts
0
500
1,000
1,500
2,000
2,500
3,000
3,500
4,000
tonn
es s
wt
2014 2015 2016 2017 2018
Striploin Cube roll/rib eye roll Topside/inside Tenderloin Chuck roll Other
Source: DAWR
A popular Hong Kong beef stir fry dish with rice flour noodles.
Market access overview – Hong Kong Trade agreements Import tariffs Competitors Volume restrictions Technical access
A-HKFTA signed March,2019. Locks in zero tariff rate. Yet to be ratifiedand EIF.
N/A Australia has same access as other suppliers
Zero No major hurdles
Best access Major challengesSource: Trade agreements, DFAT, MLA
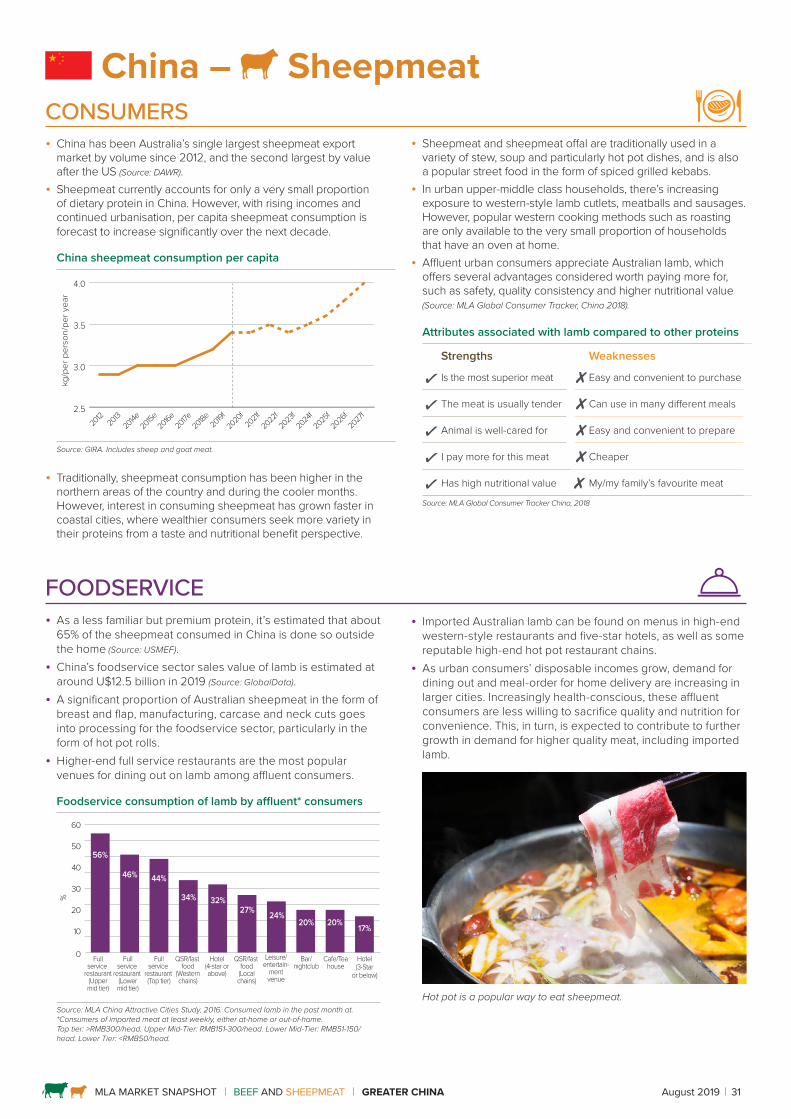
MLA MARKET SNAPSHOT BEEF AND SHEEPMEAT GREATER CHINA August 2019 31
China – SheepmeatCONSUMERS • China has been Australia’s single largest sheepmeat export
market by volume since 2012, and the second largest by valueafter the US (Source: DAWR).
• Sheepmeat currently accounts for only a very small proportionof dietary protein in China. However, with rising incomes andcontinued urbanisation, per capita sheepmeat consumption isforecast to increase significantly over the next decade.
China sheepmeat consumption per capita
kg/p
er p
erso
n/pe
r yea
r
2.5
3.0
3.5
4.0
2019f20
1320
14e20
15e20
16e20
18e20
17e20
20f
2021f
2022
f20
1220
24f
2023
f20
25f
2026
f20
27f
Source: GIRA. Includes sheep and goat meat.
• Traditionally, sheepmeat consumption has been higher in thenorthern areas of the country and during the cooler months.However, interest in consuming sheepmeat has grown faster incoastal cities, where wealthier consumers seek more variety intheir proteins from a taste and nutritional benefit perspective.
FOODSERVICE • As a less familiar but premium protein, it’s estimated that about
65% of the sheepmeat consumed in China is done so outsidethe home (Source: USMEF).
• China’s foodservice sector sales value of lamb is estimated ataround U$12.5 billion in 2019 (Source: GlobalData).
• A significant proportion of Australian sheepmeat in the form ofbreast and flap, manufacturing, carcase and neck cuts goesinto processing for the foodservice sector, particularly in theform of hot pot rolls.
• Higher-end full service restaurants are the most popularvenues for dining out on lamb among affluent consumers.
Foodservice consumption of lamb by affluent* consumers
%
0
10
20
30
40
50
60
Fullservice
restaurant(Uppermid tier)
Hotel(3-Star
or below)
Leisure/entertain-
mentvenue
Fullservice
restaurant (Lowermid tier)
Fullservice
restaurant (Top tier)
Bar/nightclub
QSR/fast food
(Westernchains)
QSR/fast food(Localchains)
Cafe/Teahouse
Hotel(4-star orabove)
56%
46% 44%
34% 32%27% 24%
20% 20% 17%
Source: MLA China Attractive Cities Study, 2016. Consumed lamb in the past month at. *Consumers of imported meat at least weekly, either at-home or out-of-home. Top tier: >RMB300/head. Upper Mid-Tier: RMB151-300/head. Lower Mid-Tier: RMB51-150/head. Lower Tier: <RMB50/head.
• Sheepmeat and sheepmeat offal are traditionally used in avariety of stew, soup and particularly hot pot dishes, and is alsoa popular street food in the form of spiced grilled kebabs.
• In urban upper-middle class households, there’s increasingexposure to western-style lamb cutlets, meatballs and sausages.However, popular western cooking methods such as roastingare only available to the very small proportion of householdsthat have an oven at home.
• Affluent urban consumers appreciate Australian lamb, whichoffers several advantages considered worth paying more for,such as safety, quality consistency and higher nutritional value(Source: MLA Global Consumer Tracker, China 2018).
Attributes associated with lamb compared to other proteins
Strengths Weaknesses
Is the most superior meat Easy and convenient to purchase
The meat is usually tender Can use in many different meals
Animal is well-cared for Easy and convenient to prepare
I pay more for this meat Cheaper
Has high nutritional value My/my family’s favourite meat
Source: MLA Global Consumer Tracker China, 2018
• Imported Australian lamb can be found on menus in high-endwestern-style restaurants and five-star hotels, as well as somereputable high-end hot pot restaurant chains.
• As urban consumers’ disposable incomes grow, demand fordining out and meal-order for home delivery are increasing inlarger cities. Increasingly health-conscious, these affluentconsumers are less willing to sacrifice quality and nutrition forconvenience. This, in turn, is expected to contribute to furthergrowth in demand for higher quality meat, including importedlamb.
Hot pot is a popular way to eat sheepmeat.
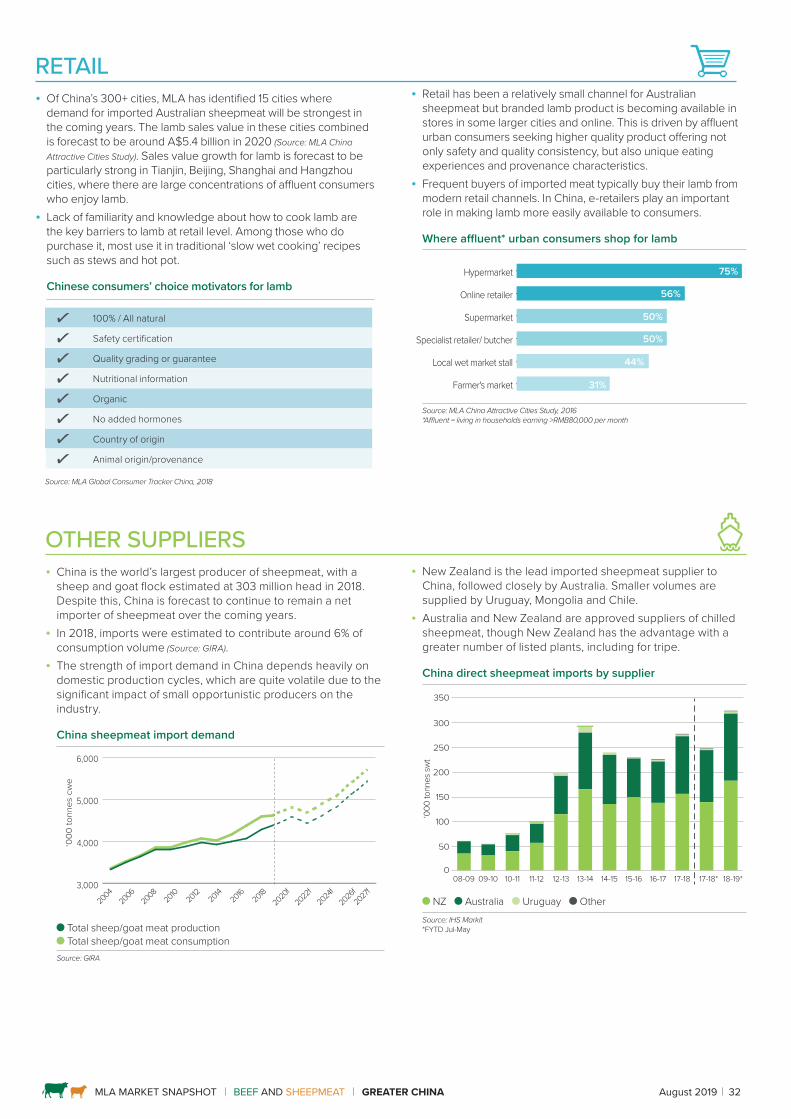
MLA MARKET SNAPSHOT BEEF AND SHEEPMEAT GREATER CHINA August 2019 32
RETAIL • Of China’s 300+ cities, MLA has identified 15 cities where
demand for imported Australian sheepmeat will be strongest in the coming years. The lamb sales value in these cities combined is forecast to be around A$5.4 billion in 2020 (Source: MLA China Attractive Cities Study). Sales value growth for lamb is forecast to be particularly strong in Tianjin, Beijing, Shanghai and Hangzhou cities, where there are large concentrations of affluent consumers who enjoy lamb.
• Lack of familiarity and knowledge about how to cook lamb are the key barriers to lamb at retail level. Among those who do purchase it, most use it in traditional ‘slow wet cooking’ recipes such as stews and hot pot.
Chinese consumers’ choice motivators for lamb
100% / All natural
Safety certification
Quality grading or guarantee
Nutritional information
Organic
No added hormones
Country of origin
Animal origin/provenance
Source: MLA Global Consumer Tracker China, 2018
OTHER SUPPLIERS • China is the world’s largest producer of sheepmeat, with a
sheep and goat flock estimated at 303 million head in 2018. Despite this, China is forecast to continue to remain a net importer of sheepmeat over the coming years.
• In 2018, imports were estimated to contribute around 6% of consumption volume (Source: GIRA).
• The strength of import demand in China depends heavily on domestic production cycles, which are quite volatile due to the significant impact of small opportunistic producers on the industry.
China sheepmeat import demand
‘000
tonn
es c
we
3,000
4,000
5,000
6,000 Total Sheep/goat meat consumption
2018
2006
2008
2010
2012
2016
2014
2020
f20
22f
2024
f20
0420
26f20
27f
Total sheep/goat meat production Total sheep/goat meat consumption
Source: GIRA
• Retail has been a relatively small channel for Australian sheepmeat but branded lamb product is becoming available in stores in some larger cities and online. This is driven by affluent urban consumers seeking higher quality product offering not only safety and quality consistency, but also unique eating experiences and provenance characteristics.
• Frequent buyers of imported meat typically buy their lamb from modern retail channels. In China, e-retailers play an important role in making lamb more easily available to consumers.
Where affluent* urban consumers shop for lamb
Farmer's market
Local wet market stall
Specialist retailer/ butcher
Supermarket
Online retailer
Hypermarket
56%
50%
50%
75%
44%
31%
Source: MLA China Attractive Cities Study, 2016 *Affluent = living in households earning >RMB80,000 per month
• New Zealand is the lead imported sheepmeat supplier to China, followed closely by Australia. Smaller volumes are supplied by Uruguay, Mongolia and Chile.
• Australia and New Zealand are approved suppliers of chilled sheepmeat, though New Zealand has the advantage with a greater number of listed plants, including for tripe.
China direct sheepmeat imports by supplier
NZ Australia Uruguay OtherSource: IHS Markit*FYTD Jul-May
‘000
tonn
es s
wt
0
50
100
150
200
250
300
350
Other
Uruguay
Australia
NZ
09-1008-09 10-11 11-12 12-13 13-14 14-15 15-16 16-17 17-18 17-18* 18-19*
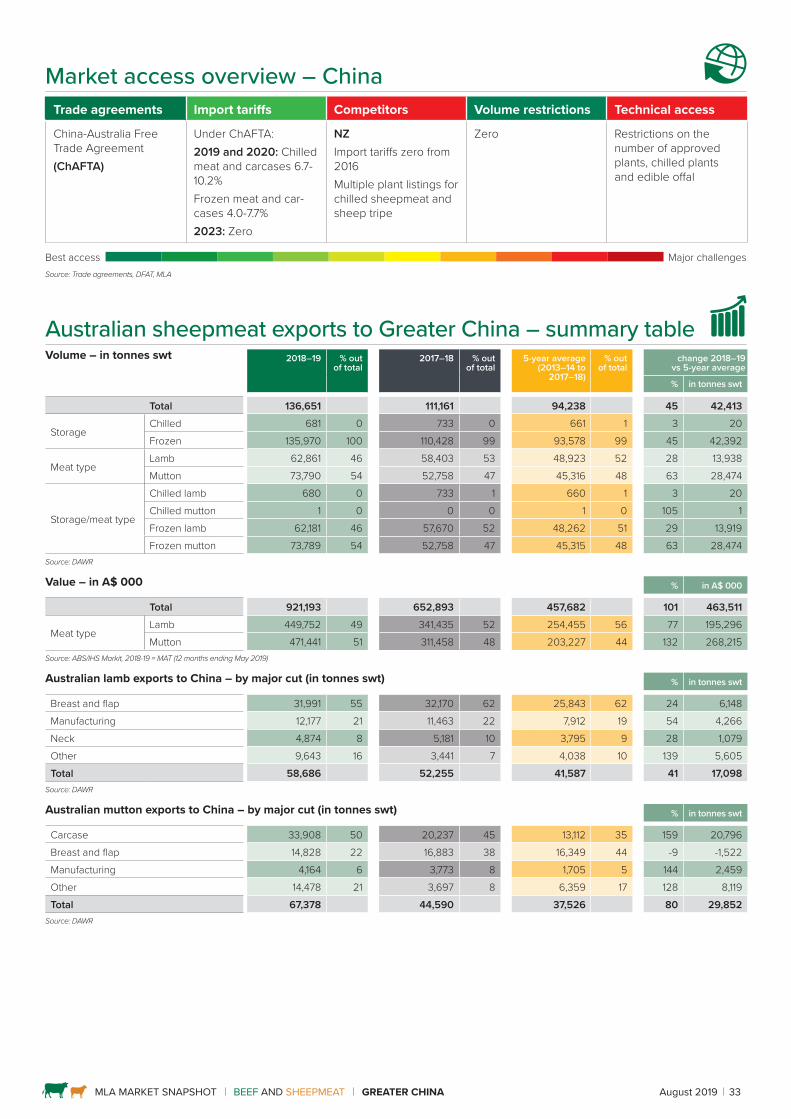
MLA MARKET SNAPSHOT BEEF AND SHEEPMEAT GREATER CHINA August 2019 33
Market access overview – China Trade agreements Import tariffs Competitors Volume restrictions Technical access
China-Australia Free Trade Agreement(ChAFTA)
Under ChAFTA:2019 and 2020: Chilled meat and carcases 6.7-10.2%Frozen meat and car-cases 4.0-7.7%2023: Zero
NZImport tariffs zero from 2016Multiple plant listings for chilled sheepmeat and sheep tripe
Zero Restrictions on the number of approved plants, chilled plants and edible offal
Best access Major challengesSource: Trade agreements, DFAT, MLA
Australian sheepmeat exports to Greater China – summary table Volume – in tonnes swt 2018–19 % out
of total2017–18 % out
of total5-year average
(2013–14 to 2017–18)
% out of total
change 2018–19 vs 5-year average
% in tonnes swt
Total 136,651 111,161 94,238 45 42,413
StorageChilled 681 0 733 0 661 1 3 20 Frozen 135,970 100 110,428 99 93,578 99 45 42,392
Meat typeLamb 62,861 46 58,403 53 48,923 52 28 13,938 Mutton 73,790 54 52,758 47 45,316 48 63 28,474
Storage/meat type
Chilled lamb 680 0 733 1 660 1 3 20 Chilled mutton 1 0 0 0 1 0 105 1 Frozen lamb 62,181 46 57,670 52 48,262 51 29 13,919 Frozen mutton 73,789 54 52,758 47 45,315 48 63 28,474
Source: DAWR
Value – in A$ 000 % in A$ 000
Total 921,193 652,893 457,682 101 463,511
Meat typeLamb 449,752 49 341,435 52 254,455 56 77 195,296 Mutton 471,441 51 311,458 48 203,227 44 132 268,215
Source: ABS/IHS Markit, 2018-19 = MAT (12 months ending May 2019)
Australian lamb exports to China – by major cut (in tonnes swt) % in tonnes swt
Breast and flap 31,991 55 32,170 62 25,843 62 24 6,148 Manufacturing 12,177 21 11,463 22 7,912 19 54 4,266 Neck 4,874 8 5,181 10 3,795 9 28 1,079 Other 9,643 16 3,441 7 4,038 10 139 5,605 Total 58,686 52,255 41,587 41 17,098
Source: DAWR
Australian mutton exports to China – by major cut (in tonnes swt) % in tonnes swt
Carcase 33,908 50 20,237 45 13,112 35 159 20,796 Breast and flap 14,828 22 16,883 38 16,349 44 -9 -1,522 Manufacturing 4,164 6 3,773 8 1,705 5 144 2,459 Other 14,478 21 3,697 8 6,359 17 128 8,119 Total 67,378 44,590 37,526 80 29,852
Source: DAWR
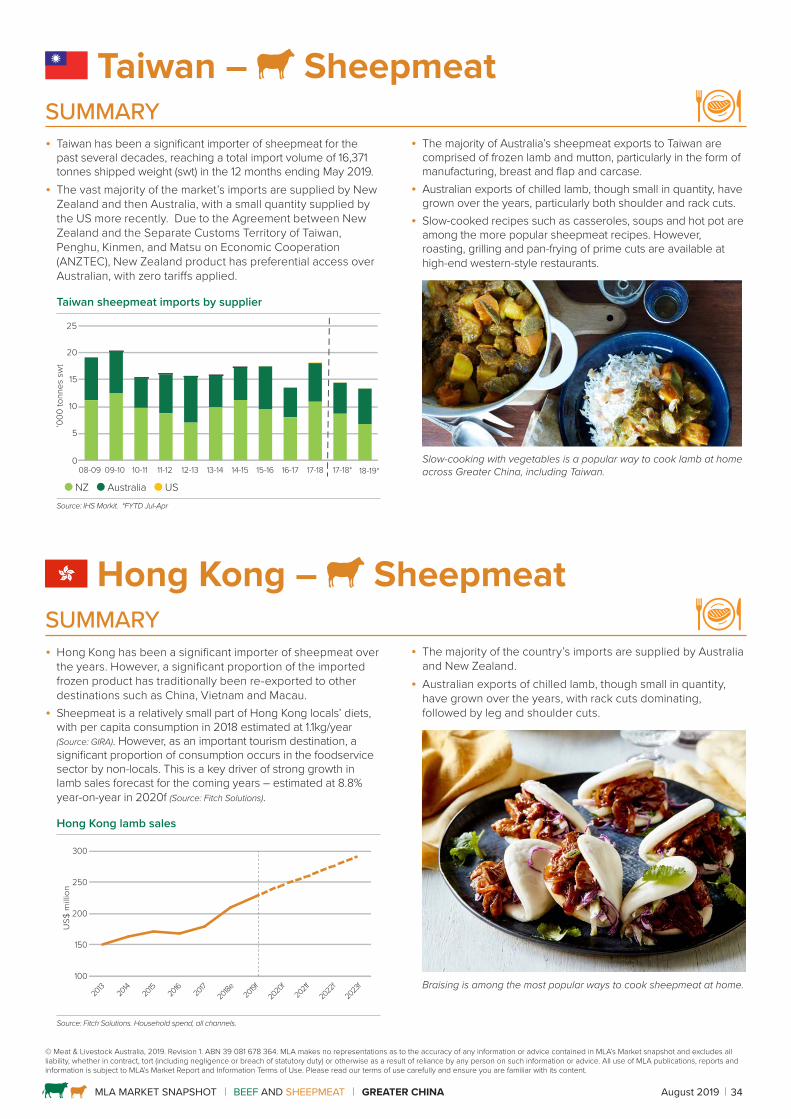
MLA MARKET SNAPSHOT BEEF AND SHEEPMEAT GREATER CHINA August 2019 34
Taiwan – SheepmeatSUMMARY • Taiwan has been a significant importer of sheepmeat for the
past several decades, reaching a total import volume of 16,371tonnes shipped weight (swt) in the 12 months ending May 2019.
• The vast majority of the market’s imports are supplied by NewZealand and then Australia, with a small quantity supplied bythe US more recently. Due to the Agreement between NewZealand and the Separate Customs Territory of Taiwan,Penghu, Kinmen, and Matsu on Economic Cooperation(ANZTEC), New Zealand product has preferential access overAustralian, with zero tariffs applied.
Taiwan sheepmeat imports by supplier
0
5
10
15
20
25US
Australia
New Zealand
‘000
tonn
es s
wt
YTD(Jan to May)
09-1008-09 10-11 11-12 12-13 13-14 14-15 15-16 16-17 17-18 17-18* 18-19*
NZ Australia USSource: IHS Markit. *FYTD Jul-Apr
• The majority of Australia’s sheepmeat exports to Taiwan arecomprised of frozen lamb and mutton, particularly in the form ofmanufacturing, breast and flap and carcase.
• Australian exports of chilled lamb, though small in quantity, havegrown over the years, particularly both shoulder and rack cuts.
• Slow-cooked recipes such as casseroles, soups and hot pot areamong the more popular sheepmeat recipes. However,roasting, grilling and pan-frying of prime cuts are available athigh-end western-style restaurants.
Slow-cooking with vegetables is a popular way to cook lamb at home across Greater China, including Taiwan.
Hong Kong – SheepmeatSUMMARY • Hong Kong has been a significant importer of sheepmeat over
the years. However, a significant proportion of the importedfrozen product has traditionally been re-exported to otherdestinations such as China, Vietnam and Macau.
• Sheepmeat is a relatively small part of Hong Kong locals’ diets,with per capita consumption in 2018 estimated at 1.1kg/year(Source: GIRA). However, as an important tourism destination, asignificant proportion of consumption occurs in the foodservicesector by non-locals. This is a key driver of strong growth inlamb sales forecast for the coming years – estimated at 8.8%year-on-year in 2020f (Source: Fitch Solutions).
Hong Kong lamb sales
US$
mill
ion
2019f20
1320
1420
1520
1620
18e2017
2020
f20
21f20
22f
2023
f100
150
200
250
300
Source: Fitch Solutions. Household spend, all channels.
• The majority of the country’s imports are supplied by Australiaand New Zealand.
• Australian exports of chilled lamb, though small in quantity,have grown over the years, with rack cuts dominating,followed by leg and shoulder cuts.
Braising is among the most popular ways to cook sheepmeat at home.
© Meat & Livestock Australia, 2019. Revision 1. ABN 39 081 678 364. MLA makes no representations as to the accuracy of any information or advice contained in MLA’s Market snapshot and excludes all liability, whether in contract, tort (including negligence or breach of statutory duty) or otherwise as a result of reliance by any person on such information or advice. All use of MLA publications, reports and information is subject to MLA’s Market Report and Information Terms of Use. Please read our terms of use carefully and ensure you are familiar with its content.
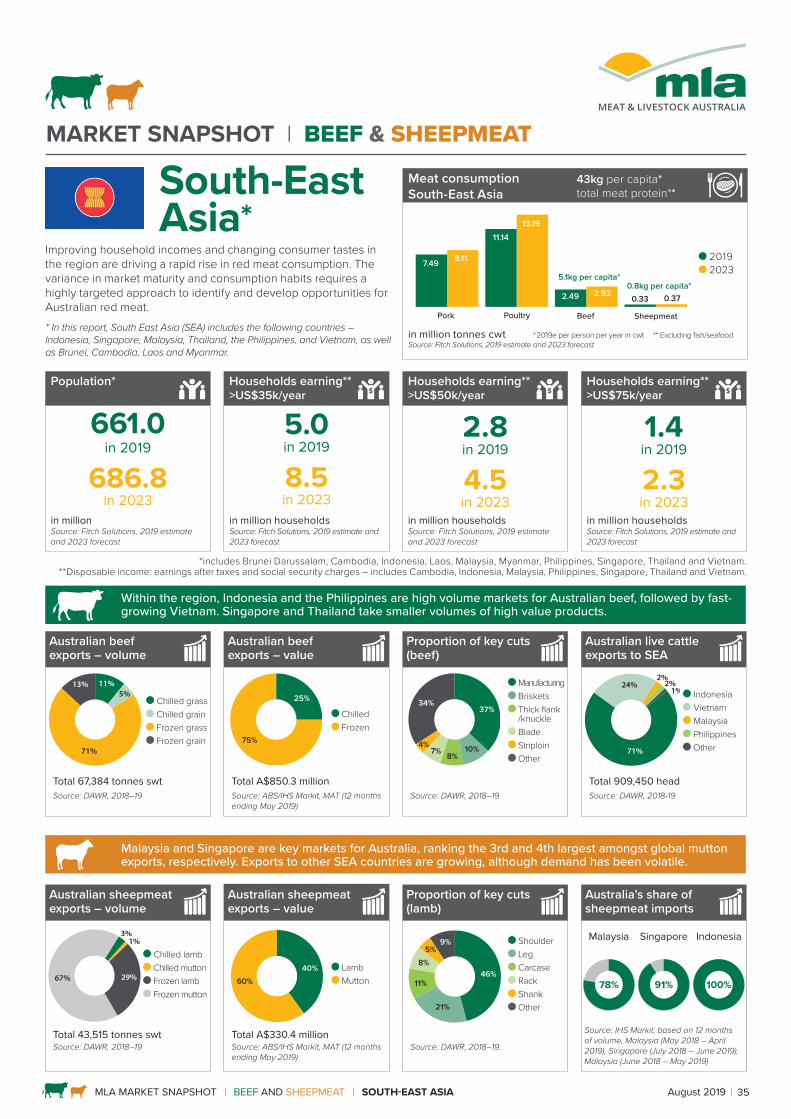
MARKET SNAPSHOT l BEEF & SHEEPMEAT
MLA MARKET SNAPSHOT BEEF AND SHEEPMEAT SOUTH-EAST ASIA August 2019 35
Improving household incomes and changing consumer tastes in the region are driving a rapid rise in red meat consumption. The variance in market maturity and consumption habits requires a highly targeted approach to identify and develop opportunities for Australian red meat.
Population* Households earning** >US$35k/year
Households earning** >US$50k/year
Households earning** >US$75k/year
661.0in 2019
686.8in 2023
5.0in 2019
8.5in 2023
2.8in 2019
4.5in 2023
1.4in 2019
2.3in 2023
in million Source: Fitch Solutions, 2019 estimate and 2023 forecast
in million households Source: Fitch Solutions, 2019 estimate and 2023 forecast
in million households Source: Fitch Solutions, 2019 estimate and 2023 forecast
in million households Source: Fitch Solutions, 2019 estimate and 2023 forecast
*includes Brunei Darussalam, Cambodia, Indonesia, Laos, Malaysia, Myanmar, Philippines, Singapore, Thailand and Vietnam. **Disposable income: earnings after taxes and social security charges – includes Cambodia, Indonesia, Malaysia, Philippines, Singapore, Thailand and Vietnam.
Within the region, Indonesia and the Philippines are high volume markets for Australian beef, followed by fast- growing Vietnam. Singapore and Thailand take smaller volumes of high value products.
Malaysia and Singapore are key markets for Australia, ranking the 3rd and 4th largest amongst global mutton exports, respectively. Exports to other SEA countries are growing, although demand has been volatile.
South-East Asia*
Meat consumption South-East Asia
43kg per capita*total meat protein**
Pork
7.49 8.11
11.1413.19
1.33
2.920.33 0.37
Poultry Beef Sheepmeat
5.1kg per capita*0.8kg per capita*
2.49
2019 2023
in million tonnes cwt * 2019e per person per year in cwt ** Excluding fish/seafoodSource: Fitch Solutions, 2019 estimate and 2023 forecast
Australian beef exports – volume
Australian beef exports – value
Proportion of key cuts (beef)
Australian live cattle exports to SEA
11%5%
71%
13%
Chilled grass Chilled grain Frozen grass Frozen grain
25%
75%
Chilled Frozen
37%
7%
34%
8%10%4%
Manufacturing Briskets Thick flank /knuckle Blade Striploin Other
2%24%
71%
2%1% Indonesia
Vietnam Malaysia Philippines Other
Total 67,384 tonnes swt Total A$850.3 million Total 909,450 headSource: DAWR, 2018–19 Source: ABS/IHS Markit, MAT (12 months
ending May 2019)Source: DAWR, 2018–19 Source: DAWR, 2018-19
* In this report, South East Asia (SEA) includes the following countries – Indonesia, Singapore, Malaysia, Thailand, the Philippines, and Vietnam, as wellas Brunei, Cambodia, Laos and Myanmar.
Australian sheepmeat exports – volume
Australian sheepmeat exports – value
Proportion of key cuts (lamb)
Australia’s share of sheepmeat imports
3%
29%67%
1%
Chilled lamb Chilled mutton Frozen lamb Frozen mutton
40%60%
Lamb Mutton
46%8%
9%
11%
21%
5% Shoulder Leg Carcase Rack Shank Other
Malaysia Singapore Indonesia
78% 91% 100%
Source: IHS Markit, based on 12 months of volume, Malaysia (May 2018 – April 2019), Singapore (July 2018 – June 2019), Malaysia (June 2018 – May 2019)
Total 43,515 tonnes swt Total A$330.4 millionSource: DAWR, 2018–19 Source: ABS/IHS Markit, MAT (12 months
ending May 2019)Source: DAWR, 2018–19.
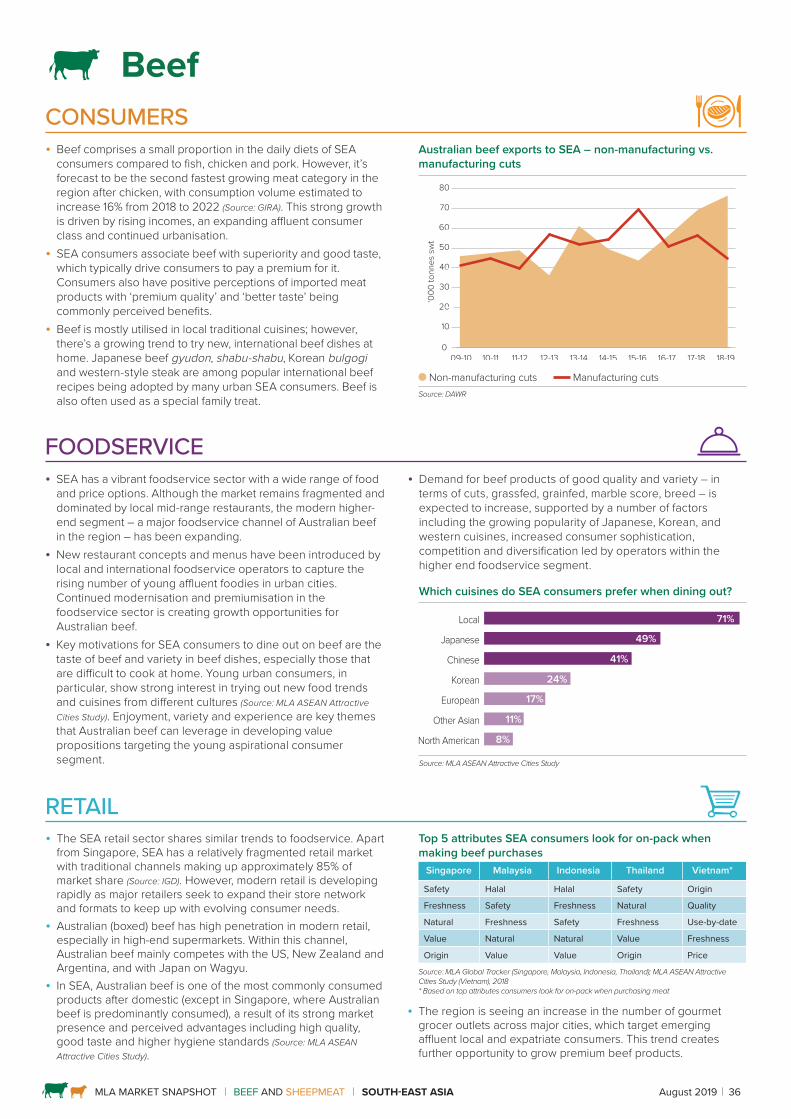
MLA MARKET SNAPSHOT BEEF AND SHEEPMEAT SOUTH-EAST ASIA August 2019 36
CONSUMERS• Beef comprises a small proportion in the daily diets of SEA
consumers compared to fish, chicken and pork. However, it’sforecast to be the second fastest growing meat category in theregion after chicken, with consumption volume estimated toincrease 16% from 2018 to 2022 (Source: GIRA). This strong growthis driven by rising incomes, an expanding affluent consumerclass and continued urbanisation.
• SEA consumers associate beef with superiority and good taste,which typically drive consumers to pay a premium for it.Consumers also have positive perceptions of imported meatproducts with ‘premium quality’ and ‘better taste’ beingcommonly perceived benefits.
• Beef is mostly utilised in local traditional cuisines; however,there’s a growing trend to try new, international beef dishes athome. Japanese beef gyudon, shabu-shabu, Korean bulgogi and western-style steak are among popular international beefrecipes being adopted by many urban SEA consumers. Beef isalso often used as a special family treat.
FOODSERVICE • SEA has a vibrant foodservice sector with a wide range of food
and price options. Although the market remains fragmented anddominated by local mid-range restaurants, the modern higher- end segment – a major foodservice channel of Australian beefin the region – has been expanding.
• New restaurant concepts and menus have been introduced bylocal and international foodservice operators to capture therising number of young affluent foodies in urban cities.Continued modernisation and premiumisation in thefoodservice sector is creating growth opportunities forAustralian beef.
• Key motivations for SEA consumers to dine out on beef are thetaste of beef and variety in beef dishes, especially those thatare difficult to cook at home. Young urban consumers, inparticular, show strong interest in trying out new food trendsand cuisines from different cultures (Source: MLA ASEAN AttractiveCities Study). Enjoyment, variety and experience are key themesthat Australian beef can leverage in developing valuepropositions targeting the young aspirational consumersegment.
• Demand for beef products of good quality and variety – interms of cuts, grassfed, grainfed, marble score, breed – isexpected to increase, supported by a number of factorsincluding the growing popularity of Japanese, Korean, andwestern cuisines, increased consumer sophistication,competition and diversification led by operators within thehigher end foodservice segment.
Which cuisines do SEA consumers prefer when dining out?
North American
Other Asian
European
Korean
Chinese
Japanese
Local
49%
41%
24%
71%
11%
8%
17%
Source: MLA ASEAN Attractive Cities Study
Beef
Australian beef exports to SEA – non-manufacturing vs. manufacturing cuts
0
10
20
30
40
50
60
70
80
‘000
tonn
es s
wt
18-1914-15 15-16 16-17 17-1812-13 13-1411-1209-10 10-11
Non-manufacturing cuts Manufacturing cutsSource: DAWR
RETAIL • The SEA retail sector shares similar trends to foodservice. Apart
from Singapore, SEA has a relatively fragmented retail marketwith traditional channels making up approximately 85% ofmarket share (Source: IGD). However, modern retail is developingrapidly as major retailers seek to expand their store networkand formats to keep up with evolving consumer needs.
• Australian (boxed) beef has high penetration in modern retail,especially in high-end supermarkets. Within this channel,Australian beef mainly competes with the US, New Zealand andArgentina, and with Japan on Wagyu.
• In SEA, Australian beef is one of the most commonly consumedproducts after domestic (except in Singapore, where Australianbeef is predominantly consumed), a result of its strong marketpresence and perceived advantages including high quality,good taste and higher hygiene standards (Source: MLA ASEAN Attractive Cities Study).
Top 5 attributes SEA consumers look for on-pack when making beef purchases
Singapore Malaysia Indonesia Thailand Vietnam*
Safety Halal Halal Safety Origin
Freshness Safety Freshness Natural Quality
Natural Freshness Safety Freshness Use-by-date
Value Natural Natural Value Freshness
Origin Value Value Origin Price
Source: MLA Global Tracker (Singapore, Malaysia, Indonesia, Thailand); MLA ASEAN Attractive Cities Study (Vietnam), 2018 * Based on top attributes consumers look for on-pack when purchasing meat
• The region is seeing an increase in the number of gourmetgrocer outlets across major cities, which target emergingaffluent local and expatriate consumers. This trend createsfurther opportunity to grow premium beef products.
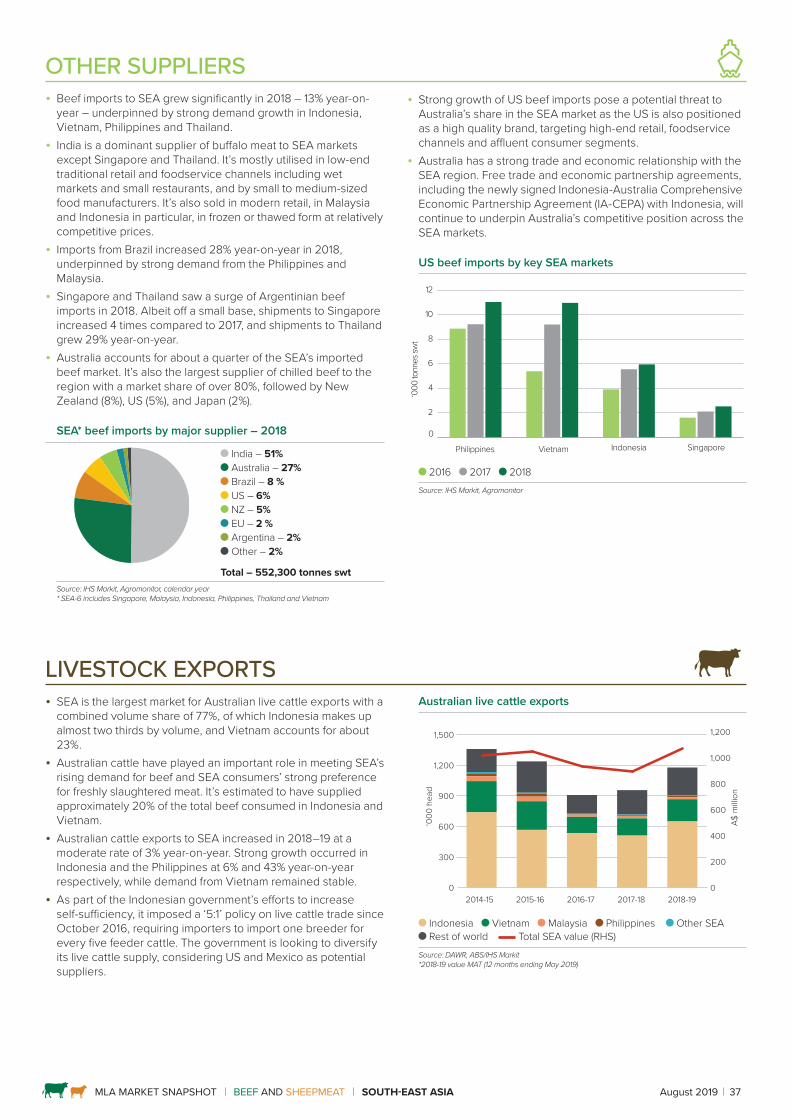
MLA MARKET SNAPSHOT BEEF AND SHEEPMEAT SOUTH-EAST ASIA August 2019 37
OTHER SUPPLIERS • Beef imports to SEA grew significantly in 2018 – 13% year-on-
year – underpinned by strong demand growth in Indonesia,Vietnam, Philippines and Thailand.
• India is a dominant supplier of buffalo meat to SEA marketsexcept Singapore and Thailand. It’s mostly utilised in low-endtraditional retail and foodservice channels including wetmarkets and small restaurants, and by small to medium-sizedfood manufacturers. It’s also sold in modern retail, in Malaysiaand Indonesia in particular, in frozen or thawed form at relativelycompetitive prices.
• Imports from Brazil increased 28% year-on-year in 2018,underpinned by strong demand from the Philippines andMalaysia.
• Singapore and Thailand saw a surge of Argentinian beefimports in 2018. Albeit off a small base, shipments to Singaporeincreased 4 times compared to 2017, and shipments to Thailandgrew 29% year-on-year.
• Australia accounts for about a quarter of the SEA’s importedbeef market. It’s also the largest supplier of chilled beef to theregion with a market share of over 80%, followed by NewZealand (8%), US (5%), and Japan (2%).
SEA* beef imports by major supplier – 2018
India – 51% Australia – 27% Brazil – 8 % US – 6% NZ – 5% EU – 2 % Argentina – 2% Other – 2%
Total – 552,300 tonnes swtSource: IHS Markit, Agromonitor, calendar year * SEA-6 includes Singapore, Malaysia, Indonesia, Philippines, Thailand and Vietnam
• Strong growth of US beef imports pose a potential threat toAustralia’s share in the SEA market as the US is also positionedas a high quality brand, targeting high-end retail, foodservicechannels and affluent consumer segments.
• Australia has a strong trade and economic relationship with theSEA region. Free trade and economic partnership agreements,including the newly signed Indonesia-Australia ComprehensiveEconomic Partnership Agreement (IA-CEPA) with Indonesia, willcontinue to underpin Australia’s competitive position across theSEA markets.
US beef imports by key SEA markets
0
2
4
6
8
10
12
‘000
tonn
es sw
t
Philippines Vietnam Indonesia Singapore
2016 2017 2018Source: IHS Markit, Agromonitor
LIVESTOCK EXPORTS • SEA is the largest market for Australian live cattle exports with a
combined volume share of 77%, of which Indonesia makes upalmost two thirds by volume, and Vietnam accounts for about23%.
• Australian cattle have played an important role in meeting SEA’srising demand for beef and SEA consumers’ strong preferencefor freshly slaughtered meat. It’s estimated to have suppliedapproximately 20% of the total beef consumed in Indonesia andVietnam.
• Australian cattle exports to SEA increased in 2018–19 at amoderate rate of 3% year-on-year. Strong growth occurred inIndonesia and the Philippines at 6% and 43% year-on-yearrespectively, while demand from Vietnam remained stable.
• As part of the Indonesian government’s efforts to increaseself-sufficiency, it imposed a ‘5:1’ policy on live cattle trade sinceOctober 2016, requiring importers to import one breeder forevery five feeder cattle. The government is looking to diversifyits live cattle supply, considering US and Mexico as potentialsuppliers.
Australian live cattle exports
‘000
hea
d
2018-192014-15 2015-16 2016-17 2017-18
A$
milli
on1,200
0
200
400
600
800
1,000
0
300
600
900
1,200
1,500
Indonesia Vietnam Malaysia Philippines Other SEA Rest of world Total SEA value (RHS)
Source: DAWR, ABS/IHS Markit*2018-19 value MAT (12 months ending May 2019)

MLA MARKET SNAPSHOT BEEF AND SHEEPMEAT SOUTH-EAST ASIA August 2019 38
Market access overview – Indonesia Trade agreements Import tariffs Competitors Volume restrictions Technical access
ASEAN*- Australia-NZ Free Trade Agreement (AANZFTA)Indonesia-Australia Comprehensive Economic Partnership Agreement (IA-CEPA) Signed in March 2019
Boxed beef – 5%for chilled and frozen boneless** and frozen bone-in***; 0% for all other linesLive cattle – 5%(0% for purebred breeding cattle)***
India (buffalo meat): India-ASEAN FTA. 5% tariff
Volumes managed by the Indonesian government’s import permit system
Highly regulated market, with complex import conditions and regulations. The government controls type of meat and offal products that can be imported into the country
Best access Major challengesSource: Trade agreements, DFAT, MLA * Association of Southeast Asian Nations. Members include Indonesia, Malaysia, Singapore, the Philippines, Thailand, Vietnam, Brunei, Myanmar, Laos and Cambodia.** Under AANZFTA: tariffs for chilled & frozen boneless beef exports will be removed on 1 January 2020.*** IA-CEPA on enter into force: tariffs for frozen bone-in beef exports will be reduced to 2.5% and removed by 2023; 0% tariff for male cattle exports within quota (575,000 head) and 2.5% out of quota, and 0% forfemale cattle exports with no quota.
Australian beef exports to Indonesia – summary table Volume – in tonnes swt 2018–19 % out
of total2017–18 % out
of total5-year average
(2013–14 to 2017–18)
% out of total
change 2018–19 vs 5-year average
% in tonnes swt
Total 54,417 58,213 50,096 9 4,321
StorageChilled 4,502 8 4,188 7 3,741 7 20 761Frozen 49,915 92 54,025 93 46,355 93 8 3,560
Meat typeGrassfed 53,324 98 56,852 98 49,288 98 8 4,036Grainfed 1,093 2 1,361 2 808 2 35 285
Storage/meat type
Chilled grassfed 4,042 7 3,391 6 3,276 7 23 767Chilled grainfed 460 1 798 1 466 1 -1 -6Frozen grassfed 49,282 91 53,461 92 46,013 92 7 3,269Frozen grainfed 633 1 564 1 342 1 85 291
Source: DAWR
Value – in A$ 000 % in A$ 000
Total 332,142 324,995 287,361 16 44,781
StorageChilled 49,140 15 48,842 15 41,722 15 18 7,418Frozen 283,002 85 276,153 85 245,639 85 15 37,363
Source: ABS/IHS Markit, 2018-19 = MAT (12 months ending May 2019)
Volume – by major cut (in tonnes swt) % in tonnes swt
Manufacturing 13,674 25 18,865 32 24,128 47 -43 -10,454Brisket 7,678 14 5,575 10 3,120 6 146 4,559Thick flank/knuckle 7,536 14 8,630 15 4,718 9 60 2,818Other 25,529 47 25,143 43 19,754 38 29 5,776Total 54,417 58,213 51,720 5 2,698
Source: DAWR
Australian beef offal exports to Indonesia (in tonnes swt) % in tonnes swt
Manufacturing 11,286 33 9,945 36 5,214 31 116 6,073Heart 5,461 16 3,974 14 3,112 18 75 2,349Liver 4,640 14 2,654 10 2,003 12 132 2,638Other 12,813 37 11,239 40 6,585 39 95 6,228Total 34,201 27,812 16,913 102 17,288
Source: ABS/IHS Markit, 2018-19 = MAT (12 months ending May 2019)
Value – in A$ 000 % in A$ 000
Total 102,453 77,090 40,350 154 62,103Source: DAWR, ABS/IHS Markit, 2018-19 = MAT (12 months ending May 2019)
Australian live cattle exports to Indonesia
Volume – in head 603,769 510,937 595,008 1 8,761Value – in A$ 000 675,129 573,551 571,131 18 103,998
Source: DAWR, ABS/IHS Markit, 2018-19 = MAT (12 months ending May 2019)
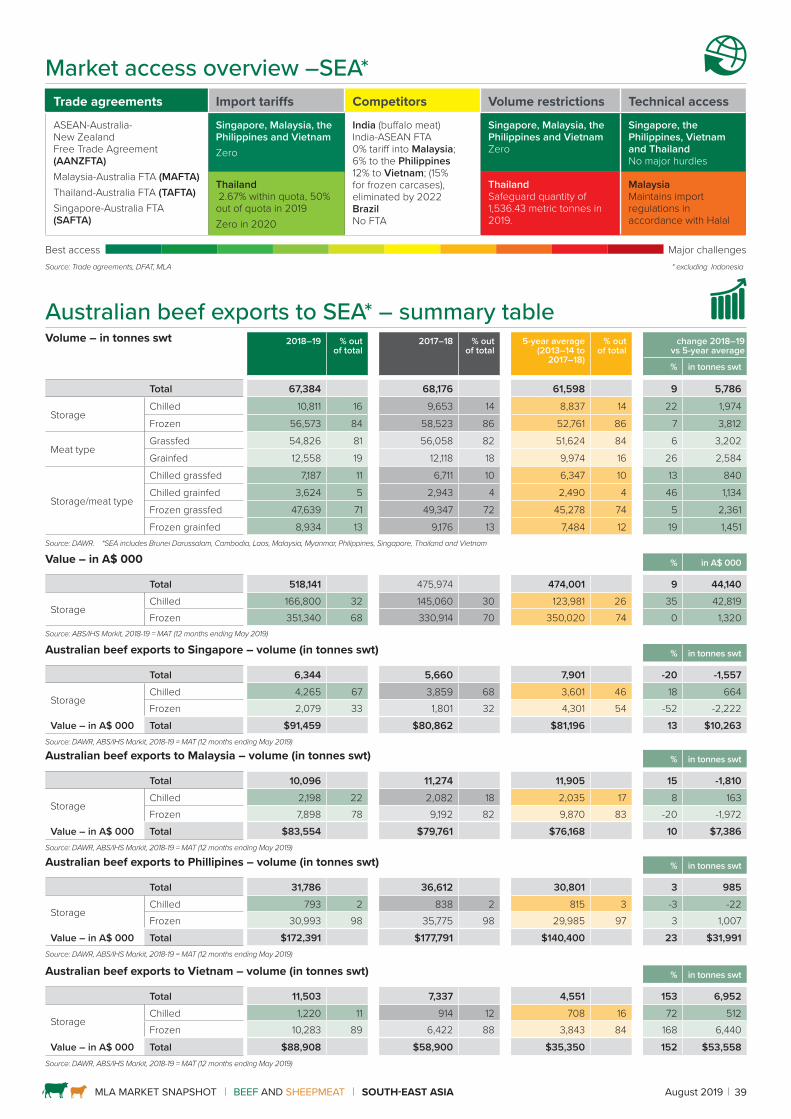
MLA MARKET SNAPSHOT BEEF AND SHEEPMEAT SOUTH-EAST ASIA August 2019 39
Market access overview –SEA* Trade agreements Import tariffs Competitors Volume restrictions Technical access
ASEAN-Australia- New Zealand Free Trade Agreement (AANZFTA)Malaysia-Australia FTA (MAFTA)Thailand-Australia FTA (TAFTA)Singapore-Australia FTA (SAFTA)
Singapore, Malaysia, the Philippines and VietnamZero
India (buffalo meat)India-ASEAN FTA0% tariff into Malaysia; 6% to the Philippines 12% to Vietnam; (15% for frozen carcases), eliminated by 2022 BrazilNo FTA
Singapore, Malaysia, the Philippines and Vietnam Zero
Singapore, the Philippines, Vietnam and Thailand No major hurdles
Thailand 2.67% within quota, 50% out of quota in 2019Zero in 2020
Thailand Safeguard quantity of 1,536.43 metric tonnes in 2019.
Malaysia Maintains import regulations in accordance with Halal
Best access Major challengesSource: Trade agreements, DFAT, MLA * excluding Indonesia
Australian beef exports to SEA* – summary table Volume – in tonnes swt 2018–19 % out
of total2017–18 % out
of total5-year average
(2013–14 to 2017–18)
% out of total
change 2018–19 vs 5-year average
% in tonnes swt
Total 67,384 68,176 61,598 9 5,786
StorageChilled 10,811 16 9,653 14 8,837 14 22 1,974
Frozen 56,573 84 58,523 86 52,761 86 7 3,812
Meat typeGrassfed 54,826 81 56,058 82 51,624 84 6 3,202 Grainfed 12,558 19 12,118 18 9,974 16 26 2,584
Storage/meat type
Chilled grassfed 7,187 11 6,711 10 6,347 10 13 840 Chilled grainfed 3,624 5 2,943 4 2,490 4 46 1,134 Frozen grassfed 47,639 71 49,347 72 45,278 74 5 2,361 Frozen grainfed 8,934 13 9,176 13 7,484 12 19 1,451
Source: DAWR. *SEA includes Brunei Darussalam, Cambodia, Laos, Malaysia, Myanmar, Philippines, Singapore, Thailand and Vietnam
Value – in A$ 000 % in A$ 000
Total 518,141 475,974 474,001 9 44,140
StorageChilled 166,800 32 145,060 30 123,981 26 35 42,819 Frozen 351,340 68 330,914 70 350,020 74 0 1,320
Source: ABS/IHS Markit, 2018-19 = MAT (12 months ending May 2019)
Australian beef exports to Singapore – volume (in tonnes swt) % in tonnes swt
Total 6,344 5,660 7,901 -20 -1,557
StorageChilled 4,265 67 3,859 68 3,601 46 18 664 Frozen 2,079 33 1,801 32 4,301 54 -52 -2,222
Value – in A$ 000 Total $91,459 $80,862 $81,196 13 $10,263 Source: DAWR, ABS/IHS Markit, 2018-19 = MAT (12 months ending May 2019)
Australian beef exports to Malaysia – volume (in tonnes swt) % in tonnes swt
Total 10,096 11,274 11,905 15 -1,810
StorageChilled 2,198 22 2,082 18 2,035 17 8 163 Frozen 7,898 78 9,192 82 9,870 83 -20 -1,972
Value – in A$ 000 Total $83,554 $79,761 $76,168 10 $7,386 Source: DAWR, ABS/IHS Markit, 2018-19 = MAT (12 months ending May 2019)
Australian beef exports to Phillipines – volume (in tonnes swt) % in tonnes swt
Total 31,786 36,612 30,801 3 985
StorageChilled 793 2 838 2 815 3 -3 -22Frozen 30,993 98 35,775 98 29,985 97 3 1,007
Value – in A$ 000 Total $172,391 $177,791 $140,400 23 $31,991 Source: DAWR, ABS/IHS Markit, 2018-19 = MAT (12 months ending May 2019)
Australian beef exports to Vietnam – volume (in tonnes swt) % in tonnes swt
Total 11,503 7,337 4,551 153 6,952
StorageChilled 1,220 11 914 12 708 16 72 512 Frozen 10,283 89 6,422 88 3,843 84 168 6,440
Value – in A$ 000 Total $88,908 $58,900 $35,350 152 $53,558Source: DAWR, ABS/IHS Markit, 2018-19 = MAT (12 months ending May 2019)
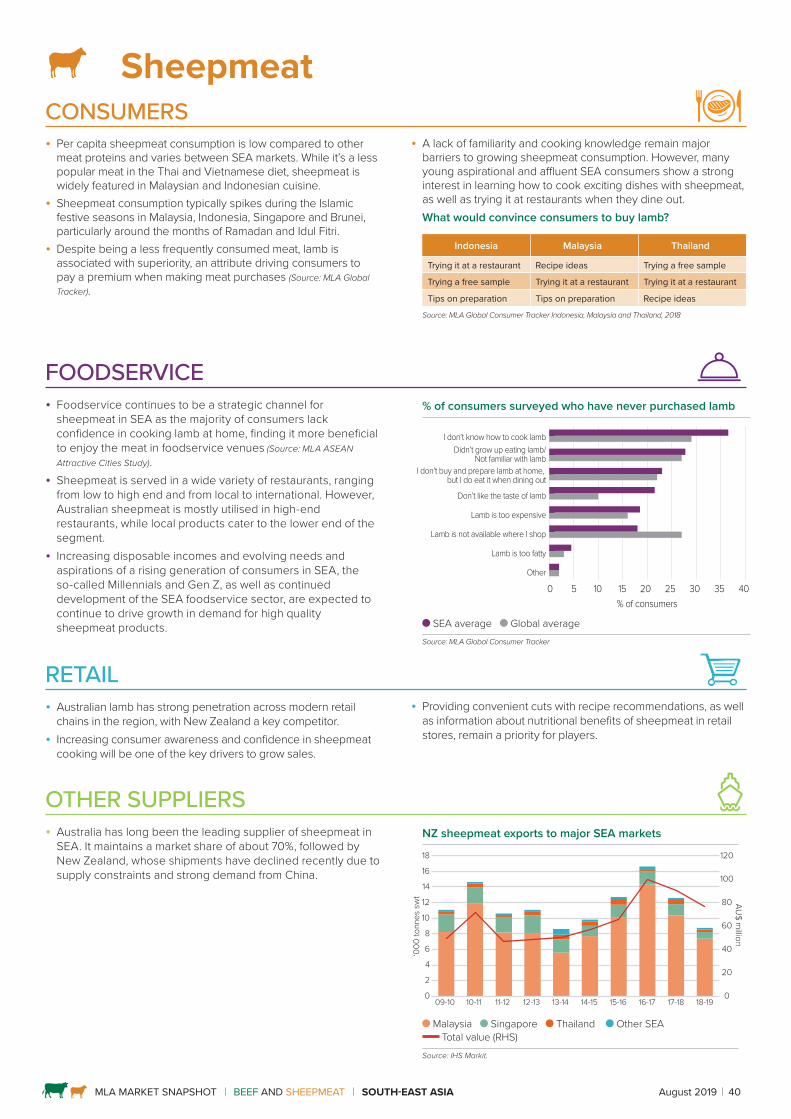
MLA MARKET SNAPSHOT BEEF AND SHEEPMEAT SOUTH-EAST ASIA August 2019 40
SheepmeatCONSUMERS • Per capita sheepmeat consumption is low compared to other
meat proteins and varies between SEA markets. While it’s a lesspopular meat in the Thai and Vietnamese diet, sheepmeat iswidely featured in Malaysian and Indonesian cuisine.
• Sheepmeat consumption typically spikes during the Islamicfestive seasons in Malaysia, Indonesia, Singapore and Brunei,particularly around the months of Ramadan and Idul Fitri.
• Despite being a less frequently consumed meat, lamb isassociated with superiority, an attribute driving consumers topay a premium when making meat purchases (Source: MLA GlobalTracker).
FOODSERVICE • Foodservice continues to be a strategic channel for
sheepmeat in SEA as the majority of consumers lackconfidence in cooking lamb at home, finding it more beneficialto enjoy the meat in foodservice venues (Source: MLA ASEAN Attractive Cities Study).
• Sheepmeat is served in a wide variety of restaurants, rangingfrom low to high end and from local to international. However,Australian sheepmeat is mostly utilised in high-endrestaurants, while local products cater to the lower end of thesegment.
• Increasing disposable incomes and evolving needs andaspirations of a rising generation of consumers in SEA, theso-called Millennials and Gen Z, as well as continueddevelopment of the SEA foodservice sector, are expected tocontinue to drive growth in demand for high qualitysheepmeat products.
• A lack of familiarity and cooking knowledge remain majorbarriers to growing sheepmeat consumption. However, manyyoung aspirational and affluent SEA consumers show a stronginterest in learning how to cook exciting dishes with sheepmeat,as well as trying it at restaurants when they dine out.What would convince consumers to buy lamb?
Indonesia Malaysia Thailand
Trying it at a restaurant Recipe ideas Trying a free sample
Trying a free sample Trying it at a restaurant Trying it at a restaurant
Tips on preparation Tips on preparation Recipe ideas
Source: MLA Global Consumer Tracker Indonesia, Malaysia and Thailand, 2018
RETAIL • Australian lamb has strong penetration across modern retail
chains in the region, with New Zealand a key competitor.• Increasing consumer awareness and confidence in sheepmeat
cooking will be one of the key drivers to grow sales.
% of consumers surveyed who have never purchased lamb
0 5 10 15 20 25 30 35 40Other
Lamb is too fatty
Lamb is not available where I shop
Lamb is too expensive
Don’t like the taste of lamb
I don’t buy and prepare lamb at home, but I do eat it when dining out
Didn’t grow up eating lamb/Not familiar with lamb
I don’t know how to cook lamb
% of consumers
SEA average Global averageSource: MLA Global Consumer Tracker
OTHER SUPPLIERS • Australia has long been the leading supplier of sheepmeat in
SEA. It maintains a market share of about 70%, followed byNew Zealand, whose shipments have declined recently due tosupply constraints and strong demand from China.
NZ sheepmeat exports to major SEA markets
09-10 10-11 11-12 12-13 13-14 14-15 15-16 16-17 17-18 18-190
20
40
60
80
100
120
0
2
4
6
8
10
12
14
16
18
AU$ m
illion
‘000
tonn
es s
wt
Malaysia Singapore Thailand Other SEA Total value (RHS)
Source: IHS Markit.
• Providing convenient cuts with recipe recommendations, as wellas information about nutritional benefits of sheepmeat in retailstores, remain a priority for players.
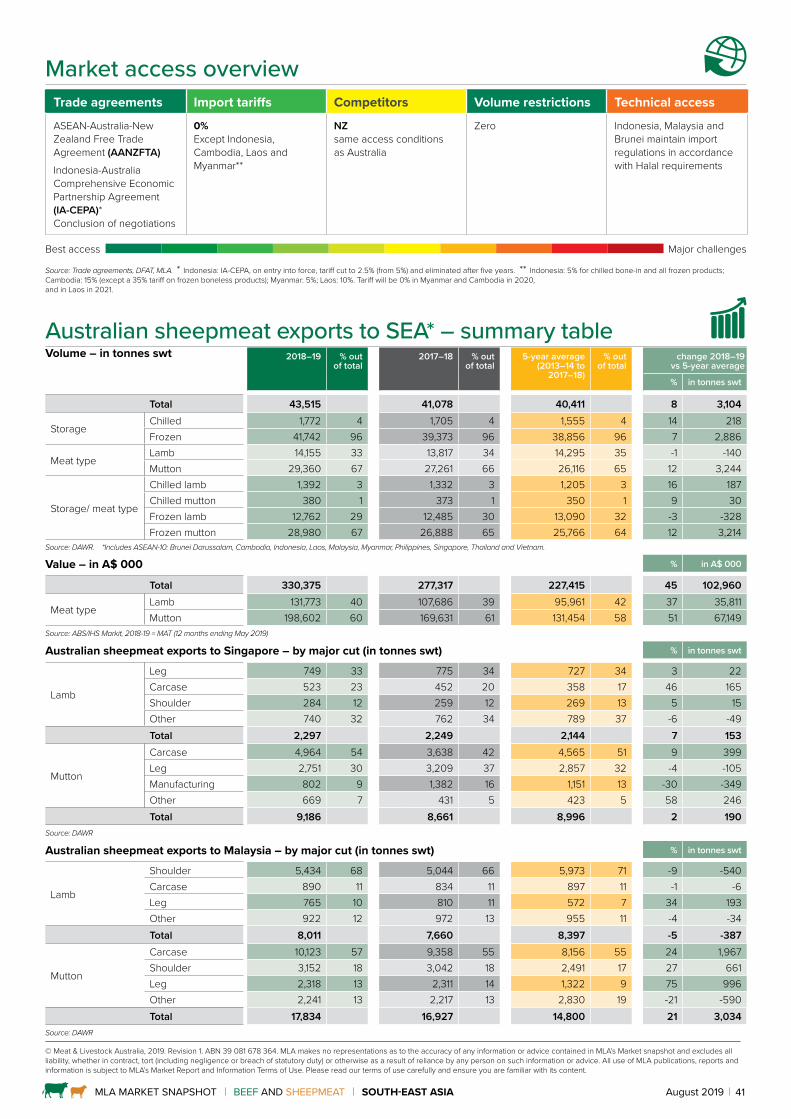
MLA MARKET SNAPSHOT BEEF AND SHEEPMEAT SOUTH-EAST ASIA August 2019 41
© Meat & Livestock Australia, 2019. Revision 1. ABN 39 081 678 364. MLA makes no representations as to the accuracy of any information or advice contained in MLA’s Market snapshot and excludes all liability, whether in contract, tort (including negligence or breach of statutory duty) or otherwise as a result of reliance by any person on such information or advice. All use of MLA publications, reports and information is subject to MLA’s Market Report and Information Terms of Use. Please read our terms of use carefully and ensure you are familiar with its content.
Market access overview Trade agreements Import tariffs Competitors Volume restrictions Technical access
ASEAN-Australia-New Zealand Free Trade Agreement (AANZFTA)
Indonesia-Australia Comprehensive Economic Partnership Agreement(IA-CEPA)*Conclusion of negotiations
0%Except Indonesia, Cambodia, Laos and Myanmar**
NZsame access conditions as Australia
Zero Indonesia, Malaysia and Brunei maintain import regulations in accordance with Halal requirements
Best access Major challenges
Source: Trade agreements, DFAT, MLA. * Indonesia: IA-CEPA, on entry into force, tariff cut to 2.5% (from 5%) and eliminated after five years. ** Indonesia: 5% for chilled bone-in and all frozen products; Cambodia: 15% (except a 35% tariff on frozen boneless products); Myanmar: 5%; Laos: 10%. Tariff will be 0% in Myanmar and Cambodia in 2020, and in Laos in 2021.
Australian sheepmeat exports to SEA* – summary table Volume – in tonnes swt 2018–19 % out
of total2017–18 % out
of total5-year average
(2013–14 to 2017–18)
% out of total
change 2018–19 vs 5-year average
% in tonnes swt
Total 43,515 41,078 40,411 8 3,104
StorageChilled 1,772 4 1,705 4 1,555 4 14 218Frozen 41,742 96 39,373 96 38,856 96 7 2,886
Meat typeLamb 14,155 33 13,817 34 14,295 35 -1 -140Mutton 29,360 67 27,261 66 26,116 65 12 3,244
Storage/ meat type
Chilled lamb 1,392 3 1,332 3 1,205 3 16 187Chilled mutton 380 1 373 1 350 1 9 30Frozen lamb 12,762 29 12,485 30 13,090 32 -3 -328Frozen mutton 28,980 67 26,888 65 25,766 64 12 3,214
Source: DAWR. *Includes ASEAN-10: Brunei Darussalam, Cambodia, Indonesia, Laos, Malaysia, Myanmar, Philippines, Singapore, Thailand and Vietnam.
Value – in A$ 000 % in A$ 000
Total 330,375 277,317 227,415 45 102,960
Meat typeLamb 131,773 40 107,686 39 95,961 42 37 35,811Mutton 198,602 60 169,631 61 131,454 58 51 67,149
Source: ABS/IHS Markit, 2018-19 = MAT (12 months ending May 2019)
Australian sheepmeat exports to Singapore – by major cut (in tonnes swt) % in tonnes swt
Lamb
Leg 749 33 775 34 727 34 3 22Carcase 523 23 452 20 358 17 46 165Shoulder 284 12 259 12 269 13 5 15Other 740 32 762 34 789 37 -6 -49Total 2,297 2,249 2,144 7 153
Mutton
Carcase 4,964 54 3,638 42 4,565 51 9 399Leg 2,751 30 3,209 37 2,857 32 -4 -105Manufacturing 802 9 1,382 16 1,151 13 -30 -349Other 669 7 431 5 423 5 58 246Total 9,186 8,661 8,996 2 190
Source: DAWR
Australian sheepmeat exports to Malaysia – by major cut (in tonnes swt) % in tonnes swt
Lamb
Shoulder 5,434 68 5,044 66 5,973 71 -9 -540Carcase 890 11 834 11 897 11 -1 -6Leg 765 10 810 11 572 7 34 193Other 922 12 972 13 955 11 -4 -34Total 8,011 7,660 8,397 -5 -387
Mutton
Carcase 10,123 57 9,358 55 8,156 55 24 1,967Shoulder 3,152 18 3,042 18 2,491 17 27 661Leg 2,318 13 2,311 14 1,322 9 75 996Other 2,241 13 2,217 13 2,830 19 -21 -590Total 17,834 16,927 14,800 21 3,034
Source: DAWR
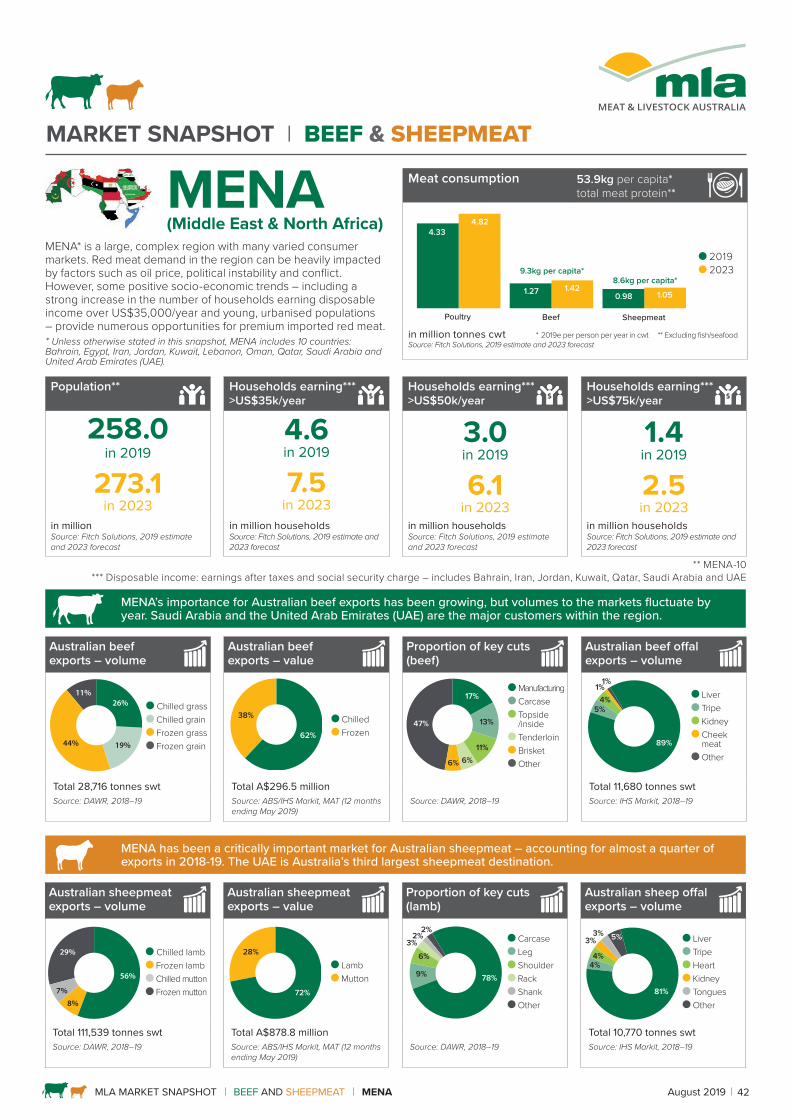
MARKET SNAPSHOT l BEEF & SHEEPMEAT
MLA MARKET SNAPSHOT BEEF AND SHEEPMEAT MENA August 2019 42
MENA* is a large, complex region with many varied consumer markets. Red meat demand in the region can be heavily impacted by factors such as oil price, political instability and conflict. However, some positive socio-economic trends – including a strong increase in the number of households earning disposable income over US$35,000/year and young, urbanised populations – provide numerous opportunities for premium imported red meat.
Population** Households earning*** >US$35k/year
Households earning*** >US$50k/year
Households earning*** >US$75k/year
258.0in 2019
273.1in 2023
4.6in 2019
7.5in 2023
3.0in 2019
6.1in 2023
1.4in 2019
2.5in 2023
in million Source: Fitch Solutions, 2019 estimate and 2023 forecast
in million households Source: Fitch Solutions, 2019 estimate and 2023 forecast
in million households Source: Fitch Solutions, 2019 estimate and 2023 forecast
in million households Source: Fitch Solutions, 2019 estimate and 2023 forecast
** MENA-10 *** Disposable income: earnings after taxes and social security charge – includes Bahrain, Iran, Jordan, Kuwait, Qatar, Saudi Arabia and UAE
MENA’s importance for Australian beef exports has been growing, but volumes to the markets fluctuate by year. Saudi Arabia and the United Arab Emirates (UAE) are the major customers within the region.
MENA has been a critically important market for Australian sheepmeat – accounting for almost a quarter of exports in 2018-19. The UAE is Australia’s third largest sheepmeat destination.
MENA (Middle East & North Africa)
Meat consumption 53.9kg per capita*total meat protein**
4.82
1.27 1.42
1.40
0.98 1.05
Poultry Beef Sheepmeat
9.3kg per capita*
4.33
8.6kg per capita*
2019 2023
in million tonnes cwt * 2019e per person per year in cwt ** Excluding fish/seafoodSource: Fitch Solutions, 2019 estimate and 2023 forecast
Australian beef exports – volume
Australian beef exports – value
Proportion of key cuts (beef)
Australian beef offal exports – volume
26%
19%44%
11%
Chilled grass Chilled grain Frozen grass Frozen grain
62%
38% Chilled Frozen
17%
6%
47%
11%
13%
6%
Manufacturing Carcase Topside /inside Tenderloin Brisket Other
89%
1%
4%5%
1% Liver Tripe Kidney Cheek meat Other
Total 28,716 tonnes swt Total A$296.5 million Total 11,680 tonnes swtSource: DAWR, 2018–19 Source: ABS/IHS Markit, MAT (12 months
ending May 2019)Source: DAWR, 2018–19 Source: IHS Markit, 2018–19
Australian sheepmeat exports – volume
Australian sheepmeat exports – value
Proportion of key cuts (lamb)
Australian sheep offal exports – volume
56%
8%
7%
29% Chilled lamb Frozen lamb Chilled mutton Frozen mutton 72%
28%
Lamb Mutton 78%9%
6%3%
2%2% Carcase
Leg Shoulder Rack Shank Other
81%
3%
4%4%
3% 5% Liver Tripe Heart Kidney Tongues Other
Total 111,539 tonnes swt Total A$878.8 million Total 10,770 tonnes swtSource: DAWR, 2018–19 Source: ABS/IHS Markit, MAT (12 months
ending May 2019)Source: DAWR, 2018–19 Source: IHS Markit, 2018–19
* Unless otherwise stated in this snapshot, MENA includes 10 countries: Bahrain, Egypt, Iran, Jordan, Kuwait, Lebanon, Oman, Qatar, Saudi Arabia and United Arab Emirates (UAE).

MLA MARKET SNAPSHOT BEEF AND SHEEPMEAT MENA August 2019 43
CONSUMERS• In most MENA diets, beef is generally a secondary protein after
chicken and fish, mainly due to the lower grade, ex-dairyindustry beef product traditionally available locally. As such,beef has been known as a versatile but somewhat genericprotein.
• MENA consumers have traditionally preferred leaner meat.However, consumption and spending on beef is forecast toincrease across almost all MENA markets in the next severalyears as more affluent consumers come to appreciate thebenefits of premium quality beef.
• Growing demand is driven by several factors, includingincreasing disposable incomes, ongoing urbanisation andwesternisation, sizable wealthy expat populations and growth inthe number of international tourist visitors.Beef sales per capita (US$/person/year)
0 50 100 150 200 250 300
QatarIran
OmanBahrain
EgyptSaudi Arabia
The UAEKuwait
Lebanon
2019f 2023fSource: Fitch Solutions. Based on annual household spending on beef for domestic consumption, all channels.
FOODSERVICE • A significant proportion of Australian frozen grassfed beef
exports to MENA is in the form of trimmings, hamburger pattiesand ground beef, which are used in the foodservice sector inboth local and western-style chains.
• Dining out is an important part of social and business life in theregion, where other leisure options are often more limited.
• As the western-style foodservice sector matures, quick servicerestaurants are being complemented by more casual stylerestaurants where consumers demand a higher quality beefproduct.
• Affluent locals enjoy a mix of cuisines when eating out, fromlocal and other Middle Eastern cuisines, to Japanese, Chineseand western-style cuisines such as European and NorthAmerican.
Australian chilled beef exports to the UAE, Bahrain, Qatar,Kuwait and Oman (combined)
Chilled grassfed Chilled GrainfedSource: DAWR
01
234567
89
‘000
tonn
es s
wt
2007
2008
2009
2010 20
1120
1220
1320
1420
1520
1620
1820
17
• Australian exports of chilled and grainfed beef products,including loin cuts, have seen significant growth over the pastdecade, particularly to some of the Gulf countries with higherconcentrations of western-style fine dining restaurantsassociated with five-star hotels and international tourism.
Number of 4 and 5-star hotels in the city (2020f)
Source: MLA MENA Attractive Cities Study, 2018
• Dubai’s hosting of the World Expo in 2020 and Qatar’s hostingof the 2022 FIFA World Cup are expected to be drivers offurther growth in demand for quality beef products in both thefine dining and fast casual sectors in the coming years.
• Home delivery food services have seen rapid growth, drivenby young, affluent populations with high mobile broadband-connected smartphone penetration rates. In Dubai and KuwaitCity, just over a third of consumers order meals for homedelivery at least weekly, and around a quarter in Riyadh andDoha do so (Source: MLA MENA Attractive Cities Study, 2018).
0 50 100 150 200 250 300Tel AvivJeddah
CairoAbu Dhabi
DohaBeirut
RiyadhMarrakesh
DubaiIstanbul
Beef
• After domestic beef, Australian beef generally has among thehighest consumer awareness compared to other suppliers.While domestic product tends to rate highest on importantattributes such as freshness, Halal-certified and safety,Australian beef is seen as offering advantages in other areassuch as consistency of high quality standards, good taste, avariety of cuts to suit different cooking styles and high animalwelfare standards.
• Across the region, cheaper beef cuts are used for stewing andslow cooking, as well as grilling of cubes in the form of kebabs.Mince is used in burgers, kofta/meatballs and as a filling forpastries.
• Grilling of prime cuts is gaining popularity, as western influenceshave started to appear in the meal repertoires of wealthierconsumers.
Grilled beef kebabs, a popular regional beef dish
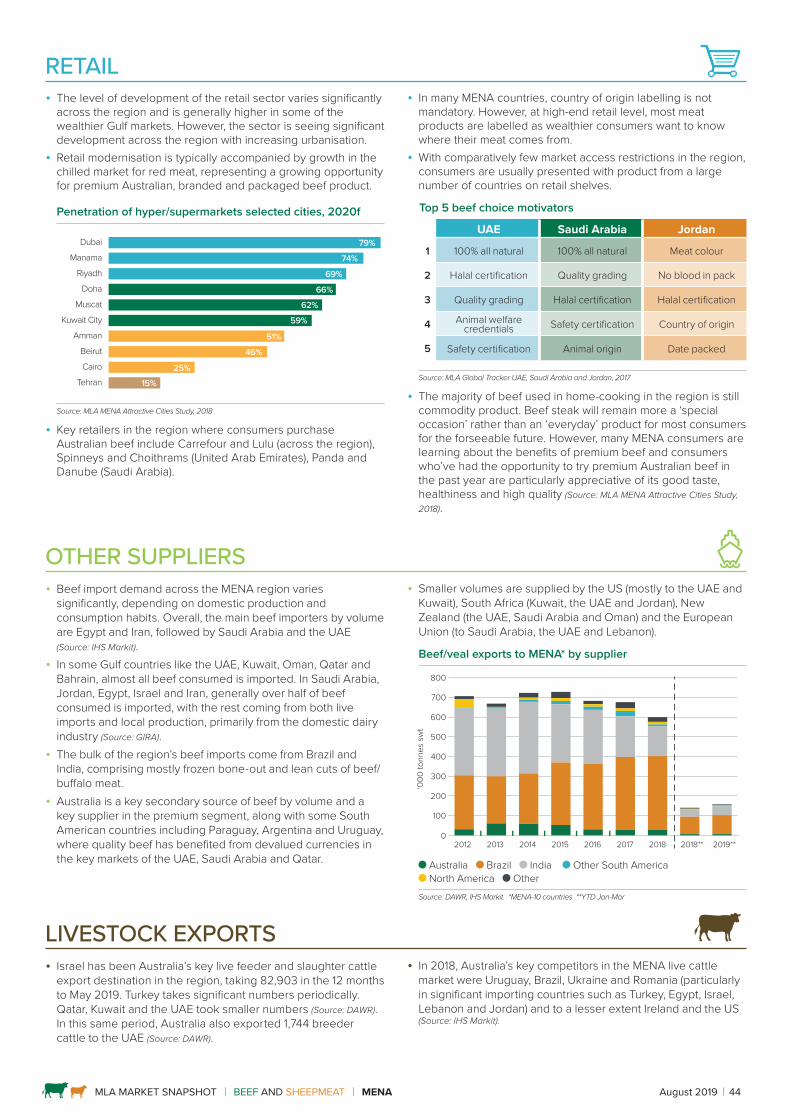
MLA MARKET SNAPSHOT BEEF AND SHEEPMEAT MENA August 2019 44
RETAIL • The level of development of the retail sector varies significantly
across the region and is generally higher in some of the wealthier Gulf markets. However, the sector is seeing significant development across the region with increasing urbanisation.
• Retail modernisation is typically accompanied by growth in the chilled market for red meat, representing a growing opportunity for premium Australian, branded and packaged beef product.
Penetration of hyper/supermarkets selected cities, 2020f
Tehran
Cairo
Beirut
Amman
Kuwait City
Muscat
Doha
Riyadh
Manama
Dubai 79%
74%71%69%
62%
59%
51%50%46%
66%
25%
15%
Source: MLA MENA Attractive Cities Study, 2018
• Key retailers in the region where consumers purchase Australian beef include Carrefour and Lulu (across the region), Spinneys and Choithrams (United Arab Emirates), Panda and Danube (Saudi Arabia).
OTHER SUPPLIERS • Beef import demand across the MENA region varies
significantly, depending on domestic production and consumption habits. Overall, the main beef importers by volume are Egypt and Iran, followed by Saudi Arabia and the UAE (Source: IHS Markit).
• In some Gulf countries like the UAE, Kuwait, Oman, Qatar and Bahrain, almost all beef consumed is imported. In Saudi Arabia, Jordan, Egypt, Israel and Iran, generally over half of beef consumed is imported, with the rest coming from both live imports and local production, primarily from the domestic dairy industry (Source: GIRA).
• The bulk of the region’s beef imports come from Brazil and India, comprising mostly frozen bone-out and lean cuts of beef/buffalo meat.
• Australia is a key secondary source of beef by volume and a key supplier in the premium segment, along with some South American countries including Paraguay, Argentina and Uruguay, where quality beef has benefited from devalued currencies in the key markets of the UAE, Saudi Arabia and Qatar.
• Smaller volumes are supplied by the US (mostly to the UAE and Kuwait), South Africa (Kuwait, the UAE and Jordan), New Zealand (the UAE, Saudi Arabia and Oman) and the European Union (to Saudi Arabia, the UAE and Lebanon).
Beef/veal exports to MENA* by supplier
Australia Brazil India Other South America North America Other
Source: DAWR, IHS Markit. *MENA-10 countries **YTD Jan-Mar
‘000
tonn
es s
wt
0
100
200
300
400
500
600
700
800
2014 2015 2016 2017 2018 2018** 2019**2012 2013
• In many MENA countries, country of origin labelling is not mandatory. However, at high-end retail level, most meat products are labelled as wealthier consumers want to know where their meat comes from.
• With comparatively few market access restrictions in the region, consumers are usually presented with product from a large number of countries on retail shelves.
Top 5 beef choice motivators
UAE Saudi Arabia Jordan
1 100% all natural 100% all natural Meat colour
2 Halal certification Quality grading No blood in pack
3 Quality grading Halal certification Halal certification
4 Animal welfare credentials Safety certification Country of origin
5 Safety certification Animal origin Date packed
Source: MLA Global Tracker UAE, Saudi Arabia and Jordan, 2017
• The majority of beef used in home-cooking in the region is still commodity product. Beef steak will remain more a ‘special occasion’ rather than an ‘everyday’ product for most consumers for the forseeable future. However, many MENA consumers are learning about the benefits of premium beef and consumers who’ve had the opportunity to try premium Australian beef in the past year are particularly appreciative of its good taste, healthiness and high quality (Source: MLA MENA Attractive Cities Study, 2018).
LIVESTOCK EXPORTS • Israel has been Australia’s key live feeder and slaughter cattle
export destination in the region, taking 82,903 in the 12 months to May 2019. Turkey takes significant numbers periodically. Qatar, Kuwait and the UAE took smaller numbers (Source: DAWR). In this same period, Australia also exported 1,744 breeder cattle to the UAE (Source: DAWR).
• In 2018, Australia’s key competitors in the MENA live cattle market were Uruguay, Brazil, Ukraine and Romania (particularly in significant importing countries such as Turkey, Egypt, Israel, Lebanon and Jordan) and to a lesser extent Ireland and the US (Source: IHS Markit).
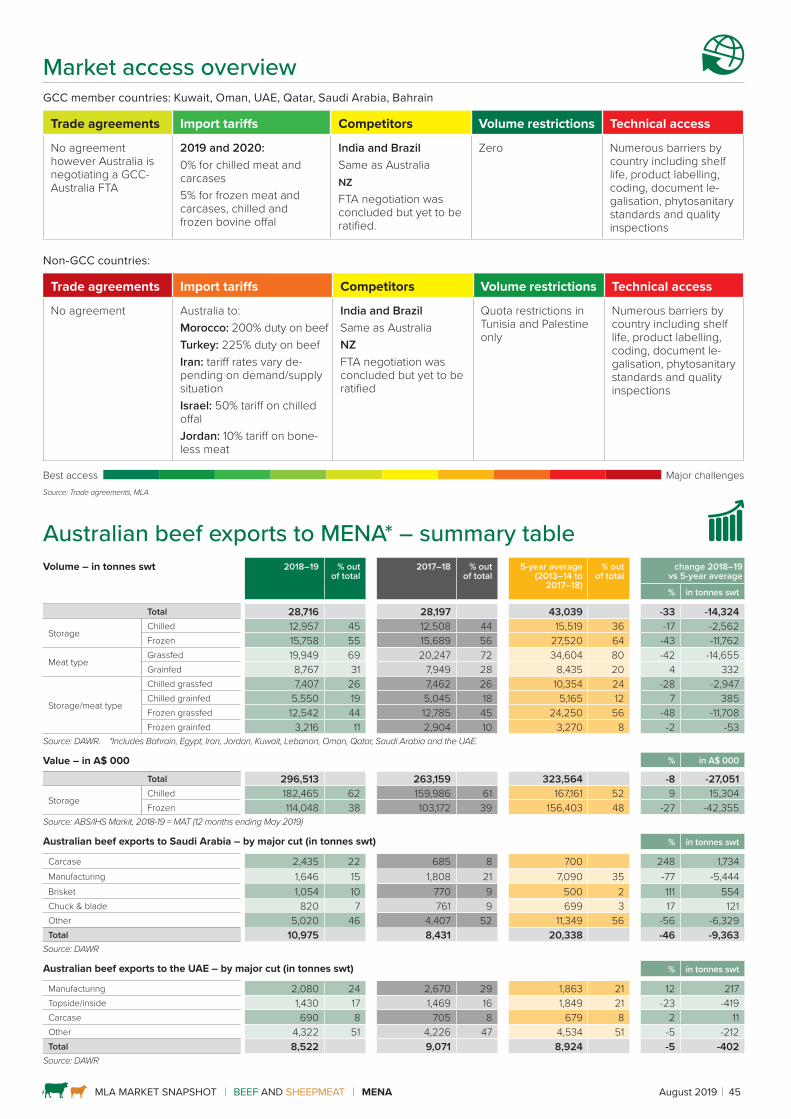
MLA MARKET SNAPSHOT BEEF AND SHEEPMEAT MENA August 2019 45
Market access overview GCC member countries: Kuwait, Oman, UAE, Qatar, Saudi Arabia, Bahrain
Trade agreements Import tariffs Competitors Volume restrictions Technical access
No agreement however Australia is negotiating a GCC- Australia FTA
2019 and 2020:0% for chilled meat and carcases 5% for frozen meat and carcases, chilled and frozen bovine offal
India and BrazilSame as AustraliaNZFTA negotiation was concluded but yet to be ratified.
Zero Numerous barriers by country including shelf life, product labelling, coding, document le-galisation, phytosanitary standards and quality inspections
Non-GCC countries:
Trade agreements Import tariffs Competitors Volume restrictions Technical access
No agreement Australia to:Morocco: 200% duty on beefTurkey: 225% duty on beefIran: tariff rates vary de-pending on demand/supply situationIsrael: 50% tariff on chilled offalJordan: 10% tariff on bone-less meat
India and BrazilSame as AustraliaNZFTA negotiation was concluded but yet to be ratified
Quota restrictions in Tunisia and Palestine only
Numerous barriers by country including shelf life, product labelling, coding, document le-galisation, phytosanitary standards and quality inspections
Best access Major challengesSource: Trade agreements, MLA
Australian beef exports to MENA* – summary table Volume – in tonnes swt 2018–19 % out
of total2017–18 % out
of total5-year average
(2013–14 to 2017–18)
% out of total
change 2018–19 vs 5-year average
% in tonnes swt
Total 28,716 28,197 43,039 -33 -14,324
StorageChilled 12,957 45 12,508 44 15,519 36 -17 -2,562 Frozen 15,758 55 15,689 56 27,520 64 -43 -11,762
Meat typeGrassfed 19,949 69 20,247 72 34,604 80 -42 -14,655 Grainfed 8,767 31 7,949 28 8,435 20 4 332
Storage/meat type
Chilled grassfed 7,407 26 7,462 26 10,354 24 -28 -2,947 Chilled grainfed 5,550 19 5,045 18 5,165 12 7 385 Frozen grassfed 12,542 44 12,785 45 24,250 56 -48 -11,708 Frozen grainfed 3,216 11 2,904 10 3,270 8 -2 -53
Source: DAWR. *Includes Bahrain, Egypt, Iran, Jordan, Kuwait, Lebanon, Oman, Qatar, Saudi Arabia and the UAE.
Value – in A$ 000 % in A$ 000
Total 296,513 263,159 323,564 -8 -27,051
StorageChilled 182,465 62 159,986 61 167,161 52 9 15,304 Frozen 114,048 38 103,172 39 156,403 48 -27 -42,355
Source: ABS/IHS Markit, 2018-19 = MAT (12 months ending May 2019)
Australian beef exports to Saudi Arabia – by major cut (in tonnes swt) % in tonnes swt
Carcase 2,435 22 685 8 700 248 1,734 Manufacturing 1,646 15 1,808 21 7,090 35 -77 -5,444Brisket 1,054 10 770 9 500 2 111 554 Chuck & blade 820 7 761 9 699 3 17 121 Other 5,020 46 4,407 52 11,349 56 -56 -6,329 Total 10,975 8,431 20,338 -46 -9,363
Source: DAWR
Australian beef exports to the UAE – by major cut (in tonnes swt) % in tonnes swt
Manufacturing 2,080 24 2,670 29 1,863 21 12 217 Topside/inside 1,430 17 1,469 16 1,849 21 -23 -419 Carcase 690 8 705 8 679 8 2 11 Other 4,322 51 4,226 47 4,534 51 -5 -212 Total 8,522 9,071 8,924 -5 -402
Source: DAWR
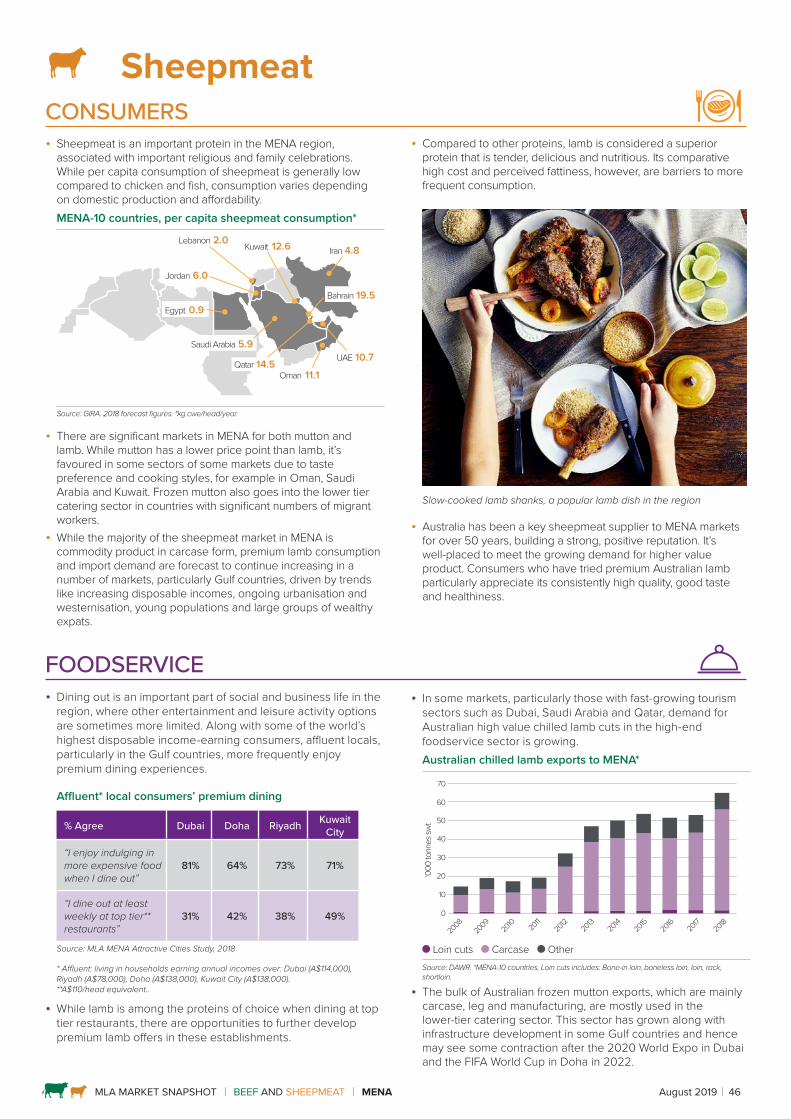
MLA MARKET SNAPSHOT BEEF AND SHEEPMEAT MENA August 2019 46
SheepmeatCONSUMERS
• Sheepmeat is an important protein in the MENA region, associated with important religious and family celebrations. While per capita consumption of sheepmeat is generally low compared to chicken and fish, consumption varies depending on domestic production and affordability. MENA-10 countries, per capita sheepmeat consumption*
Source: GIRA. 2018 forecast figures. *kg cwe/head/year.
• There are significant markets in MENA for both mutton and lamb. While mutton has a lower price point than lamb, it’s favoured in some sectors of some markets due to taste preference and cooking styles, for example in Oman, Saudi Arabia and Kuwait. Frozen mutton also goes into the lower tier catering sector in countries with significant numbers of migrant workers.
• While the majority of the sheepmeat market in MENA is commodity product in carcase form, premium lamb consumption and import demand are forecast to continue increasing in a number of markets, particularly Gulf countries, driven by trends like increasing disposable incomes, ongoing urbanisation and westernisation, young populations and large groups of wealthy expats.
UAE 10.7
Lebanon 2.0
Bahrain 19.5
Saudi Arabia 5.9
Oman 11.1Qatar 14.5
Egypt 0.9
Jordan 6.0
Iran 4.8Kuwait 12.6
FOODSERVICE • Dining out is an important part of social and business life in the
region, where other entertainment and leisure activity options are sometimes more limited. Along with some of the world’s highest disposable income-earning consumers, affluent locals, particularly in the Gulf countries, more frequently enjoy premium dining experiences.
Affluent* local consumers’ premium dining
% Agree Dubai Doha Riyadh Kuwait City
“I enjoy indulging in more expensive food when I dine out”
81% 64% 73% 71%
“I dine out at least weekly at top tier** restaurants”
31% 42% 38% 49%
Source: MLA MENA Attractive Cities Study, 2018
* Affluent: living in households earning annual incomes over: Dubai (A$114,000), Riyadh (A$78,000), Doha (A$138,000), Kuwait City (A$138,000). **A$110/head equivalent..
• While lamb is among the proteins of choice when dining at top tier restaurants, there are opportunities to further develop premium lamb offers in these establishments.
• Compared to other proteins, lamb is considered a superior protein that is tender, delicious and nutritious. Its comparative high cost and perceived fattiness, however, are barriers to more frequent consumption.
Slow-cooked lamb shanks, a popular lamb dish in the region
• Australia has been a key sheepmeat supplier to MENA markets for over 50 years, building a strong, positive reputation. It’s well-placed to meet the growing demand for higher value product. Consumers who have tried premium Australian lamb particularly appreciate its consistently high quality, good taste and healthiness.
• In some markets, particularly those with fast-growing tourism sectors such as Dubai, Saudi Arabia and Qatar, demand for Australian high value chilled lamb cuts in the high-end foodservice sector is growing.Australian chilled lamb exports to MENA*
Loin cuts Carcase OtherSource: DAWR. *MENA-10 countries, Loin cuts includes: Bone-in loin, boneless loin, loin, rack, shortloin.
• The bulk of Australian frozen mutton exports, which are mainly carcase, leg and manufacturing, are mostly used in the lower-tier catering sector. This sector has grown along with infrastructure development in some Gulf countries and hence may see some contraction after the 2020 World Expo in Dubai and the FIFA World Cup in Doha in 2022.
0
10
20
30
40
50
60
70
‘000
tonn
es sw
t
2008
2009
2010 20
1120
1220
1320
1420
1520
1620
1820
17
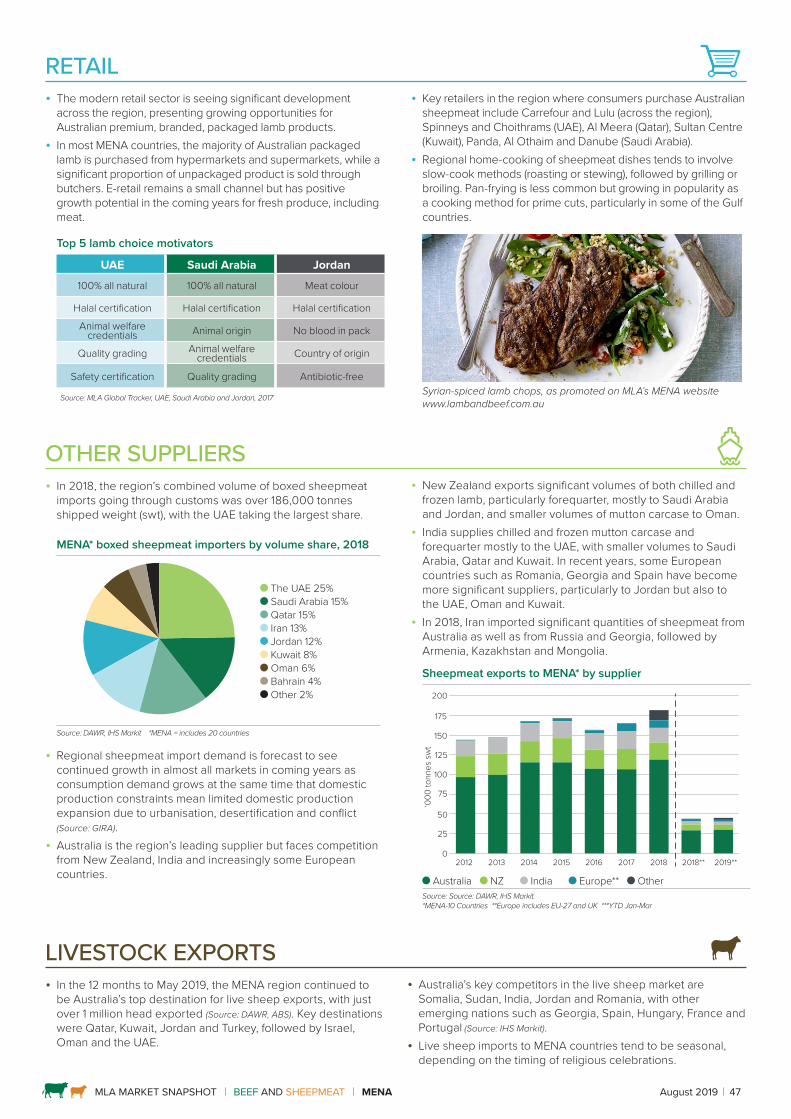
MLA MARKET SNAPSHOT BEEF AND SHEEPMEAT MENA August 2019 47
RETAIL • The modern retail sector is seeing significant development
across the region, presenting growing opportunities for Australian premium, branded, packaged lamb products.
• In most MENA countries, the majority of Australian packaged lamb is purchased from hypermarkets and supermarkets, while a significant proportion of unpackaged product is sold through butchers. E-retail remains a small channel but has positive growth potential in the coming years for fresh produce, including meat.
Top 5 lamb choice motivators
UAE Saudi Arabia Jordan
100% all natural 100% all natural Meat colour
Halal certification Halal certification Halal certification
Animal welfare credentials Animal origin No blood in pack
Quality grading Animal welfare credentials Country of origin
Safety certification Quality grading Antibiotic-free
Source: MLA Global Tracker, UAE, Saudi Arabia and Jordan, 2017
OTHER SUPPLIERS • In 2018, the region’s combined volume of boxed sheepmeat
imports going through customs was over 186,000 tonnes shipped weight (swt), with the UAE taking the largest share.
MENA* boxed sheepmeat importers by volume share, 2018
The UAE 25% Saudi Arabia 15% Qatar 15% Iran 13% Jordan 12% Kuwait 8% Oman 6% Bahrain 4% Other 2%
Source: DAWR, IHS Markit *MENA = includes 20 countries
• Regional sheepmeat import demand is forecast to see continued growth in almost all markets in coming years as consumption demand grows at the same time that domestic production constraints mean limited domestic production expansion due to urbanisation, desertification and conflict (Source: GIRA).
• Australia is the region’s leading supplier but faces competition from New Zealand, India and increasingly some European countries.
• Key retailers in the region where consumers purchase Australian sheepmeat include Carrefour and Lulu (across the region), Spinneys and Choithrams (UAE), Al Meera (Qatar), Sultan Centre (Kuwait), Panda, Al Othaim and Danube (Saudi Arabia).
• Regional home-cooking of sheepmeat dishes tends to involve slow-cook methods (roasting or stewing), followed by grilling or broiling. Pan-frying is less common but growing in popularity as a cooking method for prime cuts, particularly in some of the Gulf countries.
Syrian-spiced lamb chops, as promoted on MLA’s MENA website www.lambandbeef.com.au
• New Zealand exports significant volumes of both chilled and frozen lamb, particularly forequarter, mostly to Saudi Arabia and Jordan, and smaller volumes of mutton carcase to Oman.
• India supplies chilled and frozen mutton carcase and forequarter mostly to the UAE, with smaller volumes to Saudi Arabia, Qatar and Kuwait. In recent years, some European countries such as Romania, Georgia and Spain have become more significant suppliers, particularly to Jordan but also to the UAE, Oman and Kuwait.
• In 2018, Iran imported significant quantities of sheepmeat from Australia as well as from Russia and Georgia, followed by Armenia, Kazakhstan and Mongolia.
Sheepmeat exports to MENA* by supplier
Australia NZ India Europe** Other Source: Source: DAWR, IHS Markit.*MENA-10 Countries **Europe includes EU-27 and UK ***YTD Jan-Mar
‘000
tonn
es s
wt
0
50
100
150
200
2014 2015 2016 2017 2018 2018** 2019**2012 2013
25
75
125
175
LIVESTOCK EXPORTS • In the 12 months to May 2019, the MENA region continued to
be Australia’s top destination for live sheep exports, with just over 1 million head exported (Source: DAWR, ABS). Key destinations were Qatar, Kuwait, Jordan and Turkey, followed by Israel, Oman and the UAE.
• Australia’s key competitors in the live sheep market are Somalia, Sudan, India, Jordan and Romania, with other emerging nations such as Georgia, Spain, Hungary, France and Portugal (Source: IHS Markit).
• Live sheep imports to MENA countries tend to be seasonal, depending on the timing of religious celebrations.
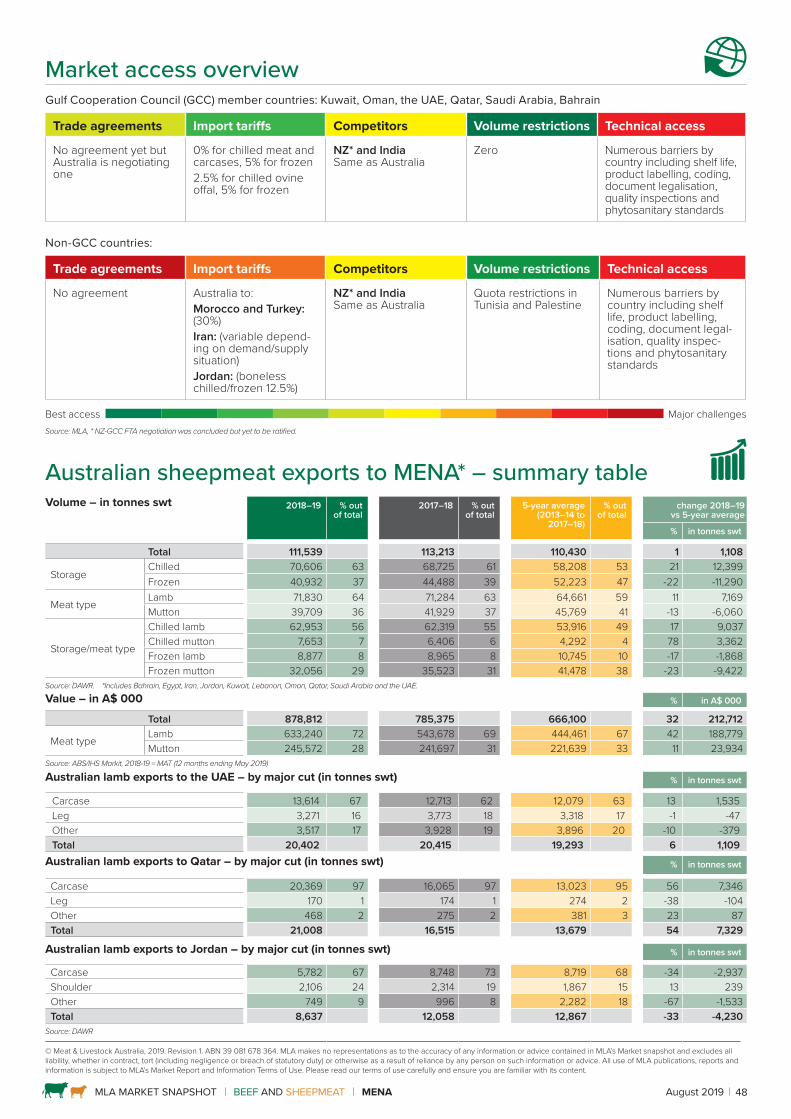
MLA MARKET SNAPSHOT BEEF AND SHEEPMEAT MENA August 2019 48
© Meat & Livestock Australia, 2019. Revision 1. ABN 39 081 678 364. MLA makes no representations as to the accuracy of any information or advice contained in MLA’s Market snapshot and excludes all liability, whether in contract, tort (including negligence or breach of statutory duty) or otherwise as a result of reliance by any person on such information or advice. All use of MLA publications, reports and information is subject to MLA’s Market Report and Information Terms of Use. Please read our terms of use carefully and ensure you are familiar with its content.
Market access overview Gulf Cooperation Council (GCC) member countries: Kuwait, Oman, the UAE, Qatar, Saudi Arabia, Bahrain
Trade agreements Import tariffs Competitors Volume restrictions Technical access
No agreement yet but Australia is negotiating one
0% for chilled meat and carcases, 5% for frozen2.5% for chilled ovine offal, 5% for frozen
NZ* and India Same as Australia
Zero Numerous barriers by country including shelf life, product labelling, coding, document legalisation, quality inspections and phytosanitary standards
Non-GCC countries:
Trade agreements Import tariffs Competitors Volume restrictions Technical access
No agreement Australia to:Morocco and Turkey: (30%) Iran: (variable depend-ing on demand/supply situation)Jordan: (boneless chilled/frozen 12.5%)
NZ* and India Same as Australia
Quota restrictions in Tunisia and Palestine
Numerous barriers by country including shelf life, product labelling, coding, document legal-isation, quality inspec-tions and phytosanitary standards
Best access Major challengesSource: MLA, * NZ-GCC FTA negotiation was concluded but yet to be ratified.
Australian sheepmeat exports to MENA* – summary table Volume – in tonnes swt 2018–19 % out
of total2017–18 % out
of total5-year average
(2013–14 to 2017–18)
% out of total
change 2018–19 vs 5-year average
% in tonnes swt
Total 111,539 113,213 110,430 1 1,108
StorageChilled 70,606 63 68,725 61 58,208 53 21 12,399 Frozen 40,932 37 44,488 39 52,223 47 -22 -11,290
Meat typeLamb 71,830 64 71,284 63 64,661 59 11 7,169 Mutton 39,709 36 41,929 37 45,769 41 -13 -6,060
Storage/meat type
Chilled lamb 62,953 56 62,319 55 53,916 49 17 9,037 Chilled mutton 7,653 7 6,406 6 4,292 4 78 3,362 Frozen lamb 8,877 8 8,965 8 10,745 10 -17 -1,868Frozen mutton 32,056 29 35,523 31 41,478 38 -23 -9,422
Source: DAWR. *Includes Bahrain, Egypt, Iran, Jordan, Kuwait, Lebanon, Oman, Qatar, Saudi Arabia and the UAE.
Value – in A$ 000 % in A$ 000
Total 878,812 785,375 666,100 32 212,712
Meat typeLamb 633,240 72 543,678 69 444,461 67 42 188,779 Mutton 245,572 28 241,697 31 221,639 33 11 23,934
Source: ABS/IHS Markit, 2018-19 = MAT (12 months ending May 2019)
Australian lamb exports to the UAE – by major cut (in tonnes swt) % in tonnes swt
Carcase 13,614 67 12,713 62 12,079 63 13 1,535 Leg 3,271 16 3,773 18 3,318 17 -1 -47Other 3,517 17 3,928 19 3,896 20 -10 -379Total 20,402 20,415 19,293 6 1,109
Australian lamb exports to Qatar – by major cut (in tonnes swt) % in tonnes swt
Carcase 20,369 97 16,065 97 13,023 95 56 7,346 Leg 170 1 174 1 274 2 -38 -104Other 468 2 275 2 381 3 23 87 Total 21,008 16,515 13,679 54 7,329
Australian lamb exports to Jordan – by major cut (in tonnes swt) % in tonnes swt
Carcase 5,782 67 8,748 73 8,719 68 -34 -2,937Shoulder 2,106 24 2,314 19 1,867 15 13 239 Other 749 9 996 8 2,282 18 -67 -1,533Total 8,637 12,058 12,867 -33 -4,230
Source: DAWR
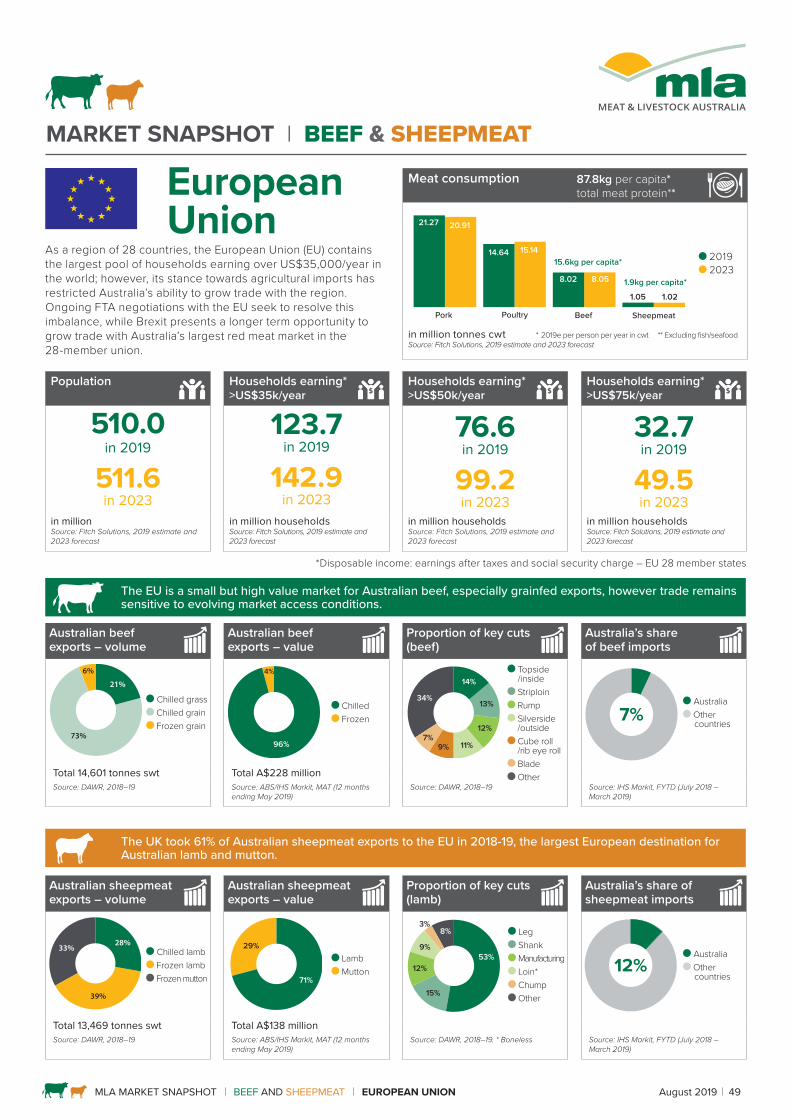
MARKET SNAPSHOT l BEEF & SHEEPMEAT
MLA MARKET SNAPSHOT BEEF AND SHEEPMEAT EUROPEAN UNION August 2019 49
As a region of 28 countries, the European Union (EU) contains the largest pool of households earning over US$35,000/year in the world; however, its stance towards agricultural imports has restricted Australia’s ability to grow trade with the region. Ongoing FTA negotiations with the EU seek to resolve this imbalance, while Brexit presents a longer term opportunity to grow trade with Australia’s largest red meat market in the 28-member union.
Population Households earning* >US$35k/year
Households earning* >US$50k/year
Households earning* >US$75k/year
510.0 in 2019
511.6in 2023
123.7in 2019
142.9in 2023
76.6 in 2019
99.2in 2023
32.7in 2019
49.5in 2023
in million Source: Fitch Solutions, 2019 estimate and 2023 forecast
in million households Source: Fitch Solutions, 2019 estimate and 2023 forecast
in million households Source: Fitch Solutions, 2019 estimate and 2023 forecast
in million households Source: Fitch Solutions, 2019 estimate and 2023 forecast
*Disposable income: earnings after taxes and social security charge – EU 28 member states
The EU is a small but high value market for Australian beef, especially grainfed exports, however trade remains sensitive to evolving market access conditions.
The UK took 61% of Australian sheepmeat exports to the EU in 2018-19, the largest European destination for Australian lamb and mutton.
European Union
Meat consumption 87.8kg per capita*total meat protein**
Pork
21.27 20.91
14.64 15.14
8.02 8.05
1.05 1.02
Poultry Beef Sheepmeat
15.6kg per capita*
1.9kg per capita*
2019 2023
in million tonnes cwt * 2019e per person per year in cwt ** Excluding fish/seafood Source: Fitch Solutions, 2019 estimate and 2023 forecast
Australian beef exports – volume
Australian beef exports – value
Proportion of key cuts (beef)
Australia’s share of beef imports
21%
73%
6%
Chilled grass Chilled grain Frozen grain
96%
4%
Chilled Frozen
14%
7%
34%
12%
13%
11%9%
Topside /inside
Striploin Rump Silverside /outside Cube roll /rib eye roll Blade Other
7% Australia Other
countries
Total 14,601 tonnes swt Total A$228 millionSource: DAWR, 2018–19 Source: ABS/IHS Markit, MAT (12 months
ending May 2019)Source: DAWR, 2018–19 Source: IHS Markit, FYTD (July 2018 –
March 2019)
Australian sheepmeat exports – volume
Australian sheepmeat exports – value
Proportion of key cuts (lamb)
Australia’s share of sheepmeat imports
28%
39%
33% Chilled lamb Frozen lamb Frozen mutton 71%
29% Lamb Mutton
53%9%
8%
12%
15%
3% Leg Shank Manufacturing Loin* Chump Other
12% Australia Other
countries
Total 13,469 tonnes swt Total A$138 millionSource: DAWR, 2018–19 Source: ABS/IHS Markit, MAT (12 months
ending May 2019)Source: DAWR, 2018–19. * Boneless Source: IHS Markit, FYTD (July 2018 –
March 2019)
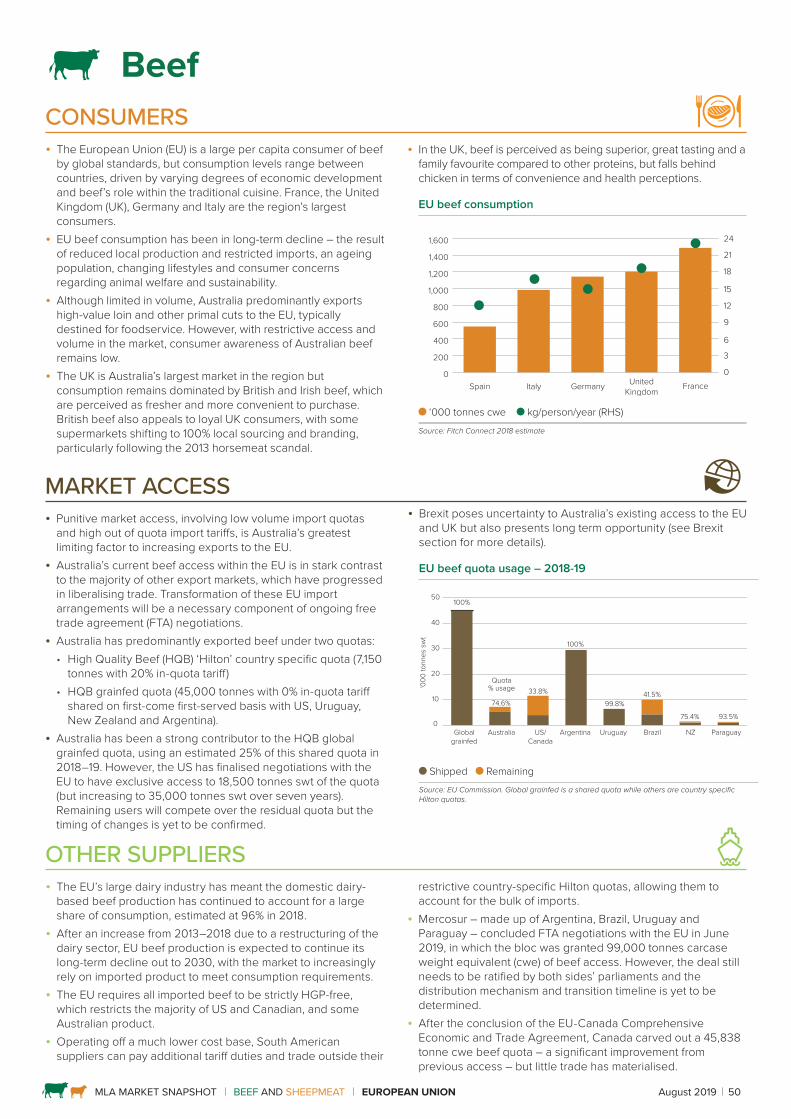
MLA MARKET SNAPSHOT BEEF AND SHEEPMEAT EUROPEAN UNION August 2019 50
CONSUMERS
• The European Union (EU) is a large per capita consumer of beef by global standards, but consumption levels range between countries, driven by varying degrees of economic development and beef’s role within the traditional cuisine. France, the United Kingdom (UK), Germany and Italy are the region’s largest consumers.
• EU beef consumption has been in long-term decline – the result of reduced local production and restricted imports, an ageing population, changing lifestyles and consumer concerns regarding animal welfare and sustainability.
• Although limited in volume, Australia predominantly exports high-value loin and other primal cuts to the EU, typically destined for foodservice. However, with restrictive access and volume in the market, consumer awareness of Australian beef remains low.
• The UK is Australia’s largest market in the region but consumption remains dominated by British and Irish beef, which are perceived as fresher and more convenient to purchase. British beef also appeals to loyal UK consumers, with some supermarkets shifting to 100% local sourcing and branding, particularly following the 2013 horsemeat scandal.
MARKET ACCESS • Punitive market access, involving low volume import quotas
and high out of quota import tariffs, is Australia’s greatest limiting factor to increasing exports to the EU.
• Australia’s current beef access within the EU is in stark contrast to the majority of other export markets, which have progressed in liberalising trade. Transformation of these EU import arrangements will be a necessary component of ongoing free trade agreement (FTA) negotiations.
• Australia has predominantly exported beef under two quotas: • High Quality Beef (HQB) ‘Hilton’ country specific quota (7,150
tonnes with 20% in-quota tariff)• HQB grainfed quota (45,000 tonnes with 0% in-quota tariff
shared on first-come first-served basis with US, Uruguay, New Zealand and Argentina).
• Australia has been a strong contributor to the HQB global grainfed quota, using an estimated 25% of this shared quota in 2018–19. However, the US has finalised negotiations with the EU to have exclusive access to 18,500 tonnes swt of the quota (but increasing to 35,000 tonnes swt over seven years). Remaining users will compete over the residual quota but the timing of changes is yet to be confirmed.
• Brexit poses uncertainty to Australia’s existing access to the EU and UK but also presents long term opportunity (see Brexit section for more details).
EU beef quota usage – 2018-19
Globalgrainfed
Australia Uruguay Brazil NZUS/Canada
Paraguay0
10
20
30
40
50
‘000
tonn
es s
wt
74.6%
100%
33.8%
99.8%
93.5%
100%
41.5%
Argentina
75.4%
Quota% usage
Shipped Remaining Source: EU Commission. Global grainfed is a shared quota while others are country specific Hilton quotas.
Beef
• In the UK, beef is perceived as being superior, great tasting and a family favourite compared to other proteins, but falls behind chicken in terms of convenience and health perceptions.
EU beef consumption
FranceGermanyItalySpain UnitedKingdom
0
200
400
600
800
1,000
1,200
1,400
1,600
0
24
12
9
6
3
21
18
15
‘000 tonnes cwe kg/person/year (RHS)
Source: Fitch Connect 2018 estimate
OTHER SUPPLIERS • The EU’s large dairy industry has meant the domestic dairy-
based beef production has continued to account for a large share of consumption, estimated at 96% in 2018.
• After an increase from 2013–2018 due to a restructuring of the dairy sector, EU beef production is expected to continue its long-term decline out to 2030, with the market to increasingly rely on imported product to meet consumption requirements.
• The EU requires all imported beef to be strictly HGP-free, which restricts the majority of US and Canadian, and some Australian product.
• Operating off a much lower cost base, South American suppliers can pay additional tariff duties and trade outside their
restrictive country-specific Hilton quotas, allowing them to account for the bulk of imports.
• Mercosur – made up of Argentina, Brazil, Uruguay and Paraguay – concluded FTA negotiations with the EU in June 2019, in which the bloc was granted 99,000 tonnes carcase weight equivalent (cwe) of beef access. However, the deal still needs to be ratified by both sides’ parliaments and the distribution mechanism and transition timeline is yet to be determined.
• After the conclusion of the EU-Canada Comprehensive Economic and Trade Agreement, Canada carved out a 45,838 tonne cwe beef quota – a significant improvement from previous access – but little trade has materialised.
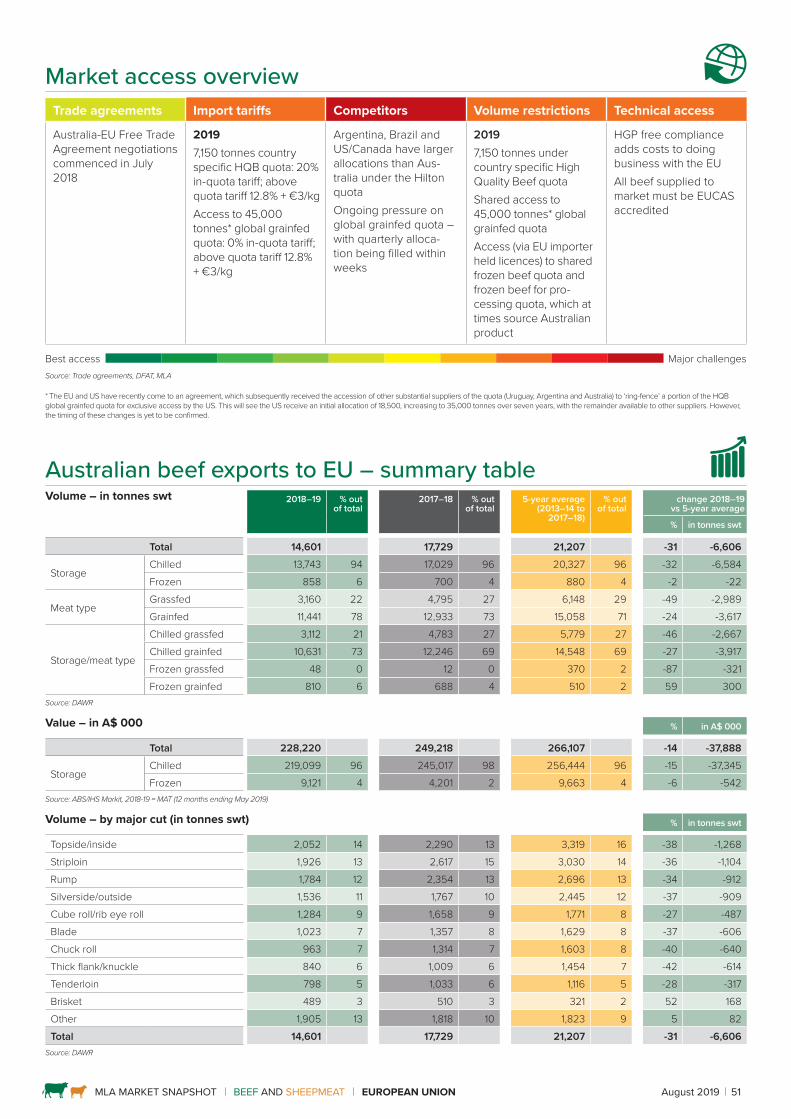
MLA MARKET SNAPSHOT BEEF AND SHEEPMEAT EUROPEAN UNION August 2019 51
Market access overview Trade agreements Import tariffs Competitors Volume restrictions Technical access
Australia-EU Free Trade Agreement negotiations commenced in July 2018
20197,150 tonnes country specific HQB quota: 20% in-quota tariff; above quota tariff 12.8% + €3/kgAccess to 45,000 tonnes* global grainfed quota: 0% in-quota tariff; above quota tariff 12.8% + €3/kg
Argentina, Brazil and US/Canada have larger allocations than Aus-tralia under the Hilton quota Ongoing pressure on global grainfed quota – with quarterly alloca-tion being filled within weeks
20197,150 tonnes under country specific High Quality Beef quota Shared access to 45,000 tonnes* global grainfed quotaAccess (via EU importer held licences) to shared frozen beef quota and frozen beef for pro-cessing quota, which at times source Australian product
HGP free compliance adds costs to doing business with the EUAll beef supplied to market must be EUCAS accredited
Best access Major challengesSource: Trade agreements, DFAT, MLA
* The EU and US have recently come to an agreement, which subsequently received the accession of other substantial suppliers of the quota (Uruguay, Argentina and Australia) to ‘ring-fence’ a portion of the HQB global grainfed quota for exclusive access by the US. This will see the US receive an initial allocation of 18,500, increasing to 35,000 tonnes over seven years, with the remainder available to other suppliers. However, the timing of these changes is yet to be confirmed.
Australian beef exports to EU – summary table Volume – in tonnes swt 2018–19 % out
of total2017–18 % out
of total5-year average
(2013–14 to 2017–18)
% out of total
change 2018–19 vs 5-year average
% in tonnes swt
Total 14,601 17,729 21,207 -31 -6,606
StorageChilled 13,743 94 17,029 96 20,327 96 -32 -6,584 Frozen 858 6 700 4 880 4 -2 -22
Meat typeGrassfed 3,160 22 4,795 27 6,148 29 -49 -2,989 Grainfed 11,441 78 12,933 73 15,058 71 -24 -3,617
Storage/meat type
Chilled grassfed 3,112 21 4,783 27 5,779 27 -46 -2,667 Chilled grainfed 10,631 73 12,246 69 14,548 69 -27 -3,917 Frozen grassfed 48 0 12 0 370 2 -87 -321 Frozen grainfed 810 6 688 4 510 2 59 300
Source: DAWR
Value – in A$ 000 % in A$ 000
Total 228,220 249,218 266,107 -14 -37,888
StorageChilled 219,099 96 245,017 98 256,444 96 -15 -37,345 Frozen 9,121 4 4,201 2 9,663 4 -6 -542
Source: ABS/IHS Markit, 2018-19 = MAT (12 months ending May 2019)
Volume – by major cut (in tonnes swt) % in tonnes swt
Topside/inside 2,052 14 2,290 13 3,319 16 -38 -1,268 Striploin 1,926 13 2,617 15 3,030 14 -36 -1,104 Rump 1,784 12 2,354 13 2,696 13 -34 -912 Silverside/outside 1,536 11 1,767 10 2,445 12 -37 -909 Cube roll/rib eye roll 1,284 9 1,658 9 1,771 8 -27 -487 Blade 1,023 7 1,357 8 1,629 8 -37 -606 Chuck roll 963 7 1,314 7 1,603 8 -40 -640 Thick flank/knuckle 840 6 1,009 6 1,454 7 -42 -614 Tenderloin 798 5 1,033 6 1,116 5 -28 -317 Brisket 489 3 510 3 321 2 52 168 Other 1,905 13 1,818 10 1,823 9 5 82 Total 14,601 17,729 21,207 -31 -6,606
Source: DAWR
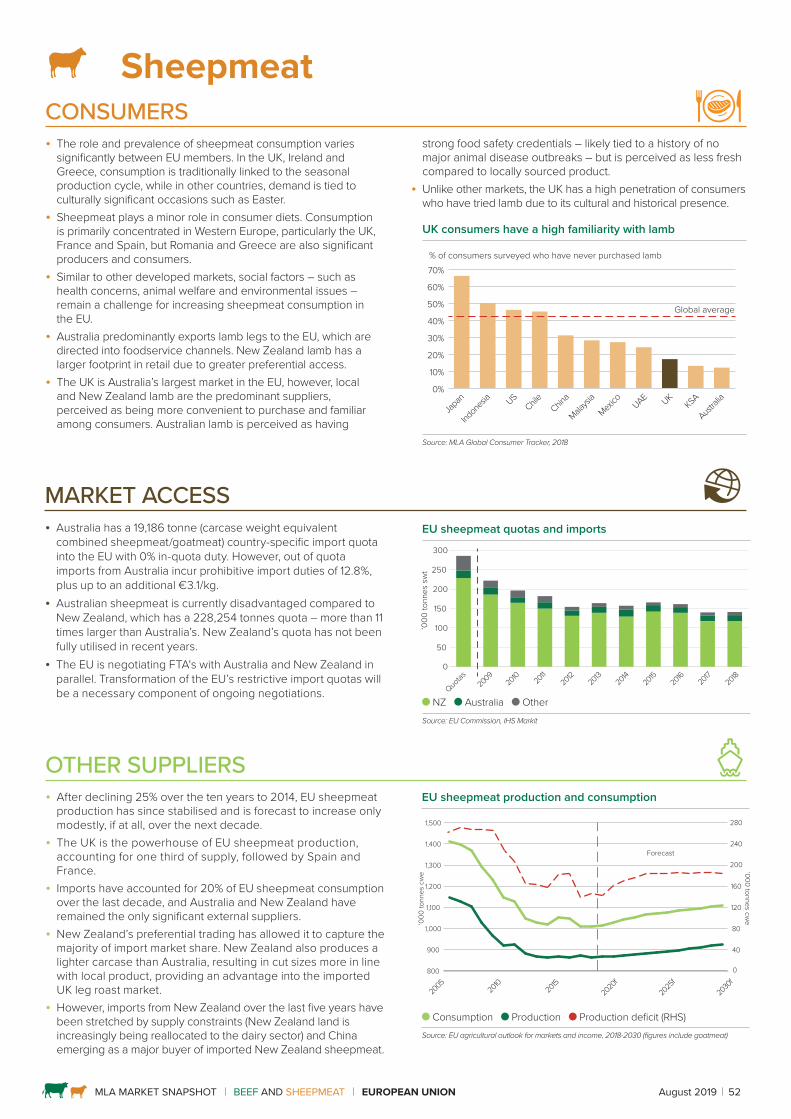
MLA MARKET SNAPSHOT BEEF AND SHEEPMEAT EUROPEAN UNION August 2019 52
SheepmeatCONSUMERS
• The role and prevalence of sheepmeat consumption varies significantly between EU members. In the UK, Ireland and Greece, consumption is traditionally linked to the seasonal production cycle, while in other countries, demand is tied to culturally significant occasions such as Easter.
• Sheepmeat plays a minor role in consumer diets. Consumption is primarily concentrated in Western Europe, particularly the UK, France and Spain, but Romania and Greece are also significant producers and consumers.
• Similar to other developed markets, social factors – such as health concerns, animal welfare and environmental issues – remain a challenge for increasing sheepmeat consumption in the EU.
• Australia predominantly exports lamb legs to the EU, which are directed into foodservice channels. New Zealand lamb has a larger footprint in retail due to greater preferential access.
• The UK is Australia’s largest market in the EU, however, local and New Zealand lamb are the predominant suppliers, perceived as being more convenient to purchase and familiar among consumers. Australian lamb is perceived as having
strong food safety credentials – likely tied to a history of no major animal disease outbreaks – but is perceived as less fresh compared to locally sourced product.
• Unlike other markets, the UK has a high penetration of consumers who have tried lamb due to its cultural and historical presence.
UK consumers have a high familiarity with lamb
Japan
0%
10%
20%
30%
40%
50%
60%
70%
Indon
esia US
Chile China
Malaysi
a
Mexico UAE UK
KSA
Austra
lia
% of consumers surveyed who have never purchased lamb
Global average
Source: MLA Global Consumer Tracker, 2018
MARKET ACCESS • Australia has a 19,186 tonne (carcase weight equivalent
combined sheepmeat/goatmeat) country-specific import quota into the EU with 0% in-quota duty. However, out of quota imports from Australia incur prohibitive import duties of 12.8%, plus up to an additional €3.1/kg.
• Australian sheepmeat is currently disadvantaged compared to New Zealand, which has a 228,254 tonnes quota – more than 11 times larger than Australia’s. New Zealand’s quota has not been fully utilised in recent years.
• The EU is negotiating FTA's with Australia and New Zealand in parallel. Transformation of the EU’s restrictive import quotas will be a necessary component of ongoing negotiations.
EU sheepmeat quotas and imports
‘000
tonn
es s
wt
0
50
100
150
200
250
300
Quotas
2009
2010 20
1120
1220
1320
1420
1520
1620
1820
17
NZ Australia Other Source: EU Commission, IHS Markit
OTHER SUPPLIERS • After declining 25% over the ten years to 2014, EU sheepmeat
production has since stabilised and is forecast to increase only modestly, if at all, over the next decade.
• The UK is the powerhouse of EU sheepmeat production, accounting for one third of supply, followed by Spain and France.
• Imports have accounted for 20% of EU sheepmeat consumption over the last decade, and Australia and New Zealand have remained the only significant external suppliers.
• New Zealand’s preferential trading has allowed it to capture the majority of import market share. New Zealand also produces a lighter carcase than Australia, resulting in cut sizes more in line with local product, providing an advantage into the imported UK leg roast market.
• However, imports from New Zealand over the last five years have been stretched by supply constraints (New Zealand land is increasingly being reallocated to the dairy sector) and China emerging as a major buyer of imported New Zealand sheepmeat.
EU sheepmeat production and consumption
Forecast
‘000
tonn
es c
we
800
900
1,000
1,100
1,200
1,300
1,400
1,500
2010
2020
f20
25f
2030
f20
0520
150
40
80
120
160
200
240
280
‘000 tonnes cwe
Consumption Production Production deficit (RHS) Source: EU agricultural outlook for markets and income, 2018-2030 (figures include goatmeat)
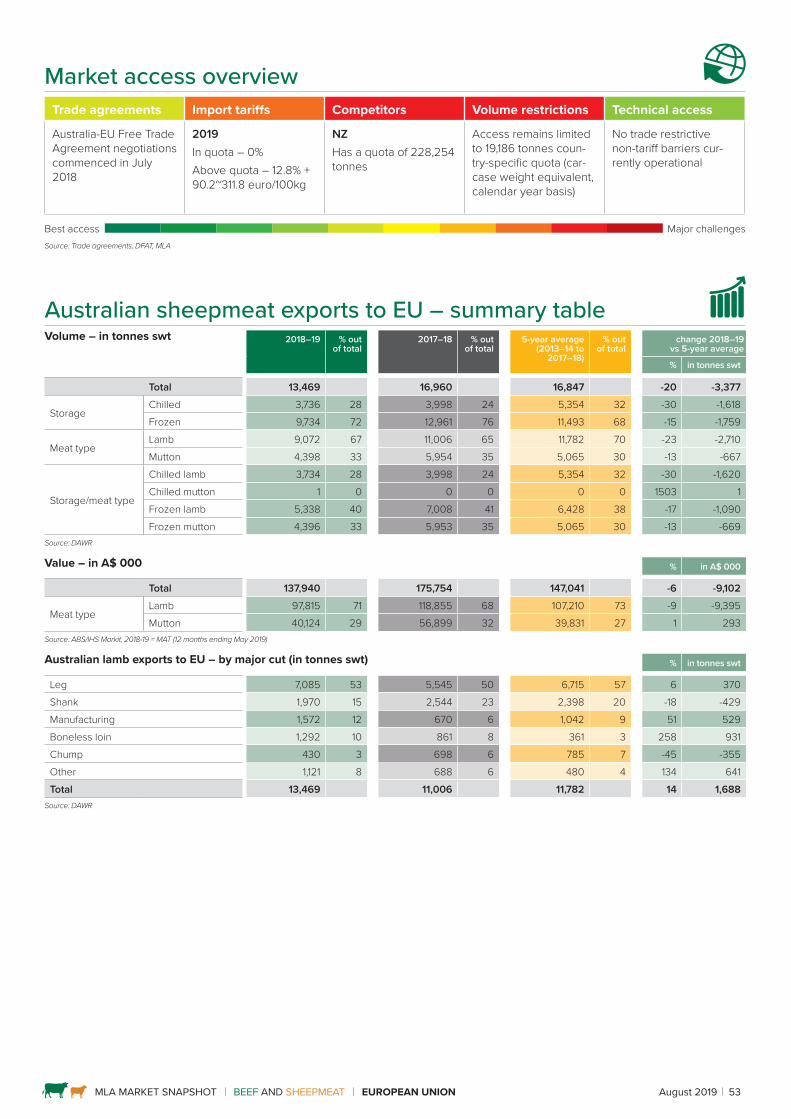
MLA MARKET SNAPSHOT BEEF AND SHEEPMEAT EUROPEAN UNION August 2019 53
Market access overview Trade agreements Import tariffs Competitors Volume restrictions Technical access
Australia-EU Free Trade Agreement negotiations commenced in July 2018
2019In quota – 0%Above quota – 12.8% + 90.2~311.8 euro/100kg
NZHas a quota of 228,254 tonnes
Access remains limited to 19,186 tonnes coun-try-specific quota (car-case weight equivalent, calendar year basis)
No trade restrictive non-tariff barriers cur-rently operational
Best access Major challengesSource: Trade agreements, DFAT, MLA
Australian sheepmeat exports to EU – summary table Volume – in tonnes swt 2018–19 % out
of total2017–18 % out
of total5-year average
(2013–14 to 2017–18)
% out of total
change 2018–19 vs 5-year average
% in tonnes swt
Total 13,469 16,960 16,847 -20 -3,377
StorageChilled 3,736 28 3,998 24 5,354 32 -30 -1,618 Frozen 9,734 72 12,961 76 11,493 68 -15 -1,759
Meat typeLamb 9,072 67 11,006 65 11,782 70 -23 -2,710 Mutton 4,398 33 5,954 35 5,065 30 -13 -667
Storage/meat type
Chilled lamb 3,734 28 3,998 24 5,354 32 -30 -1,620 Chilled mutton 1 0 0 0 0 0 1503 1 Frozen lamb 5,338 40 7,008 41 6,428 38 -17 -1,090 Frozen mutton 4,396 33 5,953 35 5,065 30 -13 -669
Source: DAWR
Value – in A$ 000 % in A$ 000
Total 137,940 175,754 147,041 -6 -9,102
Meat typeLamb 97,815 71 118,855 68 107,210 73 -9 -9,395 Mutton 40,124 29 56,899 32 39,831 27 1 293
Source: ABS/IHS Markit, 2018-19 = MAT (12 months ending May 2019)
Australian lamb exports to EU – by major cut (in tonnes swt) % in tonnes swt
Leg 7,085 53 5,545 50 6,715 57 6 370 Shank 1,970 15 2,544 23 2,398 20 -18 -429 Manufacturing 1,572 12 670 6 1,042 9 51 529 Boneless loin 1,292 10 861 8 361 3 258 931 Chump 430 3 698 6 785 7 -45 -355 Other 1,121 8 688 6 480 4 134 641 Total 13,469 11,006 11,782 14 1,688
Source: DAWR
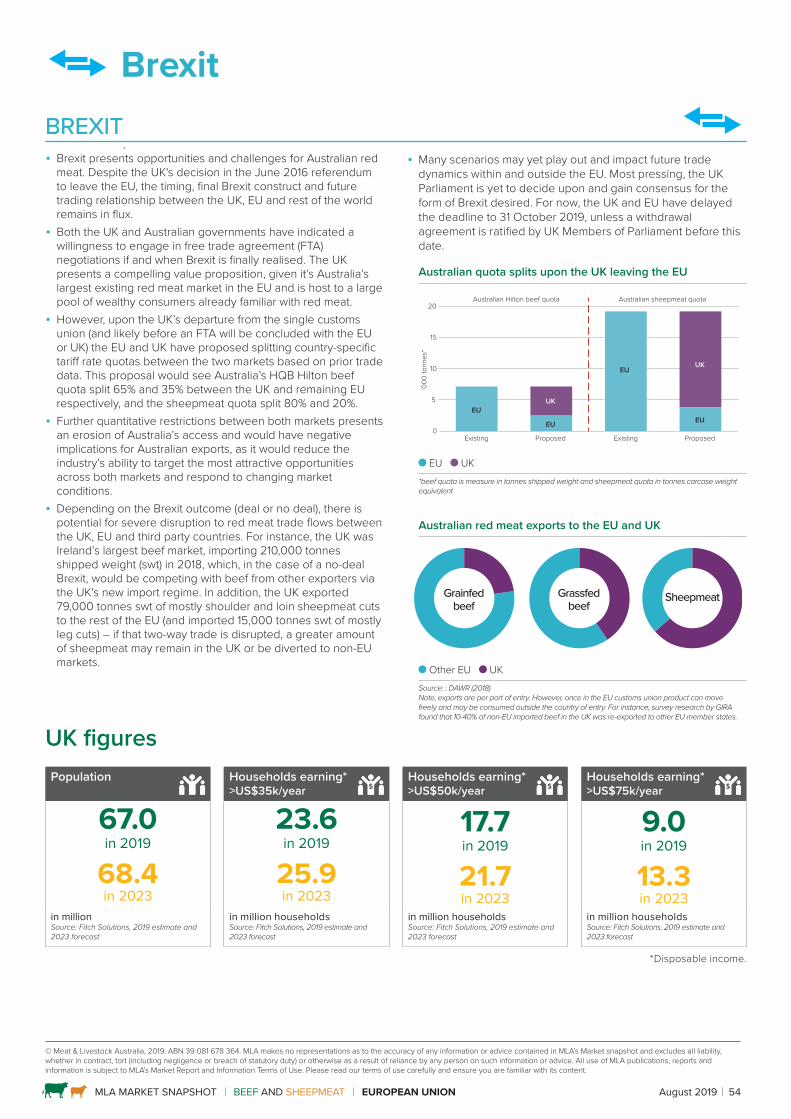
MLA MARKET SNAPSHOT BEEF AND SHEEPMEAT EUROPEAN UNION August 2019 54
BREXIT • Brexit presents opportunities and challenges for Australian red
meat. Despite the UK's decision in the June 2016 referendum to leave the EU, the timing, final Brexit construct and future trading relationship between the UK, EU and rest of the world remains in flux.
• Both the UK and Australian governments have indicated a willingness to engage in free trade agreement (FTA) negotiations if and when Brexit is finally realised. The UK presents a compelling value proposition, given it’s Australia’s largest existing red meat market in the EU and is host to a large pool of wealthy consumers already familiar with red meat.
• However, upon the UK’s departure from the single customs union (and likely before an FTA will be concluded with the EU or UK) the EU and UK have proposed splitting country-specific tariff rate quotas between the two markets based on prior trade data. This proposal would see Australia’s HQB Hilton beef quota split 65% and 35% between the UK and remaining EU respectively, and the sheepmeat quota split 80% and 20%.
• Further quantitative restrictions between both markets presents an erosion of Australia’s access and would have negative implications for Australian exports, as it would reduce the industry’s ability to target the most attractive opportunities across both markets and respond to changing market conditions.
• Depending on the Brexit outcome (deal or no deal), there is potential for severe disruption to red meat trade flows between the UK, EU and third party countries. For instance, the UK was Ireland’s largest beef market, importing 210,000 tonnes shipped weight (swt) in 2018, which, in the case of a no-deal Brexit, would be competing with beef from other exporters via the UK's new import regime. In addition, the UK exported 79,000 tonnes swt of mostly shoulder and loin sheepmeat cuts to the rest of the EU (and imported 15,000 tonnes swt of mostly leg cuts) – if that two-way trade is disrupted, a greater amount of sheepmeat may remain in the UK or be diverted to non-EU markets.
• Many scenarios may yet play out and impact future trade dynamics within and outside the EU. Most pressing, the UK Parliament is yet to decide upon and gain consensus for the form of Brexit desired. For now, the UK and EU have delayed the deadline to 31 October 2019, unless a withdrawal agreement is ratified by UK Members of Parliament before this date.
Australian quota splits upon the UK leaving the EU
Existing0
5
10
15
20
‘000
tonn
es*
EU
UKEU
EU
UKEU
Proposed Existing Proposed
Australian sheepmeat quotaAustralian Hilton beef quota
EU UK *beef quota is measure in tonnes shipped weight and sheepmeat quota in tonnes carcase weight equivalent
Australian red meat exports to the EU and UK
Grainfedbeef
Grassfedbeef
Sheepmeat
Other EU UKSource: : DAWR (2018)Note, exports are per port of entry. However, once in the EU customs union product can move freely and may be consumed outside the country of entry. For instance, survey research by GIRA found that 10-40% of non-EU imported beef in the UK was re-exported to other EU member states.
Brexit
UK figuresPopulation Households earning*
>US$35k/year Households earning* >US$50k/year
Households earning* >US$75k/year
67.0 in 2019
68.4in 2023
23.6 in 2019
25.9in 2023
17.7 in 2019
21.7in 2023
9.0 in 2019
13.3in 2023
in million Source: Fitch Solutions, 2019 estimate and 2023 forecast
in million households Source: Fitch Solutions, 2019 estimate and 2023 forecast
in million households Source: Fitch Solutions, 2019 estimate and 2023 forecast
in million households Source: Fitch Solutions, 2019 estimate and 2023 forecast
*Disposable income.
© Meat & Livestock Australia, 2019. ABN 39 081 678 364. MLA makes no representations as to the accuracy of any information or advice contained in MLA’s Market snapshot and excludes all liability, whether in contract, tort (including negligence or breach of statutory duty) or otherwise as a result of reliance by any person on such information or advice. All use of MLA publications, reports and information is subject to MLA’s Market Report and Information Terms of Use. Please read our terms of use carefully and ensure you are familiar with its content.