Embed Size (px)
Citation preview
BEFORE
THE PUBLIC SERVICE COMMISSION OF SOUTH CAROLINA
DIRECT TESTIMONY
OF
AARON L. ROTHSCHILD
COST OF CAPITAL
ON BEHALF OF
THE SOUTH CAROLINA DEPARTMENT OF CONSUMER AFFAIRS
Docket No. 2019-281-S
May 26, 2020
ELECTR
ONICALLY
FILED-2020
May
264:03
PM-SC
PSC-D
ocket#2019-281-S
-Page1of80
Direct Testimony of Aaron L. Rothschild – Cost of Capital Docket No. 2019-281-S
–––––––––––––––––––––––––––––––––––––––––––––––––––––––––––––––––––––––––––––––––––––––––––––––––––
Contents
I. STATEMENT OF QUALIFICATIONS ................................................................................................. 1
II. SUMMARY OF CONCLUSIONS ....................................................................................................... 2
III. CAPITAL STRUCTURE AND COST OF DEBT .................................................................................. 11
IV. COST OF EQUITY IN TODAY’S FINANCIAL MARKET ..................................................................... 12
A. Stock Price Trends ................................................................................................................... 15
B. Interest Rates .......................................................................................................................... 17
C. Increasing Credit Spreads ........................................................................................................ 19
D. Volatility Expectations ............................................................................................................. 20
V. COST OF EQUITY CALCULATION .................................................................................................. 25
A. Overview .................................................................................................................................... 25
B. Discounted Cash Flow ............................................................................................................. 28
C. Constant Growth Form of the DCF Model ............................................................................... 29
D. Non-Constant Growth Form of the DCF Model ....................................................................... 37
E. Capital Asset Pricing Model ..................................................................................................... 42
VI. ADDITIONAL COMMENTS ON MR. WALKER’S TESTIMONY ........................................................ 56
A. Risk Adjustments ....................................................................................................................... 60
1. Financial Risk Adjustment .......................................................................................................... 60
2. Investment Risk Adjustment ...................................................................................................... 61
B. DCF Method ............................................................................................................................... 62
C. Risk Premium Method ............................................................................................................... 69
D. CAPM Method ........................................................................................................................... 72
VII. CONCLUSION .............................................................................................................................. 77
ELECTR
ONICALLY
FILED-2020
May
264:03
PM-SC
PSC-D
ocket#2019-281-S
-Page2of80
Direct Testimony of Aaron L. Rothschild – Cost of Capital Docket No. 2019-281-S
–––––––––––––––––––––––––––––––––––––––––––––––––––––––––––––––––––––––––––––––––––––––––––––––––––
1
I. STATEMENT OF QUALIFICATIONS 1
Q. PLEASE STATE YOUR NAME, TITLE AND BUSINESS ADDRESS. 2
A. My name is Aaron L. Rothschild. My title is President and my business address is 15 Lake 3
Road, Ridgefield, CT. 4
Q. BY WHOM ARE YOU EMPLOYED AND IN WHAT CAPACITY? 5
A. I am President of Rothschild Financial Consulting. 6
Q. PLEASE STATE YOUR EDUCATIONAL ACHIEVEMENTS AND 7
PROFESSIONAL DESIGNATIONS? 8
A. I have a B.A. (1994) degree from Clark University in mathematics and an M.B.A. (1996) 9
from Vanderbilt University. 10
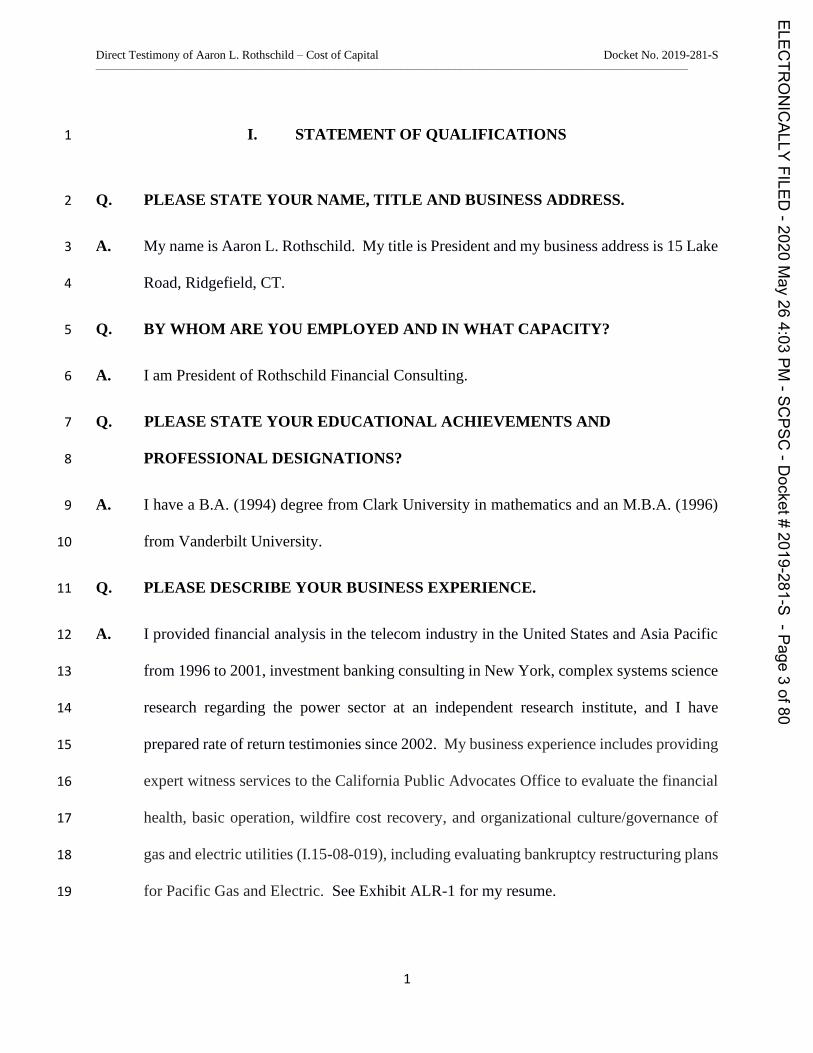
Q. PLEASE DESCRIBE YOUR BUSINESS EXPERIENCE. 11
A. I provided financial analysis in the telecom industry in the United States and Asia Pacific 12
from 1996 to 2001, investment banking consulting in New York, complex systems science 13
research regarding the power sector at an independent research institute, and I have 14
prepared rate of return testimonies since 2002. My business experience includes providing 15
expert witness services to the California Public Advocates Office to evaluate the financial 16
health, basic operation, wildfire cost recovery, and organizational culture/governance of 17
gas and electric utilities (I.15-08-019), including evaluating bankruptcy restructuring plans 18
for Pacific Gas and Electric. See Exhibit ALR-1 for my resume. 19
ELECTR
ONICALLY
FILED-2020
May
264:03
PM-SC
PSC-D
ocket#2019-281-S
-Page3of80
Direct Testimony of Aaron L. Rothschild – Cost of Capital Docket No. 2019-281-S
–––––––––––––––––––––––––––––––––––––––––––––––––––––––––––––––––––––––––––––––––––––––––––––––––––
2
Q. HAVE YOU PREVIOUSLY TESTIFIED BEFORE THIS COMMISSION, OR 1
OTHER STATE COMMISSIONS? IF SO, WHICH COMMISSIONS? 2
A. Yes, I have testified before this Commission previously. My expert witness experience 3
includes testifying in over 50 cost of capital proceedings before the following state 4
commissions: California, Colorado, Connecticut, Delaware, Florida, New Jersey, 5
Maryland, North Dakota, Pennsylvania, South Carolina and Vermont. See Exhibit ALR-6
1 for the list of dockets for each of my testimonies. 7
Q. ON WHOSE BEHALF ARE YOU PROVIDING THIS TESTIMONY? 8
A. South Carolina Department of Consumer Affairs. 9
Q. WHAT IS THE PURPOSE OF YOUR DIRECT TESTIMONY IN THIS 10
PROCEEDING? 11
A. The purpose of my testimony is to provide my recommendations to the Public Service 12
Commission of South Carolina (“Commission”) regarding the appropriate cost of equity, 13
capital structure and overall cost of capital for Palmetto Utilities Inc. (“PUI” or 14
“Company”). 15
II. SUMMARY OF CONCLUSIONS 16
Q. PLEASE SUMMARIZE YOUR TESTIMONY. 17
A. I recommend the following cost of capital for PUI’s wastewater operations: 18
• An overall cost of capital of 7.33% (7.10% - 7.56%)1 19
1 Using Mr. Walker’s capital structure of 58.21% common equity would result in a cost of equity of 7.20% to
7.65%.
ELECTR
ONICALLY
FILED-2020
May
264:03
PM-SC
PSC-D
ocket#2019-281-S
-Page4of80
Direct Testimony of Aaron L. Rothschild – Cost of Capital Docket No. 2019-281-S
–––––––––––––––––––––––––––––––––––––––––––––––––––––––––––––––––––––––––––––––––––––––––––––––––––
3
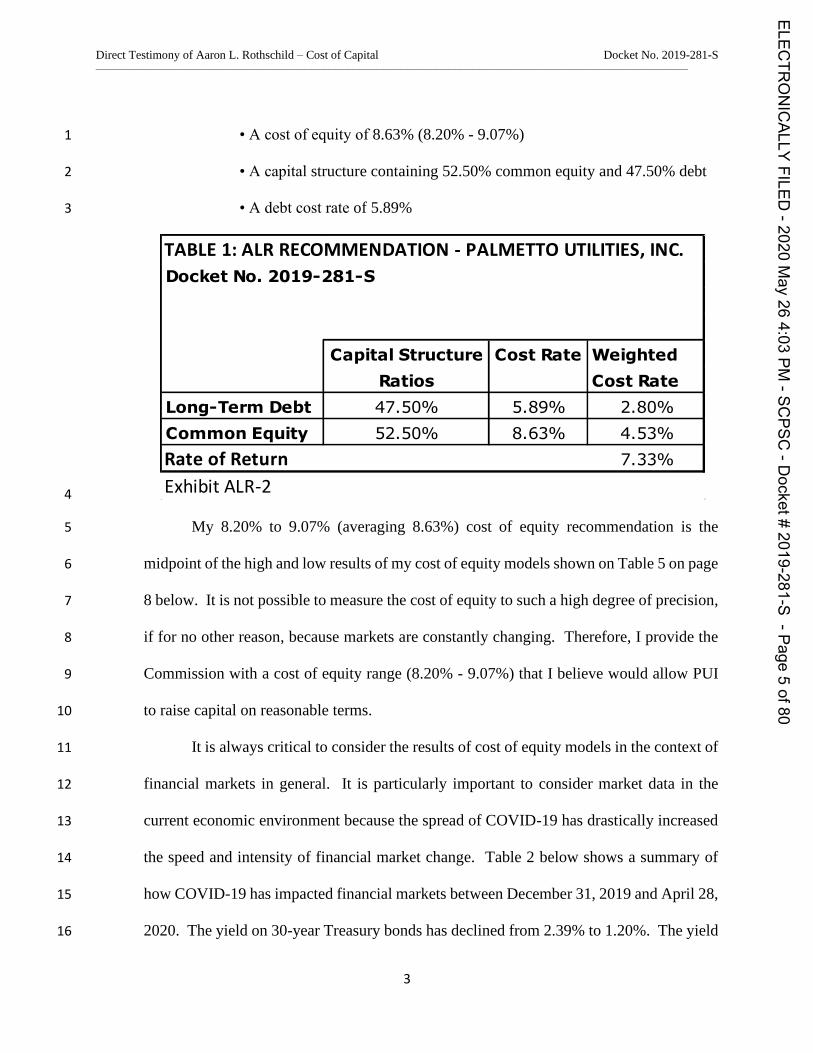
• A cost of equity of 8.63% (8.20% - 9.07%) 1
• A capital structure containing 52.50% common equity and 47.50% debt 2
• A debt cost rate of 5.89% 3
4
My 8.20% to 9.07% (averaging 8.63%) cost of equity recommendation is the 5
midpoint of the high and low results of my cost of equity models shown on Table 5 on page 6
8 below. It is not possible to measure the cost of equity to such a high degree of precision, 7
if for no other reason, because markets are constantly changing. Therefore, I provide the 8
Commission with a cost of equity range (8.20% - 9.07%) that I believe would allow PUI 9
to raise capital on reasonable terms. 10
It is always critical to consider the results of cost of equity models in the context of 11
financial markets in general. It is particularly important to consider market data in the 12
current economic environment because the spread of COVID-19 has drastically increased 13
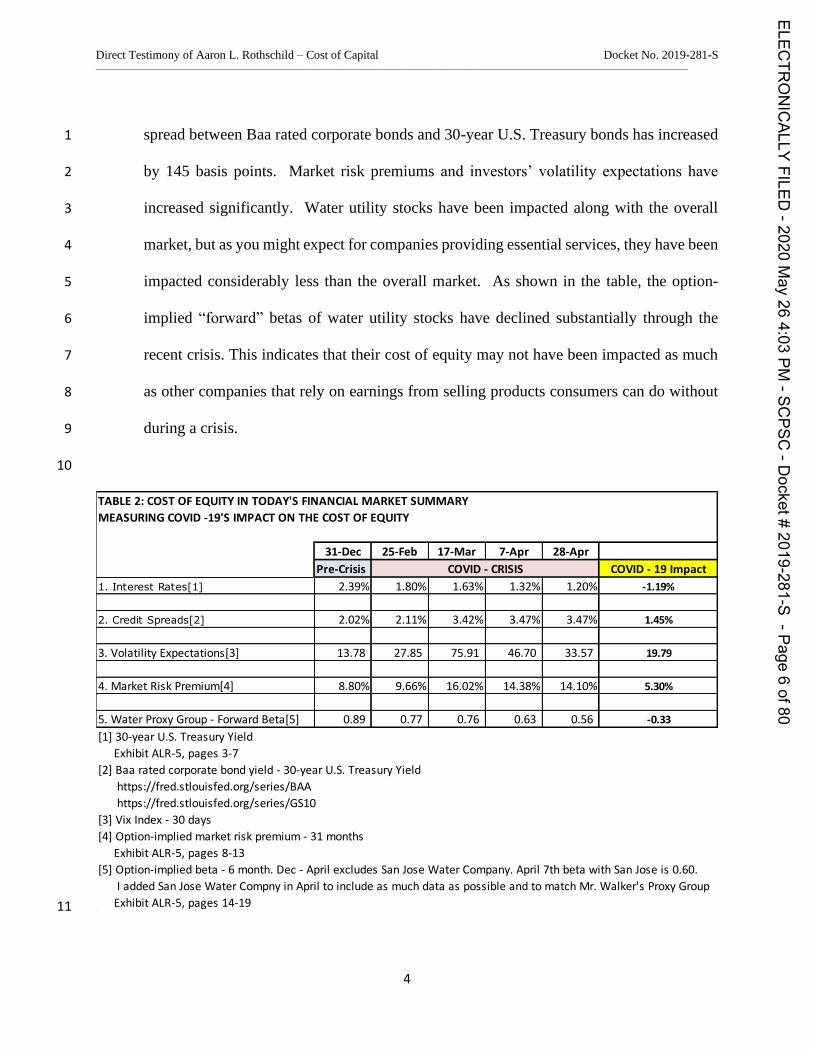
the speed and intensity of financial market change. Table 2 below shows a summary of 14
how COVID-19 has impacted financial markets between December 31, 2019 and April 28, 15
2020. The yield on 30-year Treasury bonds has declined from 2.39% to 1.20%. The yield 16
TABLE 1: ALR RECOMMENDATION - PALMETTO UTILITIES, INC.
Capital Structure Cost Rate Weighted
Ratios Cost Rate
Long-Term Debt 47.50% 5.89% 2.80%
Common Equity 52.50% 8.63% 4.53%
Rate of Return 7.33%
Exhibit ALR-2
Docket No. 2019-281-S
ELECTR
ONICALLY
FILED-2020
May
264:03
PM-SC
PSC-D
ocket#2019-281-S
-Page5of80
Direct Testimony of Aaron L. Rothschild – Cost of Capital Docket No. 2019-281-S
–––––––––––––––––––––––––––––––––––––––––––––––––––––––––––––––––––––––––––––––––––––––––––––––––––
4
spread between Baa rated corporate bonds and 30-year U.S. Treasury bonds has increased 1
by 145 basis points. Market risk premiums and investors’ volatility expectations have 2
increased significantly. Water utility stocks have been impacted along with the overall 3
market, but as you might expect for companies providing essential services, they have been 4
impacted considerably less than the overall market. As shown in the table, the option-5
implied “forward” betas of water utility stocks have declined substantially through the 6
recent crisis. This indicates that their cost of equity may not have been impacted as much 7
as other companies that rely on earnings from selling products consumers can do without 8
during a crisis. 9
10
11
TABLE 2: COST OF EQUITY IN TODAY'S FINANCIAL MARKET SUMMARY
MEASURING COVID -19'S IMPACT ON THE COST OF EQUITY
31-Dec 25-Feb 17-Mar 7-Apr 28-Apr
Pre-Crisis COVID - 19 Impact
1. Interest Rates[1] 2.39% 1.80% 1.63% 1.32% 1.20% -1.19%
2. Credit Spreads[2] 2.02% 2.11% 3.42% 3.47% 3.47% 1.45%
3. Volatility Expectations[3] 13.78 27.85 75.91 46.70 33.57 19.79
4. Market Risk Premium[4] 8.80% 9.66% 16.02% 14.38% 14.10% 5.30%
5. Water Proxy Group - Forward Beta[5] 0.89 0.77 0.76 0.63 0.56 -0.33
[1] 30-year U.S. Treasury Yield
Exhibit ALR-5, pages 3-7
[2] Baa rated corporate bond yield - 30-year U.S. Treasury Yield
https://fred.stlouisfed.org/series/BAA
https://fred.stlouisfed.org/series/GS10
[3] Vix Index - 30 days
[4] Option-implied market risk premium - 31 months
Exhibit ALR-5, pages 8-13
[5] Option-implied beta - 6 month. Dec - April excludes San Jose Water Company. April 7th beta with San Jose is 0.60.
I added San Jose Water Compny in April to include as much data as possible and to match Mr. Walker's Proxy Group
Exhibit ALR-5, pages 14-19
COVID - CRISIS
ELECTR
ONICALLY
FILED-2020
May
264:03
PM-SC
PSC-D
ocket#2019-281-S
-Page6of80
Direct Testimony of Aaron L. Rothschild – Cost of Capital Docket No. 2019-281-S
–––––––––––––––––––––––––––––––––––––––––––––––––––––––––––––––––––––––––––––––––––––––––––––––––––
5
See Section IV. Cost of Equity in Today’s Financial Markets below for a more in-depth 1
analysis of how the spread of COVID-19 has impacted financial markets and the cost of 2
equity for water utility companies. 3
Q. PLEASE COMPARE YOUR COST OF CAPITAL RECOMMENDATIONS TO 4
PUI’S REQUESTED COST OF CAPITAL. 5
A. Harold Walker’s testimony was filed before COVID-19 had significantly impacted 6
financial markets. I will respond to his analysis of COVID-19 when available. The 7
primary reason Mr. Walker and I recommend a different cost of equity for PUI based on 8
pre-COVID-19 data is that he adds 1.30% to the result of each of his cost of equity 9
models:1) to account for the difference between market value capital structure and book 10
value capital structure (0.90%); and 2) as an “investment risk adjustment” because he 11
claims PUI is risker than the companies in his proxy group (0.40%). Without these 12
adjustments, the average result of his models indicates a cost of equity of 9.20% instead of 13
10.50%. As explained below, both of Mr. Walker’s proposed adjustments are 14
inappropriate and should be denied. Technical flaws in his analysis, beyond his 15
inappropriate adjustments, indicate that even his 9.20% is higher than returns demanded 16
by investors. 17
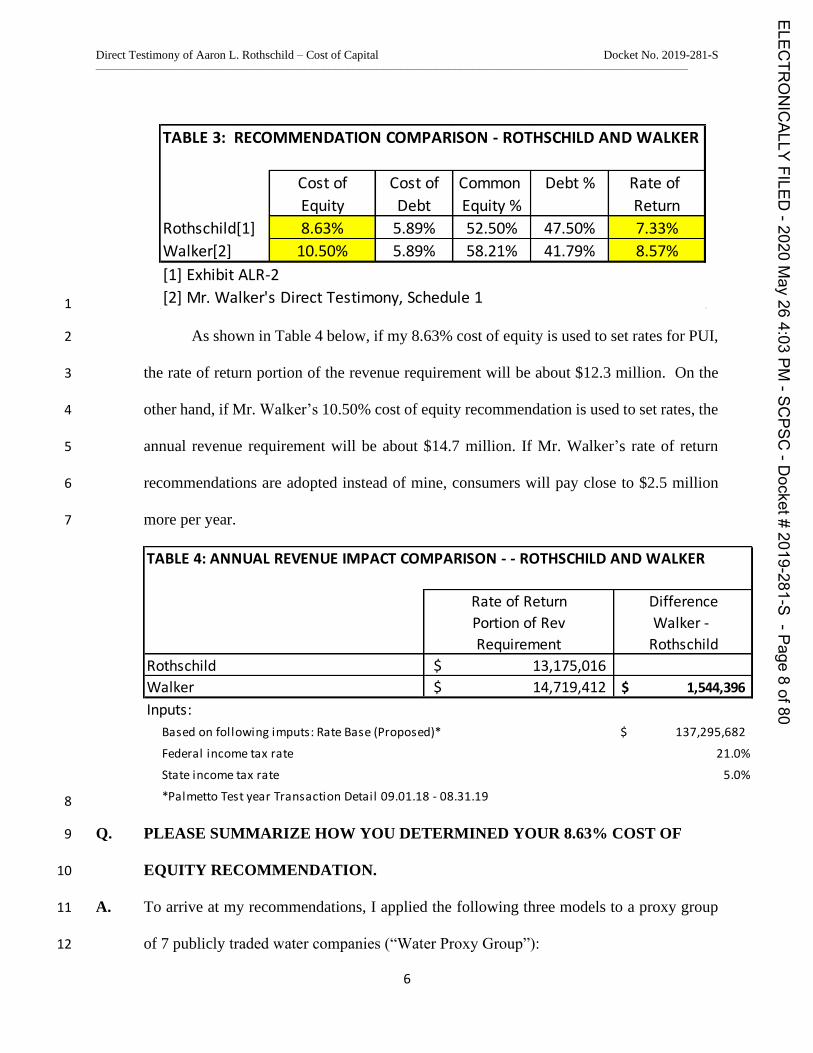
As shown in Table 3 below, Mr. Walker and I recommend the same cost of debt 18
(5.89%). Our capital structure and cost of equity recommendations are different, however. 19
My 8.63% cost of equity recommendation results in a 7.33% overall rate of return. Mr. 20
Walker’s 10.50% cost of equity recommendation results in an overall rate of return of 21
8.57%. 22
ELECTR
ONICALLY
FILED-2020
May
264:03
PM-SC
PSC-D
ocket#2019-281-S
-Page7of80
Direct Testimony of Aaron L. Rothschild – Cost of Capital Docket No. 2019-281-S
–––––––––––––––––––––––––––––––––––––––––––––––––––––––––––––––––––––––––––––––––––––––––––––––––––
6
1
As shown in Table 4 below, if my 8.63% cost of equity is used to set rates for PUI, 2
the rate of return portion of the revenue requirement will be about $12.3 million. On the 3
other hand, if Mr. Walker’s 10.50% cost of equity recommendation is used to set rates, the 4
annual revenue requirement will be about $14.7 million. If Mr. Walker’s rate of return 5
recommendations are adopted instead of mine, consumers will pay close to $2.5 million 6
more per year. 7
8
Q. PLEASE SUMMARIZE HOW YOU DETERMINED YOUR 8.63% COST OF 9
EQUITY RECOMMENDATION. 10
A. To arrive at my recommendations, I applied the following three models to a proxy group 11
of 7 publicly traded water companies (“Water Proxy Group”): 12
TABLE 3: RECOMMENDATION COMPARISON - ROTHSCHILD AND WALKER
Cost of Cost of Common Debt % Rate of
Equity Debt Equity % Return
Rothschild[1] 8.63% 5.89% 52.50% 47.50% 7.33%
Walker[2] 10.50% 5.89% 58.21% 41.79% 8.57%
[1] Exhibit ALR-2
[2] Mr. Walker's Direct Testimony, Schedule 1
TABLE 4: ANNUAL REVENUE IMPACT COMPARISON - - ROTHSCHILD AND WALKER
Rate of Return Difference
Portion of Rev Walker -
Requirement Rothschild
Rothschild 13,175,016$
Walker 14,719,412$ 1,544,396$
Inputs:
Based on following imputs: Rate Base (Proposed)* 137,295,682$
Federal income tax rate 21.0%
State income tax rate 5.0%
*Palmetto Test year Transaction Detail 09.01.18 - 08.31.19
ELECTR
ONICALLY
FILED-2020
May
264:03
PM-SC
PSC-D
ocket#2019-281-S
-Page8of80
Direct Testimony of Aaron L. Rothschild – Cost of Capital Docket No. 2019-281-S
–––––––––––––––––––––––––––––––––––––––––––––––––––––––––––––––––––––––––––––––––––––––––––––––––––
7
• Constant Growth Discounted Cash Flow (“DCF”) Model 1
• Non-Constant Growth DCF Model 2
• Capital Asset Pricing Model (“CAPM”) 3
My constant growth DCF model is used by major financial institutions. J.P. 4
Morgan Chase uses the sustainable growth form of the DCF method, as I do, in its 2019 5
Long-Term Capital Market Assumptions publication.2 Principles of Corporate Finance, a 6
leading financial textbook used in business schools and investment banks around the world, 7
recommends using the very same method I use to calculate the cost of equity for regulated 8
energy utility companies.3 My CAPM is based on methodologies used by Value Line, the 9
Chicago Board of Options Exchange (CBOE), and published in peer-reviewed academic 10
journals (e.g., The Review of Financial Studies). 11
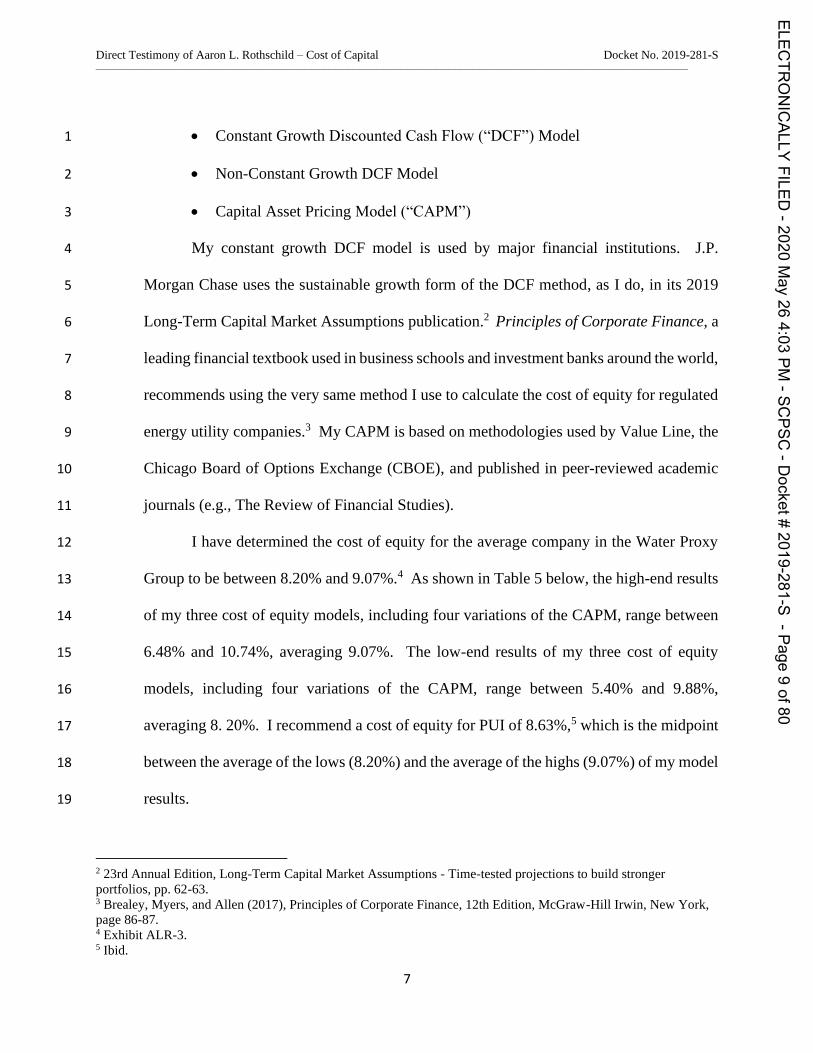
I have determined the cost of equity for the average company in the Water Proxy 12
Group to be between 8.20% and 9.07%.4 As shown in Table 5 below, the high-end results 13
of my three cost of equity models, including four variations of the CAPM, range between 14
6.48% and 10.74%, averaging 9.07%. The low-end results of my three cost of equity 15
models, including four variations of the CAPM, range between 5.40% and 9.88%, 16
averaging 8. 20%. I recommend a cost of equity for PUI of 8.63%,5 which is the midpoint 17
between the average of the lows (8.20%) and the average of the highs (9.07%) of my model 18
results. 19
2 23rd Annual Edition, Long-Term Capital Market Assumptions - Time-tested projections to build stronger
portfolios, pp. 62-63. 3 Brealey, Myers, and Allen (2017), Principles of Corporate Finance, 12th Edition, McGraw-Hill Irwin, New York,
page 86-87. 4 Exhibit ALR-3. 5 Ibid.
ELECTR
ONICALLY
FILED-2020
May
264:03
PM-SC
PSC-D
ocket#2019-281-S
-Page9of80
Direct Testimony of Aaron L. Rothschild – Cost of Capital Docket No. 2019-281-S
–––––––––––––––––––––––––––––––––––––––––––––––––––––––––––––––––––––––––––––––––––––––––––––––––––
8
1
Q. PLEASE PROVIDE A SUMMARY OF HOW MR. WALKER’S COST OF EQUITY 2
RECOMMENDATION COMPARES TO YOUR RECOMMENDATION, RETURN 3
EXPECTATIONS OF MAJOR FINANCIAL INSTITUTIONS, AND RECENT 4
DECISIONS IN WATER UTILITY RATE CASES YOU HAVE BEEN INVOLVED 5
IN. 6
A. My direct testimony explains that Mr. Walker’s 10.50% cost of equity recommendation is 7
above (1) return expectations indicated by market data (e.g., stocks, bonds, options), (2) 8
return expectations published by major financial institutions, and (3) allowed returns in 9
water utility rate cases in which I have filed testimonies. 10
The following two components of our analyses led to our different cost of equity 11
recommendations: 12
TABLE 5: COST OF EQUITY MODEL RESULTS
DCF Low High
Constant Growth 8.17% 8.30%
Non-Constant Growth 5.40% 6.48%
CAPM
a. Forward - Spot
Risk Free Rate - 3-Month T Bill 7.91% 9.08%
Risk Free Rate - 30-yr T Bond 8.42% 9.50%
b.Forward - Weighted
Risk Free Rate - 3-Month T Bill 9.40% 10.32%
Risk Free Rate - 30-yr T Bond 9.88% 10.74%
Average 8.20% 9.07%
Exhibit ALR-3
ELECTR
ONICALLY
FILED-2020
May
264:03
PM-SC
PSC-D
ocket#2019-281-S
-Page10
of80
Direct Testimony of Aaron L. Rothschild – Cost of Capital Docket No. 2019-281-S
–––––––––––––––––––––––––––––––––––––––––––––––––––––––––––––––––––––––––––––––––––––––––––––––––––
9
1. Mr. Walker increases his cost of equity results by 1.30% because he claims that a 1
Financial Risk Adjustment (0.90%) and an Investment Risk Adjustment (0.40%) 2
are required. 3
2. The non-constant growth DCF model indicates a lower cost of equity (5.40%-4
6.48%) than the constant growth DCF (8.17%-8.30%). Mr. Walker does not 5
implement a non-constant growth DCF model. 6
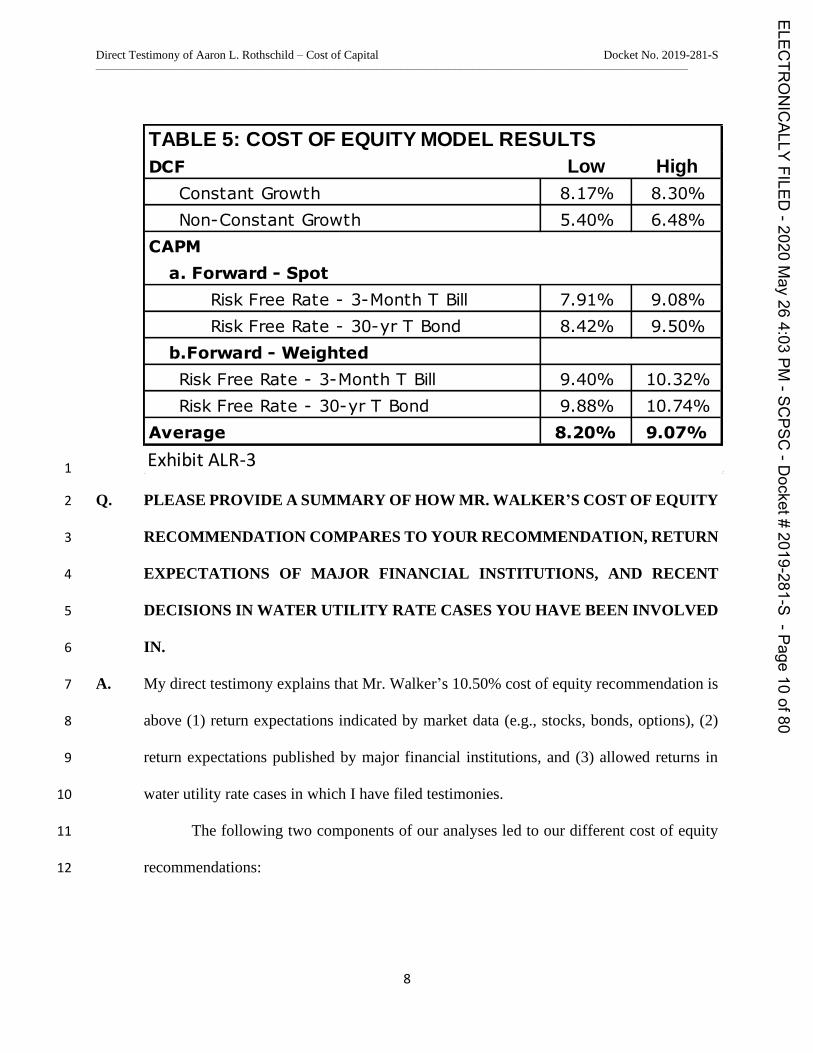
As shown in Table 6 below, Mr. Walker’s 10.50% cost of equity 7
recommendation is considerably higher than return expectations published by major 8
banks and brokerage houses (5.25-8.75%).6 9
10
The return expectations published by Charles Schwab and J.P. Morgan are based 11
on their own financial models. I provide the data shown in Table 6 to show that major 12
financial institutions are telling their clients to expect lower returns on their investments 13
than the cost of equity proposed by Mr. Walker. Charles Schwab and J.P. Morgan’s 14
published return expectations are for the overall stock market. Mr. Walker’s cost of equity 15
recommendation is for a regulated utility company. It is unlikely that investors would 16
6 Includes expected returns from selected emerging markets (8.00-8.75%).
TABLE 6: COST OF EQUITY COMPARISON
Nominal
Mr. Walker's Recommendation (March 2020) - [1] 10.5% [1]
Charles Schwab - Long-term Market Returns (March 2018)
U.S. Large Capitalization Stocks 6.5% [2]
U.S. Small Capitalization Stocks 7.2% [3]
J.P. Morgan Asset Management - Equity Long-Term Returns (2019)
U.S Large Cap 5.25% [3]
Selected Emerging Market 8.00 - 8.75% [3]
Sources:
[1] Mr. Walker's Direct Testimony, page 3, lines 9-11.
[2] Charles Schwab - Why Market Returns May Be Lower in the Future, March 6, 2018.
[3] J.P. Morgan Asset Management - Long-Term Capital Market Assumptions, 2019 Annual Edition, page 65.
ELECTR
ONICALLY
FILED-2020
May
264:03
PM-SC
PSC-D
ocket#2019-281-S
-Page11
of80
Direct Testimony of Aaron L. Rothschild – Cost of Capital Docket No. 2019-281-S
–––––––––––––––––––––––––––––––––––––––––––––––––––––––––––––––––––––––––––––––––––––––––––––––––––
10
expect to earn a higher return on equity for a cost of service regulated utility company than 1
for the overall stock market. 2
My 8.63% cost of equity for PUI is also above the range of the published figures 3
shown in Table 6, which should give the Commission confidence that if my 4
recommendation is used to set rates, it will still enable PUI to raise the capital it requires. 5
The cost of equity cannot be calculated as precisely as the weight or height of an object. 6
Therefore, I recommend a cost of equity of between 8.20% and 9.07%, and the 7
Commission can use the forecasts shown in Table 6 along with market data provided in 8
this testimony to determine the cost of equity within that range which they consider 9
appropriate for setting PUI’s rates. 10
Mr. Walker’s 10.50% is not consistent with allowed returns in recent proceedings 11
I have testified in. In 2018, I testified on behalf of the Office of Ratepayer Advocates 12
(ORA)7 in California’s Water Cost of Capital Proceeding. On March 22, 2018, the 13
California Public Utilities Commission authorized a return on equity (ROE) of between 14
8.90% and 9.20% for the following California Class A water utilities (Decision 18-03-15
035): 16
• 9.20% - California Water Service Company (A17-04-001, 17-04-001); 17
• 9.20% - California American Water Company (A17-04-001, 17-04-002); 18
• 8.90% - Golden State Water Company (A17-04-001, 17-04-003); 19
• 8.90% - San Jose Water Company (A17-04-001, 17-04-006).8 20
21
7 Renamed the “Public Advocates Office” in 2019. 8 CPUC Press release, CPUC SETS COST OF CAPITAL FOR LARGE WATER COMPANIES, March 22, 2018.
ELECTR
ONICALLY
FILED-2020
May
264:03
PM-SC
PSC-D
ocket#2019-281-S
-Page12
of80
Direct Testimony of Aaron L. Rothschild – Cost of Capital Docket No. 2019-281-S
–––––––––––––––––––––––––––––––––––––––––––––––––––––––––––––––––––––––––––––––––––––––––––––––––––
11
In 2019, I testified on behalf of the South Carolina Department of Consumer Affairs 1
regarding the appropriate cost of equity, capital structure and overall cost of capital for 2
Blue Granite Water Company (Docket No. 2019-290-WS). On April 9, 2020, the 3
Commission authorized a return on equity (ROE) of 7.46%.9 4
5
III. CAPITAL STRUCTURE AND COST OF DEBT 6
Q. WHAT CAPITAL STRUCTURE DO YOU RECOMMEND AND WHY? 7
A. Mr. Walker proposes using a capital structure of 41.79% debt and 58.21% common equity, 8
based upon PUI’s capital structure as of August 31, 2019. I disagree with the use of this 9
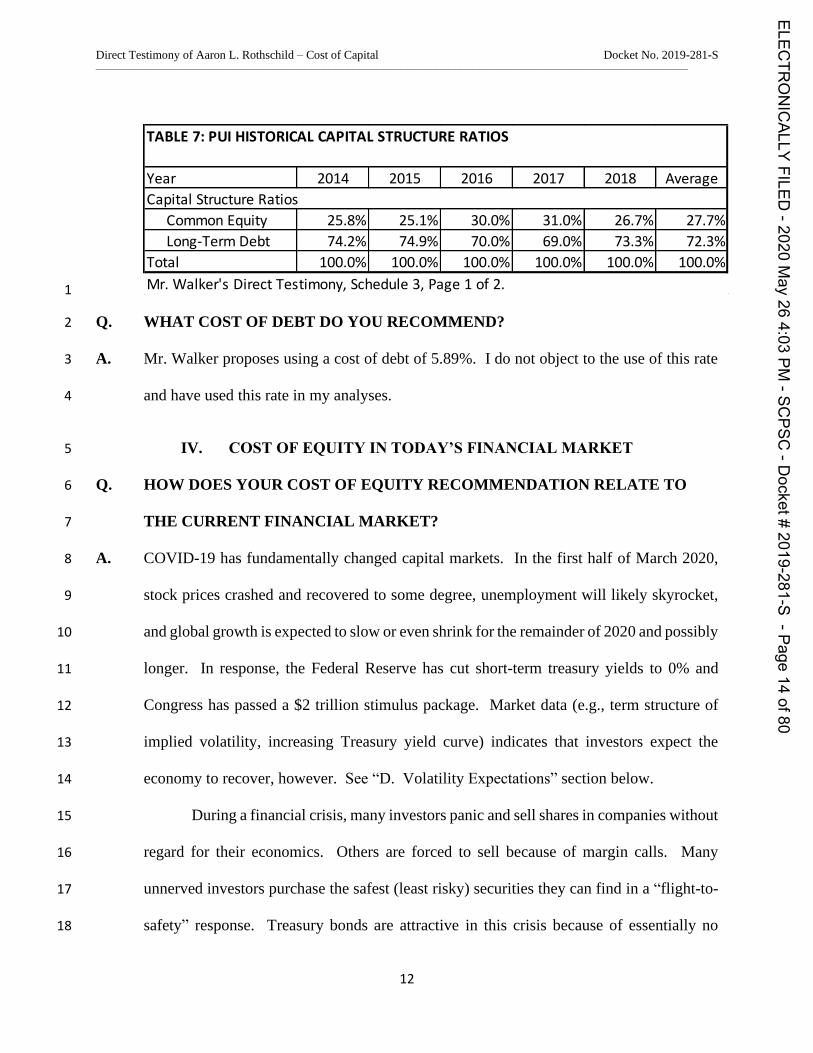
capital structure because 1) as evidenced in Table 7, the capital structure of PUI has 10
averaged only 27.7% between 2014 and 2018, and 2) the common equity ratio of PUI’s 11
requested capital structure is significantly above the average of the 7 regulated water 12
utilities in my proxy group. As a result, I recommend using a capital structure consisting 13
of 52.50% equity and 47.50% debt, based on a conservative point between the average 14
common equity ratios of the companies in my proxy group excluding and including short-15
term debt for pre and post COVID-19. As per Exhibit ALR-6, these averages are between 16
49.7%10 and 54.6%11, respectively. 17
9 Docket No. 2019-290-WS – Order No. 2020-306, page 38. 10 With short-term debt per April 10, 2020 Value Line Company Reports. 11 Without short-term debt per January 10, 2020 Value Line Company Reports.
ELECTR
ONICALLY
FILED-2020
May
264:03
PM-SC
PSC-D
ocket#2019-281-S
-Page13
of80
Direct Testimony of Aaron L. Rothschild – Cost of Capital Docket No. 2019-281-S
–––––––––––––––––––––––––––––––––––––––––––––––––––––––––––––––––––––––––––––––––––––––––––––––––––
12
1
Q. WHAT COST OF DEBT DO YOU RECOMMEND? 2
A. Mr. Walker proposes using a cost of debt of 5.89%. I do not object to the use of this rate 3
and have used this rate in my analyses. 4
IV. COST OF EQUITY IN TODAY’S FINANCIAL MARKET 5
Q. HOW DOES YOUR COST OF EQUITY RECOMMENDATION RELATE TO 6
THE CURRENT FINANCIAL MARKET? 7
A. COVID-19 has fundamentally changed capital markets. In the first half of March 2020, 8
stock prices crashed and recovered to some degree, unemployment will likely skyrocket, 9
and global growth is expected to slow or even shrink for the remainder of 2020 and possibly 10
longer. In response, the Federal Reserve has cut short-term treasury yields to 0% and 11
Congress has passed a $2 trillion stimulus package. Market data (e.g., term structure of 12
implied volatility, increasing Treasury yield curve) indicates that investors expect the 13
economy to recover, however. See “D. Volatility Expectations” section below. 14
During a financial crisis, many investors panic and sell shares in companies without 15
regard for their economics. Others are forced to sell because of margin calls. Many 16
unnerved investors purchase the safest (least risky) securities they can find in a “flight-to-17
safety” response. Treasury bonds are attractive in this crisis because of essentially no 18
TABLE 7: PUI HISTORICAL CAPITAL STRUCTURE RATIOS
Year 2014 2015 2016 2017 2018 Average
Capital Structure Ratios
Common Equity 25.8% 25.1% 30.0% 31.0% 26.7% 27.7%
Long-Term Debt 74.2% 74.9% 70.0% 69.0% 73.3% 72.3%
Total 100.0% 100.0% 100.0% 100.0% 100.0% 100.0%
Mr. Walker's Direct Testimony, Schedule 3, Page 1 of 2.
ELECTR
ONICALLY
FILED-2020
May
264:03
PM-SC
PSC-D
ocket#2019-281-S
-Page14
of80
Direct Testimony of Aaron L. Rothschild – Cost of Capital Docket No. 2019-281-S
–––––––––––––––––––––––––––––––––––––––––––––––––––––––––––––––––––––––––––––––––––––––––––––––––––
13
chance of default, among other reasons. Understandably, long-term treasury yields have 1
fallen sharply since the spread of the Coronavirus as investors bid up the price of these 2
bonds. On the other hand, corporate bond yields have increased as investors demand a 3
higher yield spread over treasury bonds to take on the added risk of lending money to 4
corporations instead of the Federal Government. 5
At this point, I will address how the current financial crisis has impacted water 6
utility companies’ cost of equity. Water utilities’ earnings are relatively stable during an 7
economic slowdown because they provide essential services. This stability indicates their 8
cost of equity is likely relatively stable because their earnings are safer than those of an 9
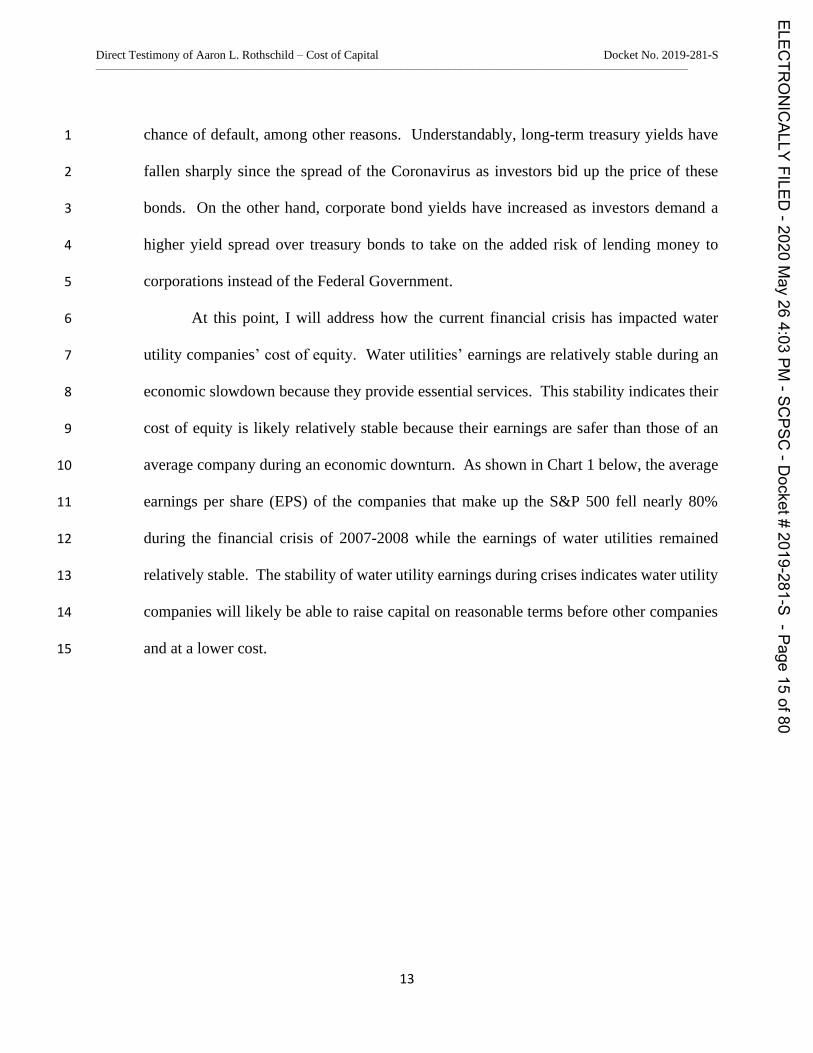
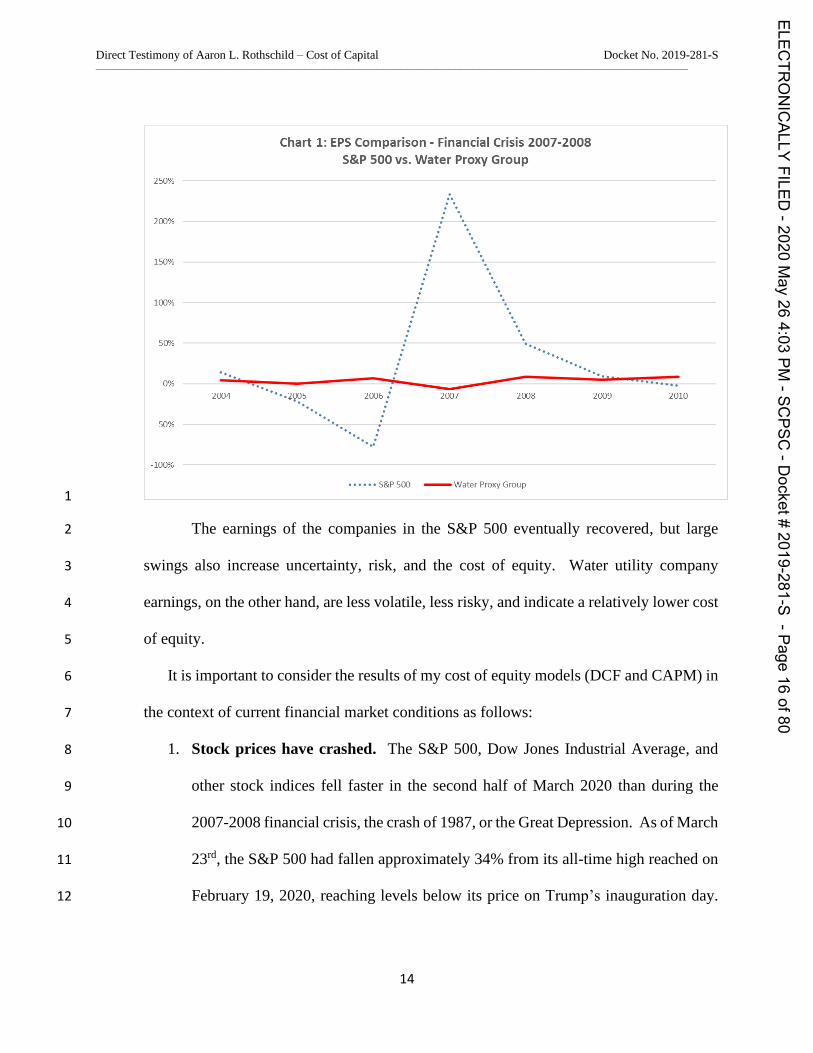
average company during an economic downturn. As shown in Chart 1 below, the average 10
earnings per share (EPS) of the companies that make up the S&P 500 fell nearly 80% 11
during the financial crisis of 2007-2008 while the earnings of water utilities remained 12
relatively stable. The stability of water utility earnings during crises indicates water utility 13
companies will likely be able to raise capital on reasonable terms before other companies 14
and at a lower cost. 15
ELECTR
ONICALLY
FILED-2020
May
264:03
PM-SC
PSC-D
ocket#2019-281-S
-Page15
of80
Direct Testimony of Aaron L. Rothschild – Cost of Capital Docket No. 2019-281-S
–––––––––––––––––––––––––––––––––––––––––––––––––––––––––––––––––––––––––––––––––––––––––––––––––––
14
1
The earnings of the companies in the S&P 500 eventually recovered, but large 2
swings also increase uncertainty, risk, and the cost of equity. Water utility company 3
earnings, on the other hand, are less volatile, less risky, and indicate a relatively lower cost 4
of equity. 5
It is important to consider the results of my cost of equity models (DCF and CAPM) in 6
the context of current financial market conditions as follows: 7
1. Stock prices have crashed. The S&P 500, Dow Jones Industrial Average, and 8
other stock indices fell faster in the second half of March 2020 than during the 9
2007-2008 financial crisis, the crash of 1987, or the Great Depression. As of March 10
23rd, the S&P 500 had fallen approximately 34% from its all-time high reached on 11
February 19, 2020, reaching levels below its price on Trump’s inauguration day. 12
ELECTR
ONICALLY
FILED-2020
May
264:03
PM-SC
PSC-D
ocket#2019-281-S
-Page16
of80
29094
Chart 1: EPS Comparison - Financial Crisis 2007-2008S&P 500 vs. Water Proxy Group
29094
1C016
094
2004 2006 2C06 ~ 2007 2008 2C09 2010
-100X
~ ~ ~ S&P SCO Water Proxy Group
Direct Testimony of Aaron L. Rothschild – Cost of Capital Docket No. 2019-281-S
–––––––––––––––––––––––––––––––––––––––––––––––––––––––––––––––––––––––––––––––––––––––––––––––––––
15
Water utility stocks have fallen too, but much less than the overall market, only 1
13% off their peak reached in February during the same time period. 2
2. Low interest rates and a steep yield curve. As short-term treasury yields reach 3
0%, long-term rates have dropped sharply as well. The difference between long-4
term and short-term yields, referred to as the yield curve, has increased. A steep 5
yield curve (where long-term yields are significantly higher than short-term yields) 6
indicates investors expect the economy to improve. 7
3. Credit spreads have increased sharply. The spread between the yield investors 8
demand to purchase U.S. Corporate Bonds and U.S. Treasury bonds (see Chart 6) 9
has increased significantly since the COVID-19 pandemic started, but it remains 10
lower than during the financial crisis of 2007-2008. 11
4. Investors expect high short-term stock price volatility to decrease. In March 12
2020, the Market Volatility Index (“VIX”) reached levels not seen since the 13
financial crisis of 2007-2008, and even set all-time records. Market data indicates 14
that investors expect volatility to decrease, however. 15
. 16
A. Stock Price Trends 17
Q. WHAT, IF ANYTHING, DOES STOCK MARKET DATA INDICATE WITH 18
REGARD TO THE COST OF EQUITY? 19
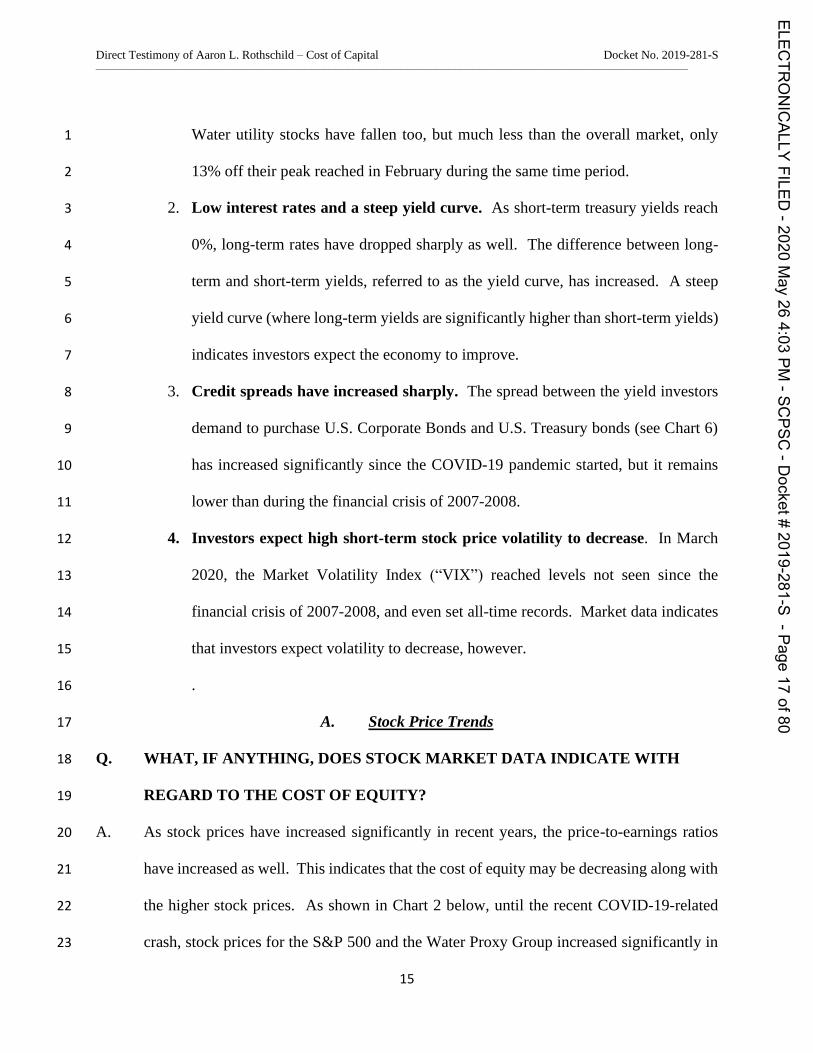
A. As stock prices have increased significantly in recent years, the price-to-earnings ratios 20
have increased as well. This indicates that the cost of equity may be decreasing along with 21
the higher stock prices. As shown in Chart 2 below, until the recent COVID-19-related 22
crash, stock prices for the S&P 500 and the Water Proxy Group increased significantly in 23
ELECTR
ONICALLY
FILED-2020
May
264:03
PM-SC
PSC-D
ocket#2019-281-S
-Page17
of80
Direct Testimony of Aaron L. Rothschild – Cost of Capital Docket No. 2019-281-S
–––––––––––––––––––––––––––––––––––––––––––––––––––––––––––––––––––––––––––––––––––––––––––––––––––
16
the two and a half years since PUI filed their last rate case in August 2017. At their peaks, 1
the Water Proxy Group had increased 67.56% while the S&P 500 had increased 37.4%. 2
Even considering the significant losses due to COVID-19, the Water Proxy Group was up 3
44.98% as of April 28. In comparison, the S&P 500 lost a greater percentage of its gains 4
than the Water Proxy Group in the recent market crash. As of April 28, the S&P 500 was 5
only 16.18% higher than it was as of mid-August 2017. 6
7
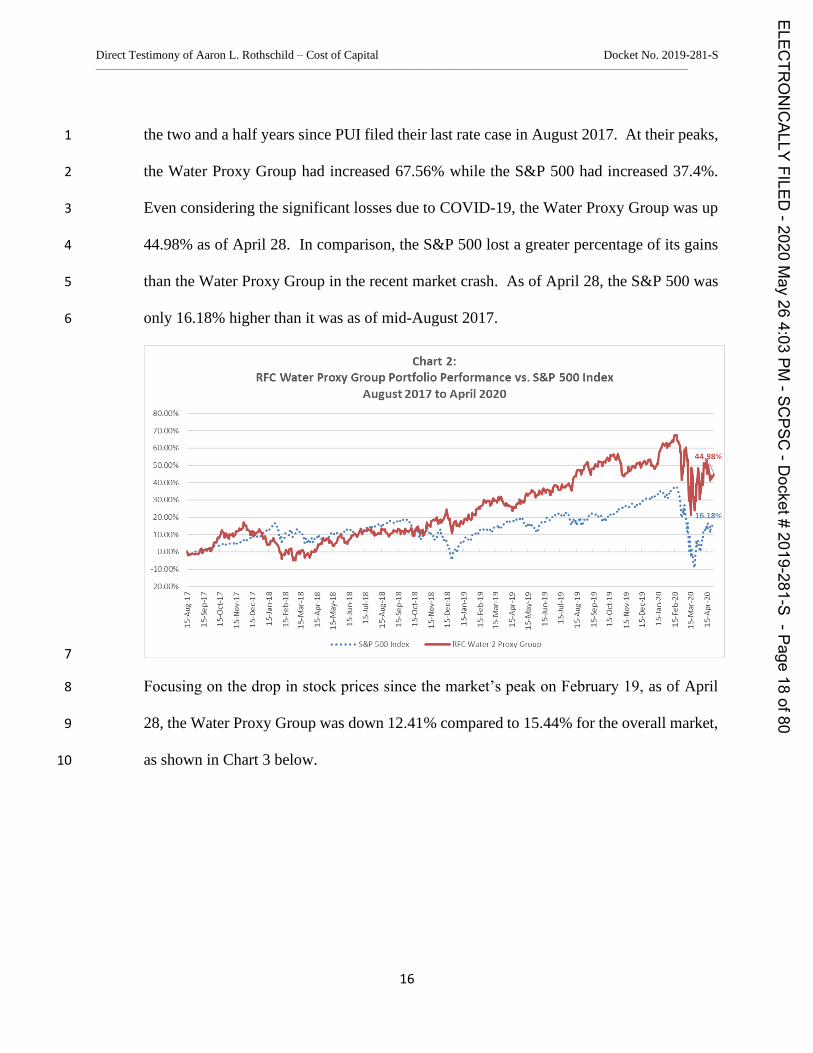
Focusing on the drop in stock prices since the market’s peak on February 19, as of April 8
28, the Water Proxy Group was down 12.41% compared to 15.44% for the overall market, 9
as shown in Chart 3 below. 10
ELECTR
ONICALLY
FILED-2020
May
264:03
PM-SC
PSC-D
ocket#2019-281-S
-Page18
of80
80 00%
20.00%
60 00%
50.00%
40 00%
30.00%
20 00%
10.00%
Chart 2:RFC Water Proxy Group Portfolio Performance vs. S&P 5001ndex
August 2017 to April 2020
-10.00%
20.MP4
a o z 42* * * *
0
*
te
z raJ
s r* *
O
z oa* *
SAP 3CO Index xpcyyater 2 Proxy Group
Direct Testimony of Aaron L. Rothschild – Cost of Capital Docket No. 2019-281-S
–––––––––––––––––––––––––––––––––––––––––––––––––––––––––––––––––––––––––––––––––––––––––––––––––––
17
1
2
B. Interest Rates 3
Q. PLEASE DISCUSS THE CURRENT INTEREST RATE ENVIRONMENT AND 4
WHAT IT INDICATES REGARDING THE COST OF EQUITY. 5
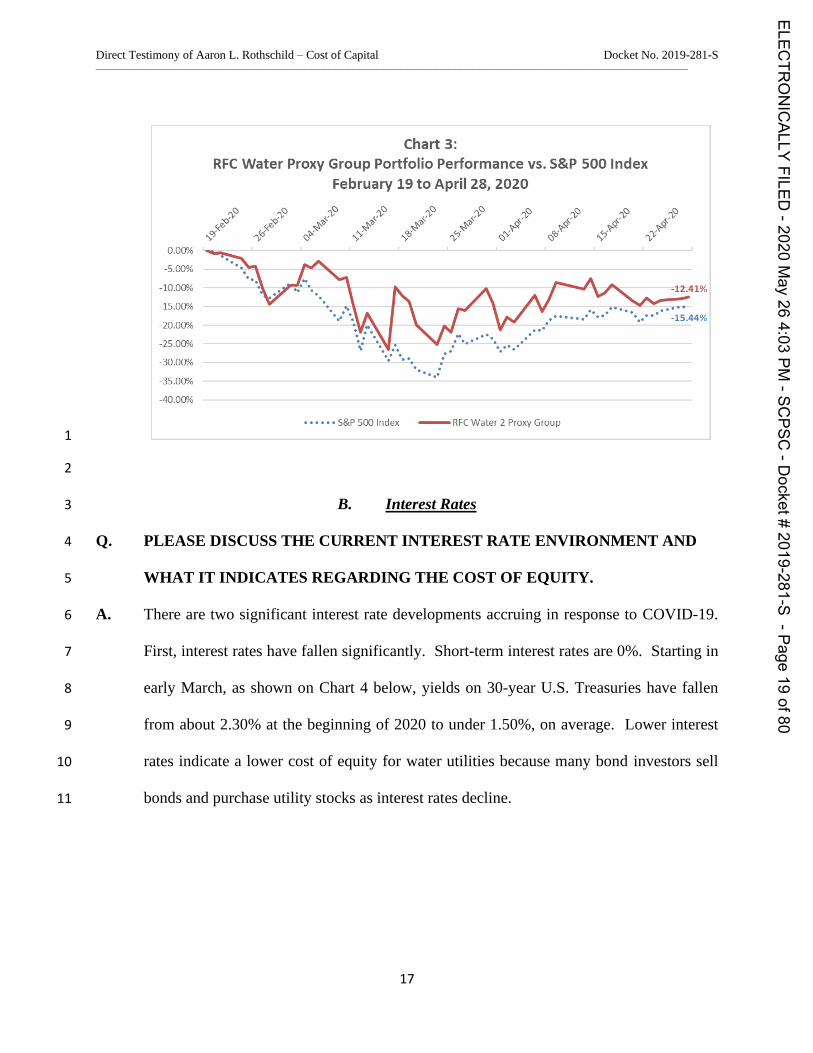
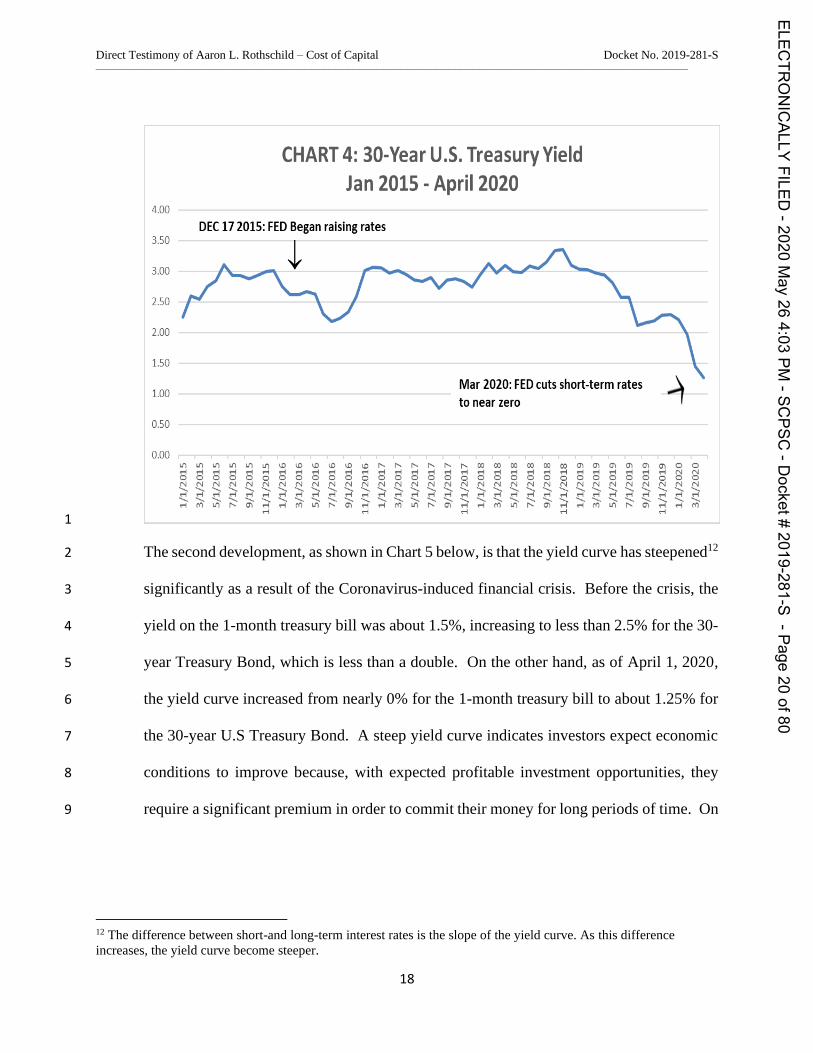
A. There are two significant interest rate developments accruing in response to COVID-19. 6
First, interest rates have fallen significantly. Short-term interest rates are 0%. Starting in 7
early March, as shown on Chart 4 below, yields on 30-year U.S. Treasuries have fallen 8
from about 2.30% at the beginning of 2020 to under 1.50%, on average. Lower interest 9
rates indicate a lower cost of equity for water utilities because many bond investors sell 10
bonds and purchase utility stocks as interest rates decline. 11
ELECTR
ONICALLY
FILED-2020
May
264:03
PM-SC
PSC-D
ocket#2019-281-S
-Page19
of80
0.00%
-5.001'10.00%
-15.00%
-20.00X
-25.00%
-30.00%
-35.00%
-40.00%
Chart 3:RFC Water Proxy Group Portfolio Performance vs. S&P 500 Index
February 19 to April 28, 2020
~O RO no no no no gO gO gO Ro
'y 3 O 5 5 3 O O
1%i
4%
~ ~ 5$P 500 Index RFCyyater 2 Proxy Group
Direct Testimony of Aaron L. Rothschild – Cost of Capital Docket No. 2019-281-S
–––––––––––––––––––––––––––––––––––––––––––––––––––––––––––––––––––––––––––––––––––––––––––––––––––
18
1
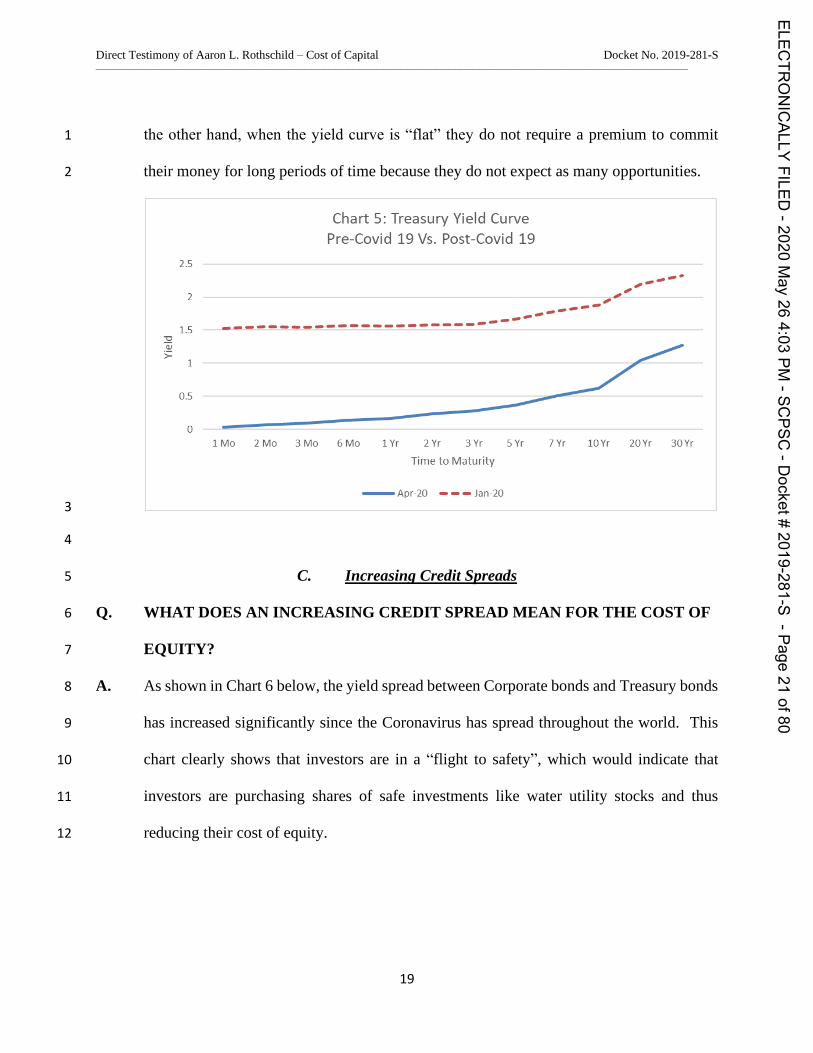
The second development, as shown in Chart 5 below, is that the yield curve has steepened12 2
significantly as a result of the Coronavirus-induced financial crisis. Before the crisis, the 3
yield on the 1-month treasury bill was about 1.5%, increasing to less than 2.5% for the 30-4
year Treasury Bond, which is less than a double. On the other hand, as of April 1, 2020, 5
the yield curve increased from nearly 0% for the 1-month treasury bill to about 1.25% for 6
the 30-year U.S Treasury Bond. A steep yield curve indicates investors expect economic 7
conditions to improve because, with expected profitable investment opportunities, they 8
require a significant premium in order to commit their money for long periods of time. On 9
12 The difference between short-and long-term interest rates is the slope of the yield curve. As this difference
increases, the yield curve become steeper.
ELECTR
ONICALLY
FILED-2020
May
264:03
PM-SC
PSC-D
ocket#2019-281-S
-Page20
of80
CHART 4: 30-Year U.S. Treasury Yield
Jan 2015- April 20204.00
DEC 172015: FED Began raising rates
300
2.50
2.00
i
1.50
1.00
0.50
0.00ltl Ol
0 0N
M
III ill III
0 0 0N N N
III I Ol
Ol
0 0N
0 0N CV
M
IO
0 0N
Ol
I
0 0N
N0 0N N
Itl Itl
N0 0N N
Ol
0 CO
0 0 0tl N tl
M
0 CO 00 0 0N N N
III I Ol
CO Ol
0 0CI
Ol Ill
0 0N N
M M
Ol Ol OI
0 0 0N tl N
Mar 2020: FED cuts short-term ratesto near zero
0 0N0 0N
ttl
Direct Testimony of Aaron L. Rothschild – Cost of Capital Docket No. 2019-281-S
–––––––––––––––––––––––––––––––––––––––––––––––––––––––––––––––––––––––––––––––––––––––––––––––––––
19
the other hand, when the yield curve is “flat” they do not require a premium to commit 1
their money for long periods of time because they do not expect as many opportunities. 2
3
4
C. Increasing Credit Spreads 5
Q. WHAT DOES AN INCREASING CREDIT SPREAD MEAN FOR THE COST OF 6
EQUITY? 7
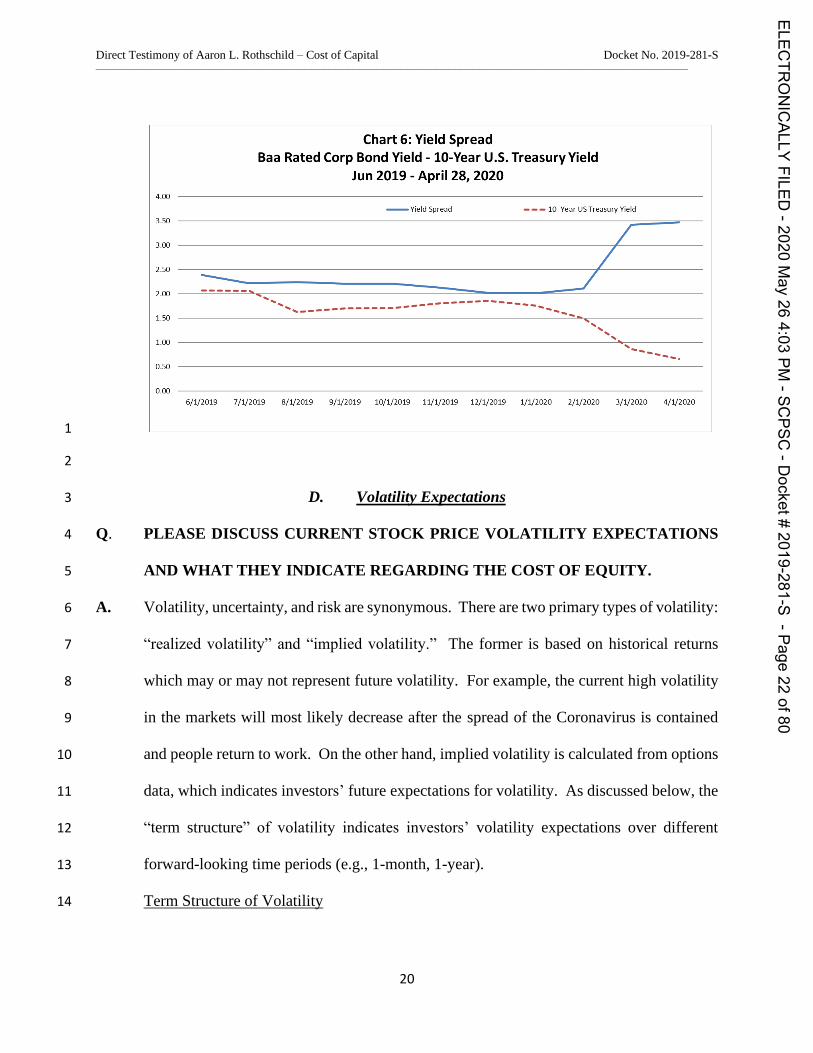
A. As shown in Chart 6 below, the yield spread between Corporate bonds and Treasury bonds 8
has increased significantly since the Coronavirus has spread throughout the world. This 9
chart clearly shows that investors are in a “flight to safety”, which would indicate that 10
investors are purchasing shares of safe investments like water utility stocks and thus 11
reducing their cost of equity. 12
ELECTR
ONICALLY
FILED-2020
May
264:03
PM-SC
PSC-D
ocket#2019-281-S
-Page21
of80
Chart 5: Treasury Yield CurvePre-Covid 19 Vs. Post-Covid 19
2.5
1.5
1
0.5
1Mo 2Mo 3Mo 6Mo 1Yr 2Yr 3Yr 5Yr 7Yr 10Yr 20Yr 30Yr
Time to Maturity
Apr-20 Jan-20
Direct Testimony of Aaron L. Rothschild – Cost of Capital Docket No. 2019-281-S
–––––––––––––––––––––––––––––––––––––––––––––––––––––––––––––––––––––––––––––––––––––––––––––––––––
20
1
2
D. Volatility Expectations 3
Q. PLEASE DISCUSS CURRENT STOCK PRICE VOLATILITY EXPECTATIONS 4
AND WHAT THEY INDICATE REGARDING THE COST OF EQUITY. 5
A. Volatility, uncertainty, and risk are synonymous. There are two primary types of volatility: 6
“realized volatility” and “implied volatility.” The former is based on historical returns 7
which may or may not represent future volatility. For example, the current high volatility 8
in the markets will most likely decrease after the spread of the Coronavirus is contained 9
and people return to work. On the other hand, implied volatility is calculated from options 10
data, which indicates investors’ future expectations for volatility. As discussed below, the 11
“term structure” of volatility indicates investors’ volatility expectations over different 12
forward-looking time periods (e.g., 1-month, 1-year). 13
Term Structure of Volatility 14
ELECTR
ONICALLY
FILED-2020
May
264:03
PM-SC
PSC-D
ocket#2019-281-S
-Page22
of80
Direct Testimony of Aaron L. Rothschild – Cost of Capital Docket No. 2019-281-S
–––––––––––––––––––––––––––––––––––––––––––––––––––––––––––––––––––––––––––––––––––––––––––––––––––
21
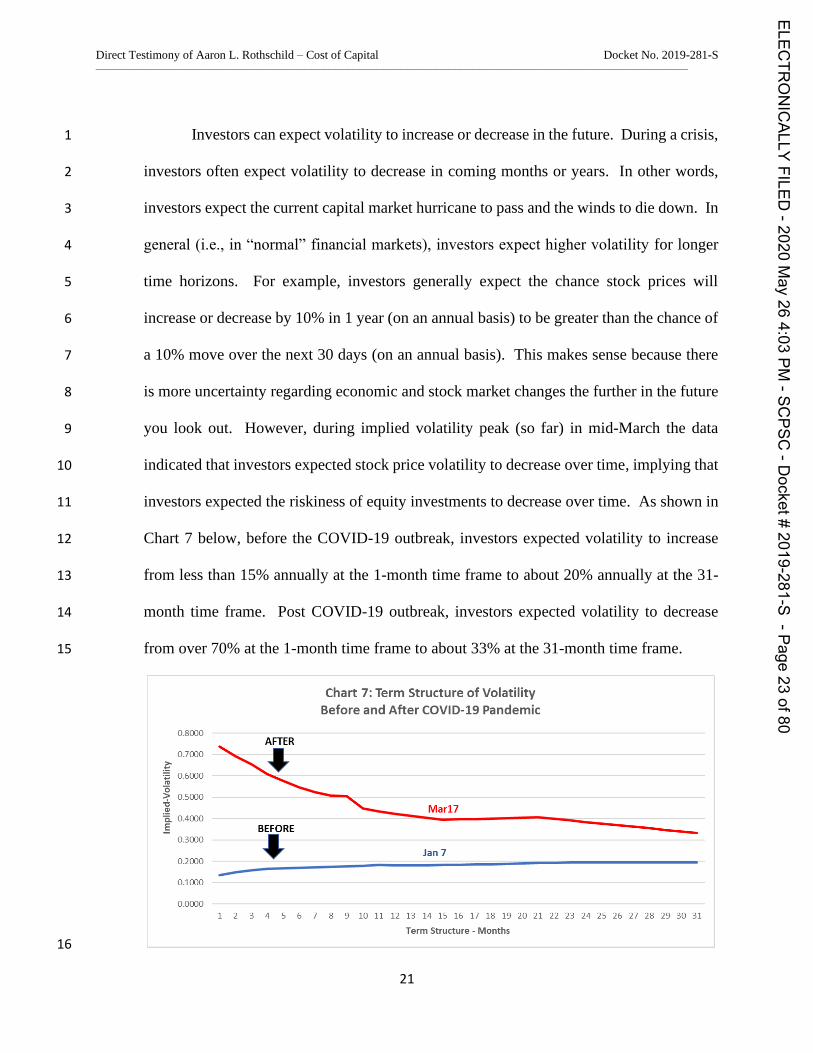
Investors can expect volatility to increase or decrease in the future. During a crisis, 1
investors often expect volatility to decrease in coming months or years. In other words, 2
investors expect the current capital market hurricane to pass and the winds to die down. In 3
general (i.e., in “normal” financial markets), investors expect higher volatility for longer 4
time horizons. For example, investors generally expect the chance stock prices will 5
increase or decrease by 10% in 1 year (on an annual basis) to be greater than the chance of 6
a 10% move over the next 30 days (on an annual basis). This makes sense because there 7
is more uncertainty regarding economic and stock market changes the further in the future 8
you look out. However, during implied volatility peak (so far) in mid-March the data 9
indicated that investors expected stock price volatility to decrease over time, implying that 10
investors expected the riskiness of equity investments to decrease over time. As shown in 11
Chart 7 below, before the COVID-19 outbreak, investors expected volatility to increase 12
from less than 15% annually at the 1-month time frame to about 20% annually at the 31-13
month time frame. Post COVID-19 outbreak, investors expected volatility to decrease 14
from over 70% at the 1-month time frame to about 33% at the 31-month time frame. 15
16
ELECTR
ONICALLY
FILED-2020
May
264:03
PM-SC
PSC-D
ocket#2019-281-S
-Page23
of80
Chart 7: Term Structure of VolatilityBefore and After COVID-19 Pandemic
0.8000
0.70DO
0.6000
O.SCOO'o
0.4COO
AFTER
0.3COO
0.20001an 7
0.10DO
0.00001 2 3 4 5 6 7 8 9 10 11 12 13 14 15 16 17 18 19 20 21 22 23 24 25 26 27 28 29 30 31
Term Structure - Months
Direct Testimony of Aaron L. Rothschild – Cost of Capital Docket No. 2019-281-S
–––––––––––––––––––––––––––––––––––––––––––––––––––––––––––––––––––––––––––––––––––––––––––––––––––
22
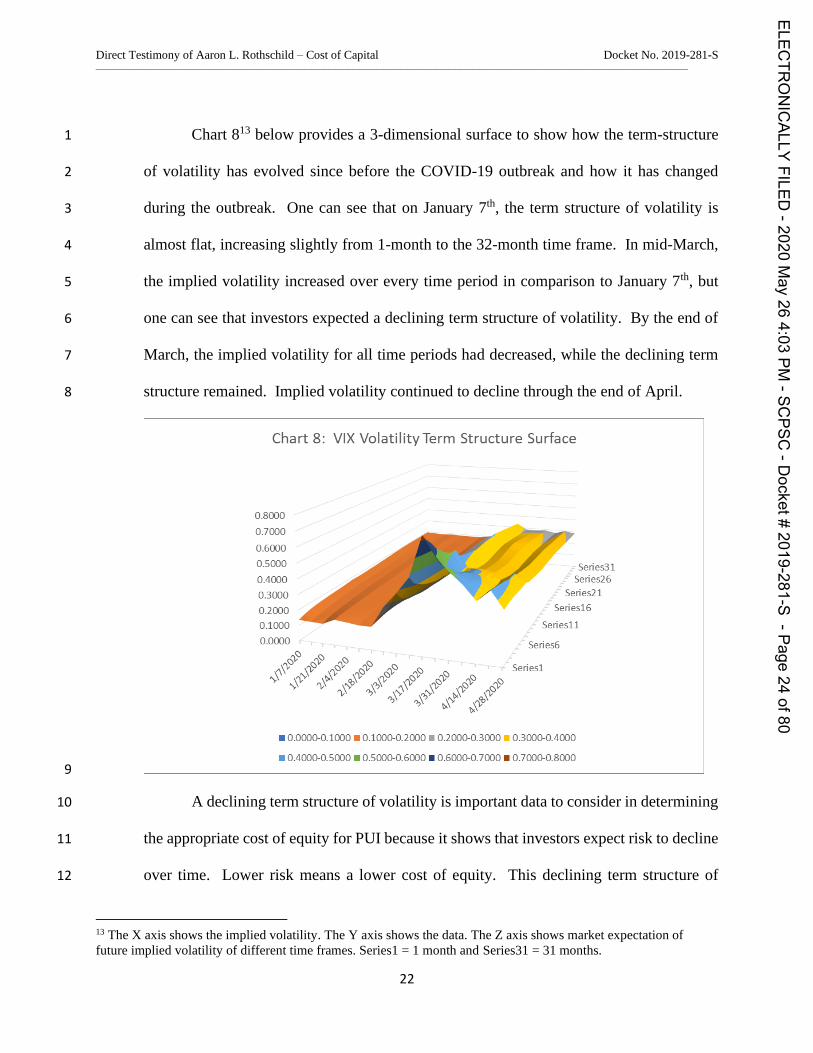
Chart 813 below provides a 3-dimensional surface to show how the term-structure 1
of volatility has evolved since before the COVID-19 outbreak and how it has changed 2
during the outbreak. One can see that on January 7th, the term structure of volatility is 3
almost flat, increasing slightly from 1-month to the 32-month time frame. In mid-March, 4
the implied volatility increased over every time period in comparison to January 7th, but 5
one can see that investors expected a declining term structure of volatility. By the end of 6
March, the implied volatility for all time periods had decreased, while the declining term 7
structure remained. Implied volatility continued to decline through the end of April. 8
9
A declining term structure of volatility is important data to consider in determining 10
the appropriate cost of equity for PUI because it shows that investors expect risk to decline 11
over time. Lower risk means a lower cost of equity. This declining term structure of 12
13 The X axis shows the implied volatility. The Y axis shows the data. The Z axis shows market expectation of
future implied volatility of different time frames. Series1 = 1 month and Series31 = 31 months.
ELECTR
ONICALLY
FILED-2020
May
264:03
PM-SC
PSC-D
ocket#2019-281-S
-Page24
of80
Chart 8: VIX Volatility Term Structure Surface
0.8000
0.7000
0.6000
0.6000
0.4000
0.3000
0.2000
0.1000
0.0000
o1 3O oo
o~ + o o&o os &o o
i~o i~K 4i~ qo o~ ~o
Series31= Series26Series21
Series16
SQ Il Qs1 1
Series6
Series1
~ 0.0000-0.1000 ~ 0.1C00-0.2000 ~ 0.200(10.3000 ~ 0.3000-0.4COO
~ 0.4000-0.6000 ~ O.SC00-0.6000 ~ 0.6000-0.7000 ~ 0.7000-0.8COO
Direct Testimony of Aaron L. Rothschild – Cost of Capital Docket No. 2019-281-S
–––––––––––––––––––––––––––––––––––––––––––––––––––––––––––––––––––––––––––––––––––––––––––––––––––
23
volatility is consistent with my DCF results showing that the cost of equity for water 1
utilities has not increased as a result of COVID-19. 2
3
Volatility Expectations – Water Utilities Compared to the S&P 500 4
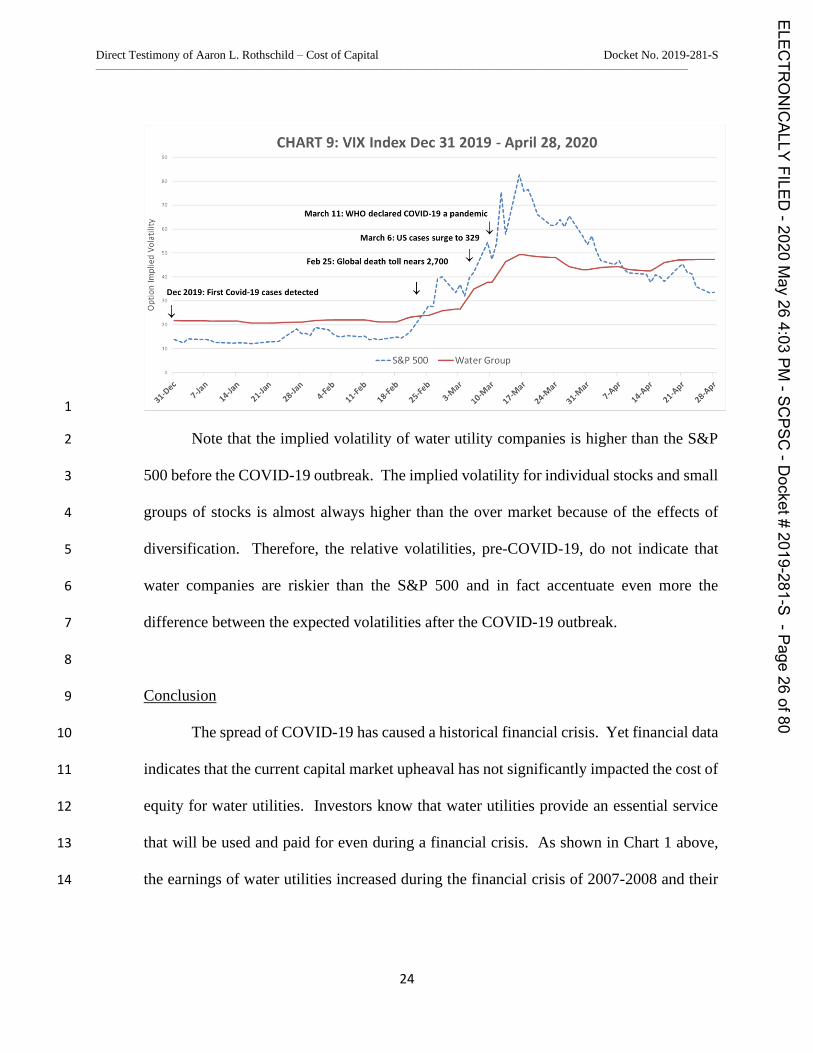
The blue line in Chart 9 below shows investors’ stock price volatility expectations 5
for the overall market (S&P 500) increased significantly as COVID-19 infections spread 6
to the U.S. and continued to grow exponentially around the world. In the middle of 7
February, investors expected an annualized change of about 13.00% over the next 30 days. 8
In mid-March, investors’ volatility expectations peaked at over 80.00%. As of April 28, 9
investors expected an annualized change of about 34.00%. The red line in Chart 9 shows 10
that investors’ volatility expectations for my Water Utility Group, as indicated by their 11
stock option prices, increased along with the market, but to a significantly lesser degree in 12
mid-March. Investors’ volatility expectations for water utility companies has not declined 13
as quickly as the overall market in April, however. Considering that individual companies, 14
and small portfolios of stocks, always have higher volatility than the overall market (as 15
evidenced in the early part of the chart and explained below), this does not indicate that the 16
cost of equity for water utility companies has increased because of COVID-19. The fact 17
that the implied volatility for water utility companies was lower than the overall market 18
during the peak of the market chaos indicates that water utility stocks are less risky than 19
the overall market. 20
ELECTR
ONICALLY
FILED-2020
May
264:03
PM-SC
PSC-D
ocket#2019-281-S
-Page25
of80
Direct Testimony of Aaron L. Rothschild – Cost of Capital Docket No. 2019-281-S
–––––––––––––––––––––––––––––––––––––––––––––––––––––––––––––––––––––––––––––––––––––––––––––––––––
24
1
Note that the implied volatility of water utility companies is higher than the S&P 2
500 before the COVID-19 outbreak. The implied volatility for individual stocks and small 3
groups of stocks is almost always higher than the over market because of the effects of 4
diversification. Therefore, the relative volatilities, pre-COVID-19, do not indicate that 5
water companies are riskier than the S&P 500 and in fact accentuate even more the 6
difference between the expected volatilities after the COVID-19 outbreak. 7
8
Conclusion 9
The spread of COVID-19 has caused a historical financial crisis. Yet financial data 10
indicates that the current capital market upheaval has not significantly impacted the cost of 11
equity for water utilities. Investors know that water utilities provide an essential service 12
that will be used and paid for even during a financial crisis. As shown in Chart 1 above, 13
the earnings of water utilities increased during the financial crisis of 2007-2008 and their 14
ELECTR
ONICALLY
FILED-2020
May
264:03
PM-SC
PSC-D
ocket#2019-281-S
-Page26
of80
CHART 9: VIX Index Dec 31 2019 - April 28, 2020
o
E
o De
O
rI
I
March 11: WHO declared COVID-19 a pandemic
March 6: US cases surge to 919,h r
sr
— -5&P 500 —Water Group
a(0
L
ec'o ec'c ao es ao eoha'M hx vh ym her hx h'o'h'u ne lr 9'r
Direct Testimony of Aaron L. Rothschild – Cost of Capital Docket No. 2019-281-S
–––––––––––––––––––––––––––––––––––––––––––––––––––––––––––––––––––––––––––––––––––––––––––––––––––
25
relatively strong stock prices during the current crisis indicate that investors expect water 1
utility company earnings to remain strong in this crisis as well. 2
Although stock and bond prices are currently highly volatile, market data indicates 3
that investors expect the market to calm down in about 6 months. The steep upwardly 4
sloping treasury yield curve also indicates that investors see better times ahead. 5
Every financial crisis is unique, and this one is no exception. But it seems that, as 6
has been the case during financial crises in the past, investors do not require a higher cost 7
of equity for water utilities despite the current market turbulence. 8
V. COST OF EQUITY CALCULATION 9
A. Overview 10
Q. PLEASE PROVIDE YOUR DEFINITION OF THE COST OF CAPITAL. 11
A. The cost of capital is the return investors require to provide capital to PUI based on current 12
capital markets. The spread of COVID-19 has made it more challenging to determine the 13
current cost of capital because it has drastically increased the speed and intensity of capital 14
market change. Stock markets constantly go up and down, but despite the ebb and flow of 15
financial markets, the data used in testimony generally remains up to date (enough) 16
throughout the proceeding and when it is time to set rates. Because of the current COVID-17
19-induced financial crisis, it is particularly important to consider model results in the 18
context of extreme financial turbulence. In order to do this, it is critical to consider how 19
model results change over time throughout this crisis. 20
My cost of equity (“COE”) recommendation is my opinion of the return investors 21
require to provide equity capital to PUI based on current capital markets. My 22
ELECTR
ONICALLY
FILED-2020
May
264:03
PM-SC
PSC-D
ocket#2019-281-S
-Page27
of80
Direct Testimony of Aaron L. Rothschild – Cost of Capital Docket No. 2019-281-S
–––––––––––––––––––––––––––––––––––––––––––––––––––––––––––––––––––––––––––––––––––––––––––––––––––
26
recommendation is consistent with the following legal standards set by the United States 1
Supreme Court for a fair rate of return: 2
The return to the equity owner should be commensurate with returns on investments 3
in other enterprises having corresponding risks.14 4 5
And 6
…sufficient to…support its credit and…raise the money necessary for the proper 7
discharge of its public duties.15 8
9
Because the cost of equity is not a published figure like a bond yield, some 10
interpretation is required to determine the appropriate market price. My cost of equity 11
recommendation is based on my computation of what the market indicates investors require 12
(return on investment) to provide capital to companies with comparable risk to PUI. 13
As explained below, I use current market prices (e.g. stocks, bonds, options), which 14
measures investors’ expectations directly, instead of relying solely on historical data and 15
analyst forecasts. 16
A cost of equity based on market prices (market-based) is superior to a cost of 17
equity based on historical data (non-market-based) for two reasons: 18
• The cost of equity that PUI has to pay investors is based on capital markets. Interest 19
rates remain at historical low levels after a persistent downtrend since the early 1980s. 20
It is possible interest rates will increase, but if the marketplace expected interest rates 21
to change, then that would already be part of current prices. 22
14 Federal Power Commission v. Hope Natural Gas Company (1944) 320 U.S. 591, 603. 15 Bluefield Water Works & Improvement Company v. Public Service. Commission of the State of Virginia (1923)
262 U.S. 679, 692-693.
ELECTR
ONICALLY
FILED-2020
May
264:03
PM-SC
PSC-D
ocket#2019-281-S
-Page28
of80
Direct Testimony of Aaron L. Rothschild – Cost of Capital Docket No. 2019-281-S
–––––––––––––––––––––––––––––––––––––––––––––––––––––––––––––––––––––––––––––––––––––––––––––––––––
27
• Capital markets are unpredictable. Regarding capital markets’ unpredictability, 1
investment guru Warren Buffet recently gave the following advice to investors: 2
“They should not listen to a lot of the jabbering about what the market is going to 3 do tomorrow, or next week or next month because nobody knows.”16 4
5 Research, which I will present later in my testimony, supports Mr. Buffet’s advice 6
to investors and my opinion that the cost of equity should be based on current capital 7
markets. Current capital markets are our best source of investors’ expectations regarding 8
future capital markets. 9
Current market prices of stocks and bonds reflect investors’ forecasts for long-term 10
interest rates and capital markets in general. If, indeed, investors in aggregate should be 11
expecting an increase in interest rates, adding a separate factor for this on top of what is 12
already indicated in market prices would amount to a double-count. 13
Q. WHICH COMPANIES DID YOU INCLUDE IN YOUR COMPARABLE GROUP 14
OF UTILITY COMPANIES TO DETERMINE YOUR COST OF EQUITY 15
RECOMMENDATION? 16
A. I included the following 7 utility companies, referred to as the Water Proxy Group: (1) 17
American States Water, (2) American Water Works, (3) Aqua America, (4) California 18
Water Service Group, (5) Middlesex Water Company, (6) SJW Corp, and (7) York Water. 19
Mr. Walker’s proxy group includes the same 7 utility companies. 20
Q. HOW DID YOU ARRIVE AT YOUR COST OF EQUITY RECOMMENDATIONS? 21
A. I used both a constant growth and non-constant growth Discounted Cash Flow (“DCF”) 22
method. My constant growth DCF method determines growth based on the sustainable 23
16 PBS News Hour, June 26, 2017, Part 1 – America should stand for more than just wealth, says Warren Buffett.
ELECTR
ONICALLY
FILED-2020
May
264:03
PM-SC
PSC-D
ocket#2019-281-S
-Page29
of80
Direct Testimony of Aaron L. Rothschild – Cost of Capital Docket No. 2019-281-S
–––––––––––––––––––––––––––––––––––––––––––––––––––––––––––––––––––––––––––––––––––––––––––––––––––
28
retention procedure. My non-constant growth method is based on estimated dividend 1
growth for the next 5-years and capital gains. Additionally, I used a Capital Asset Pricing 2
Model (“CAPM”) based on current market data. Later in my testimony, I explain the theory 3
behind both the DCF and CAPM methods. 4
5
B. Discounted Cash Flow 6
Q. HOW DID YOU ARRIVE AT YOUR DCF-BASED COST OF EQUITY 7
RECOMMENDATION? 8
A. I used the constant growth form of the Discounted Cash Flow (“DCF”) method that 9
determines growth based on the sustainable retention growth procedure and a non-constant 10
DCF method. My constant growth form DCF analysis indicates a cost of equity range of 11
between 8.17% and 8.30% for the Water Proxy Group.17 The results of my non-constant 12
DCF method indicates a cost of equity of between 5.40% and 6.48% for the Water Proxy 13
Group.18 14
Q. WHAT IS THE DISCOUNTED CASH FLOW METHOD? 15
A. The DCF method, is an approach to determining the cost of equity. The method recognizes 16
that investors purchase common stock to receive future cash payments. These payments 17
come from: (a) current and future dividends, and (b) proceeds from selling stock. A rational 18
investor will buy stock to receive dividends and to ultimately sell the stock to another 19
investor at a gain. The price the new owner is willing to pay for stock is related to that 20
buyer’s expectation of future flow of dividends and the future expected selling price. The 21
17 See Exhibit ALR-4, page 1. 18 See Exhibit ALR-4, pages 2-3.
ELECTR
ONICALLY
FILED-2020
May
264:03
PM-SC
PSC-D
ocket#2019-281-S
-Page30
of80
Direct Testimony of Aaron L. Rothschild – Cost of Capital Docket No. 2019-281-S
–––––––––––––––––––––––––––––––––––––––––––––––––––––––––––––––––––––––––––––––––––––––––––––––––––
29
value of the stock is the discounted value of all future dividends until the stock is sold plus 1
the value of proceeds from the sale of the stock. 2
Q. HAVE INVESTORS ALWAYS USED THE DCF METHOD? 3
A. While investors who buy stock have always done so for future cash flow, the DCF approach 4
first appeared in the 1937 Harvard Ph.D. thesis of John Burr Williams titled The Theory of 5
Investment Value. Author Peter L. Bernstein once stated, Williams’ model for valuing a 6
security calls for the investor to make a long-run projection of a company’s future dividend 7
payments…”19 The Williams DCF model separately discounts each and every future 8
expected cash flow. Dividends and proceeds from the sale of stock are the expected cash 9
flows. Its accuracy is therefore unaffected by non-constant growth rates. Myron Gordon 10
and Eli Shapiro who helped to make this method widely used, referred to Williams’ work 11
in their paper published in 1956 “Equipment Analysis: The Required Rate of Profit.” 12
13
C. Constant Growth Form of the DCF Model 14
Q. YOU STATE YOU USED THE CONSTANT GROWTH FORM OF THE DCF 15
MODEL. WHAT IS THE CONSTANT GROWTH FORM OF THE DCF MODEL? 16
A. The constant growth form of the DCF model is a form of the DCF method that can be used 17
in determining the cost of equity when investors can reasonably expect that the growth of 18
retained earnings and dividends will be constant. 19
Retained earnings are funds that a company keeps in its treasury, so that it is 20
available for future needs, such as operating expenses, capital expenditures, debt payments, 21
19 P. BERNSTEIN, Capital Ideas: The Improbable Origins of Modern Wall Street (The Free Press, © 1992).
ELECTR
ONICALLY
FILED-2020
May
264:03
PM-SC
PSC-D
ocket#2019-281-S
-Page31
of80
Direct Testimony of Aaron L. Rothschild – Cost of Capital Docket No. 2019-281-S
–––––––––––––––––––––––––––––––––––––––––––––––––––––––––––––––––––––––––––––––––––––––––––––––––––
30
and new investments. These retained earnings show investors whether the company is 1
growing which, in turn, is a measure of the future indicator of dividends and the value of a 2
company’s stock. 3
Q. DESCRIBE HOW THE CONSTANT GROWTH MODEL WORKS. 4
A. The constant growth model is described by this equation k= D/P + g, where: 20 5
k= cost of equity; 6
D=Dividend; and 7
P=Market price of stock at time of the analysis. 8
and where: 9
g=the growth rate, where g= br + sv; 10
b=the earnings retention rate; 11
r=return on common equity investment (referred to below as “book equity”); 12
v=the fraction of funds raised by the sale of stock that increases the book value of 13
the existing shareholders’ common equity; and 14
s=the rate of continuous new stock financing. 15
The constant growth model is therefore correctly recognized to be: 16
k=D/P + (br +sv) 17
The cost of equity demanded by investors is the sum of two factors. The first factor 18
is the dividend yield. The second factor is growth (dividends and stock price). The logical 19
relationship among these factors is as follows: the dividend yield is calculated based on 20
current dividend payments while growth indicates what dividends and stock price will be 21
in the future. 22
Q. WHAT OTHER FACTORS IMPACT HOW ONE USES THE CONSTANT 23
GROWTH FORM OF THE DCF MODEL? 24
A. Sufficient care must be taken to be sure that the growth rate “g” is representative of the 25
constant sustainable growth. To obtain an accurate constant growth DCF result, the 26
20 M. GORDON, Cost of Capital to a Public Utility, at 32-33 (MSU Public Utility Studies 1974).
ELECTR
ONICALLY
FILED-2020
May
264:03
PM-SC
PSC-D
ocket#2019-281-S
-Page32
of80
Direct Testimony of Aaron L. Rothschild – Cost of Capital Docket No. 2019-281-S
–––––––––––––––––––––––––––––––––––––––––––––––––––––––––––––––––––––––––––––––––––––––––––––––––––
31
mathematical relationship between earnings, dividends, book value and stock price must 1
be respected. 2
Suppose one is faced with a situation where Value Line forecasts of growth are 3
being used as a source for inputs and Value Line projects different growth rates for earnings 4
per share and dividends per share. Under such conditions, the earnings per share growth 5
rate does not provide a reasonable proxy for earnings per share growth, and dividends per 6
share and stock price growth as well. Consider the following: 7
8
1. It is the lower dividend growth rate that makes it possible for more earnings 9
to be retained, which in turn makes the earnings per share growth rate higher than 10
it would be if dividends had in fact been modeled by Value Line to keep pace with 11
earnings per share growth. 12
2. A dividend growth rate that is lower than both the earnings per share growth rate 13
and the stock price growth rate means that the dividend yield will be going down. 14
However, the constant growth form of the DCF model has no mechanism to account 15
for the lower dividend yield investors would get if the Value Line projections were 16
correct. 17
Using an earnings per share growth rate in the constant growth form of the DCF 18
model will therefore result in an overstatement of the cost of equity whenever the earnings 19
per share growth rate that has been modeled is derived along with an expectation of a lower 20
dividend growth rate. This is because, under these conditions, the dividend yield portion of 21
the constant growth form of the equation will be overstated. 22
ELECTR
ONICALLY
FILED-2020
May
264:03
PM-SC
PSC-D
ocket#2019-281-S
-Page33
of80
Direct Testimony of Aaron L. Rothschild – Cost of Capital Docket No. 2019-281-S
–––––––––––––––––––––––––––––––––––––––––––––––––––––––––––––––––––––––––––––––––––––––––––––––––––
32
The basic difference between the use of an analysts’ earnings per share growth rate 1
in the constant growth DCF formula and using the “br” (b (the earnings retention rate) X r 2
(rate of return on common equity investment)) approach is that the “br” form, if properly 3
applied, eliminates the mathematical error caused by an inconsistency between the 4
expectations for earnings per share growth and dividends per share growth. Because it 5
eliminates that error, the results of a properly applied “br” approach will be superior to the 6
answer obtained from other approaches to the constant growth form of the DCF model. 7
This is not to say that even a properly applied “br” approach will be perfect. The self-8
correcting nature of a properly applied “br” to forecasted differences in earnings per share 9
and dividends per share growth rates helps mitigate the resultant error, but should not be 10
viewed as the perfect way to quantify the impact of expected non-constant growth rates. 11
Q. ARE YOU AWARE OF CLAIMS ALLEGING THAT THE “BR” APPROACH TO 12
THE CONSTANT GROWTH DCF MODEL IS FLAWED BECAUSE IT RELIES 13
ON THE VALUE OF THE FUTURE EXPECTED RETURN ON BOOK EQUITY 14
“R” TO ESTIMATE WHAT THE EARNED RETURN ON EQUITY SHOULD BE? 15
A. Yes. One common criticism is that it is not reasonable for the DCF to indicate a cost of 16
equity (market return) that is different (lower or higher) than the expected return on book 17
equity (accounting). There are multiple reasons why this concern is unfounded: 18
1. The constant growth form of the equation using “br” is: 19
k= D/P + (br + sv). 20
In this equation, k is the variable for the cost of equity, and r is the future expected 21
return on equity. The cost of equity, “k,” is not the same variable as the future 22
ELECTR
ONICALLY
FILED-2020
May
264:03
PM-SC
PSC-D
ocket#2019-281-S
-Page34
of80
Direct Testimony of Aaron L. Rothschild – Cost of Capital Docket No. 2019-281-S
–––––––––––––––––––––––––––––––––––––––––––––––––––––––––––––––––––––––––––––––––––––––––––––––––––
33
expected earned return on equity, “r.” In fact, there often is a large difference 1
between the two. 2
2. The correct value to use for “r” is the return on book equity expected by 3
investors as of the time the stock price and dividend data is used to quantify the D/P 4
term in the equation. Therefore, even if future events occur that may change what 5
investors expect for “r”, the computation of the cost of equity “k” remains correct 6
as of the time the computation was made. 7
3. The ability of a commission’s ROE decision to influence future cash flow 8
expectations is not unique to the retention growth DCF approach. The five-year 9
analysts’ earnings per share growth rate is a computation that is directly influenced 10
by what earnings per share will be in five years. Allowed ROE’s impact earning – 11
higher allowed returns lead to higher earnings growth because the higher allowed 12
returns the more earnings that is available for reinvestment. 13
Q. CAN CHANGES IN THE ACTUAL EARNED RETURNS IMPACT GROWTH 14
ABOVE AND BEYOND WHATEVER GROWTH RESULTS FROM EARNINGS 15
RETENTION? 16
A. Yes, but large short-term changes in earnings per share caused by a perceived change in 17
the future expected earned returns are unsustainable. The new perceived earned return on 18
book equity should be part of the computation, but the one-time growth spurt to get there 19
is no more indicative of the sustainable growth required in the constant growth DCF 20
formula than the temporary negative growth that occurs when a company has a bad year. 21
Q. HOW HAVE YOU IMPLEMENTED THE CONSTANT GROWTH FORM OF THE 22
DCF MODEL IN THIS CASE? 23
ELECTR
ONICALLY
FILED-2020
May
264:03
PM-SC
PSC-D
ocket#2019-281-S
-Page35
of80
Direct Testimony of Aaron L. Rothschild – Cost of Capital Docket No. 2019-281-S
–––––––––––––––––––––––––––––––––––––––––––––––––––––––––––––––––––––––––––––––––––––––––––––––––––
34
A. I have applied the constant growth form of the DCF model by staying true to the 1
mathematically derived “k=D/P + (br + sv)” form of the DCF model. I have also taken care 2
to fully allocate all future expected earnings to either future cash flow in the form of 3
dividends (“D”) or to retained earnings (the retention rate, “b”). This extra accuracy is 4
obtained only when the retention rate “b” is derived from the values used for “D” and “r,” 5
rather than independently. 6
Q. PLEASE EXPLAIN HOW YOU OBTAINED THE VALUES TO INPUT INTO THE 7
CONSTANT GROWTH FORM OF THE DCF METHOD. 8
A. The DCF model generally calls for the use of the dividend expected over the next year. A 9
reasonable way to estimate next year’s dividend rate is to increase the quarterly dividend 10
rate by ½ of the current actual quarterly dividend rate. This is a good approximation of the 11
rate that would be obtained if the full prior year’s dividend were escalated by the entire 12
growth rate.21 13
I obtained the stock price—“P”—used in my DCF analysis from the closing prices 14
of the stocks on April 28, 2020. I also obtained an average stock price for the 12 months 15
ending April 28, 2020 by averaging the high and low stock prices for the year. 16
21 For example, assume a company paid a dividend of $0.50 in the first quarter a year ago, and has a dividend growth
rate of 4 % per year. This dividend growth rate equals (1.04)^4-1=0.00985 % per quarter. Thus, the dividend is $0.5049
in the second quarter, $0.5099 in the third quarter, and $0.5149 in the fourth quarter. If that 4 % per annum growth
continues into the following year, then the dividend would be $0.5199 in the 1st quarter, $0.5251 in the 2nd quarter,
$0.5303 in the 3rd quarter, and $0.5355 in the 4th quarter. Thus, the total dividends for the following year equal $2.111
(0.5199 + 0.5251 + 0.5303 + 0.5355). I computed the dividend yield by taking the current quarter (the $0.5149 in the
4th quarter in this example), and multiplying it by 4 to get an annual rate of $2.06. I then escalated this $2.06 by ½ the
4 % growth rate, which means it is increased by 2 %. $2.06 x 1.02= $2.101, which is within one cent of the $2.111
obtained in the example.
ELECTR
ONICALLY
FILED-2020
May
264:03
PM-SC
PSC-D
ocket#2019-281-S
-Page36
of80
Direct Testimony of Aaron L. Rothschild – Cost of Capital Docket No. 2019-281-S
–––––––––––––––––––––––––––––––––––––––––––––––––––––––––––––––––––––––––––––––––––––––––––––––––––
35
I based the value of the future expected return on equity— “r” —on the average 1
return on book equity expected by Value Line, adjusted in consideration of recent returns. 2
I also made a computation that was based on a review of both the earned return on equity 3
consistent with analysts’ consensus earnings growth rate expectations and on the actual 4
earned returns on equity. For a stable industry such as utility companies, investors will 5
typically look at actual earned returns on equity as one meaningful input into what can be 6
expected for future earned returns on book equity. See Exhibit ALR-4, page 1. 7
This return on book equity expectation used in the DCF method to compute growth 8
must not be confused with the cost of equity. Since the stock prices for the comparative 9
companies are considerably higher than their book value, the return investors expect to 10
receive on their market price investment is considerably less than whatever is the 11
anticipated return on book value. If the market price is low relative to book value, the cost 12
of equity will be higher than the future expected return on book equity, and if the market 13
price is high, then the return on book equity will be less than the cost of equity. 14
In addition to growing through the retention of earnings, utility companies also 15
grow by selling new common stock. Selling new common stock increases a company’s 16
growth. I quantified this growth caused by the sale of new common stock by multiplying 17
the amount that the actual market-to-book ratio exceeds 1.0, by the compound annual 18
growth rate of stock that Value Line forecasts. The results of that computation are shown 19
on line 4 of Exhibit ALR-4, page 1. 20
Pure financial theory prefers concentrating on the results from the most current 21
price because investors cannot purchase stock at historical prices. There is a legitimate 22
concern, however, about the potential distortion of using just a single price. I present DCF 23
ELECTR
ONICALLY
FILED-2020
May
264:03
PM-SC
PSC-D
ocket#2019-281-S
-Page37
of80
Direct Testimony of Aaron L. Rothschild – Cost of Capital Docket No. 2019-281-S
–––––––––––––––––––––––––––––––––––––––––––––––––––––––––––––––––––––––––––––––––––––––––––––––––––
36
results based on the most recent stock pricing data (April 28, 2020) as well as the average 1
of the high and low stock price over the past 12 months to obtain a range of reasonable 2
values. As shown in Exhibit ALR-4, page 1, the DCF result based on the average of the 3
high and low stock price for the year ending April 28, 2020 is 8.17%. The DCF result 4
based on the stock price as of April 28, 2020 is 8.30%. Exhibit ALR-4, page 1, shows more 5
of the specifics of how I implemented the constant growth form of the DCF model for the 6
Water Proxy Group. 7
Q. PLEASE EXPLAIN HOW YOU DETERMINED WHAT VALUE TO USE FOR “R” 8
WHEN COMPUTING GROWTH IN YOUR CONSTANT GROWTH FORM OF 9
THE DCF MODEL. 10
A. The inputs I considered are shown in Footnote [C] of Exhibit ALR-4, page 1. The value of 11
“r” that is appropriate to use in the DCF formula is the value anticipated by investors to be 12
maintained on average in the future. This Exhibit shows that the average future return on 13
equity forecasted by Value Line for the Water Proxy Group between 2020 2023-2025 is 14
12.21%. The same footnote also shows that the future expected return on equity derived 15
from the Zacks consensus forecast is 7.40%, and that the actual returns on equity earned 16
by the Water Proxy Group on average were 11.20% in 2017, 10.24% in 2018 and 9.68% 17
in 2019. Based on the combination of the forecasted return on equity derived from the 18
Zacks consensus, the recent historical actual earned returns, and Value Line’s forecast, I 19
made the DCF growth computation using an 10.0%22 value of “r”. 20
22 I used 10.0% in consideration of historical returns, allowed returns and Value Line projected returns for the Water
Proxy Group.
ELECTR
ONICALLY
FILED-2020
May
264:03
PM-SC
PSC-D
ocket#2019-281-S
-Page38
of80
Direct Testimony of Aaron L. Rothschild – Cost of Capital Docket No. 2019-281-S
–––––––––––––––––––––––––––––––––––––––––––––––––––––––––––––––––––––––––––––––––––––––––––––––––––
37
Q. WHAT COST OF EQUITY IS INDICATED BY THE CONSTANT GROWTH 1
FORM OF THE DCF METHOD THAT YOU RELY ON FOR YOUR 2
RECOMMENDATION? 3
A. The result of my DCF analysis using the Constant Growth form of the DCF indicates a cost 4
of equity range of between 8.17% and 8.30% for the Water Proxy Group.23 Since these 5
DCF findings use analysts’ forecasts to derive sustainable growth (in part) and on analysts’ 6
forecasts of dividend growth and book value growth in the non-constant form of the DCF 7
method, the results should be considered as conservatively high. This is because, as 8
previously mentioned above, analysts’ forecasts of such growth have been notoriously 9
overstated. 10
My results are not as influenced by over-optimistic analysts’ forecasts as would 11
have been the case had I merely used analysts’ five-year earnings growth rate forecasts as 12
a proxy for long-term growth. This is because the DCF methods I use compute sustainable 13
growth rates, rather than growth rates that can exaggerate the growth rate due to assuming 14
that a relatively short-term forecast (five-years) will remain indefinitely. 15
16
D. Non-Constant Growth Form of the DCF Model 17
Q. PLEASE EXPLAIN HOW YOU IMPLEMENTED THE NON-CONSTANT 18
GROWTH FORM OF THE DCF MODEL. 19
A. The non-constant growth form of the DCF model determines the return on investment 20
expected by investors based on an estimate of each separate annual cash flow the investor 21
23 Exhibit ALR -4, page 1.
ELECTR
ONICALLY
FILED-2020
May
264:03
PM-SC
PSC-D
ocket#2019-281-S
-Page39
of80
Direct Testimony of Aaron L. Rothschild – Cost of Capital Docket No. 2019-281-S
–––––––––––––––––––––––––––––––––––––––––––––––––––––––––––––––––––––––––––––––––––––––––––––––––––
38
expects to receive. For the purpose of this computation, I’ve incorporated Value Line’s 1
detailed annual forecasts to arrive at the specific non-constant growth expectations that an 2
investor who trusts Value Line would expect. This implementation is shown on Exhibit 3
ALR-4, page 2-3. In the first stage, cash flow entry is the cash outflow an investor would 4
experience when buying a share of stock at the market price. The subsequent years of cash 5
flow are equal to the dividends per share that Value Line forecasts. For the intermediate 6
years of the forecast period in which Value Line does not provide a specific dividend, the 7
annual dividends were obtained by estimating that dividend growth would persist at a 8
compound annual rate. The cash flow at the end of the forecast period consists of both the 9
last year’s dividend forecast by Value Line, and the proceeds from the sale of the stock. 10
The stock price used to determine the proceeds from selling the stock was obtained by 11
estimating that the stock price would grow at the same rate at which Value Line forecasts 12
book value to grow. 13
Q. WHY DID YOU USE BOOK VALUE GROWTH TO PROVIDE THE ESTIMATE 14
OF THE FUTURE STOCK PRICE? 15
A. For any given earned return on book equity, earnings are directly proportional to the book 16
value. Furthermore, book value growth is the net result after the company produces 17
earnings, pays a dividend and also, perhaps, either sells new common stock at market price 18
or repurchases its own common stock at market price. 19
Once these cash flows are entered into an Excel spreadsheet, the compound annual 20
return an investor would achieve as a result of making this investment was obtained by 21
using the Internal Rate of Return (IRR) function built into the spreadsheet. As shown on 22
Exhibit ALR-4, pages 2-3, this multi-stage DCF model produced an average indicated cost 23
ELECTR
ONICALLY
FILED-2020
May
264:03
PM-SC
PSC-D
ocket#2019-281-S
-Page40
of80
Direct Testimony of Aaron L. Rothschild – Cost of Capital Docket No. 2019-281-S
–––––––––––––––––––––––––––––––––––––––––––––––––––––––––––––––––––––––––––––––––––––––––––––––––––
39
of equity of 5.40% based on the year-end stock price, and 6.48% based on average prices 1
for the year ending April 28, 2020 for the Water Proxy Group. 2
Q. YOUR NON-CONSTANT GROWTH DCF MODEL USES ANNUAL EXPECTED 3
CASH FLOWS. SINCE DIVIDENDS ARE PAID QUARTERLY RATHER THAN 4
ANNUALLY, HOW DOES THIS SIMPLIFICATION IMPACT YOUR RESULTS? 5
A. I used the annual model because it is easier to input the data and for observers to visualize 6
what is happening. By modeling cash flows to be annual rather than when they actually 7
are expected to occur causes a small overstatement of the cost of equity. 8
Q. WHY IS IT A SMALL OVERSTATEMENT IF YOU HAVE MODELED 9
DIVIDENDS TO BE RECEIVED SOME MONTHS AFTER INVESTORS 10
ACTUALLY EXPECT TO RECEIVE THEM? 11
A. The process of changing from an annual model to a quarterly model would require two 12
changes, not just one. A quarterly model would show dividends being paid sooner and 13
would also show earnings being available sooner. A company that receives its earnings 14
sooner, rather than at the end of the year, has the opportunity to compound them. Since 15
revenues, and therefore earnings, are essentially received every day, a company that is 16
supposed to earn an annual rate of 9.00% on equity would have to earn only 8.62% if the 17
return were compounded daily.24 This reduction from 9.00% to 8.62% would then be 18
partially offset by the impact of the quarterly dividend payment to bring the result of 19
switching from the simplifying annual model closer to, but still a bit below 9.00%. 20
24 (1+.0862/365)^365=1.09=9.00 %.
ELECTR
ONICALLY
FILED-2020
May
264:03
PM-SC
PSC-D
ocket#2019-281-S
-Page41
of80
Direct Testimony of Aaron L. Rothschild – Cost of Capital Docket No. 2019-281-S
–––––––––––––––––––––––––––––––––––––––––––––––––––––––––––––––––––––––––––––––––––––––––––––––––––
40
Q. BY USING CASH FLOW EXPECTATIONS AS THE VALUATION PARAMETER, 1
DOES THE NON-CONSTANT DCF MODEL STILL RELY ON EARNINGS? 2
A. Yes. It relies on an expectation of future cash flows. Future cash flows come from 3
dividends during the time the stock is owned and capital gains from the sale of the stock 4
once it is sold. Since earnings impact both dividends and stock price, the non-constant 5
DCF model still relies on earnings. 6
Every dollar of earnings is used for the benefit of stockholders, either in the form 7
of a dividend payment, or earnings reinvested for future growth in earnings and/or 8
dividends. Earnings paid out as a dividend have a different value to investors than earnings 9
retained in the business. Recognizing this difference and properly considering it in the 10
quantification process is a major strength of the DCF model, and is why the non-constant 11
DCF model as I have set forth is an improvement over either the P/E ratio or D/P methods. 12
Q. WHY IS THERE A DIFFERENCE TO INVESTORS IN THE VALUE OF 13
EARNINGS PAID OUT AS A DIVIDEND COMPARED TO THE VALUE OF 14
EARNINGS RETAINED IN THE BUSINESS? 15
A. The return on earnings retained in the business depends upon the opportunities available to 16
that company. If a regulated utility reinvests earnings in needed used and useful utility 17
assets, then those reinvested earnings have the potential to earn at whatever return is 18
consistent with ratemaking procedures allowed and the skill of management in prudently 19
operating the system. 20
When an investor receives a dividend, he can either reinvest it in the same or 21
another company or use it for other things, such as paying down debt or paying living 22
expenses. Although an investor could theoretically use the proceeds from any dividend 23
ELECTR
ONICALLY
FILED-2020
May
264:03
PM-SC
PSC-D
ocket#2019-281-S
-Page42
of80
Direct Testimony of Aaron L. Rothschild – Cost of Capital Docket No. 2019-281-S
–––––––––––––––––––––––––––––––––––––––––––––––––––––––––––––––––––––––––––––––––––––––––––––––––––
41
payments to simply buy more stock in the same company, when an investor increases his 1
investment in a company by purchasing more stock, the transaction occurs at market price. 2
However, when the same investor sees his investment in a company increase because 3
earnings are retained rather than paid as a dividend, the reinvestment occurs at book value. 4
Stated within the context of the DCF terminology: earnings retained in the business earn at 5
the future expected return on book equity “r,” and dividends used to purchase new stock 6
earn at the rate “k.” When the market price exceeds book value (that is, the market-to-7
book ratio exceeds 1.0), retained earnings are worth more than earnings paid out as a 8
dividend because “r” will be higher than “k.” Conversely, when the market price is below 9
book value, “k” will be higher than “r,” meaning that earnings paid out as a dividend earn 10
a higher rate than retained earnings. 11
Q. IF RETAINED EARNINGS WERE MORE VALUABLE WHEN THE MARKET-12
TO-BOOK RATIO IS ABOVE 1.0, WHY WOULD A COMPANY WITH A 13
MARKET-TO-BOOK RATIO ABOVE 1.0 PAY A DIVIDEND RATHER THAN 14
RETAIN ALL OF THE EARNINGS? 15
A. Retained earnings are more valuable than dividends only if there are sufficient 16
opportunities to profitably reinvest those earnings. Regulated utility companies are 17
allowed to earn the cost of capital only on assets that are used and useful in providing utility 18
service. Investing in assets that are not needed may not produce any return at all. For 19
unregulated companies, opportunities to reinvest funds are limited by the demands of the 20
business. For example, how many new computer chips can Intel profitably develop at the 21
same time? 22
ELECTR
ONICALLY
FILED-2020
May
264:03
PM-SC
PSC-D
ocket#2019-281-S
-Page43
of80
Direct Testimony of Aaron L. Rothschild – Cost of Capital Docket No. 2019-281-S
–––––––––––––––––––––––––––––––––––––––––––––––––––––––––––––––––––––––––––––––––––––––––––––––––––
42
Q. UNDER THE NON-CONSTANT DCF MODEL, IS IT NECESSARY FOR 1
EARNINGS AND DIVIDENDS TO GROW AT A CONSTANT RATE FOR THE 2
MODEL TO BE ABLE TO ACCURATELY DETERMINE THE COST OF 3
EQUITY? 4
A. No, because the non-constant form of the DCF model separately discounts each and every 5
future expected cash flow, it does not rely on any assumptions of constant growth. The 6
dividend yield can be different from period to period, and growth can bounce around in 7
any imaginable pattern without harming the accuracy of the answer obtained from 8
quantifying those expectations. When the non-constant DCF model is correctly used, the 9
answer obtained is as accurate as the estimates of future cash flow. 10
Q. WHAT COST OF EQUITY DOES YOUR NON-CONSTANT GROWTH DCF 11
METHOD INDICATE? 12
A. My non-constant growth DCF method indicates a cost of equity of between 5.40% and 13
6.48%.25 14
E. Capital Asset Pricing Model 15
Q. PLEASE DESCRIBE THE CAPM. 16
A. CAPM stands for “Capital Asset Pricing Model.” The CAPM relates return to risk; 17
specifically, it relates the expected return on an investment in a security to the risk of 18
investing in that security. The riskier the investment, the greater the expected return (i.e., 19
the cost of equity) investors require to make for that investment. 20
25 Exhibit ALR- 4, pages 2-3.
ELECTR
ONICALLY
FILED-2020
May
264:03
PM-SC
PSC-D
ocket#2019-281-S
-Page44
of80
Direct Testimony of Aaron L. Rothschild – Cost of Capital Docket No. 2019-281-S
–––––––––––––––––––––––––––––––––––––––––––––––––––––––––––––––––––––––––––––––––––––––––––––––––––
43
Investors in a firm’s equity face two types of risks: (1) firm-specific risk and (2) 1
market risk (financial analysts refer to this market risk as systematic risk). Firm-specific 2
risk refers to risks unique to the firm such as management performance and losing market 3
share to a new competitor. Investors can reduce firm-specific risk by purchasing stocks as 4
part of a diverse portfolio of companies, if they construct the portfolio to cause the firm-5
specific risk of individual companies to balance out. Market-related risk refers to potential 6
impacts from the overall market such as a recession or interest rate changes. This risk 7
cannot be removed by diversification, so the investor must bear it no matter what. Because 8
the investor has no option but to bear market risk, the investor’s cost of equity will reflect 9
that risk. The CAPM predicts that for a given equity security, the cost of equity has a 10
positive linear relationship to how sensitive the stock’s returns are to movements in the 11
overall market (e.g., S&P 500). A security’s market sensitivity is measured by its Beta.26 12
As shown in Chart 10 below, the higher the beta of a stock, the higher the company’s cost 13
of equity—the return required by the investor to invest in the stock. 14
26 The covariation of the return on an individual security with the return on the market portfolio.
ELECTR
ONICALLY
FILED-2020
May
264:03
PM-SC
PSC-D
ocket#2019-281-S
-Page45
of80
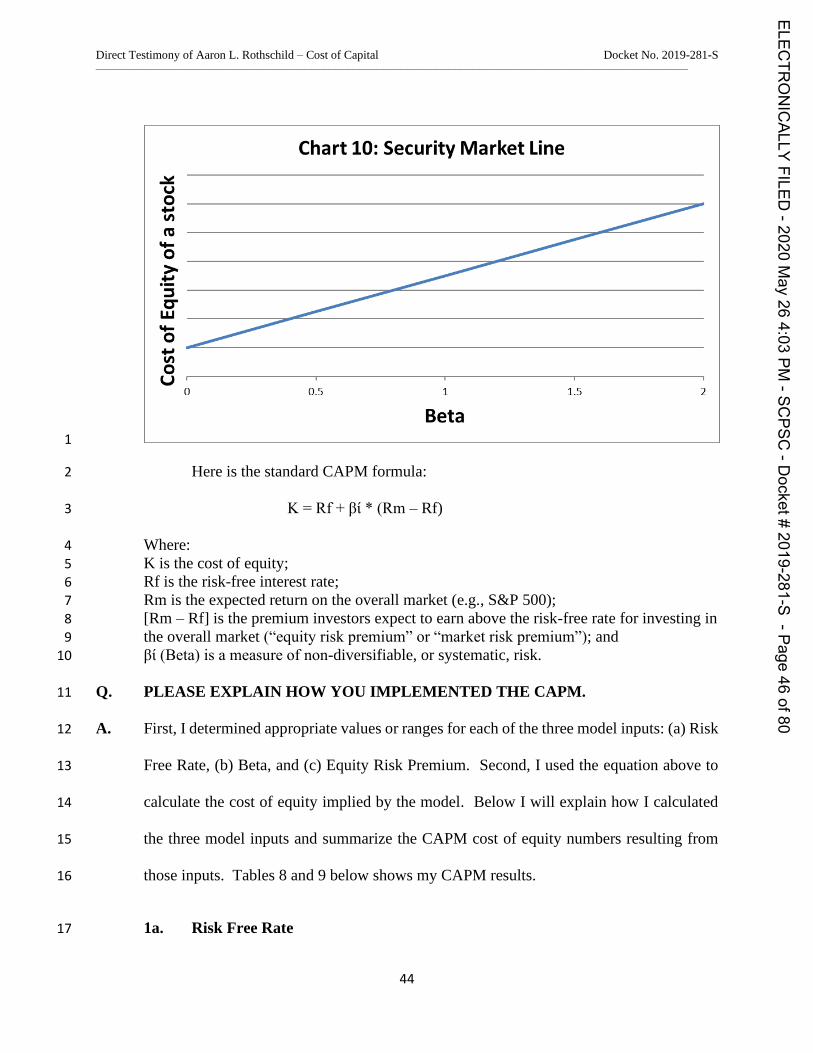
Direct Testimony of Aaron L. Rothschild – Cost of Capital Docket No. 2019-281-S
–––––––––––––––––––––––––––––––––––––––––––––––––––––––––––––––––––––––––––––––––––––––––––––––––––
44
1
Here is the standard CAPM formula: 2
K = Rf + βί * (Rm – Rf) 3
Where: 4
K is the cost of equity; 5 Rf is the risk-free interest rate; 6 Rm is the expected return on the overall market (e.g., S&P 500); 7
[Rm – Rf] is the premium investors expect to earn above the risk-free rate for investing in 8 the overall market (“equity risk premium” or “market risk premium”); and 9
βί (Beta) is a measure of non-diversifiable, or systematic, risk. 10
Q. PLEASE EXPLAIN HOW YOU IMPLEMENTED THE CAPM. 11
A. First, I determined appropriate values or ranges for each of the three model inputs: (a) Risk 12
Free Rate, (b) Beta, and (c) Equity Risk Premium. Second, I used the equation above to 13
calculate the cost of equity implied by the model. Below I will explain how I calculated 14
the three model inputs and summarize the CAPM cost of equity numbers resulting from 15
those inputs. Tables 8 and 9 below shows my CAPM results. 16
1a. Risk Free Rate 17
ELECTR
ONICALLY
FILED-2020
May
264:03
PM-SC
PSC-D
ocket#2019-281-S
-Page46
of80
Direct Testimony of Aaron L. Rothschild – Cost of Capital Docket No. 2019-281-S
–––––––––––––––––––––––––––––––––––––––––––––––––––––––––––––––––––––––––––––––––––––––––––––––––––
45
It is generally preferable to use the market yield on short-term U.S. treasuries yields 1
as the risk-free rate because these bonds have a beta close to zero. The Principles of 2
Corporate Finance states “The CAPM…calls for a short-term interest rate.”27 I chose to 3
use a risk-free rate based on both long- and short-term treasury yields, however, because, 4
as indicated by the steepness of the yield curve,28 investors expect short-term interest rates 5
to increase. My short-term risk-free rate is 0.11%,29 based on short-term U.S. Treasury 6
bills (3-months) as of April 28, 2020. My long-term risk free rate is 1.20%, based on the 7
yield of long-term U.S. Treasury bonds (30-years) as of April 28, 2020. U.S. government 8
bonds are reasonable to use as a risk-free rate because they have a negligible risk of default. 9
The value of short-term U.S. Treasury bills has a relatively low exposure to swings in the 10
overall market. The value of long-term U.S. Treasury bonds is relatively more exposed to 11
the market and therefore must be used with caution. I considered using a risk-free rate 12
based on subtracting the historical spread between long-term and short-term U.S. Treasury 13
bills from current long-term yields, as recommended by some financial textbooks.30 I did 14
not use this method because in the current capital markets, this method results in an 15
unreasonably low risk-free rate (under 0%). 16
17
1b. Beta 18
27 Brealey, Myers, and Allen (2017), Principles of Corporate Finance, 12th Edition, McGraw-Hill Irwin, New York,
page 228 28 The yield curve on U.S. Treasury bonds relates the yield to its time to maturity. We say the current yield curve is
steep because the difference in yield between short-term (near 0%) and long-term (over 1%) bonds is large in
percentage terms. 29 Exhibit ALR-5, page 7. 30 Brealey, Myers, and Allen (2017), Principles of Corporate Finance, 12th Edition, McGraw-Hill Irwin, New York,
page 228
ELECTR
ONICALLY
FILED-2020
May
264:03
PM-SC
PSC-D
ocket#2019-281-S
-Page47
of80
Direct Testimony of Aaron L. Rothschild – Cost of Capital Docket No. 2019-281-S
–––––––––––––––––––––––––––––––––––––––––––––––––––––––––––––––––––––––––––––––––––––––––––––––––––
46
Since the cost of equity should be based on investor expectations, I chose to use 1
two betas. My “forward beta” is based on forward-looking investor expectations of non-2
diversifiable risk. My “hybrid beta” is based on both forward-looking investor 3
expectations and historical return data. 4
Most published betas are based exclusively on historical return data. For example, 5
Value Line publishes a 5-year historical beta for each of the companies it covers. However, 6
it is also possible to calculate betas based on investors’ expectations of the probability 7
distribution of future returns. This probability distribution of future returns expected by 8
investors can be calculated based on the market prices of stock options. 9
A stock option is the right to buy or sell a stock at a specific price for a specified 10
amount of time. A call option is the right to buy a stock at a specified exercise or strike 11
price on or before a maturity date. A put option is the right to sell a stock at a specified 12
exercise or strike price on or before a maturity date. For example, a call option to purchase 13
Apple Computer stock for $230 on January 17, 2020 allows the owner the option (not the 14
obligation) to buy Apple stock for $230 on that date. At the end of July 2019, Apple stock 15
was trading at about $215 per share. Why would anyone pay for the right to buy a stock 16
higher than the current price? Investors who purchased those call options thought there 17
was a chance Apple stock would be trading higher than $230 on January 17, 2020, and 18
those options gave those investors the right to buy Apple stock for $230 and profit by 19
selling it at the market price on that date, if it was higher. The price of Apple’s stock was 20
$317.98 at the close of trading on January 17, 2020. Therefore, the investor who purchased 21
ELECTR
ONICALLY
FILED-2020
May
264:03
PM-SC
PSC-D
ocket#2019-281-S
-Page48
of80
Direct Testimony of Aaron L. Rothschild – Cost of Capital Docket No. 2019-281-S
–––––––––––––––––––––––––––––––––––––––––––––––––––––––––––––––––––––––––––––––––––––––––––––––––––
47
this call option for $635 on July 31, 2019 earned a profit of $8,16331 at expiry on January 1
17, 2020. On the other hand, the investor who purchased an Apple put option with the 2
same expiration date and strike price on July 31, 2019 would have lost the price of the 3
option ($2,248) and gained nothing on the expiration date because the right to sell Apple 4
stock for $230 when the price is over $300 is worthless. 5
The market prices of put options and call options provide information regarding the 6
probability distribution of future stock prices expected by investors. Using established 7
techniques, I am able to use price data for stock options of my Proxy Group companies and 8
the S&P 500 Index to determine investors’ return expectations, including the relationship 9
(covariance) between the return expectations for individual Proxy Group companies and 10
those for the overall market (S&P 500). This covariance between the expected returns for 11
my Proxy Group and for the S&P 500 indicates what investors expect betas will be in the 12
future. I refer to betas based on option price calculations as “option-implied betas.” 13
Traditionally, the betas used in CAPM calculations are calculated from historical 14
returns. This approach has strengths and weaknesses. An alternative way to calculate betas 15
is to incorporate investors’ return expectations by calculating option-implied betas as 16
explained in the previous paragraph. As discussed below, I have chosen to use both 17
historical and option-implied betas in my CAPM analysis. I chose to use option-implied 18
betas in my CAPM analysis because, among other reasons, studies have found that betas 19
calculated based on investor expectations (option-implied) provide information regarding 20
31 $8,163 profit from exercising call option ($31,798 from selling at $317.98 market price - $23,000 cost to purchase
at $230) - $635 ($6.35 X 100) option purchase price. Note: Each call option is the right to purchase 100 shares.
ELECTR
ONICALLY
FILED-2020
May
264:03
PM-SC
PSC-D
ocket#2019-281-S
-Page49
of80
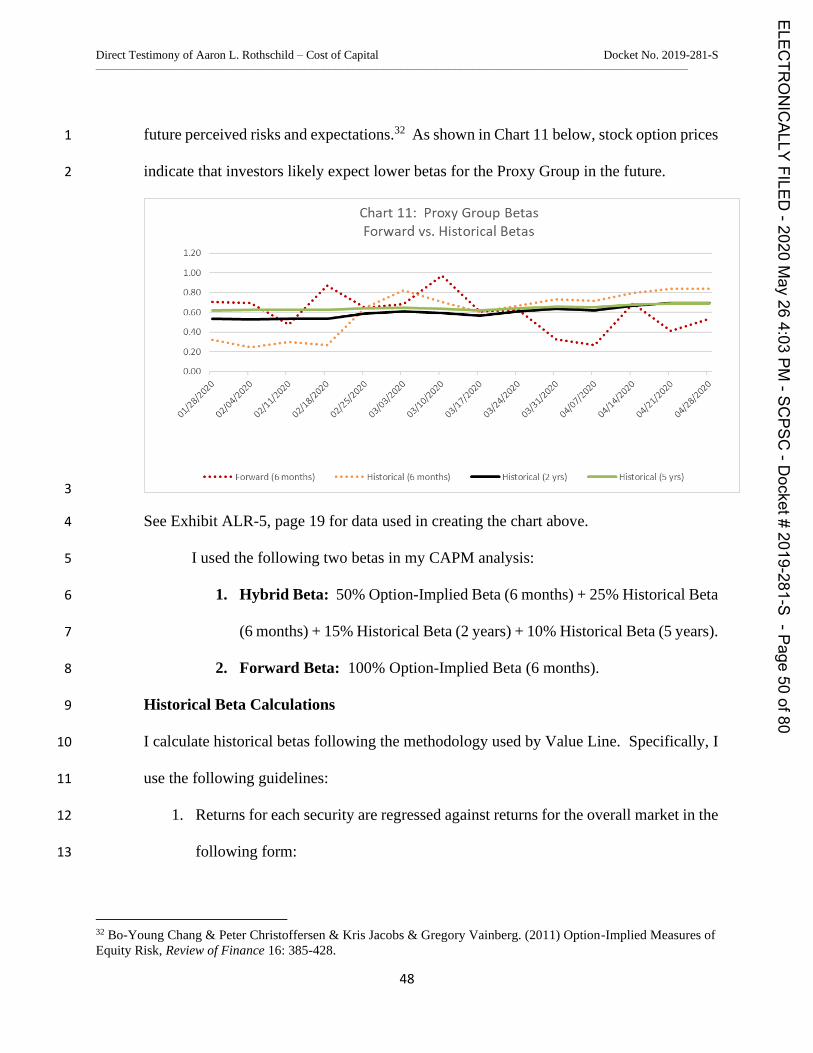
Direct Testimony of Aaron L. Rothschild – Cost of Capital Docket No. 2019-281-S
–––––––––––––––––––––––––––––––––––––––––––––––––––––––––––––––––––––––––––––––––––––––––––––––––––
48
future perceived risks and expectations.32 As shown in Chart 11 below, stock option prices 1
indicate that investors likely expect lower betas for the Proxy Group in the future. 2
3
See Exhibit ALR-5, page 19 for data used in creating the chart above. 4
I used the following two betas in my CAPM analysis: 5
1. Hybrid Beta: 50% Option-Implied Beta (6 months) + 25% Historical Beta 6
(6 months) + 15% Historical Beta (2 years) + 10% Historical Beta (5 years). 7
2. Forward Beta: 100% Option-Implied Beta (6 months). 8
Historical Beta Calculations 9
I calculate historical betas following the methodology used by Value Line. Specifically, I 10
use the following guidelines: 11
1. Returns for each security are regressed against returns for the overall market in the 12
following form: 13
32 Bo-Young Chang & Peter Christoffersen & Kris Jacobs & Gregory Vainberg. (2011) Option-Implied Measures of
Equity Risk, Review of Finance 16: 385-428.
ELECTR
ONICALLY
FILED-2020
May
264:03
PM-SC
PSC-D
ocket#2019-281-S
-Page50
of80
1.20
1.00
0.80
0.60
0.40
0.20
Chart 11: Proxy Group BetasForward vs. Historical Betas
0.00
OO OO OO nO nO OO OO OO OO OO nO OO OO OO
". Forward(6months) """ Historical (6months) Historical (2yrs) — Historical (6yrs)
Direct Testimony of Aaron L. Rothschild – Cost of Capital Docket No. 2019-281-S
–––––––––––––––––––––––––––––––––––––––––––––––––––––––––––––––––––––––––––––––––––––––––––––––––––
49
Ln (p I t / p I t-1) = a I + B I * Ln (p m t / p m t-1) 1
Where: 2
• p I t is the price of the security I at time t 3
• p I t-1 is the price of the security I one week before time t 4
• p m t and p m
t-1 are the corresponding values of the market index 5
• B I is the regression estimate of Beta for the security against the market 6
index 7
2. The natural log of the price ratio is used as an approximation of each return and no 8
adjustment is made for dividends paid during the week. 9
3. Weekly returns are calculated weekly on Tuesdays to minimize the effect of 10
holidays as much as possible. 11
4. Betas calculated using the regression method above are adjusted as per Blume 12
(1971) using the following formula: 13
Adjusted B I = 0.35 + 0.67 * Calculated B I 14
The only significant difference between my beta calculations and Value Line’s 15
calculations is that, whereas Value Line uses the NYSE Composite Index as the market 16
index, I use the S&P 500 Index. S&P 500 Index has a much larger number of options 17
traded, making the calculation of option-implied betas more reliable, and I wanted to make 18
my historical betas as comparable as possible to my option-implied betas. Value Line only 19
calculates betas every three months and always uses a five year period for the return 20
regression in their company reports33, whereas I use the same consistent methodology to 21
33 The offer betas calculated over different time periods on their website, including 3-years and 10-years.
ELECTR
ONICALLY
FILED-2020
May
264:03
PM-SC
PSC-D
ocket#2019-281-S
-Page51
of80
Direct Testimony of Aaron L. Rothschild – Cost of Capital Docket No. 2019-281-S
–––––––––––––––––––––––––––––––––––––––––––––––––––––––––––––––––––––––––––––––––––––––––––––––––––
50
calculate betas every week during the most recent three complete months (February 1
through April 2020) and calculate historical betas for periods of 6 months, two years, and 2
five years, as shown in Chart 11 above. 3
Option-Implied Beta Calculations 4
Calculating option-implied betas of a company requires (1) obtaining stock option data for 5
that company and a market index, (2) filtering the stock option data, (3) calculating the 6
option-implied volatility for the company and for the index, (4) calculating the option-7
implied skewness for the company and for the index, and (5) calculating option-implied 8
betas for the company based on implied volatility and skewness for the company and for 9
the index. There are various ways one could choose to perform the steps above, but I chose 10
to filter stock option data and calculate option-implied volatility34 and skewness35 11
following exactly the same methodology used by the Chicago Board of Options Exchange 12
(CBOE) in the calculation of their widely-used VIX (or Volatility Index) and SKEW Index, 13
respectively. 14
I start my process with publicly available trading information for all the options for 15
a given security (company or index) for a complete trading day. I then filter the option 16
data as described by the CBOE using the following guidelines: 17
1. Use the mid-quote or mark (average of bid and ask) as the option price. 18
2. Use only out-of-the-money call and put options. 19
34 CBOE Volatility Index White Paper, 2018. Cover page says “proprietary information.” The author has had access
to this document in the public domain for at least 3 years. 35 The CBOE SKEW Index, 2010. Cover page says “proprietary information.” The author has had access to this
document in the public domain for at least 3 years.
ELECTR
ONICALLY
FILED-2020
May
264:03
PM-SC
PSC-D
ocket#2019-281-S
-Page52
of80
Direct Testimony of Aaron L. Rothschild – Cost of Capital Docket No. 2019-281-S
–––––––––––––––––––––––––––––––––––––––––––––––––––––––––––––––––––––––––––––––––––––––––––––––––––
51
a. Determine the “moneyness” threshold where absolute difference between 1
call and put prices is smallest (using CBOE “Forward Index Price” 2
formula). 3
b. Include “at-the-money” call and put options and use average of call and put 4
prices as price for “blended” option. 5
3. Exclude all zero bids. 6
4. Exclude remaining (more out-of-the-money) options when two sequential zero bids 7
are found. 8
I then apply the series of formulas clearly described in both of the CBOE’s white 9
papers to the remaining options to calculate Option-Implied Volatility and Option-Implied 10
Skewness. In the words of the CBOE, each of its two indices is “an amalgam of the 11
information reflected in the prices of all of the selected options.” To be clear, Implied 12
Volatility is not exactly the same as the VIX Index and Implied Skewness is not exactly 13
the same as the SKEW Index, but both indices are directly based on their corresponding 14
statistical value. 15
Option-Implied Volatility reflects investors’ expectations regarding future stock 16
price movements. Option-Implied Skewness reflects investors’ expectations regarding 17
how implied volatility changes for strike prices that are closer and further to the current 18
value of the underlying stock price. 19
The CBOE calculates Times to Expiration by the minute—as do I. The Time to 20
Expiration of traded options cannot be changed and varies from day to day. For the sake 21
of consistency, the CBOE calculates the VIX and SKEW indices on a “30-day” basis by 22
ELECTR
ONICALLY
FILED-2020
May
264:03
PM-SC
PSC-D
ocket#2019-281-S
-Page53
of80
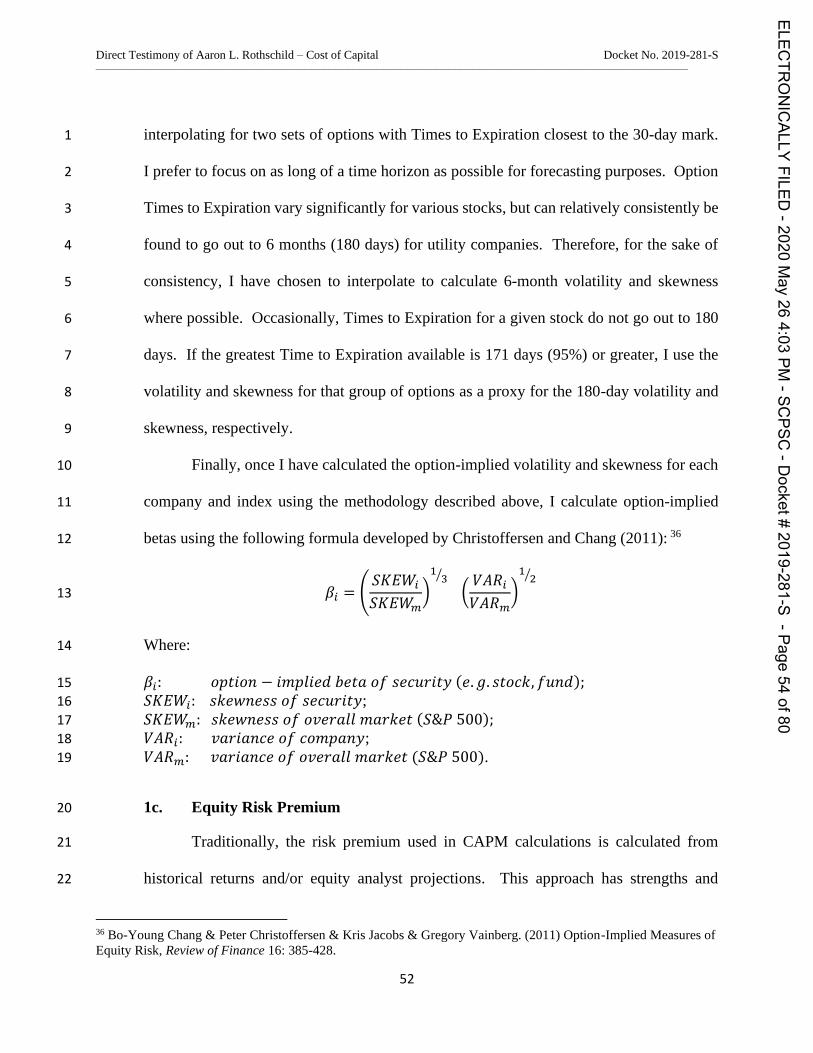
Direct Testimony of Aaron L. Rothschild – Cost of Capital Docket No. 2019-281-S
–––––––––––––––––––––––––––––––––––––––––––––––––––––––––––––––––––––––––––––––––––––––––––––––––––
52
interpolating for two sets of options with Times to Expiration closest to the 30-day mark. 1
I prefer to focus on as long of a time horizon as possible for forecasting purposes. Option 2
Times to Expiration vary significantly for various stocks, but can relatively consistently be 3
found to go out to 6 months (180 days) for utility companies. Therefore, for the sake of 4
consistency, I have chosen to interpolate to calculate 6-month volatility and skewness 5
where possible. Occasionally, Times to Expiration for a given stock do not go out to 180 6
days. If the greatest Time to Expiration available is 171 days (95%) or greater, I use the 7
volatility and skewness for that group of options as a proxy for the 180-day volatility and 8
skewness, respectively. 9
Finally, once I have calculated the option-implied volatility and skewness for each 10
company and index using the methodology described above, I calculate option-implied 11
betas using the following formula developed by Christoffersen and Chang (2011): 36 12
𝛽𝑖 = (𝑆𝐾𝐸𝑊𝑖
𝑆𝐾𝐸𝑊𝑚)
13⁄
(𝑉𝐴𝑅𝑖
𝑉𝐴𝑅𝑚)
12⁄
13
Where: 14
𝛽𝑖: 𝑜𝑝𝑡𝑖𝑜𝑛 − 𝑖𝑚𝑝𝑙𝑖𝑒𝑑 𝑏𝑒𝑡𝑎 𝑜𝑓 𝑠𝑒𝑐𝑢𝑟𝑖𝑡𝑦 (𝑒. 𝑔. 𝑠𝑡𝑜𝑐𝑘, 𝑓𝑢𝑛𝑑); 15
𝑆𝐾𝐸𝑊𝑖: 𝑠𝑘𝑒𝑤𝑛𝑒𝑠𝑠 𝑜𝑓 𝑠𝑒𝑐𝑢𝑟𝑖𝑡𝑦; 16
𝑆𝐾𝐸𝑊𝑚: 𝑠𝑘𝑒𝑤𝑛𝑒𝑠𝑠 𝑜𝑓 𝑜𝑣𝑒𝑟𝑎𝑙𝑙 𝑚𝑎𝑟𝑘𝑒𝑡 (𝑆&𝑃 500); 17
𝑉𝐴𝑅𝑖: 𝑣𝑎𝑟𝑖𝑎𝑛𝑐𝑒 𝑜𝑓 𝑐𝑜𝑚𝑝𝑎𝑛𝑦; 18
𝑉𝐴𝑅𝑚: 𝑣𝑎𝑟𝑖𝑎𝑛𝑐𝑒 𝑜𝑓 𝑜𝑣𝑒𝑟𝑎𝑙𝑙 𝑚𝑎𝑟𝑘𝑒𝑡 (𝑆&𝑃 500). 19
1c. Equity Risk Premium 20
Traditionally, the risk premium used in CAPM calculations is calculated from 21
historical returns and/or equity analyst projections. This approach has strengths and 22
36 Bo-Young Chang & Peter Christoffersen & Kris Jacobs & Gregory Vainberg. (2011) Option-Implied Measures of
Equity Risk, Review of Finance 16: 385-428.
ELECTR
ONICALLY
FILED-2020
May
264:03
PM-SC
PSC-D
ocket#2019-281-S
-Page54
of80
Direct Testimony of Aaron L. Rothschild – Cost of Capital Docket No. 2019-281-S
–––––––––––––––––––––––––––––––––––––––––––––––––––––––––––––––––––––––––––––––––––––––––––––––––––
53
weaknesses. An alternative way to calculate the equity risk premium is to use option-1
implied return expectations. 2
My equity risk premium is the expected return on the S&P 500 minus the risk-free 3
rate as described above. I calculated an expected return on the S&P 500 by using stock 4
options traded on this index. The implied volatility changes over time as investors’ 5
perception of risk changes. For example, during a crisis, implied volatility generally 6
increases as investors expect that stock market prices have a greater chance of large swings 7
compared to times when there is no crisis. As discussed earlier, investors often have 8
different volatility expectations over different time periods. For example, investors might 9
expect volatility to be relatively high over the next 30 days and decrease over the next year 10
or longer. 11
I calculated my equity risk premium in two ways. My Weighted Risk Premium 12
accounts for investors’ expectations over the past 3 months. My Spot Risk Premium is 13
based on investors’ expectations as of April 28, 2020. 14
15
Weighted Risk Premium 16
I calculated my Weighted Risk Premium by weighing option-implied volatility over 17
time (February 1, 2020 to April 28, 2020) and over time to expiry (1 month to 31 months). 18
The option-implied volatility for options with an expiration period of 30-days was 19
approximately 0.2785 on February 25, 0.467 on March 17, 0.467 on April 7 and 0.3357 on 20
April 28.37 This implied volatility indicates that the market expects the standard deviation 21
37 Table 2.
ELECTR
ONICALLY
FILED-2020
May
264:03
PM-SC
PSC-D
ocket#2019-281-S
-Page55
of80
Direct Testimony of Aaron L. Rothschild – Cost of Capital Docket No. 2019-281-S
–––––––––––––––––––––––––––––––––––––––––––––––––––––––––––––––––––––––––––––––––––––––––––––––––––
54
of future annual price movements of the S&P 500 to decreased from 42% to 32% between 1
February 25th and April 28th. Regarding term structure, the implied-volatility was upward 2
sloping before the COVID-19 pandemic and has become downward sloping as the 3
pandemic spread in the United States. See Charts 7 and 8 above. 4
Based on these market weighted market expectations, I considered the following 5
growth rate in the DCF analysis I used to calculate the equity risk premium component of 6
my CAPM: 7
Base S&P 500 growth of 14.92% 8
i. The market expects a 68.3% probability of growth equal to or 9
less than this level. The market expects less than a 32% 10
probability of higher growth. 11
12
Sport Risk Premium 13
I calculated my Spot Risk Premium by using the option-implied volatility as of 14
April 28, 2020 and over time to expiry of 31 months. 15
Based on these spot (as of April 28, 2020) market expectations, I considered the 16
following growth rate in the DCF analysis I used to calculate the equity risk premium 17
component of my CAPM: 18
Base S&P 500 growth of 12.91% 19
i. The market expects a 68.3% probability of growth equal to or 20
less than this level. The market expects less than a 32% 21
probability of higher growth. 22
23
ELECTR
ONICALLY
FILED-2020
May
264:03
PM-SC
PSC-D
ocket#2019-281-S
-Page56
of80
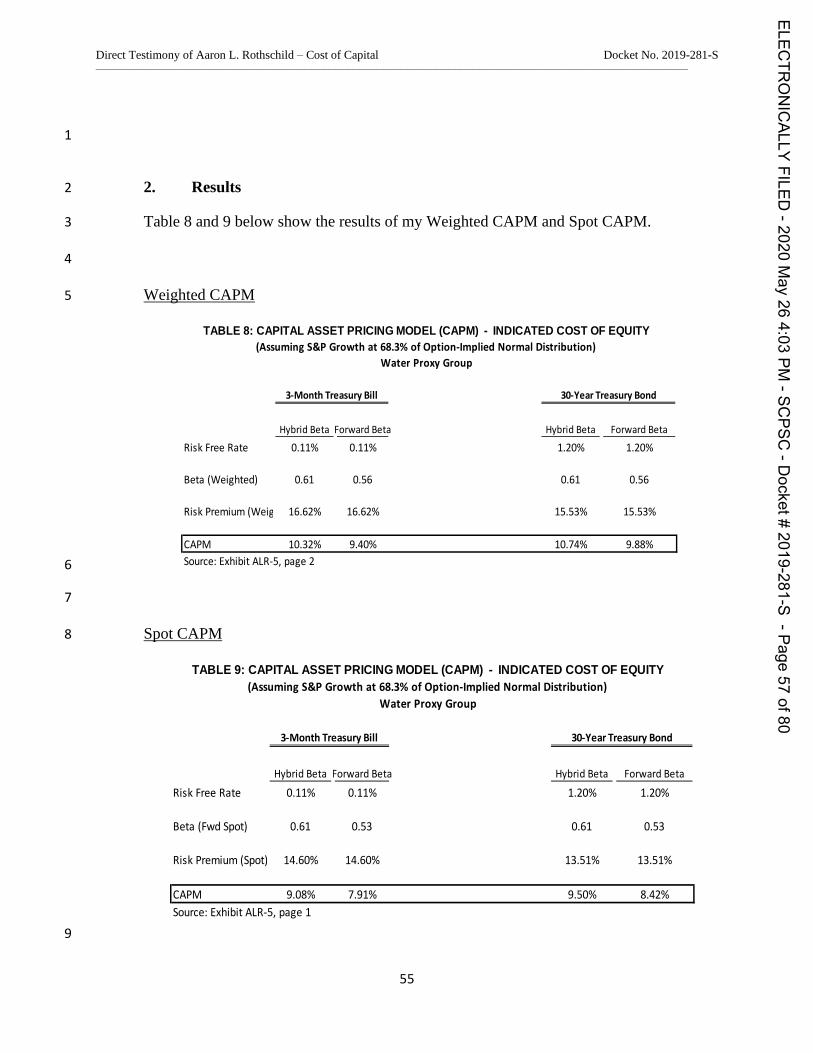
Direct Testimony of Aaron L. Rothschild – Cost of Capital Docket No. 2019-281-S
–––––––––––––––––––––––––––––––––––––––––––––––––––––––––––––––––––––––––––––––––––––––––––––––––––
55
1
2. Results 2
Table 8 and 9 below show the results of my Weighted CAPM and Spot CAPM. 3
4
Weighted CAPM 5
6
7
Spot CAPM 8
9
Hybrid Beta Forward Beta Hybrid Beta Forward Beta
Risk Free Rate 0.11% 0.11% 1.20% 1.20%
Beta (Weighted) 0.61 0.56 0.61 0.56
Risk Premium (Weighted)16.62% 16.62% 15.53% 15.53%
CAPM 10.32% 9.40% 10.74% 9.88%
Source: Exhibit ALR-5, page 2
3-Month Treasury Bill 30-Year Treasury Bond
TABLE 8: CAPITAL ASSET PRICING MODEL (CAPM) - INDICATED COST OF EQUITY
(Assuming S&P Growth at 68.3% of Option-Implied Normal Distribution)
Water Proxy Group
Hybrid Beta Forward Beta Hybrid Beta Forward Beta
Risk Free Rate 0.11% 0.11% 1.20% 1.20%
Beta (Fwd Spot) 0.61 0.53 0.61 0.53
Risk Premium (Spot) 14.60% 14.60% 13.51% 13.51%
CAPM 9.08% 7.91% 9.50% 8.42%
Source: Exhibit ALR-5, page 1
3-Month Treasury Bill 30-Year Treasury Bond
TABLE 9: CAPITAL ASSET PRICING MODEL (CAPM) - INDICATED COST OF EQUITY
(Assuming S&P Growth at 68.3% of Option-Implied Normal Distribution)
Water Proxy Group
ELECTR
ONICALLY
FILED-2020
May
264:03
PM-SC
PSC-D
ocket#2019-281-S
-Page57
of80
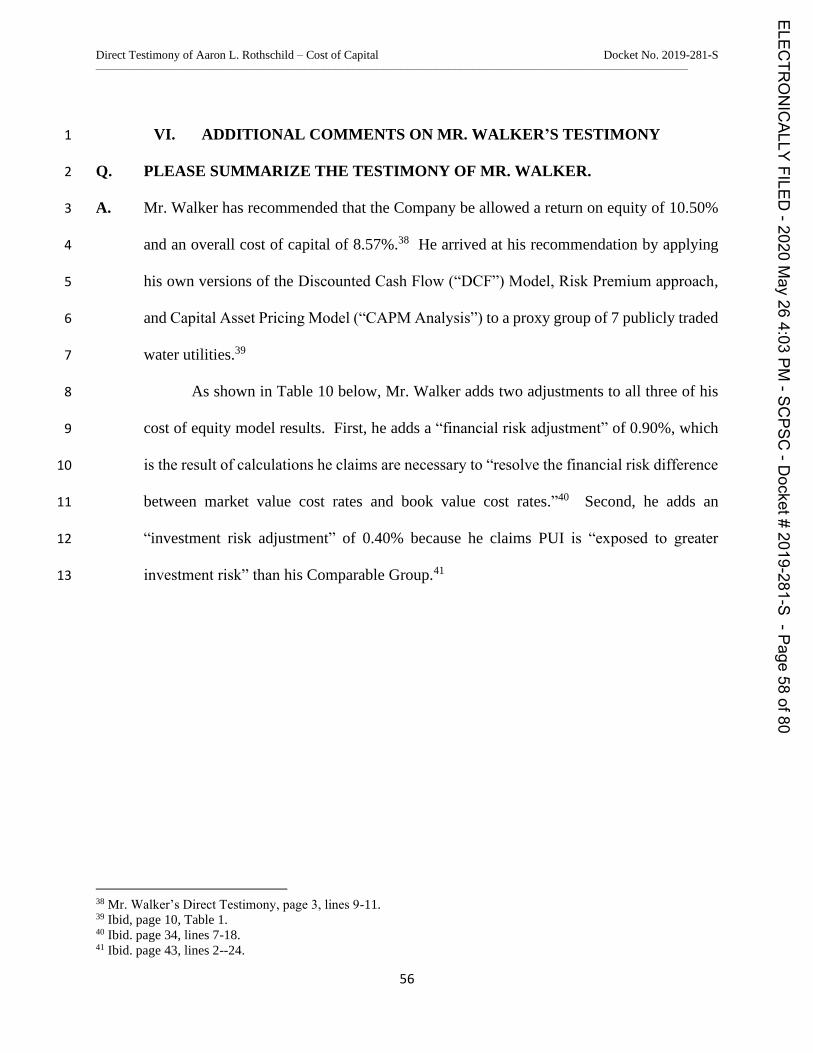
Direct Testimony of Aaron L. Rothschild – Cost of Capital Docket No. 2019-281-S
–––––––––––––––––––––––––––––––––––––––––––––––––––––––––––––––––––––––––––––––––––––––––––––––––––
56
VI. ADDITIONAL COMMENTS ON MR. WALKER’S TESTIMONY 1
Q. PLEASE SUMMARIZE THE TESTIMONY OF MR. WALKER. 2
A. Mr. Walker has recommended that the Company be allowed a return on equity of 10.50% 3
and an overall cost of capital of 8.57%.38 He arrived at his recommendation by applying 4
his own versions of the Discounted Cash Flow (“DCF”) Model, Risk Premium approach, 5
and Capital Asset Pricing Model (“CAPM Analysis”) to a proxy group of 7 publicly traded 6
water utilities.39 7
As shown in Table 10 below, Mr. Walker adds two adjustments to all three of his 8
cost of equity model results. First, he adds a “financial risk adjustment” of 0.90%, which 9
is the result of calculations he claims are necessary to “resolve the financial risk difference 10
between market value cost rates and book value cost rates.”40 Second, he adds an 11
“investment risk adjustment” of 0.40% because he claims PUI is “exposed to greater 12
investment risk” than his Comparable Group.41 13
38 Mr. Walker’s Direct Testimony, page 3, lines 9-11. 39 Ibid, page 10, Table 1. 40 Ibid. page 34, lines 7-18. 41 Ibid. page 43, lines 2--24.
ELECTR
ONICALLY
FILED-2020
May
264:03
PM-SC
PSC-D
ocket#2019-281-S
-Page58
of80
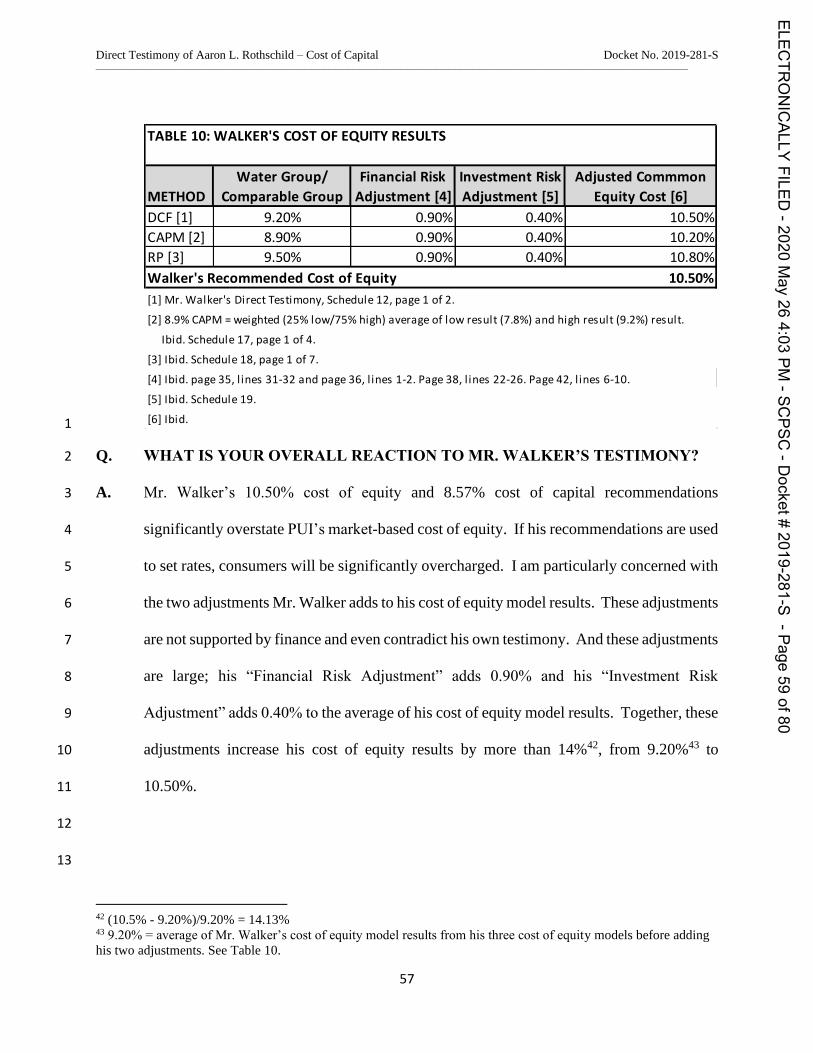
Direct Testimony of Aaron L. Rothschild – Cost of Capital Docket No. 2019-281-S
–––––––––––––––––––––––––––––––––––––––––––––––––––––––––––––––––––––––––––––––––––––––––––––––––––
57
1
Q. WHAT IS YOUR OVERALL REACTION TO MR. WALKER’S TESTIMONY? 2
A. Mr. Walker’s 10.50% cost of equity and 8.57% cost of capital recommendations 3
significantly overstate PUI’s market-based cost of equity. If his recommendations are used 4
to set rates, consumers will be significantly overcharged. I am particularly concerned with 5
the two adjustments Mr. Walker adds to his cost of equity model results. These adjustments 6
are not supported by finance and even contradict his own testimony. And these adjustments 7
are large; his “Financial Risk Adjustment” adds 0.90% and his “Investment Risk 8
Adjustment” adds 0.40% to the average of his cost of equity model results. Together, these 9
adjustments increase his cost of equity results by more than 14%42, from 9.20%43 to 10
10.50%. 11
12
13
42 (10.5% - 9.20%)/9.20% = 14.13% 43 9.20% = average of Mr. Walker’s cost of equity model results from his three cost of equity models before adding
his two adjustments. See Table 10.
TABLE 10: WALKER'S COST OF EQUITY RESULTS
Water Group/ Financial Risk Investment Risk Adjusted Commmon
METHOD Comparable Group Adjustment [4] Adjustment [5] Equity Cost [6]
DCF [1] 9.20% 0.90% 0.40% 10.50%
CAPM [2] 8.90% 0.90% 0.40% 10.20%
RP [3] 9.50% 0.90% 0.40% 10.80%
Walker's Recommended Cost of Equity 10.50%
[1] Mr. Walker's Direct Testimony, Schedule 12, page 1 of 2.
[2] 8.9% CAPM = weighted (25% low/75% high) average of low result (7.8%) and high result (9.2%) result.
Ibid. Schedule 17, page 1 of 4.
[3] Ibid. Schedule 18, page 1 of 7.
[4] Ibid. page 35, l ines 31-32 and page 36, l ines 1-2. Page 38, l ines 22-26. Page 42, l ines 6-10.
[5] Ibid. Schedule 19.
[6] Ibid.
ELECTR
ONICALLY
FILED-2020
May
264:03
PM-SC
PSC-D
ocket#2019-281-S
-Page59
of80
Direct Testimony of Aaron L. Rothschild – Cost of Capital Docket No. 2019-281-S
–––––––––––––––––––––––––––––––––––––––––––––––––––––––––––––––––––––––––––––––––––––––––––––––––––
58
Q. PLEASE RESPOND TO MR. WALKER’S CLAIM THAT VALUE LINE’S 1
PROJECTED ACCOUNTING RETURNS INDICATE THAT HIS 10.50% COST 2
OF EQUITY IS REASONABLE. 3
A. Mr. Walker claims his 10.50% cost of equity recommendation is reasonable because it is 4
within the range of Value Line’s projected accounting returns of between 9.5% and 5
14.0%.44 Knowledgeable investors are aware that Value Line’s Future Expected Return 6
on Book Equity (9.50% to 14.00% for the Water Proxy Group) is an accounting measure 7
and not the return they will actually earn on their investment (i.e., the return on the market 8
price of the stock). With market-to-book ratios of water companies trading over 3 times 9
book value,45 investors know they will likely earn considerably less than the forecasted 10
return on book value. The scholar Stewart C. Myers states the following about what 11
investors care about: 12
The shareholder is not directly interested in the ratio of book earnings to the book value of 13 a company he invests in. He looks at anticipated dividends and capital gains relative to the 14 stock price he has to pay.46 15
16 Q. DOES VALUE LINE PROVIDE FORECASTS OF WHAT INVESTORS WILL 17
ACTUALLY EARN ON THE MARKET PRICE OF WATER UTILITY STOCKS? 18
A. Yes. Value Line publishes the market-based returns that are relevant to their readers and 19
to this proceeding. As shown in Table 11 below, Value Line projects that investors will 20
actually earn 0.8% (midpoint of projections) on their Water Utility Investments, not the 21
9.5% - 14.0% claimed by Mr. Walker. 22
44 Ibid. page 4, lines 4-9. 45 Exhibit ALR-4, page 1, line 2a. 46 Application of Finance Theory to Public Utility Rate Cases, Bell Journal of Economics & Management Science
3:58-97 (1972)., page xx
ELECTR
ONICALLY
FILED-2020
May
264:03
PM-SC
PSC-D
ocket#2019-281-S
-Page60
of80
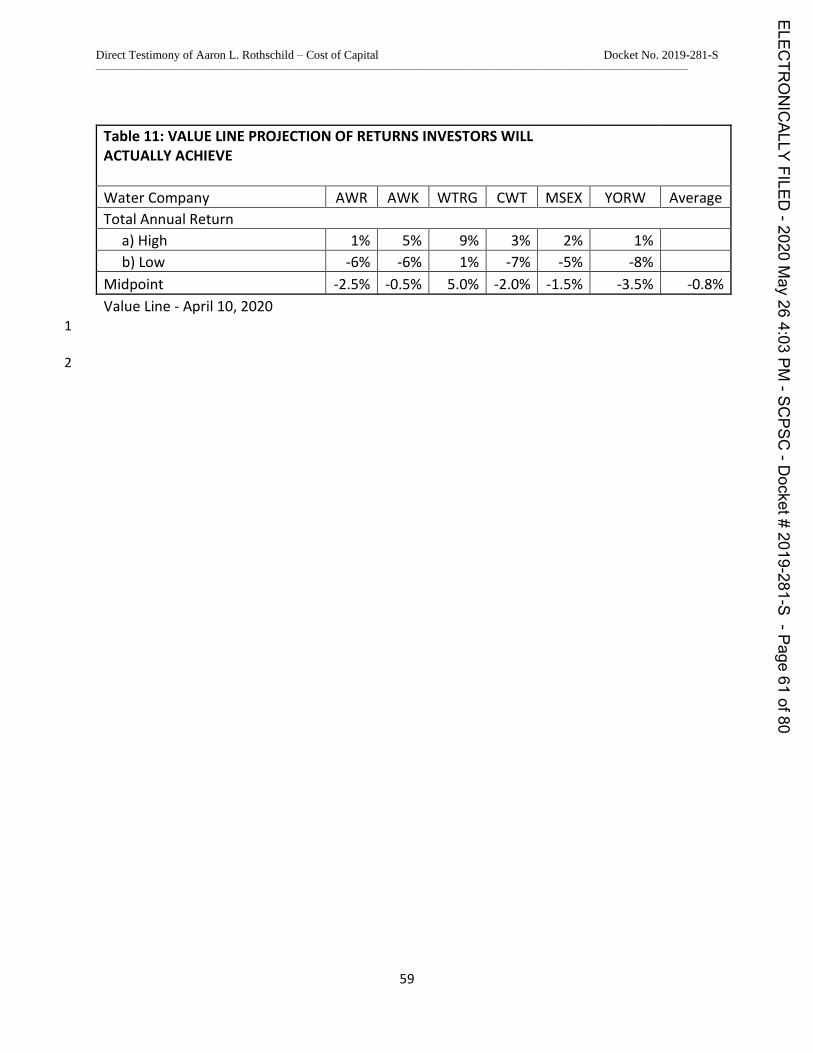
Direct Testimony of Aaron L. Rothschild – Cost of Capital Docket No. 2019-281-S
–––––––––––––––––––––––––––––––––––––––––––––––––––––––––––––––––––––––––––––––––––––––––––––––––––
59
Table 11: VALUE LINE PROJECTION OF RETURNS INVESTORS WILL ACTUALLY ACHIEVE
Water Company AWR AWK WTRG CWT MSEX YORW Average
Total Annual Return
a) High 1% 5% 9% 3% 2% 1%
b) Low -6% -6% 1% -7% -5% -8%
Midpoint -2.5% -0.5% 5.0% -2.0% -1.5% -3.5% -0.8%
Value Line - April 10, 2020 1
2
ELECTR
ONICALLY
FILED-2020
May
264:03
PM-SC
PSC-D
ocket#2019-281-S
-Page61
of80
Direct Testimony of Aaron L. Rothschild – Cost of Capital Docket No. 2019-281-S
–––––––––––––––––––––––––––––––––––––––––––––––––––––––––––––––––––––––––––––––––––––––––––––––––––
60
A. Risk Adjustments 1
Q. PLEASE COMMENT ON MR. WALKER’S RISK ADJUSTMENTS. 2
A. Mr. Walker claims risk adjustments must be added to his cost of equity model results to 3
reflect financial risks and investments risks. 4
1. Financial Risk Adjustment 5
Mr. Walker’s recommended 0.90% Financial Risk Adjustment is based on the average of 6
the following two proposed adjustments: 7
1. 1.53% - Difference between Water Group’s market value levered beta 8
and their book value levered beta X risk premium (5.9%). 9
2. 0.35% - The yield spread between the bond rating based on the 10
“hypothetical market value capital structure” of his Comparative Group 11
(Aaa) and their actual bond rating based upon their book value capital 12
structure (A). 13
Mr. Walker’s 0.90% Financial Risk Adjustment is not supported by finance. In fact, his 14
justification for making this adjustment has nothing to do with finance. Mr. Walker claims 15
that because the market value cost of equity is applied to book value rate base to set rates, 16
an adjustment is required when stock market prices and book values are not similar. 17
Currently, the market prices of water utility stocks are more than 300% larger than their 18
book value – resulting in a market-to-book ratio of more than 3. This is the case for all 19
water utility companies and there is no reason to think that PUI’s market-to-book ratio 20
would be significantly different, if it had publicly traded shares. Regardless, Mr. Walker 21
is not claiming a financial adjustment is required because there is something fundamentally 22
different about PUI and the Comparable Group in this regard. If there were a fundamental 23
ELECTR
ONICALLY
FILED-2020
May
264:03
PM-SC
PSC-D
ocket#2019-281-S
-Page62
of80
Direct Testimony of Aaron L. Rothschild – Cost of Capital Docket No. 2019-281-S
–––––––––––––––––––––––––––––––––––––––––––––––––––––––––––––––––––––––––––––––––––––––––––––––––––
61
difference, it may be appropriate to adjust the result of models applied to his Comparable 1
Group to make them applicable to PUI, but this is not the case. 2
It is also important to note that the net effect of this adjustment by Mr. Walker is to 3
directly counteract and offset the consequences of established regulation which requires 4
applying a market-based cost of equity to book value. 5
By recommending this Financial Risk Adjustment, Mr. Walker is implying that 6
investors forget how regulation works after each rate case. Investors understand that as 7
part of the regulatory process, allowed returns are applied to book value. This is a process 8
that has been going on for decades and it is hard to argue that investors are not aware of 9
this. 10
2. Investment Risk Adjustment 11
Mr. Walker’s 0.40% Investment Risk Adjustment should be rejected because it contradicts 12
financial theory, among other reasons. 13
Diversifiable Risk. Mr. Walker claims the risks that investors can eliminate 14
through diversification (“diversifiable risk”) impact PUI’s cost of equity. Mr. Walker 15
concludes that PUI’s lack of economic diversification, among other risks, indicates that 16
PUI’s cost of equity is higher than the companies in his Comparable Group. An investor 17
is unlikely to require a higher return to invest in a company with only regional economic 18
exposure because investors can attain the economic diversification regional companies like 19
PUI cannot by purchasing a portfolio of stocks of companies doing business around the 20
country and the rest of the world. 21
Principles of Corporate Finance states: 22
Don’t be fooled by diversifiable risk… 23
ELECTR
ONICALLY
FILED-2020
May
264:03
PM-SC
PSC-D
ocket#2019-281-S
-Page63
of80
Direct Testimony of Aaron L. Rothschild – Cost of Capital Docket No. 2019-281-S
–––––––––––––––––––––––––––––––––––––––––––––––––––––––––––––––––––––––––––––––––––––––––––––––––––
62
Sometimes financial managers increase discount rates in an attempt to offset these risks. 1 This makes no sense. Diversifiable risks do not increase the cost of capital.47 2 3
Small Firm Effect. Mr. Walker claims that it is well documented in financial 4
literature that “size affects relative business risk.” The issue is not as settled as Mr. Walker 5
suggests. Between 1926 and 2015, small stock premiums (averaging 3.82%) were highly 6
volatile. Principles of Corporate Finance stated that the so called “small firm premium” 7
was most likely supported by “data mining.” The textbook goes on to say that if you search 8
enough you are likely to find a pattern. Professor Aswath Damodaran from New York 9
University states the following regarding the supposed “small cap premium”: 10
Even if you believe that small cap companies are more exposed to market risk than 11 large cap ones, this is an extremely sloppy and lazy way of dealing with that risk, 12 since risk ultimately has to come from something fundamental (and size is not a 13
fundamental factor).48 14 15
Mr. Walker’s “Investment Risk Premium” should be rejected because it contradicts 16
financial theory and conclusions regarding size and risk that are highly criticized by the 17
financial community. 18
19
B. DCF Method 20
Q. WHAT FORMULA DOES MR. WALKER USE IN HIS DCF ANALYSIS? 21
A. Dividend Yield (D/P) + Growth Rate (g).49 22
47 Brealey, Myers, and Allen (2017), Principles of Corporate Finance, 12th Edition, McGraw-Hill Irwin, New York,
page 232. 48Aswath Damodaran, Equity Risk Premiums (ERP): Determinates, Estimation and Implications – The 2015 Edition
(paper updated, March 2015). Page 42. 49 Ibid. Schedule 12, page 1 of 2.
ELECTR
ONICALLY
FILED-2020
May
264:03
PM-SC
PSC-D
ocket#2019-281-S
-Page64
of80
Direct Testimony of Aaron L. Rothschild – Cost of Capital Docket No. 2019-281-S
–––––––––––––––––––––––––––––––––––––––––––––––––––––––––––––––––––––––––––––––––––––––––––––––––––
63
Q. DOES MR. WALKER PROPERLY APPLY THE SIMPLIFIED OR CONSTANT 1
GROWTH DCF METHOD? 2
A. No. Even though Mr. Walker does add a growth component to a divided yield, his growth 3
estimate relies entirely on analyst five-year EPS growth forecasts.50 Proper application of 4
the DCF method requires that the dividend yield be computed properly, and that the growth 5
rate used be derived from a careful study of what future sustainable growth in cash flow is 6
anticipated by investors. As discussed above in Section II, major financial institutions like 7
J.P. Morgan Chase do not use a growth rate based on analyst 5-year EPS growth rates as 8
Mr. Walker has done. 9
Q. HOW DID MR. WALKER CALCULATE THE GROWTH RATE FOR HIS DCF 10
METHOD? 11
A. Mr. Walker’s DCF growth rates are based upon historical and projected (5-year) EPS 12
growth rates from “…First Call, S&P, Zacks, and Value Line.”51 Mr. Walker states, “…all 13
growth rates for the Comparison Companies have been considered and have been given 14
weight in determining a 7.4% growth rate for the Water Group52 Below are the five-year 15
projected earnings per share rates by the four investment research firms he chose: 16
First Call: 7.4% 17
S&P: 7.4% 18
Zacks: 6.6% 19
Value Line: 8.1%53 20
50 Mr. Walker’s Direct Testimony, Schedule 13. 51 Ibid. 52 Ibid. page 30, lines 25-27. 53 Ibid. Schedule 13.
ELECTR
ONICALLY
FILED-2020
May
264:03
PM-SC
PSC-D
ocket#2019-281-S
-Page65
of80
Direct Testimony of Aaron L. Rothschild – Cost of Capital Docket No. 2019-281-S
–––––––––––––––––––––––––––––––––––––––––––––––––––––––––––––––––––––––––––––––––––––––––––––––––––
64
Q. IS MR. WALKER’S METHODOLOGY FOR DETERMINING THE GROWTH 1
RATE TO USE IN HIS DCF MODEL APPROPRIATE? 2
A. No. As stated above, Mr. Walker uses analyst five-year earnings per share growth without 3
attempting to reconcile the retention rate used for computing growth with the retention rate 4
he used to compute the dividend yield. This is analogous to failing to reconcile the money 5
you are taking out of your checking account with your future balance, i.e., the basic 6
balancing of a checkbook. 7
Q. CAN YOU PLEASE SUMMARIZE WHY A FUTURE-ORIENTED “B X R” 8
METHOD IS SUPERIOR TO A FIVE-YEAR EARNINGS PER SHARE GROWTH 9
RATE FORECAST IN PROVIDING A LONG-TERM SUSTAINABLE GROWTH 10
RATE? 11
A. Yes. The primary cause of sustainable earnings growth is the retention of earnings. A 12
company is able to create higher future earnings by retaining a portion of the prior year’s 13
earnings in the business and purchasing new business assets with those retained earnings. 14
There are many factors that can cause short-term swings in earnings growth rates, but the 15
long-term sustainable growth is caused by retaining earnings and reinvesting those 16
earnings. Factors that cause short-term swings include anything that causes a company to 17
earn a return on book equity at a rate different from the long-term sustainable rate. Assume, 18
for example, that a particular utility company is regulated so that it is provided with a 19
reasonable opportunity to earn 9% on its equity. Should the company experience an event 20
such as the loss of several key customers, or unfavorable weather conditions, which cause 21
it to earn only 6% on equity in a given year, the drop from a 9% earned return on equity 22
to a 6% earned return on equity would be concurrent with a very large drop in earnings per 23
ELECTR
ONICALLY
FILED-2020
May
264:03
PM-SC
PSC-D
ocket#2019-281-S
-Page66
of80
Direct Testimony of Aaron L. Rothschild – Cost of Capital Docket No. 2019-281-S
–––––––––––––––––––––––––––––––––––––––––––––––––––––––––––––––––––––––––––––––––––––––––––––––––––
65
share. In fact, if a company did not issue any new shares of stock during the year, a drop 1
from a 9% earned return on book equity to a 6% earned return on book equity would result 2
in a 33.3% decline in earnings per share over the period.54 However, such a drop in 3
earnings would not be an indication of what is a long-term sustainable earnings per share 4
growth rate. If the drop were caused by weather conditions, the drop in earnings would be 5
immediately offset once normal weather conditions return. If the drop were from the loss 6
of some key customers, the company would replace the lost earnings by filing for a rate 7
increase to bring revenues up to the level required for the company to be given a reasonable 8
opportunity to recover its cost of equity. 9
For the reasons above, changes in earnings per share growth rates that are caused 10
by non-recurring changes in the earned return on book equity are inconsistent with long-11
term sustainable growth, but changes in earnings per share because of the reinvestment of 12
additional assets is a cause of sustainable earnings growth. The “b x r” term in the DCF 13
equation computes sustainable growth because it measures only the growth which a 14
company can expect to achieve when its earned return on book equity “r” remains in 15
equilibrium. If analysts have sufficient data to be able to forecast varying values of “r” in 16
future years, then a complex, or multi-stage DCF method must be used to accurately 17
quantify the effect. Averaging growth rates over sub-periods, such as averaging growth 18
over the first five years with a growth rate expected over the subsequent period, will not 19
provide an appropriate representation of the cash flows expected by investors in the future 20
54 By definition, earned return on equity is earnings divided by book value. Therefore, whatever level of
earnings is required to produce earnings of 6% of book would have to be 33.3% lower than the level of earnings
required to produce a return on book equity of 9%.
ELECTR
ONICALLY
FILED-2020
May
264:03
PM-SC
PSC-D
ocket#2019-281-S
-Page67
of80
Direct Testimony of Aaron L. Rothschild – Cost of Capital Docket No. 2019-281-S
–––––––––––––––––––––––––––––––––––––––––––––––––––––––––––––––––––––––––––––––––––––––––––––––––––
66
and, therefore, will not provide an acceptable method of quantifying the cost of equity 1
using the DCF method. The choices are either a constant growth DCF, in which one growth 2
rate derived using “b x r” should be used, or a complex DCF method in which the cash 3
flow anticipated in each future year is separately estimated. Mr. Walker has done neither. 4
Q. WHY ARE ANALYSTS’ FIVE-YEAR CONSENSUS GROWTH RATES NOT 5
INDICATIVE OF LONG-TERM SUSTAINABLE GROWTH RATES? 6
A. Analysts’ five-year earnings per share growth rates are earnings per share growth rates that 7
measure earnings growth from the most currently completed fiscal year to projected 8
earnings five years into the future. These growth rates are not indicative of future 9
sustainable growth rates in part because the sources of cash flow to an investor are 10
dividends and stock price appreciation. While both stock price and dividends are impacted 11
in the long-run by the level of earnings a company is capable of achieving, earnings growth 12
over a period as short as five years is rarely in synchronization with the cash flow growth 13
from increases in dividends and stock prices. For example, if a company experiences a 14
year in which investors perceive that earnings temporarily dipped below normal trend 15
levels, stock prices generally do not decline at the same percentage that earnings decline, 16
and dividends are usually not cut just because of a temporary decline in a company’s 17
earnings. Unless both the stock price and dividends mirror every down swing in earnings, 18
they cannot be expected to recover at the same growth rate that earnings recover. 19
Therefore, growth rates such as five-year projected growth in earnings per share are not 20
indicative of long-term sustainable growth rates in cash flow. As a result, they are not 21
applicable for direct use in the simplified DCF method. 22
ELECTR
ONICALLY
FILED-2020
May
264:03
PM-SC
PSC-D
ocket#2019-281-S
-Page68
of80
Direct Testimony of Aaron L. Rothschild – Cost of Capital Docket No. 2019-281-S
–––––––––––––––––––––––––––––––––––––––––––––––––––––––––––––––––––––––––––––––––––––––––––––––––––
67
Q. IS THE USE OF FIVE-YEAR EARNINGS PER SHARE GROWTH RATES IN 1
THE DCF MODEL ALSO IMPROPER? 2
A. Yes. A raw, unadjusted, five-year earnings per share growth rate is usually a poor proxy 3
for either short-term or long-term cash flow growth that an investor expects to receive. 4
When implementing the DCF method, the time value of money is considered by equating 5
the current stock price of a company to the present value of the future cash flows that an 6
investor expects to receive over the entire time that he or she owns the stock. The discount 7
rate required to make the future cash flow stream, on a net present value basis, equal to the 8
current stock price is the cost of equity. The only two sources of cash flow to an investor 9
are dividends and the net proceeds from the sale of stock at whatever time in the future the 10
investor finally sells. Therefore, the DCF method is discounting future cash flows that 11
investors expect to receive from dividends and from the eventual sale of the stock. Five-12
year earnings growth rate forecasts are especially poor indicators of cash flow growth, even 13
over the five years being measured by the five-year earnings per share growth rate number. 14
Q. WHY IS A FIVE-YEAR EARNINGS PER SHARE GROWTH RATE A POOR 15
INDICATOR OF THE FIVE-YEAR CASH DIVIDEND GROWTH 16
EXPECTATIONS? 17
A. The board of directors of a company changes dividend rates based upon long-term earnings 18
expectations combined with the capital needs of a company. Most companies do not 19
decrease dividends simply because a company has a year in which earnings were below 20
sustainable trends, and similarly they do not increase dividends simply because earnings 21
for one year happened to be above long-term sustainable trends. Therefore, over any given 22
five-year period, earnings growth is frequently very different from dividend growth. In 23
ELECTR
ONICALLY
FILED-2020
May
264:03
PM-SC
PSC-D
ocket#2019-281-S
-Page69
of80
Direct Testimony of Aaron L. Rothschild – Cost of Capital Docket No. 2019-281-S
–––––––––––––––––––––––––––––––––––––––––––––––––––––––––––––––––––––––––––––––––––––––––––––––––––
68
order for earnings growth to equal dividend growth, at a minimum, earnings per share in 1
the first year of the five-year earnings growth rate period would have to be exactly on the 2
long-term earnings trend line expected by investors. Since earnings in most years are above 3
or below the trend line, the earnings per share growth rate over most five-year periods is 4
different from what is expected for dividend growth. 5
Q. WHY IS THE FIVE-YEAR EARNINGS PER SHARE GROWTH RATE A POOR 6
INDICATION OF FUTURE STOCK PRICE GROWTH? 7
A. If a company happens to experience a year in which earnings decline below what investors 8
believe is consistent with the long-term trend, then the stock price does not drop anywhere 9
near as much as earnings drop. Similarly, if a company happens to experience a year in 10
which earnings are higher than the investor-perceived long-term sustainable trend, the 11
stock price will not increase as much as the earnings. In other words, the P/E ratio of a 12
company will increase after a year in which investors believe earnings are below 13
sustainable levels, and the P/E ratio will decline in a year in which investors believe 14
earnings are higher than expected. Since stock price is one of the important cash flow 15
sources to an investor, a five-year earnings growth rate is a poor indicator of cash flow, 16
both because it is a poor indicator of stock price growth over the five years being examined, 17
and because it is equally a poor predictor of dividend growth over the period. 18
Q. ARE YOU SAYING THAT ANALYSTS’ CONSENSUS EARNINGS PER SHARE 19
GROWTH RATES ARE USELESS AS AN AID TO PROJECTING THE FUTURE? 20
A. No. Analysts’ EPS growth rates are, however, very dangerous if used in a simplified DCF 21
without proper interpretation. While they are not useful if used in their “raw” form, they 22
can be very useful in computing estimates of what earned return on equity investors expect 23
ELECTR
ONICALLY
FILED-2020
May
264:03
PM-SC
PSC-D
ocket#2019-281-S
-Page70
of80
Direct Testimony of Aaron L. Rothschild – Cost of Capital Docket No. 2019-281-S
–––––––––––––––––––––––––––––––––––––––––––––––––––––––––––––––––––––––––––––––––––––––––––––––––––
69
will be sustained in the future, and as such, are useful in developing long-term sustainable 1
growth rates. This is exactly what I do in the application of my Constant Growth DCF 2
Analysis. 3
Q. BESIDES GROWTH RATE, ARE THERE ANY OTHER DCF ANALYSIS INPUTS 4
THAT MR. WALKER HAS ESTIMATED INCORRECTLY? 5
A. Yes. Mr. Walker recommends adding a “Financial Risk Adjustment” of 0.9% and an 6
“Investment Risk Adjustment” of 0.40% to all three of his cost of equity model results, 7
including his DCF results. As discussed above, these adjustments are not valid and should 8
be rejected. 9
10
C. Risk Premium Method 11
Q. PLEASE EXPLAIN MR. WALKER’S VERSION OF THE RISK PREMIUM (“RP”) 12
METHOD, AS PRESENTED IN HIS DIRECT TESTIMONY. 13
A. Mr. Walker states “A risk premium is the common equity investors’ required premium 14
over the long-term debt cost rate for the same company…”55 Mr. Walker’s “Palmetto 15
adjusted” RP (10.4%) is based on his “Market Value RP” result (10.4%) “plus 0.9% to 16
account for “the difference in leverage between market value capitalization ratios and book 17
value ratios.”56 18
Mr. Walker’s “Market Value RP” result (10.3%) is based on two different risk 19
premium methodologies: (1) projected risk premium, and (2) historical risk premium. He 20
55 Ibid. page 39, lines 4-6. 56 Ibid. page 47, lines 17-21.
ELECTR
ONICALLY
FILED-2020
May
264:03
PM-SC
PSC-D
ocket#2019-281-S
-Page71
of80
Direct Testimony of Aaron L. Rothschild – Cost of Capital Docket No. 2019-281-S
–––––––––––––––––––––––––––––––––––––––––––––––––––––––––––––––––––––––––––––––––––––––––––––––––––
70
calculates a “projected risk premium” (7.1 – 7.3%%) based on Value Line’s projected total 1
market return for the next 3-5 years (12.3-12.5%) less Moody’s A Rated industrial bonds 2
(4.3 - 4.59%).57 Mr. Walker’s historical risk premium (5.7%)58 is based on the average of 3
historical returns for the entire 1928-2017 period (4.7%) and returns during low interest 4
rates (7.1%).59 5
Q. PLEASE COMMENT ON MR. WALKER’S RISK PREMIUM METHOD. 6
A Mr. Walker’s Risk Premium method is not reliable because, among other reasons, he 7
increases his risk premium from 4.7% to 5.7% based on his false claim that risk premiums 8
and interest rates are inversely correlated. Using his same methodology, his “Market Value 9
RP” would be about 9.3%,60 all else being equal, if he used a historical risk premium based 10
on the entire 1928-2017 period (4.7%). However, even this 9.3% cost of equity result is 11
unreasonably high because his Market Value RP result is based on an above-market 12
“prospective public utility bond yield” of 4.6%. Mr. Walker also relied on interest rate 13
data from November 2018. As indicated by the yield on Corporate bonds (Baa), the cost 14
of debt to corporations has decreased by over 50 basis points between November 2018 and 15
April 2019.61 Correcting for both of Mr. Walker’s errors62 indicates a “Market Value RP” 16
of 8.8%.63 17
57 Ibid. Schedule 18, page 2 of 7. 58 (4.7% + 7.1%)/2 = 5.9%, not 5.7%. 59 Ibid. page 52, lines 14-21. 60 4.6% prospective public utility bond yields plus a 4.7% historical risk premium. 61 Baa Corporate bond yield change from November 2018 to April 2019 decreased from 5.22% to 4.7%, which is a
decrease of over 50 basis points. Source: Federal Reserve Economic Data 62 Correcting for Mr. Walker’s inflated risk premium and prospective public utility bond yield leads to a more
reasonable cost of equity result (8.8%), but it is still unreasonably high. 63 4.1% (4.6% - 50 basis points) prospective public utility yields plus a 4.7% risk premium = 8.8%
ELECTR
ONICALLY
FILED-2020
May
264:03
PM-SC
PSC-D
ocket#2019-281-S
-Page72
of80
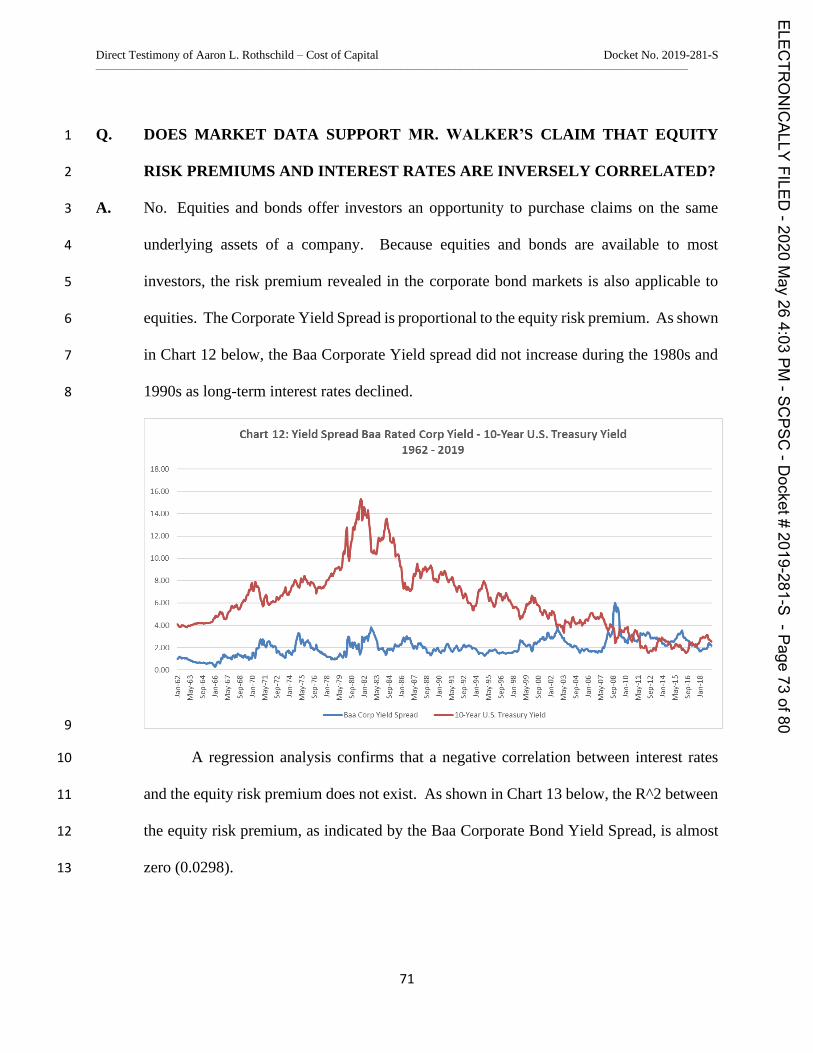
Direct Testimony of Aaron L. Rothschild – Cost of Capital Docket No. 2019-281-S
–––––––––––––––––––––––––––––––––––––––––––––––––––––––––––––––––––––––––––––––––––––––––––––––––––
71
Q. DOES MARKET DATA SUPPORT MR. WALKER’S CLAIM THAT EQUITY 1
RISK PREMIUMS AND INTEREST RATES ARE INVERSELY CORRELATED? 2
A. No. Equities and bonds offer investors an opportunity to purchase claims on the same 3
underlying assets of a company. Because equities and bonds are available to most 4
investors, the risk premium revealed in the corporate bond markets is also applicable to 5
equities. The Corporate Yield Spread is proportional to the equity risk premium. As shown 6
in Chart 12 below, the Baa Corporate Yield spread did not increase during the 1980s and 7
1990s as long-term interest rates declined. 8
9
A regression analysis confirms that a negative correlation between interest rates 10
and the equity risk premium does not exist. As shown in Chart 13 below, the R^2 between 11
the equity risk premium, as indicated by the Baa Corporate Bond Yield Spread, is almost 12
zero (0.0298). 13
ELECTR
ONICALLY
FILED-2020
May
264:03
PM-SC
PSC-D
ocket#2019-281-S
-Page73
of80
18 00
Chart 12: Yield Spread Baa Rated Corp Yield - 10-Year U.S. Treasury Yield1962-2019
16 60
~
14C0
10 00
8 00
4 00
0 00Q61$ 45 88988+58 d8
Baa Corp Yield Spread 10-Year 0 6 Treasury Yield
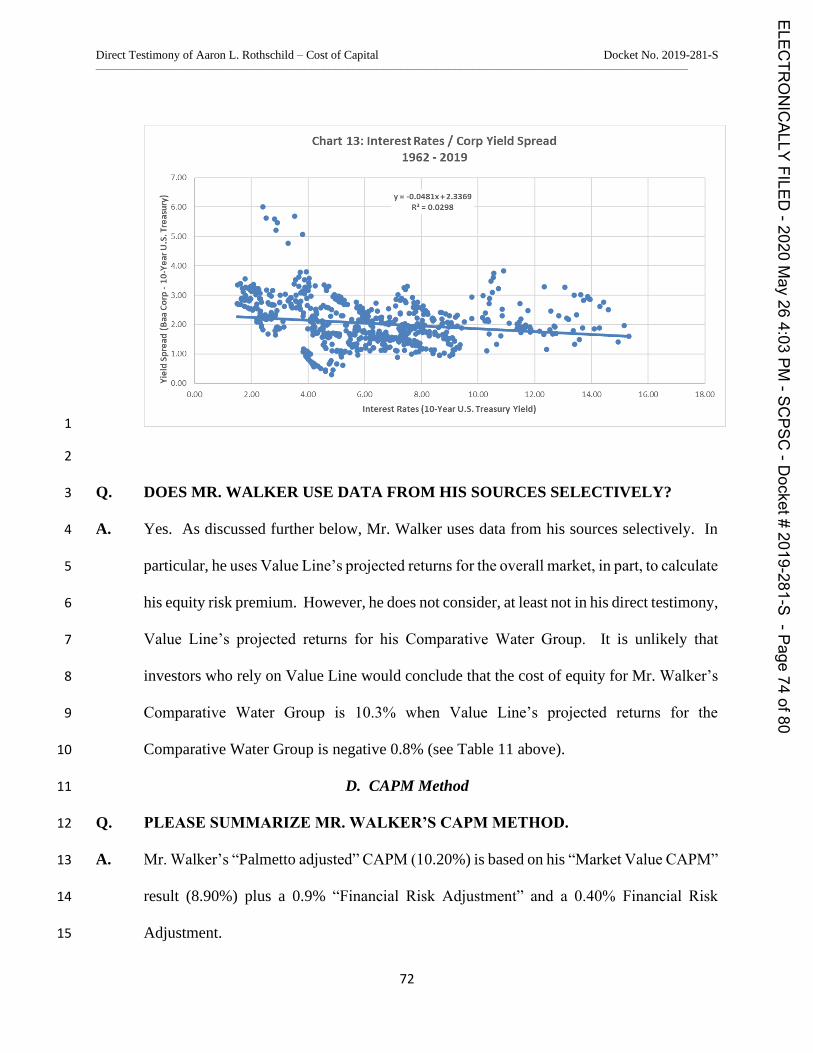
Direct Testimony of Aaron L. Rothschild – Cost of Capital Docket No. 2019-281-S
–––––––––––––––––––––––––––––––––––––––––––––––––––––––––––––––––––––––––––––––––––––––––––––––––––
72
1
2
Q. DOES MR. WALKER USE DATA FROM HIS SOURCES SELECTIVELY? 3
A. Yes. As discussed further below, Mr. Walker uses data from his sources selectively. In 4
particular, he uses Value Line’s projected returns for the overall market, in part, to calculate 5
his equity risk premium. However, he does not consider, at least not in his direct testimony, 6
Value Line’s projected returns for his Comparative Water Group. It is unlikely that 7
investors who rely on Value Line would conclude that the cost of equity for Mr. Walker’s 8
Comparative Water Group is 10.3% when Value Line’s projected returns for the 9
Comparative Water Group is negative 0.8% (see Table 11 above). 10
D. CAPM Method 11
Q. PLEASE SUMMARIZE MR. WALKER’S CAPM METHOD. 12
A. Mr. Walker’s “Palmetto adjusted” CAPM (10.20%) is based on his “Market Value CAPM” 13
result (8.90%) plus a 0.9% “Financial Risk Adjustment” and a 0.40% Financial Risk 14
Adjustment. 15
ELECTR
ONICALLY
FILED-2020
May
264:03
PM-SC
PSC-D
ocket#2019-281-S
-Page74
of80
Chart 13: Interest Rates / Corp Yield Spread1962 - 2019
7.00
k 6 00
'009
s. 400a
~ g ~
y = -0.04814+ 2.3369R' 0.0296
9 3 000Sr
as 2.00ss
ss 100'u49 ooo
6.00 8.00 10.CO 12.CO 14.CO 16.00 18.00
Interest Rates (10-Year U.S. Treasury Yield)
Direct Testimony of Aaron L. Rothschild – Cost of Capital Docket No. 2019-281-S
–––––––––––––––––––––––––––––––––––––––––––––––––––––––––––––––––––––––––––––––––––––––––––––––––––
73
His CAPM result is based on the average of two CAPM analyses that rely on two 1
different risk premium methodologies: (1) projected risk premium, and (2) historical risk 2
premium. In both analyses, he uses a risk-free rate of 3.4% based on “recent and forward 3
long-term treasury yields.” His projected risk premium (9.0%) is based on Value Line’s 4
projected total market return for the next 3 to 5 years (12.4%) minus his risk-free rate 5
(3.4%).64 His historical risk premium (6.9%) is based on Ibbotson Associates’ long-term 6
common stock total market return from 1928-2017 (11.95%) minus the long-term historic 7
return on long-term government bonds (5.02%) over the same time period. 8
Q. DO YOU AGREE WITH THE RESULTS OF MR. WALKER’S CAPM ANALYSIS? 9
A. No, I do not agree with the results of Mr. Walker’s CAPM analysis because I believe that 10
it significantly and inaccurately overstates the Company’s cost of equity. 11
Q. WHAT IS YOUR CONCLUSION REGARDING THE REASONABLENESS OF 12
MR. WALKER’S CAPM RESULT? 13
A. Just like his RP method (see above), Mr. Walker’s CAPM is not reliable because, among 14
other reasons, he uses data from his sources selectively and without explanation. He 15
depends on Value’s Line’s published forecasts in all three of his cost of equity methods, 16
including his CAPM. Mr. Walker explains that Value Line is “relied upon by many 17
investors,”65 but he does not address his unstated assumption that they rely on certain data 18
published by Value Line (forecasted annual returns for the overall market) and not others 19
(forecasted annual returns for water utilities). In his CAPM analysis, he uses Value Line’s 20
projected returns for the overall market, in part, to calculate his cost of equity for his 21
64 Ibid. Schedule 17, page 2 of 4. 65 Ibid. page 2, lines 21-22.
ELECTR
ONICALLY
FILED-2020
May
264:03
PM-SC
PSC-D
ocket#2019-281-S
-Page75
of80
Direct Testimony of Aaron L. Rothschild – Cost of Capital Docket No. 2019-281-S
–––––––––––––––––––––––––––––––––––––––––––––––––––––––––––––––––––––––––––––––––––––––––––––––––––
74
Comparative Water Group and, ultimately, for PUI. As discussed above, Mr. Walker does 1
not consider, at least not in his direct testimony, Value Line’s projected returns for his 2
Comparative Water Group in his RP method. He does not consider these same Value Line 3
projections in his CAPM analysis. It is unlikely that investors who rely on Value Line 4
would conclude that the cost of equity for Mr. Walker’s Comparative Water Group is 5
10.0% when Value Line’s projected returns for the Comparative Water Group is negative 6
0.8% (see Table 11 above). Regardless of the technical aspects of Mr. Walker’s CAPM 7
analysis, it is difficult to reconcile a CAPM result of 10.0% (Comparative Water Group) 8
with Value Line’s projected market return of negative 0.8% for the same group of 9
companies. I am not suggesting that the cost of equity for PUI should be set at negative 10
0.8%. My recommended cost of equity is significantly higher as well. My point is that 11
even if investors do, in fact, use Value Line, we have to justify which numbers they use 12
and how. In other words, we have to justify our cost of equity recommendation with our 13
own analysis. 14
Q. DO YOU AGREE WITH MR. WALKER’S USE OF THE ARITHMETIC MEAN 15
TO CALCULATE THE HISTORICAL RISK PREMIUM PORTION OF HIS 16
CAPM? 17
A. No. The arithmetic average return that Mr. Walker uses overstates the historical risk 18
premium by about 200 basis points. The 2019 SBBI Yearbook shows that investors 19
actually earned a compounded annual return of 10.0% between 1926 and 2018.66 The 20
arithmetic mean return of 11.9%67 is possibly valuable to stockbrokers and fund managers 21
66 2019 SBBI Yearbook, 16-17. 67 Ibid.
ELECTR
ONICALLY
FILED-2020
May
264:03
PM-SC
PSC-D
ocket#2019-281-S
-Page76
of80
Direct Testimony of Aaron L. Rothschild – Cost of Capital Docket No. 2019-281-S
–––––––––––––––––––––––––––––––––––––––––––––––––––––––––––––––––––––––––––––––––––––––––––––––––––
75
attempting to predict future bonuses, but not for calculating the cost of equity. As stated 1
above, the arithmetic average significantly overstates returns. 2
Q. DOES THE SOURCE RELIED ON BY MR. WALKER TO CALCULATE HIS 3
HISTORICAL RISK PREMIUM (IBBOTSON ASSOCIATES) AGREE THAT 4
INVESTORS ARE CONCERNED ABOUT GEOMETRIC MEAN RETURNS? 5
A. Yes. Ibbotson Associates states the following regarding Geometric vs. Single-Period 6
Expected Return (Arithmetic average): 7
…over long periods, investors are not concerned with simple averages of returns, 8 rather they are concerned with the accumulation of wealth. We use forecasted long-9
term geometric mean as the measure of reward because investors who plan on 10 repeatedly reinvesting in the same strategy over an indefinite period would seek the 11
highest rate of growth for the portfolios as measured by geometric mean.68 12
Q. WHAT IS YOUR CONCLUSION REGARDING MR. WALKER’S CLAIM THAT 13
PUI HAS A HIGHER COST OF EQUITY BECAUSE OF ITS SIZE? 14
A. Mr. Walker’s claim that PUI has a higher cost of equity because of its size is unjustified. 15
His assertion contradicts financial theory and empirical evidence. On page 44 of his direct 16
testimony, Mr. Walker correctly states “The CAPM is based upon the assumption that 17
investors hold diversified portfolios and the market only recognizes or rewards non-18
diversifiable (or systematic) risk.”69 However, in Mr. Walker’s “risk analysis” he does not 19
even attempt to demonstrate that the risks he claims are faced by investing in PUI (e.g., 20
lack of diverse geographic operation, “regulatory diversification,” and diverse customer 21
base) are non-diversifiable. 22
68 Ibbotson SBBI 2015 Classic Yearbook, page 149 69 Mr. Walker’s Direct Testimony, page 44, lines 16-18.
ELECTR
ONICALLY
FILED-2020
May
264:03
PM-SC
PSC-D
ocket#2019-281-S
-Page77
of80
Direct Testimony of Aaron L. Rothschild – Cost of Capital Docket No. 2019-281-S
–––––––––––––––––––––––––––––––––––––––––––––––––––––––––––––––––––––––––––––––––––––––––––––––––––
76
Mr. Walker states “The size of a company can be likened to ships on the ocean, 1
since a large ship has a much better chance of weathering the storm than a small ship. The 2
loss of a large customer will impact a small company much more than a large company 3
because a large customer of a small company usually counts for a larger percentage of a 4
small company’s sales.”70 Mr. Walker fails to mention that investors can purchase the 5
shares of many small companies and thus receive the type of risk protection experienced 6
by investing in one large company. For example, some companies within a portfolio of 7
many small companies will lose large customers and others will gain large customers. 8
Q. IS MR. WALKER’S ADJUSTMENT FOR A SMALL SIZE EFFECT AN 9
APPROPRIATE PART OF A CAPM ANALYSIS? 10
A. No. Mr. Walker’s added premium for the relatively small size of PUI is not justified. A 11
proper analysis of the data from Ibbotson SBBI/Morningstar shows that size is a 12
diversifiable risk and therefore does not impact the cost of equity. Professor Aswath 13
Damodaran said the following regarding the supposed “small cap premium”: 14
Even if you believe that small cap companies are more exposed to market risk than 15 large cap ones, this is an extremely sloppy and lazy way of dealing with that risk, 16
since risk ultimately has to come from something fundamental (and size is not a 17 fundamental factor).71 18
Q. PLEASE SUMMARIZE YOUR ANALYSIS OF MR. WALKER'S TESTIMONY. 19
A. Mr. Walker recommends that the Company be allowed a return on equity of 10.50%. Mr. 20
Walker’s DCF result of 9.70%72 is high because he uses unsuitable growth rates and adds 21
inappropriate adjustments for evaluating a company’s cost of equity. 22
70 Ibid. page 19, lines 16-17 and page 20, lines 1-2. 71Aswath Damodaran, Equity Risk Premiums (ERP): Determinates, Estimation and Implications – The 2014 Edition
(paper updated, March 2014). Page 40. 72 Mr. Walker’s Direct Testimony, Schedule 12, page 1 of 2.
ELECTR
ONICALLY
FILED-2020
May
264:03
PM-SC
PSC-D
ocket#2019-281-S
-Page78
of80
Direct Testimony of Aaron L. Rothschild – Cost of Capital Docket No. 2019-281-S
–––––––––––––––––––––––––––––––––––––––––––––––––––––––––––––––––––––––––––––––––––––––––––––––––––
77
Mr. Walker’s Risk Premium method and CAPM are unreliable because (1) they 1
rely on selective data from Value Line, and (2) they are developed based upon an improper 2
mathematical approach to quantifying historic actual returns. Mr. Walker’s claim that 3
investors demand a higher cost of equity to invest in a small company (referred to as “size 4
premium”) is manufactured by an incorrect use of data. 5
6
VII. CONCLUSION 7
Q. PLEASE SUMMARIZE YOUR RECOMMENDATIONS IN THIS CASE. 8
A. Based on the evidence presented in my testimony, I conclude that the cost of equity allowed 9
for the Company should be between 8.20% and 9.07% (averaging 8.63%) with an overall 10
cost of capital of between 7.10% and 7.56% (averaging 7.33%) based on the average 11
common equity ratio of the Water Proxy Group (See Table 1). My cost of equity 12
recommendation is based upon applying my three cost of equity models (Constant Growth 13
DCF, Non-Constant Growth DCF, and CAPM) to a proxy group of 7 regulated utility 14
companies. 15
Mr. Walker’s cost of equity recommendation of 10.50% is unreasonably high 16
primarily because he adds inappropriate adjustments for company size and the difference 17
between market value and book value capital structure. His adjustments should not be 18
accepted because they go against original cost ratemaking. 19
My 8.20% to 9.07% (averaging 8.63%) cost of equity recommendation satisfies the 20
requirements of Hope and Bluefield that regulated utility companies should have the 21
opportunity to earn a return commensurate with returns on investments in other enterprises 22
ELECTR
ONICALLY
FILED-2020
May
264:03
PM-SC
PSC-D
ocket#2019-281-S
-Page79
of80
Direct Testimony of Aaron L. Rothschild – Cost of Capital Docket No. 2019-281-S
–––––––––––––––––––––––––––––––––––––––––––––––––––––––––––––––––––––––––––––––––––––––––––––––––––
78
having corresponding risks. My recommendations are consistent with legal standards set 1
by the United States Supreme Court and market data. My 8.20% to 9.07% (averaging 2
8.63%) cost of equity and an overall cost of capital (rate of return) of 7.10% to 7.56% 3
(averaging 7.33%) will allow PUI to raise capital on reasonable terms while fulfilling their 4
obligation to provide safe and reliable service. 5
Q. DOES THIS CONCLUDE YOUR DIRECT TESTIMONY? 6
A. Yes. 7
ELECTR
ONICALLY
FILED-2020
May
264:03
PM-SC
PSC-D
ocket#2019-281-S
-Page80
of80