Embed Size (px)
Citation preview
BEFORE THE ENVIRONMENT COURT AT CHRISTCHURCH ENV-2010-CHC-115, 123, 124 AND 135 IN THE MATTER of Appeals pursuant to Section 120 of the
Resource Management Act 1991 BETWEEN WEST COAST ENT INC Appellant AND ROYAL FOREST AND BIRD PROTECTION SOCIETY OF NEW ZEALAND INC Appellant AND WHITE WATER NEW ZEALAND INC Appellant AND DIRECTOR GENERAL OF CONSERVATION Appellant AND WEST COAST REGIONAL COUNCIL AND BULLER DISTRICT COUNCIL Respondents ....Continued over leaf _____________________________________________________
STATEMENT OF EVIDENCE OF INGRID GERDA GRUNER
FOR DIRECTOR GENERAL OF CONSERVATION Dated: 15 May 2012
_____________________________________________________
_____________________________________________________
Department of Conservation, West Coast Tai o Poutini Conservancy Private Bag 701, Sewell Street HOKITIKA Ph 03 756 9100 Fax 03 756 9188 Counsel Acting: A Cameron, D van Mierlo
2
AND MERIDIAN ENERGY LIMITED Applicant AND FRIDA INTA Section 274 Party AND WHANAU PIHAWAI WEST –
RICHARD WAYNE BARBER AND IRI MAY BARBER MILNER
Section 274 Party AND J MacTAGGART Section 274 Party AND ORION ENERGY NZ LTD, ALPINE ENERGY LTD, MAIN POWER NZ LTD AND ELECTRICITY ASHBURTON LTD Section 274 Party AND NZ RAFTING INC Section 274 Party AND ANN SHERIDAN Section 274 Party AND BULLER ELECTRICITY Section 274 Party
3
TABLE OF CONTENTS 1. QUALIFICATIONS AND EXPERIENCE ...............................5
2. SCOPE OF EVIDENCE............................................................7
3. KEY FACTS AND OPINIONS.................................................7
4. SYSTEMATIC CONSERVATION PLANNING FOR
THE BULLER COAL PLATEAUX .........................................7
5. SYSTEMATIC CONSERVATION PLANNING.....................8
6. METHODS ..............................................................................10
Analysis Software ....................................................................10
Study Area ...............................................................................11
Data on Conservation Values...................................................12
Additional Analysis Features...................................................15
7. OUTPUTS................................................................................16
Scenario 1 – Biodiversity, without planning constraints;
Map 2 .......................................................................................17
Scenario 2 – Biodiversity, excluding consented areas;
Map 3 .......................................................................................17
Scenario 3 – Biodiversity and historic values, excluding
consented areas; Map 4............................................................18
Scenario 4 – Biodiversity and historic values, favouring
non-coal areas and public conservation land; Map 6...............19
Scenario 5 – Biodiversity and historic values, avoiding
coal resources; Map 8 ..............................................................20
8. CONCLUSIONS......................................................................21
REFERENCES ........................................................................24
APPENDIX 1...........................................................................27
APPENDIX 2...........................................................................28
APPENDIX 3...........................................................................29
APPENDIX 4...........................................................................30
APPENDIX 5...........................................................................31
APPENDIX 6...........................................................................32
APPENDIX 7...........................................................................33
APPENDIX 8...........................................................................34

4
APPENDIX 9...........................................................................35
1. QUALIFICATIONS AND EXPERIENCE
1.1. My full name is Ingrid Gerda Gruner.
1.2. I hold a Diploma in Biology (comparable to an MSc) from
Westfaelische Wilhelms University in Muenster, Germany,
and a PhD in Forestry, specialising in conservation
ecology, from the University of Canterbury, Christchurch,
New Zealand.
1.3. I am currently employed by the Department of
Conservation as Technical Support Officer, Ecosystems,
for the West Coast Conservancy. I have held this position
since 2008. Between 2004 and 2008, I was employed as
Conservancy Advisory Scientist, also for the West Coast
Conservancy. Prior to this, I worked for two years for
AgriQuality NZ, leading the South Island field verification
process for the second version of the New Zealand Land
Cover Database.
1.4. I am an ecologist with emphasis on plant and vegetation
ecology. During my time with the Department of
Conservation, I have also been involved in animal
conservation and ecology as well as visitor and recreation
management. Working for AgriQuality NZ, I acquired
skills in GIS and spatial analysis. I have published three
scientific papers.
1.5. With regard to the Buller Coal Plateaux, I have been
involved in conservation management issues in the area
over an extended period of time in my roles with the
Department of Conservation. My work there has included
the assessment of effects of mining proposals on public
conservation land, the review of expert ecological reports,
6
the provision of advice on Powelliphanta land snail
management and the provision of advice on mine
rehabilitation.
1.6. I am familiar with the Buller Coal Plateaux through
numerous field visits in connection with this work. I also
attained a general overview of vegetation patterns in the
area while mapping the Buller Coal Plateaux for the New
Zealand Land Cover Database. I have not undertaken any
field visits especially to investigate areas affected by the
proposed transmission line.
1.7. I am familiar with the transmission line proposal associated
with the Mokihinui Hydro Proposal (MHP) to the extent
that it crosses the Buller Coal Plateaux (which are
comprised of the Stockton Plateau and the Denniston
Plateau). I am not familiar with the details of the
transmission line construction or the MHP as it affects the
Mokihinui valley and wider catchment.
1.8. I have read the Environment Court’s Code of Conduct for
Expert Witnesses, and I agree to comply with it. I confirm
that the issues addressed in this brief of evidence are within
my area of expertise.
1.9. I have not omitted to consider material facts known to me
that might alter or detract from the opinions expressed. I
have specified where my opinion is based on limited or
partial information and identified any assumptions I have
made in forming my opinions.
1.10. In preparing this evidence, I have reviewed statements of
evidence of other witnesses giving evidence on behalf of
7
the Department of Conservation, namely those of Dr J.R.
Leathwick, Dr K.M. Lloyd and Ms K.J. Walker.
2. SCOPE OF EVIDENCE
2.1. My evidence will deal with the following:
A description of a project I am currently leading within the
Department to assist in identifying and mapping key areas
that would be required for a reserve network to achieve full
representation and long-term persistence of the full range
of conservation values on the Buller Coal Plateaux.
A consideration of the extent to which the proposed
transmission line for the MHP would intersect with these
key areas as identified and mapped to date within this
project.
3. KEY FACTS AND OPINIONS
3.1. The proposed MHP transmission line would likely affect
several areas of high priority for conservation management.
3.2. Further development impacting priority areas for
conservation management on the Buller Coal Plateaux,
including the MHP transmission line, should be deferred
until systematic conservation planning for the area has been
undertaken and a management strategy finalised.
4. SYSTEMATIC CONSERVATION PLANNING FOR THE BULLER COAL PLATEAUX
4.1. I am currently leading a project within the Department
exploring the use of a systematic conservation planning
approach (Margules & Pressey 2000) to the Buller Coal
8
Plateaux. The need for this project arose from the
increasing conflict between protection of conservation
values on the one hand and development proposals, in
particular for mining, on the other. The Department realised
that a continuation of its current case-by-case approach to
development proposals would likely lead to the long-term
loss of significant conservation values.
4.2. My evidence is based on outputs from this project to date.
At the time of writing this evidence, the project has not yet
been completed. Further analyses are likely, potentially
changing the picture provided in this evidence statement. I
will be in a position to update the Court on any such
changes. The anticipated timeframe for the project is for
completion by the end of June 2012. Dr Leathwick, who
also presents evidence on behalf of the Department of
Conservation, assisted with the design of the analyses
presented here.
4.3. In the following, I will briefly describe the principles of
systematic conservation planning, the analysis methods and
the data used for the project, and then step through the
analysis process to provide a better understanding of the
outputs. I will present different output scenarios, and put
them into the context of the proposed MHP transmission
line.
5. SYSTEMATIC CONSERVATION PLANNING
5.1. Systematic conservation planning is a relatively new
approach to conservation management. It aims at achieving
protection and persistence of the full range of conservation
values in an environment of conflicting human interests
9
and financial constraints (Margules & Pressey 2000;
Moilanen et al. 2009).
5.2. Systematic conservation planning has been widely used
internationally (e.g., Franco et al. 2009; Game et al. 2010;
Lehtomaki et al. 2009) and is meeting increasing interest in
New Zealand: For example, here, it has been used to
identify priorities for freshwater conservation (Leathwick et
al. 2010; Moilanen et al. 2008; see also evidence by Dr
Leathwick), for marine protection proposals (Leathwick et
al. 2006; Leathwick et al. 2008), and is most recently being
applied by the Department of Conservation to prioritise
conservation management to ensure protection of a full
range of New Zealand’s ecosystems (refer evidence of Dr
Leathwick).
5.3. The use of systematic conservation planning in the context
of the Buller Coal Plateaux aims at moving the Department
away from a case-by-case approach to development
proposals in the area. Systematic conservation planning
allows a look at the entire area and its conservation values
as a whole. Analyses can then identify which parts of the
area are of particular importance, if the aim is to protect a
representative and long-term viable sample of these values.
5.4. Systematic conservation planning also allows taking into
account other factors such as land status and, in the
example of the Buller Coal Plateaux, interests in coal
resources. Therefore, the aim of the current project is to
identify which areas on the Buller Coal Plateaux currently
provide the best opportunity to protect a representative and
long-term viable sample of the full range of conservation
values, while acknowledging current and potential future
interests in access to coal resources.
10
5.5. The current project does not necessarily supersede the
Protected Natural Areas Programme (PNAP) survey
previously undertaken for the Ngakawau Ecological
District (Overmars et al. 1998). The motivation for the
Ngakawau PNAP was principally the same as for the
current project, but the methods used were different. The
current project aims to assess a wider range of conservation
values and uses relatively new, quantitative and spatial
analysis methods. These methods allow the comparison of
a range of potential scenarios and provide a decision
support tool rather than producing one single, static
recommendation as in the PNAP survey report. Outputs
from the current project will need to be assessed and
evaluated using expert knowledge and other information on
values in the area, including that contained in the PNAP
survey report.
6. METHODS
Analysis Software
6.1. The analysis uses the software application Zonation
(Moilanen 2007; Moilanen et al. 2005,
http://www.helsinki.fi/bioscience/consplan/) which was
specifically developed for problems of systematic
conservation planning. Zonation works on spatial data sets,
i.e. a series of digital maps showing the geographic
distribution of conservation values in the area of interest.
6.2. The analysis starts by assuming that the entire area is
protected. Zonation then progressively reduces the area
under protection in a step-wise fashion, at each step
removing those parts of the area that contribute least to the
protection of conservation values. During the course of this
process a new map is created illustrating this step-wise
11
removal process, which translates into a ranking of the area
by conservation priority. Zonation also provides
information on the decline of individual conservation
values, calculated as the area under protection is
progressively reduced.
6.3. These outputs can be used to identify which parts of the
area of interest would best be protected to achieve
representativeness and persistence of the full range of
conservation values, assuming that only a proportion of the
area can be protected.
Study Area
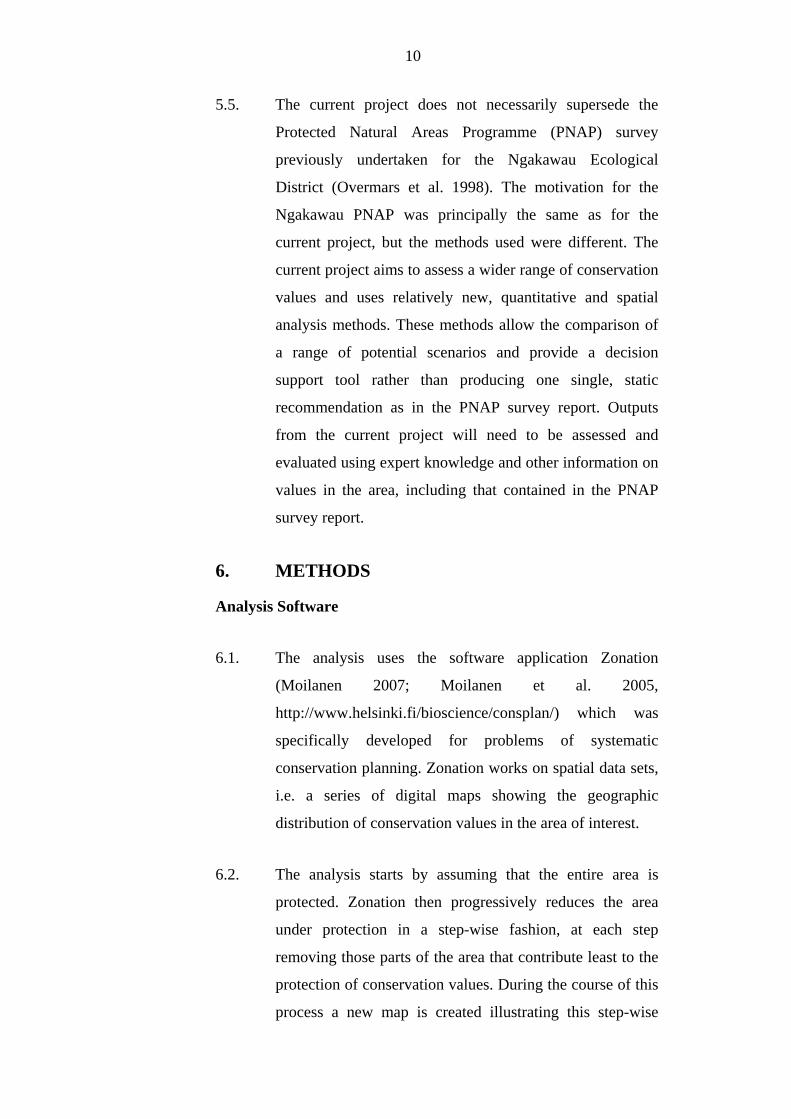
6.4. The study area used in the analysis extends over the
Stockton and Denniston Plateaux south to the Te Kuha area
and includes the steep western slopes towards the coastal
flats as well as the western slopes of the Mt William Range
(Map 1). This area encompasses the unique landscapes and
conservation values of the Buller Coal Plateaux. The
Blackburn Pakihi to the east of the Stockton Plateau was
excluded because of its relatively high degree of
modification and the presence of comparable, unmodified
areas in the nearby Ngakawau and Orikaka Ecological
Areas (Overmars et al. 1998). Only the southern most 14.8
km of the proposed MHP transmission line are within the
study area.
12
Map 1. Study area for the Buller Coal Plateaux Systematic Conservation Planning project.
Data on Conservation Values
6.5. Ideally, the analysis would include data on the full range of
conservation values present on the Buller Coal Plateaux,
i.e. all biodiversity, historic, landscape, recreation and
13
cultural values. In practice, this approach is limited by the
availability of data. The following briefly discusses the
range of data layers used. These were compiled from
survey reports, field visits, expert knowledge and mapping
of aerial photography.
(a) Vegetation. The information on vegetation
types represents one of the key layers for
biodiversity. This is because of their inherent
biodiversity values, but also because they
function as surrogates for the distribution of
fauna species, where comprehensive data on
distribution are lacking. The extent to which
these vegetation types truly reflect the
distribution of other biodiversity throughout
the area is unknown; the use of surrogacy has
been widely criticised in the international
literature (e.g., Lombard et al. 2003; Pressey
2004), but it is currently the best we can do
with available data.
(b) Originally rare ecosystems. Originally rare
ecosystems are defined as ecosystems that
were rare before human colonisation, with a
total extent of less than 0.5% (<134,000ha) of
New Zealand’s total land area (Williams et al.
2007). Six originally rare ecosystems have
been identified on the Buller Coal Plateaux:
sandstone erosion pavements, boulderfields of
quartzose/acidic rock, cliffs and scarps of
quartzose/acidic rock, tarns, seepages and
pakihi. With the exception of cliffs and scarps
of quartzose/acidic rock, layers for all of these
ecosystems were included in the analysis.
14
(c) Powelliphanta land snails. The only fauna
species for which we have comprehensive
distributional data are the two species of
Powelliphanta land snails present on the
Buller Coal Plateaux, i.e. P. patrickensis and
P. augusta. Distribution maps for these
species were included as separate data layers
in the analysis.
(d) Freshwater streams. Streams were classified
into five stream types, according to their
topography and water chemistry. In addition,
we used a so-called ‘condition layer’ for
streams, which ranks them according to their
ecological integrity, favouring the protection
of those that are in good condition ahead of
those that have been degraded by human
activity.
(e) Historic values. Known above ground
historic values were mapped using aerial
photography and included in our analysis as a
series of map layers. It needs to be noted that
the Zonation software was primarily
developed for the analysis of data on
biodiversity features. However, the inclusion
of historic features in our analyses is
consistent with Zonation’s purpose and intent,
which is to identify parts of a landscape that
maximise the protection of a range of features
with differing geographic distributions. In our
analysis, historic values are treated in the
same way as species with limited geographical
15
distributions. Outputs seem to appropriately
include historic features.
(f) Landscape, recreation and cultural values.
The intent of the project is to also include
landscape, recreation and cultural values. This
has to date not been undertaken, i.e. the
interim outputs presented below exclude
consideration of these values.
Additional Analysis Features
6.6. Three additional analysis features are important to mention
for a better understanding of outputs. These are:
(a) The ability to put different weights onto the
conservation value layers. In our analysis,
highest weight was given to conservation
values that were deemed to be of (inter)
national significance, because they are unique
(endemic) to the Buller Coal Plateaux (e.g.,
Chionochloa juncea grassland, Powelliphanta
species). Intermediate weight was given to
features that are integral components of the
unique ecology of the Buller Coal Plateaux,
but are also found in other places (e.g., high
elevation beech forests and manuka scrub
above 600m asl). Lowest weight was given to
values that are not integral to the unique
ecology of the Plateaux. These features occur
mainly at lower altitude and are relatively
widespread elsewhere (e.g., rimu-hard beech
forest). For detailed discussions on the values
of the Buller Coal Plateaux and their
16
significance refer to other evidence presented
on behalf of the Department, e.g., that of Dr
K. Lloyd and Ms Walker.
(b) The ability to include algorithms that
encourage the identification of geographically
compact high-value sites, as opposed to
solutions in which high-value sites are
scattered across the landscape in a fragmented
pattern. Use of these techniques recognises the
ecological value of connectivity for the
functioning and persistence of species and
ecosystems.
(c) The ability to use ‘masks’ in the analysis to
forcibly exclude or include certain areas. This
allows the development of scenarios with
different sets of constraints, e.g., considering
mining that is already underway or to which
planning consent has been granted. This will
be further explained below.
7. OUTPUTS
7.1. The analysis outputs presented below are preliminary. The
project is a work in progress, and further analyses will be
undertaken, potentially changing the picture provided here.
Nonetheless, presentation of these outputs is still relevant
because they highlight the potential for the MHP
transmission line to impact on areas of high priority for
conservation management.
17
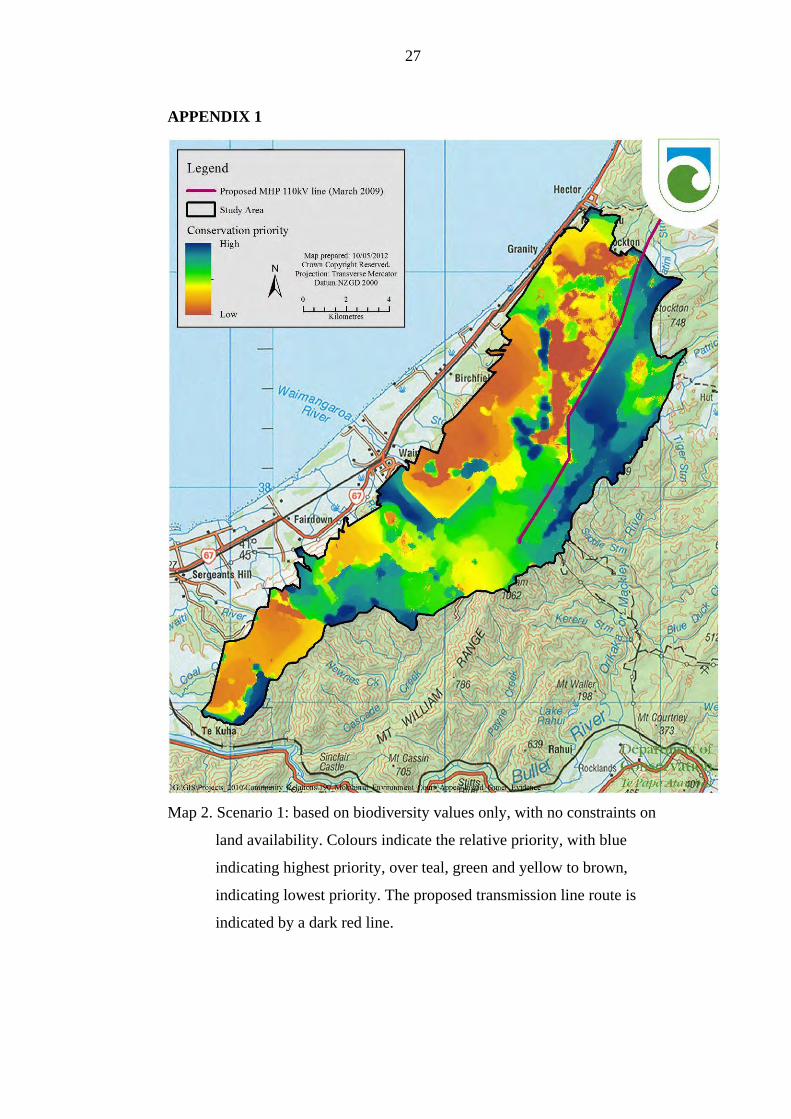
7.2. The maps illustrating the various scenarios use a graded
colour scheme from the lowest ranked areas in brown, over
yellow and green, to the highest priority areas in blue.
Scenario 1 – Biodiversity, without planning constraints; Map 2
7.3. This represents the most basic scenario, ranking the entire
landscape for its contribution to conservation outcomes,
with no constraints imposed by land status or presence of
coal resources. It shows that the highest ranked areas on the
Stockton Plateau are from the area around Mangatini
Stream south along the flanks of Mt Stockton over Fly
Creek and Plover Stream into the Cypress area and along
the western slopes of the Mt William Range to about Cedar
Creek Saddle. The proposed MHP transmission line would
more or less follow the western edge of this highly ranked
area. Other highly ranked areas on the Stockton Plateau are
just to the west of the Stockton escarpment (P. augusta
habitat) and slopes around Mt Frederick.
7.4. Developing a protection proposal based on this scenario
would be unrealistic, as some of the highly ranked areas
have already been consented for development, e.g. the
Cypress Stream area in the upper Waimangaroa catchment.
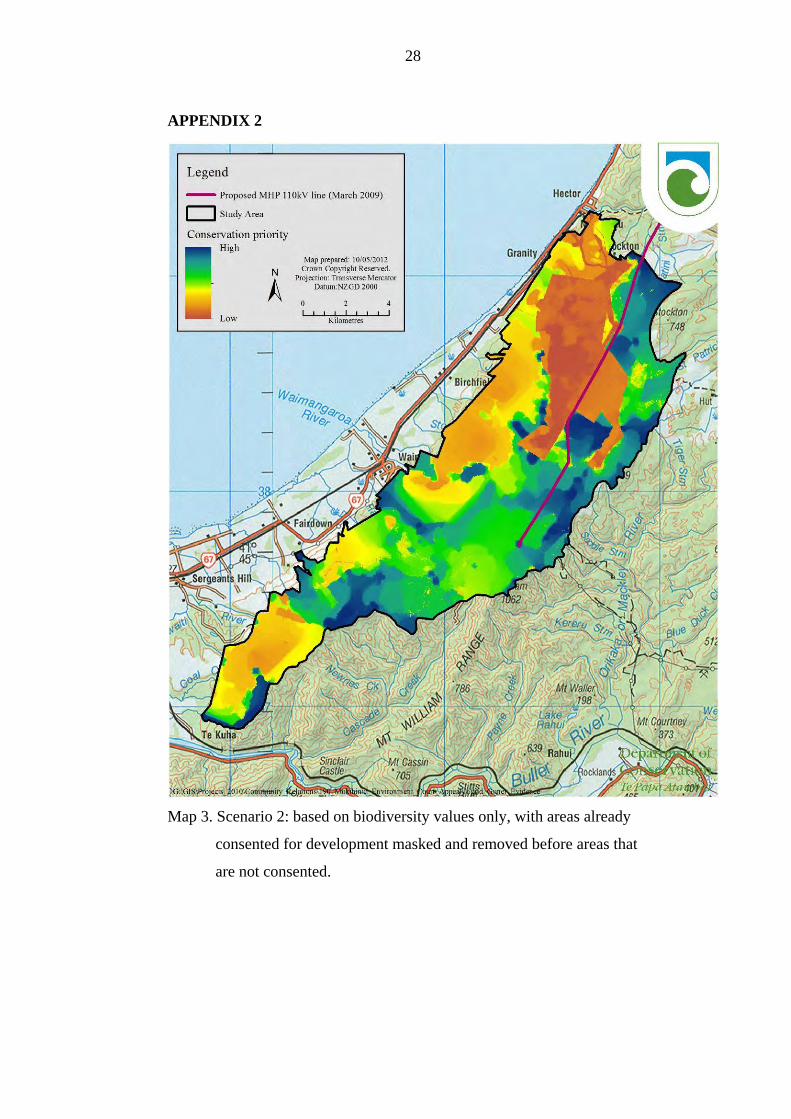
Scenario 2 – Biodiversity, excluding consented areas; Map 3
7.5. This is a more realistic scenario as it excludes areas already
consented for development. In the analysis a mask was
used forcing Zonation to remove these consented areas
first1. As a consequence, previously highly ranked areas,
1 Areas excluded to date because of existing consents are: Solid Energy’s Stockton Coal
Mining Licence, Cypress Mine, Stockton No 2 South, Rockies Mine, and the Kawatiri
Energy hydro development.
18
e.g., in the vicinity of Fly Creek, Plover Stream and
Cypress Stream are now allocated a low priority (= brown
colouring), reflecting the impending loss of all biodiversity
values in these areas. Otherwise, areas east of the
transmission line remain highly ranked, but an area south
of Webb Stream is now more highly ranked and the
proposed transmission line would bisect this area. In
addition, a very highly ranked area containing a red tussock
fen is now prominent at the southern end of the
transmission line. The exact location of this fen in relation
to the proposed transmission line has not been assessed in
the field.
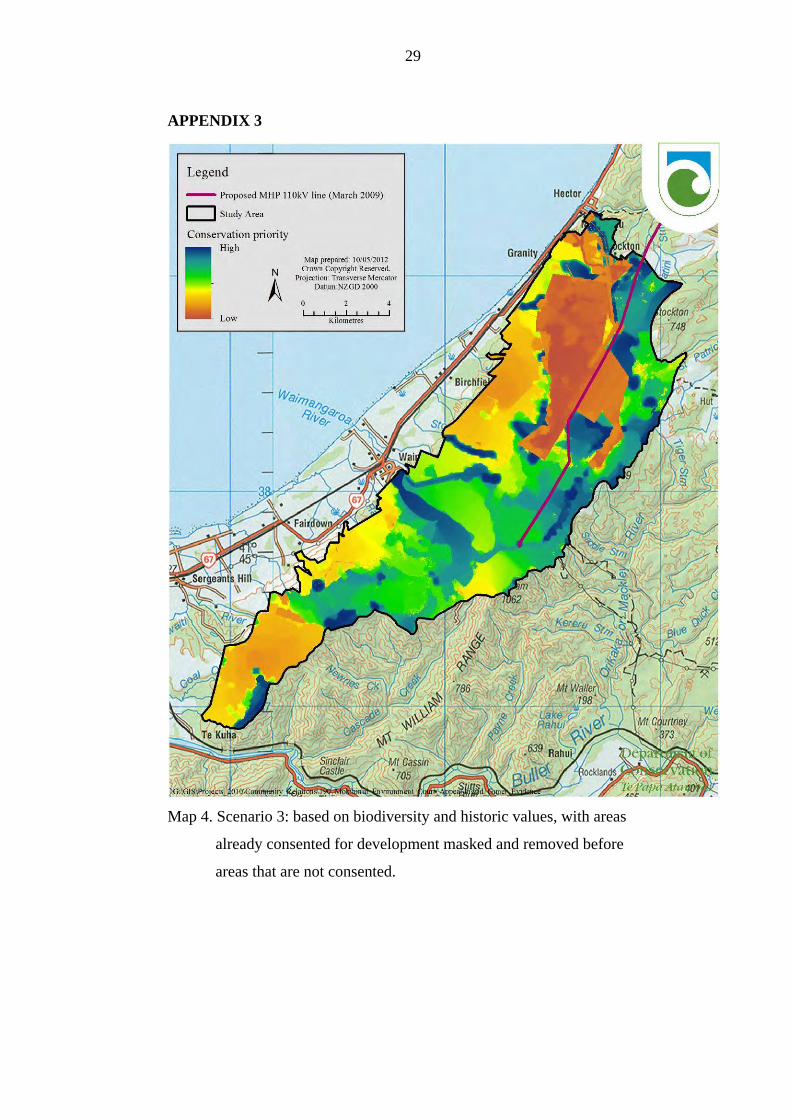
Scenario 3 – Biodiversity and historic values, excluding
consented areas; Map 4
7.6. In Scenario 3 we expand the previous analysis by taking
into account both, biodiversity and historic values.
Inclusion of historic values subtly alters the distribution of
highly ranked areas to include important historic features,
e.g., the Stockton electric loco line. Because of this, the
area to the west of the transmission line along Burma Road
is now also highly ranked.
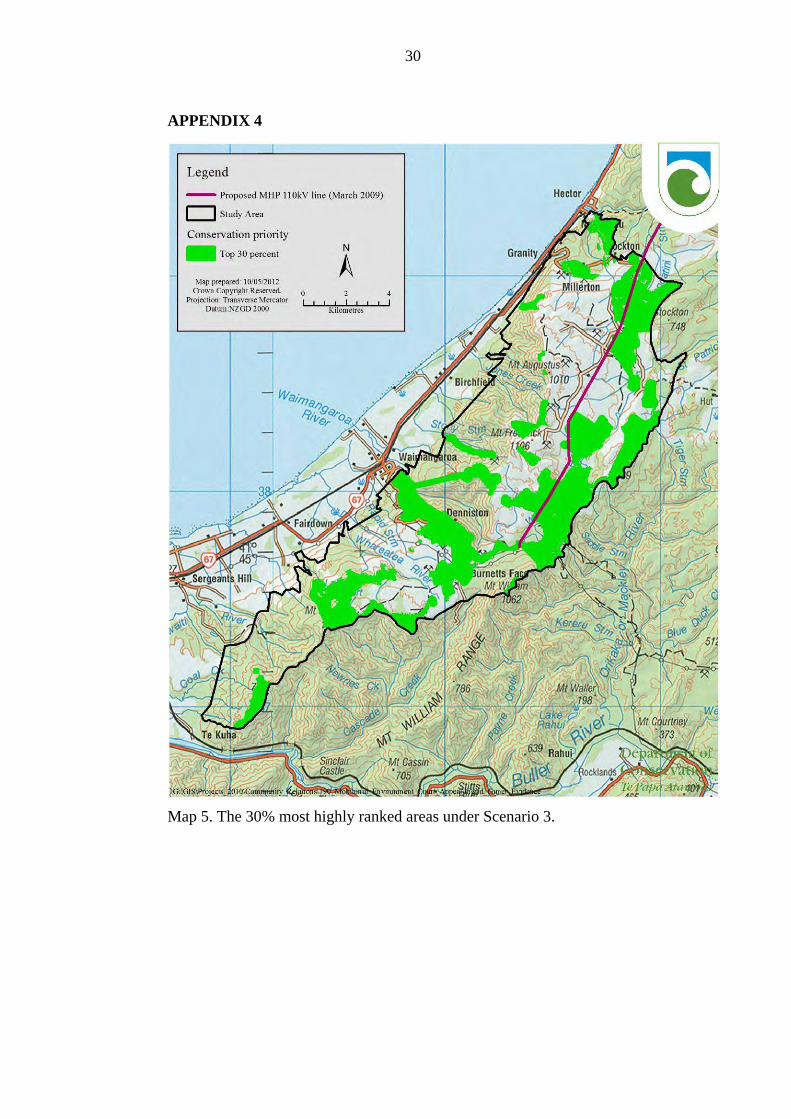
7.7. Protection of the most highly ranked 30% of the study
area2, based on this scenario, would require setting aside
for conservation the areas shown on Map 5. Several of
these highly ranked areas would be affected by the
proposed transmission line reducing their value for
conservation.
2 The figure of 30% is used here for illustrative purposes only, to highlight high priority
areas. This does not imply that protection of these areas would be appropriate or sufficient
in the context of a protection proposal for the Buller Coal Plateaux.
19
7.8. Scenario 3 is still optimistic. In reality further constraints
are likely to be brought forward by various stakeholders.
Not all of the area is public conservation land; some areas
are held by Land Information New Zealand
(LINZ)/Ministry for Economic Development (MED), i.e.
this land is not necessarily held for conservation purposes.
The presence of coal resources off and on public
conservation land is likely to add another constraint to the
achievability of protection proposals.
Scenario 4 – Biodiversity and historic values, favouring non-coal
areas and public conservation land; Map 6
7.9. Scenario 4 takes both of the constraints described above
into account. This was implemented in the analysis by
using a mask that removes areas already mined or
consented for development first (as in Scenario 2 and 3),
followed by areas likely to have coal resources beneath
them. The latter were removed sequentially starting with
areas on LINZ/MED land, followed by areas on
stewardship land, and then removing coal resource areas in
existing conservation reserves and Ecological Areas3.
Areas known to be free of coal resources, irrespective of
land tenure or status, were retained until last, and as a
consequence have the highest rankings. In this scenario the
proposed transmission line does not affect any highly
ranked areas except for a small area along Mangatini
Stream. Most areas along the transmission line are ranked
intermediate (green to yellow).
3 The sequence of removal of areas with likely coal resources is based on the level of
control the Department has concerning mining development, depending on land tenure and
status. The sequence does not reflect relative ecological value of these areas.
20
7.10. The most highly ranked 30% under this scenario are shown
on Map 7. Very few-high value areas are identified for the
Plateaux proper, and protection is now focussed mainly on
tracts of forest on the plateau fringes. Only one large area
on the Denniston Plateau remains that has been identified
as bearing no coal.
7.11. While this scenario would maximise the availability of coal
resources, it would also deliver a substantial reduction in
the protection of biodiversity. Under the previous Scenario
3, setting aside the top ranked 30% of land for conservation
would protect at least 11% of the extent of all biodiversity
features and at least 21% of the extent of those features
deemed to be of (inter-)national significance. By contrast,
under this Scenario 4, several conservation features would
be lost entirely or reduced to below 5% of their current
extent, including several deemed to be of (inter-)national
significance (e.g., sandstone erosion pavements and tarns).
This means, while Scenario 4 would strongly accommodate
mining interests, it would deliver substantially lower
conservation outcomes than Scenario 3.
Scenario 5 – Biodiversity and historic values, avoiding coal
resources; Map 8
7.12. A further scenario is provided by an analysis that allows the
ranking of the remaining area independent of land tenure or
status, but aims at avoiding coal resources. This is achieved
by giving likely coal resources a negative weight in the
analysis. To reflect the high value given to coal resources
by stakeholders, we used the same level of weight as for
distinct and (inter-)nationally significant conservation
values.
21
7.13. In this scenario, the area east of the Stockton CML is again
highly ranked. The transmission line would bisect highly
ranked areas in the north, and again south of Webb Stream.
The distribution of the top 30% (Map 9) is similar to
Scenario 3, but some on-coal areas are avoided. Under this
scenario a minimum of 12% of the extent of all biodiversity
values would be maintained, and at least 19% of the extent
of those values deemed (inter-)nationally significant. This
means the overall conservation benefit would be
comparable to Scenario 3. 80% of the coal resource would
remain accessible.
8. CONCLUSIONS
8.1. Currently, there is no certainty that the high conservation
values of the Buller Coal Plateaux will persist, given the
current and likely future interest in coal resources. Even
off-coal areas are targeted by developers to provide space
for, e.g., infrastructure or overburden dumps. The analysis
described above is intended to initiate and support a
discussion process between interested parties aiming to
reach agreement on a protection proposal that allows for
the achievement of at least some conservation goals
through the withholding of some high-value areas from
development.
8.2. The scenarios presented above show options for such a
proposal from the idealistic through to the pragmatic and
pessimistic. Discussions with stakeholders have not yet
begun. The outcome is therefore unknown. The decision
about the proposed transmission line may have to be made
in this uncertain environment. However, the scenarios
presented above highlight that some areas along the
22
proposed transmission line route are likely to be of
particular interest for conservation management.
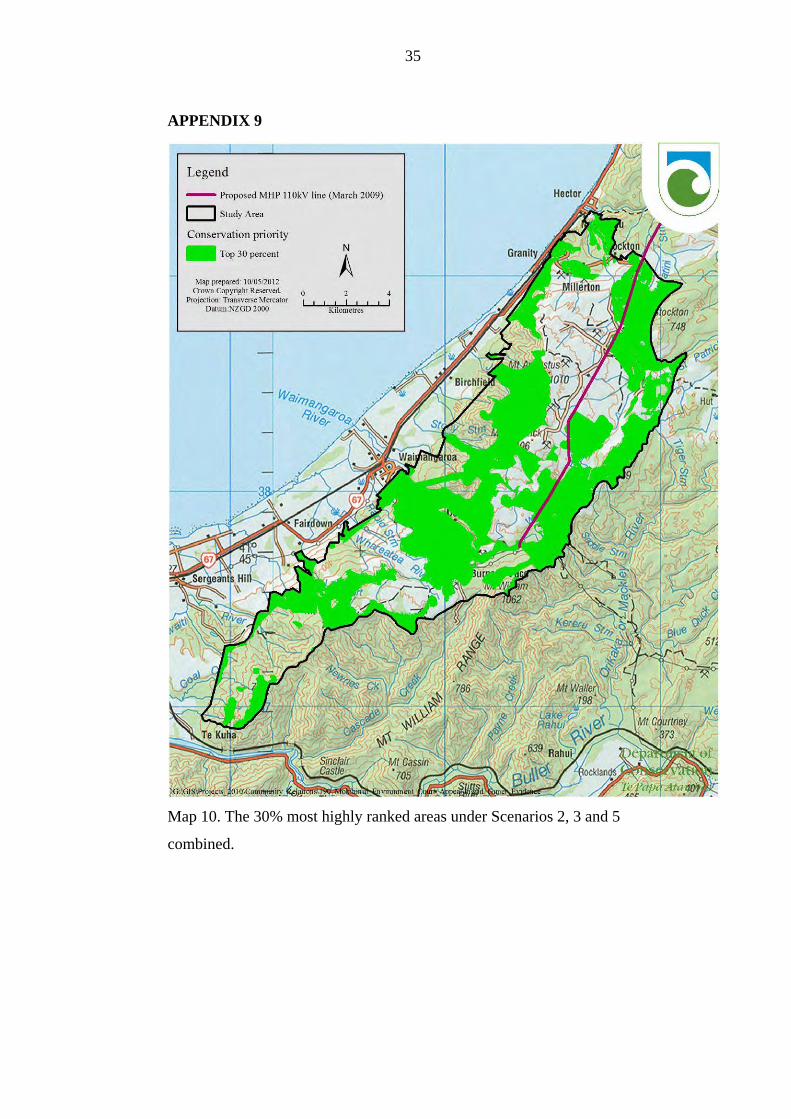
8.3. An overlay of all the top ranked 30% for scenarios 2, 3 and
5 illustrates these areas based on analysis results to date
(Map 10). Scenario 1 was excluded from this combined
map because it includes some areas that are already
consented. Scenario 4 was excluded because of the
inadequacy of its conservation outcomes.
8.4. The MHP transmission line would bisect areas of high
conservation interest in the north of the project study area,
i.e. in the Mangatini Stream area to the east of Burma
Road, and further south, to the east of Mt Frederick and
south of Webb Stream.
8.5. While outcomes for the Buller Coal Plateaux are uncertain,
considering the high conservation value of the area and the
strong interest by mining companies, it would be premature
to impact on any of the high priority areas identified in this
analysis before an overall strategy for protection and
development of the Plateaux is finalised. Otherwise,
currently possible beneficial outcomes for the Buller Coal
Plateaux may be precluded.
8.6. If further development cannot be deferred until a strategy
for the Buller Coal Plateaux has been finalised, it should be
focussed on areas that are ranked as relatively low priority
in the analyses. This is the case, in particular, for the
proposed MHP transmission line, as this development is
not spatially fixed. Coal resources and associated coal
mines cannot be moved; the transmission line could
potentially be constructed along a different route.

23
8.7. The analysis results presented above are preliminary. It is
anticipated that the project described in this evidence will
be completed over the next two months, and the final
project outputs will then be available.
24
REFERENCES
Franco, A. M. A., B. Anderson, D. B. Roy, S. Gillings, R. Fox, A.
Moilanen, and C. D. Thomas. 2009. Surrogacy and
persistence in reserve selection: landscape prioritisation for
multiple taxa in Britain. Journal of Applied Ecology 46:82-
91.
Game, E. T., G. Lipsett-Moore, R. Hamilton, N. Peterson, J.
Kereseka, W. Atu, M. Watts, and H. Possingham. 2010.
Informed opportunism for conservation planning in the
Solomon Islands. Conservation Letters 00:1-9.
Leathwick, J., K. Julian, and M. Francis. 2006. Exploration of the
use of reserve planning sofware to identify potential Marine
Protected Areas in New Zealand's Exclusive Economic Zone.
National Institute of Water & Atmospheric Research Ltd,
Department of Conservation, Hamilton.
Leathwick, J., A. Moilanen, M. Francis, J. Elith, P. Taylor, K. Julian,
T. Hastie, and C. Duffy. 2008. Novel methods for the design
and evaluation of marine protected areas in offshore waters.
Conservation Letters 1:91-102.
Leathwick, J. R., A. Moilanen, S. Ferrier, and K. Julian. 2010.
Complementarity-based conservation prioritization using a
community classification, and its application to riverine
ecosystems. Biological Conservation 143:984-991.
Lehtomaki, J., E. Tomppo, P. Kuokkanen, I. Hanski, and A.
Moilanen. 2009. Applying spatial conservation prioritization
software and high-resolution GIS data to a national-scale
study in forest conservation. Forest Ecology and
Management 258:2439-2449.
25
Lombard, A. T., R. M. Cowling, R. L. Pressey, and A. G. Rebelo.
2003. Effectiveness of land classes as surrogates for species
in conservation planning for the Cape Floristic Region.
Biological Conservation 112:45.
Margules, C. R., and R. L. Pressey. 2000. Systematic conservation
planning. Nature 405:243-253.
Moilanen, A. 2007. Landscape Zonation, benefit functions and
target-based planning: Unifying reserve selection strategies.
Biological Conservation 134:571.
Moilanen, A., A. M. A. Franco, R. I. Early, R. Fox, B. Wintle, and
C. D. Thomas. 2005. Prioritizing multiple-use landscapes for
conservation: methods for large multi-species planning
problems. Proceedings of the Royal Society B: Biological
Sciences 272:1885-1891.
Moilanen, A., J. Leathwick, and J. Elith. 2008. A method for spatial
freshwater conservation prioritization. Freshwater Biology
53:577.
Moilanen, A., K. A. Wilson, and P. H. P., editors. 2009. Spatial
conservation prioritization. Quantitative methods and
computational tools. Oxford University Press, Oxford.
Overmars, F. B., M. J. Kilvington, R. S. Gibson, C. L. Newell, and
T. J. Rhodes 1998. Ngakawau Ecological District. Survey
report for the protected natural areas programme. Department
of Conservation, Hokitika.
26
Pressey, R. L. 2004. Conservation Planning and Biodiversity:
Assembling the Best Data for the Job. Conservation Biology
18:1677.
Williams, P. A., S. Wiser, B. Clarkson, and M. C. Stanley. 2007.
New Zealand's historically rare terrestrial ecosystems set in a
physical and physiognomic framework. New Zealand Journal
of Ecology 31:119-128.
27
APPENDIX 1
Map 2. Scenario 1: based on biodiversity values only, with no constraints on
land availability. Colours indicate the relative priority, with blue
indicating highest priority, over teal, green and yellow to brown,
indicating lowest priority. The proposed transmission line route is
indicated by a dark red line.
28
APPENDIX 2
Map 3. Scenario 2: based on biodiversity values only, with areas already
consented for development masked and removed before areas that
are not consented.
29
APPENDIX 3
Map 4. Scenario 3: based on biodiversity and historic values, with areas
already consented for development masked and removed before
areas that are not consented.
30
APPENDIX 4
Map 5. The 30% most highly ranked areas under Scenario 3.
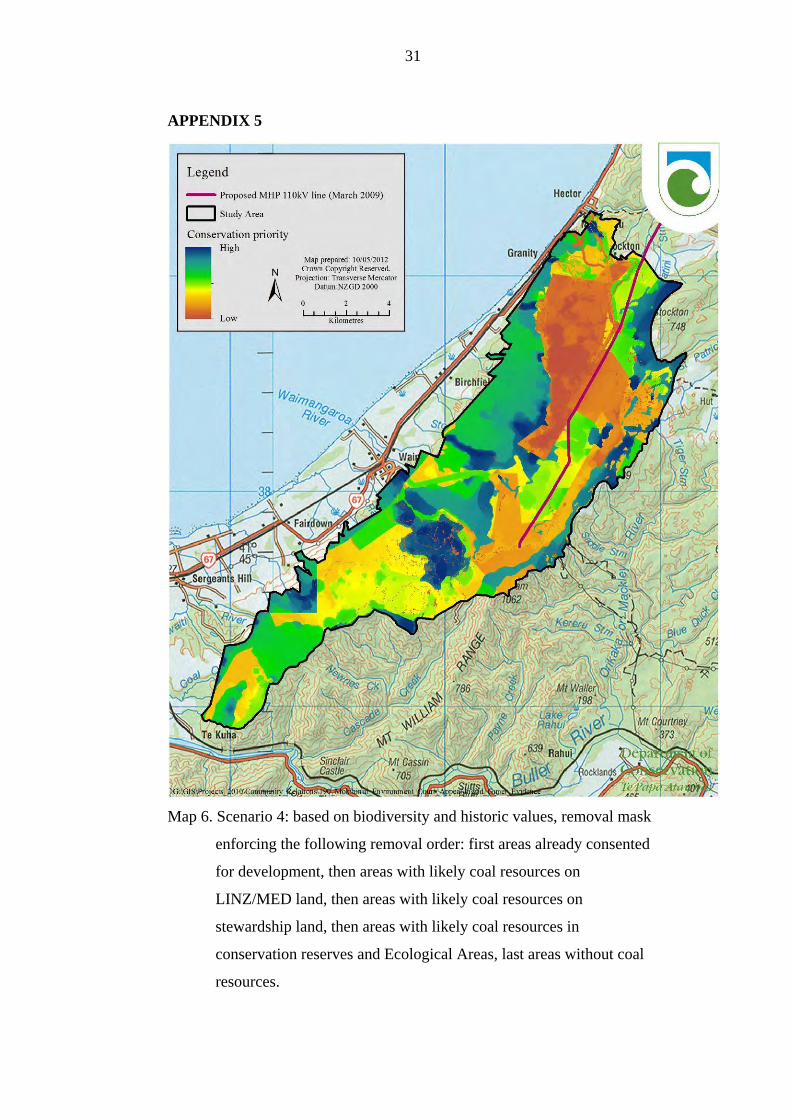
31
APPENDIX 5
Map 6. Scenario 4: based on biodiversity and historic values, removal mask
enforcing the following removal order: first areas already consented
for development, then areas with likely coal resources on
LINZ/MED land, then areas with likely coal resources on
stewardship land, then areas with likely coal resources in
conservation reserves and Ecological Areas, last areas without coal
resources.
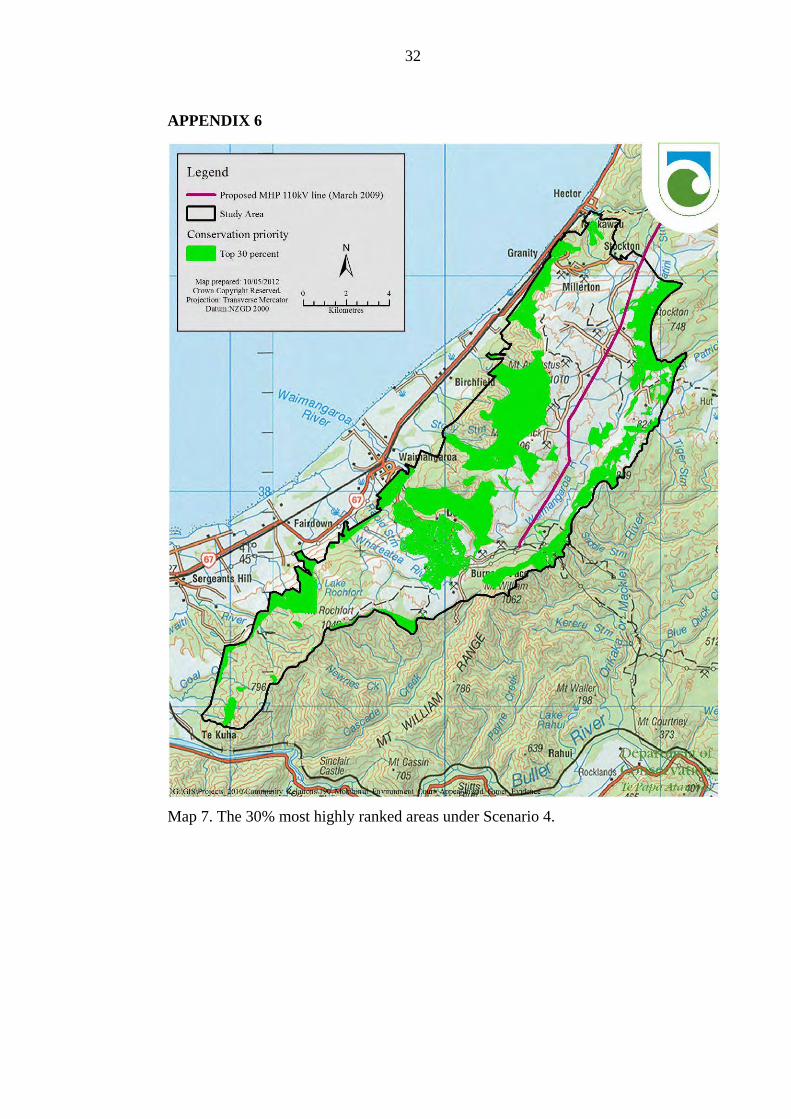
32
APPENDIX 6
Map 7. The 30% most highly ranked areas under Scenario 4.
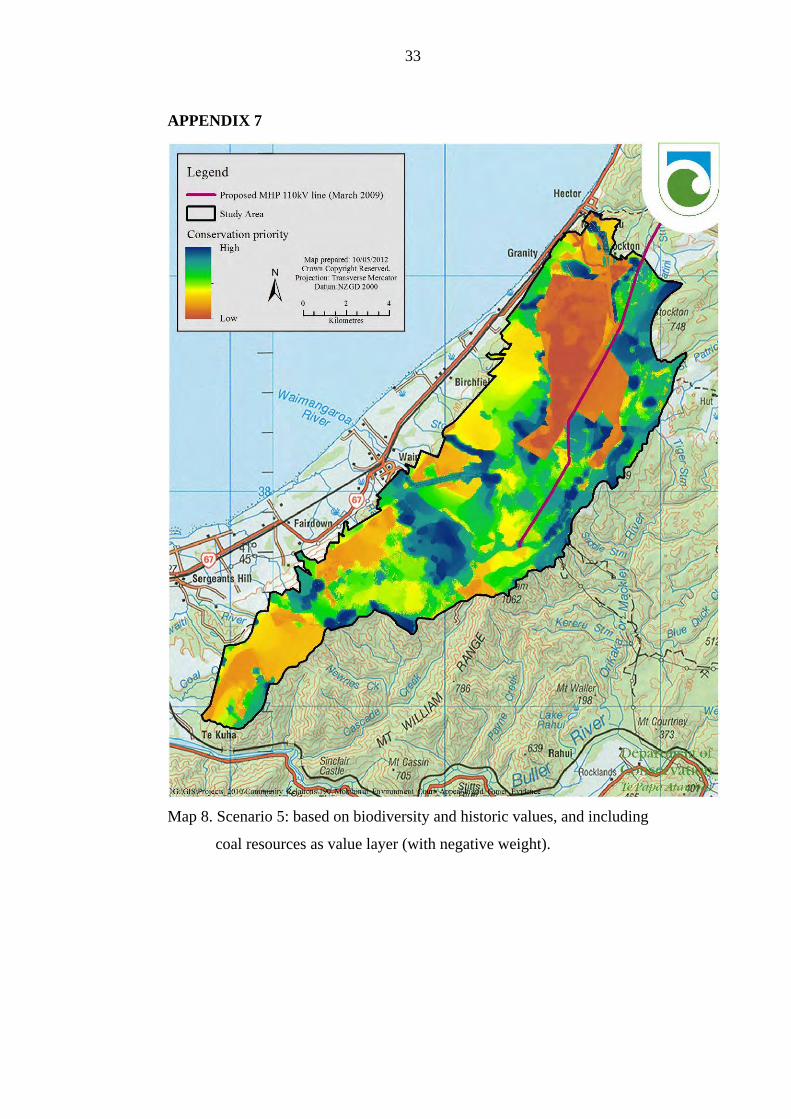
33
APPENDIX 7
Map 8. Scenario 5: based on biodiversity and historic values, and including
coal resources as value layer (with negative weight).
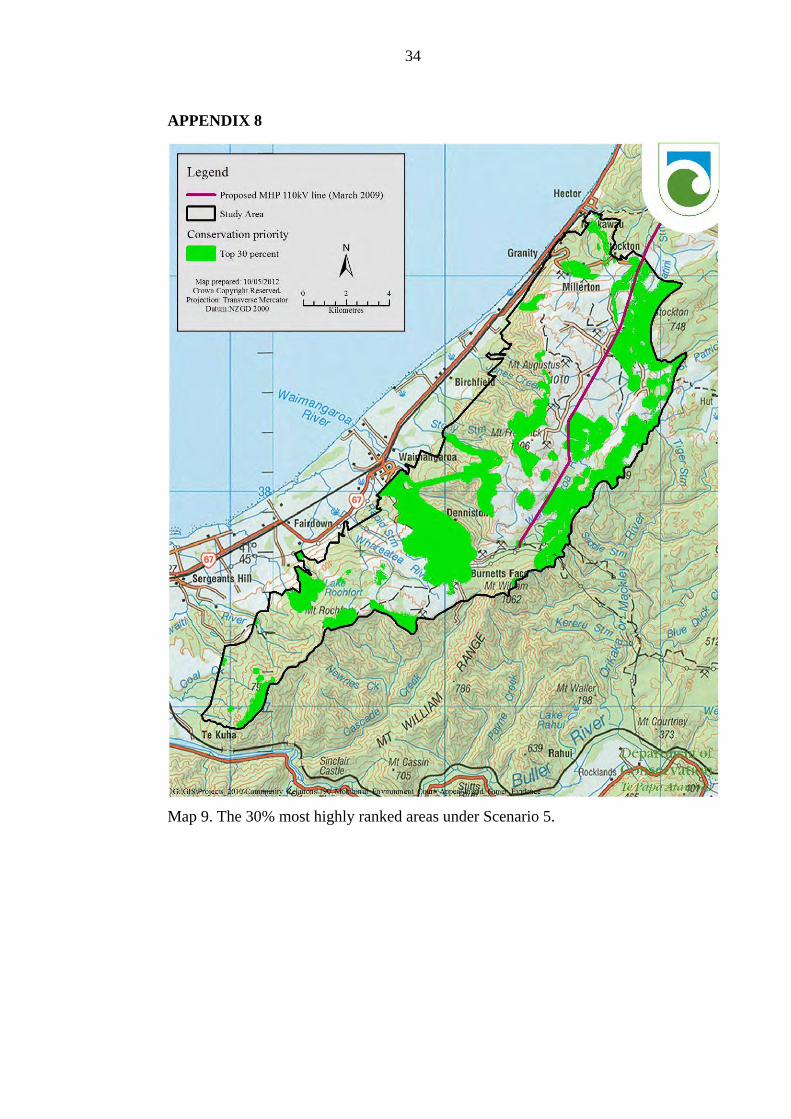
34
APPENDIX 8
Map 9. The 30% most highly ranked areas under Scenario 5.
35
APPENDIX 9
Map 10. The 30% most highly ranked areas under Scenarios 2, 3 and 5
combined.
![IN THE EMPLOYMENT COURT CHRISTCHURCH CRC 21/07employmentcourt.govt.nz/assets/Documents/Decisions/2012-NZEm… · IN THE EMPLOYMENT COURT CHRISTCHURCH [2012] NZEmpC 63 CRC 21/07 IN](https://img.pdfslide.net/doc/110x75/5e9c397a52b9f02bb4717497/in-the-employment-court-christchurch-crc-21-in-the-employment-court-christchurch.jpg)
![IN THE EMPLOYMENT COURT CHRISTCHURCH …...ROSAURO GAPUZAN v PRATT & WHITNEY AIR NEW ZEALAND SERVICES trading as CHRISTCHURCH ENGINE CENTRE NZEmpC CHRISTCHURCH [2014] NZEmpC 206 [11](https://img.pdfslide.net/doc/110x75/5e8c90ab784a4214512ccb53/in-the-employment-court-christchurch-rosauro-gapuzan-v-pratt-whitney-air.jpg)

![IN THE HIGH COURT OF NEW ZEALAND CHRISTCHURCH … · SERVICES LTD [2016] NZHC 1048 IN THE HIGH COURT OF NEW ZEALAND CHRISTCHURCH REGISTRY ... concrete veneer cladding, on a perimeter](https://img.pdfslide.net/doc/110x75/5fb29531fe51d041c1703cc9/in-the-high-court-of-new-zealand-christchurch-services-ltd-2016-nzhc-1048-in-the.jpg)
![IN THE EMPLOYMENT COURT CHRISTCHURCH … · DAVID RODKISS v CARTER HOLT HARVEY LIMITED NZEmpC CHRISTCHURCH [2015] NZEmpC 147 [27 August 2015] IN THE EMPLOYMENT COURT CHRISTCHURCH](https://img.pdfslide.net/doc/110x75/5bc066c209d3f210098b7f8b/in-the-employment-court-christchurch-david-rodkiss-v-carter-holt-harvey-limited.jpg)


![IN THE HIGH COURT OF NEW ZEALAND CHRISTCHURCH … · IN THE HIGH COURT OF NEW ZEALAND CHRISTCHURCH REGISTRY CIV-2013-409-000896 [2015] NZHC 1627 BETWEEN AVONDALE GOLF CLUB INC Plaintiff](https://img.pdfslide.net/doc/110x75/6028aebf5222f90ce472361c/in-the-high-court-of-new-zealand-christchurch-in-the-high-court-of-new-zealand-christchurch.jpg)

![IN THE HIGH COURT OF NEW ZEALAND CHRISTCHURCH REGISTRY · in the high court of new zealand christchurch registry i te kŌti matua o aotearoa Ōtautahi rohe civ-2016-409-001137 [2017]](https://img.pdfslide.net/doc/110x75/5f033b957e708231d4083167/in-the-high-court-of-new-zealand-christchurch-registry-in-the-high-court-of-new.jpg)
![IN THE EMPLOYMENT COURT CHRISTCHURCH CRC 26/11a01.nzmwu.org.nz.s3.amazonaws.com/a/resources/SPM... · IN THE EMPLOYMENT COURT CHRISTCHURCH [2012] NZEmpC 96 CRC 26/11 ... The MIA co-ordinates](https://img.pdfslide.net/doc/110x75/5eb6cb6da78022120b508f7b/in-the-employment-court-christchurch-crc-2611a01nzmwuorgnzs3-in-the-employment.jpg)


![IN THE EMPLOYMENT COURT CHRISTCHURCH CRC 32/11€¦ · IN THE EMPLOYMENT COURT CHRISTCHURCH [2012] NZEmpC 137 CRC 32/11 IN THE MATTER OF a challenge to a determination of the Employment](https://img.pdfslide.net/doc/110x75/5edf730dad6a402d666acbbb/in-the-employment-court-christchurch-crc-3211-in-the-employment-court-christchurch.jpg)

![IN THE HIGH COURT OF NEW ZEALAND CHRISTCHURCH ......beneficiaries is seen in the judgment of Panckhurst J in Kain v Hutton HC Christchurch M198/00, 3 December 2004, at [249]. [15]](https://img.pdfslide.net/doc/110x75/6075d70e82e0ad00f0729a9c/in-the-high-court-of-new-zealand-christchurch-beneficiaries-is-seen-in-the.jpg)

![IN THE EMPLOYMENT COURT CHRISTCHURCH CRC 48/10 · HOOPER V COCA-COLA AMATIL (NZ) LTD NZEmpC CHCH [2012] NZEmpC 11 [2 February 2012] IN THE EMPLOYMENT COURT CHRISTCHURCH [2012] NZEmpC](https://img.pdfslide.net/doc/110x75/5e62a58357459c38fe553655/in-the-employment-court-christchurch-crc-4810-hooper-v-coca-cola-amatil-nz-ltd.jpg)
![IN THE HIGH COURT OF NEW ZEALAND CHRISTCHURCH ......C & S KELLY PROPERTIES LTD v EARTHQUAKE COMMISSION & ANOR [2017] NZHC 1583 [10 July 2017] IN THE HIGH COURT OF NEW ZEALAND CHRISTCHURCH](https://img.pdfslide.net/doc/110x75/60667438f4769e06d112970b/in-the-high-court-of-new-zealand-christchurch-c-s-kelly-properties.jpg)


![IN THE HIGH COURT OF NEW ZEALAND CHRISTCHURCH …img.scoop.co.nz/media/pdfs/1302/Morley_v_Earthquake... · 2013. 7. 12. · Christchurch earthquakes. Relevant legislation [15] The](https://img.pdfslide.net/doc/110x75/5fca413b84fa33562b54a7cc/in-the-high-court-of-new-zealand-christchurch-imgscoopconzmediapdfs1302morleyvearthquake.jpg)