Embed Size (px)
Citation preview
Behavioral Finance and Investment Processes IFT Notes
IFT Notes for the Level III Exam www.ift.world Page 1
Behavioral Finance and Investment Processes
1. Introduction .............................................................................................................................................. 3
2. The Uses and Limitations of Classifying Investors into Types ................................................................... 3
2.1 General Discussion of Investor Types ................................................................................................. 3
2.2 Limitations of Classifying Investors into Various Types ...................................................................... 6
3. How Behavioral Factors Affect Adviser-Client Relationships .................................................................... 7
3.5 Limitations of Traditional Risk Tolerance Questionnaires .................................................................. 7
4. How Behavioral Factors Affect Portfolio Construction ............................................................................. 7
4.1 Inertial and Default ............................................................................................................................. 7
4.2 Naïve Diversification ........................................................................................................................... 8
4.3 Company Stock: Investing in the Familiar ........................................................................................... 8
4.4 Excessive Trading ................................................................................................................................ 9
4.5 Home Bias ........................................................................................................................................... 9
4.6 Behavioral Portfolio Theory ................................................................................................................ 9
5. Behavioral Finance and Analyst Forecasts .............................................................................................. 10
5.1 Overconfidence in Forecasting Skills ................................................................................................ 10
5.2 Influence of Company’s Management on Analysis ........................................................................... 11
5.3 Analyst Biases in Conducting Research ............................................................................................. 11
6. How Behavioral Factors Affect Committee Decision Making ................................................................. 12
6.1 Investment Committee Dynamics ..................................................................................................... 12
6.2 Techniques for Structuring and Operating Committees to Address Behavioral Factors .................. 12
7. How Behavioral Finance Influences Market Behavior ............................................................................ 12
7.1 Defining Market Anomalies .............................................................................................................. 13
7.2 Momentum ....................................................................................................................................... 13
7.3 Bubbles and Crashes ......................................................................................................................... 13
7.4 Value and Growth ............................................................................................................................. 14
Summary ..................................................................................................................................................... 15
Examples from the Curriculum ................................................................................................................... 15
Examples 1: Target Date Fund Glide Path...................................................................................... 15
Examples 2: Analyst Case Study ..................................................................................................... 20
Examples 3: Analyst Recommendation and Base Rate Case Study ............................................... 20
Examples 4: Investment Manager Case Study ............................................................................... 22

Behavioral Finance and Investment Processes IFT Notes
IFT Notes for the Level III Exam www.ift.world Page 2
This document should be read in conjunction with the corresponding reading in the 2018 Level III CFA® Program curriculum. Some of the graphs, charts, tables, examples, and figures are copyright 2017, CFA Institute. Reproduced and republished with permission from CFA Institute. All rights reserved.
Required disclaimer: CFA Institute does not endorse, promote, or warrant the accuracy or quality of the products or services offered by IFT. CFA Institute, CFA®, and Chartered Financial Analyst® are trademarks owned by CFA Institute.
Behavioral Finance and Investment Processes IFT Notes
IFT Notes for the Level III Exam www.ift.world Page 3
1. Introduction
As discussed in The Behavioral Finance Perspective, traditional finance assumes that all investors are Rational Economic Men who a hold mean-variance optimal portfolio that meets their return objective and tolerance for risk. The behavioral finance perspective is based on observations that individuals do not actually behave as they are assumed to by traditional finance. Specifically, individuals are susceptible to the types of behavioral biases covered in The Behavioral Biases of Individuals, which cause them to deviate from their mean variance optimal asset allocation. Advisers need to recognize the behavioral biases that their clients exhibit and may even need to modify portfolios in order to accommodate them. This reading continues the discussion of behavioral factors with respect to the adviser-client relationship (sections 2 and 3), and extends the analysis of behavioral finance to portfolio construction (section 4), investment analysts (section 5), investment committees (section 6) and the functioning of markets (section 7).
2. The Uses and Limitations of Classifying Investors into Types
This section addresses:
LO.a: Explain the uses and limitations of classifying investors into personality types
The uses of classifying investors into personality types are provided in section 2.1 and the limitations appear in section 2.2.
2.1 General Discussion of Investor Types
If all investors were Rational Economic Men, as traditional finance assumes, it would be possible to determine return objectives and risk tolerance based on objective demographic criteria (e.g.; age, life expectancy, level of wealth) and choose a corresponding mean-variance efficient portfolio. A risk tolerance questionnaire may also be helpful in this process. However, as seen in the previous readings, investors demonstrate behavioral biases. Additionally, as discussed in section 3.5, there are limitations to the use of traditional risk tolerance questionnaires. Therefore, advisors may be able to provide better service by developing and understanding of their clients’ psychological profile in addition to their situational profile.
Sections 2.1.1, 2.1.2 and 2.1.3 describe three models that can be used to classify investors based on their behavioral characteristics. These are meant to assist advisers seeking to develop a fuller understanding of their clients. For exam purposes, it is important to note that none of this reading’s Learning Outcomes requires detailed knowledge of the investor types. The models and their associated investor types are presented in the context of providing advisers with guidance on how to better work with clients equipped with a deeper understanding of their behavioral influences.
2.1.1 Barnewall Two-Way Model
According to Barnewall, there are two types of investors: active and passive. In general terms, active investors have generated wealth by risking their own capital (for example, entrepreneurs) and they are assumed to have a higher risk tolerance than passive investors, who have accumulated wealth by

Behavioral Finance and Investment Processes IFT Notes
IFT Notes for the Level III Exam www.ift.world Page 4
earning a salary (or perhaps from inheritance). In order to determine which category an investor fits into, an advisor can administer a risk tolerance test such as the one shown in section 2.1.3 of this reading:
Diagnostic Question Active Investor’s Answer Passive Investor’s Answer
“Have you risked your own capital in the creation of your wealth?”
Yes No
“Which is stronger: your tolerance for risk to build wealth or the desire to preserve wealth?”
Tolerance for risk Desire to preserve wealth
“Would you prefer to maintain control over your investments or prefer to delegate that responsibility to someone else?”
Maintain control Delegate responsibility
“Do you have faith in your abilities as an investor?”
Yes No
“If you had to pick one of two portfolios, which would it be?
80% stocks/20% bonds 40% stocks/60% bonds
“Is your wealth goal intended to continue your current lifestyle, or are you motivated to build wealth at the expense of your current lifestyle?”
Build wealth (at the expense of current lifestyle)
Continue current lifestyle
“In your work and personal life, do you generally prefer to take initiative by seeking out what needs to be done and then doing it, or do you prefer to take direction?”
Take initiative Take direction
“Are you capital preservation oriented or are you willing to put your capital at risk to build wealth?”
Capital at risk Capital preservation oriented
“Do you believe in the concept of borrowing money to make money/operate a business or do you prefer to limit the amount of debt that you owe?”
Borrow money Limit debt
This assessment of risk tolerance based on source of wealth will be covered again in section 3.1.1 of Managing Individual Investor Portfolios.
2.1.2 Ballard, Biehl, and Kaiser Five-Way Model
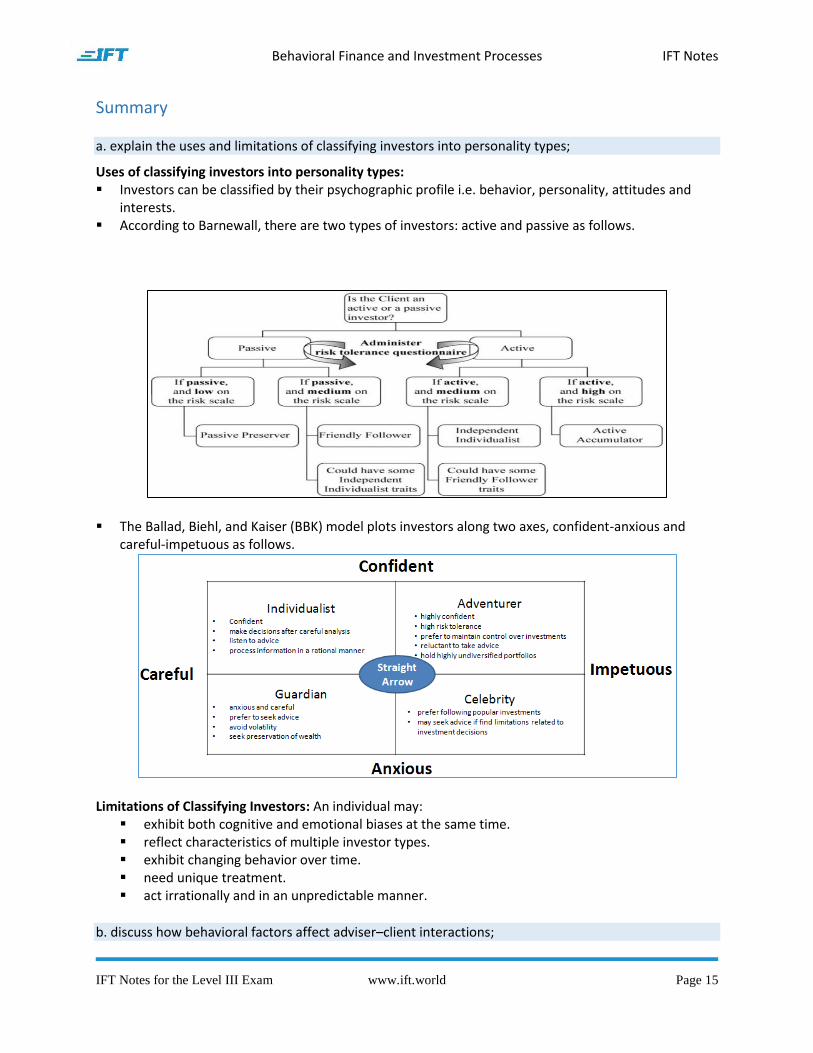
The Ballad, Biehl, and Kaiser (BBK) model plots investors along two axes, confident-anxious and careful-impetuous. The five investor types generated by the BBK model are:
Investor type Personality Axis Methodology Axis Adviser relationship notes
Adventurer Confident Impetuous Reluctant to take advice
Celebrity Anxious Impetuous May be willing to take advice
Individualist Confident Careful Will listen to advice
Guardian Anxious Careful May seek advice
Straight Arrow Mid-point Mid-point Rational

Behavioral Finance and Investment Processes IFT Notes
IFT Notes for the Level III Exam www.ift.world Page 5
2.1.3 New Developments in Psychographic Modeling: Behavioral Investor Types
The Pompian model uses a four-step process to classify investors into types:
Step 1: Interview the client and identify active and passive traits and risk tolerance. This is accomplished using a risk tolerance questionnaire.
Step 2: Plot the investor on the active/passive and risk tolerance scale. Note that, unlike the Barnewell model, which is binary (active/passive), the Pompian model has two types of passive investors and two types of active investors.
Step 3: Test for behavioral biases. The diagnostic questions mentioned in The Behavioral Biases of Individuals can be particularly helpful in this process.
Step 4: Classify investor into a behavioral type. Note that, as mentioned in section 5.1.1 of The Behavioral Biases of Individuals, investors may demonstrate both cognitive and emotional the biases. In such cases, it is necessary to determine whether an investor’s biases are primarily cognitive or primarily emotional.
The four investor types generated by this model are:
Investor type Active/Passive Risk Tolerance Biases (Primarily)
Passive Preserver Passive Low Emotional
Friendly Follower Passive Low-Moderate Cognitive
Independent Individualist Active Moderate-High Cognitive
Active Accumulator Active High Emotional

Behavioral Finance and Investment Processes IFT Notes
IFT Notes for the Level III Exam www.ift.world Page 6
As noted above, the most important use of investor classification models is to provide advisers with insights that can be used to improve client relationships. For exam purposes, it is less important to know whether an investor can be classified as a Passive Preserver or Friendly Follower (or a Guardian or an Adventurer) and more important to be able to identify whether her biases are primarily cognitive or primarily emotional. (Note that Margaret Neilson is referred to as “a guardian or passive preserver” in the solution to Practice Problem 10 at the end of this reading). Just as in The Behavioral Biases of Individuals, Section 5.1.1, the guidelines for advisers are different depending on the nature of a client’s biases.
The recommendation for advisers who are dealing with clients that demonstrate primarily emotional biases is to “focus on explaining how the investment program being create affects such issues as financial security, retirement, or future generations rather than focusing on such quantitative details as standard deviations and Sharpe ratios.” For example, in Practice Problem 1 at the end of this reading, Neal Patel’s biases (endowment, loss aversion and status quo) are all emotional and his adviser (Ian Wang) will therefore want to avoid using technical terms. By contrast, education is the recommended course of action when dealing with investors who are primarily affected by cognitive biases.
2.2 Limitations of Classifying Investors into Various Types
The curriculum lists five limitations of classifying investors into types based on behavioral models:
1. It is possible, even likely, that individuals will exhibit both cognitive and emotional biases. This presents a problem for models that classify investors based on the nature of their biases.
2. Individuals may not fit neatly into categories and may exhibit characteristics of more than one type of investor.
3. Behaviors change over time. Notably, there is a tendency for individuals to become less risk tolerant and exhibit more emotional biases as they age.
4. Each individual is unique and not all investors that have been placed in the same category will act identically.

Behavioral Finance and Investment Processes IFT Notes
IFT Notes for the Level III Exam www.ift.world Page 7
5. Individuals can act irrationally and unpredictably. If it isn’t possible to predict market returns, why should we expect to be able to predict human behavior?
3. How Behavioral Factors Affect Adviser-Client Relationships
This section addresses:
LO.b: Discuss how behavioral factors affect adviser-client interactions
The table below shows four objectives of a successful adviser-client relationship and how behavioral finance can help achieve each of them. This covers the key material in sections 3.1 through 3.4.
Advisory Relationship Objective How behavioral finance helps achieve this objective
Adviser understands client’s financial goals The adviser develops a better understanding of the client’s motivations in setting financial goals
Adviser maintains a consistent approach Clients who feel better understood are more likely to stick to a recommended investment plan
Adviser invests as client expects An adviser who has a deeper understanding of a client’s behavioral biases is more likely to recommend an investment plan that meets the client’s expectations
The relationship is mutually-beneficial Recognizing and appreciating behavioral biases will create a stronger advisory relationship
3.5 Limitations of Traditional Risk Tolerance Questionnaires
From a behavioral finance perspective, the limitation of traditional risk tolerance questionnaires is that they are less useful for developing an understanding of clients affected by emotional biases than they are for clients whose biases are primarily cognitive. As such, traditional risk tolerance questionnaires may be more appropriate institutional investors rather than individuals.
4. How Behavioral Factors Affect Portfolio Construction
This section addresses:
LO.c: Discuss how behavioral factors influence portfolio construction
Rather than active like Rational Economic Men, many investors demonstrate behavioral biases that cause them to hold portfolios that deviate from the mean-variance optimal asset allocation.
4.1 Inertial and Default
As will be discussed in Lifetime Financial Advice, employees (at least in North America) are increasingly less likely to be able to rely on government assistance and defined-benefit (DB) pensions in order to meet their own financial needs in retirement. Many employers provide defined-contribution (DC) pension plans, which offer a range of funds in which employees can invest. If the employee fails to give instructions, the employer’s contributions are invested in the default option, which is often a low-risk
Behavioral Finance and Investment Processes IFT Notes
IFT Notes for the Level III Exam www.ift.world Page 8
money market fund. Academic studies have shown that employees have a tendency to keep to the default option, despite the fact that a 100% allocation to a money market fund is inappropriate for almost all working-age investors. Additionally, investors often fail to adjust their asset allocation to reflect changes in their personal circumstances (notably, investors should hold fewer risk assets as they age). These tendencies are a manifestation of status quo bias, which was covered in section 4.4 of The Behavioral Biases of Individuals.
Refer to Example 1 from the curriculum.
4.2 Naïve Diversification
Employers who provide DC pension plans are required to offer a range of funds in which employees can invest. If an employer offers, for example, 4 funds and an employee allocates 25% of his contributions to each, that employee is demonstrating naïve diversification (also known as “1/n diversification”). Another example of this behavior would be a fixed-income fund manager who allocates equal amounts of money to the sovereign debt of each European Union member, regardless of the different risk profiles of these securities.
4.3 Company Stock: Investing in the Familiar
As will be discussed in Concentrated Single-Asset Positions, a highly-concentrated position in a single stock exposes an investor to considerable non-systematic risk. Further, as will be discussed in Lifetime Financial Advice, employees who hold their employer’s stock are exposing themselves to the risk of losing their job at the same time that the value of their employer’s stock collapses. Therefore, a concentrated position in one’s own-company stock is inconsistent with a mean-variance optimal portfolio.
It is important to note that employees who receive financial incentive to invest in their employer’s stock have rational reasons to do so. However, there is considerable evidence to suggest that investors will hold own-company stock even in the absence of such incentives. Behavioral finance offers the following explanations for this irrational behavior:
Familiarity and overconfidence: Employees overestimate the return potential of their employer’s stock and underestimate its risk. This is consistent with overconfidence bias, which was covered in section 4.2 of The Behavioral Biases of Individuals.
Naïve extrapolation of past returns: Employees of companies that have performed well over the previous 10 years allocate 40% of their investment contributions to their own-company stock (compared to 10% of contributions for employees of poorly-performing companies). This is a manifestation of representativeness bias, which was covered in section 3.1.3 of The Behavioral Biases of Individuals.
Status quo effect of matching contributions: When employers purchase own-company stock for their employees as a default contribution to a DC pension plan, employees may make own-company stock the default allocation for their own contributions.
Framing effect of matching contributions: An employee who sees his employer purchase own-company stock, he may take this as implicit advice to do the same with his contributions. This is a manifestation of framing bias, which was covered in section 3.2.3 of The Behavioral Biases of Individuals.
Behavioral Finance and Investment Processes IFT Notes
IFT Notes for the Level III Exam www.ift.world Page 9
Loyalty effects: Employees may be motivated by a sense of loyalty to their employer to hold own-company stock in order to protect against a potential takeover.
4.4 Excessive Trading
It is very difficult for any investor to out-perform the market on a consistent basis. Indeed, there is considerable evidence showing that the vast majority of investors – even professional fund managers –fail to do so. Even before accounting for transaction costs, it appears that those who trade excessively, such as online investors, make poor investment decisions. This may be due to a false believe that they have special insight, which is consistent with the illusion of knowledge aspect of overconfidence bias that was covered in section 4.2 of The Behavioral Biases of Individuals. Specifically, excessive traders tend to sell “winning” investments that have appreciated and hold on to “losing” investments that are trading below their purchase price. This behavior is consistent with the disposition effect, which is associated with loss aversion bias (see section 4.1 of The Behavioral Biases of Individuals).
4.5 Home Bias
A rational portfolio is not only diversification across asset classes, but also takes advantage of opportunities to diversify internationally. Investors who fail to do so exhibit home bias. Behavioral finance has associated home bias with several of the biases covered in The Behavioral Biases of Individuals (availability, confirmation, illusion of control, endowment, and status quo). However, for exam purposes home bias is likely to appear as a stand-alone issue. For example, in Practice Problem 3 at the end of this reading, Sarah Johnson (who is American) demonstrates home bias when she reveals her aversion to investing in non-US equities. By contrast, Christine Blake from Practice Problem 14 is said to not exhibit home bias because her portfolio is diversified across four countries.
4.6 Behavioral Portfolio Theory
This section covers:
LO.d: Explain how behavioral finance can be applied to the process of portfolio construction
As mentioned in section 4.3.3 of The Behavioral Finance Perspective, behavioral portfolio theory is offered as observation of how investors actually build portfolios – as opposed to how they are assumed to do so according to the traditional finance perspective. Specifically, portfolios are constructed in layers, each of which is associated with one of the investor’s goals. The asset allocation is different for each layer and reflects the importance of the corresponding goal. For example, the funds allocated to cover essential goals such as maintaining one’s standard of living are allocated to lower risk investments. More aspirational goals are funded with risker assets.
An understanding of behavioral portfolio theory (and behavioral bias) can help an adviser improve a relationships with clients. For example, layered portfolios are a manifestation of mental accounting bias, which was covered in section 3.2.2 of The Behavioral Biases of Individuals. Because mental accounting is a cognitive bias, it may be possible to convince clients who have built such portfolios to accept a more “rational” allocation by educating them about the benefits of proper diversification that accounts for

Behavioral Finance and Investment Processes IFT Notes
IFT Notes for the Level III Exam www.ift.world Page 10
correlations between assets.
5. Behavioral Finance and Analyst Forecasts
This section covers:
LO.e: Discuss how behavioral factors affect analyst forecasts and recommend remedial actions for analyst biases
All financial market participants are susceptible to behavioral biases and investment analysts are no exception.
5.1 Overconfidence in Forecasting Skills
Academic studies have shown that analysts often demonstrate overconfidence bias for overestimating their forecasting abilities. Because of their extensive training and access to information, analysts may believe that they are better informed than they actually are, which is known as illusion of knowledge bias. Overconfidence may also stem from self-attribution bias, which is the tendency to take credit for one’s successes and blame others (or chance) for one’s failures. As noted in section 4.2 of The Behavioral Biases of Individuals, both illusion of knowledge bias and self-attribution bias can be seen as sub-sets of overconfidence bias.
Analysts can demonstrate overconfidence bias by claiming to know an industry better than others or by using definitive terms, such as “will” or “will not”, when making forecasts when it would be more appropriate to refer to probabilities. Offering a narrow range of outcomes and overly-precise estimates reveal overconfidence in the form of underestimating risk. This is a particular concern for analysts who use complex models. However, overconfidence in the accuracy and precision of estimates derived from a complex model is also associated with illusion of control bias.
Hindsight bias, the belief that events were (and are) predictable, is related to overconfidence bias because analysts have a tendency to remember their accurate forecasts and forget or ignore their inaccurate forecasts. However, while this section describes hindsight bias as involving “both cognitive and emotional bias”, it should always be considered as a cognitive bias for the purpose of determining whether an investor’s biases are primarily cognitive or emotional.
Refer to Example 2 from the curriculum.
5.1.1 Remedial Actions for Overconfidence and Related Biases
Recommendations to help analysts overcome common biases include:
Follow a systematic and structured approach to collect data
Use consistent data
Focus on metrics and comparable data (rather than what is descriptive and unverifiable)
Seek out contradictory facts and opinions
Recognize underlying base rates when assigning probabilities
Behavioral Finance and Investment Processes IFT Notes
IFT Notes for the Level III Exam www.ift.world Page 11
Incorporate evidence sequentially
Evaluate previous forecasts when making new ones
Make clear, unambiguous forecasts
Document the reasons for making a judgment or forecast
Ensure prompt, well-structured feedback from colleagues, superiors and systems
Establish an incentive structure that rewards accuracy
Refer to Example 3 from the curriculum.
5.2 Influence of Company’s Management on Analysis
Analysts who interact with the management of companies that they cover are susceptible to three biases: framing, anchoring and adjustment, and availability.
Framing bias: Analysts should remain objective and not allow their thinking to be framed by others. Specifically, company management tends to be overly optimistic, in part because they are often affected by their own biases such as overconfidence and illusion of control.
Anchoring and adjustment bias: Analysts will also want to avoid becoming anchored to figures provided by managers.
Availability bias: Analysts may give too much weight to easily-recallable information provided by company management.
5.2.1 Remedial Actions for Influence of Company’s Management on Analysis
See the recommendations in section 5.1.1.
5.3 Analyst Biases in Conducting Research
The biases that analysts demonstrate when conducting research are similar to those that appear when making forecasts (see section 5.1), notably overconfidence and illusion of control. A particular concern during the research process is confirmation bias, which is the tendency to downplay or ignore information that contradicts one’s existing beliefs.
In conducting research, analysts collect a significant amount of information. This can lead to representativeness bias, which is the tendency to place too much emphasis on new information (or small sample sizes) and neglect base rates. Specifically, analysts may determine that a company fits their classification as a growth stock and naively extrapolate earnings data.
Representativeness bias may also manifest itself in the form of the gamblers’ fallacy, which is an unjustified belief that a pattern will revert to its long-term mean within a specific period. In reality, prices, interest rates and other measures of market activity can deviate from their long-term averages for extended periods. The opposite of the gamblers’ fallacy is the hot hand fallacy, which assumes that short-term trends will continue.
Behavioral Finance and Investment Processes IFT Notes
IFT Notes for the Level III Exam www.ift.world Page 12
5.3.1 Remedial Actions for Analyst Biases in Conducting Research
See the recommendations in section 5.1.1.
Refer to Example 4 from the curriculum.
6. How Behavioral Factors Affect Committee Decision Making
This section addresses:
LO.f: Discuss how behavioral factors affect investment committee decision making and recommend techniques for mitigating their effects
Individuals, even financial professionals, can be affected by behavioral biases and grouping individuals into a committee will not eliminate the risk of sub-optimal decisions. Indeed, decisions made by committees may be more influenced by biases than decisions made by individuals. Specifically, individuals are susceptible to social proof bias, in which committee members refrain from voicing their own opinions and adopt the group consensus. It is possible to demonstrate social proof bias even when one is not a member of a committee.
6.1 Investment Committee Dynamics
Individual members of a committee may withhold contrarian or dissenting opinions in order to avoid being perceived as an obstacle to reaching a consensus. This self-censorship eliminates the primary benefit of a committee, which is the collective wisdom obtained from a group of diverse individuals. Additionally, committees often fail to encourage feedback and learn from past mistakes.
6.2 Techniques for Structuring and Operating Committees to Address Behavioral Factors
The recommendations listed in section 5.1.1 are meant to help analysts make unbiased decisions, but are equally applicable to committees. What differentiates committee decision-making is the role of the chair. A chair can make a committee less susceptible to social proof bias by seeking out members with a diverse range of knowledge and experience, encouraging the airing of dissenting opinions, and ensuring that all committee members are treated with respect.
7. How Behavioral Finance Influences Market Behavior
This section covers:
LO.g: Describe how behavioral biases of investors can lead to market characteristics that may not be explained by traditional finance
At the micro level, traditional finance assumes that individuals are Rational Economic Men. Behavioral finance challenges this by noting observed behavioral biases. At the macro level, traditional finance assumes that markets are perfectly efficient in that they instantly and fully incorporate all information into asset prices. Behavioral finance challenges these assumptions by observing what individuals actually

Behavioral Finance and Investment Processes IFT Notes
IFT Notes for the Level III Exam www.ift.world Page 13
do in the real world.
7.1 Defining Market Anomalies
Market anomalies are persistent deviations from the efficient market hypothesis (EMH). However, identifying the existence of anomalies is challenging for several reasons:
Valuation model: As noted in section 4.1.3 of The Behavioral Finance Perspective, in order to demonstrate that an asset’s market prices fails to reflect its intrinsic value, it is necessary to show what the price should be. The apparent value vs. growth anomaly discussed in section 4.1.3.1 of The Behavioral Finance Perspective may not persist after risk measures have been added to the valuation model.
Spurious relationships: An apparent market anomaly may simply be the result of data mining, or analyzing data until the point that a correlation is discovered – even when this correlation has no rational relationship with market prices.
Arbitrage: Assuming that a legitimate market anomaly is discovered, its publication should cause the mispricing will disappear as self-interested investors to act on this information. Interestingly, the “January effect” mentioned in section 4.1.3.3 of The Behavioral Finance Perspective persists despite having been well known for decades.
Rational explanations: Some apparent market anomalies may not be due to irrational factors such as behavioral biases, but rather they can be explained by rational factors such as taxes or transaction costs.
Despite the challenges, behavioral finance has identified several market anomalies and offered explanations based in the behavioral biases of individual investors. Three such anomalies are momentum, bubbles and crashes, and value stocks vs. growth stocks.
7.2 Momentum
Momentum (or trending) occurs when price movements are correlated with recent past prices. Recall that, according to the weak-form EMH, current market prices reflect all past price and trading volume data, which means that this information should have no predictive power.
Trending prices are the macro-level effect of individual investors conforming to a market consensus. This behavior, known as herding, is associated with regret aversion bias (see section 4.6 of The Behavioral Biases of Individuals). Seeing a trend, investors want to avoid the regret caused by missing out on an opportunity to join the crowd.
7.3 Bubbles and Crashes
Bubbles and crashes are defined, respectively, as “negative returns because of prices varying considerably from or reverting to their intrinsic value.” A more objective measure is asset prices beyond two standard deviations of their long-term average. During such times, “asset prices become decoupled from economic fundamentals.” Note that this concept is a direct challenge to the traditional finance view that market prices always reflect an asset’s intrinsic value. Recall from section 4.1 of The Behavioral
Behavioral Finance and Investment Processes IFT Notes
IFT Notes for the Level III Exam www.ift.world Page 14
Finance Perspective that one the core principles of traditional finance is that “the price is right”.
The most obvious behavioral bias associated with bubbles and crashes are emotional. Specifically,
Overconfidence is, almost by definition, abundant during bubbles (but not necessarily crashes). As noted in section 4.2 of The Behavioral Biases of Individuals, this bias causes investors to overestimate expected returns, underestimate risk, trade excessively, and hold undiversified portfolios. Self-attribution bias and illusion of knowledge, both of which are subsets of overconfidence bias, are also present.
As with the momentum effect, regret aversion and its associated herding behavior are also present during bubbles.
Loss aversion bias is present to the extent that investors sell “winning” stocks to lock-in profits during bubbles and refuse to sell “losing” stocks during crashes.
While the biases listed above (overconfidence, regret aversion, and loss aversion) are all emotional, investors also demonstrate cognitive biases during bubbles and crashes.
Confirmation bias, the tendency for investors to downplay or ignore information that contradicts their existing beliefs, is particularly noticeable during rapid expansions.
After a bubble popped and a crash has begun, investors may display anchoring and adjustment bias by irrationally holding on to positions because they are anchored to a peak or target price.
Hindsight bias is present among investors who are convinced that bubbles and crashes are predictable.
7.4 Value and Growth
As mentioned in section 4.1.3.1 of The Behavioral Finance Perspective, academic studies have identified an apparent anomaly in the form of excess returns from investing in value stocks rather than growth stocks. As noted above, these studies may not be adequately accounting for the risk associated with value stocks.
Assuming that the value vs. growth discrepancy is a legitimate anomaly, behavioral finance offers the halo effect as an explanation. In the context of finance, investors demonstrate the halo effect by noticing an investment’s good qualities and forming a positive opinion of all of its qualities. In Practice Problem 7 at the end of this reading, Ian Wang’s clients all agree that “they would perceive a company with a good growth record and good previous share price performance as a good investment.” (Note that this behavior can also be considered herding). The halo effect is similar to both representativeness bias because it involves the naïve extrapolation of past returns, and overconfidence bias because those affected by it tend to overestimate an investment’s expected returns and underestimate its risks.
Home bias, which was discussed in section 4.5 of this reading, is mentioned in this section in the context of emotional attachments to stocks, but it is not necessarily related to the specific issue of value vs. growth stocks.
Behavioral Finance and Investment Processes IFT Notes
IFT Notes for the Level III Exam www.ift.world Page 15
Summary
a. explain the uses and limitations of classifying investors into personality types;
Uses of classifying investors into personality types: Investors can be classified by their psychographic profile i.e. behavior, personality, attitudes and
interests. According to Barnewall, there are two types of investors: active and passive as follows.
The Ballad, Biehl, and Kaiser (BBK) model plots investors along two axes, confident-anxious and careful-impetuous as follows.
Limitations of Classifying Investors: An individual may: exhibit both cognitive and emotional biases at the same time. reflect characteristics of multiple investor types. exhibit changing behavior over time. need unique treatment. act irrationally and in an unpredictable manner.
b. discuss how behavioral factors affect adviser–client interactions;
Behavioral Finance and Investment Processes IFT Notes
IFT Notes for the Level III Exam www.ift.world Page 16
Understanding client’s behavioral tendencies allows advisors to: • better formulate financial goals. • better understand the client before delivering any investment advice. • formulate an appropriate asset allocation for the client. • develop a stronger bond by satisfying clients.
c. discuss how behavioral factors influence portfolio construction;
Behavioral Factors/Biases Impact on Portfolio Construction
Status quo bias Sticking with default portfolio allocation despite changes in risk tolerance level or other circumstances.
Regret aversion and framing biases Naïve diversification or 1/n strategy: allocating an equal amount of money to available investment options regardless of the different risk profiles of these options.
Overconfidence, representativeness & availability, status-quo, framing, endowment biases
Investing in the familiar: a classic example is being overweight in own-company stock.
Regret aversion, overconfidence, and disposition effect (loss aversion) biases
Excessive trading which results in high transaction costs and poor portfolio performance.
Availability, illusion of control, endowment, familiarity, and status quo biases
Investors invest a relatively high portion of their funds in domestic stocks. Home bias.
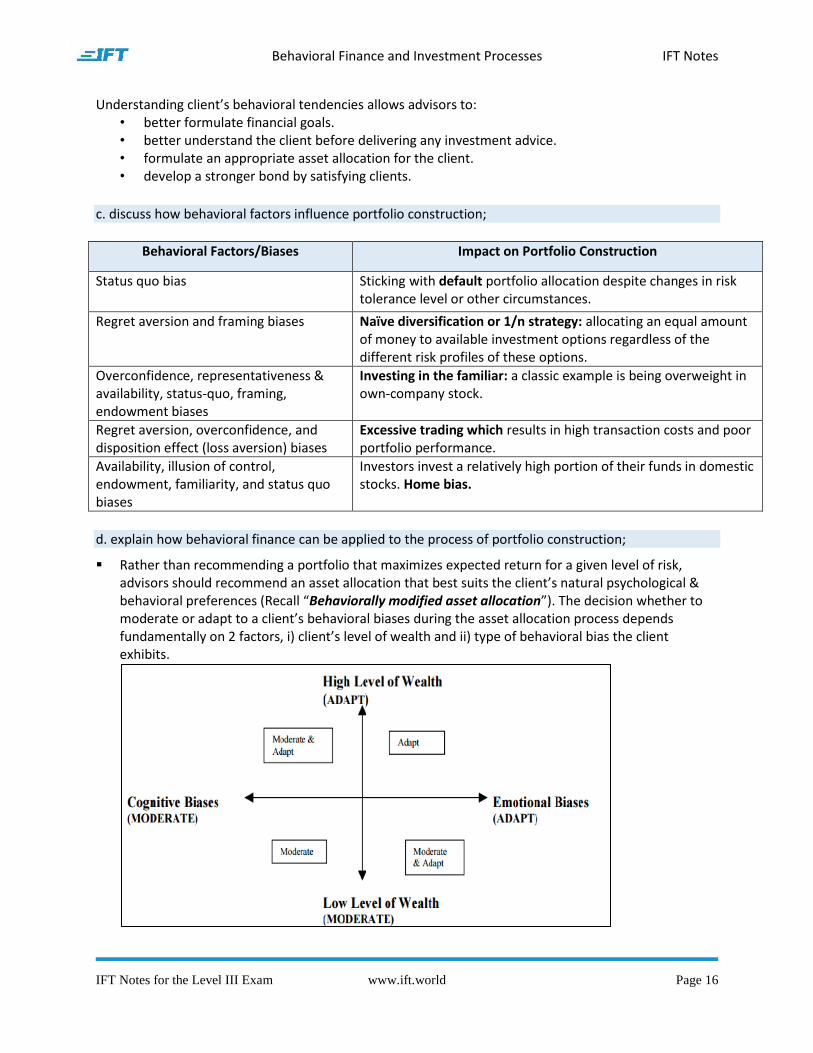
d. explain how behavioral finance can be applied to the process of portfolio construction;
Rather than recommending a portfolio that maximizes expected return for a given level of risk, advisors should recommend an asset allocation that best suits the client’s natural psychological & behavioral preferences (Recall “Behaviorally modified asset allocation”). The decision whether to moderate or adapt to a client’s behavioral biases during the asset allocation process depends fundamentally on 2 factors, i) client’s level of wealth and ii) type of behavioral bias the client exhibits.

Behavioral Finance and Investment Processes IFT Notes
IFT Notes for the Level III Exam www.ift.world Page 17
e. discuss how behavioral factors affect analyst forecasts and recommend remedial actions for analyst biases;
Behavioral Factors Biases Remedial Actions
Overconfidence in forecasting skills
Overconfidence (encouraged by complex models), representativeness, availability, hindsight
Prompt and accurate feedback, structure that rewards accuracy, learn to use Bayes’ formula
Influence of company’s management on analysis
Framing, anchoring and adjustment (analysis influenced by initial default position or anchor), availability (greater importance to more easily available information)
Disciplined and systematic approach
Analyst biases in conducting research
Excessive unstructured information illusion of knowledge overconfidence Excessive information feeds representativeness bias (classify new information based on past experiences) Confirmation bias
Focus on objective data, systematic and structured approach, follow Standard V, seek contrary facts and opinions
f. discuss how behavioral factors affect investment committee decision making and recommend techniques for mitigating their effects;
Social proof bias: Individuals biased to follow beliefs of a group.
Implications: Group members become overconfident among themselves leading to excessive risk exposure. Group decisions are more vulnerable to confirmation bias. Group member avoids divergent opinions to avoid unpleasant tensions within a group.
Remedial Actions Individual views should be collected before the meeting. Committee composition should have diversity in culture, knowledge, skills, experience and thought
processes. Chair of the committee should be impartial. Committee members should respect opinions of each other. At least one member of a group should play a role of “devil’s advocate”.
g. describe how behavioral biases of investors can lead to market characteristics that may not be explained by traditional finance;
Observed Market Behavior Behavioral Explanation
Momentum or trending effect
Herding behaviour Availability bias: more recent events easily recalled and given relatively high weight (recency effect) Hindsight bias regret trend-chasing effect
Bubbles Overconfidence bias (illusion of knowledge and self attribution) leads to underestimation of risk and over-trading
Crashes Disposition effect in the context of loss aversion bias: tendency to sell winners quickly and hold on to losers too long
Behavioral Finance and Investment Processes IFT Notes
IFT Notes for the Level III Exam www.ift.world Page 18
Value stocks outperform growth stocks in the long-run
Halo effect: tendency of people to generalize positive views/beliefs about one characteristic of a product/person to another characteristic; related to representativeness bias refers to classifying new information based on past experiences
Examples from the Curriculum
Example 1. Target Date Fund Glide Path
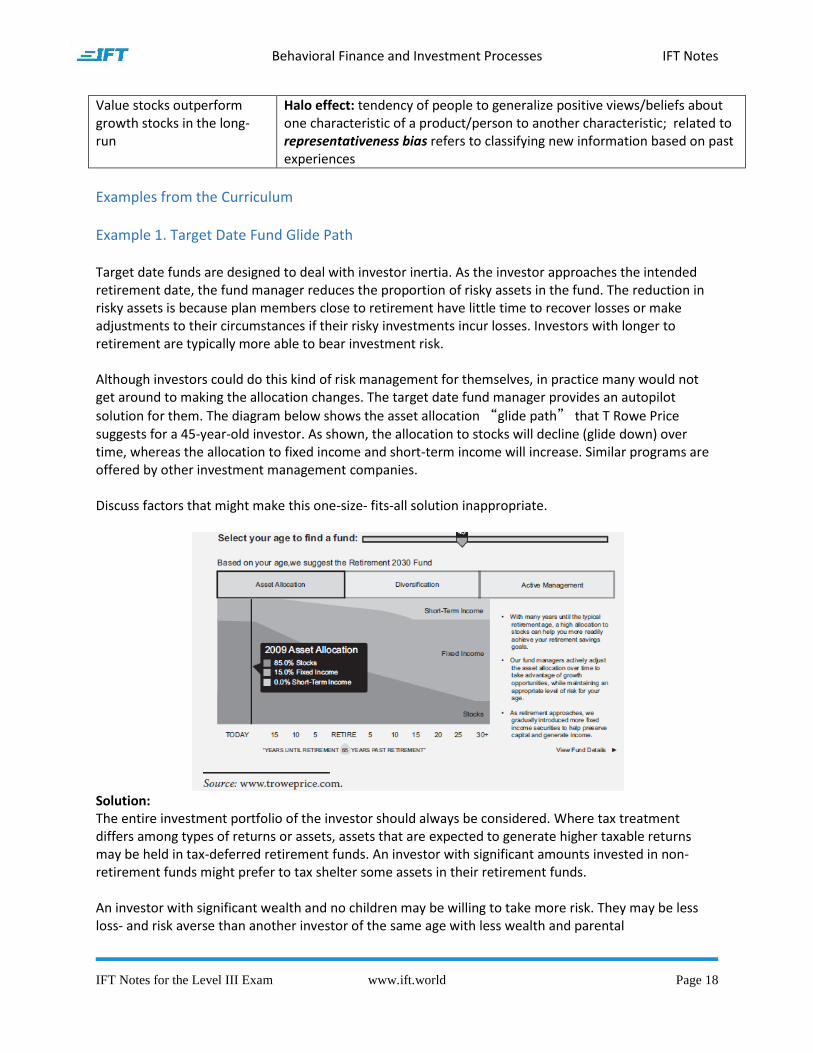
Target date funds are designed to deal with investor inertia. As the investor approaches the intended retirement date, the fund manager reduces the proportion of risky assets in the fund. The reduction in risky assets is because plan members close to retirement have little time to recover losses or make adjustments to their circumstances if their risky investments incur losses. Investors with longer to retirement are typically more able to bear investment risk. Although investors could do this kind of risk management for themselves, in practice many would not get around to making the allocation changes. The target date fund manager provides an autopilot
solution for them. The diagram below shows the asset allocation “glide path” that T Rowe Price suggests for a 45-year-old investor. As shown, the allocation to stocks will decline (glide down) over time, whereas the allocation to fixed income and short-term income will increase. Similar programs are offered by other investment management companies. Discuss factors that might make this one-size- fits-all solution inappropriate.
Solution: The entire investment portfolio of the investor should always be considered. Where tax treatment differs among types of returns or assets, assets that are expected to generate higher taxable returns may be held in tax-deferred retirement funds. An investor with significant amounts invested in non-retirement funds might prefer to tax shelter some assets in their retirement funds. An investor with significant wealth and no children may be willing to take more risk. They may be less loss- and risk averse than another investor of the same age with less wealth and parental
Behavioral Finance and Investment Processes IFT Notes
IFT Notes for the Level III Exam www.ift.world Page 19
responsibilities. An investor with a preference for active portfolio management might prefer to have different allocations to asset classes based on his or her expectations and market conditions. For example, if interest levels are historically low, the investor might prefer to invest in stocks anticipating that interest rates will rise and the fixed-income portion will decline in value. These are some of the factors that might be discussed.
Back to Notes.
Example 2. Analyst Case Study
Based on a company’s sales and earnings per share growth over the past 10 years, an analyst has concluded that its high rate of growth will continue in the future. Before the report is completed, the analyst reads in a newspaper that the company’s chief executive has made an apparently very profitable personal investment in another unrelated business. The analyst believes that this profitable outcome is evidence of the chief executive’s entrepreneurism and dynamism, and that it is additional confirmation of the analyst’s assessment of the company in the report.
Supported by the additional information, the analyst now feels more confident with the forecasted growth rates and in fact increases the average forecasted earnings growth rate and decreases the dispersion of the forecasted growth rates. He includes the additional information about the chief executive in the report.
Discuss flaws in the analyst’s approach and possible biases of the analyst.
Solution:
The value of the additional information is difficult to quantify, and it may not have been collected systematically. The analyst may not have looked as rigorously for evidence of how representative the successful investment was among the chief executive’s total portfolio of personal investments; other investments might have shown poor returns but received less publicity. Newspaper coverage can be selective. Thus, the new information might reflect availability bias. The chief executive may even have been motivated to diversify his investments by concern about the outlook for the company’s stock. The analyst’s judgment might have been adversely affected by overconfidence, with faulty reasoning contributing to the issue. Further, the analyst might have seen the additional information as being representative of a mental picture of the characteristics of a growth business.
Back to Notes.
Example 3. Analyst Recommendation and Base Rate Case Study
The chief investment officer (CIO) of an investment institution is presented with research by an analyst on his team. The analyst is recommending a switch from the stock of one major integrated oil company, XYZ plc, into another major integrated oil company, ABC plc. Over the previous three years, the stock

Behavioral Finance and Investment Processes IFT Notes
IFT Notes for the Level III Exam www.ift.world Page 20
prices of the two companies had a correlation of 88 percent. On the basis of this high correlation and also the fact that over the period the performance of the two stocks had diverged little, the CIO concludes that the probability of switching costs exceeding the difference in prospective returns over the next 12 months is 80 percent (base rate or prior probability). The CIO estimates the cost of the
switch at 4 percent because tax costs are involved. The analyst’s judgment is correct 60 percent of the
time, in line with the average for the team. How should the CIO evaluate the analyst’s recommendation?
Solution:
The information in Exhibit 7 is summarized in Exhibit 8.
P(A) = Probability switching is worthwhile = 1 – 0.8 = 0.2 (given), or 200/1000 = 0.2 P(B) = Probability analyst recommends a switch = 440/1000 = 0.44 P(B|A) = Probability analyst recommends a switch given switching is worthwhile = 0.6 (given), or 120/200 = 0.6 If a population of 1000 outcomes is used, on average in 800 ( = 0.8 × 1000) outcomes there will be less than 4 percent annualized difference between the stocks. On the other 200 (= 0.2 × 1000) outcomes, it

Behavioral Finance and Investment Processes IFT Notes
IFT Notes for the Level III Exam www.ift.world Page 21
would be worth switching. The analysts 60 percent rate of being correct means on average that he can be expected to identify correctly 120 (= 0.6 × 200) of the useful switching opportunities. But his 40 percent failure rate means that he will not predict the remaining 80 (= 0.4 × 200) outcomes when switching would prove right (false negatives). Of the 800 outcomes in which switching would not be worthwhile, the analyst will correctly recognize 480 of the outcomes (= 0.6 × 800). But he will wrongly predict a switch on the remaining 320 outcomes in which there is no meaningful difference between the stocks (false positives). Exhibit 8 indicates that the analyst will make 440 calls to switch (= 120 + 320), of which just 120 can be
expected to be correct. The analyst’s expected success ratio in calling a profitable switch between two
closely correlated stocks is 27 percent (= 120/440) or calculated using Bayes’ formula: P(A|B) = [P(B|A)/P(B)]P(A) = [(0.6)/(0.44) × 0.2] = 1.36 × 0.2 = 0.27 The CIO would need more information about time frames and predicted magnitude of performance difference between the stocks before making a decision. However, in these circumstances, the base
rate—the similar prior performance of the two stocks—is hard to beat. (Switching costs and the possibility that some outcomes represent an unexpected outperformance of XYZ may even add to the risks.) Where a base rate or prior is very strong, a decision counter to the base rate can only be made with a strong proven ability to discriminate.
Back to Notes.
Example 4. Investment Manager Case Study
It is August. An investment manager has just signed a charitable organization (charity) as a new client. The charity currently holds primarily cash and liquid assets. The directors of the charity would like to move some money not required to fund short- or medium-term activities of the charity into stocks. They expect stocks to earn higher returns than the returns of the assets currently held. They have asked the investment manager to advise them on the timing of entry into the stock market.
The manager advises them that she expects stock to rise over the next 12 months but advises deferring investment in stocks for a month or two. She thinks stocks will decline in the near future because each month for the last six months stocks have risen more than the average monthly increase for the last 25 years. She anticipates a correction that will reduce the increase to the long-term average.
She suggests waiting to enter the market until after the anticipated correction. She states that the probability of a market fall in any September is 0.55 and that the probability of a market increase over a 12-month period is 0.7. She uses these probabilities to support her advice to defer investment for a month or two.
Assume that the probabilities are correct and that the events are independent. What behavioral biases might be evident with this advice? How might the investment manager

Behavioral Finance and Investment Processes IFT Notes
IFT Notes for the Level III Exam www.ift.world Page 22
address these?
Solution:
The expectation of a market reversal—a fall coming after a rising trend—could reflect the gamblers’ fallacy. The investment manager is expecting the stocks that have diverged from the long-term average to reverse within a specific period of time. She has not done a thorough analysis but has instead told a compelling story. She may be susceptible to a representativeness bias, in which analysts judge the probability of a forecast being correct by considering how much the outcome resembles overall available data. Frequently, this simplification combines probabilities incorrectly. Additional information or detail may appear to conform to the overall scenario being forecast, even if it is largely irrelevant, and so add to confidence in the forecast. Further, the manager may be anchoring incorrectly on the long-run average. If she believes in a further gain in the stock market, then phased investment over a period of weeks or months may reduce the impact of volatility on timing investment on any single day or month. Combining this event—a stock market fall in September—with an expectation of a rise in subsequent months to support the manager’s belief inappropriately combines probabilities and reflects the conjunction fallacy. The probability of two independent events occurring in conjunction is never greater than the probability of either event occurring alone. The probability of a market fall in September is 0.55, the probability of a market rise over the subsequent 12 months is 0.7, and the two events are independent. Therefore, the probability of the two events occurring in the outlined scenario is just 0.385 (= 0.55 × 0.7).
This probability is lower than the probability of either individual event. However, the investment manager and the client may suffer from a confirmation bias that makes the additional detail appear supportive of her belief. The information is not being analyzed in a rigorous way. Essentially, the proposal to the client is a sequence of apparently connected events (a story). The added detail in actuality suggests that the assumed scenario is less likely than she asserts, but offers misleading vividness and detail that is being misinterpreted.
Back to Notes.