Embed Size (px)
Citation preview
Behaviour of Electrical Resistivity with Soil Strength Parameters by
Varying the Particle Size Proportion for Mixed Sand and Silt Samples
by
Nur Atikah Binti Haron
16379
Dissertation submitted in partial fulfillment of
the requirements for the
Bachelor of Engineering (Hons)
(Civil Engineering)
January 2016
Universiti Teknologi PETRONAS
32610 Seri Iskandar
Perak Darul Ridzuan
brought to you by COREView metadata, citation and similar papers at core.ac.uk
provided by UTPedia
ii
CERTIFICATION OF APPROVAL
Behaviour of Electrical Resistivity with Soil Strength Parameters by Varying
the Particle Size Proportion for Mixed Sand and Silt Samples
by
Nur Atikah Binti Haron
16379
A project dissertation submitted to the
Civil Engineering Programme
Universiti Teknologi PETRONAS
in partial fulfillment of the requirement for the
BACHELOR OF ENGINEERING (Hons)
(CIVIL ENGINEERING)
Approved by,
Dr. Syed Baharom Azahar bin Syed Osman
UNIVERSITI TEKNOLOGI PETRONAS
TRONOH, PERAK
January 2016

iii
CERTIFICATION OF ORIGINALITY
This is to certify that I am responsible for the work submitted in this project, that the
original work is my own except as specified in the references and acknowledgements,
and that the original work contained herein have not been undertaken or done by
unspecified sources or persons.
NUR ATIKAH BINTI HARON
iv
ABSTRACT
Geotechnical properties should be precisely identified as it is essential for a successful
construction of a structure. Bore hole sampling is known as a conventional method of
soil investigation and contributes to reliable determination of soil strength parameters
but this method is costly, time consuming and causes soil disturbance. Geophysical
methods such as electrical resistivity, is proven to be more efficient because of the
non-invasive, non-destructive, rapid and cost-effective aspect. This paper presents the
effects of porosity and saturation on electrical resistivity for different particle size
proportion. In addition, the behaviour of electrical resistivity with soil strength
parameters by varying the particle size proportion for mixed sand and silt samples is
also presented. The research involves laboratory test on the mixture of sand and silt
with different particle size proportion of; (1) 100% sand, (2) 80% sand, 20% silt, (3)
60% sand, 40% silt, (4) 40% sand, 60% silt, (5) 20% sand, 80% silt, and (6) 100% silt
under different moisture content ranging from 15% to 35%. The correlation of
electrical resistivity with porosity, saturation and soil strength parameters by varying
the particle size proportion of sand and silt is performed by using the parameters
obtained from laboratory work that includes electrical resistivity test and direct shear
test based on 20 samples. The relationship obtained between electrical resistivity and
porosity for all points is electrical resistivity decreases with increasing porosity with
regression coefficient R2=0.3292. Electrical resistivity decreases with the increasing
of saturation for all points with regression coefficient R2=0.822. On the other hand,
the relationship between electrical resistivity and angle of friction for all points
indicates that the electrical resistivity increases as angle of friction increases with
regression coefficient R2=0.3921. Meanwhile, regression coefficient of R2=0.632 is
established between electrical resistivity and cohesion for all points. Electrical
resistivity increases with the increasing cohesion. The correlation and relationship
between porosity, saturation and soil strength parameters (angle of friction and
cohesion) by varying the particle size proportion for mixed sand and silt samples has
been established in this research.
v
ACKNOWLEDGEMENT
First and foremost, I wish to express my sincere gratitude particularly to my
Final Year Project (FYP) supervisor, Dr. Syed Baharom Azahar bin Syed Osman for
his support and kind guidance throughout the period of my final year project. His
passionate supervision has helped me in overcoming various difficulties faced during
the FYP. Without the attention and dedicated guidance from my supervisor, my final
year project would not be successfully completed.
Besides, I am also very thankful to graduate assistant, Mr. Hisyam Jusoh who has
provided endless guidance throughout my FYP. It is lucky to have him as part of the
team, whom never hesitate to give me necessary advice and help.
Finally, I am also grateful to the geotechnical laboratory technicians; Mr. Redzuan,
and Mr. Ruzaimi for their kindness and in lending helping hand in the time of needs.
Without them, this research can hardly be completed in time. Heartfelt appreciation is
given sincerely to all of them from me.
vi
TABLE OF CONTENT
CERTIFICATION OF APPROVAL ........................................................................... ii
CERTIFICATION OF ORIGINALITY ..................................................................... iii
ABSTRACT ................................................................................................................ iv
ACKNOWLEDGEMENT ........................................................................................... v
TABLE OF CONTENT .............................................................................................. vi
LIST OF FIGURES .................................................................................................. viii
LIST OF TABLES ....................................................................................................... x
1.0 INTRODUCTION ................................................................................................. 6
1.1 Background ........................................................................................................ 6
1.2 Problem Statement ............................................................................................. 7
1.3 Objectives ........................................................................................................... 7
1.4 Scope of Study .................................................................................................... 8
2.0 LITERATURE REVIEW ...................................................................................... 9
2.1 Electrical Resistivity of Soil ............................................................................... 9
2.2 Factors Affecting Resistivity of Soil ................................................................ 13
2.2.1 Nature and Arrangement of Solid Constituents ......................................... 13
2.2.2 Water Content ............................................................................................ 15
2.2.3 Pore Fluid Composition ............................................................................. 18
2.2.4 Temperature ............................................................................................... 20
2.3 Relation of Current Research with Previous Research..................................... 22
3.0 METHODOLOGY ............................................................................................... 24
3.1 Research Methodology ..................................................................................... 25
3.2 Sample Acquisition and Preparation ................................................................ 25
3.3 Soil Analysis Test ............................................................................................. 25
3.3.1 Particle Size Distribution ........................................................................... 25
vii
3.3.2 Moisture Content ....................................................................................... 27
3.3.3 Plasticity Index (Liquid Limit and Plastic Limit) ...................................... 28
3.4 Electrical Resistivity Test ................................................................................. 29
3.5 Shear Strength Determination .......................................................................... 30
3.6 Project Timeline ............................................................................................... 32
3.6.1 Final Year Project 1 (FYP 1) ..................................................................... 32
3.6.2 Final Year Project 2 (FYP 2) ...................................................................... 33
4.0 RESULTS & DISCUSSION ................................................................................ 34
4.1 Graph of Porosity, Saturation, Angle of Friction, Cohesion and Electrical
Resistivity versus Proportion of Sand and Silt ....................................................... 35
4.2 Graph of Electrical Resistivity versus Porosity, Saturation, Angle of Friction
and Cohesion .......................................................................................................... 40
4.3 Correlation of Electrical Resistivity versus Porosity, Saturation, Angle of
Friction and Cohesion for All Soil Samples ........................................................... 44
5.0 CONCLUSION AND RECOMMENDATION ................................................... 48
REFERENCES ........................................................................................................... 50
APPENDICES ........................................................................................................... 54
Appendix 1: Sample of Calculation Using Experiment Data ................................. 55
Appendix 2: Laboratory Test.................................................................................. 59
viii
LIST OF FIGURES
FIGURE 1: Distribution of the current flow in a homogeneous soil (Samouelian et
al., 2005). ............................................................................................... 10
FIGURE 2: Liner Resistivity Measurement Using Fixed-Spacing Four-Probed
Wenner Electrode Configuration (Kalinski & Kelly, 1994) .................... 12
FIGURE 3: Laboratory electrical resistivity setup. ................................................... 12
FIGURE 4: Relation of Porosity and Permeability to Formation Resistivity Factor
For Consolidated Sandstone Cores of the Gulf Coast (Archie, 1942) ..... 14
FIGURE 5: Relation of Porosity and Permeability to Formation Resistivity Factor,
Nacatoch Sand, Bellevue, LA (Archie, 1942). ........................................ 14
FIGURE 6: An example of experimental relationship between electrical resistivity
and water content of a peat soil (Podznyakov & Podznyakova, 2002). .. 16
FIGURE 7: Effect of soil saturation levels on soil electrical resistivity of (a) sandy
soil, (b) silty sand, (c) silt, (d) silty loam, and (e) clay loam (Zhou et al.,
2015). ....................................................................................................... 17
FIGURE 8: Relationship between the volumetric water content and resistivity for
different values of pore-water conductivity (Kalinski and Kelly, 1993). 18
FIGURE 9: Effect of pore fluid composition on soil electrical resistivity of (a) sandy
soil and (b) silt (Zhou et al., 2015). ......................................................... 19
FIGURE 10: Effect of soil temperature on the electrical resistivity of the five soils 21
FIGURE 11: Angle of friction (Phi) vs. electrical resistivity for all soil samples;
sand, silt and clay (Syed et al., 2014) ...................................................... 22
FIGURE 12: Porosity vs proportion of sand and silt for all moisture content. .......... 35
FIGURE 13: Saturation vs proportion of sand and silt for all moisture content........ 36
FIGURE 14: Angle of friction vs proportion of sand and silt for all moisture content.
................................................................................................................. 37
FIGURE 15: Cohesion vs proportion of sand and silt for all moisture content. ........ 38
FIGURE 16: Electrical resistivity vs proportion of sand and silt for all moisture
content. ..................................................................................................... 39
FIGURE 17: Electrical resistivity vs porosity for all moisture content. .................... 40
FIGURE 18: Electrical resistivity vs saturation for all moisture content. ................. 41
ix
FIGURE 19: Electrical resistivity vs angle of friction for all moisture content. ....... 42
FIGURE 20: Electrical resistivity vs cohesion for all moisture content. ................... 43
FIGURE 21: Correlation of electrical resistivity with porosity for all soil samples. . 44
FIGURE 22: Correlation of electrical resistivity with saturation for all soil samples.
................................................................................................................. 45
FIGURE 23: Correlation of electrical resistivity with angle of friction for all soil
samples..................................................................................................... 46
FIGURE 24: Correlation of electrical resistivity with cohesion for all soil samples. 47
x
LIST OF TABLES
TABLE 1: 2D in-line electrodes array configuration, and 3D electrode device
(Samouelian et al., 2005) ....................................................................... 11
TABLE 2: Timeline for FYP 1 .................................................................................. 32
TABLE 3: Timeline for FYP 2 .................................................................................. 33
TABLE 4: Results for porosity, saturation, electrical resistivity, angle of friction and
cohesion. .................................................................................................. 34
TABLE 5: Results for pH and plasticity index. ......................................................... 35
6
CHAPTER 1
INTRODUCTION
1.1 Background
The soil is the most important aspect in a construction project as it is the natural
foundation that supports all structures and investment. Proper soil investigation and
analysis is crucial to acquire the complete information or data of the environment and
ground condition to enable a safe practical and economical design of the building.
According to Timari and Kumawat (2013), the purpose of soil investigation is to assess
the general suitability of the soil for the proposed project and to allow an adequate and
economical design to be made. In addition, soil investigation is done to acquire
physical and mechanical properties of soils for design and construction and also to
calculate total and differential settlements of foundation soil.
Soil boring is done on site or field to acquire the soil samples. Laboratory test is then
performed on the samples to determine the engineering properties and the shear
strength parameters such as cohesion (c) and angle of internal friction (φ) of the soil
which then enable us to compute the bearing capacity of soil and factor of safety
(FOS). However, the determination of these properties involves extensive soil boring,
sample acquisitions and laboratory testing which consume a lot of time and money.
As oppose to the conventional method, geophysical methods such as geo-electrical,
ground penetration radar and seismic refraction is proven to be more efficient in terms
of time and cost. Because of the non-invasive, non-destructive, rapid and cost-effective
aspect of geo-electrical survey, there have been many researches done to explore the
phenomenon of electrical resistivity in soils.
7
1.2 Problem Statement
Malaysia is a developing country which results in massive construction and
development of buildings and infrastructure. Geotechnical properties should be
identified accurately as it is essential for a successful construction of a structure. Bore
hole sampling is known as a conventional method of soil investigation and contributes
to reliable determination of soil strength parameters. However, some of the drawbacks
of this method are time consuming, costly and the process of acquiring bore hole
sample causes disturbance to the soil mechanics. Bore hole sampling also involves the
mobilization of heavy equipment to the site. Not only that, soil properties are subjected
to high spatial and temporal variations, resulting in high density of sampling for precise
assessment of soil properties. In addition, a hillside development for example, requires
checking of the slope stability by calculating factor of safety (FOS). For a regular
checking of slope stability and calculation of FOS, many bore holes at different
locations are required on a particular stretch of slope to enable the determination of
possible hazards or risks which is not practical (Syed et al., 2014).
Geophysical method such as electrical resistivity is an alternative which is rapid, cost
effective, and non-destructive. Correlation between electrical resistivity and soil
strength parameters (e.g. cohesion, angle of friction) will help in quicker assessment
of geotechnical problems such as bearing capacity and factor of safety in soil slopes.
The correlation will also enable designing and checking of any geotechnical structure.
1.3 Objectives
The objectives of this project are:
1. To determine the effects of porosity and saturation on electrical resistivity for
different particle size proportion.
2. To determine the behaviour of electrical resistivity with soil strength parameters
by varying the particle size proportion for mixed sand and silt samples.
8
1.4 Scope of Study
The research involves only laboratory test. This study uses two types of soil;
sand (grade S10100) and silt (grade S300). The soil samples were purchased from soil
processing company. The two types of soil will be mixed into respective proportion;
(1) 100% sand, (2) 80% sand, 20% silt, (3) 60% sand, 40% silt, (4) 40% sand, 60%
silt, (5) 20% sand, 80% silt, (6) 100% silt.
The moisture content will be fixed to (1) 15%, (2) 20%, (3) 25%, (4) 30% and (5) 35%.
All the different percentage of particle size proportion will be tested with every
moisture content value. The correlation of electrical resistivity and soil strength
parameters by varying the particle size proportion of sand and silt is performed by
using the parameters obtained from laboratory work based on 20 samples. The
engineering properties such as moisture content, pH, porosity, saturation, plasticity
index, angle of friction and cohesion can be obtained through laboratory tests.
9
CHAPTER 2
LITERATURE REVIEW
2.1 Electrical Resistivity of Soil
An electrical resistivity of soil is the measure of its resistance to the passage of
current through it (Syed & Siddiqui, 2012). Ozcep et al. (2009) believes that soil
electrical properties are the parameters of natural and artificially created electrical
fields in soils and influenced by distribution of mobile electrical charges, mostly
inorganic ions, in soils.
For a simple body, the resistivity 𝜌 (Ω m) is defined as follows:
𝜌 = 𝑅 𝐴
𝐿 Equation 2.1
Where R = electrical resistance (Ω), L = length of the cylinder (m) and A = cross-
sectional area (m2).
The electrical resistance of the cylindrical body R (Ω), is defined by the Ohm’s law as
follows:
𝑅 = 𝑉
𝐼 Equation 2.2
where V = potential (V) and I = current (A).
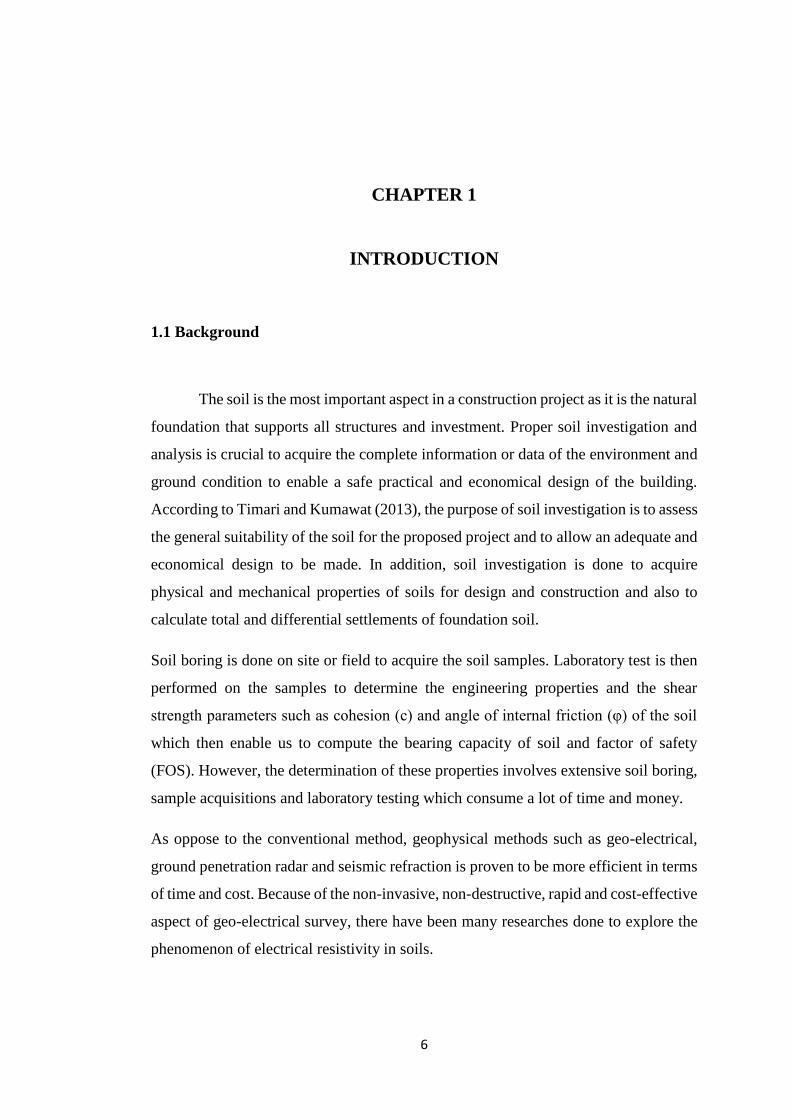
As stated by Samouelian et al. (2004), four electrodes are usually required to measure
electrical resistivity. To inject current, two electrodes called A and B are used (current
electrodes). To record the resulting potential difference, two other electrodes called M
and N are used (potential electrode).
10
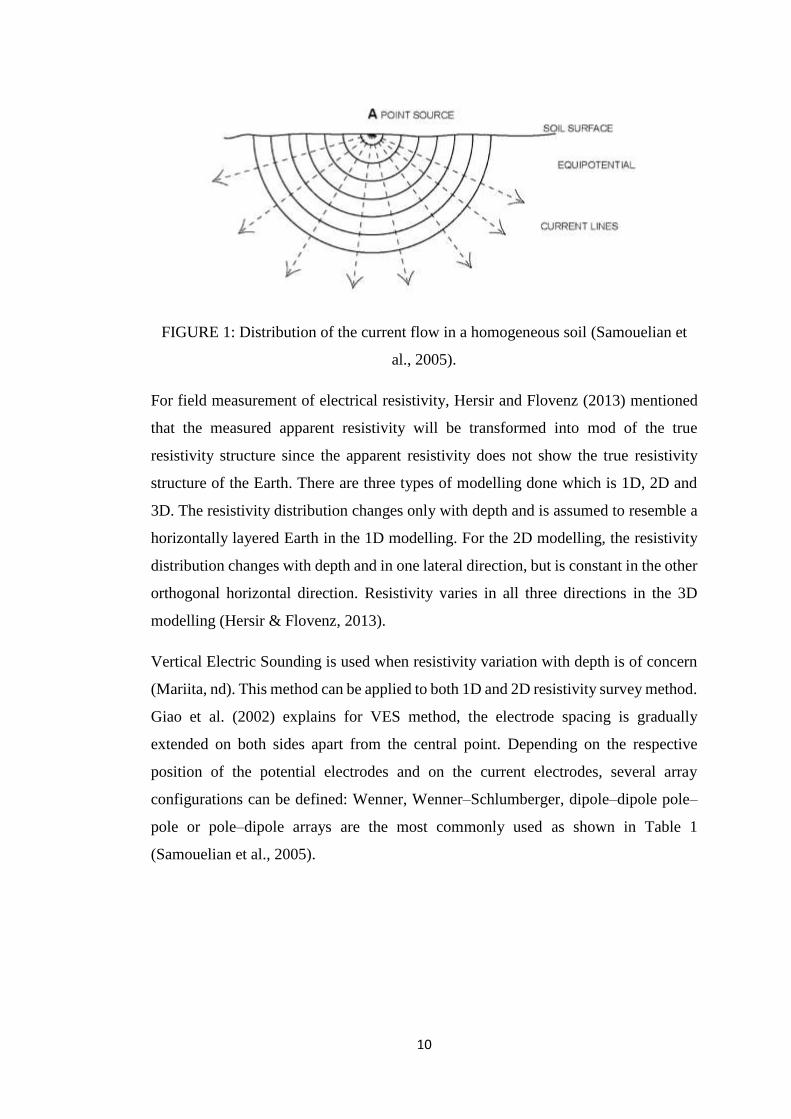
FIGURE 1: Distribution of the current flow in a homogeneous soil (Samouelian et
al., 2005).
For field measurement of electrical resistivity, Hersir and Flovenz (2013) mentioned
that the measured apparent resistivity will be transformed into mod of the true
resistivity structure since the apparent resistivity does not show the true resistivity
structure of the Earth. There are three types of modelling done which is 1D, 2D and
3D. The resistivity distribution changes only with depth and is assumed to resemble a
horizontally layered Earth in the 1D modelling. For the 2D modelling, the resistivity
distribution changes with depth and in one lateral direction, but is constant in the other
orthogonal horizontal direction. Resistivity varies in all three directions in the 3D
modelling (Hersir & Flovenz, 2013).
Vertical Electric Sounding is used when resistivity variation with depth is of concern
(Mariita, nd). This method can be applied to both 1D and 2D resistivity survey method.
Giao et al. (2002) explains for VES method, the electrode spacing is gradually
extended on both sides apart from the central point. Depending on the respective
position of the potential electrodes and on the current electrodes, several array
configurations can be defined: Wenner, Wenner–Schlumberger, dipole–dipole pole–
pole or pole–dipole arrays are the most commonly used as shown in Table 1
(Samouelian et al., 2005).
11
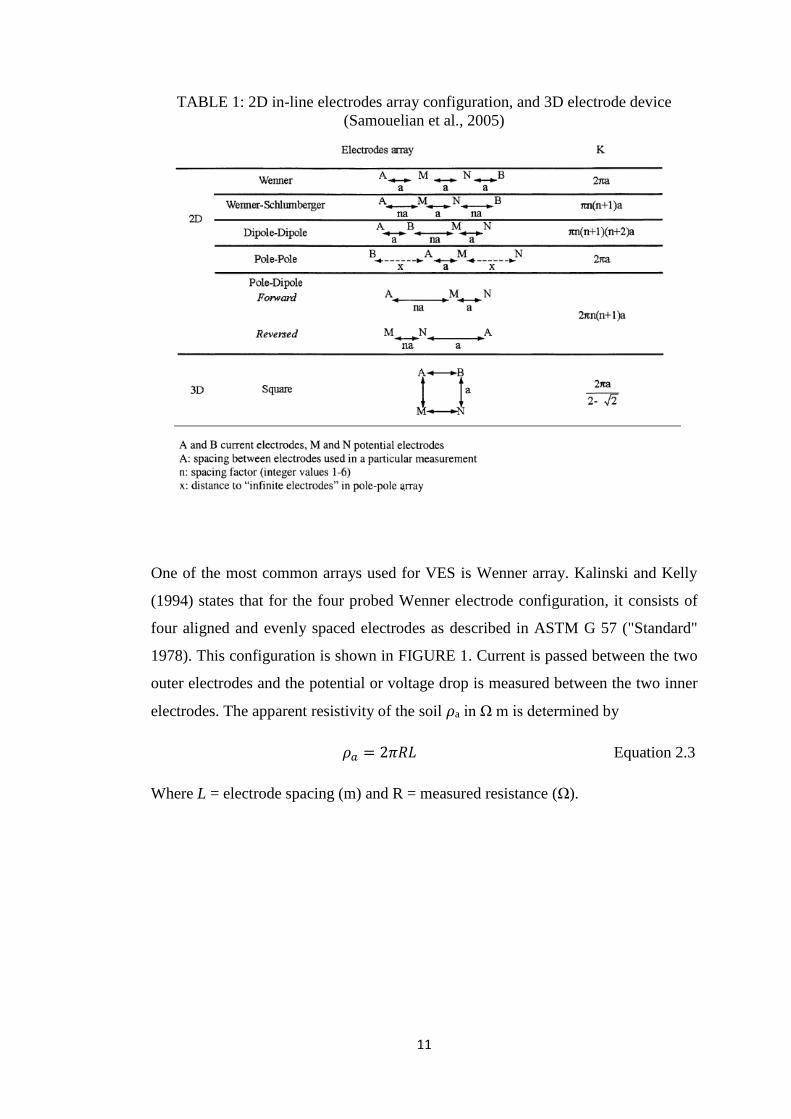
TABLE 1: 2D in-line electrodes array configuration, and 3D electrode device
(Samouelian et al., 2005)
One of the most common arrays used for VES is Wenner array. Kalinski and Kelly
(1994) states that for the four probed Wenner electrode configuration, it consists of
four aligned and evenly spaced electrodes as described in ASTM G 57 ("Standard"
1978). This configuration is shown in FIGURE 1. Current is passed between the two
outer electrodes and the potential or voltage drop is measured between the two inner
electrodes. The apparent resistivity of the soil 𝜌a in Ω m is determined by
𝜌𝑎 = 2𝜋𝑅𝐿 Equation 2.3
Where L = electrode spacing (m) and R = measured resistance (Ω).
12
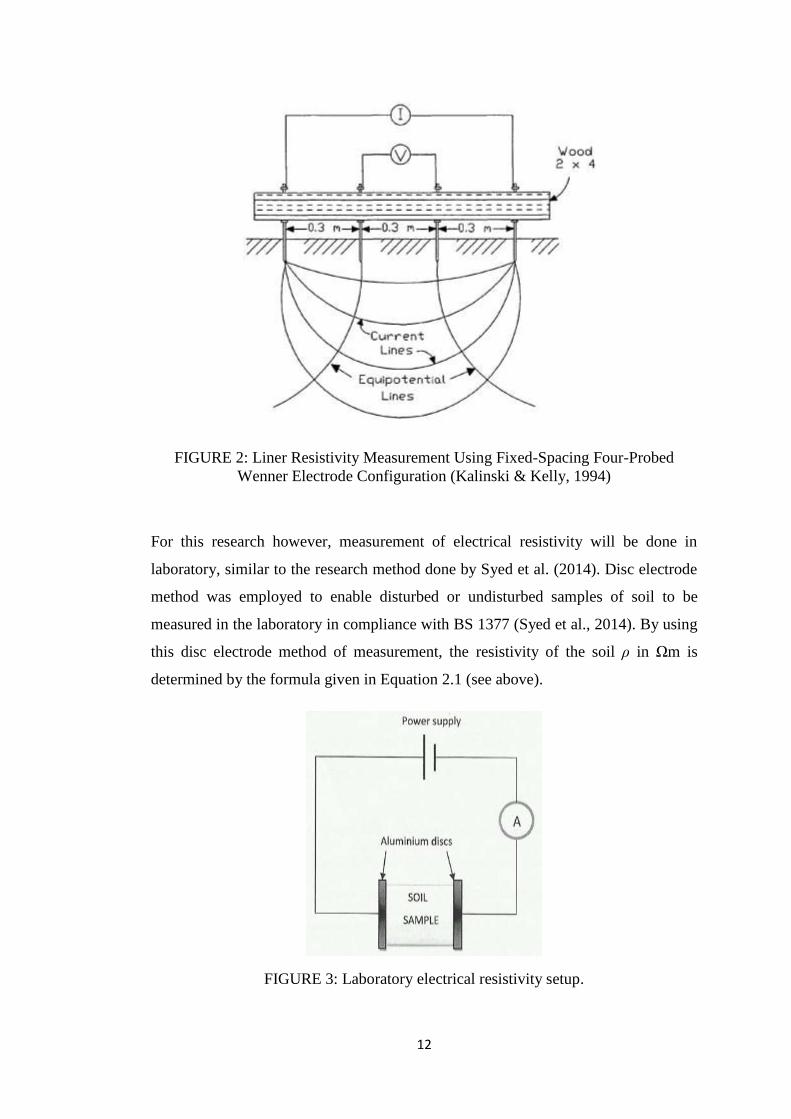
FIGURE 2: Liner Resistivity Measurement Using Fixed-Spacing Four-Probed
Wenner Electrode Configuration (Kalinski & Kelly, 1994)
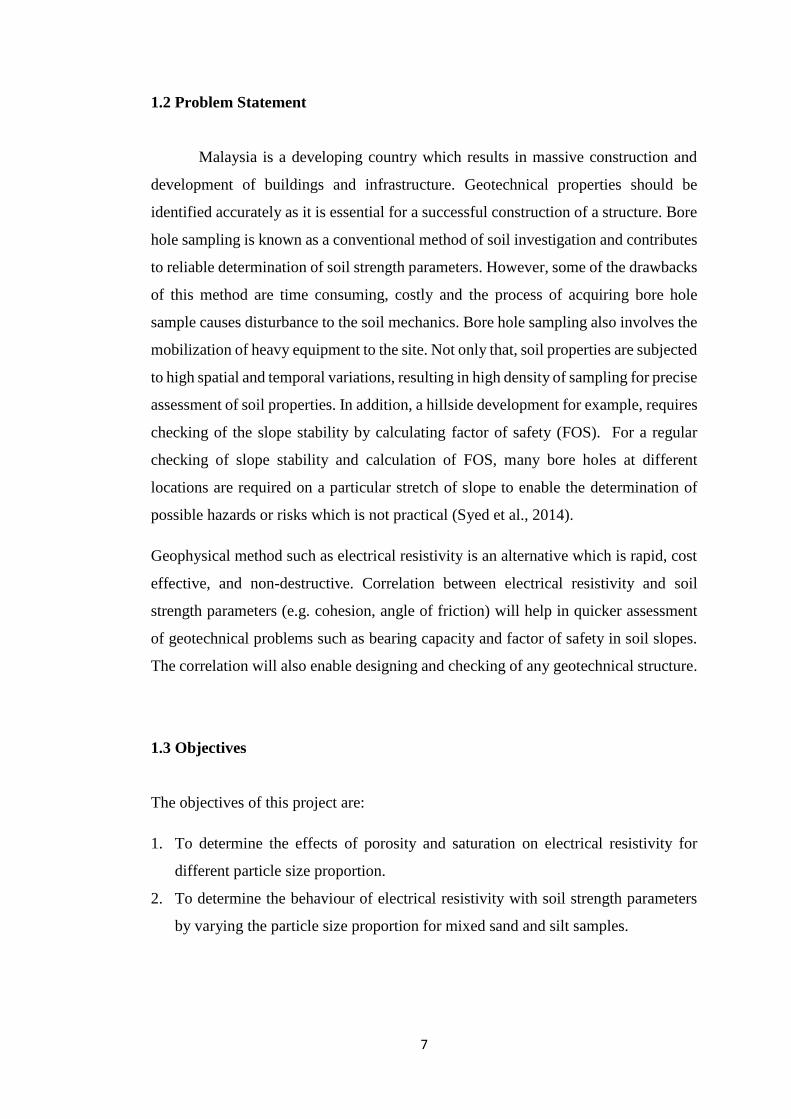
For this research however, measurement of electrical resistivity will be done in
laboratory, similar to the research method done by Syed et al. (2014). Disc electrode
method was employed to enable disturbed or undisturbed samples of soil to be
measured in the laboratory in compliance with BS 1377 (Syed et al., 2014). By using
this disc electrode method of measurement, the resistivity of the soil ρ in Ωm is
determined by the formula given in Equation 2.1 (see above).
FIGURE 3: Laboratory electrical resistivity setup.
13
2.2 Factors Affecting Resistivity of Soil
As mentioned by Samouelian et al. (2005), the electrical resistivity is affected
by some soil properties:
a) Nature of the solid constituents (particle size distribution and mineralogy).
b) Arrangement of voids (porosity, pore size distribution and connectivity.
c) Degree of water saturation (water content).
d) Electrical resistivity of the fluid (solute concentration).
e) Temperature.
2.2.1 Nature and Arrangement of Solid Constituents
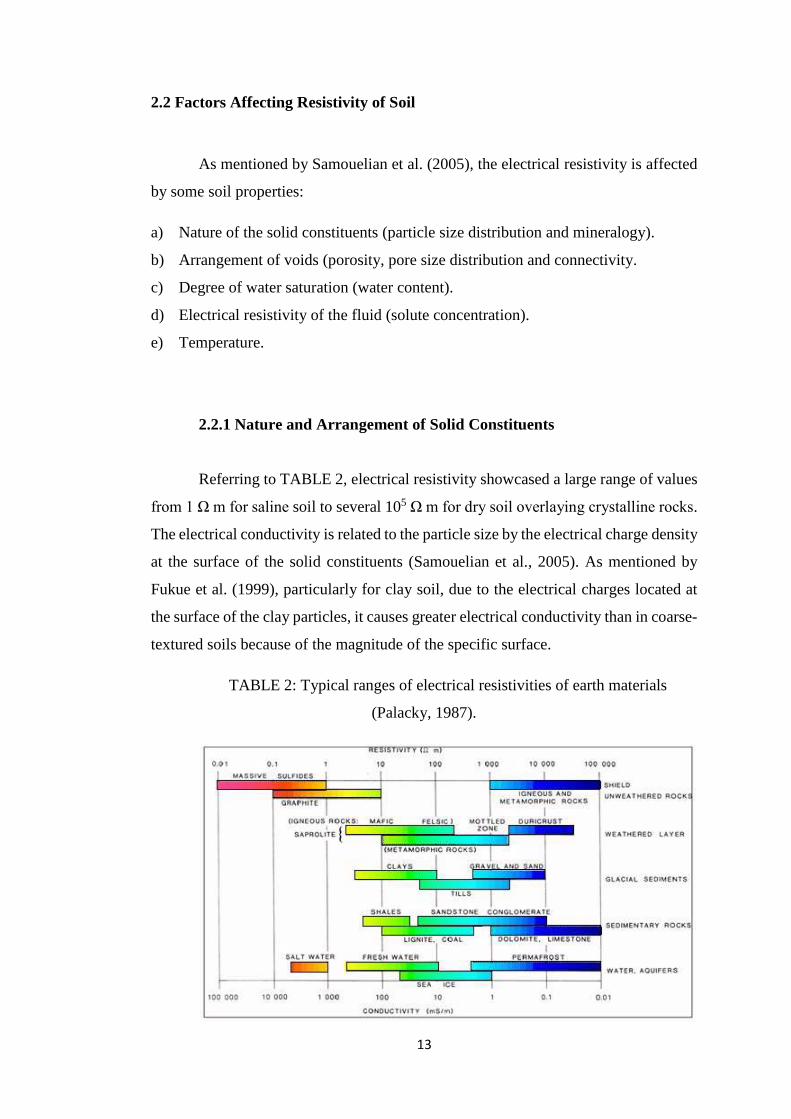
Referring to TABLE 2, electrical resistivity showcased a large range of values
from 1 Ω m for saline soil to several 105 Ω m for dry soil overlaying crystalline rocks.
The electrical conductivity is related to the particle size by the electrical charge density
at the surface of the solid constituents (Samouelian et al., 2005). As mentioned by
Fukue et al. (1999), particularly for clay soil, due to the electrical charges located at
the surface of the clay particles, it causes greater electrical conductivity than in coarse-
textured soils because of the magnitude of the specific surface.
TABLE 2: Typical ranges of electrical resistivities of earth materials
(Palacky, 1987).
14
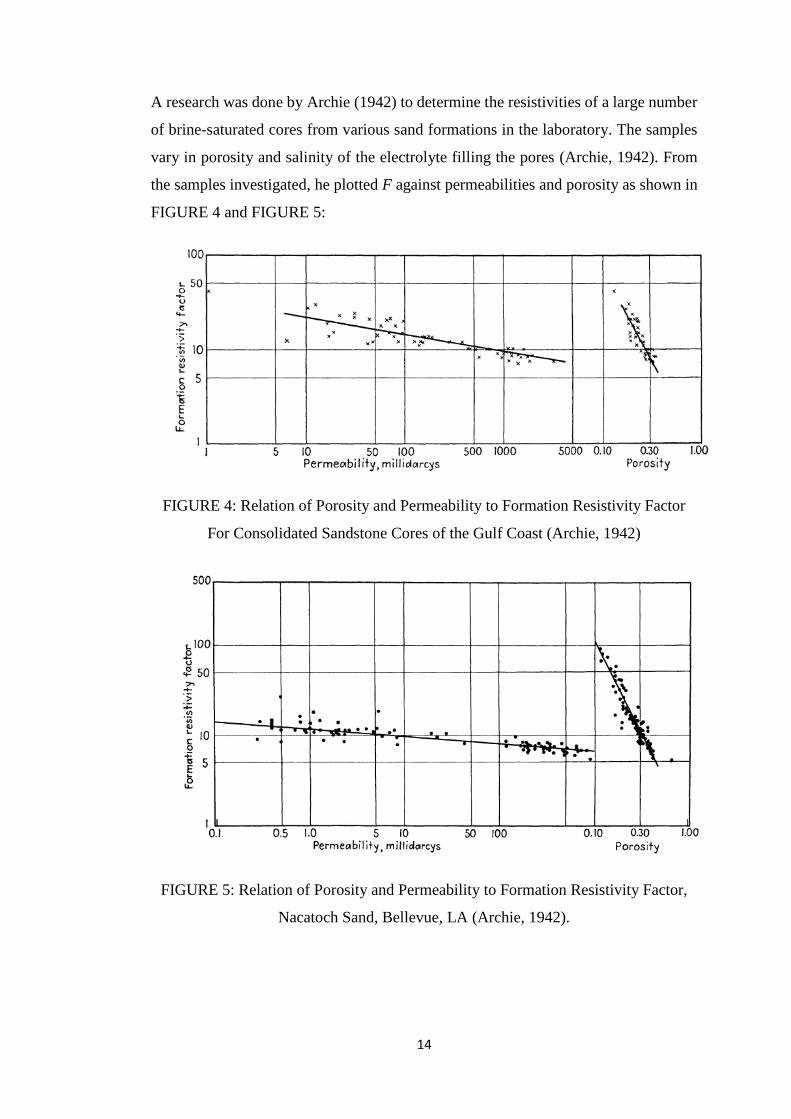
A research was done by Archie (1942) to determine the resistivities of a large number
of brine-saturated cores from various sand formations in the laboratory. The samples
vary in porosity and salinity of the electrolyte filling the pores (Archie, 1942). From
the samples investigated, he plotted F against permeabilities and porosity as shown in
FIGURE 4 and FIGURE 5:
FIGURE 4: Relation of Porosity and Permeability to Formation Resistivity Factor
For Consolidated Sandstone Cores of the Gulf Coast (Archie, 1942)
FIGURE 5: Relation of Porosity and Permeability to Formation Resistivity Factor,
Nacatoch Sand, Bellevue, LA (Archie, 1942).
15
As mentioned by Samouelian et al. (2005), the porosity can be obtained for the
electrical property using Archie’s law, which for a saturated soil without clay is written
as:
𝐹 =𝜌
𝜌𝑤= 𝑎𝜙−𝑚 Equation 2.4
where the proportionality factor F is called the formation factor, a and m are constants
related, respectively, to the coefficient of saturation and the cementation factor, 𝜌 and
𝜌w are the resistivity of the formation and the resistivity of the pore-water, 𝜙 is the
porosity. The factor F depends then on the pore geometry. By knowing the pore-water
resistivity and the 𝑎 and 𝑚 constants the porosity can be calculated from the resistivity
value (Samouelian et al., 2005).
2.2.2 Water Content
Zhou et al. (2015) explains that soil resistivity is highly influenced by water in
soil. This is due to the electrical conduction in soil that is primarily electrolytic and
occurs through water in pore spaces or along the continuous films of water adsorbed
on grain boundaries. Water content influences the mobility of electrical charges in
soils.
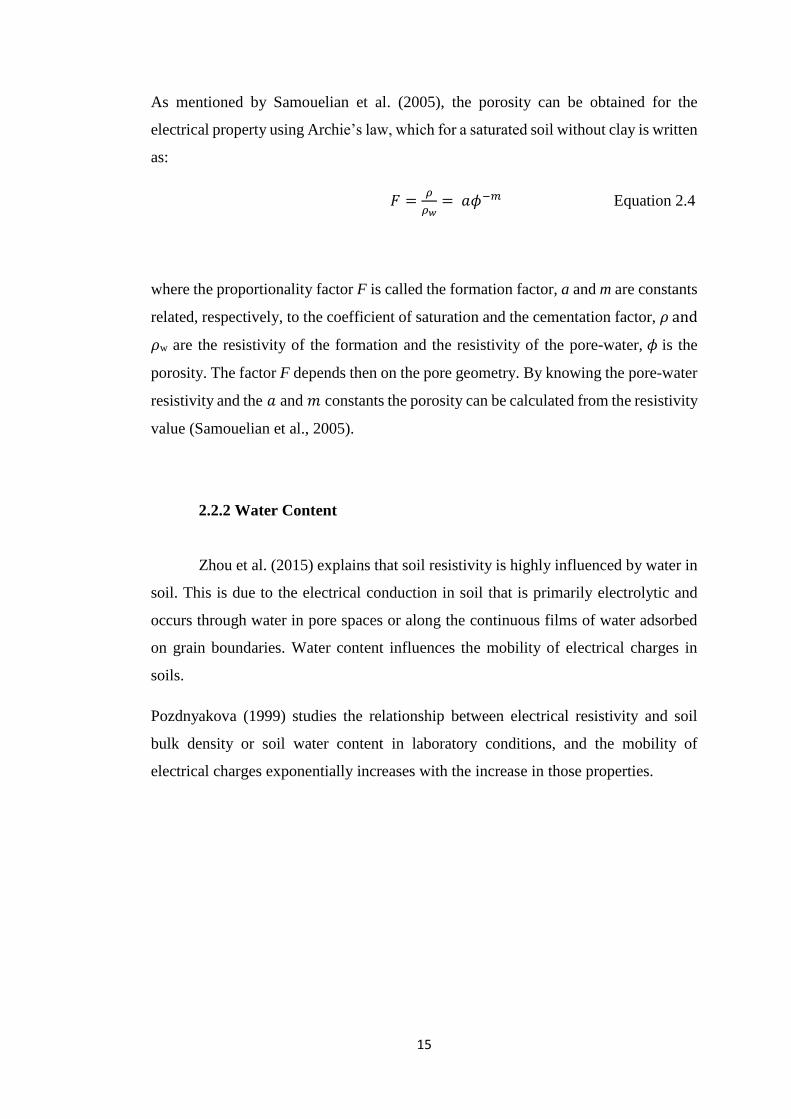
Pozdnyakova (1999) studies the relationship between electrical resistivity and soil
bulk density or soil water content in laboratory conditions, and the mobility of
electrical charges exponentially increases with the increase in those properties.
16
FIGURE 6: An example of experimental relationship between electrical resistivity
and water content of a peat soil (Podznyakov & Podznyakova, 2002).
Archie (1942) suggested an empirical relationship based on laboratory measurements
of clean sandstone samples. This relationship, as shown below as Equation 2.6, was
modified from the Equation 2.4 mentioned previously, taking into account that the
porosity can be filled by other medium as water, such as air or petroleum. The water
saturation was expressed in function of the formation factor F, of the formation
resistivity 𝜌 and of the water resistivity 𝜌𝑤:
𝑆𝑛 =𝐹𝜌
𝜌𝑤 Equation 2.5
By combining with equation 2.4, we obtain:
𝑆𝑛 =𝑎𝜌
𝜙𝑚𝜌𝑤 Equation 2.6
where S is the saturation degree and n is a parameter related to the saturation degree.
Equation 2.6 was valid for medium to coarse-grained soils and rocks as it presumes
that the characteristic of the solid phase which is grain matrix does not influence the
electrical current conduction (Frohlich & Parke, 1989). However, the electrical
resistivity of the grain matrix cannot be ignored for small grain sizes especially when
clay minerals are present.
17
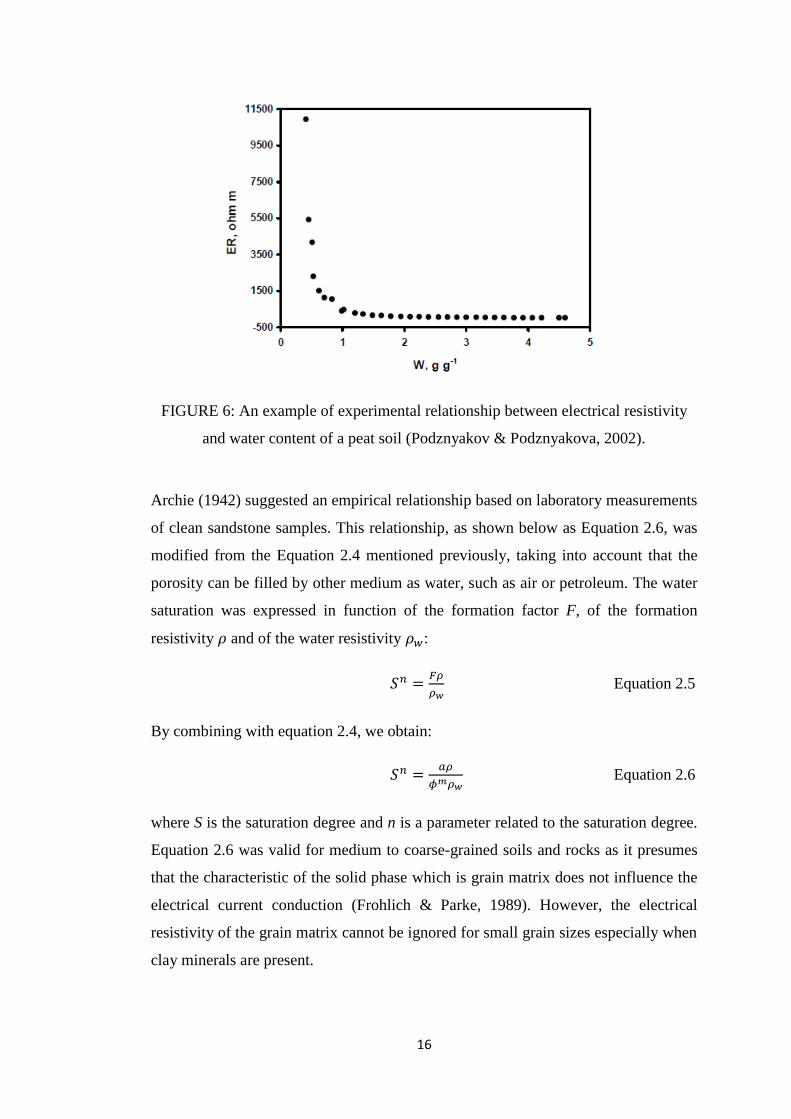
FIGURE 7 presents the results of Zhou et al. (2015) research on the electrical
resistivity of five soils under different soil saturation levels. For all the five soils, when
the soil saturation increases, the soil electrical resistivity decreases. They also added
that there exists a critical soil saturation level below which the resistivity will increase
rapidly. Under the same soil saturation level, the electrical resistivity of sandy soil >
silty sand > silt > silty loam > clay loam. It can be concluded that the smaller the soil
particle, or the higher the clay contents of the soil, the lower the electrical resistivity
(Zhou et al., 2015).
FIGURE 7: Effect of soil saturation levels on soil electrical resistivity of (a) sandy
soil, (b) silty sand, (c) silt, (d) silty loam, and (e) clay loam (Zhou et al., 2015).
18
In addition, experiment done by Kibria and Hossain (2012) also achieved good
correlation between degree of saturation and soil resistivity. Soil resistivity decreases
with the increase in degree of saturation.
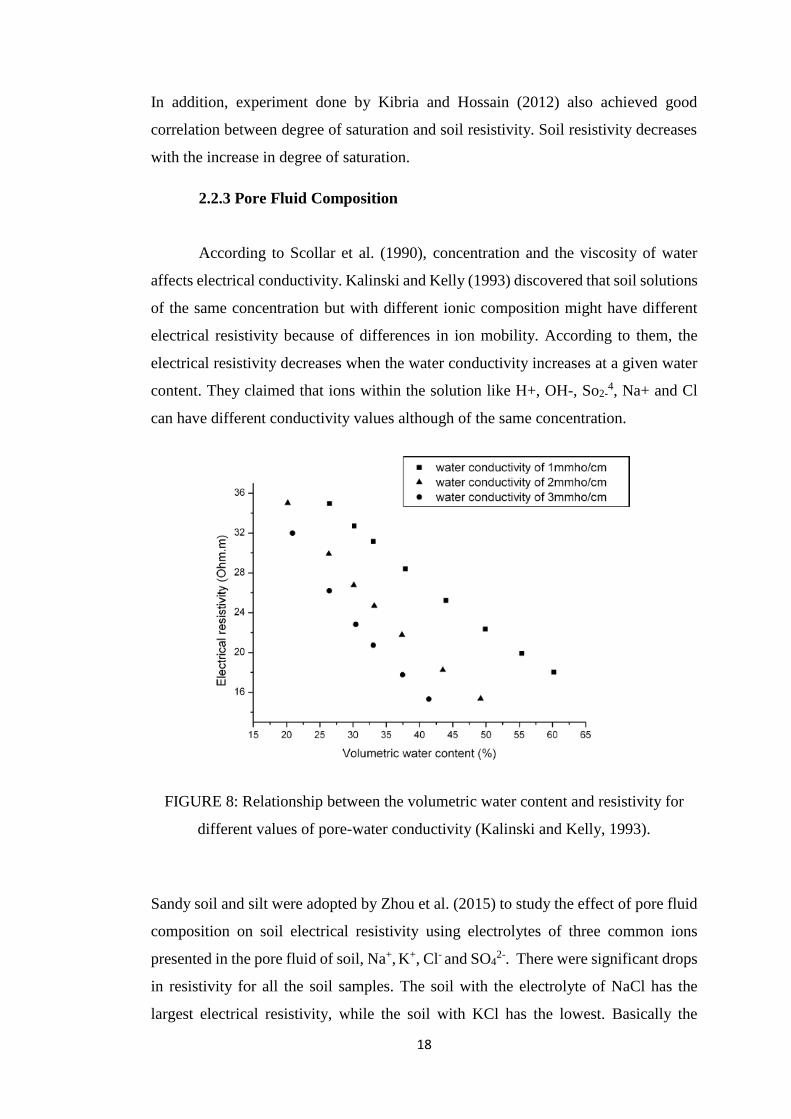
2.2.3 Pore Fluid Composition
According to Scollar et al. (1990), concentration and the viscosity of water
affects electrical conductivity. Kalinski and Kelly (1993) discovered that soil solutions
of the same concentration but with different ionic composition might have different
electrical resistivity because of differences in ion mobility. According to them, the
electrical resistivity decreases when the water conductivity increases at a given water
content. They claimed that ions within the solution like H+, OH-, So2-4, Na+ and Cl
can have different conductivity values although of the same concentration.
FIGURE 8: Relationship between the volumetric water content and resistivity for
different values of pore-water conductivity (Kalinski and Kelly, 1993).
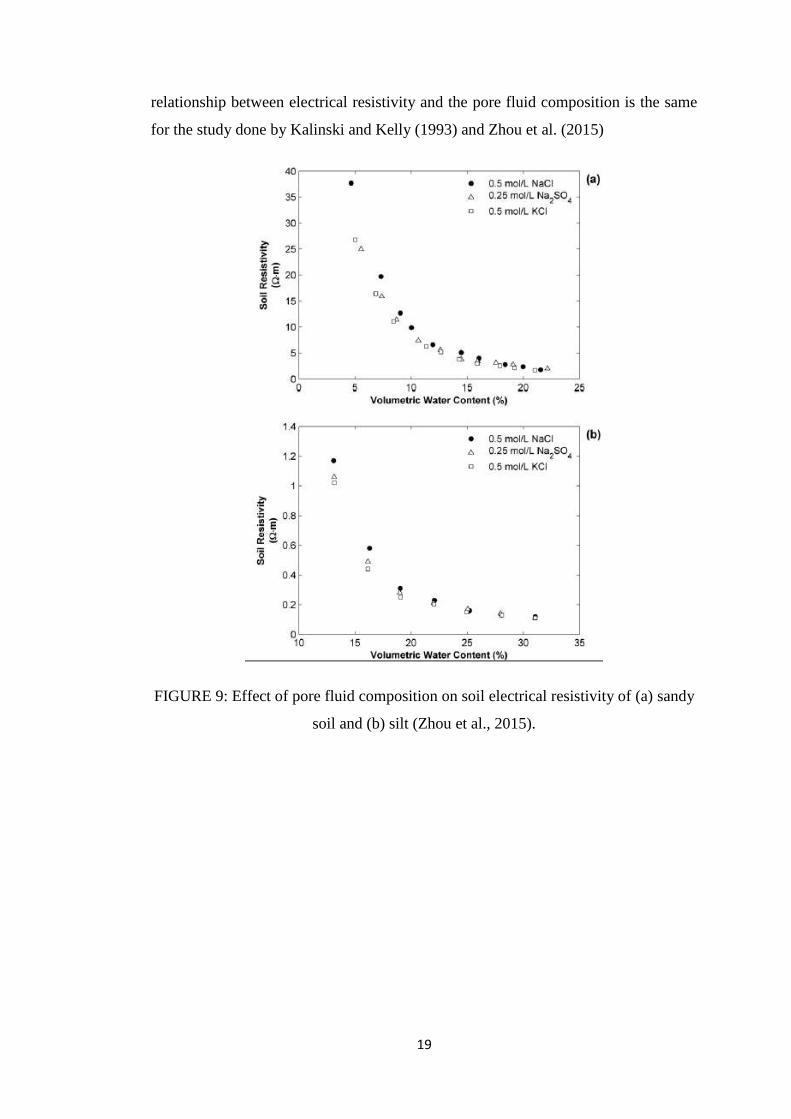
Sandy soil and silt were adopted by Zhou et al. (2015) to study the effect of pore fluid
composition on soil electrical resistivity using electrolytes of three common ions
presented in the pore fluid of soil, Na+, K+, Cl- and SO42-. There were significant drops
in resistivity for all the soil samples. The soil with the electrolyte of NaCl has the
largest electrical resistivity, while the soil with KCl has the lowest. Basically the
19
relationship between electrical resistivity and the pore fluid composition is the same
for the study done by Kalinski and Kelly (1993) and Zhou et al. (2015)
FIGURE 9: Effect of pore fluid composition on soil electrical resistivity of (a) sandy
soil and (b) silt (Zhou et al., 2015).
20
2.2.4 Temperature
When the viscosity of a fluid decreases, ion agitation increases with
temperature causing the electrical resistivity to decrease as the temperature increases.
Campbell et al. (1948) conducted laboratory experiments on 30 samples of saline and
alkaline soils and he demonstrated that conductivity increased by 2.02% per °C
between 15 and 35°C. The electrical conductivity is expressed at the standardized
temperature of 25°C as in Equation 2.7:
𝜎𝑡 = 𝜎25℃ [1 + 𝛼(𝑇 − 25°𝐶)] Equation 2.7
where 𝜎𝑡 = the conductivity at the experiment temperature, 𝜎25℃ = the conductivity at
25 °C, and 𝛼 is the correction factor equal to 2.02%.
Abu-Hassanein et al. (1996) studied the effect of temperature on the electrical
resistivity of compacted clays. The result shows electrical resistivity decreases with
increasing temperature, as expected. In the same time, a large drop in electrical
resistivity occurs as the temperature passes the freezing point (-O°C). Keller and
Frischknecht (1966) explain, this abrupt change occurs due to change in dielectric
constant when the pore fluid changes phase.
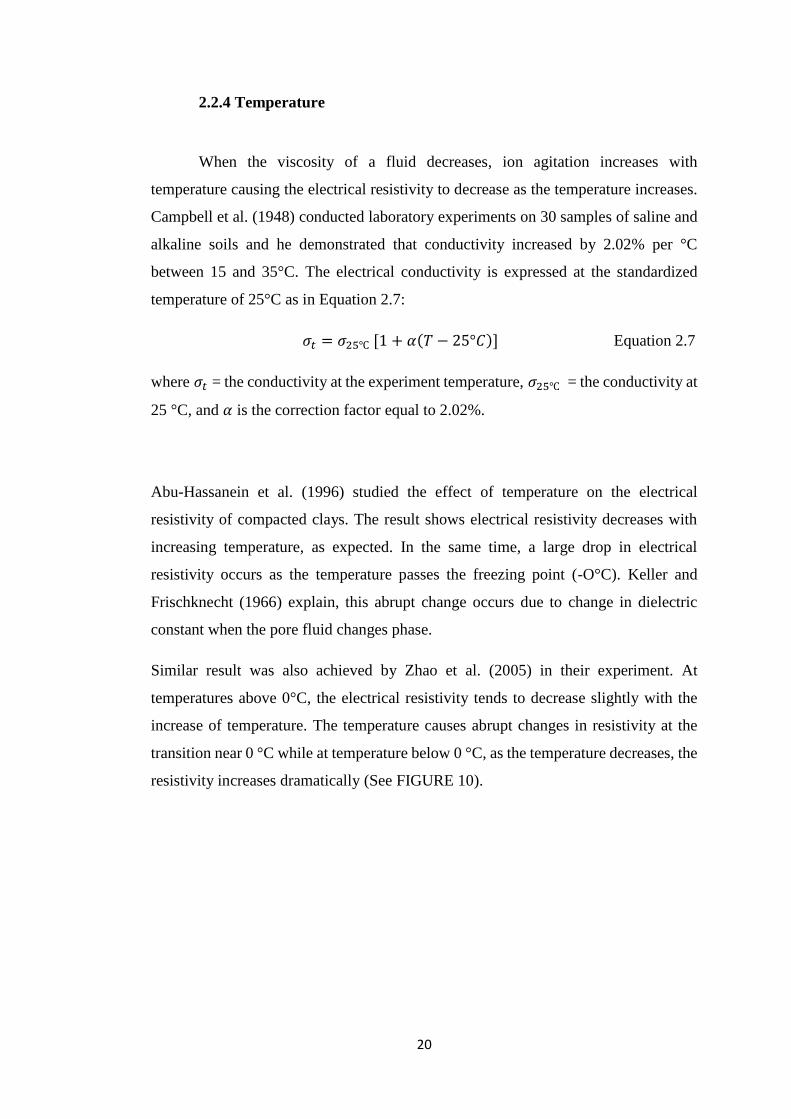
Similar result was also achieved by Zhao et al. (2005) in their experiment. At
temperatures above 0°C, the electrical resistivity tends to decrease slightly with the
increase of temperature. The temperature causes abrupt changes in resistivity at the
transition near 0 °C while at temperature below 0 °C, as the temperature decreases, the
resistivity increases dramatically (See FIGURE 10).
21
FIGURE 10: Effect of soil temperature on the electrical resistivity of the five soils
(Zhao et al., 2015).
As stated by Samouelian et al. (2005), the effect of temperature on electrical field
resistivity measurements at the annual scale is not avoidable as temperature variation
in soil occurs at two different temporal scales, which is day and season during a year.
Typically, in the Northern hemisphere, the highest resistivity values are obtained
between September to November. The lowest resistivity values are recorded between
June to July (Samouelian et al., 2005).
22
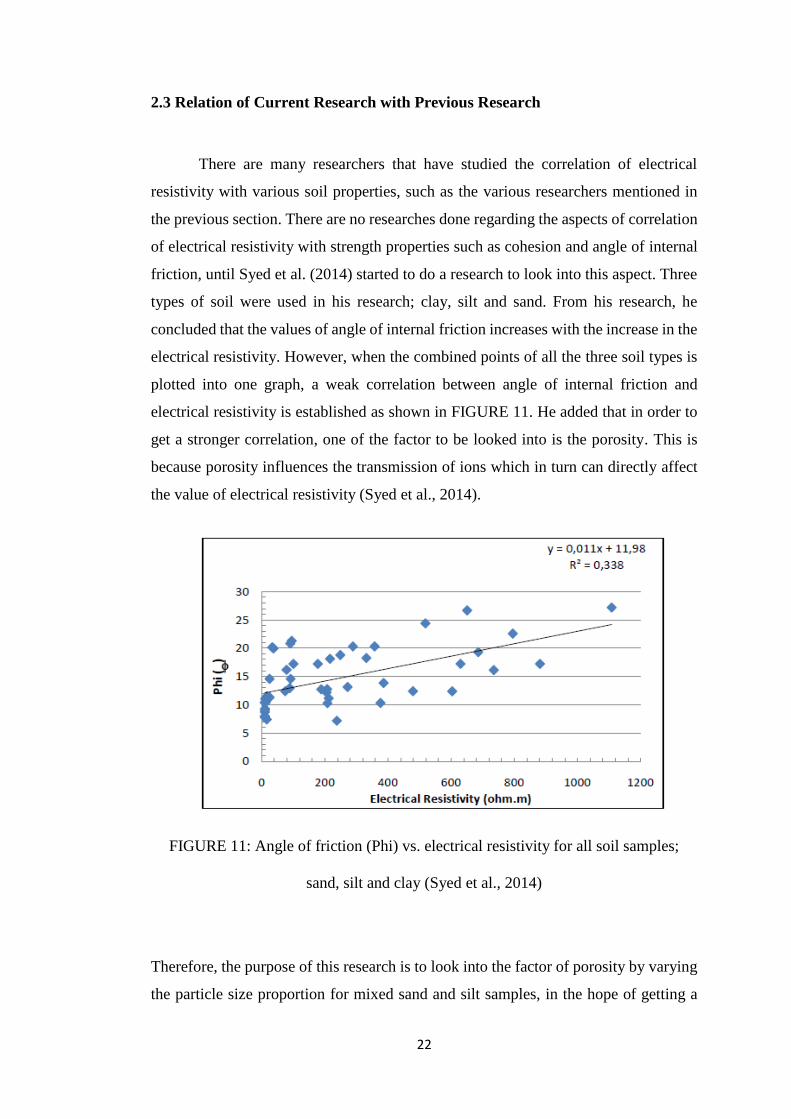
2.3 Relation of Current Research with Previous Research
There are many researchers that have studied the correlation of electrical
resistivity with various soil properties, such as the various researchers mentioned in
the previous section. There are no researches done regarding the aspects of correlation
of electrical resistivity with strength properties such as cohesion and angle of internal
friction, until Syed et al. (2014) started to do a research to look into this aspect. Three
types of soil were used in his research; clay, silt and sand. From his research, he
concluded that the values of angle of internal friction increases with the increase in the
electrical resistivity. However, when the combined points of all the three soil types is
plotted into one graph, a weak correlation between angle of internal friction and
electrical resistivity is established as shown in FIGURE 11. He added that in order to
get a stronger correlation, one of the factor to be looked into is the porosity. This is
because porosity influences the transmission of ions which in turn can directly affect
the value of electrical resistivity (Syed et al., 2014).
FIGURE 11: Angle of friction (Phi) vs. electrical resistivity for all soil samples;
sand, silt and clay (Syed et al., 2014)
Therefore, the purpose of this research is to look into the factor of porosity by varying
the particle size proportion for mixed sand and silt samples, in the hope of getting a
23
stronger correlation between porosity and electrical resistivity. This will directly affect
the strength of correlation between soil strength parameters (cohesion and angle of
internal friction) with electrical resistivity.
24
CHAPTER 3
METHODOLOGY
The objective of this study is to determine the effects of porosity and
saturation on electrical resistivity for different particle size proportion and also to
determine the effects of varying the particle size proportion for mixed sand and silt
samples on the behaviour of electrical resistivity with soil strength parameters.
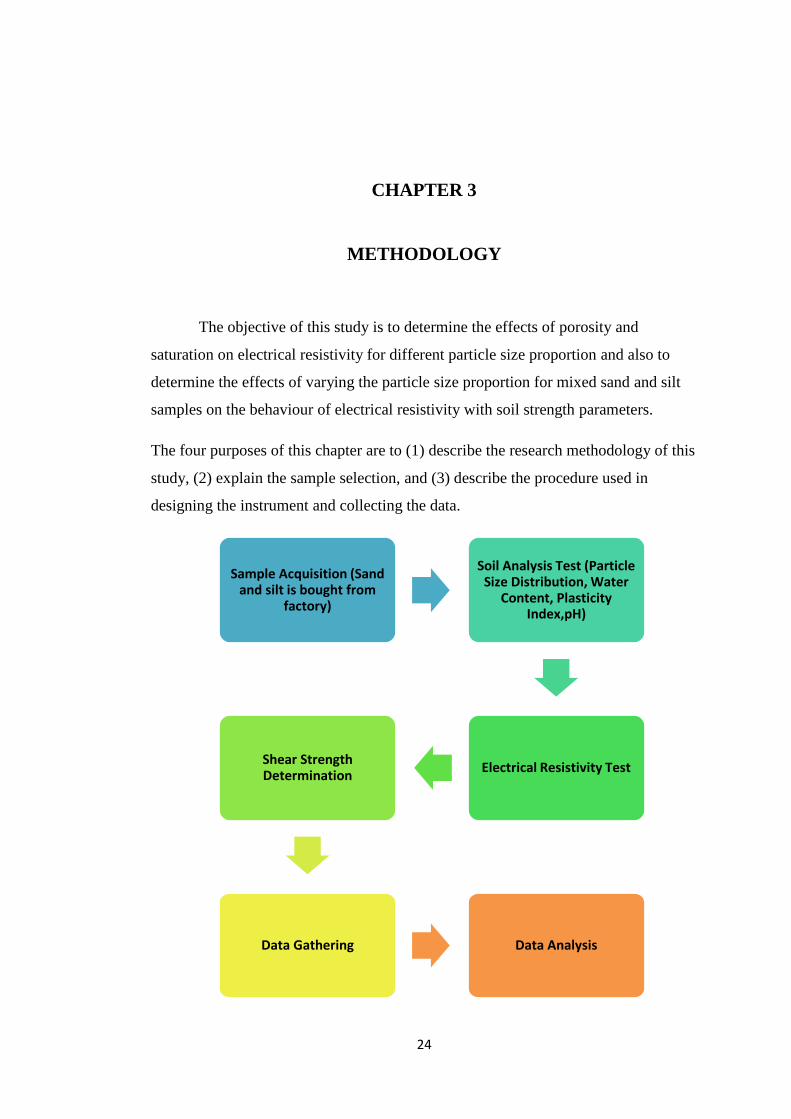
The four purposes of this chapter are to (1) describe the research methodology of this
study, (2) explain the sample selection, and (3) describe the procedure used in
designing the instrument and collecting the data.
Sample Acquisition (Sand and silt is bought from
factory)
Soil Analysis Test (Particle Size Distribution, Water
Content, Plasticity Index,pH)
Electrical Resistivity TestShear Strength Determination
Data Gathering Data Analysis
25
3.1 Research Methodology
The type of research used in this study is quantitative research. This study
applies experimental research where scientific method is used to establish the cause-
effect relationship among a group of variables that make up this study. In this study,
the proportion of mixed sand and silt samples is varied to determine the effects on the
behaviour of electrical resistivity along with soil strength parameters.
3.2 Sample Acquisition and Preparation
For this study, 20 samples of mixed sand and silt soil is needed. Two different
types of soil specimen with different particle size are bought from a specific supplier.
The first type is sand grade S10100 with particle size from 0.029mm to 2.00mm. The
second type is silt grade S300 with particle size from 0.0045mm to 0.250mm. Different
particle size proportion is prepared using the two types of soil specimen bought, with
the proportion of (1) 100% sand, (2) 80% sand, 20% silt, (3) 60% sand, 40% silt, (4)
40% sand, 60% silt, (5) 20% sand, 80% silt, (6) 100% silt.
3.3 Soil Analysis Test
3.3.1 Particle Size Distribution
This test is performed to check the particle sizes of the samples bought. Since
the soil samples obtained are very fine and the sieve test was impractical to measure
its size distribution, another method was adopted. Hydrometer test was used according
to BS 1377 part 2 1990, 9.6 standard.
50 g of the sample was placed in a conical flask and 100ml of sodium
hexametaphosphate was added and mixed in the shaker for 24 hours. The next day the
sample was sieved through 63μm sieve. Two procedures were followed with the
26
retained and passing mass, to be able to generate a size distribution graph that
represents the size variation throughout the soil sample.
The mass passing 63μm was placed in a 1000ml cylinder and placed in the water bath
and readings were taken at 30s, 1min, 4min, 8min, 15min, 30min, 1 hours, 2 hours, 4
hours, and 24 hours using a hydrometer. On the other hand, the mass retained on 63μm
was washed off on a tray using distilled water and placed in the oven for 24 hours. The
next day the dry sample was sieved through 1.18mm, 600μm, 425μm, 300μm, 212μm,
150μm, and 63μm respectively.
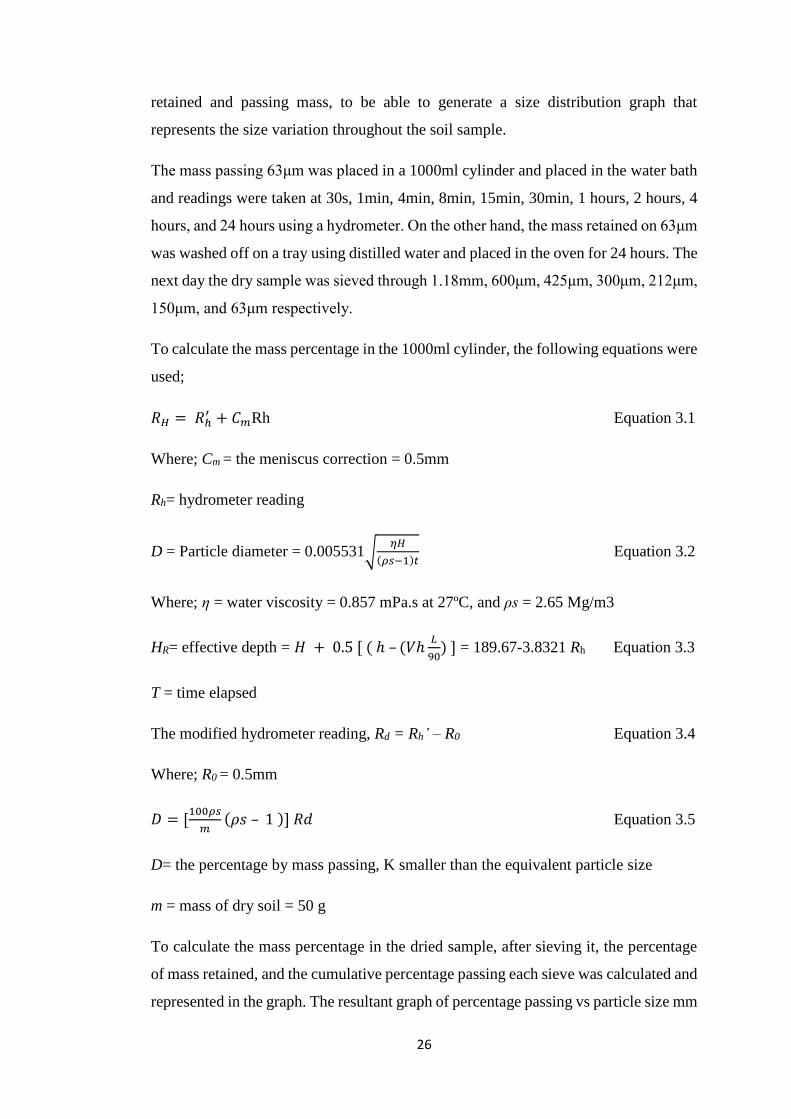
To calculate the mass percentage in the 1000ml cylinder, the following equations were
used;
𝑅𝐻 = 𝑅ℎ′ + 𝐶𝑚Rh Equation 3.1
Where; Cm = the meniscus correction = 0.5mm
Rh= hydrometer reading
D = Particle diameter = 0.005531√𝜂𝐻
(𝜌𝑠−1)𝑡 Equation 3.2
Where; η = water viscosity = 0.857 mPa.s at 27ºC, and ρs = 2.65 Mg/m3
HR= effective depth = 𝐻 + 0.5 [ ( ℎ – (𝑉ℎ𝐿
90) ] = 189.67-3.8321 Rh Equation 3.3
T = time elapsed
The modified hydrometer reading, Rd = Rh’ – R0 Equation 3.4
Where; R0 = 0.5mm
𝐷 = [100𝜌𝑠
𝑚(𝜌𝑠 – 1 )] 𝑅𝑑 Equation 3.5
D= the percentage by mass passing, K smaller than the equivalent particle size
m = mass of dry soil = 50 g
To calculate the mass percentage in the dried sample, after sieving it, the percentage
of mass retained, and the cumulative percentage passing each sieve was calculated and
represented in the graph. The resultant graph of percentage passing vs particle size mm
27
represents the size distribution for the entire 50 g sample. Starting from clay, then to
silt, to sandy size. The percentage of sand, silt, and clay was taken from the distribution
of the particle sizes in that graph.
3.3.2 Moisture Content
This test is performed to determine the water (moisture) content of soils by
oven drying method. The water content is the ratio, expressed as a percentage, of the
mass of “pore” or “free” water in a given mass of soil to the mass of the dry soil solids.
For many soils, the water content may be an extremely important index used for
establishing the relationship between the way a soil behaves and its properties. The
consistency of a fine-grained soil largely depends on its water content. Apparatus
required are:
Thermostatically controlled oven maintained at a temperature of 105ºC to
110ºC.
Scientific balance with a readability of 0.01g for specimens with mass of
200g and less, readability of 0.1g for specimens with mass over 200g.
Air-tight container made of non-corrodible material with lid
Tongs
The following calculation is used to calculate the water content:
𝑊 = 𝑊2−𝑊3
𝑊3−𝑊1∗ 100% Equation 3.6
Where W= Water content
W1= Weight of empty container with lid, g
W2= Weight of container + Wet soil, g
W3= Weight of container + Dry soil, g
28
3.3.3 Plasticity Index (Liquid Limit and Plastic Limit)
Atterberg Limit Test was done on the soil samples to obtain the liquid limit and
plastic limit. The Atterberg Limits are based on the moisture content of the soil. The
Liquid Limit, also known as the upper plastic limit, is the water content at which soil
changes from the liquid state to a plastic state. The Plastic Limit, also known as the
lower plastic limit, is the water content at which a soil changes from the plastic state
to a semisolid state.
To perform this test, a soil sample is placed into the cup of the liquid limit machine
and separated into two halves using a grooving tool. The crank on the machine is then
rotated so that the cup holding the sample strikes the base of the test machine. The
number of blows is recorded until the two halves flow together and close the groove.
Apparatus needed are:
Porcelain evaporating dish
Grooving tool and spatula
Distilled Water
Ground Glass Plate
Penetration Machine
Scientific Balance
To analyse the data for Liquid Limit:
1. The water content of each of the liquid limit moisture cans is calculated
after they have been in the oven for at least 16 hours.
2. The number of drops, N, is plotted (on the log scale) versus the water
content (w). The best-fit straight line through the plotted points is drawn
and the liquid limit (LL) is determined as the water content at 25 drops.
To analyse the data for Plastic Limit:
1. The water content of each of the plastic limit moisture cans
is calculated after they have been in the oven for at least 16 hours.
29
2. The average of the water contents is computed to determine the plastic
limit, PL.
3. The plasticity index is calculated
𝑃𝐼 = 𝐿𝐿 − 𝑃𝐿 Equation 3.7
Report the liquid limit, plastic limit, and plasticity index to the nearest
whole number, omitting the percent designation.
3.4 Electrical Resistivity Test
To prepare the soil for electrical resistivity test, all samples were stored in
airtight containers to reduce the absorption of moisture. The instruments needed for
the test are:
Two 100mm aluminium electrodes
200 volts DC power supply & handheld multimeter
For every specimen, 3 kg of soil were mixed with a certain amount of distilled water
according to the percentage of moisture content required which are 15%, 20%, 25%,
30% and 35%. Mixing of soil and distilled water was done using soil mixer. The
samples were then wrapped with plastic and left aside in the mixing bowl for 24 hours.
Prior to the compaction process, the internal perimeter of the mould was lined with a
thick plastic material for easy removal of the specimen once the mould is dissembled.
Also, during electrical resistivity test, the plastic material prevents the reading from
being affected by the mould which is made by steel. The specimens were then
compacted directly in the round mould in three equal layers using the standard
compaction machine. The number of blow is 27. The procedure for compaction is the
same as prescribed in BS 1377.
Upon completion of compaction, the mould was dissembled and the specimen was
placed between two circular aluminium electrodes for the purpose of determination of
electrical resistivity using disc electrode method in accordance with BS 1377. The
specimens along with the aluminium disc were connected to both the negative and
positive terminals of a DC power supply and in the same time connected to a
30
multimeter where an initial potential with varying voltages from 30V, 60V and 90V
were applied. The resulting values of current in ampere were then recorded and
calculated using equations. The resistivity of the soil can be calculated using the
formulas:
𝑅 =𝑉
𝐼 Equation 3.8
Where V= Voltage (v), I= Current, (A)
𝜌 = 𝑅 (𝐴
𝐿) Equation 3.9
Where A = cross-sectional area of the sample, i.e. the mould area, 𝐴 = 𝜋𝑟2 (m2), L=
Length of the mould (m) and 𝜌 = Resistivity
3.5 Shear Strength Determination
The Direct Shear Test is used for determination of the consolidated drained (or
undrained) shear strength of soils. The test is performed on three or four specimens
from a relatively undisturbed soil sample. A specimen is placed in a shear box which
has two stacked rings to hold the sample; the contact between the two rings is at
approximately the mid-height of the sample. A confining stress is applied vertically to
the specimen, and the upper ring is pulled laterally until the sample fails, or through a
specified strain. The load applied and the strain induced is recorded at frequent
intervals to determine a stress–strain curve for each confining stress. Several
specimens are tested at varying confining stresses to determine the shear strength
parameters, the soil cohesion (c) and the angle of internal friction, commonly known
as friction angle (𝜙). The results of the tests on each specimen are plotted on a graph
with the peak (or residual) stress on the y-axis and the confining stress on the x-axis.
From the plot, a straight-line approximation of the Mohr-Coulomb failure envelope
curve can be drawn, f may be determined, and, for cohesionless soils (c = 0), the shear
strength can be computed from the following equation:
𝑠 = 𝑠 tan 𝑓 Equation 3.10
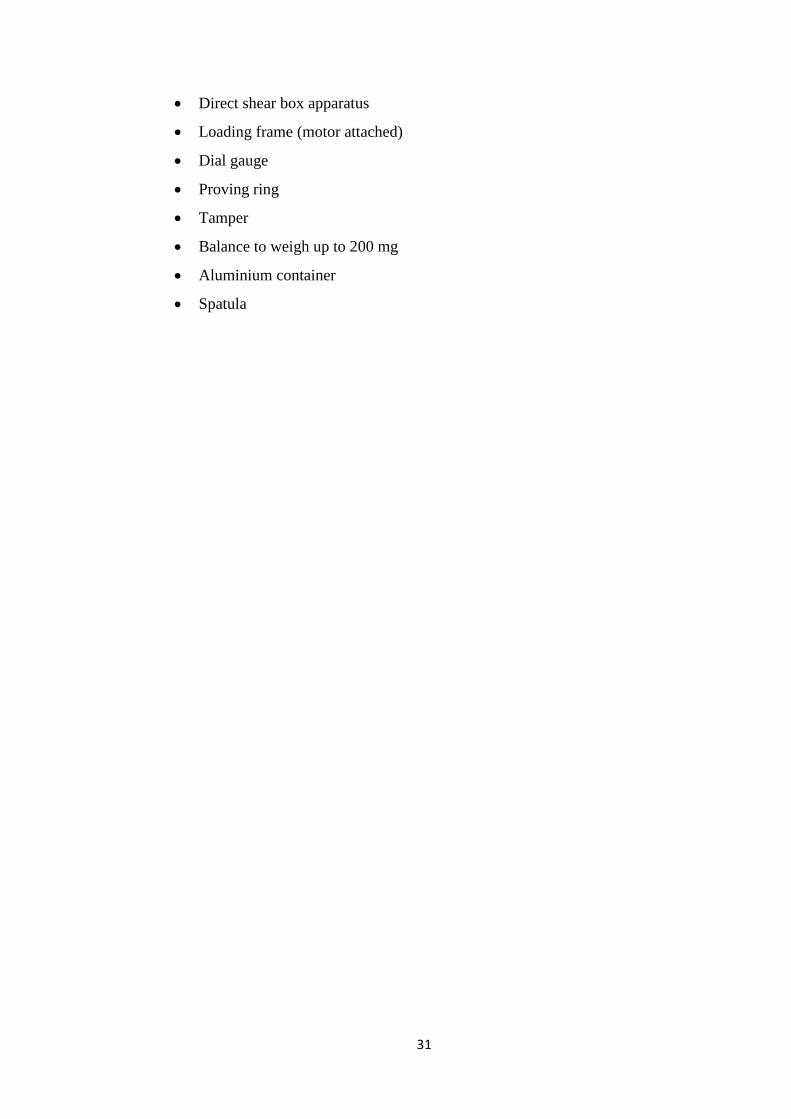
The apparatus needed for the test are:
31
Direct shear box apparatus
Loading frame (motor attached)
Dial gauge
Proving ring
Tamper
Balance to weigh up to 200 mg
Aluminium container
Spatula

32
3.6 Project Timeline
3.6.1 Final Year Project 1 (FYP 1)
TABLE 2: Timeline for FYP 1
Week Number
1 2 3 4 5 6 7 8 9 10 11 12 13 14 Activities
Selection of Project Topic
Briefing
Research on Required Tools & Equipments
Implement the Process of the Project
Searching for Soil Samples
Lab Safety Briefing
Submission of Extended Proposal
Proposal Defense
Particle Size Distribution Test
Plasticity Index (For all soil proportion)
Moisture Content = 25%
80% sand, 20 % silt
60% sand, 40 % silt
40% sand, 60 % silt
Submission of Interim Draft Report
Submission of Interim Report
Project Milestone and Process
Lab Work Milestone and Process
33
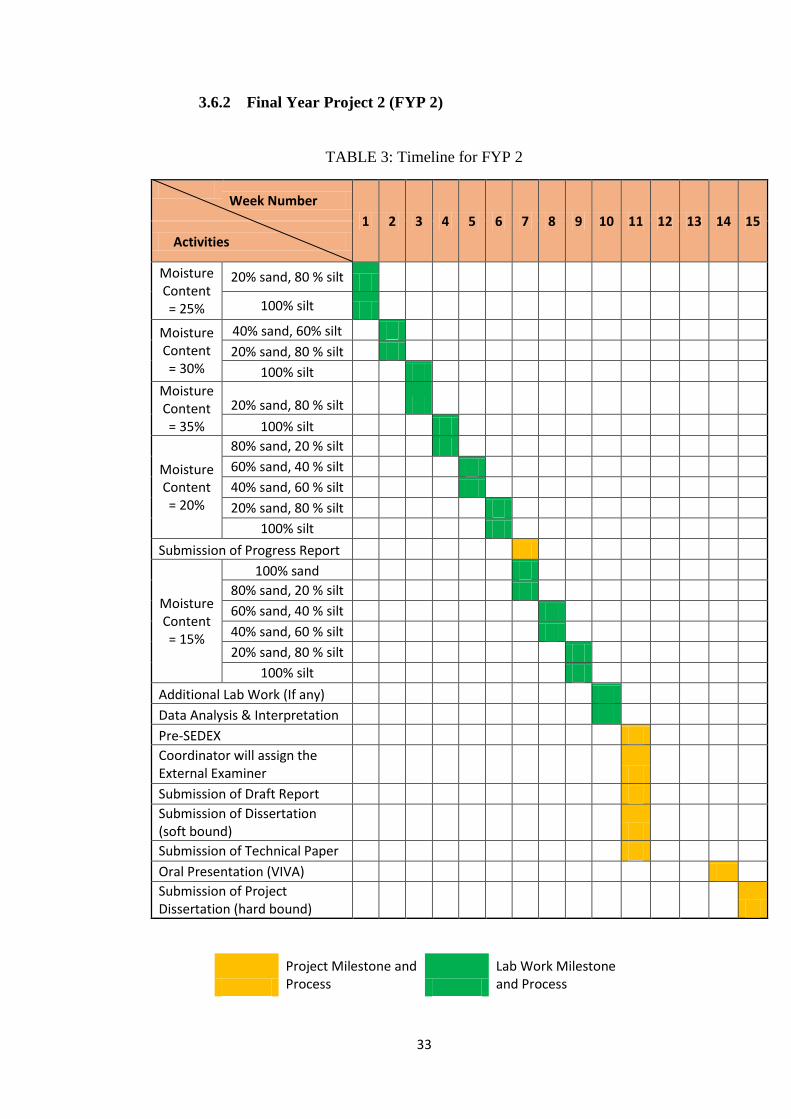
3.6.2 Final Year Project 2 (FYP 2)
TABLE 3: Timeline for FYP 2
Week Number
1 2 3 4 5 6 7 8 9 10 11 12 13 14 15
Activities
Moisture Content = 25%
20% sand, 80 % silt
100% silt
Moisture Content = 30%
40% sand, 60% silt
20% sand, 80 % silt
100% silt
Moisture Content = 35%
20% sand, 80 % silt
100% silt
Moisture Content = 20%
80% sand, 20 % silt
60% sand, 40 % silt
40% sand, 60 % silt
20% sand, 80 % silt
100% silt
Submission of Progress Report
Moisture Content = 15%
100% sand
80% sand, 20 % silt
60% sand, 40 % silt
40% sand, 60 % silt
20% sand, 80 % silt
100% silt
Additional Lab Work (If any)
Data Analysis & Interpretation
Pre-SEDEX
Coordinator will assign the External Examiner
Submission of Draft Report
Submission of Dissertation (soft bound)
Submission of Technical Paper
Oral Presentation (VIVA)
Submission of Project Dissertation (hard bound)
Project Milestone and Process
Lab Work Milestone and Process
34
CHAPTER 4
RESULTS & DISCUSSION
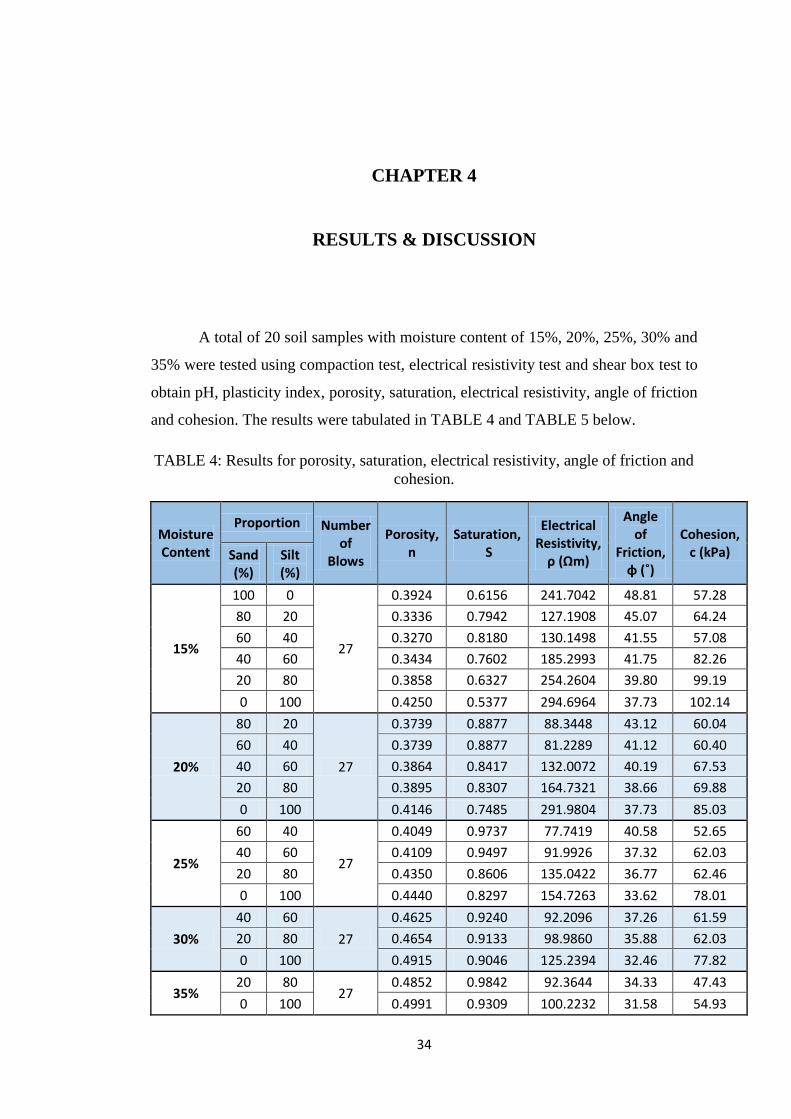
A total of 20 soil samples with moisture content of 15%, 20%, 25%, 30% and
35% were tested using compaction test, electrical resistivity test and shear box test to
obtain pH, plasticity index, porosity, saturation, electrical resistivity, angle of friction
and cohesion. The results were tabulated in TABLE 4 and TABLE 5 below.
TABLE 4: Results for porosity, saturation, electrical resistivity, angle of friction and
cohesion.
Moisture Content
Proportion Number of
Blows
Porosity, n
Saturation, S
Electrical Resistivity,
ρ (Ωm)
Angle of
Friction, φ (˚)
Cohesion, c (kPa) Sand
(%) Silt (%)
15%
100 0
27
0.3924 0.6156 241.7042 48.81 57.28
80 20 0.3336 0.7942 127.1908 45.07 64.24
60 40 0.3270 0.8180 130.1498 41.55 57.08
40 60 0.3434 0.7602 185.2993 41.75 82.26
20 80 0.3858 0.6327 254.2604 39.80 99.19
0 100 0.4250 0.5377 294.6964 37.73 102.14
20%
80 20
27
0.3739 0.8877 88.3448 43.12 60.04
60 40 0.3739 0.8877 81.2289 41.12 60.40
40 60 0.3864 0.8417 132.0072 40.19 67.53
20 80 0.3895 0.8307 164.7321 38.66 69.88
0 100 0.4146 0.7485 291.9804 37.73 85.03
25%
60 40
27
0.4049 0.9737 77.7419 40.58 52.65
40 60 0.4109 0.9497 91.9926 37.32 62.03
20 80 0.4350 0.8606 135.0422 36.77 62.46
0 100 0.4440 0.8297 154.7263 33.62 78.01
30%
40 60
27
0.4625 0.9240 92.2096 37.26 61.59
20 80 0.4654 0.9133 98.9860 35.88 62.03
0 100 0.4915 0.9046 125.2394 32.46 77.82
35% 20 80
27 0.4852 0.9842 92.3644 34.33 47.43
0 100 0.4991 0.9309 100.2232 31.58 54.93
35
TABLE 5: Results for pH and plasticity index.
Proportion pH
Plasticity Index, PI Sand (%) Silt (%)
100 0 6.15 0
80 20 5.72 0.3
60 40 5.37 6.6
40 60 4.92 5.34
20 80 4.29 4.3
0 100 4.15 12.04
From TABLE 4 above, only soil sample with moisture content of 15% can be
tested for all 6 proportion of sand and silt. For other moisture contents, some
proportion of sand and silt cannot be tested because the samples turn out to be too
watery, therefore electrical resistivity test and shear box test cannot be performed.
4.1 Graph of Porosity, Saturation, Angle of Friction, Cohesion and Electrical
Resistivity versus Proportion of Sand and Silt
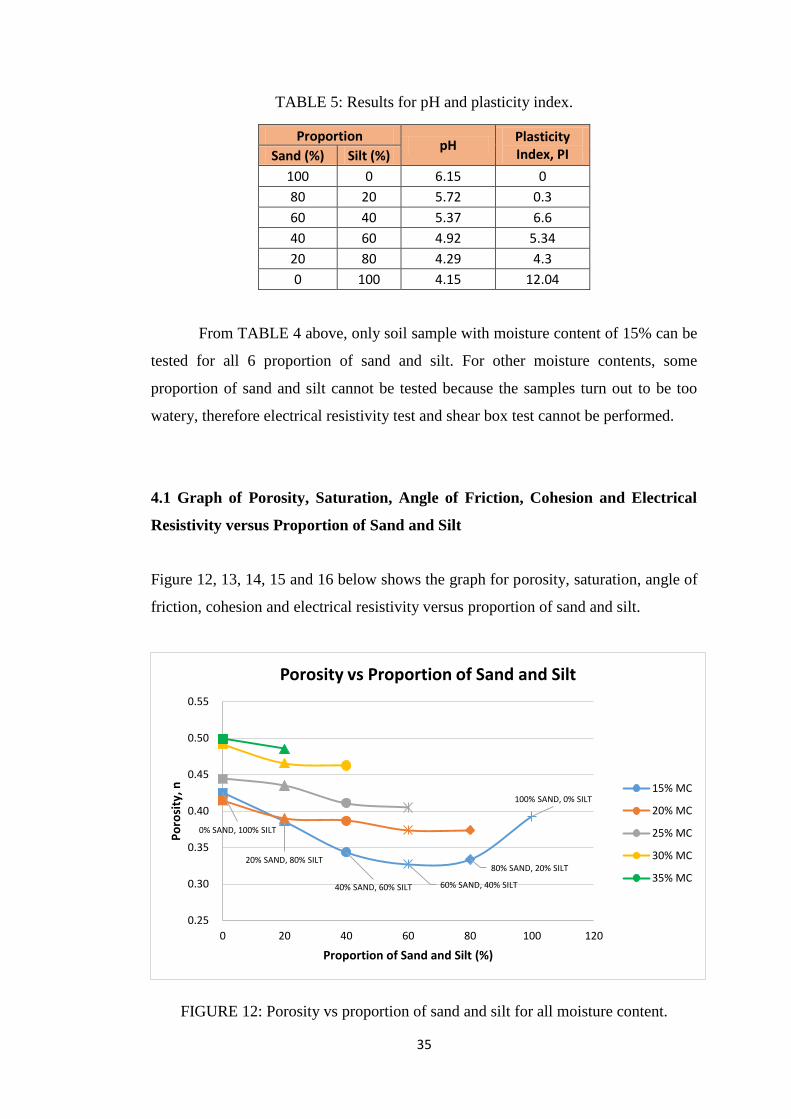
Figure 12, 13, 14, 15 and 16 below shows the graph for porosity, saturation, angle of
friction, cohesion and electrical resistivity versus proportion of sand and silt.
FIGURE 12: Porosity vs proportion of sand and silt for all moisture content.
100% SAND, 0% SILT
80% SAND, 20% SILT
60% SAND, 40% SILT40% SAND, 60% SILT
20% SAND, 80% SILT
0% SAND, 100% SILT
0.25
0.30
0.35
0.40
0.45
0.50
0.55
0 20 40 60 80 100 120
Po
rosi
ty, n
Proportion of Sand and Silt (%)
Porosity vs Proportion of Sand and Silt
15% MC
20% MC
25% MC
30% MC
35% MC
36
FIGURE 12 shows the relationship between porosity and proportion of sand
for all moisture content. It can be seen that the trend shows porosity decreases as
proportion of sand decreases and silt increases. Fleming (n.d.) stated that porosity is
inversely proportional to grain size. Silt and clay that is composed of finer grains have
a considerably greater volume of open spaces than sand and gravel which composed
of coarse grains. As the range in grain sizes getting wider, the resulting porosity is
lower. This explains the relationship portrayed in FIGURE 12.
In addition, for the same proportion of sand and silt but with the increasing of moisture
content, porosity increases. According to Nimmo (2004), porosity indicates the
amount of space available to fluid within a specific body of soil. Therefore, when
porosity is higher, more water can be filled within the pores. The result for moisture
content of 15% shows inconsistency due to increment in porosity at 80% sand and
20% silt. This behaviour might occur due to the low water content causing it harder to
facilitate the movement of soil particles during compaction.
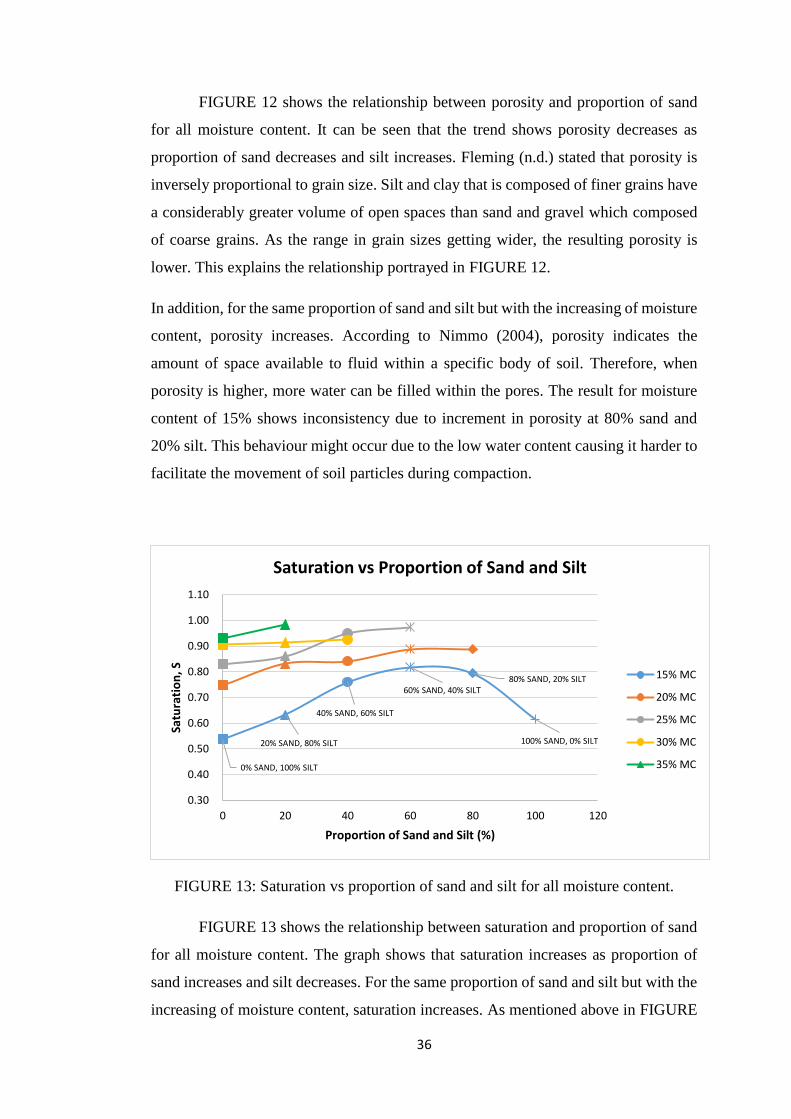
FIGURE 13: Saturation vs proportion of sand and silt for all moisture content.
FIGURE 13 shows the relationship between saturation and proportion of sand
for all moisture content. The graph shows that saturation increases as proportion of
sand increases and silt decreases. For the same proportion of sand and silt but with the
increasing of moisture content, saturation increases. As mentioned above in FIGURE
100% SAND, 0% SILT
80% SAND, 20% SILT60% SAND, 40% SILT
40% SAND, 60% SILT
20% SAND, 80% SILT
0% SAND, 100% SILT
0.30
0.40
0.50
0.60
0.70
0.80
0.90
1.00
1.10
0 20 40 60 80 100 120
Satu
rati
on
, S
Proportion of Sand and Silt (%)
Saturation vs Proportion of Sand and Silt
15% MC
20% MC
25% MC
30% MC
35% MC
37
12, the result for moisture content of 15% shows inconsistency due to the low water
content.
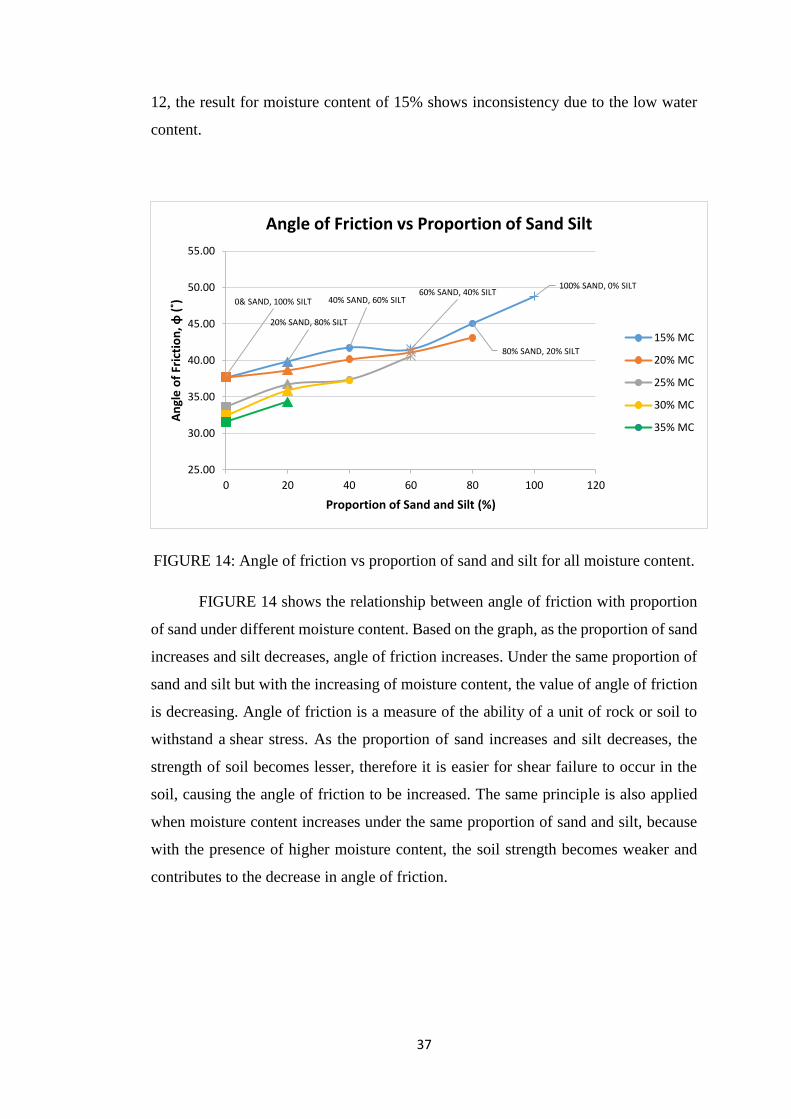
FIGURE 14: Angle of friction vs proportion of sand and silt for all moisture content.
FIGURE 14 shows the relationship between angle of friction with proportion
of sand under different moisture content. Based on the graph, as the proportion of sand
increases and silt decreases, angle of friction increases. Under the same proportion of
sand and silt but with the increasing of moisture content, the value of angle of friction
is decreasing. Angle of friction is a measure of the ability of a unit of rock or soil to
withstand a shear stress. As the proportion of sand increases and silt decreases, the
strength of soil becomes lesser, therefore it is easier for shear failure to occur in the
soil, causing the angle of friction to be increased. The same principle is also applied
when moisture content increases under the same proportion of sand and silt, because
with the presence of higher moisture content, the soil strength becomes weaker and
contributes to the decrease in angle of friction.
100% SAND, 0% SILT
80% SAND, 20% SILT
60% SAND, 40% SILT40% SAND, 60% SILT
20% SAND, 80% SILT
0& SAND, 100% SILT
25.00
30.00
35.00
40.00
45.00
50.00
55.00
0 20 40 60 80 100 120
An
gle
of
Fric
tio
n, φ
(˚)
Proportion of Sand and Silt (%)
Angle of Friction vs Proportion of Sand Silt
15% MC
20% MC
25% MC
30% MC
35% MC
38
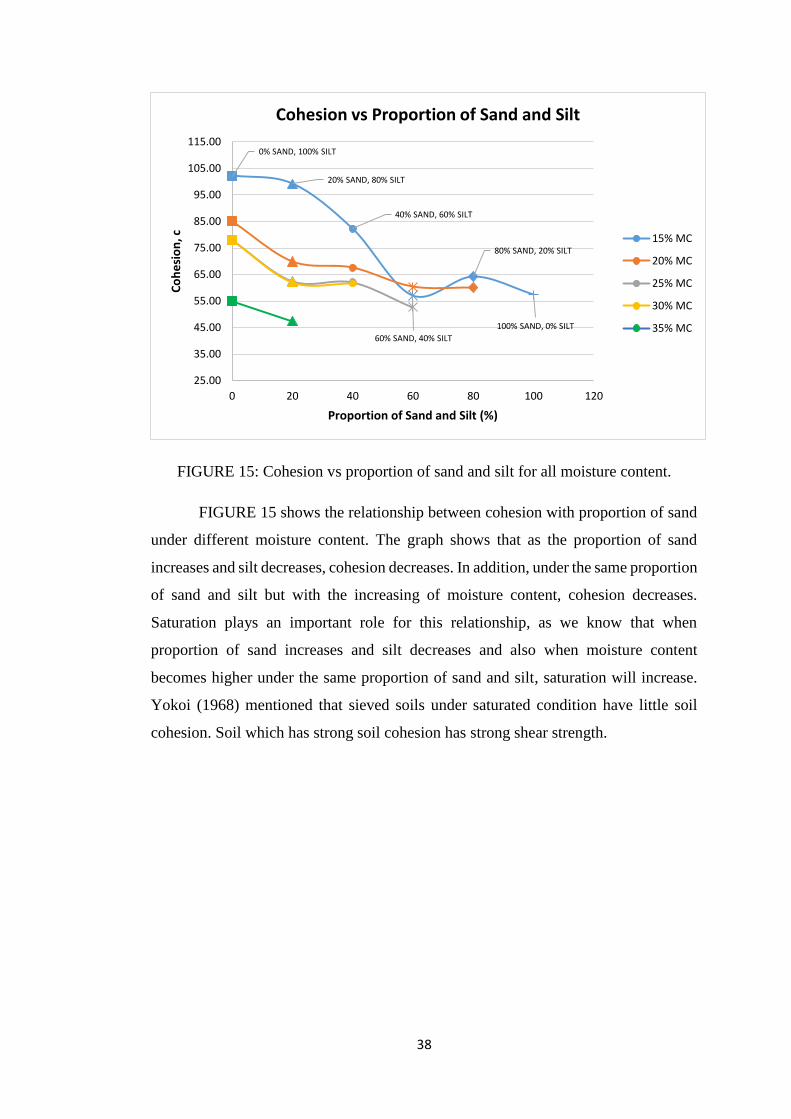
FIGURE 15: Cohesion vs proportion of sand and silt for all moisture content.
FIGURE 15 shows the relationship between cohesion with proportion of sand
under different moisture content. The graph shows that as the proportion of sand
increases and silt decreases, cohesion decreases. In addition, under the same proportion
of sand and silt but with the increasing of moisture content, cohesion decreases.
Saturation plays an important role for this relationship, as we know that when
proportion of sand increases and silt decreases and also when moisture content
becomes higher under the same proportion of sand and silt, saturation will increase.
Yokoi (1968) mentioned that sieved soils under saturated condition have little soil
cohesion. Soil which has strong soil cohesion has strong shear strength.
100% SAND, 0% SILT
80% SAND, 20% SILT
60% SAND, 40% SILT
40% SAND, 60% SILT
20% SAND, 80% SILT
0% SAND, 100% SILT
25.00
35.00
45.00
55.00
65.00
75.00
85.00
95.00
105.00
115.00
0 20 40 60 80 100 120
Co
he
sio
n, c
Proportion of Sand and Silt (%)
Cohesion vs Proportion of Sand and Silt
15% MC
20% MC
25% MC
30% MC
35% MC
39
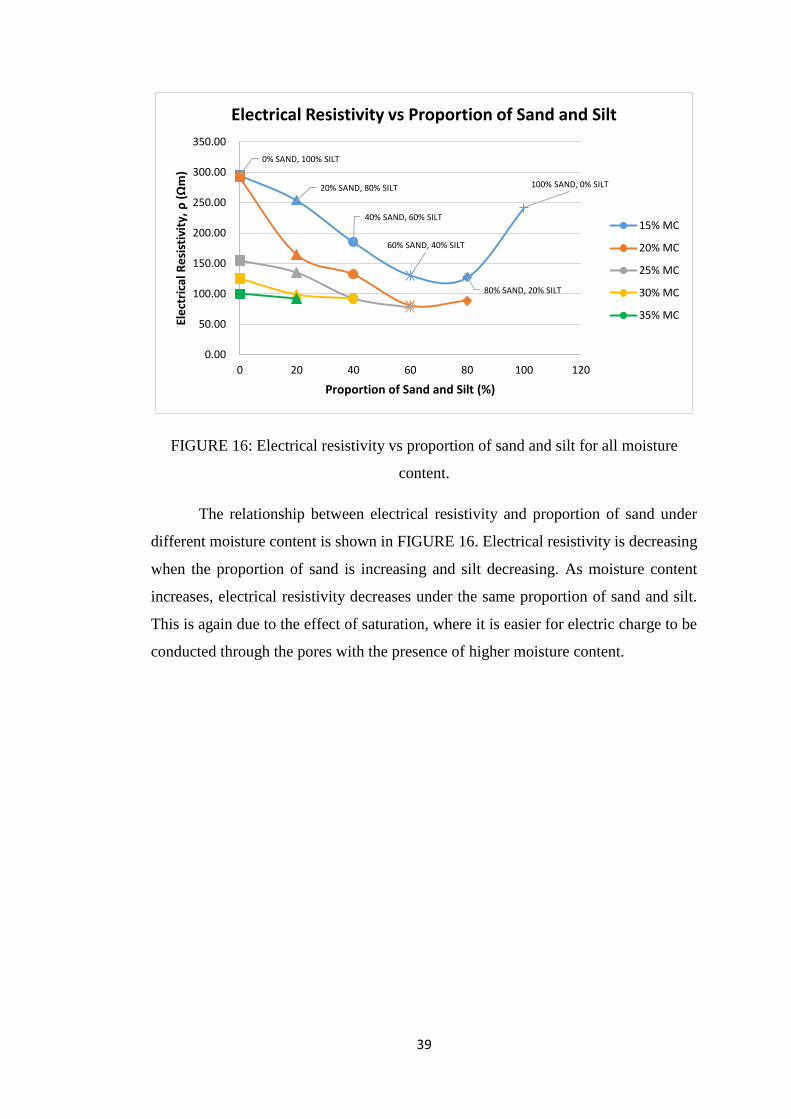
FIGURE 16: Electrical resistivity vs proportion of sand and silt for all moisture
content.
The relationship between electrical resistivity and proportion of sand under
different moisture content is shown in FIGURE 16. Electrical resistivity is decreasing
when the proportion of sand is increasing and silt decreasing. As moisture content
increases, electrical resistivity decreases under the same proportion of sand and silt.
This is again due to the effect of saturation, where it is easier for electric charge to be
conducted through the pores with the presence of higher moisture content.
100% SAND, 0% SILT
80% SAND, 20% SILT
60% SAND, 40% SILT
40% SAND, 60% SILT
20% SAND, 80% SILT
0% SAND, 100% SILT
0.00
50.00
100.00
150.00
200.00
250.00
300.00
350.00
0 20 40 60 80 100 120
Ele
ctri
cal R
esi
stiv
ity,
ρ (
Ωm
)
Proportion of Sand and Silt (%)
Electrical Resistivity vs Proportion of Sand and Silt
15% MC
20% MC
25% MC
30% MC
35% MC
40
4.2 Graph of Electrical Resistivity versus Porosity, Saturation, Angle of Friction
and Cohesion
Figure 17, 18, 19, and 20 below shows the graph for electrical resistivity versus
porosity, saturation, angle of friction and cohesion.
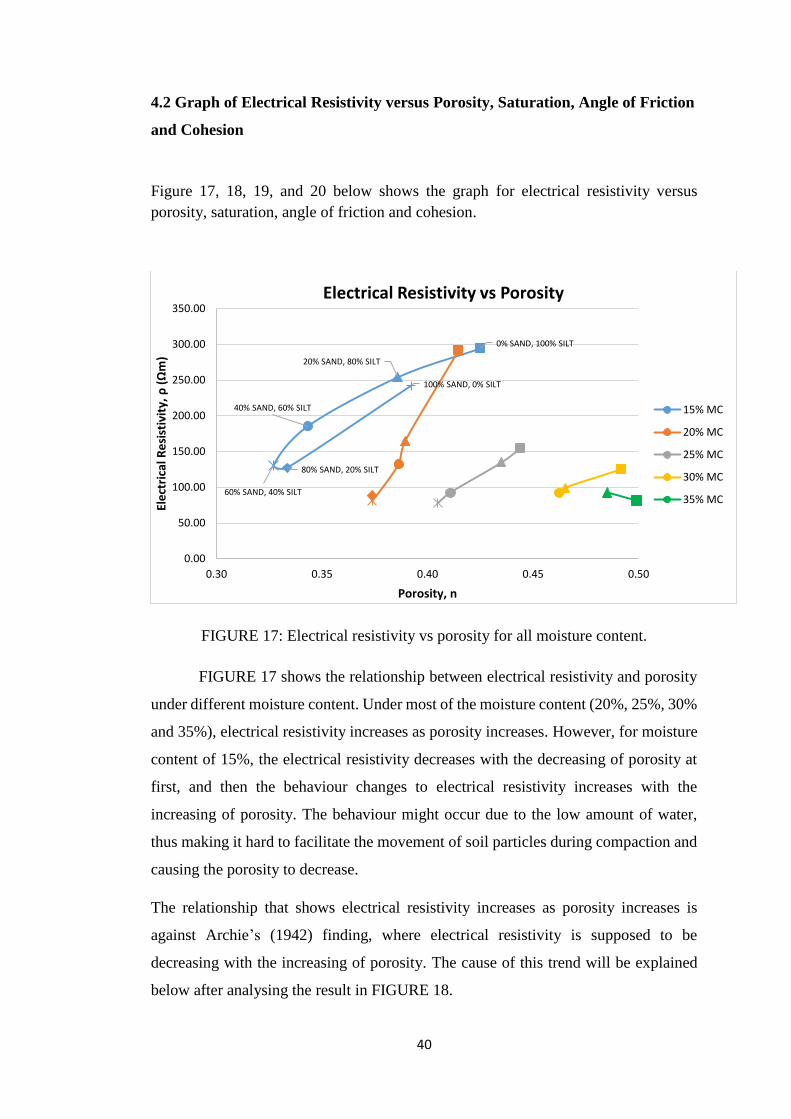
FIGURE 17: Electrical resistivity vs porosity for all moisture content.
FIGURE 17 shows the relationship between electrical resistivity and porosity
under different moisture content. Under most of the moisture content (20%, 25%, 30%
and 35%), electrical resistivity increases as porosity increases. However, for moisture
content of 15%, the electrical resistivity decreases with the decreasing of porosity at
first, and then the behaviour changes to electrical resistivity increases with the
increasing of porosity. The behaviour might occur due to the low amount of water,
thus making it hard to facilitate the movement of soil particles during compaction and
causing the porosity to decrease.
The relationship that shows electrical resistivity increases as porosity increases is
against Archie’s (1942) finding, where electrical resistivity is supposed to be
decreasing with the increasing of porosity. The cause of this trend will be explained
below after analysing the result in FIGURE 18.
100% SAND, 0% SILT
80% SAND, 20% SILT
60% SAND, 40% SILT
40% SAND, 60% SILT
20% SAND, 80% SILT
0% SAND, 100% SILT
0.00
50.00
100.00
150.00
200.00
250.00
300.00
350.00
0.30 0.35 0.40 0.45 0.50
Ele
ctri
cal R
esi
stiv
ity,
ρ (
Ωm
)
Porosity, n
Electrical Resistivity vs Porosity
15% MC
20% MC
25% MC
30% MC
35% MC
41
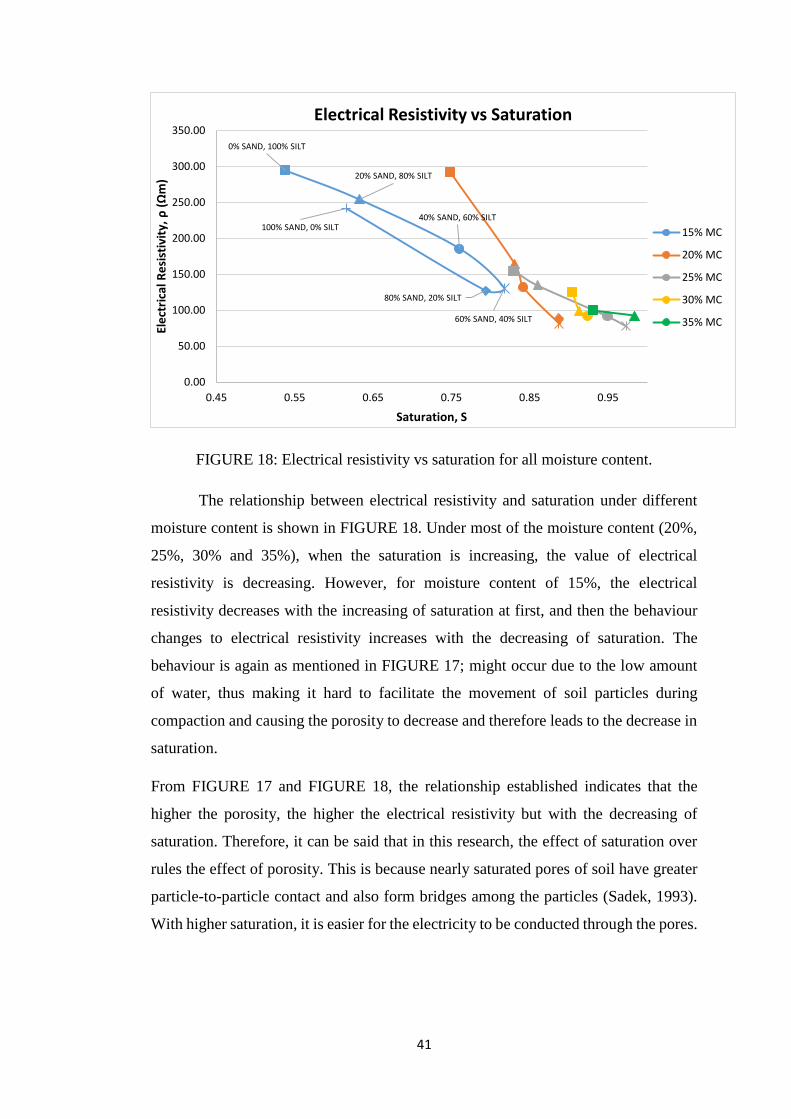
FIGURE 18: Electrical resistivity vs saturation for all moisture content.
The relationship between electrical resistivity and saturation under different
moisture content is shown in FIGURE 18. Under most of the moisture content (20%,
25%, 30% and 35%), when the saturation is increasing, the value of electrical
resistivity is decreasing. However, for moisture content of 15%, the electrical
resistivity decreases with the increasing of saturation at first, and then the behaviour
changes to electrical resistivity increases with the decreasing of saturation. The
behaviour is again as mentioned in FIGURE 17; might occur due to the low amount
of water, thus making it hard to facilitate the movement of soil particles during
compaction and causing the porosity to decrease and therefore leads to the decrease in
saturation.
From FIGURE 17 and FIGURE 18, the relationship established indicates that the
higher the porosity, the higher the electrical resistivity but with the decreasing of
saturation. Therefore, it can be said that in this research, the effect of saturation over
rules the effect of porosity. This is because nearly saturated pores of soil have greater
particle-to-particle contact and also form bridges among the particles (Sadek, 1993).
With higher saturation, it is easier for the electricity to be conducted through the pores.
100% SAND, 0% SILT
80% SAND, 20% SILT
60% SAND, 40% SILT
40% SAND, 60% SILT
20% SAND, 80% SILT
0% SAND, 100% SILT
0.00
50.00
100.00
150.00
200.00
250.00
300.00
350.00
0.45 0.55 0.65 0.75 0.85 0.95
Ele
ctri
cal R
esi
stiv
ity,
ρ (
Ωm
)
Saturation, S
Electrical Resistivity vs Saturation
15% MC
20% MC
25% MC
30% MC
35% MC
42
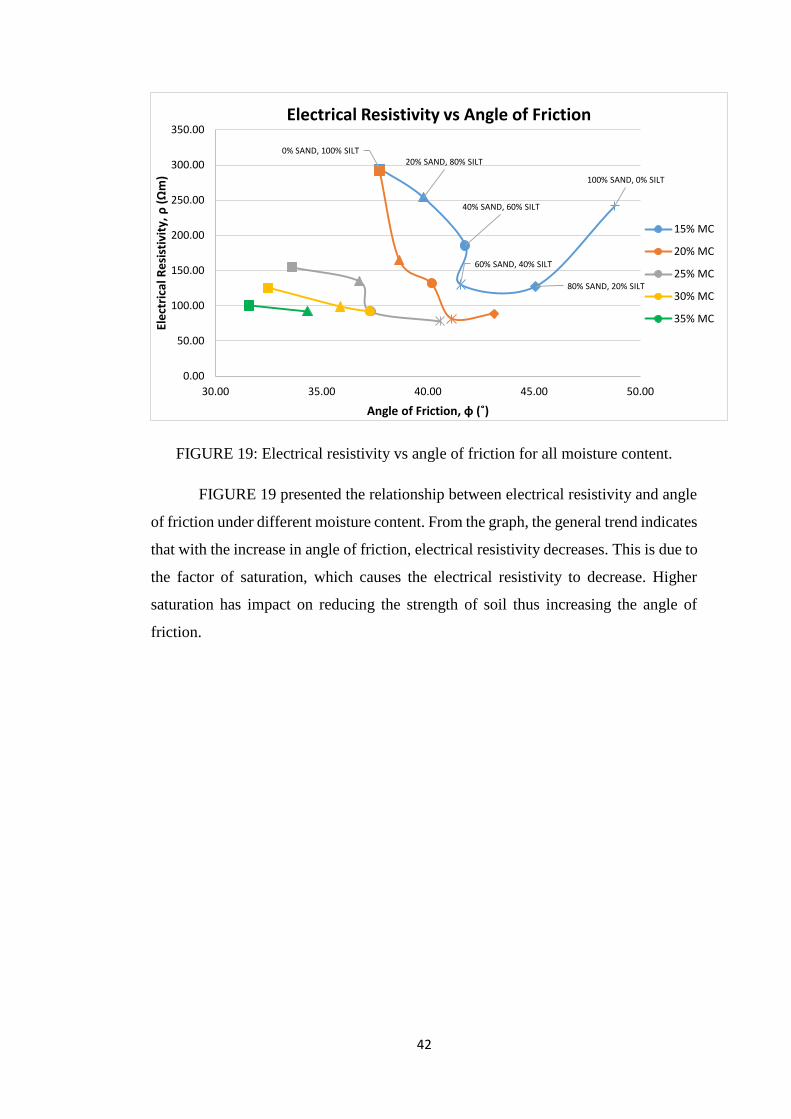
FIGURE 19: Electrical resistivity vs angle of friction for all moisture content.
FIGURE 19 presented the relationship between electrical resistivity and angle
of friction under different moisture content. From the graph, the general trend indicates
that with the increase in angle of friction, electrical resistivity decreases. This is due to
the factor of saturation, which causes the electrical resistivity to decrease. Higher
saturation has impact on reducing the strength of soil thus increasing the angle of
friction.
100% SAND, 0% SILT
80% SAND, 20% SILT
60% SAND, 40% SILT
40% SAND, 60% SILT
20% SAND, 80% SILT0% SAND, 100% SILT
0.00
50.00
100.00
150.00
200.00
250.00
300.00
350.00
30.00 35.00 40.00 45.00 50.00
Ele
ctri
cal R
esi
stiv
ity,
ρ (
Ωm
)
Angle of Friction, φ (˚)
Electrical Resistivity vs Angle of Friction
15% MC
20% MC
25% MC
30% MC
35% MC
43
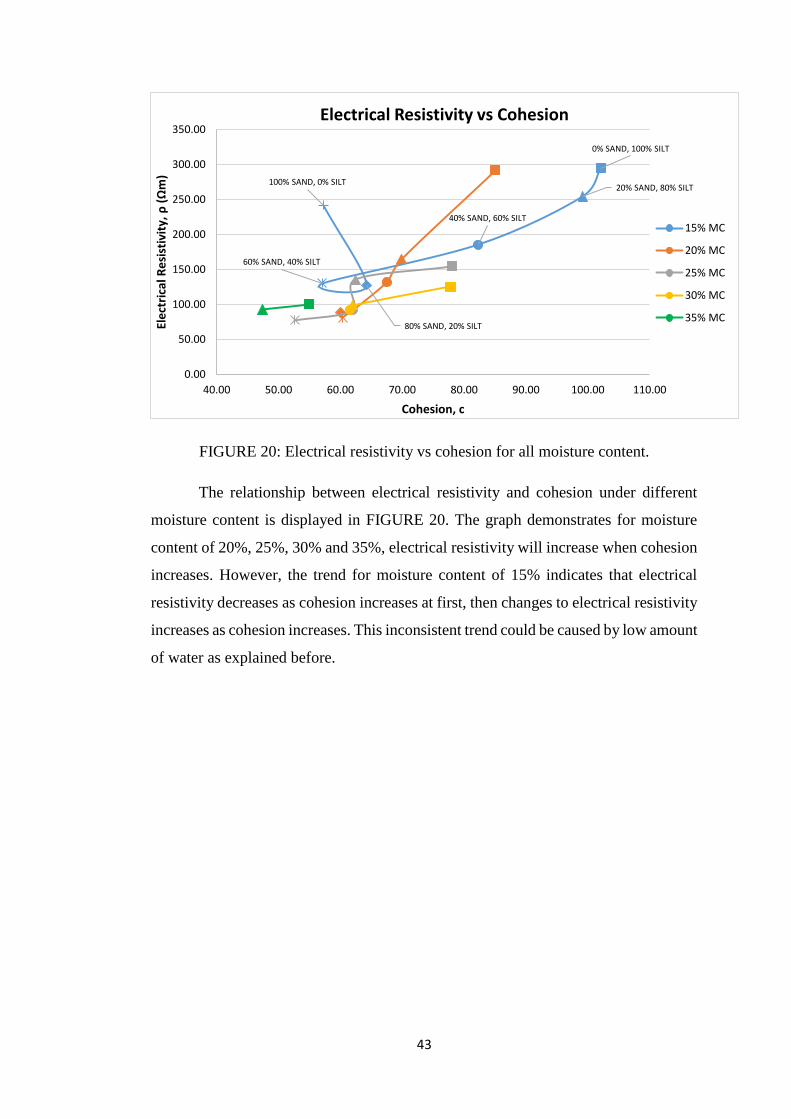
FIGURE 20: Electrical resistivity vs cohesion for all moisture content.
The relationship between electrical resistivity and cohesion under different
moisture content is displayed in FIGURE 20. The graph demonstrates for moisture
content of 20%, 25%, 30% and 35%, electrical resistivity will increase when cohesion
increases. However, the trend for moisture content of 15% indicates that electrical
resistivity decreases as cohesion increases at first, then changes to electrical resistivity
increases as cohesion increases. This inconsistent trend could be caused by low amount
of water as explained before.
100% SAND, 0% SILT
80% SAND, 20% SILT
60% SAND, 40% SILT
40% SAND, 60% SILT
20% SAND, 80% SILT
0% SAND, 100% SILT
0.00
50.00
100.00
150.00
200.00
250.00
300.00
350.00
40.00 50.00 60.00 70.00 80.00 90.00 100.00 110.00
Ele
ctri
cal R
esi
stiv
ity,
ρ (
Ωm
)
Cohesion, c
Electrical Resistivity vs Cohesion
15% MC
20% MC
25% MC
30% MC
35% MC
44
4.3 Correlation of Electrical Resistivity versus Porosity, Saturation, Angle of
Friction and Cohesion for All Soil Samples
Figure 21, 22, 23 and 24 below shows the correlation of electrical resistivity versus
porosity, saturation, angle of friction and cohesion for all soil samples
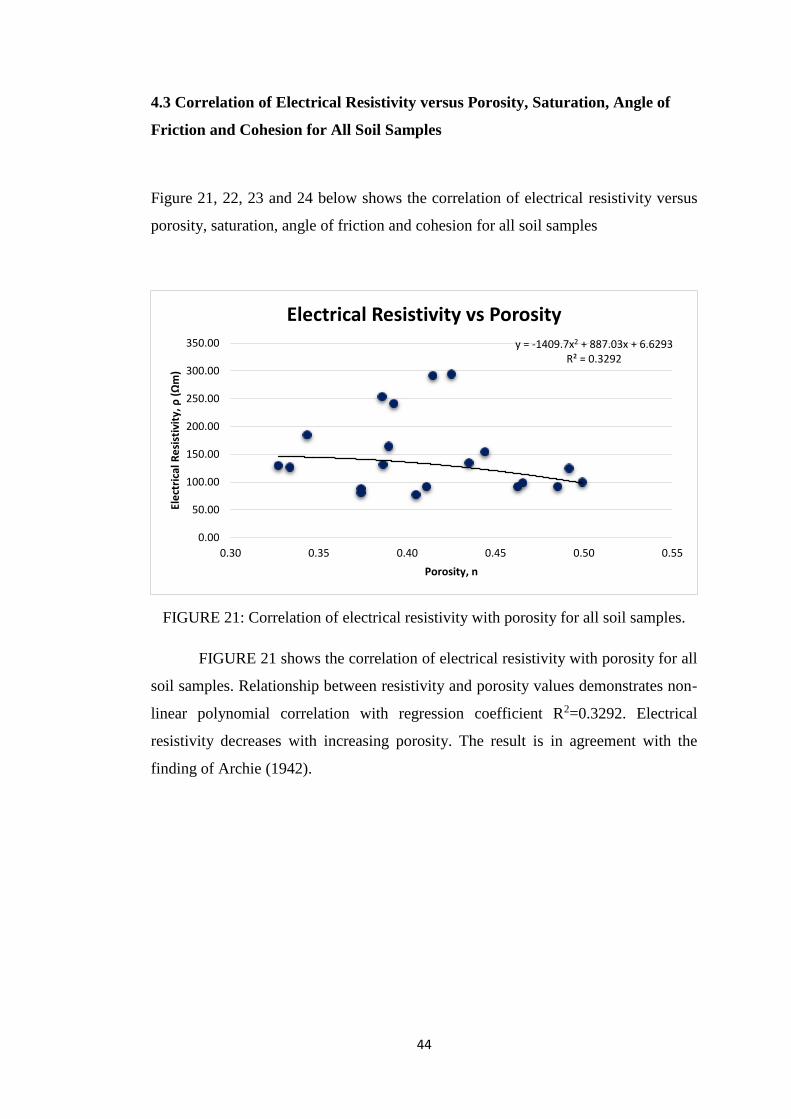
FIGURE 21: Correlation of electrical resistivity with porosity for all soil samples.
FIGURE 21 shows the correlation of electrical resistivity with porosity for all
soil samples. Relationship between resistivity and porosity values demonstrates non-
linear polynomial correlation with regression coefficient R2=0.3292. Electrical
resistivity decreases with increasing porosity. The result is in agreement with the
finding of Archie (1942).
y = -1409.7x2 + 887.03x + 6.6293R² = 0.3292
0.00
50.00
100.00
150.00
200.00
250.00
300.00
350.00
0.30 0.35 0.40 0.45 0.50 0.55
Ele
ctri
cal R
esi
stiv
ity,
ρ (
Ωm
)
Porosity, n
Electrical Resistivity vs Porosity
45
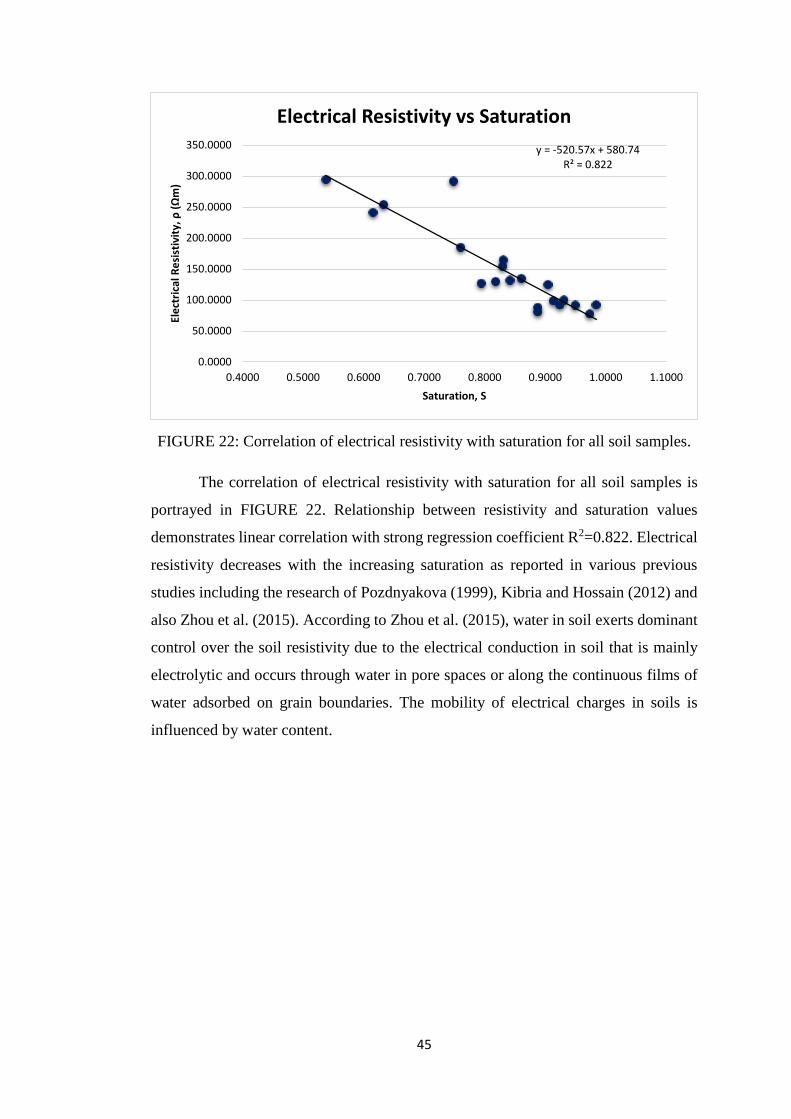
FIGURE 22: Correlation of electrical resistivity with saturation for all soil samples.
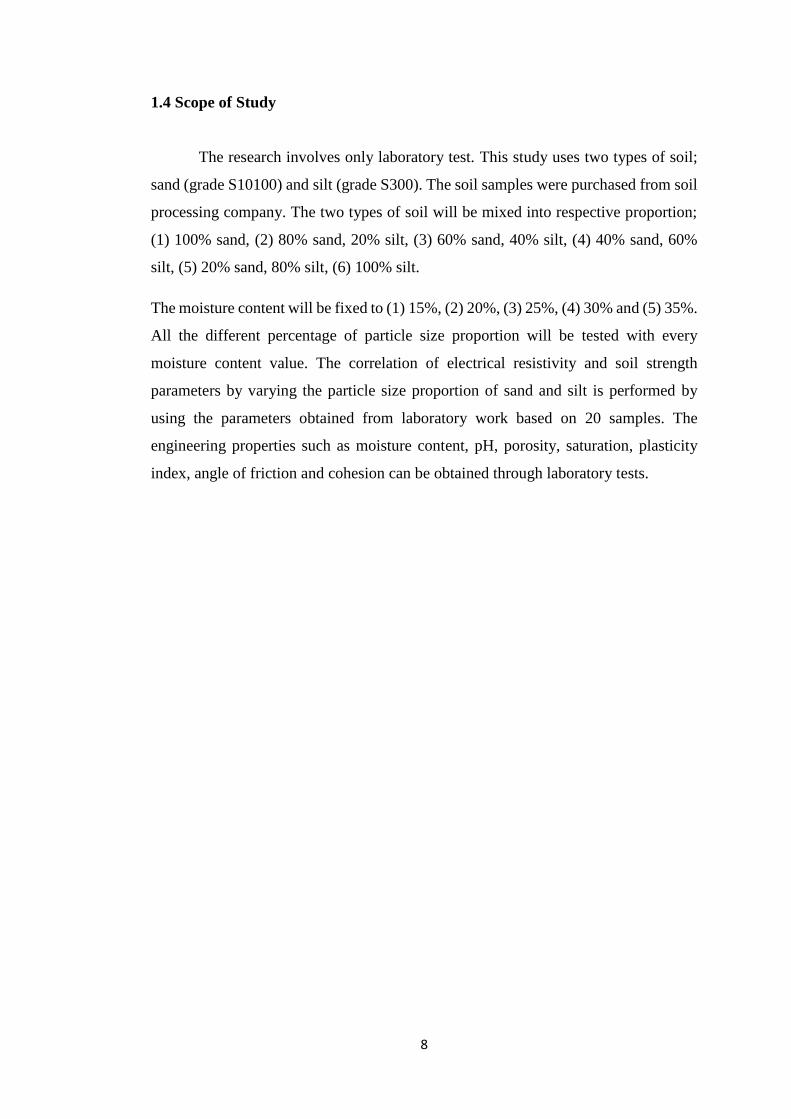
The correlation of electrical resistivity with saturation for all soil samples is
portrayed in FIGURE 22. Relationship between resistivity and saturation values
demonstrates linear correlation with strong regression coefficient R2=0.822. Electrical
resistivity decreases with the increasing saturation as reported in various previous
studies including the research of Pozdnyakova (1999), Kibria and Hossain (2012) and
also Zhou et al. (2015). According to Zhou et al. (2015), water in soil exerts dominant
control over the soil resistivity due to the electrical conduction in soil that is mainly
electrolytic and occurs through water in pore spaces or along the continuous films of
water adsorbed on grain boundaries. The mobility of electrical charges in soils is
influenced by water content.
y = -520.57x + 580.74R² = 0.822
0.0000
50.0000
100.0000
150.0000
200.0000
250.0000
300.0000
350.0000
0.4000 0.5000 0.6000 0.7000 0.8000 0.9000 1.0000 1.1000
Ele
ctri
cal R
esi
stiv
ity,
ρ (
Ωm
)
Saturation, S
Electrical Resistivity vs Saturation
46
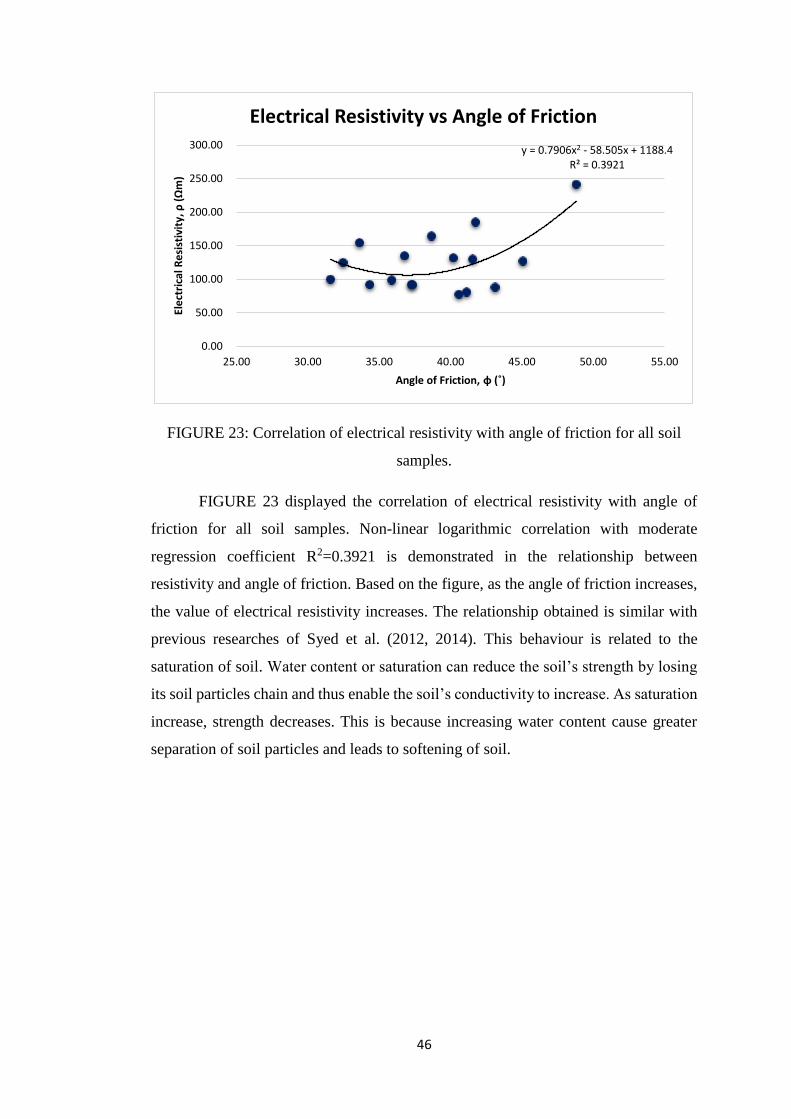
FIGURE 23: Correlation of electrical resistivity with angle of friction for all soil
samples.
FIGURE 23 displayed the correlation of electrical resistivity with angle of
friction for all soil samples. Non-linear logarithmic correlation with moderate
regression coefficient R2=0.3921 is demonstrated in the relationship between
resistivity and angle of friction. Based on the figure, as the angle of friction increases,
the value of electrical resistivity increases. The relationship obtained is similar with
previous researches of Syed et al. (2012, 2014). This behaviour is related to the
saturation of soil. Water content or saturation can reduce the soil’s strength by losing
its soil particles chain and thus enable the soil’s conductivity to increase. As saturation
increase, strength decreases. This is because increasing water content cause greater
separation of soil particles and leads to softening of soil.
y = 0.7906x2 - 58.505x + 1188.4R² = 0.3921
0.00
50.00
100.00
150.00
200.00
250.00
300.00
25.00 30.00 35.00 40.00 45.00 50.00 55.00
Ele
ctri
cal R
esi
stiv
ity,
ρ (
Ωm
)
Angle of Friction, φ (˚)
Electrical Resistivity vs Angle of Friction
47
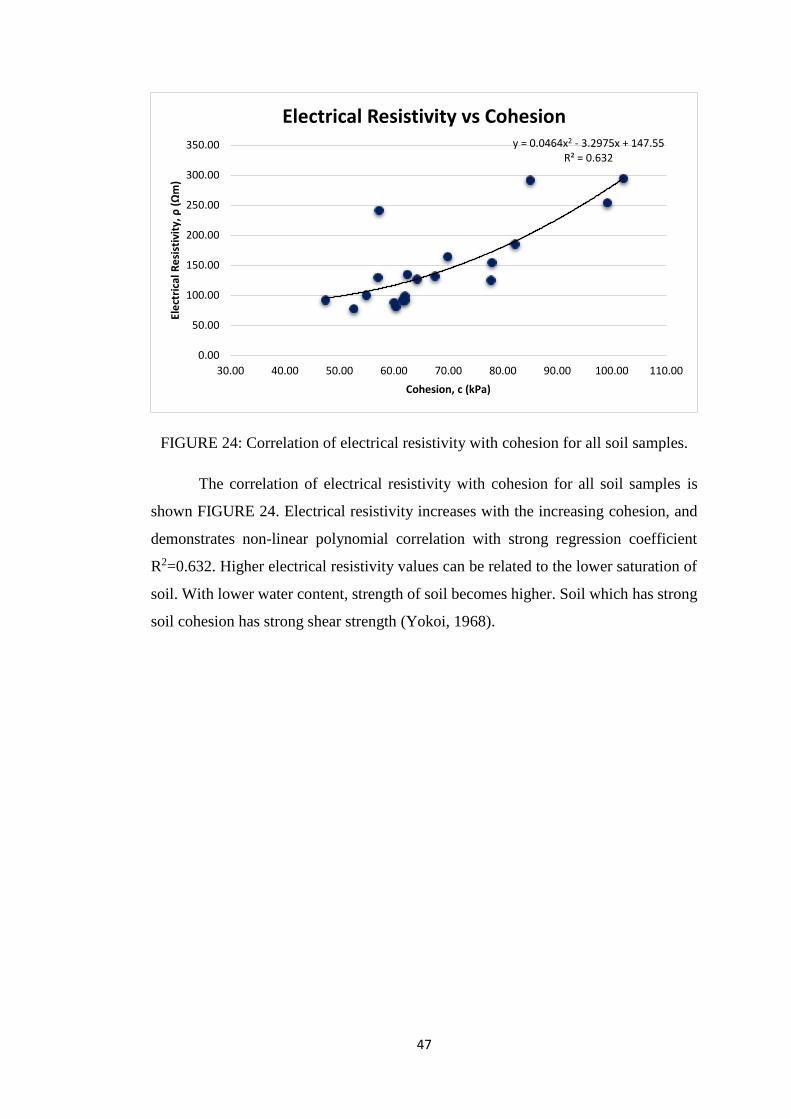
FIGURE 24: Correlation of electrical resistivity with cohesion for all soil samples.
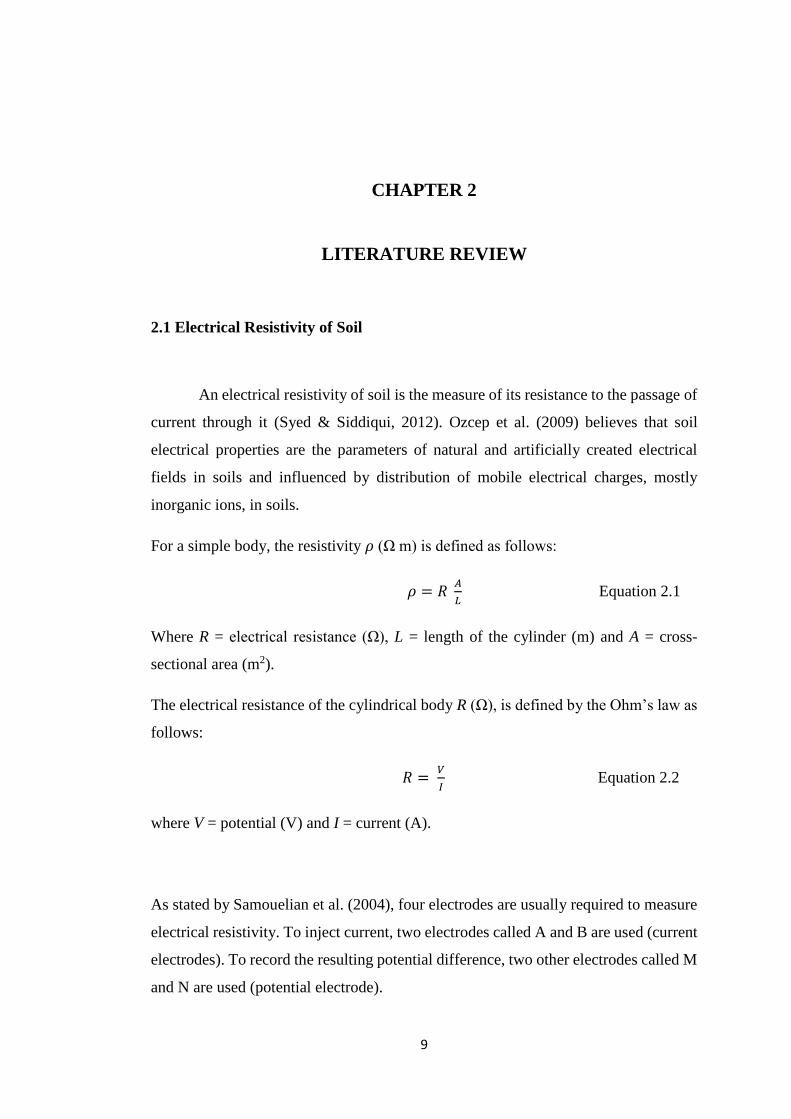
The correlation of electrical resistivity with cohesion for all soil samples is
shown FIGURE 24. Electrical resistivity increases with the increasing cohesion, and
demonstrates non-linear polynomial correlation with strong regression coefficient
R2=0.632. Higher electrical resistivity values can be related to the lower saturation of
soil. With lower water content, strength of soil becomes higher. Soil which has strong
soil cohesion has strong shear strength (Yokoi, 1968).
y = 0.0464x2 - 3.2975x + 147.55R² = 0.632
0.00
50.00
100.00
150.00
200.00
250.00
300.00
350.00
30.00 40.00 50.00 60.00 70.00 80.00 90.00 100.00 110.00
Ele
ctri
cal R
esi
stiv
ity,
ρ (
Ωm
)
Cohesion, c (kPa)
Electrical Resistivity vs Cohesion
48
CHAPTER 5
CONCLUSION AND RECOMMENDATION
The objective of this study is to estimate the relationship between electrical
resistivity with porosity, saturation and soil strength parameters by varying the particle
size proportion for mixed sand and silt samples. The relationship obtained between
electrical resistivity and porosity for all points is electrical resistivity decreases with
increasing porosity with moderate regression coefficient R2=0.3292. The result is in
agreement with the finding of Archie (1942). Looking at the relationship between
electrical resistivity and saturation for all points, the relationship obtained is electrical
resistivity decreases with the increasing of saturation with good regression coefficient
R2=0.822. The result obtained is similar with the previous reports and studies. Overall,
when analysed according to different moisture content, the trend established in this
study were the higher the porosity, the higher the electrical resistivity but with the
decreasing of saturation. This is in contrast with general understanding that the higher
the porosity, the lower the electrical resistivity. Therefore, it can be concluded that in
this research, the effect of saturation over rules the effect of porosity. With higher
amount of water, it is easier for the electricity to be conducted through the pores. This
is because nearly saturated pores of soil have greater particle-to-particle contact and
also form bridges among the particles (Sadek, 1993).
On the other hand, the relationship between electrical resistivity and angle of friction
for all points indicates that the electrical resistivity increases as angle of friction
increases with moderate regression coefficient R2=0.3921. Meanwhile, moderate
correlation between electrical resistivity and cohesion is obtained with good regression
coefficient R2=0.632. Electrical resistivity increases with the increasing cohesion as
reported in various previous studies.
49
In conclusion, the correlation and relationship between porosity, saturation and soil
strength parameters (angle of friction and cohesion) by varying the particle size
proportion for mixed sand and silt samples has been established in this research.
Further tests need to be done to increase more understandings and findings, as well as
to establish more generalized and precise correlation between strength properties and
electrical resistivity of soil. Hopefully in the future, a strong correlation between
electrical resistivity and soil strength parameters can be established, enabling this
method to be implemented and reducing full dependency of site investigation by soil
boring.
50
REFERENCES
Abu-Hassanein, Z. S., Benson, C. H., & Blotz, L. R. (1996). Electrical resistivity of
compacted clays. Journal of Geotechnical Engineering.
Archie, G. (1942). Electrical-resistivity log as an aid in determining some reservoir
characteristics. Trans. Am Inst. of Min. Engrg., 146, 318-319.
Campbell, R.B., Bower, C.A., Richards, L.A., 1948. Change of electrical conductivity
with temperature and the relation of osmotic pressure to electrical conductivity
and ion concentration for soil extracts. Soil Sci. Soc. Proc. 66–69.
Fleming, A.H. (n.d.). Porosity and Permeability. Indiana Geological Survey. Retrieved
from https://igs.indiana.edu/MarionCounty/PoroAndPerme.cfm.
Frohlich, R.K., & Parke, C.D. (1989). The electrical resistivity of the Vadose Zone –
Field Survey. Ground Water 27, 524–530.
Fukue, M., Minatoa, T., Horibe, H., Taya, N., 1999. The microstructure of clay given
by resistivity measurements. Eng. Geol. 54, 43–53.
Giao, P. H., Chung, S. G., Kim, D. Y., & Tanaka, H. (2003). Electric imaging and
laboratory resistivity testing for geotechnical investigation of Pusan clay
deposits. Journal of Applied Geophysics, 52(4), 157-175. doi: 10.1016/s0926-
9851(03)00002-8.
Hersir, G. P., & Flovenz, O.G. (2013). Resistivity surveying and electromagnetic
methods. Iceland GeoSurvey, Reykjavik.
Kalinski, R., & Kelly, W. (1994). Electrical-resistivity measurements for evaluating
compacted-soil liners. Journal of Geotechnical Engineering, 120(2), 451-457.
Keller, G. and Frischknecht, F. (1966). Electrical methods in geophysical
prospecting, Pergamon Press, New York, N.Y.
51
Kibria, G., & Hossain, M. S. (2012). Investigation of Geotechnical Parameters
Affecting Electrical Resistivity of Compacted Clays. Journal of geotechnical
and geoenvironmental engineering, 138(12), 1520-1529. doi:
10.1061/(asce)gt.1943-5606.0000722.
Mariita, N.O. (n.d.). Schlumberger vertical soundings: techniques and interpretations
with examples from Krisuvik and Glerardalur, Iceland and Olkaria, Kenya.
Retrieved at November 1, 2015 from http://www.os.is/gogn/unu-gtp-
report/UNU-GTP-1986-05.pdf.
Nimmo, J.R. (2004). Porosity and Pore Size Distribution, in Hillel, D., ed.
Encyclopedia of Soils in the Environment: London, Elsevier, v. 3, p. 295-303.
Ozcep, F., Tezel, O., & Asci, M. (2009). Correlation between electrical resistivity and
soil-water content: Istanbul and Golcuk. International Journal of Physical
Sciences, 4(6), 362-365.
Palacky, G.J., 1987. Clay mapping using electromagnetic methods. First Break 5, 295–
306.
Pozdnyakova, L.A. 1999. Electrical properties of soils. Ph.D. Dissertation. Univ. of
Wyoming, Col. of Agriculture, Laramie, WY. p. 175.
http://larisa_pozd.tripod.com/disser/start/disserstart.htm.
Pozdnyakova, L., & Pozdnyakov, A. (2001). Electrical fields and soil properties.
presented at 17th WCSS, Thailand, 2001.
Rhoades, J. D., Raats, P. A. C., & Prather, R. J. (1976). Effects of Liquid-phase
Electrical Conductivity, Water Content, and Surface Conductivity on Bulk Soil
Electrical Conductivity1. Soil Science Society of America Journal, 40(5), 651.
doi: 10.2136/sssaj1976.03615995004000050017x.
52
Sadek, M. (1993). A Comparative Study of the Electrical and Hydraulic Conductivities
of Compacted Clay. Phd Thesis, Dept. of Civil Engineering, University of
California at Berkeley, Berkeley, California.
Samouëlian, A., Cousin, I., Tabbagh, A., Bruand, A., & Richard, G. (2005). Electrical
resistivity survey in soil science: a review. Soil and Tillage research, 83(2),
173-193. doi: 10.1016/j.still.2004.10.004.
Scollar, I., Tabbagh, A., Hesse, A., Herzog, I., 1990. Archaeological Prospecting and
Remote Sensing. , 674 pp.
Syed, B. A. B. S. O. & Siddiqui, F. I. (2012). Electrical Resistivity Based Non-
Destructive Testing Method for Determination of Soil’s Strength Properties.
Advanced Materials Research, 488-489, 1553-1557. doi:
10.4028/www.scientific.net/AMR.488-489.1553.
Syed, B. A. B. S. O. & Siddiqui, F. I. (2012). Simple and multiple regression models
for relationship between electrical resistivity and various soil properties for soil
characterization. Environmental Earth Sciences, 70(1), 259-267. doi:
10.1007/s12665-012-2122-0.
Syed, B. A. B. S. O., Siddiqui, F. I. & Fikri, M.N. (2014). Correlation of Electrical
Resistivity with Some Soil Parameters for the Development of Possible
Prediction of Slope Stability and Bearing Capacity of Soil using Electrical
Parameters. Pertanika Journal Science & Technology 22 (1), 139 - 152.
Tiwari, S. K. & Kumawat, N. K. (2013). Guidelines for Planning Soil Investigation of
Building Project. Proceedings of Indian Geotechnical Conference, Roorke,
December 22-24,2013.
Zhou, M., Wang, J., Cai, L., & Fan, Y. (2015). Laboratory Investigations on Factors
Affecting Soil Electrical Resistivity and the Measurement. IEEE Transactions
on Industry Applications, 1-1. doi: 10.1109/tia.2015.2465931.

53
Yokoi, H. (1968). Relationship between soil cohesion and shear strength. Soil Science
and Plant Nutrition, 14:3, 89-93, DOI:10.1080/00380768.1968.10432750.

54
APPENDICES
55
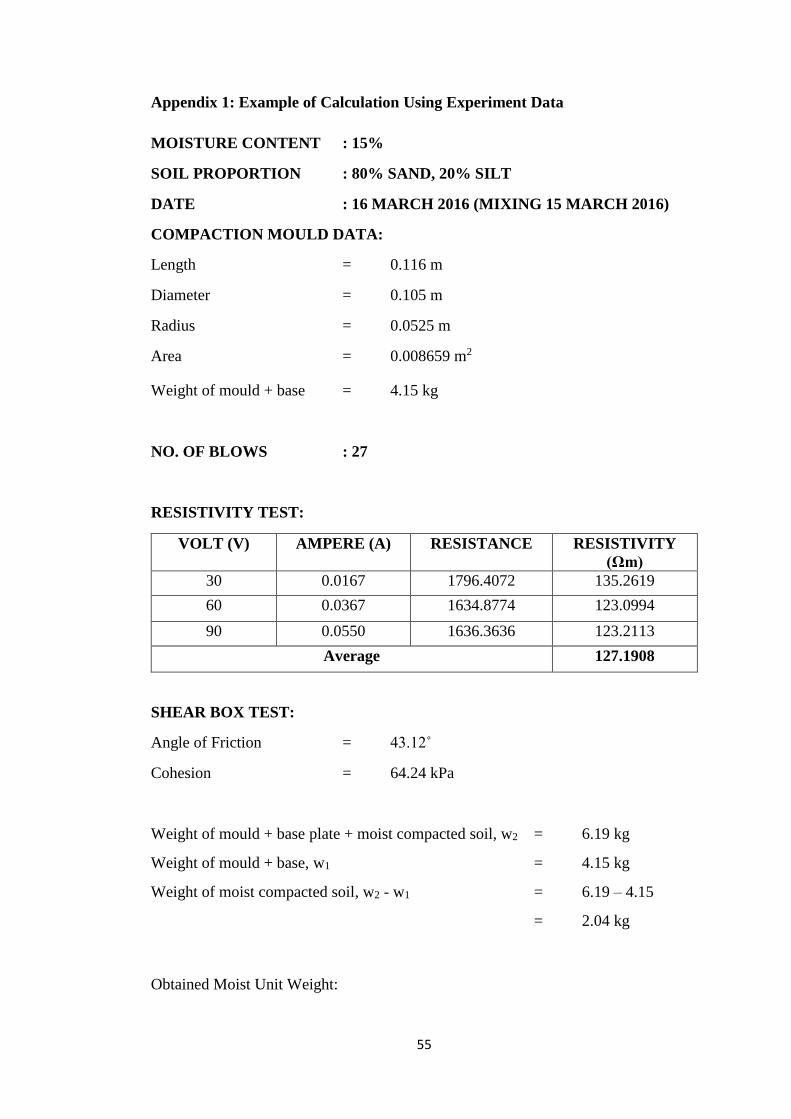
Appendix 1: Example of Calculation Using Experiment Data
MOISTURE CONTENT : 15%
SOIL PROPORTION : 80% SAND, 20% SILT
DATE : 16 MARCH 2016 (MIXING 15 MARCH 2016)
COMPACTION MOULD DATA:
Length = 0.116 m
Diameter = 0.105 m
Radius = 0.0525 m
Area = 0.008659 m2
Weight of mould + base = 4.15 kg
NO. OF BLOWS : 27
RESISTIVITY TEST:
VOLT (V) AMPERE (A) RESISTANCE RESISTIVITY
(Ωm)
30 0.0167 1796.4072 135.2619
60 0.0367 1634.8774 123.0994
90 0.0550 1636.3636 123.2113
Average 127.1908
SHEAR BOX TEST:
Angle of Friction = 43.12˚
Cohesion = 64.24 kPa
Weight of mould + base plate + moist compacted soil, w2 = 6.19 kg
Weight of mould + base, w1 = 4.15 kg
Weight of moist compacted soil, w2 - w1 = 6.19 – 4.15
= 2.04 kg
Obtained Moist Unit Weight:
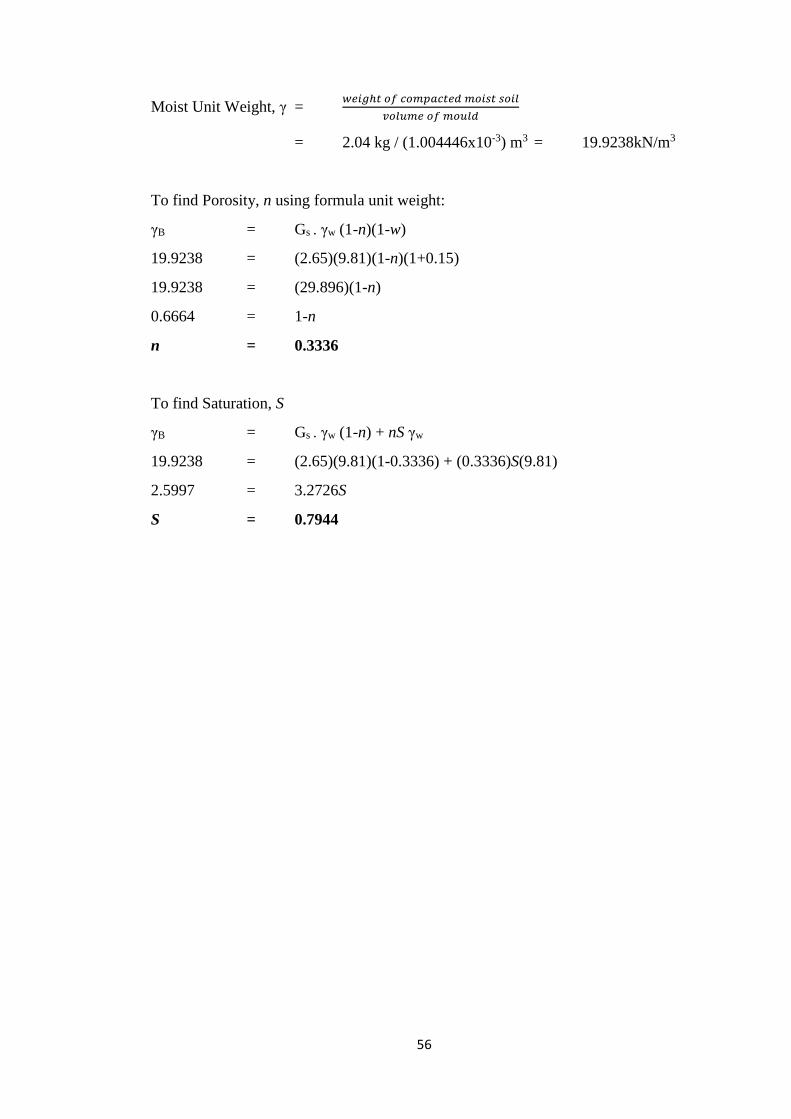
56
Moist Unit Weight, γ = 𝑤𝑒𝑖𝑔ℎ𝑡 𝑜𝑓 𝑐𝑜𝑚𝑝𝑎𝑐𝑡𝑒𝑑 𝑚𝑜𝑖𝑠𝑡 𝑠𝑜𝑖𝑙
𝑣𝑜𝑙𝑢𝑚𝑒 𝑜𝑓 𝑚𝑜𝑢𝑙𝑑
= 2.04 kg / (1.004446x10⁻³) m3 = 19.9238kN/m3
To find Porosity, n using formula unit weight:
γB = Gs . γw (1-n)(1-w)
19.9238 = (2.65)(9.81)(1-n)(1+0.15)
19.9238 = (29.896)(1-n)
0.6664 = 1-n
n = 0.3336
To find Saturation, S
γB = Gs . γw (1-n) + nS γw
19.9238 = (2.65)(9.81)(1-0.3336) + (0.3336)S(9.81)
2.5997 = 3.2726S
S = 0.7944
57
MOISTURE CONTENT : 30%
SOIL PROPORTION : 40% SAND, 60% SILT
DATE : 17 FEBRUARY 2016 (MIXING 16 FEBRUARY
2016)
COMPACTION MOULD DATA:
Length = 0.116 m
Diameter = 0.105 m
Radius = 0.0525 m
Area = 0.008659 m2
Weight of mould + base = 4.15 kg
NO. OF BLOWS : 27
RESISTIVITY TEST:
VOLT (V) AMPERE (A) RESISTANCE RESISTIVITY
(Ωm)
30 0.0217 1382.4885 104.0955
60 0.0496 1209.6774 91.0836
90 0.0832 1081.7308 81.4498
Average 92.2097
SHEAR BOX TEST:
Angle of Friction = 43.12˚
Cohesion = 64.24 kPa
Weight of mould + base plate + moist compacted soil, w2 = 6.01 kg
Weight of mould + base, w1 = 4.15 kg
Weight of moist compacted soil, w2 - w1 = 6.01 – 4.15
= 1.86 kg
58
Obtained Moist Unit Weight:
Moist Unit Weight, γ = 𝑤𝑒𝑖𝑔ℎ𝑡 𝑜𝑓 𝑐𝑜𝑚𝑝𝑎𝑐𝑡𝑒𝑑 𝑚𝑜𝑖𝑠𝑡 𝑠𝑜𝑖𝑙
𝑣𝑜𝑙𝑢𝑚𝑒 𝑜𝑓 𝑚𝑜𝑢𝑙𝑑
= 1.86 kg / (1.004446x10⁻³) m3 = 18.1658 kN/m3
To find Porosity, n using formula unit weight:
γB = Gs . γw (1-n)(1-w)
18.1658 = (2.65)(9.81)(1-n)(1+0.30)
18.1658 = (33.7955)(1-n)
0.5375 = 1-n
n = 0.4625
To find Saturation, S
γB = Gs . γw (1-n) + nS γw
18.1658 = (2.65)(9.81)(1-0.4625) + (0.4625)S(9.81)
4.1927 = 4.5371S
S = 0.924
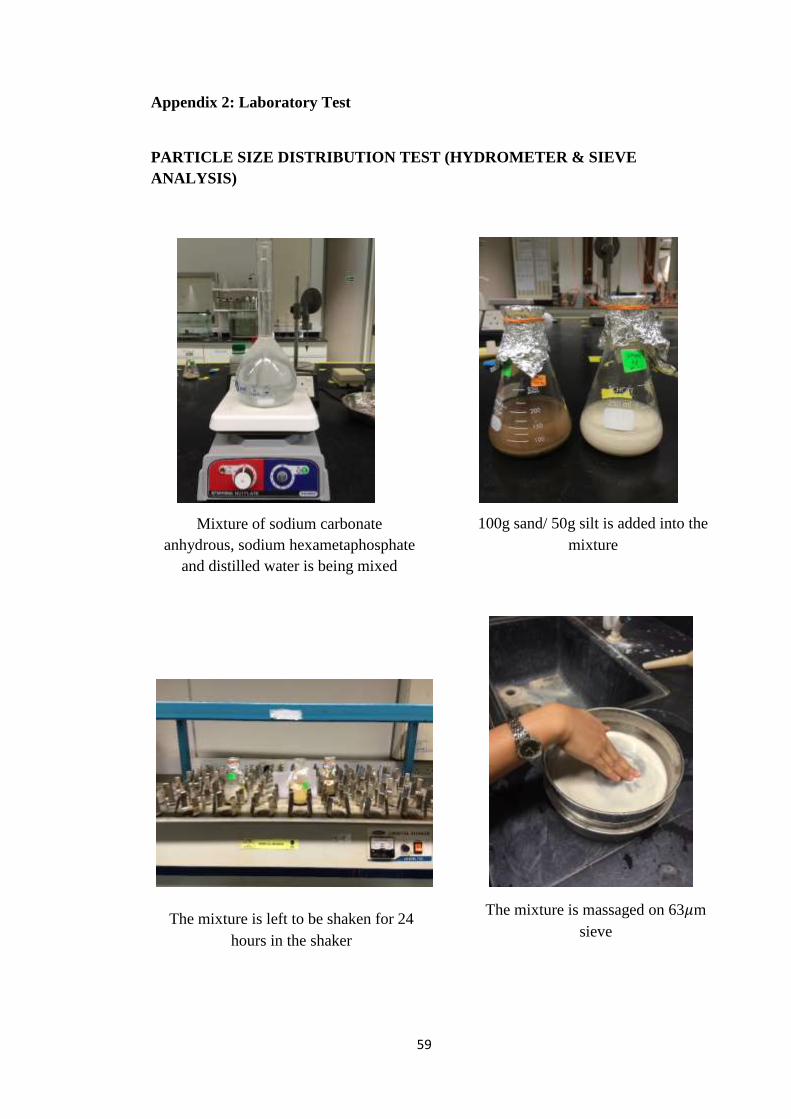
59
Appendix 2: Laboratory Test
PARTICLE SIZE DISTRIBUTION TEST (HYDROMETER & SIEVE
ANALYSIS)
Mixture of sodium carbonate
anhydrous, sodium hexametaphosphate
and distilled water is being mixed
100g sand/ 50g silt is added into the
mixture
The mixture is left to be shaken for 24
hours in the shaker
The mixture is massaged on 63𝜇m
sieve
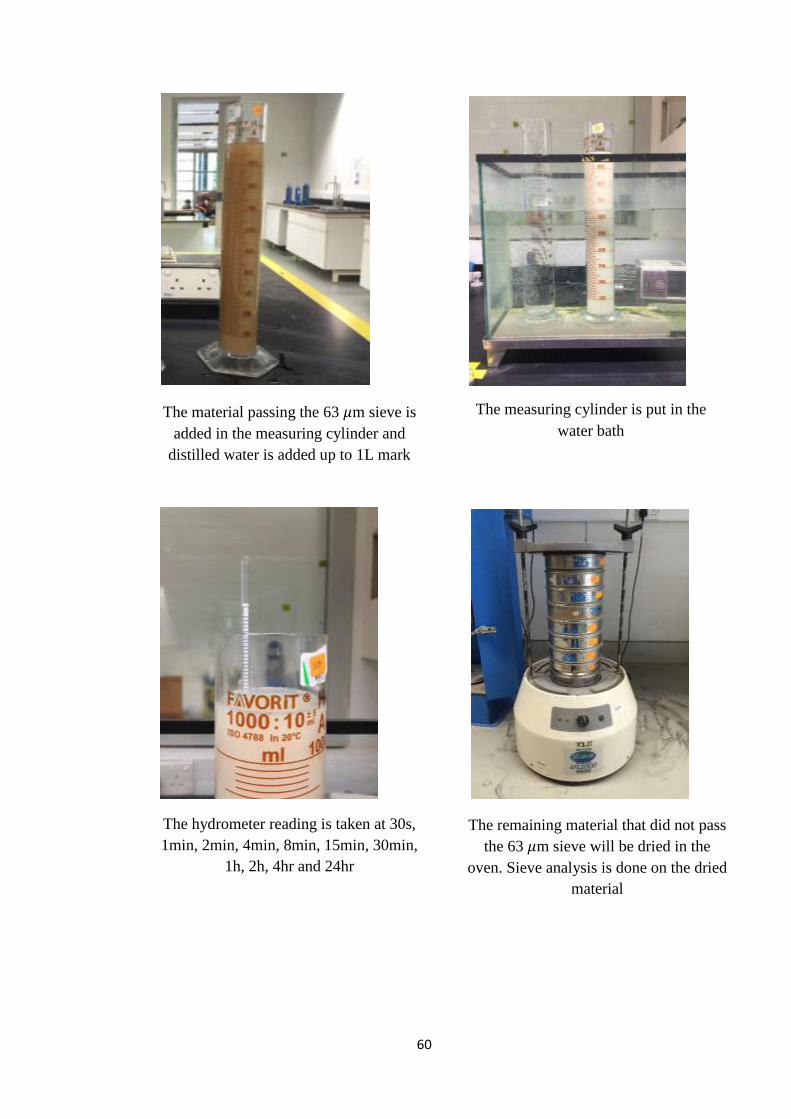
60
The material passing the 63 𝜇m sieve is
added in the measuring cylinder and
distilled water is added up to 1L mark
The measuring cylinder is put in the
water bath
The hydrometer reading is taken at 30s,
1min, 2min, 4min, 8min, 15min, 30min,
1h, 2h, 4hr and 24hr
The remaining material that did not pass
the 63 𝜇m sieve will be dried in the
oven. Sieve analysis is done on the dried
material
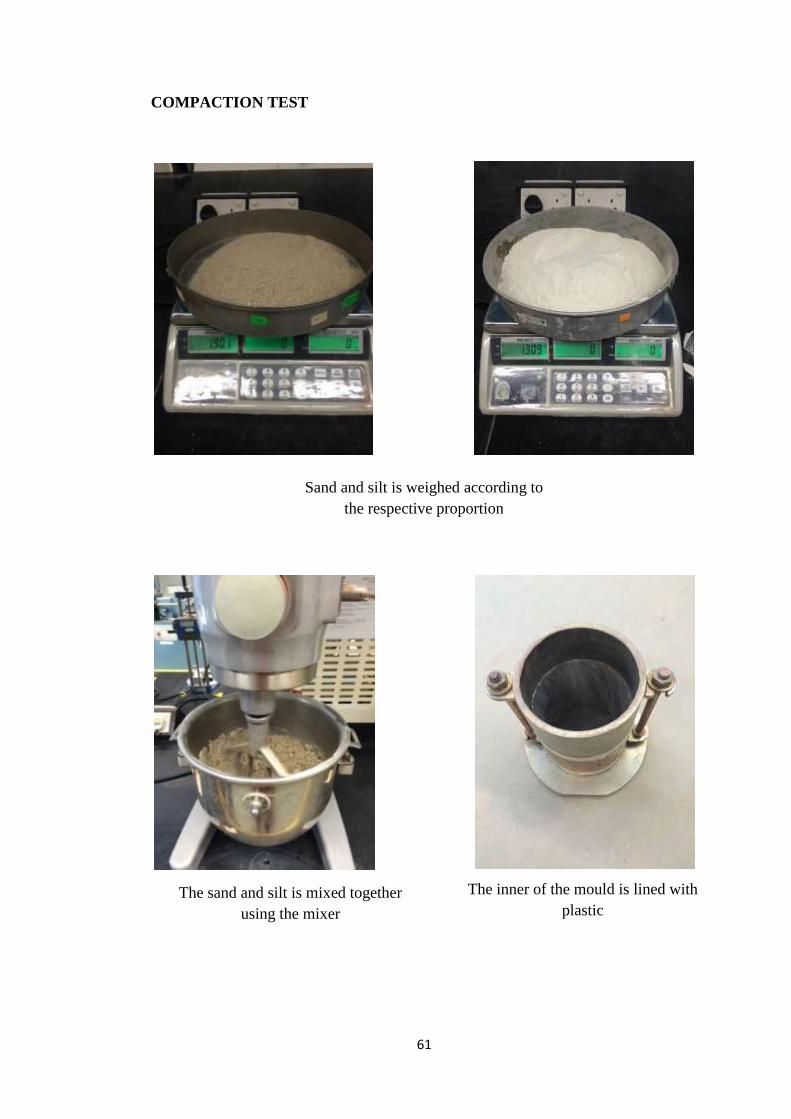
61
COMPACTION TEST
Sand and silt is weighed according to
the respective proportion
The sand and silt is mixed together
using the mixer
The inner of the mould is lined with
plastic
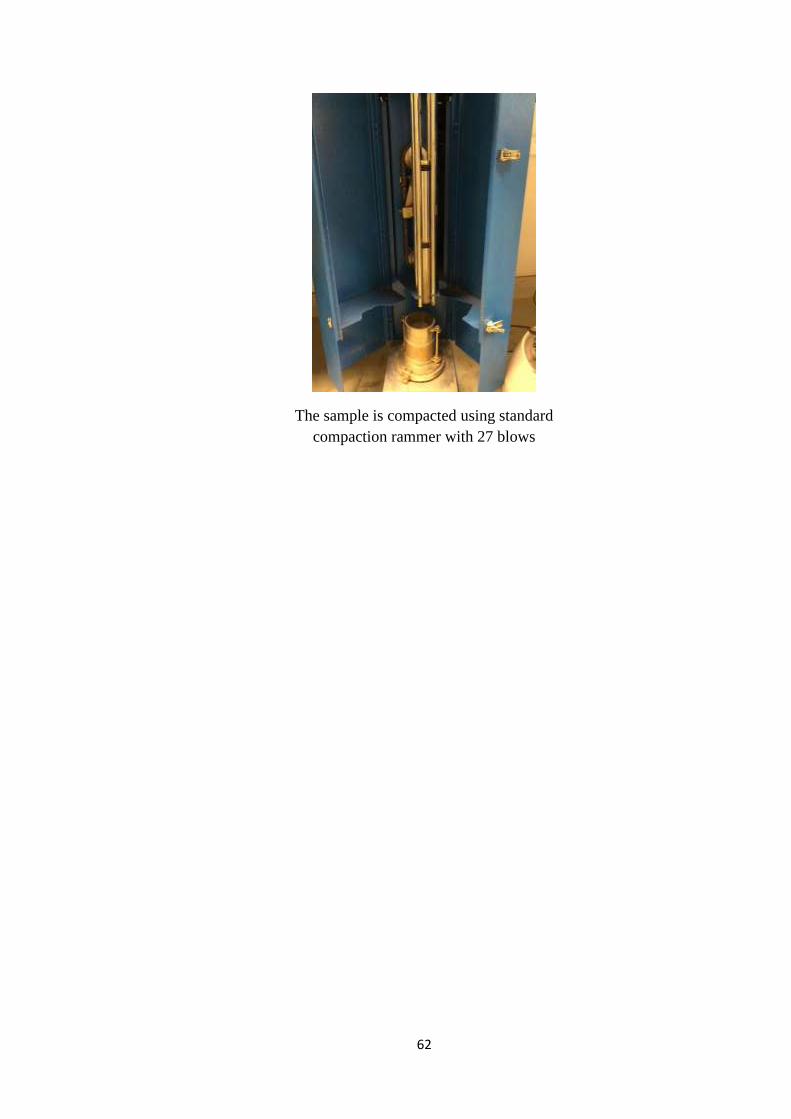
62
The sample is compacted using standard
compaction rammer with 27 blows
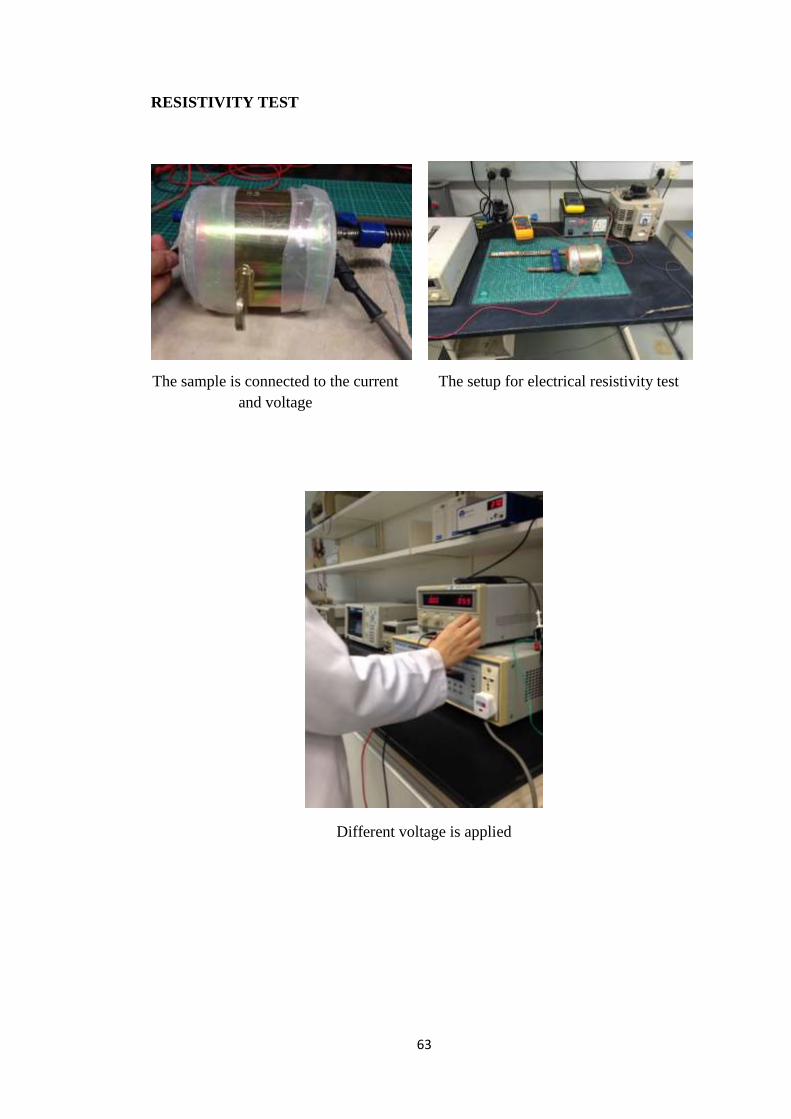
63
RESISTIVITY TEST
The sample is connected to the current
and voltage
The setup for electrical resistivity test
Different voltage is applied
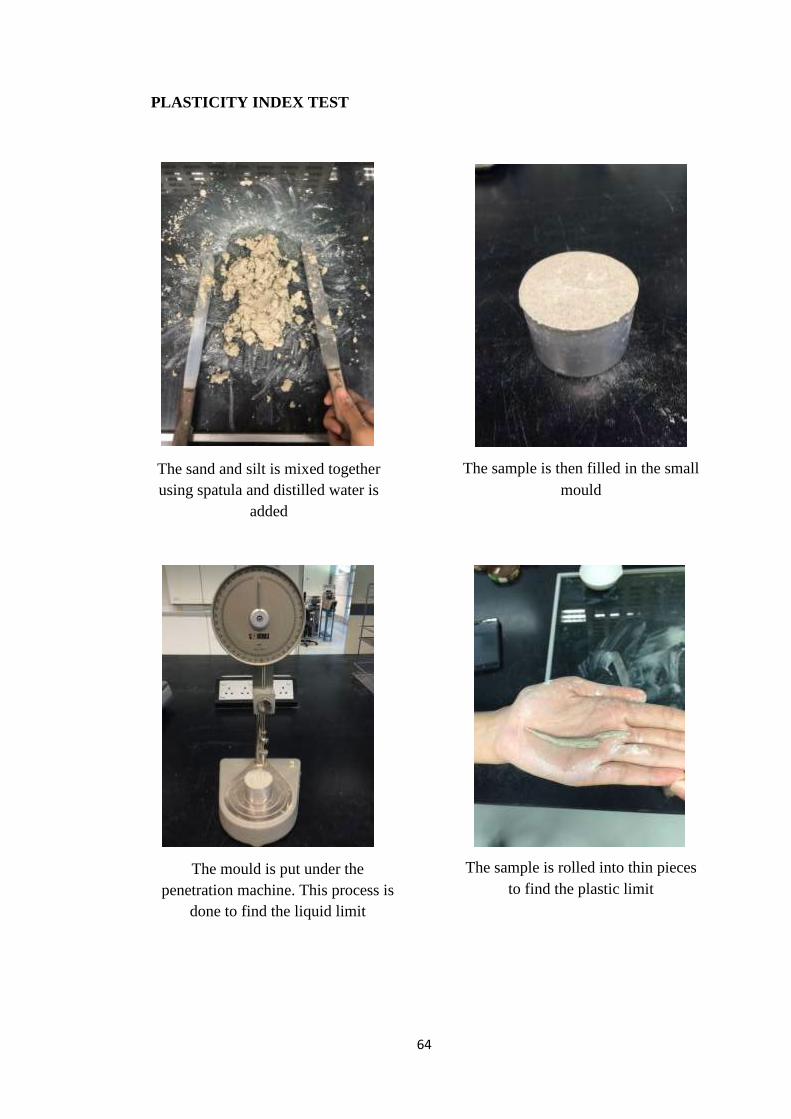
64
PLASTICITY INDEX TEST
The sand and silt is mixed together
using spatula and distilled water is
added
The sample is then filled in the small
mould
The mould is put under the
penetration machine. This process is
done to find the liquid limit
The sample is rolled into thin pieces
to find the plastic limit

65
All the wet samples are put into the
oven to find the dry mass