Embed Size (px)
Citation preview
0.2 0.4 0.6 0.8 1 1.2Time (s)
Freq
uenc
y (k
Hz)
‘Figure’ onset Time-frequency representation of coherence 8 stimulus
Psychophysical functions of coherence (Teki et al. 2013)
The stimulus to the left consists of a sequence of 25ms-long chords containing a random set of pure tone components. The transition from random background is to eight coherent chords, which begin at 700ms and last for 700ms (horizontal stripes on the time-frequency plot). Different versions of this stimulus were adopted for normal and hearing impaired listeners in which the chord segment duration, number of chords, and stimu-lus coherence were varied between groups.
The figure to the left is taken from Teki et al. 2013. d′ is shown for chord duration of 25ms plotted as a function of the duration of the figure (in terms of number of 25ms-long chords). The coherence of the different stimuli is colour coded according to the legend (inset). Error bars signify one standard error of the mean.
P.E. Gander1, I. Choi2, B. McMurray3, T.D. Griffiths4,5
Behavioural evidence for a relationship between auditory object grouping and speech-in-noise processing
1Department of Neurosurgery, 2Department of Communication Sciences and Disorders, 3Department of Psychological and Brain Sciences, The University of Iowa, Iowa City, IA, USA, 4Institute of Neuroscience, Newcastle University, Newcastle-Upon-Tyne, UK, 5Wellcome Trust Centre for Neuroimaging, University College London, London, UK
3
Auditory object detection and speech-in-noise tasks
Trial example for the cochlear implant group, showing a 4-second-long SFG stimulus with segments across the frequency range (100-7500Hz). After 2s, 6 segments are randomly chosen to remain fixed for 2s. On a no-object trial, segments are ranomized for the duration of the stimulus.
Stochastic Figure-Ground stimulus
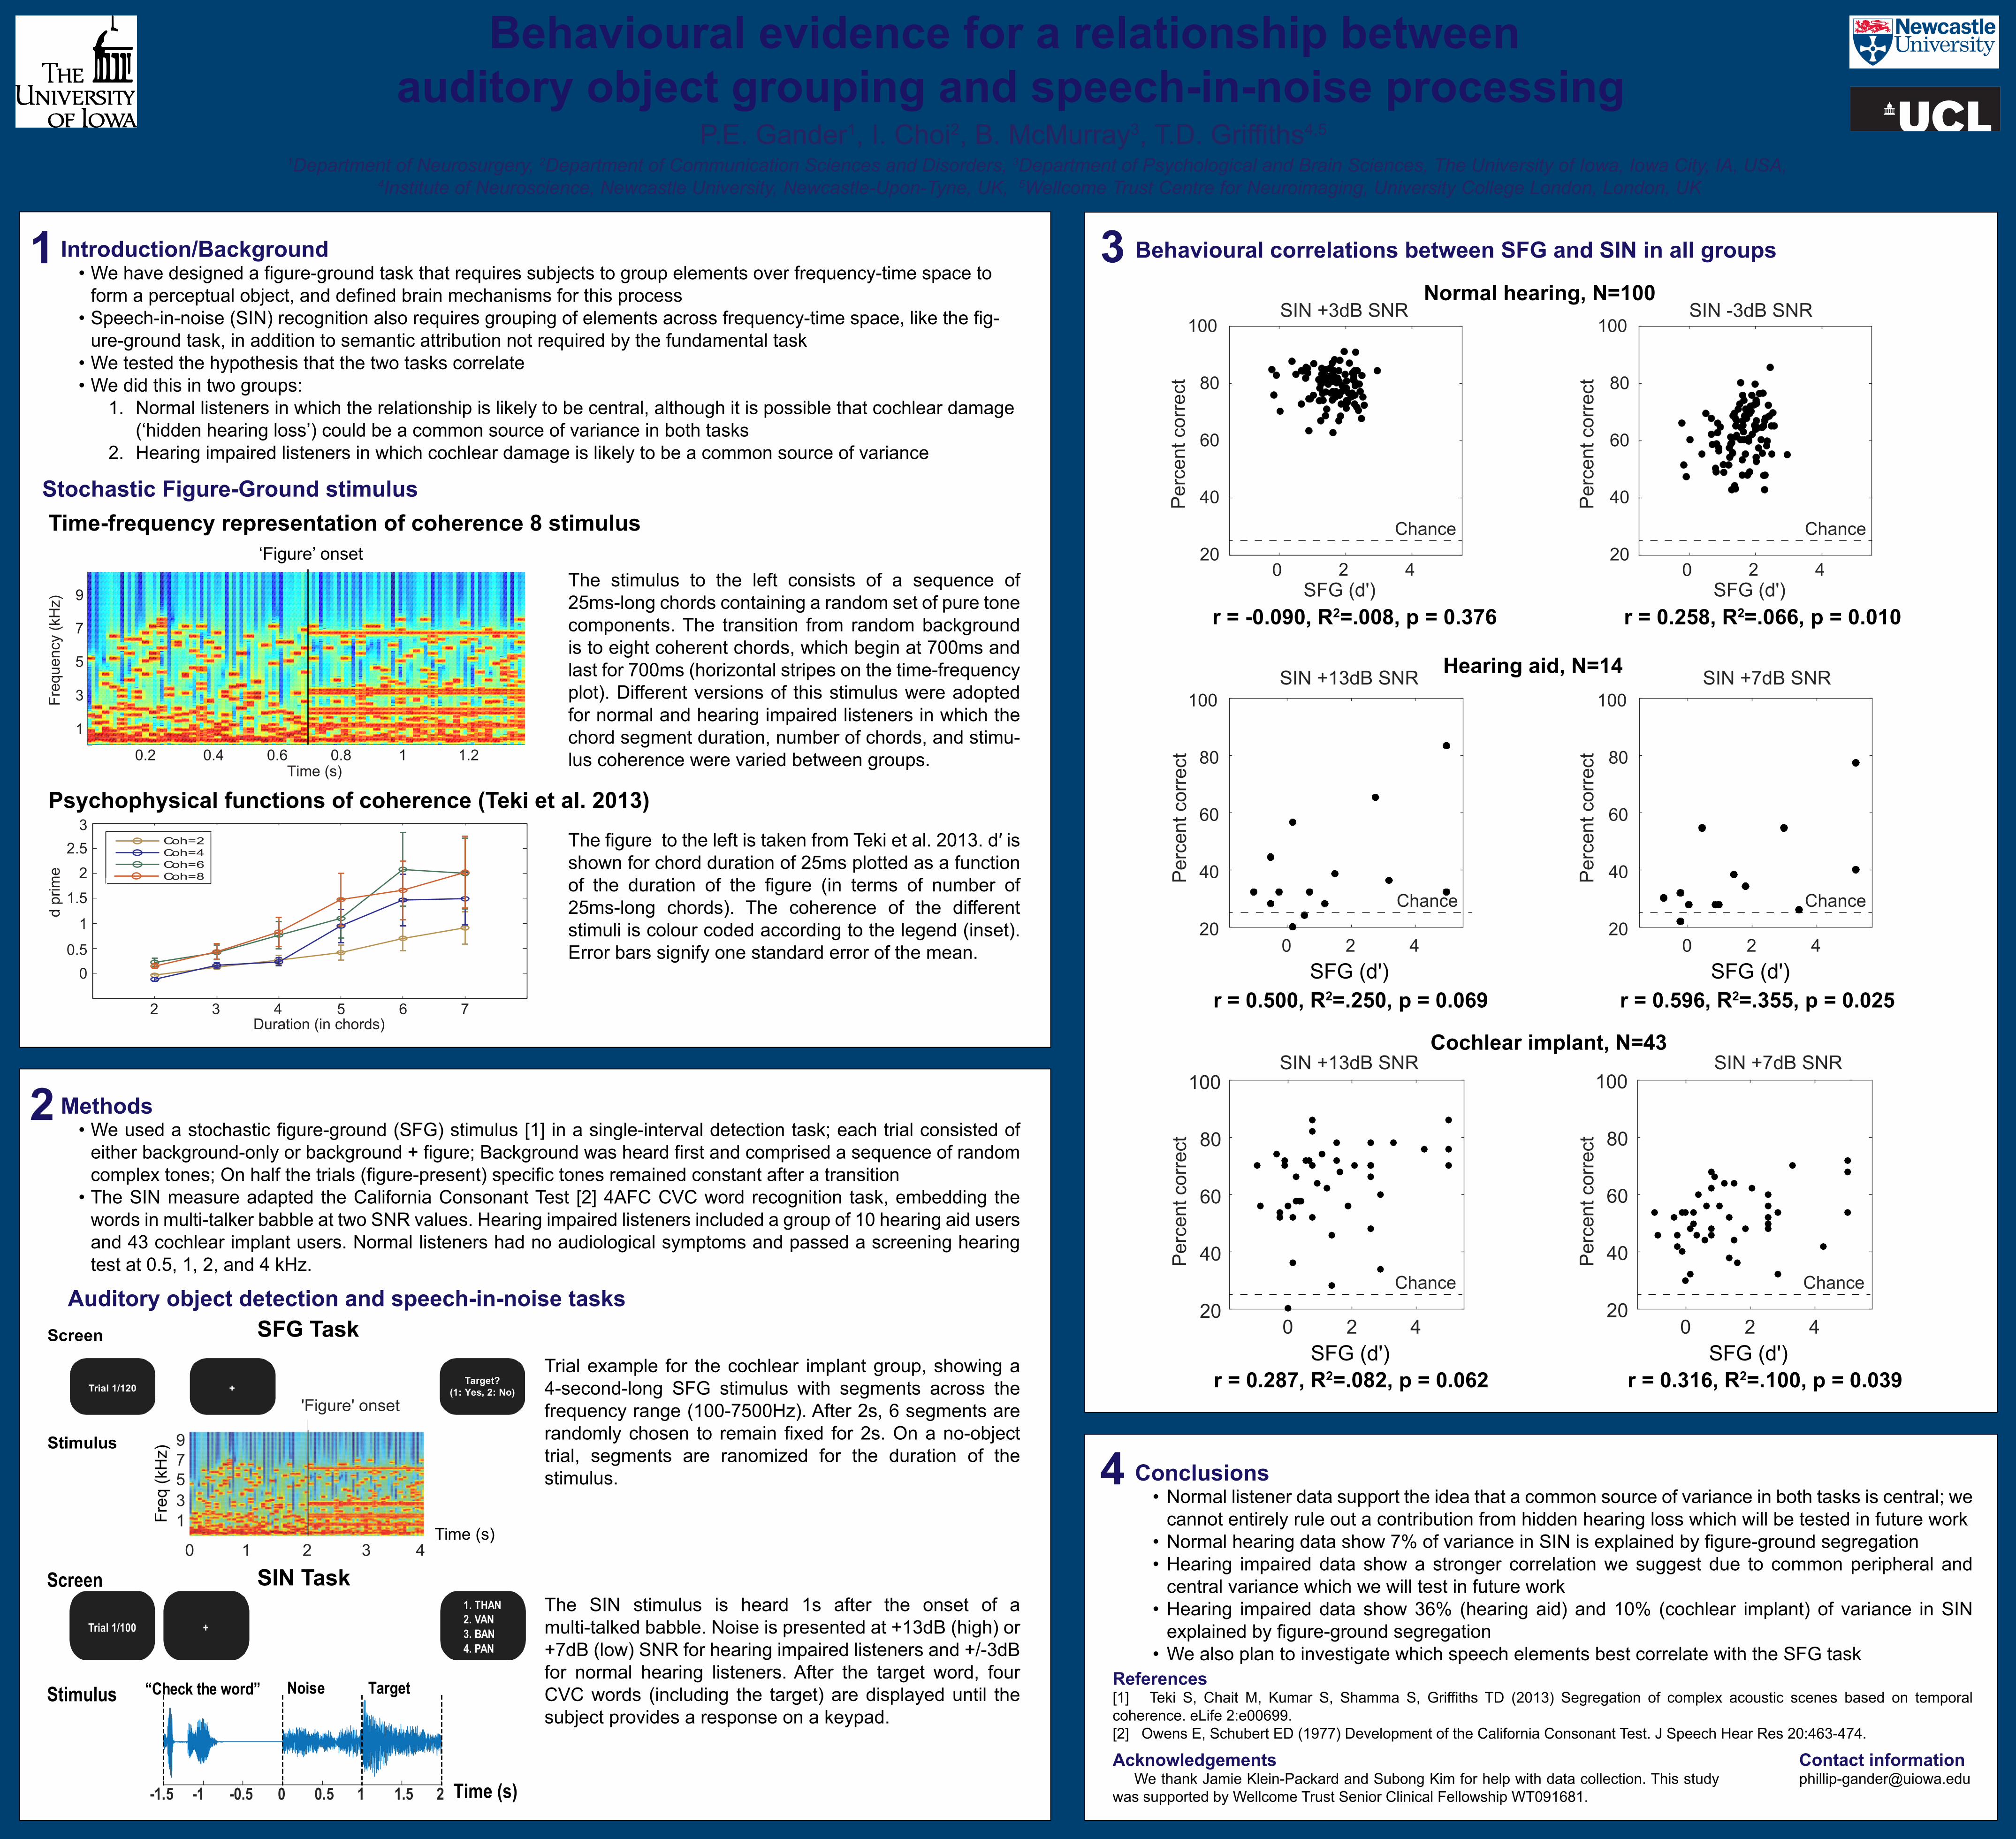
1 Behavioural correlations between SFG and SIN in all groups
Screen
Stimulus
Time (s)
Target?(1: Yes, 2: No)+Trial 1/120
'Figure' onset
1Freq
(kH
z)
3579
0 2 41 3
“Check the word”
Screen
Stimulus Noise Target
Time (s)-1.5 -1 -0.5 0 0.5 1 1.5 2
1. THAN2. VAN3. BAN4. PAN
+Trial 1/100
0 2 4SFG (d')
20
40
60
80
100
r = 0.500, R2=.250, p = 0.069
0 2 4SFG (d')
20
40
60
80
100
r = 0.596, R2=.355, p = 0.025
0 2 4SFG (d')
20
40
60
80
100
r = 0.287, R2=.082, p = 0.062
0 2 4SFG (d')
20
40
60
80
100
r = 0.316, R2=.100, p = 0.039
We have designed a figure-ground task that requires subjects to group elements over frequency-time space to form a perceptual object, and defined brain mechanisms for this processSpeech-in-noise (SIN) recognition also requires grouping of elements across frequency-time space, like the fig-ure-ground task, in addition to semantic attribution not required by the fundamental taskWe tested the hypothesis that the two tasks correlate We did this in two groups:
1. Normal listeners in which the relationship is likely to be central, although it is possible that cochlear damage (‘hidden hearing loss’) could be a common source of variance in both tasks
2. Hearing impaired listeners in which cochlear damage is likely to be a common source of variance
Introduction/Background•
•
••
Coh=2Coh=4Coh=6Coh=8
SFG Task
SIN TaskThe SIN stimulus is heard 1s after the onset of a multi-talked babble. Noise is presented at +13dB (high) or +7dB (low) SNR for hearing impaired listeners and +/-3dB for normal hearing listeners. After the target word, four CVC words (including the target) are displayed until the subject provides a response on a keypad.
Normal hearing, N=100
Hearing aid, N=14
Cochlear implant, N=43Duration (in chords)
2
d pr
ime
2 Methods•
•
We used a stochastic figure-ground (SFG) stimulus [1] in a single-interval detection task; each trial consisted of either background-only or background + figure; Background was heard first and comprised a sequence of random complex tones; On half the trials (figure-present) specific tones remained constant after a transition The SIN measure adapted the California Consonant Test [2] 4AFC CVC word recognition task, embedding the words in multi-talker babble at two SNR values. Hearing impaired listeners included a group of 10 hearing aid users and 43 cochlear implant users. Normal listeners had no audiological symptoms and passed a screening hearing test at 0.5, 1, 2, and 4 kHz.
3 4 5 6 7
0
1
2
3
0.5
1.5
2.5
1
3
5
7
9
4
Contact [email protected]
References[1] Teki S, Chait M, Kumar S, Shamma S, Griffiths TD (2013) Segregation of complex acoustic scenes based on temporal coherence. eLife 2:e00699. [2] Owens E, Schubert ED (1977) Development of the California Consonant Test. J Speech Hear Res 20:463-474.
Acknowledgements We thank Jamie Klein-Packard and Subong Kim for help with data collection. This study was supported by Wellcome Trust Senior Clinical Fellowship WT091681.
Normal listener data support the idea that a common source of variance in both tasks is central; we cannot entirely rule out a contribution from hidden hearing loss which will be tested in future workNormal hearing data show 7% of variance in SIN is explained by figure-ground segregationHearing impaired data show a stronger correlation we suggest due to common peripheral and central variance which we will test in future work Hearing impaired data show 36% (hearing aid) and 10% (cochlear implant) of variance in SIN explained by figure-ground segregationWe also plan to investigate which speech elements best correlate with the SFG task
Conclusions•
••
•
•
0 2 4SFG (d')
20
40
60
80
100
Perc
ent c
orre
ct
r = -0.090, R2=.008, p = 0.376
0 2 4SFG (d')
20
40
60
80
100
r = 0.258, R2=.066, p = 0.010
SIN +3dB SNR SIN -3dB SNR
Perc
ent c
orre
ct
SIN +13dB SNR SIN +7dB SNR
Perc
ent c
orre
ct
Perc
ent c
orre
ct
SIN +13dB SNR SIN +7dB SNR
Perc
ent c
orre
ct
Perc
ent c
orre
ct
Chance Chance
Chance Chance
ChanceChance