Embed Size (px)
Citation preview
1
Beijing Capital Land Ltd. 2868.HK
Annual Results 2015
March 2016
2
Table of Content
1 Results Summary
2 Business Highlights
3 2016 Outlook
3
Section 1
Results Summary
4
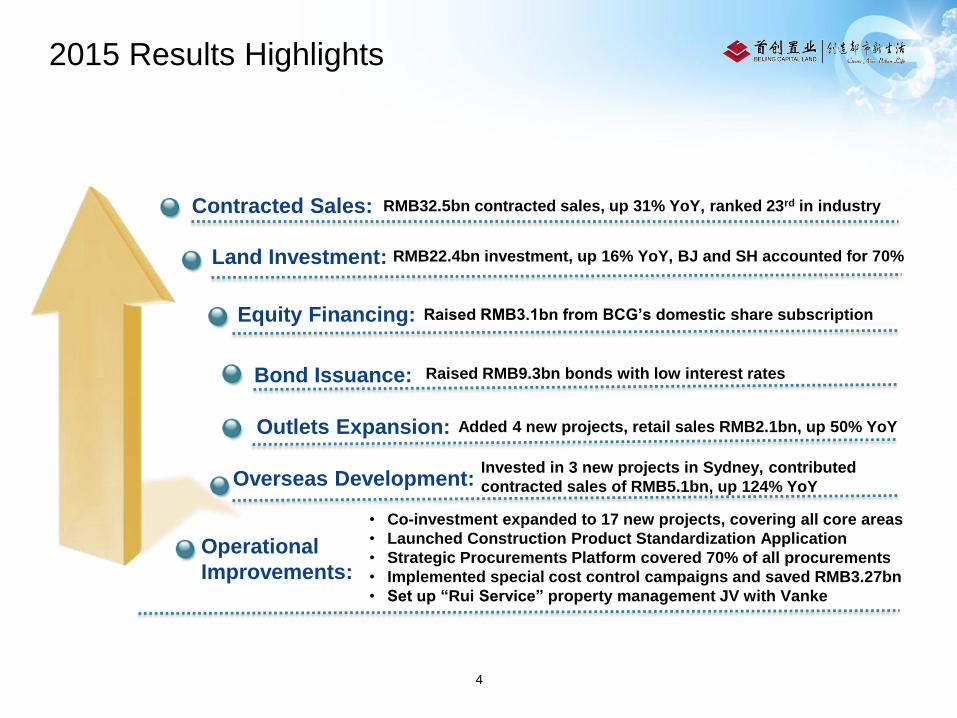
Contracted Sales:
Land Investment:
Equity Financing:
Bond Issuance:
Outlets Expansion:
Overseas Development:
Operational
Improvements:
RMB32.5bn contracted sales, up 31% YoY, ranked 23rd in industry
RMB22.4bn investment, up 16% YoY, BJ and SH accounted for 70%
Raised RMB3.1bn from BCG’s domestic share subscription
Raised RMB9.3bn bonds with low interest rates
Added 4 new projects, retail sales RMB2.1bn, up 50% YoY
Invested in 3 new projects in Sydney, contributed
contracted sales of RMB5.1bn, up 124% YoY
• Co-investment expanded to 17 new projects, covering all core areas
• Launched Construction Product Standardization Application
• Strategic Procurements Platform covered 70% of all procurements
• Implemented special cost control campaigns and saved RMB3.27bn
• Set up “Rui Service” property management JV with Vanke
2015 Results Highlights
5
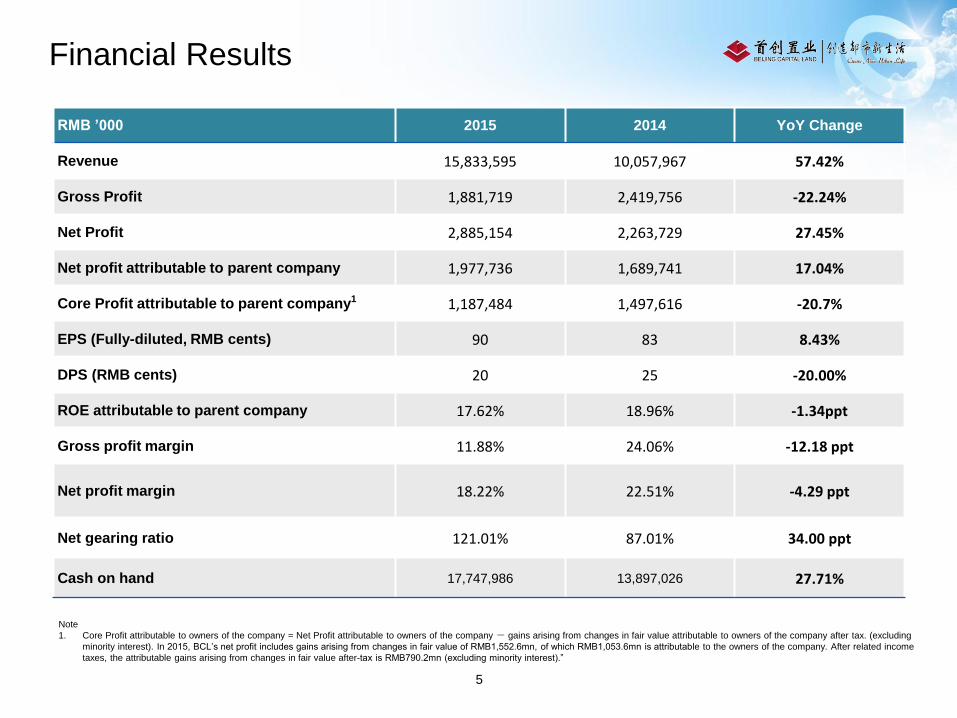
RMB ’000 2015 2014 YoY Change
Revenue 15,833,595 10,057,967 57.42%
Gross Profit 1,881,719 2,419,756 -22.24%
Net Profit 2,885,154 2,263,729 27.45%
Net profit attributable to parent company 1,977,736 1,689,741 17.04%
Core Profit attributable to parent company1 1,187,484 1,497,616 -20.7%
EPS (Fully-diluted, RMB cents) 90 83 8.43%
DPS (RMB cents) 20 25 -20.00%
ROE attributable to parent company 17.62% 18.96% -1.34ppt
Gross profit margin 11.88% 24.06% -12.18 ppt
Net profit margin 18.22% 22.51% -4.29 ppt
Net gearing ratio 121.01% 87.01% 34.00 ppt
Cash on hand 17,747,986 13,897,026 27.71%
Note
1. Core Profit attributable to owners of the company = Net Profit attributable to owners of the company - gains arising from changes in fair value attributable to owners of the company after tax. (excluding
minority interest). In 2015, BCL’s net profit includes gains arising from changes in fair value of RMB1,552.6mn, of which RMB1,053.6mn is attributable to the owners of the company. After related income
taxes, the attributable gains arising from changes in fair value after-tax is RMB790.2mn (excluding minority interest).”
Financial Results
6
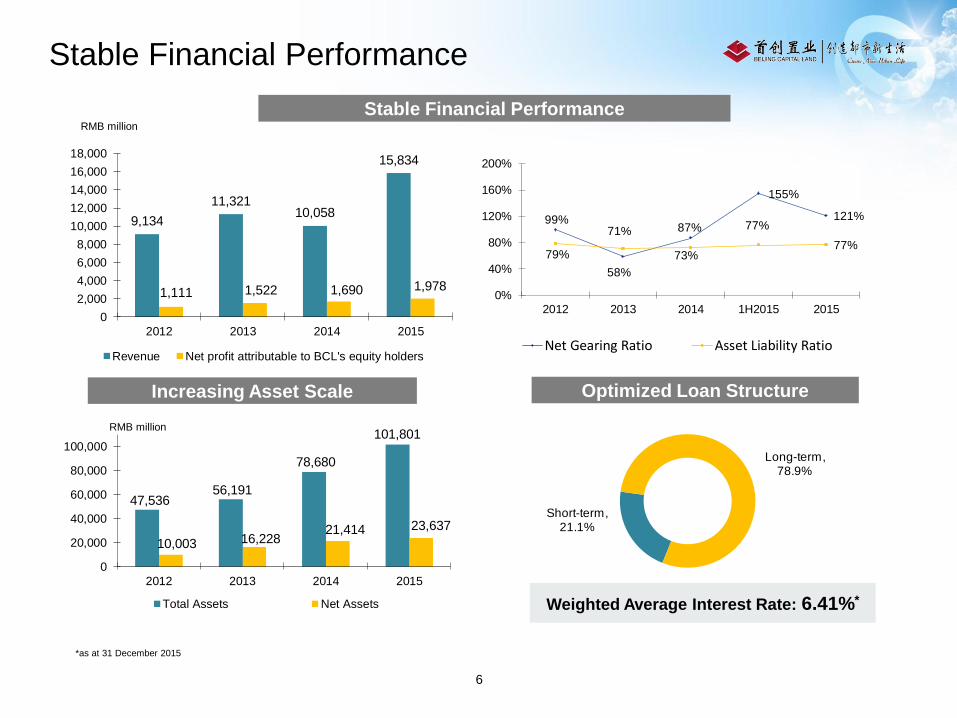
Stable Financial Performance
Increasing Asset Scale Optimized Loan Structure
Short-term, 21.1%
Long-term, 78.9%
Weighted Average Interest Rate: 6.41%*
47,536 56,191
78,680
101,801
10,003 16,22821,414 23,637
0
20,000
40,000
60,000
80,000
100,000
2012 2013 2014 2015
Total Assets Net Assets
*as at 31 December 2015
9,134
11,321 10,058
15,834
1,111 1,522 1,690 1,978
0
2,000
4,000
6,000
8,000
10,000
12,000
14,000
16,000
18,000
2012 2013 2014 2015
Revenue Net profit attributable to BCL's equity holders
RMB million
RMB million
Stable Financial Performance
99%
58%
87%
155%
121%
79%
71%
73%
77%
77%
0%
40%
80%
120%
160%
200%
2012 2013 2014 1H2015 2015
Net Gearing Ratio Asset Liability Ratio
7
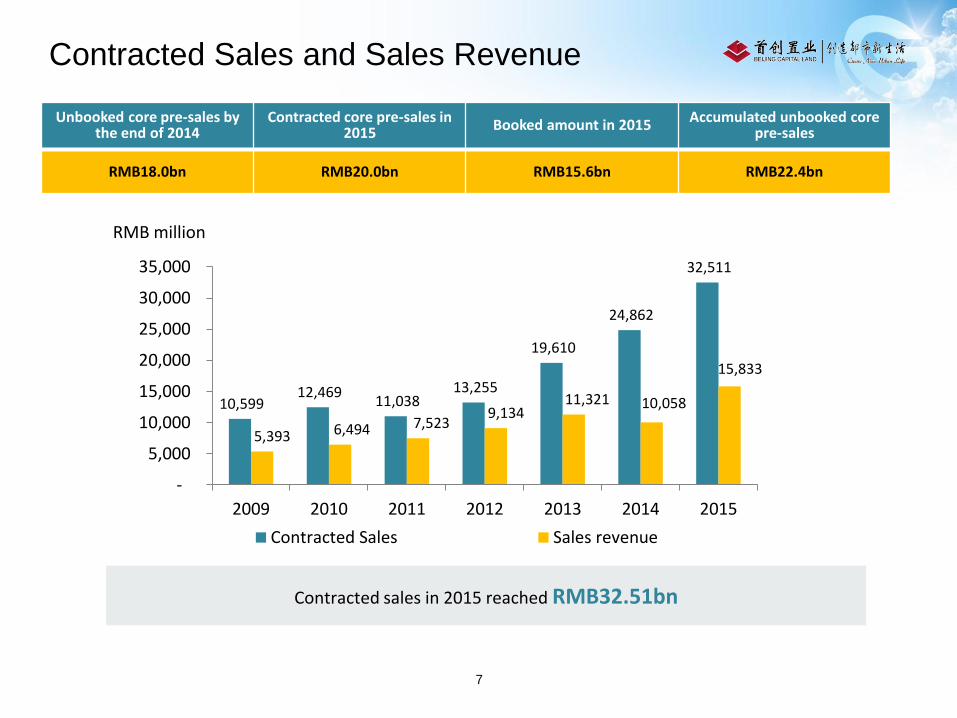
Unbooked core pre-sales by the end of 2014
Contracted core pre-sales in 2015 Booked amount in 2015 Accumulated unbooked core
pre-sales
RMB18.0bn RMB20.0bn RMB15.6bn RMB22.4bn
Contracted sales in 2015 reached RMB32.51bn
10,599 12,469
11,038 13,255
19,610
24,862
32,511
5,393 6,494 7,5239,134
11,321 10,058
15,833
-
5,000
10,000
15,000
20,000
25,000
30,000
35,000
2009 2010 2011 2012 2013 2014 2015
Contracted Sales Sales revenue
RMB million
Contracted Sales and Sales Revenue
8
Section 2
Business Highlights
9
11,613
14,675
77%
87%
-
5,000
10,000
15,000
20,000
2014 2015
72%
74%
76%
78%
80%
82%
84%
86%
88%
ASP in 5 Core Cities & Sydney
5 Core Cities & Sydney as % of Contracted Sales
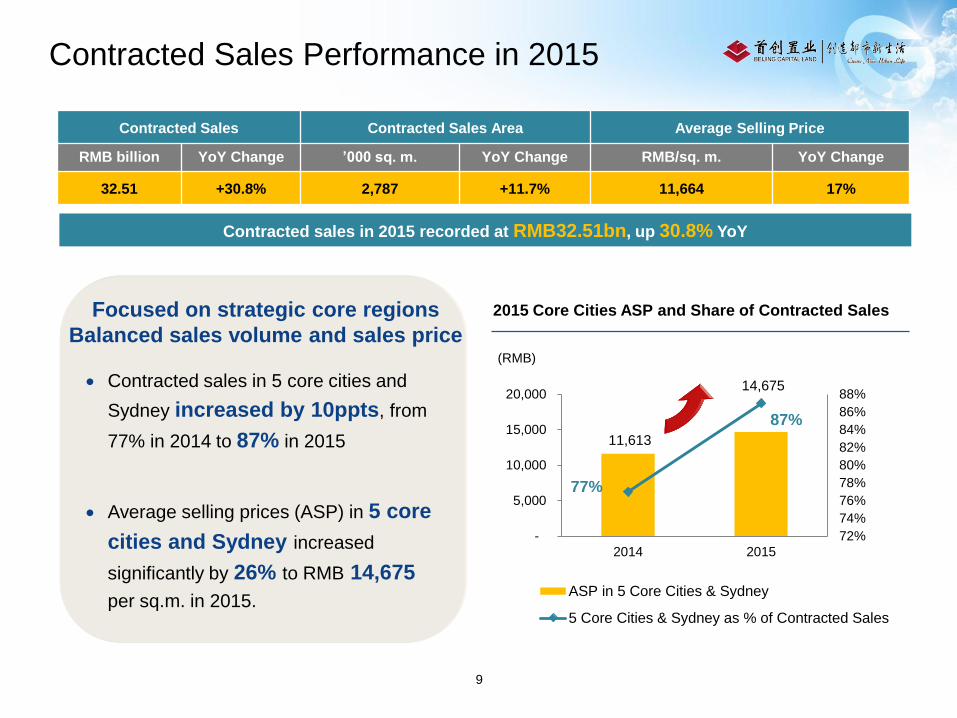
Contracted sales in 5 core cities and
Sydney increased by 10ppts, from
77% in 2014 to 87% in 2015
Average selling prices (ASP) in 5 core
cities and Sydney increased
significantly by 26% to RMB 14,675
per sq.m. in 2015.
Contracted Sales Contracted Sales Area Average Selling Price
RMB billion YoY Change ’000 sq. m. YoY Change RMB/sq. m. YoY Change
32.51 +30.8% 2,787 +11.7% 11,664 17%
Contracted sales in 2015 recorded at RMB32.51bn, up 30.8% YoY
2015 Core Cities ASP and Share of Contracted Sales
(RMB)
Focused on strategic core regions
Balanced sales volume and sales price
Contracted Sales Performance in 2015
10
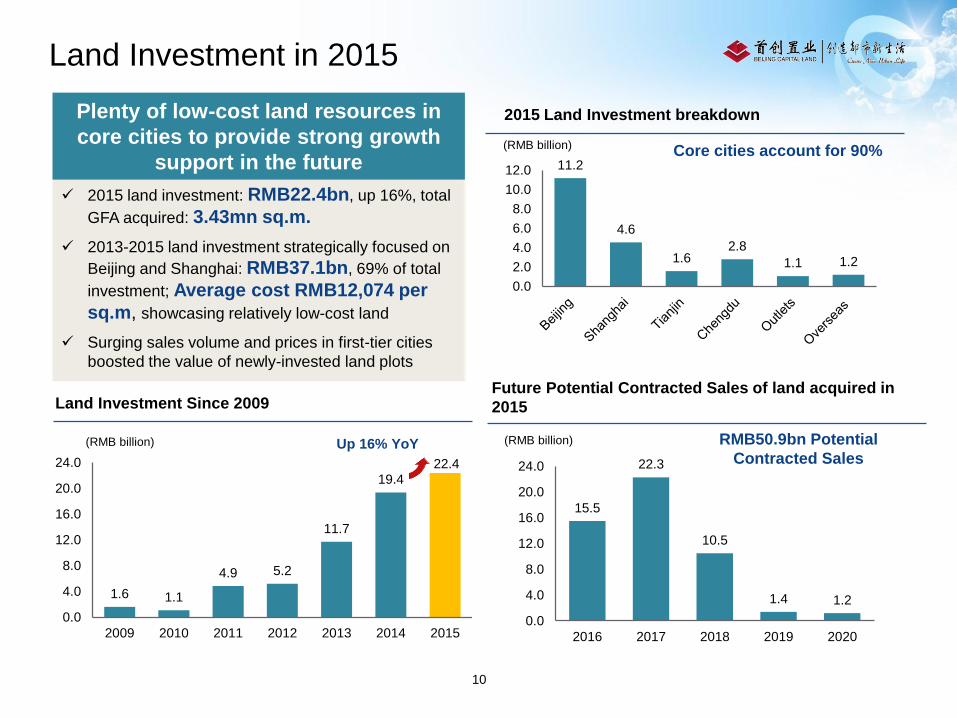
Land Investment Since 2009
(RMB billion)
1.6 1.1
4.9 5.2
11.7
19.422.4
0.0
4.0
8.0
12.0
16.0
20.0
24.0
2009 2010 2011 2012 2013 2014 2015
Up 16% YoY
Future Potential Contracted Sales of land acquired in
2015
(RMB billion)
15.5
22.3
10.5
1.4 1.2
0.0
4.0
8.0
12.0
16.0
20.0
24.0
2016 2017 2018 2019 2020
RMB50.9bn Potential
Contracted Sales
11.2
4.6
1.62.8
1.1 1.2
0.0
2.0
4.0
6.0
8.0
10.0
12.0
2015 Land Investment breakdown
(RMB billion) Core cities account for 90%
2015 land investment: RMB22.4bn, up 16%, total
GFA acquired: 3.43mn sq.m.
2013-2015 land investment strategically focused on
Beijing and Shanghai: RMB37.1bn, 69% of total
investment; Average cost RMB12,074 per
sq.m, showcasing relatively low-cost land
Surging sales volume and prices in first-tier cities
boosted the value of newly-invested land plots
Plenty of low-cost land resources in
core cities to provide strong growth
support in the future
Land Investment in 2015
11
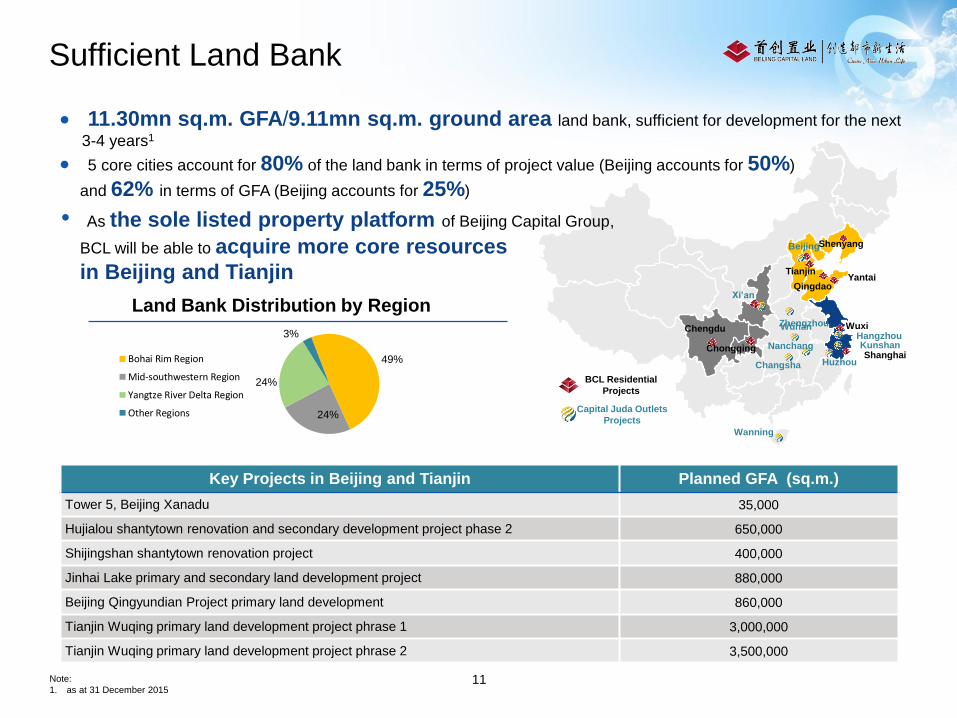
Sufficient Land Bank
Note:
1. as at 31 December 2015
49%
24%
24%
3%
Bohai Rim Region
Mid-southwestern Region
Yangtze River Delta Region
Other Regions Capital Juda Outlets
Projects
Shanghai
HangzhouChengdu
Chongqing
Xi’an
BeijingShenyang
Wuxi
Tianjin
Wanning
QingdaoYantai
Huzhou
Kunshan
Changsha
Nanchang
Wuhan
BCL Residential
Projects
Land Bank Distribution by RegionZhengzhou
Key Projects in Beijing and Tianjin Planned GFA (sq.m.)
Tower 5, Beijing Xanadu 35,000
Hujialou shantytown renovation and secondary development project phase 2 650,000
Shijingshan shantytown renovation project 400,000
Jinhai Lake primary and secondary land development project 880,000
Beijing Qingyundian Project primary land development 860,000
Tianjin Wuqing primary land development project phrase 1 3,000,000
Tianjin Wuqing primary land development project phrase 2 3,500,000
11.30mn sq.m. GFA/9.11mn sq.m. ground area land bank, sufficient for development for the next
3-4 years1
5 core cities account for 80% of the land bank in terms of project value (Beijing accounts for 50%)
and 62% in terms of GFA (Beijing accounts for 25%)
• As the sole listed property platform of Beijing Capital Group,
BCL will be able to acquire more core resources
in Beijing and Tianjin
12
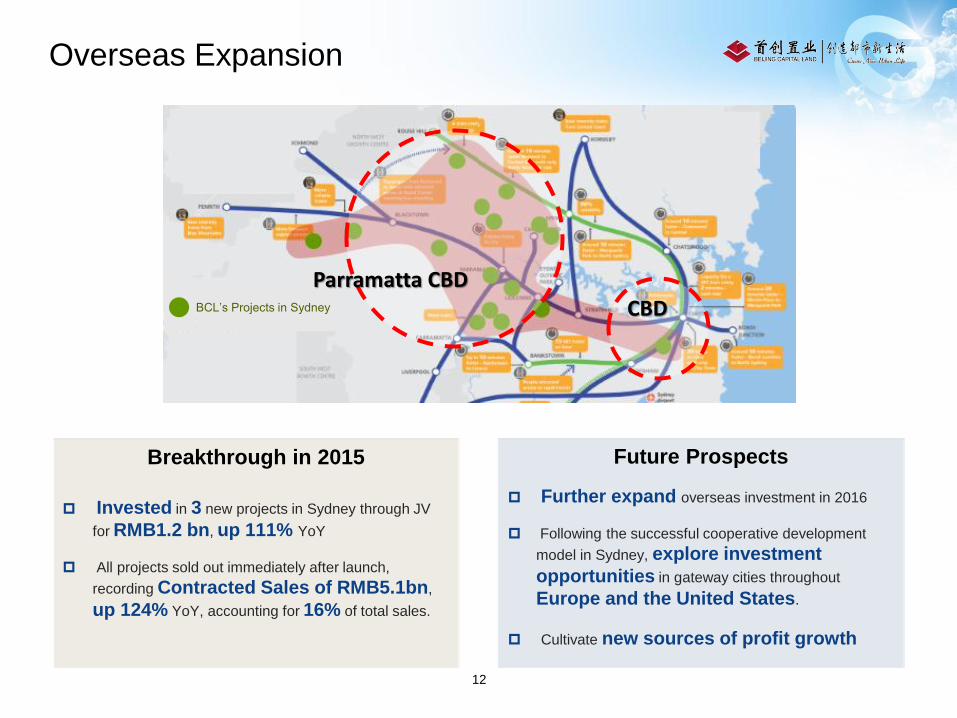
Future ProspectsBreakthrough in 2015
Invested in 3 new projects in Sydney through JV
for RMB1.2 bn, up 111% YoY
All projects sold out immediately after launch,
recording Contracted Sales of RMB5.1bn,
up 124% YoY, accounting for 16% of total sales.
Further expand overseas investment in 2016
Following the successful cooperative development
model in Sydney, explore investment
opportunities in gateway cities throughout
Europe and the United States.
Cultivate new sources of profit growth
BCL’s Projects in Sydney
Parramatta CBDCBD
Overseas Expansion
13
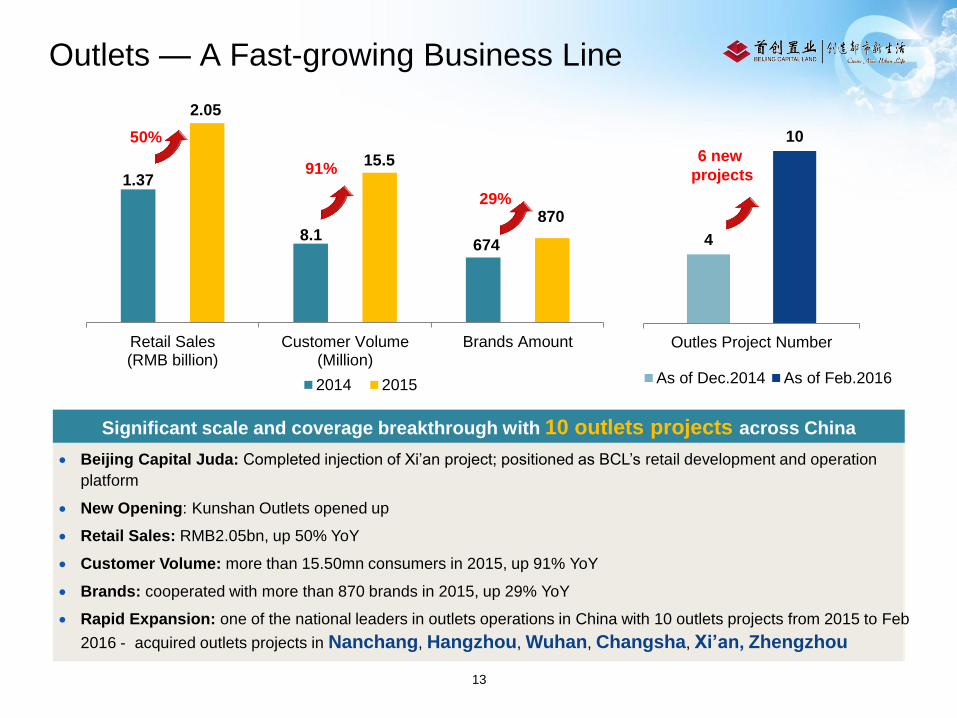
Retail Sales(RMB billion)
Customer Volume(Million)
Brands Amount
2014 2015
1.37
2.05
50%
8.1
15.591%
29%
674
870
4
10
Outles Project Number
As of Dec.2014 As of Feb.2016
Beijing Capital Juda: Completed injection of Xi’an project; positioned as BCL’s retail development and operation
platform
New Opening: Kunshan Outlets opened up
Retail Sales: RMB2.05bn, up 50% YoY
Customer Volume: more than 15.50mn consumers in 2015, up 91% YoY
Brands: cooperated with more than 870 brands in 2015, up 29% YoY
Rapid Expansion: one of the national leaders in outlets operations in China with 10 outlets projects from 2015 to Feb
2016 - acquired outlets projects in Nanchang, Hangzhou, Wuhan, Changsha, Xi’an, Zhengzhou
Significant scale and coverage breakthrough with 10 outlets projects across China
6 new
projects
Outlets — A Fast-growing Business Line
14
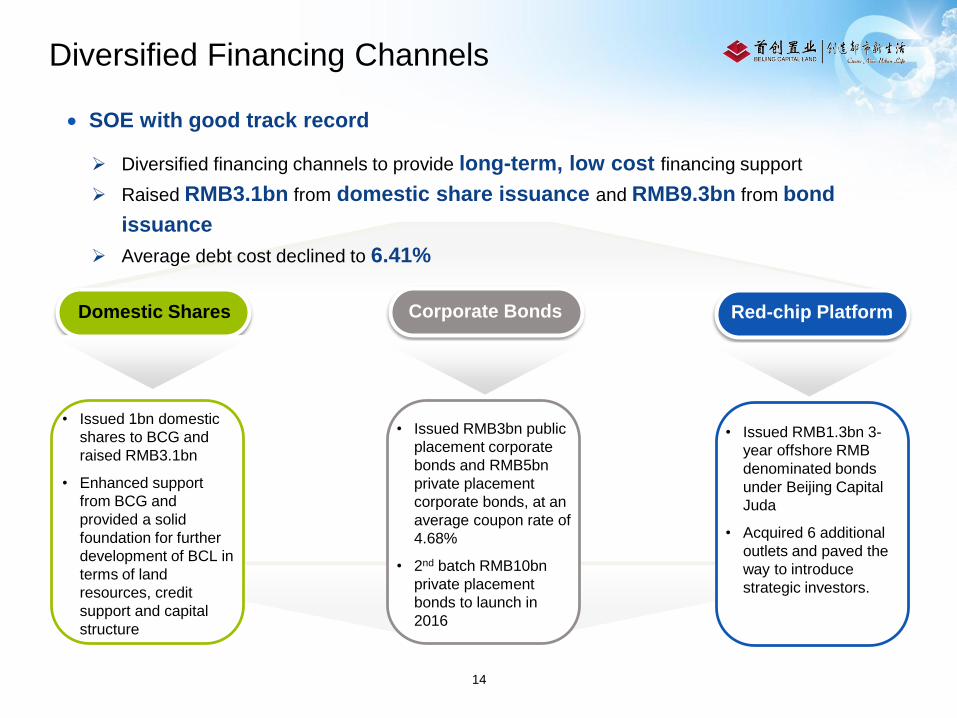
Domestic Shares Red-chip PlatformCorporate Bonds
• Issued 1bn domestic
shares to BCG and
raised RMB3.1bn
• Enhanced support
from BCG and
provided a solid
foundation for further
development of BCL in
terms of land
resources, credit
support and capital
structure
• Issued RMB1.3bn 3-
year offshore RMB
denominated bonds
under Beijing Capital
Juda
• Acquired 6 additional
outlets and paved the
way to introduce
strategic investors.
• Issued RMB3bn public
placement corporate
bonds and RMB5bn
private placement
corporate bonds, at an
average coupon rate of
4.68%
• 2nd batch RMB10bn
private placement
bonds to launch in
2016
SOE with good track record
Diversified financing channels to provide long-term, low cost financing support
Raised RMB3.1bn from domestic share issuance and RMB9.3bn from bond
issuance
Average debt cost declined to 6.41%
Diversified Financing Channels
15
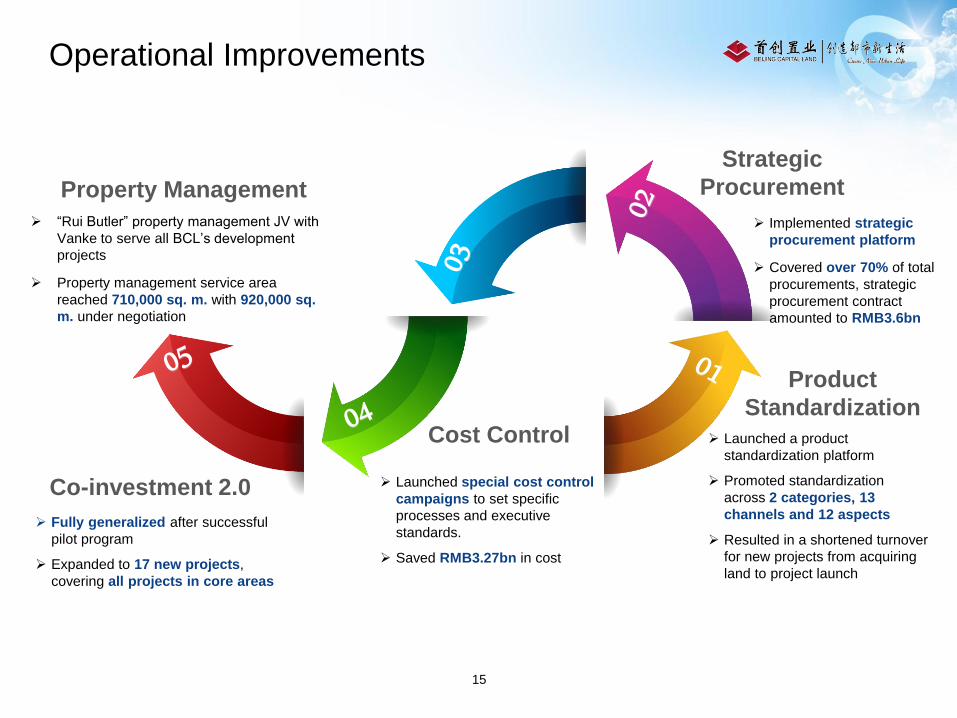
Property Management
Cost Control
Strategic
Procurement
Co-investment 2.0
Launched a product
standardization platform
Promoted standardization
across 2 categories, 13
channels and 12 aspects
Resulted in a shortened turnover
for new projects from acquiring
land to project launch
Implemented strategic
procurement platform
Covered over 70% of total
procurements, strategic
procurement contract
amounted to RMB3.6bn
Product
Standardization
Launched special cost control
campaigns to set specific
processes and executive
standards.
Saved RMB3.27bn in cost
Fully generalized after successful
pilot program
Expanded to 17 new projects,
covering all projects in core areas
“Rui Butler” property management JV with
Vanke to serve all BCL’s development
projects
Property management service area
reached 710,000 sq. m. with 920,000 sq.
m. under negotiation
Operational Improvements
16
Section 3
2016 Outlook
17
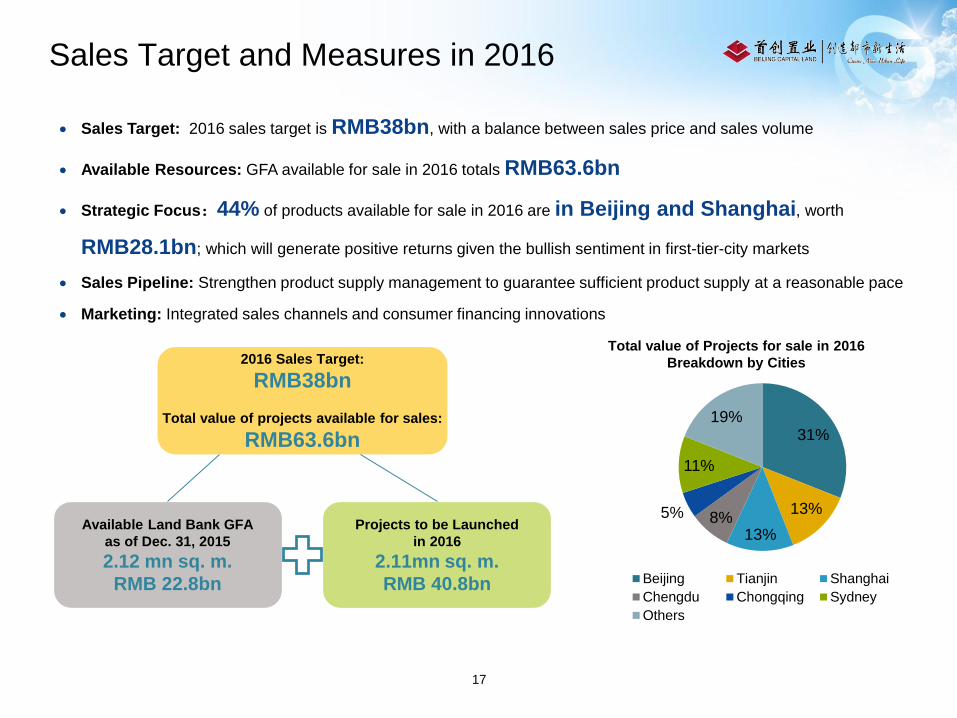
Sales Target and Measures in 2016
Available Land Bank GFA
as of Dec. 31, 2015
2.12 mn sq. m.
RMB 22.8bn
Projects to be Launched
in 2016
2.11mn sq. m.
RMB 40.8bn
2016 Sales Target:
RMB38bn
Total value of projects available for sales:
RMB63.6bn
Sales Target: 2016 sales target is RMB38bn, with a balance between sales price and sales volume
Available Resources: GFA available for sale in 2016 totals RMB63.6bn
Strategic Focus:44% of products available for sale in 2016 are in Beijing and Shanghai, worth
RMB28.1bn; which will generate positive returns given the bullish sentiment in first-tier-city markets
Sales Pipeline: Strengthen product supply management to guarantee sufficient product supply at a reasonable pace
Marketing: Integrated sales channels and consumer financing innovations
31%
13%
13%8%5%
11%
19%
Beijing Tianjin Shanghai
Chengdu Chongqing Sydney
Others
Total value of Projects for sale in 2016
Breakdown by Cities
18
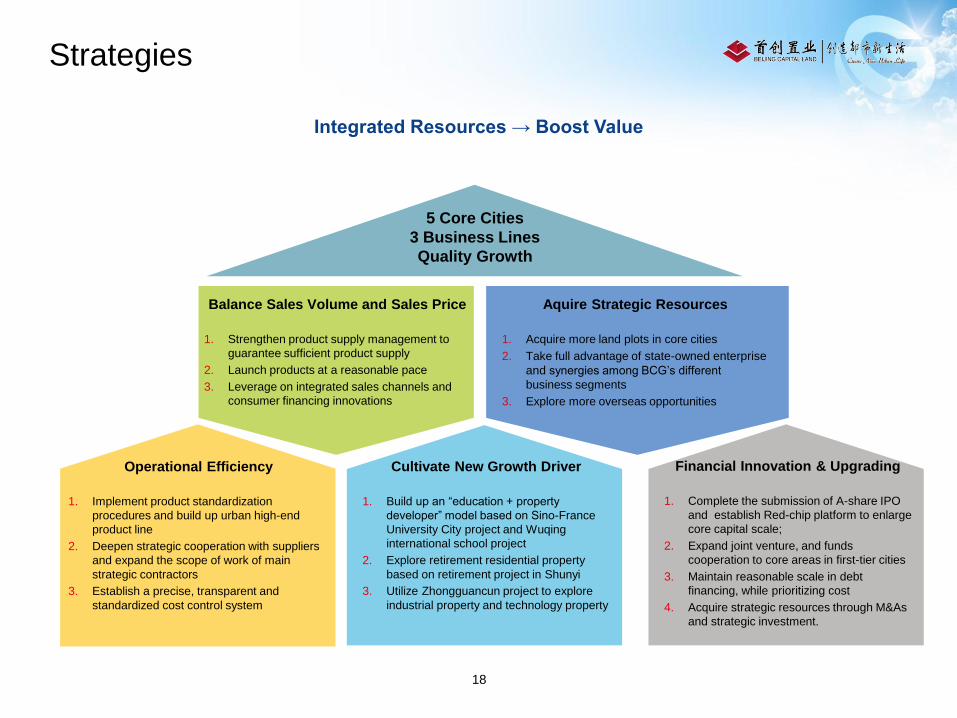
Integrated Resources → Boost Value
5 Core Cities
3 Business Lines
Quality Growth
Balance Sales Volume and Sales Price
1. Strengthen product supply management to
guarantee sufficient product supply
2. Launch products at a reasonable pace
3. Leverage on integrated sales channels and
consumer financing innovations
Aquire Strategic Resources
1. Acquire more land plots in core cities
2. Take full advantage of state-owned enterprise
and synergies among BCG’s different
business segments
3. Explore more overseas opportunities
Operational Efficiency
1. Implement product standardization
procedures and build up urban high-end
product line
2. Deepen strategic cooperation with suppliers
and expand the scope of work of main
strategic contractors
3. Establish a precise, transparent and
standardized cost control system
Cultivate New Growth Driver
1. Build up an “education + property
developer” model based on Sino-France
University City project and Wuqing
international school project
2. Explore retirement residential property
based on retirement project in Shunyi
3. Utilize Zhongguancun project to explore
industrial property and technology property
Financial Innovation & Upgrading
1. Complete the submission of A-share IPO
and establish Red-chip platform to enlarge
core capital scale;
2. Expand joint venture, and funds
cooperation to core areas in first-tier cities
3. Maintain reasonable scale in debt
financing, while prioritizing cost
4. Acquire strategic resources through M&As
and strategic investment.
Strategies
19
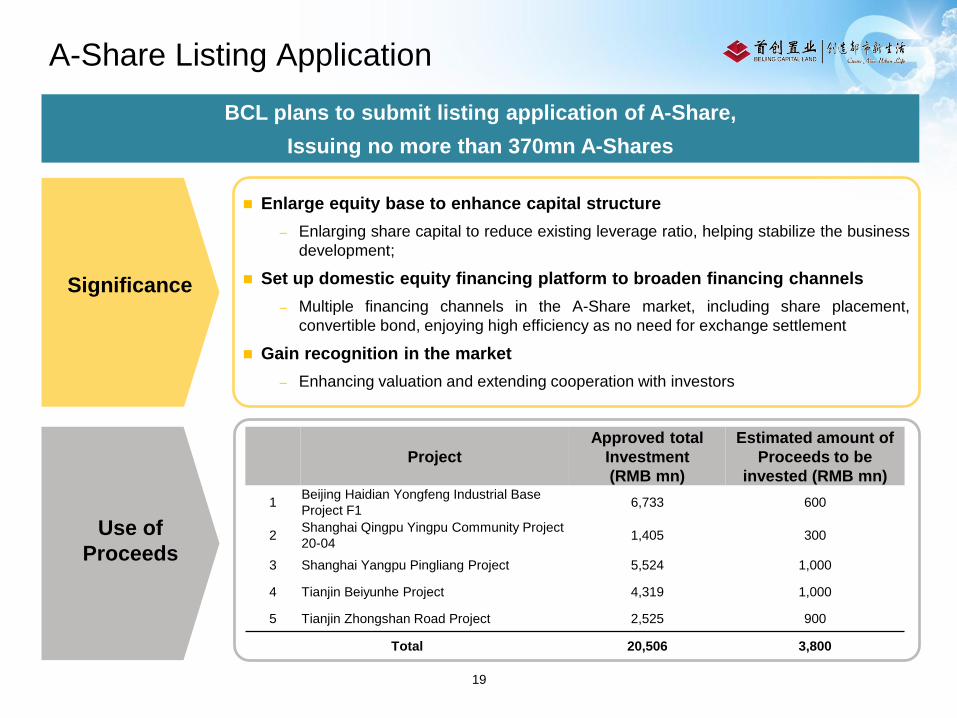
Enlarge equity base to enhance capital structure
– Enlarging share capital to reduce existing leverage ratio, helping stabilize the business
development;
Set up domestic equity financing platform to broaden financing channels
– Multiple financing channels in the A-Share market, including share placement,
convertible bond, enjoying high efficiency as no need for exchange settlement
Gain recognition in the market
– Enhancing valuation and extending cooperation with investors
BCL plans to submit listing application of A-Share,
Issuing no more than 370mn A-Shares
Significance
Project
Approved total
Investment
(RMB mn)
Estimated amount of
Proceeds to be
invested (RMB mn)
1Beijing Haidian Yongfeng Industrial Base
Project F16,733 600
2Shanghai Qingpu Yingpu Community Project
20-041,405 300
3 Shanghai Yangpu Pingliang Project 5,524 1,000
4 Tianjin Beiyunhe Project 4,319 1,000
5 Tianjin Zhongshan Road Project 2,525 900
Total 20,506 3,800
Use of
Proceeds
A-Share Listing Application
20
Q&A


![Newsletter (2868.HK) May 09 - 首创置业 · building, SOHO apartment, ... Coherent with the theme of the ... Microsoft PowerPoint - BCL_Newsletter_May 2009_E_[1] Author:](https://img.pdfslide.net/doc/110x75/5b63695f7f8b9a687e8bf5e8/newsletter-2868hk-may-09-building-soho-apartment-coherent.jpg)


![I.D. No. 1 11/04/2021 RESOLUTION NO. [2868]](https://img.pdfslide.net/doc/110x75/61f2a0091248db29392cab45/id-no-1-11042021-resolution-no-2868.jpg)