Embed Size (px)
Citation preview
Beijing Urban Spatial Development Model Families: From Macro, Meso to Micro Level
LONG Ying, Ph.D., Beijing Institute of City Planning MAO Qizhi, Ph.D., School of Architecture, Tsinghua University
DANG Anrong, Ph.D., School of Architecture, Tsinghua University

Applied urban modelling (AUM)
! This report falls into the pool of AUM o Rather than theoretical urban modelling
! Increasingly complex urban system o Residents, firms, buildings, parcels, policies, laws, standards and regulations o Integrated platform required for handling various aspects, giving thanks to the
booming of IT o Man brain not applicable any more, of decision makers, planners even modelers
! City lab for testing policies o Evaluation o Forecasting o Scenario analysis
! Dozens of extensively applied approaches in existing researches o Various spatial scales o Structural, static and dynamic o Top-down vs. bottom-up
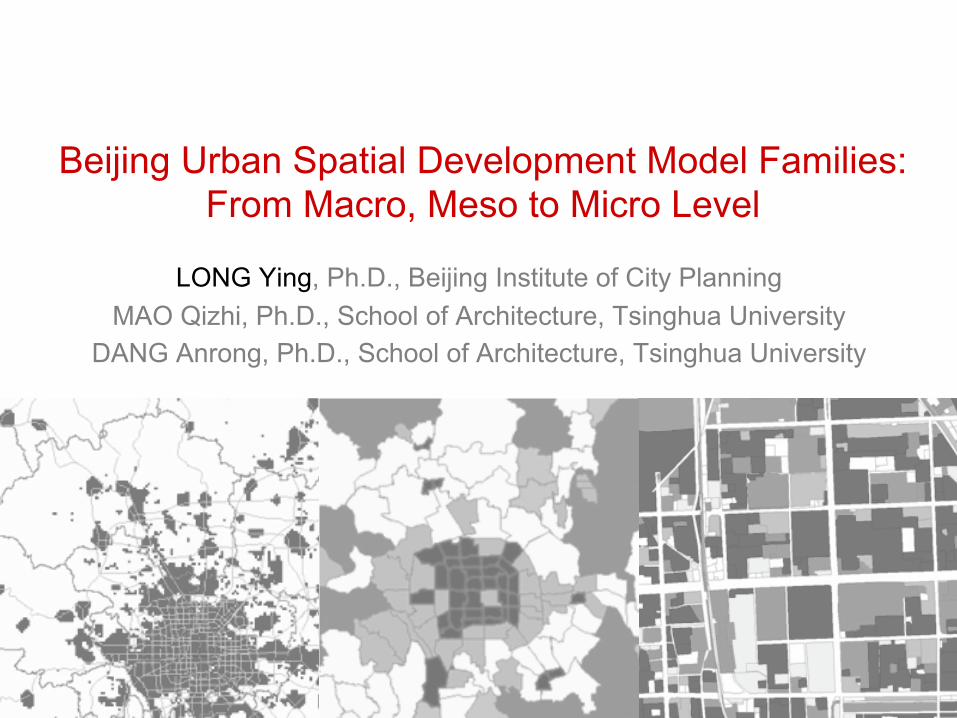
Applied urban modelling: a glance Adapted from: Dynamic Microsimulation: UrbanSim, Webinar 5 of 8-part TMIP, Webinar series on land use forecasting methods.
• Structure models • Static models (most are top-down) • Dynamic models (both bottom-up and top-down)
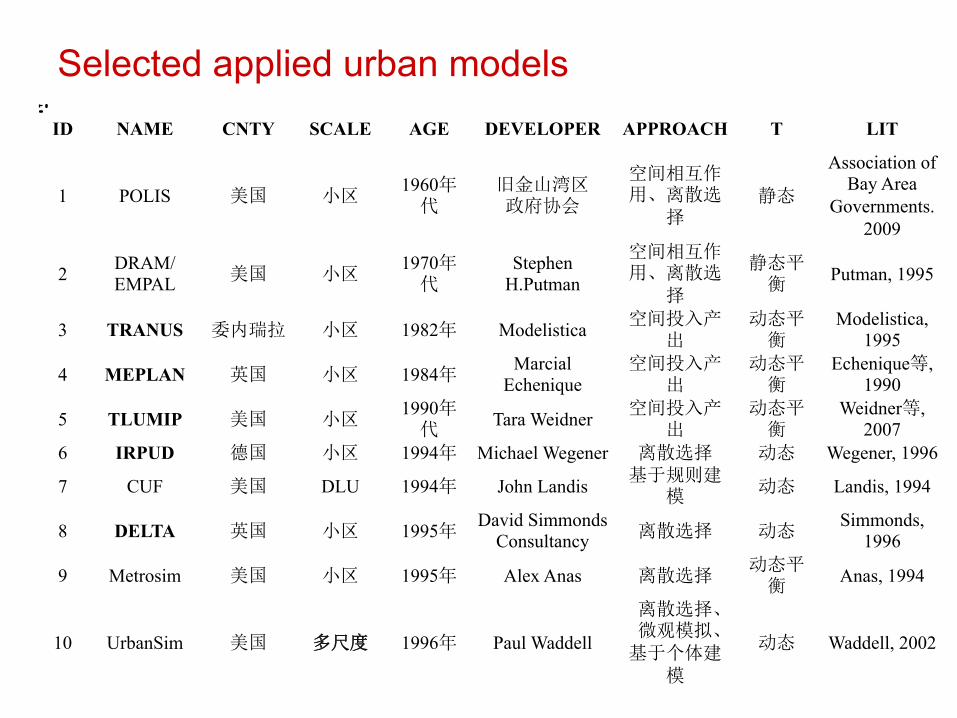
Selected applied urban models ID NAME CNTY SCALE AGE DEVELOPER APPROACH T LIT
1 POLIS 美国 小区 1960年代
旧金山湾区 政府协会
空间相互作用、离散选
择 静态
Association of Bay Area
Governments. 2009
2 DRAM/EMPAL 美国 小区
1970年代
Stephen H.Putman
空间相互作用、离散选
择
静态平衡 Putman, 1995
3 TRANUS 委内瑞拉 小区 1982年 Modelistica 空间投入产出
动态平衡
Modelistica, 1995
4 MEPLAN 英国 小区 1984年 Marcial
Echenique 空间投入产
出 动态平衡
Echenique等, 1990
5 TLUMIP 美国 小区 1990年代 Tara Weidner 空间投入产
出 动态平衡
Weidner等, 2007
6 IRPUD 德国 小区 1994年 Michael Wegener 离散选择 动态 Wegener, 1996
7 CUF 美国 DLU 1994年 John Landis 基于规则建模 动态 Landis, 1994
8 DELTA 英国 小区 1995年 David Simmonds
Consultancy 离散选择 动态 Simmonds,
1996
9 Metrosim 美国 小区 1995年 Alex Anas 离散选择 动态平衡 Anas, 1994
10 UrbanSim 美国 多尺度 1996年 Paul Waddell
离散选择、微观模拟、基于个体建
模
动态 Waddell, 2002
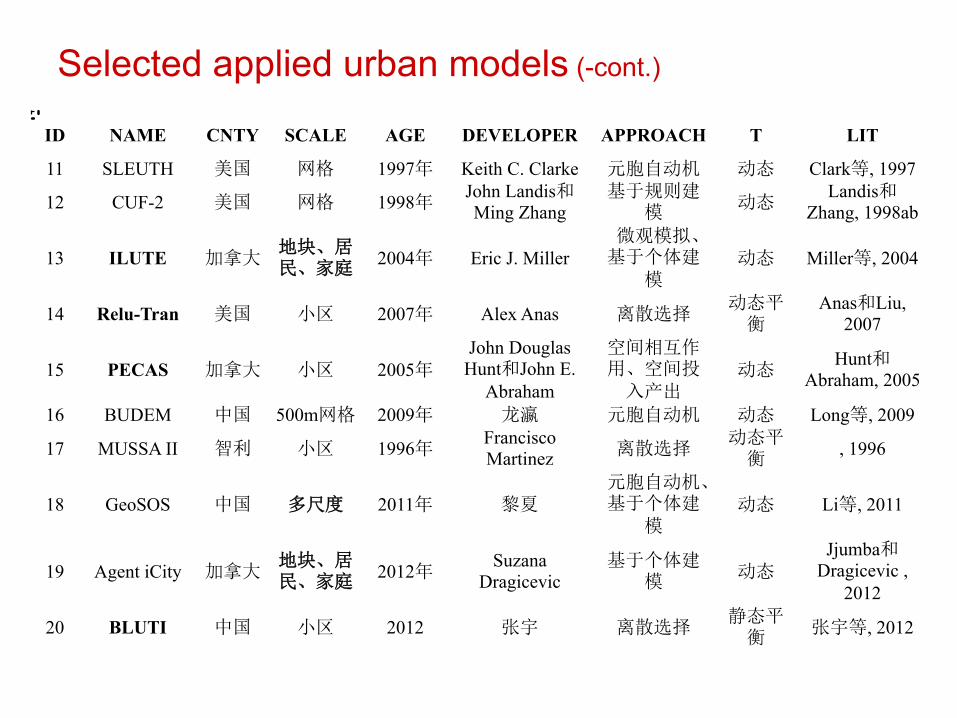
ID NAME CNTY SCALE AGE DEVELOPER APPROACH T LIT
11 SLEUTH 美国 网格 1997年 Keith C. Clarke 元胞自动机 动态 Clark等, 1997
12 CUF-2 美国 网格 1998年 John Landis和Ming Zhang
基于规则建模 动态
Landis和Zhang, 1998ab
13 ILUTE 加拿大 地块、居民、家庭 2004年 Eric J. Miller
微观模拟、基于个体建
模 动态 Miller等, 2004
14 Relu-Tran 美国 小区 2007年 Alex Anas 离散选择 动态平衡
Anas和Liu, 2007
15 PECAS 加拿大 小区 2005年 John Douglas
Hunt和John E. Abraham
空间相互作用、空间投入产出
动态 Hunt和
Abraham, 2005
16 BUDEM 中国 500m网格 2009年 龙瀛 元胞自动机 动态 Long等, 2009
17 MUSSA II 智利 小区 1996年 Francisco Martinez 离散选择
动态平衡 , 1996
18 GeoSOS 中国 多尺度 2011年 黎夏 元胞自动机、基于个体建
模 动态 Li等, 2011
19 Agent iCity 加拿大 地块、居民、家庭 2012年
Suzana Dragicevic
基于个体建模 动态
Jjumba和Dragicevic ,
2012
20 BLUTI 中国 小区 2012 张宇 离散选择 静态平衡 张宇等, 2012
Selected applied urban models (-cont.)
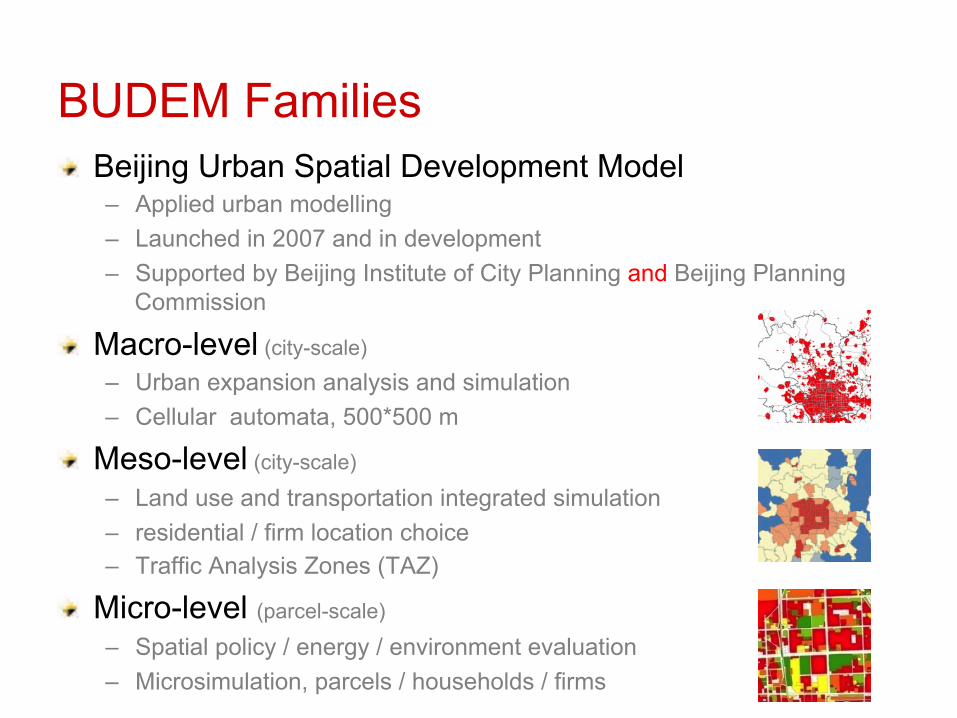
BUDEM Families! Beijing Urban Spatial Development Model
– Applied urban modelling – Launched in 2007 and in development – Supported by Beijing Institute of City Planning and Beijing Planning
Commission
! Macro-level (city-scale) – Urban expansion analysis and simulation – Cellular automata, 500*500 m
! Meso-level (city-scale)
– Land use and transportation integrated simulation – residential / firm location choice – Traffic Analysis Zones (TAZ)
! Micro-level (parcel-scale) – Spatial policy / energy / environment evaluation – Microsimulation, parcels / households / firms
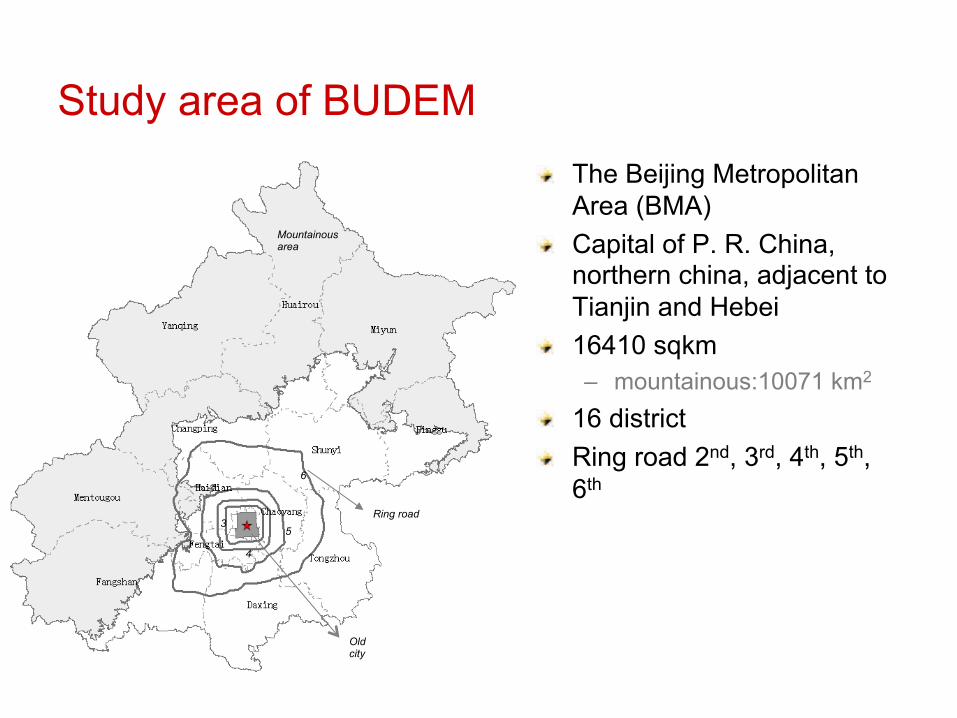
Study area of BUDEM! The Beijing Metropolitan
Area (BMA) ! Capital of P. R. China,
northern china, adjacent to Tianjin and Hebei
! 16410 sqkm – mountainous:10071 km2
! 16 district ! Ring road 2nd, 3rd, 4th, 5th,
6th
Mountainous area
6
5
4
3
Old city
Ring road
(
)
)( ( ( (
-0 8
85
13
69724
1947 1976 1981 1986 1991 1996 2001 2006
2 65 1A 5 45 8 .9 0 8 3575
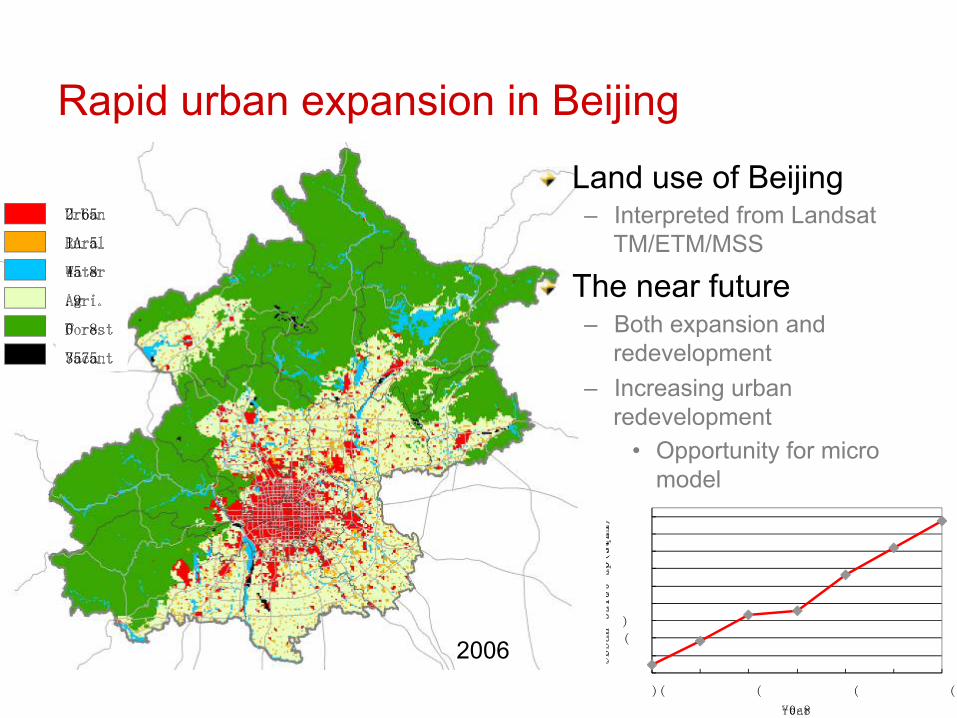
Rapid urban expansion in Beijing
! Land use of Beijing – Interpreted from Landsat
TM/ETM/MSS
! The near future – Both expansion and
redevelopment – Increasing urban
redevelopment • Opportunity for micro
model
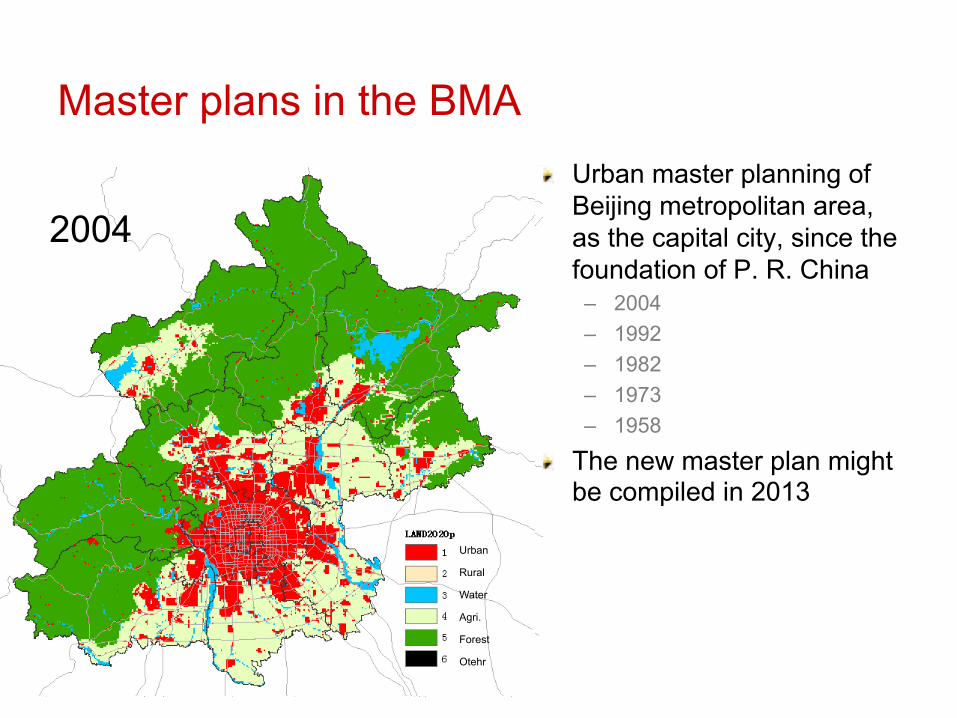
Master plans in the BMA! Urban master planning of
Beijing metropolitan area, as the capital city, since the foundation of P. R. China
– 2004 – 1992 – 1982 – 1973 – 1958
! The new master plan might be compiled in 2013
1958 1973 1982 1992 2004
Urban
Rural
Water
Agri.
Forest
Otehr
All focusing on spatial! Urban growth / expansion, redevelopment ! Urban form / urban structure ! Strong relationship between urban spatial
organization and CO2 emission – Owens, 1987, Anderson et al., 1996; Banister et al., 1997
Macro BUDEM (2006-)
! Identifying driving force of urban expansion in various historical phases
! Evaluating the effectiveness of urban master plans in urban expansion
! Retrieving policies required to implement master plan for 2020
! Simulating urban growth scenarios with different policies set in 2049
! Planning support system for practical urban planning and management (various developing policies)
MACRO MESO MICRO
Long Y, Mao Q, Dang A, 2009, “Beijing urban development model: Urban growth analysis and simulation” Tsinghua Science and Technology 14(6) 787-794
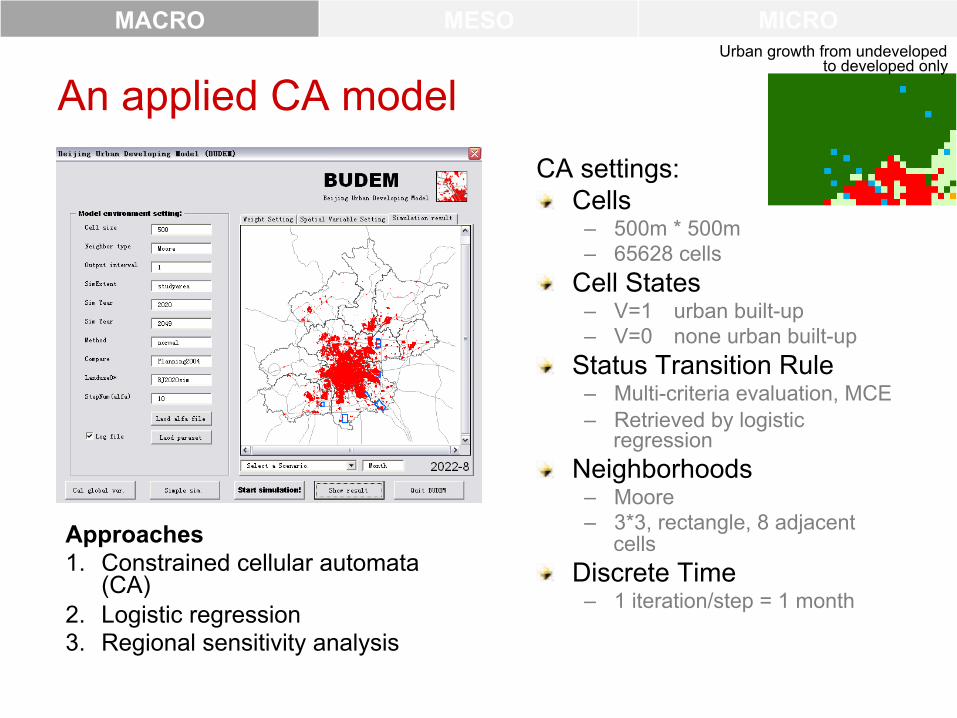
An applied CA modelCA settings: ! Cells
– 500m * 500m – 65628 cells
! Cell States – V=1 urban built-up – V=0 none urban built-up
! Status Transition Rule – Multi-criteria evaluation, MCE – Retrieved by logistic
regression ! Neighborhoods
– Moore – 3*3, rectangle, 8 adjacent
cells ! Discrete Time
– 1 iteration/step = 1 month
MACRO MESO MICROUrban growth from undeveloped
to developed only
Approaches 1. Constrained cellular automata
(CA) 2. Logistic regression 3. Regional sensitivity analysis
{ }{ }
1, ,
,
,
, , , , ,
, , , ,
, , ,
, ,
, , ,
,
_ , _ , _ , _ , _ ,
_ , _ , _ , _ ,
, _ , ,
t ti j i j
ti j
ti j
i j i j i j i j i j
i j i j i j i j
i j i j i j
V f V Global Local
V LOCATION GOVERNMENT NEIGHBOR
Vd tam d vcity d city d vtown d town
f d river r road d bdtown f rgnplanning con f landresource
+ =
=
=
,
,
1,
t ij
t ij
ti j
ti j
ti j
neighbor
V
V
f
+
⎧ ⎫⎪ ⎪⎪ ⎪⎪ ⎪⎨ ⎬⎪ ⎪⎪ ⎪⎪ ⎪⎩ ⎭
� �
� �
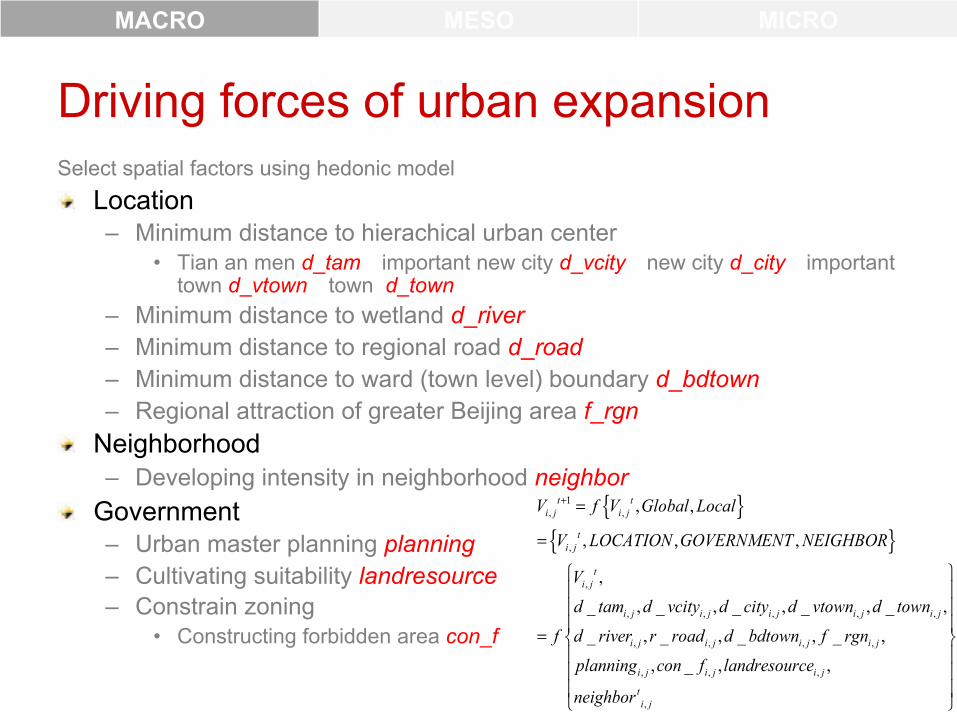
Driving forces of urban expansionSelect spatial factors using hedonic model! Location
– Minimum distance to hierachical urban center • Tian an men d_tam important new city d_vcity new city d_city important
town d_vtown town d_town – Minimum distance to wetland d_river – Minimum distance to regional road d_road – Minimum distance to ward (town level) boundary d_bdtown – Regional attraction of greater Beijing area f_rgn
! Neighborhood – Developing intensity in neighborhood neighbor
! Government – Urban master planning planning – Cultivating suitability landresource – Constrain zoning
• Constructing forbidden area con_f
MACRO MESO MICRO
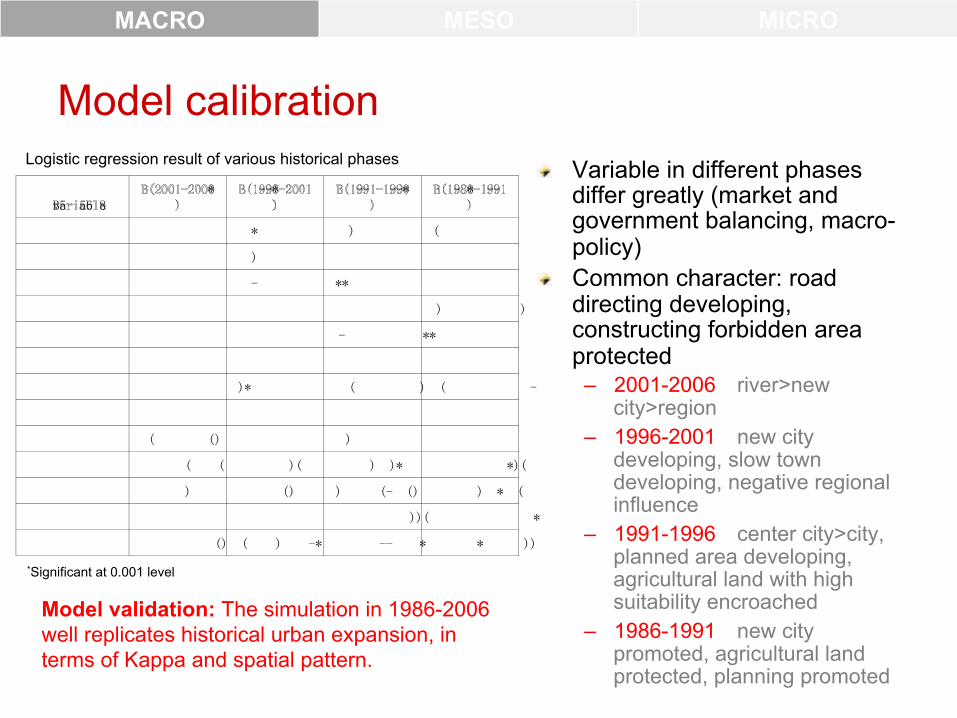
Model calibration! Variable in different phases
differ greatly (market and government balancing, macro-policy)
! Common character: road directing developing, constructing forbidden area protected
– 2001-2006 river>new city>region
– 1996-2001 new city developing, slow town developing, negative regional influence
– 1991-1996 center city>city, planned area developing, agricultural land with high suitability encroached
– 1986-1991 new city promoted, agricultural land protected, planning promoted
MACRO MESO MICRO
B5 56 8 *
--*
-- --*
- * --
* ) ( ) - ** ) ) - ** )* ( ) ( - ( () )
( ( )( ) )* *)( ) () ) (- () ) * (
))( * () ( ) -* -- * * ))
Logistic regression result of various historical phases
*Significant at 0.001 level
Model validation: The simulation in 1986-2006 well replicates historical urban expansion, in terms of Kappa and spatial pattern.

15
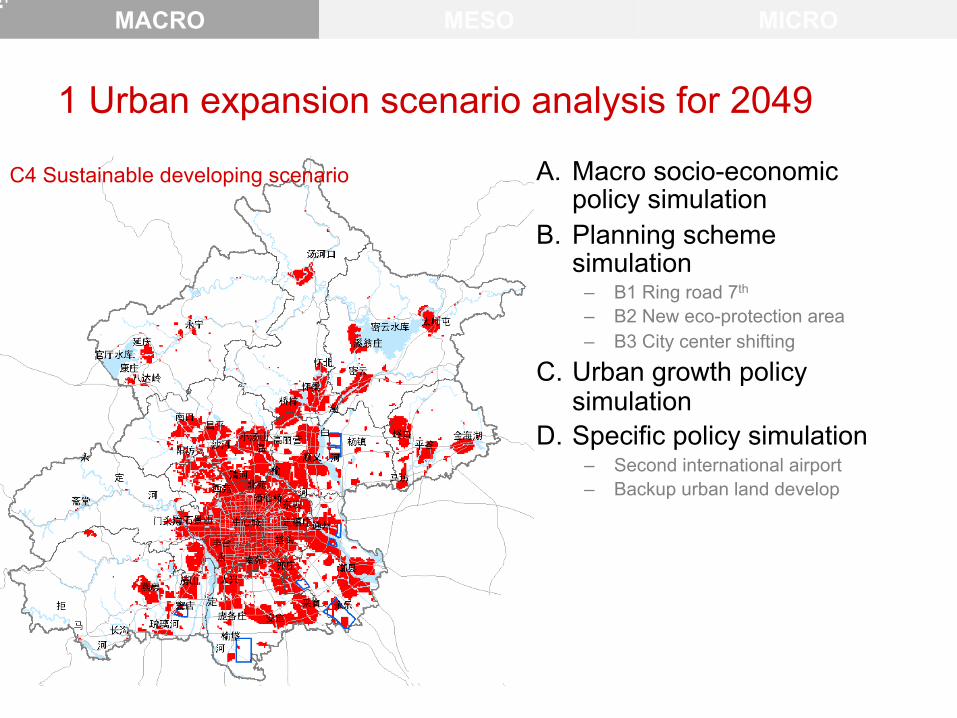
1 Urban expansion scenario analysis for 2049
A. Macro socio-economic policy simulation
B. Planning scheme simulation
– B1 Ring road 7th
– B2 New eco-protection area – B3 City center shifting
C. Urban growth policy simulation
D. Specific policy simulation – Second international airport – Backup urban land develop
MACRO MESO MICRO
A1 High speed population increasing A2 Low speed population increasing C1 Scenario with current developing trend C3 Grape-cluster developing scenario C4 Sustainable developing scenario
MACRO MESO MICRO
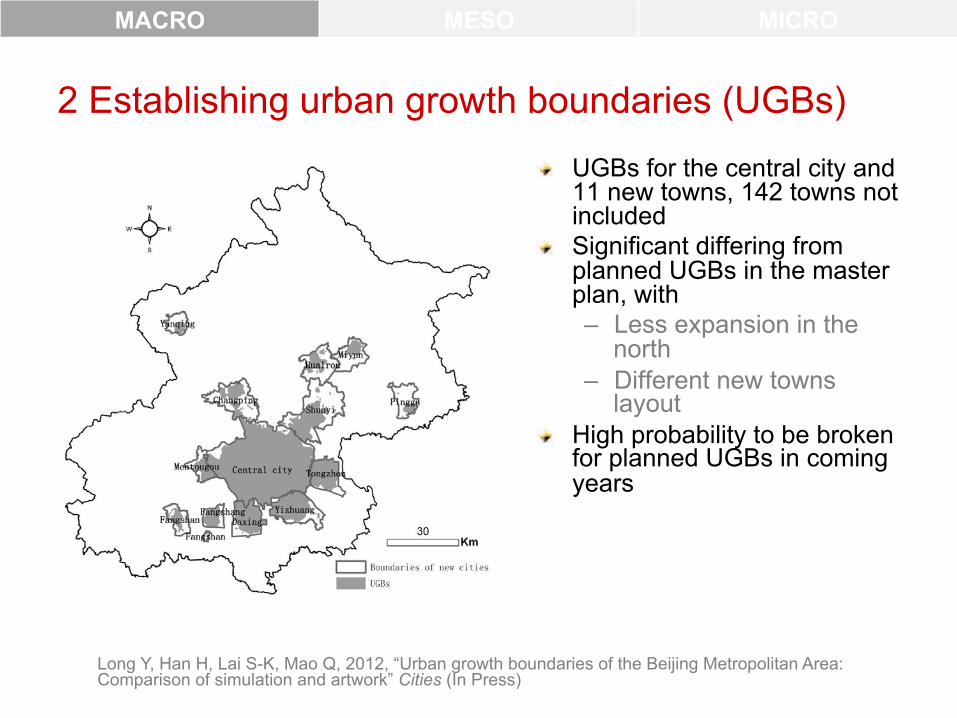
2 Establishing urban growth boundaries (UGBs)
! UGBs for the central city and 11 new towns, 142 towns not included
! Significant differing from planned UGBs in the master plan, with – Less expansion in the
north – Different new towns
layout ! High probability to be broken
for planned UGBs in coming years
Long Y, Han H, Lai S-K, Mao Q, 2012, “Urban growth boundaries of the Beijing Metropolitan Area: Comparison of simulation and artwork” Cities (In Press)
MACRO MESO MICRO
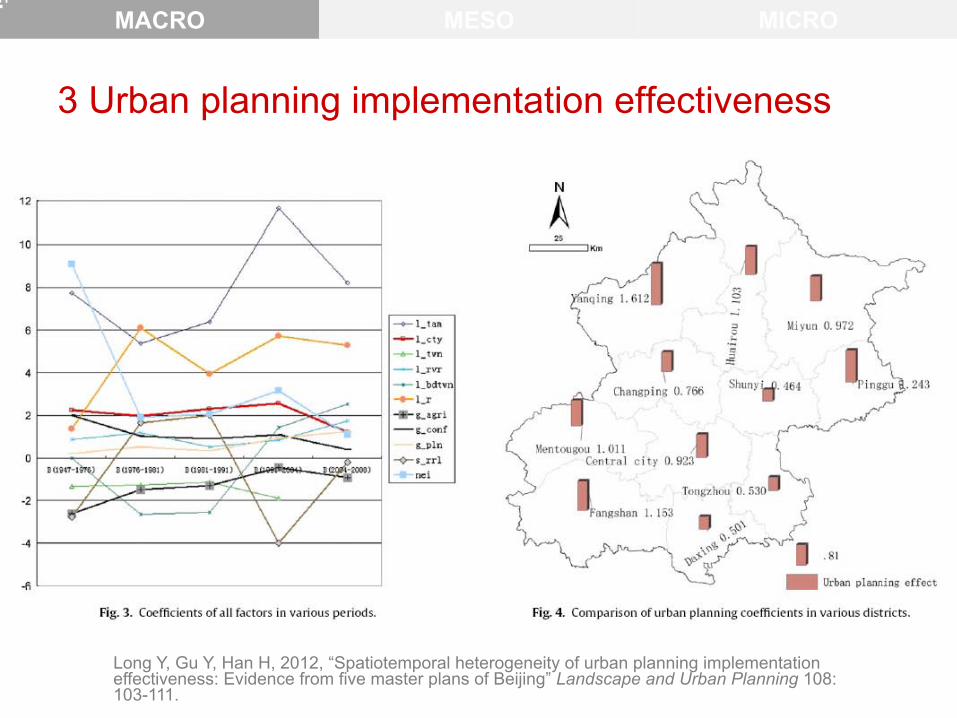
3 Urban planning implementation effectiveness
Long Y, Gu Y, Han H, 2012, “Spatiotemporal heterogeneity of urban planning implementation effectiveness: Evidence from five master plans of Beijing” Landscape and Urban Planning 108: 103-111.
MACRO MESO MICRO
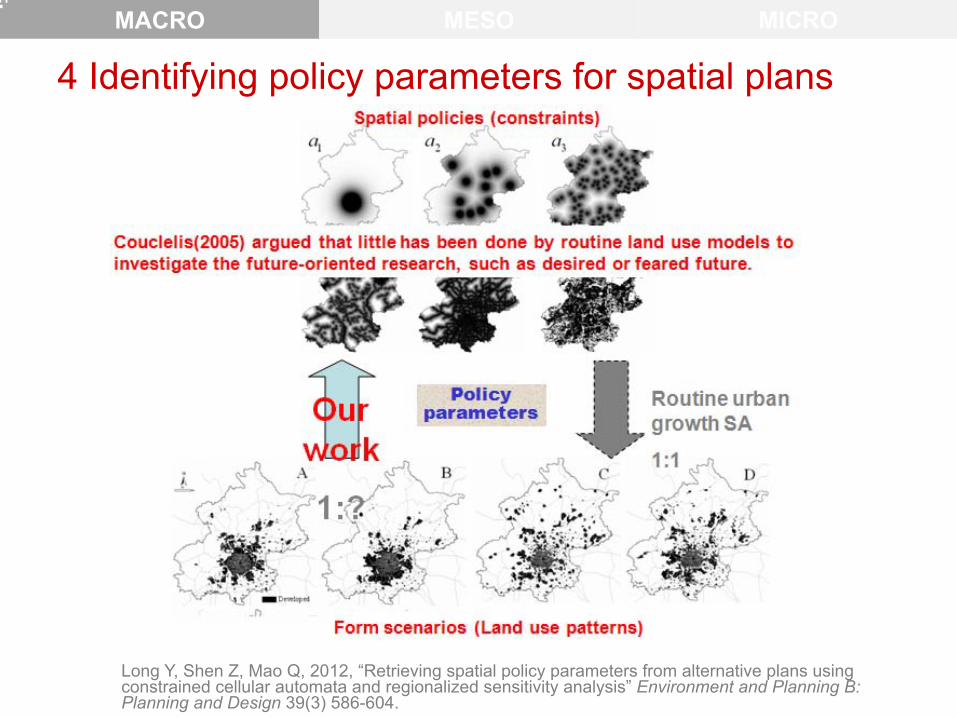
4 Identifying policy parameters for spatial plans
Long Y, Shen Z, Mao Q, 2012, “Retrieving spatial policy parameters from alternative plans using constrained cellular automata and regionalized sensitivity analysis” Environment and Planning B: Planning and Design 39(3) 586-604.
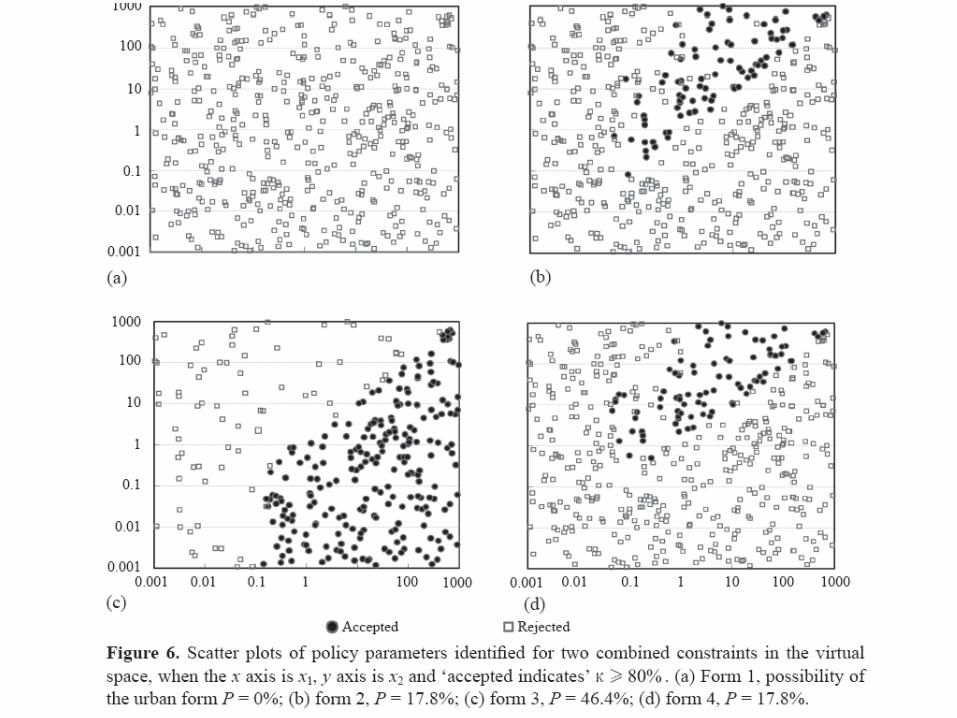
! Our findings: – Under current spatial policy settings, the spatial layout of master
plan for 2020 could not be implemented. – This module of Macro BUDEM could facilitate planners compiling
a spatial plan with higher possibility to be implemented.
! Backgrounds: – Planned layout is occasionally broken through in China due to
lack of consideration of economy factors – Empirical studies in Beijing, Guangzhou, and Shanghai (Han et
al, 2009; Xu et al, 2009; Tian et al, 2008)
MACRO MESO MICRO
MACRO MESO MICRO
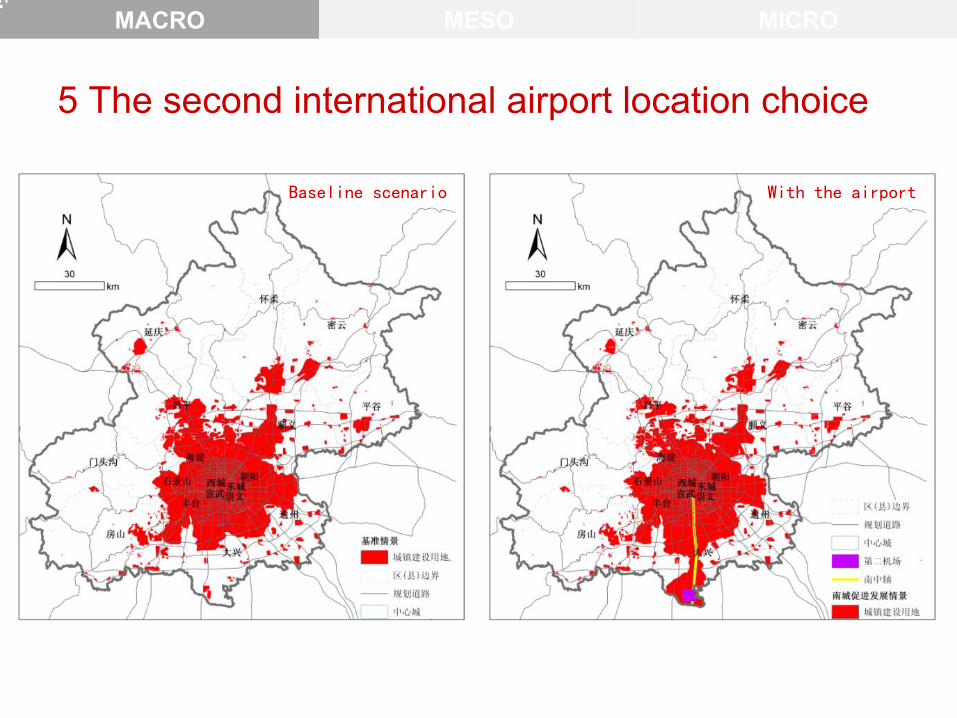
5 The second international airport location choice
Baseline scenario With the airport
MACRO MESO MICRO
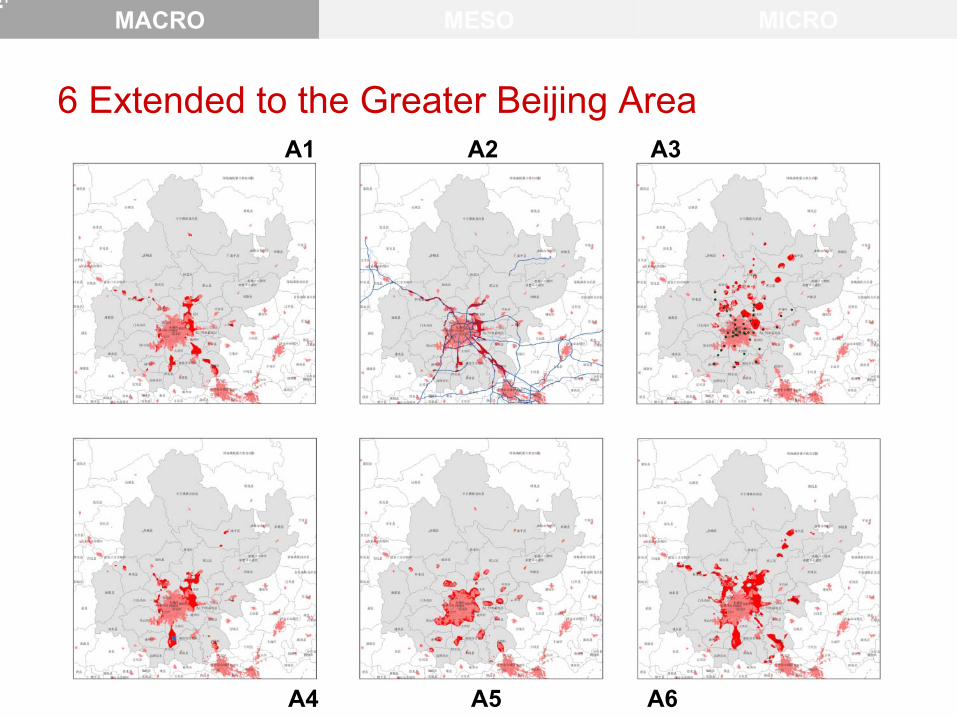
6 Extended to the Greater Beijing Area A1 A2 A3
A4 A5 A6
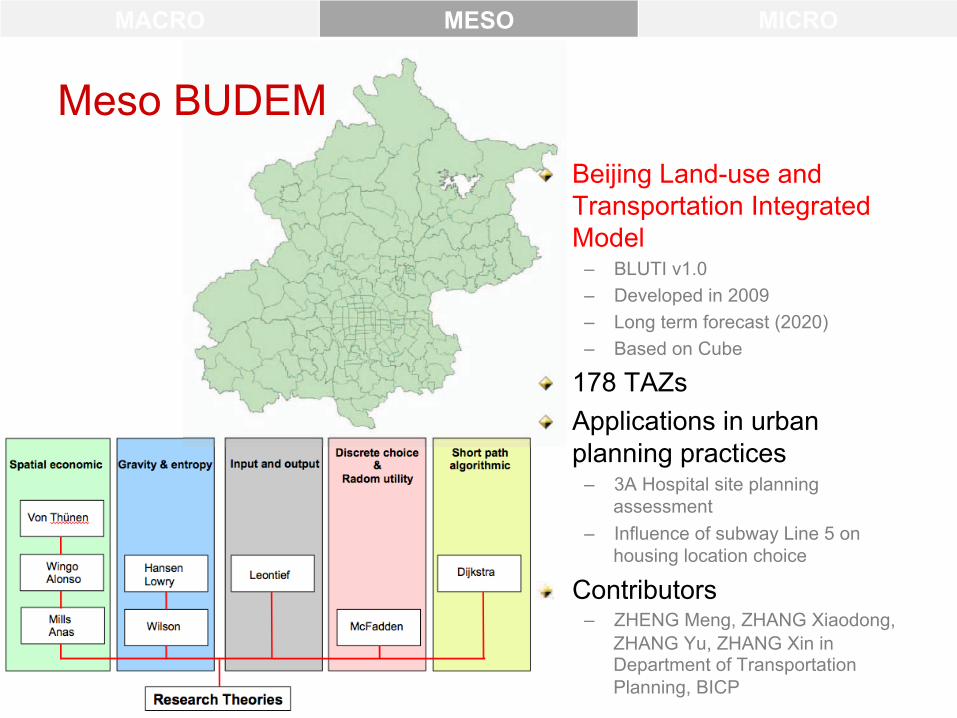
Meso BUDEM! Beijing Land-use and
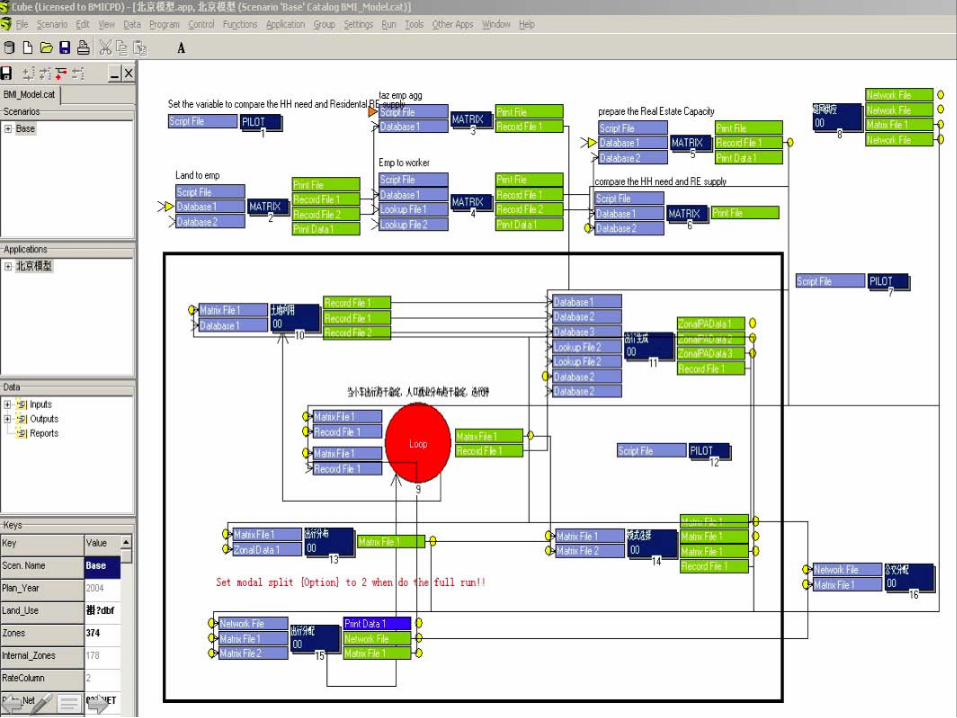
Transportation Integrated Model
– BLUTI v1.0 – Developed in 2009 – Long term forecast (2020) – Based on Cube
! 178 TAZs ! Applications in urban
planning practices – 3A Hospital site planning
assessment – Influence of subway Line 5 on
housing location choice
! Contributors – ZHENG Meng, ZHANG Xiaodong,
ZHANG Yu, ZHANG Xin in Department of Transportation Planning, BICP
MACRO MESO MICRO
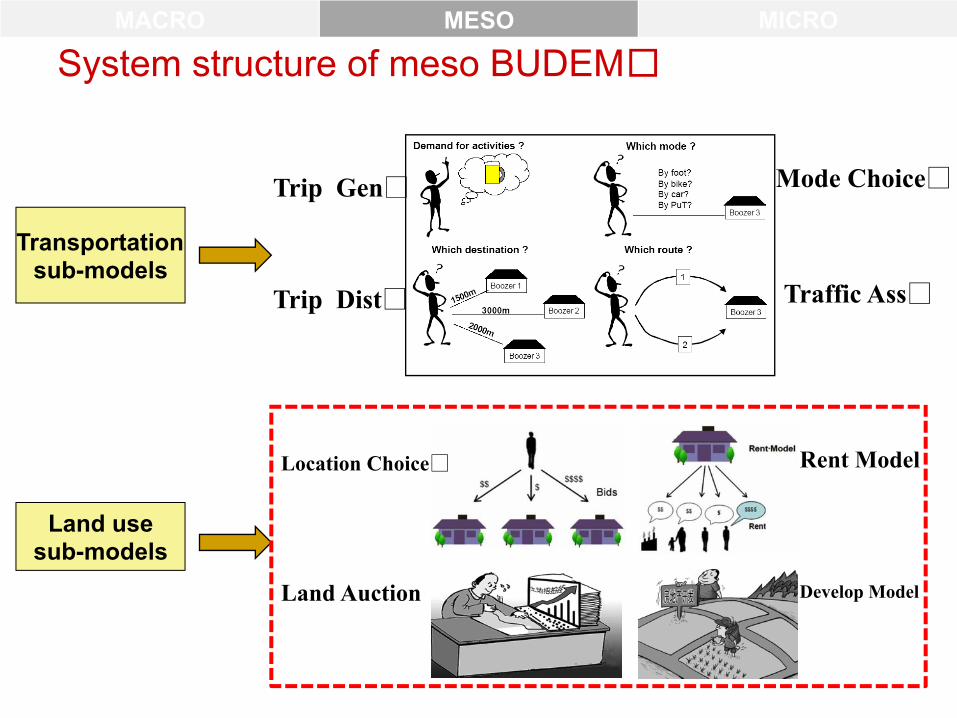
System structure of meso BUDEMMACRO MESO MICRO
Transportation sub-models
Land use sub-models
Trip Gen
Trip Dist
Mode Choice
Traffic Ass
Location Choice Rent Model
Develop Model Land Auction
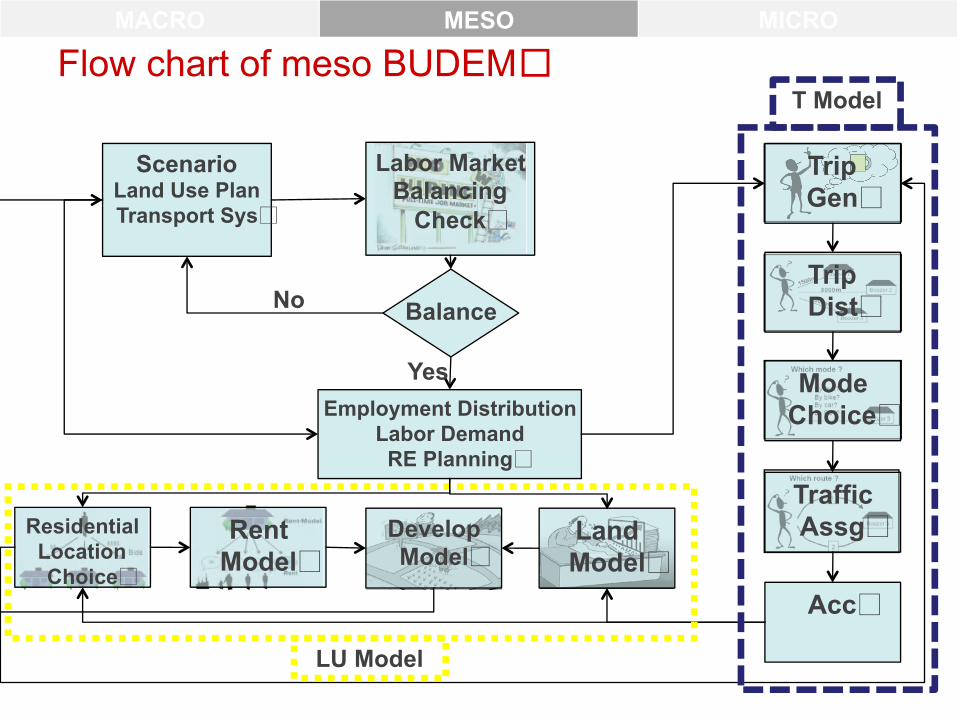
Flow chart of meso BUDEMMACRO MESO MICRO
Traffic Assg
Mode Choice
Trip Dist
Trip Gen
Land Model
Develop Model
Residential Location Choice
Scenario Land Use Plan Transport Sys
BalanceNo
Employment Distribution Labor Demand
RE Planning
Acc
Rent Model
Yes
LU Model
T Model
Labor Market Balancing
Check
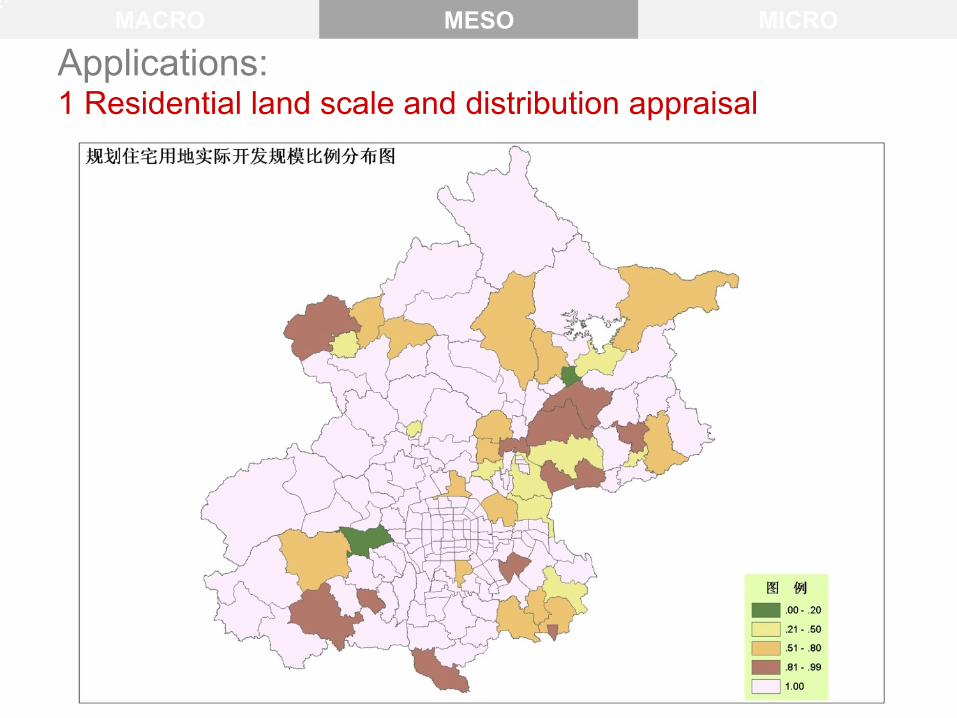
Applications: 1 Residential land scale and distribution appraisal
MACRO MESO MICRO
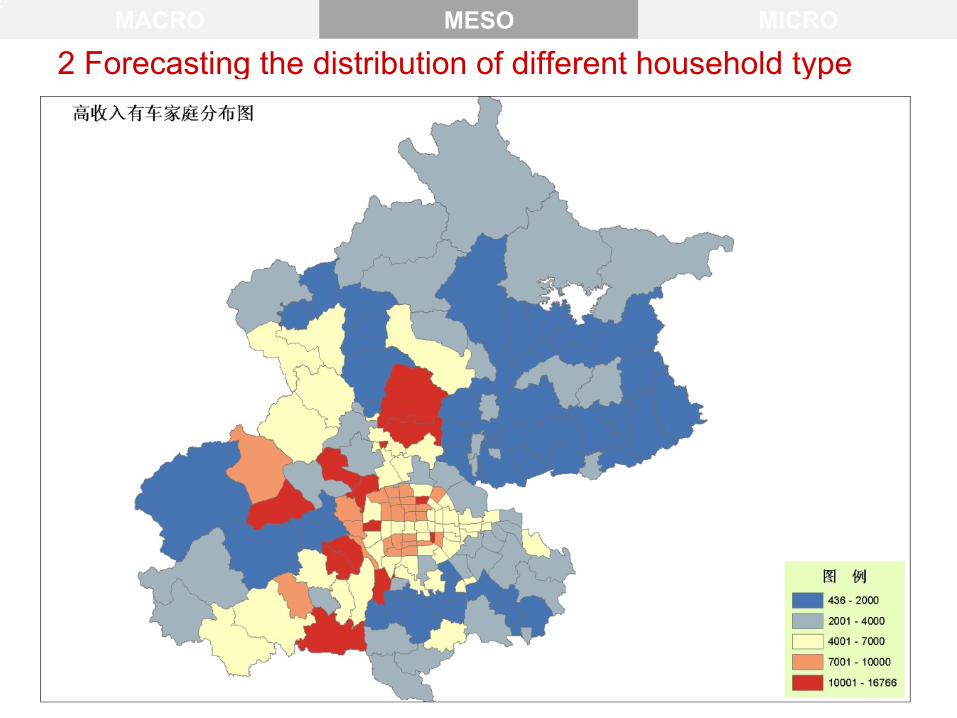
2 Forecasting the distribution of different household type MACRO MESO MICRO
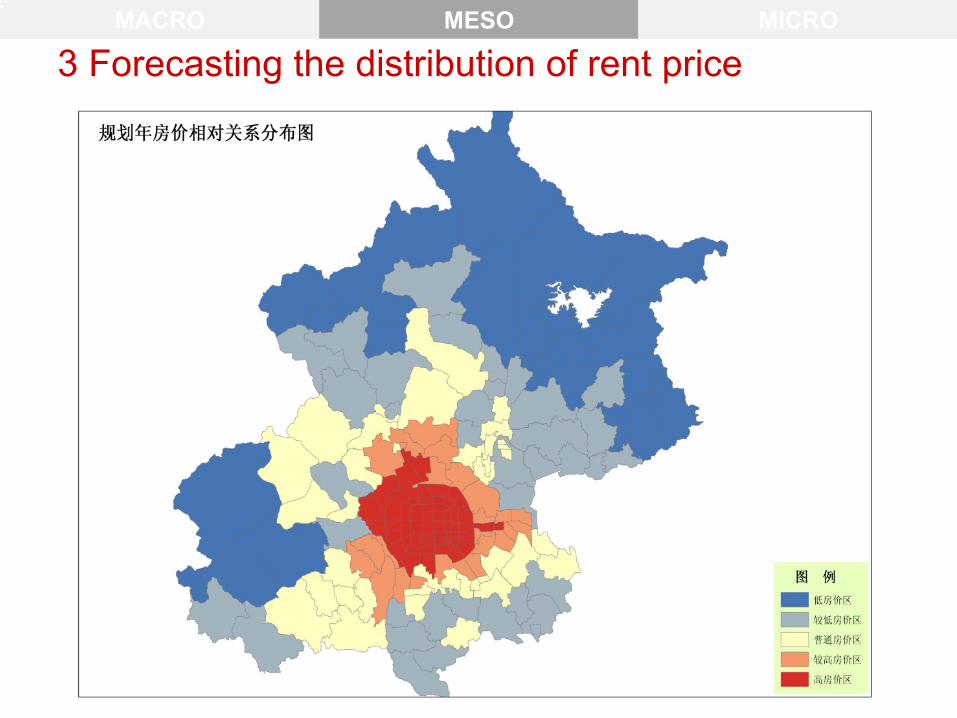
3 Forecasting the distribution of rent price MACRO MESO MICRO
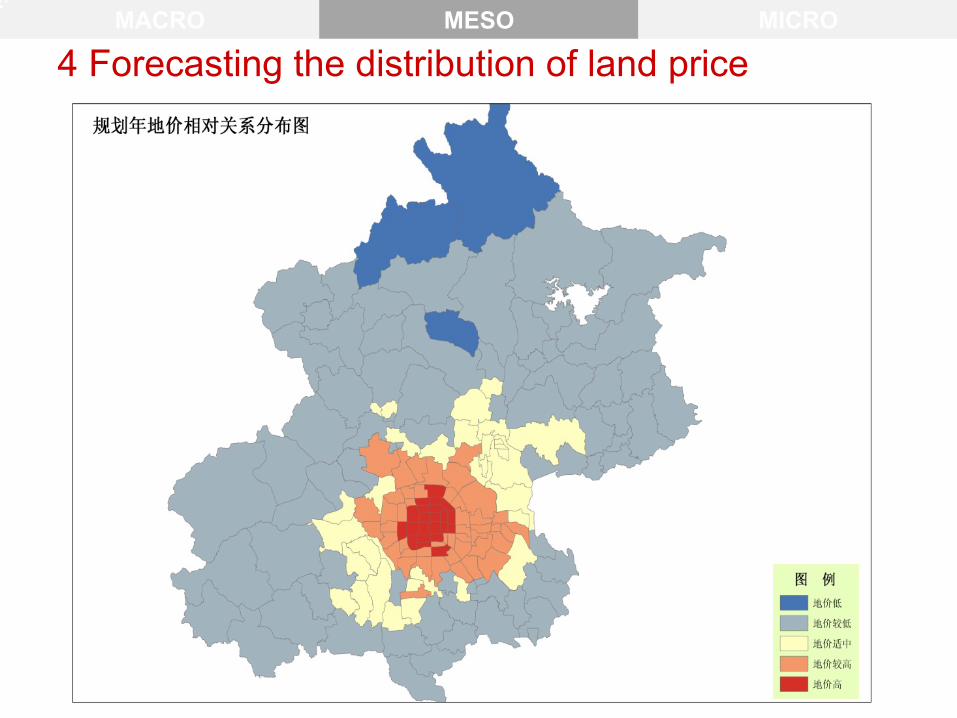
4 Forecasting the distribution of land price MACRO MESO MICRO
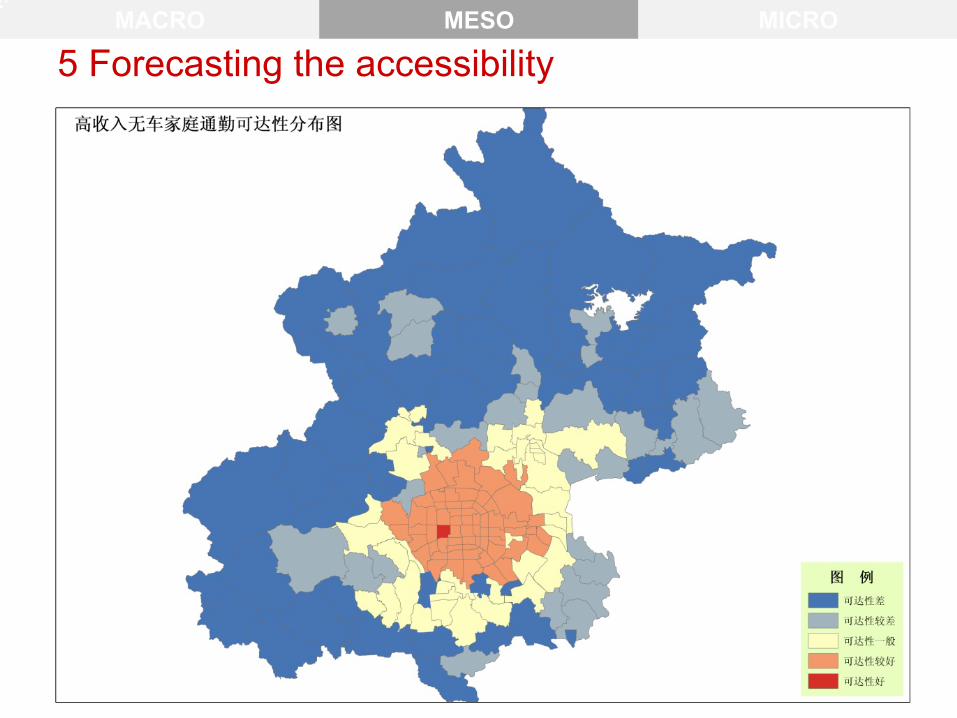
5 Forecasting the accessibility MACRO MESO MICRO
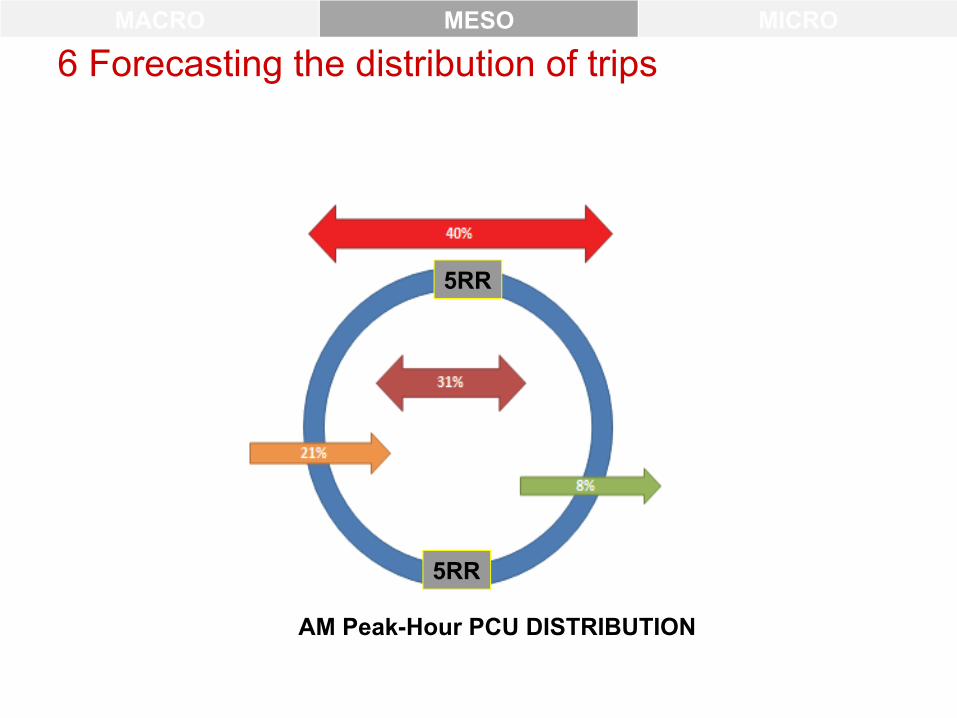
6 Forecasting the distribution of tripsMACRO MESO MICRO
AM Peak-Hour PCU DISTRIBUTION
5RR
5RR
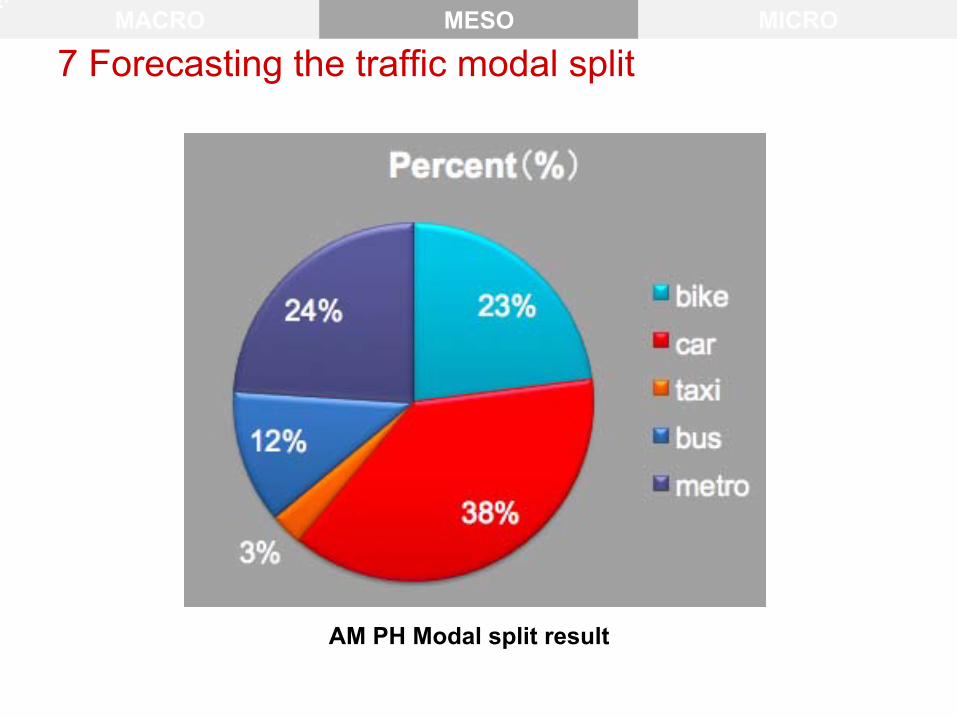
7 Forecasting the traffic modal split MACRO MESO MICRO
AM PH Modal split result
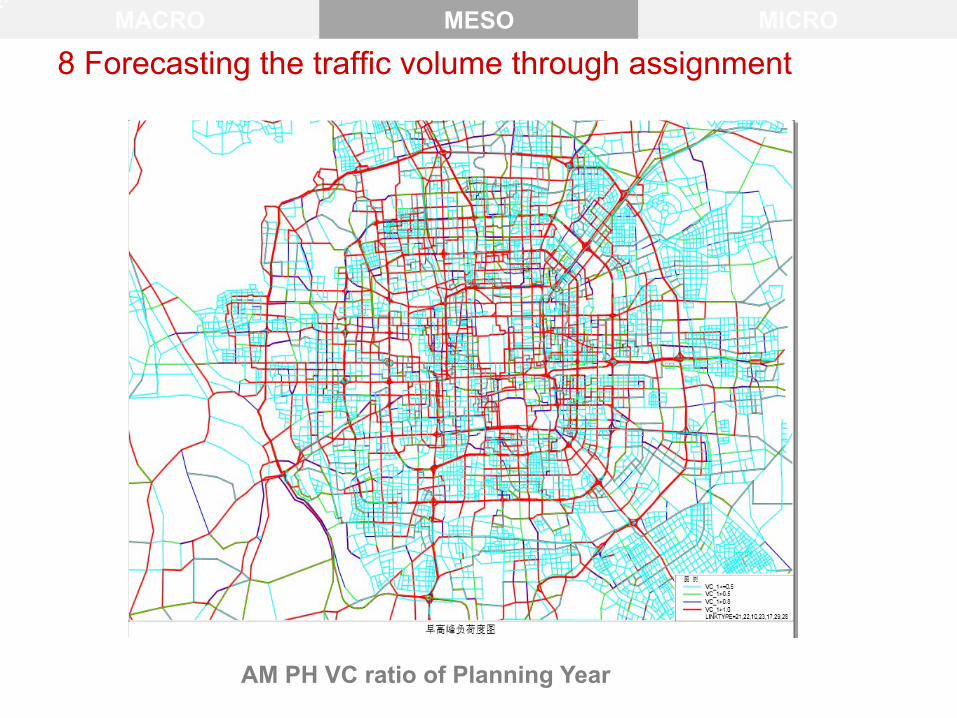
8 Forecasting the traffic volume through assignment MACRO MESO MICRO
AM PH VC ratio of Planning Year
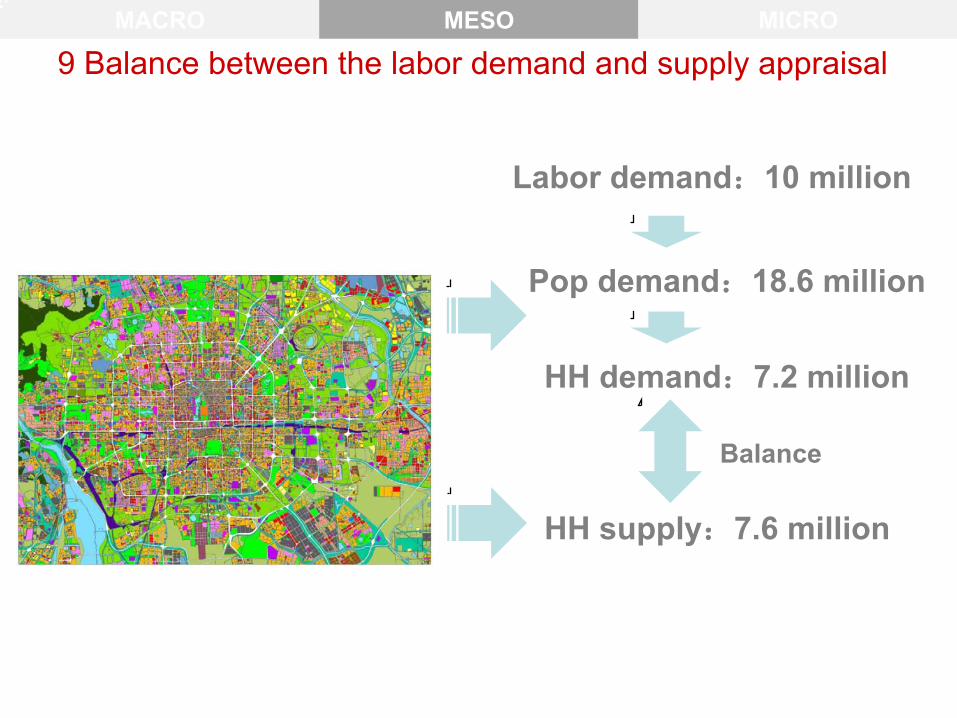
9 Balance between the labor demand and supply appraisal MACRO MESO MICRO
Labor demand:10 million
Pop demand:18.6 million
HH demand:7.2 million
HH supply:7.6 million
Balance
MACRO MESO MICRO
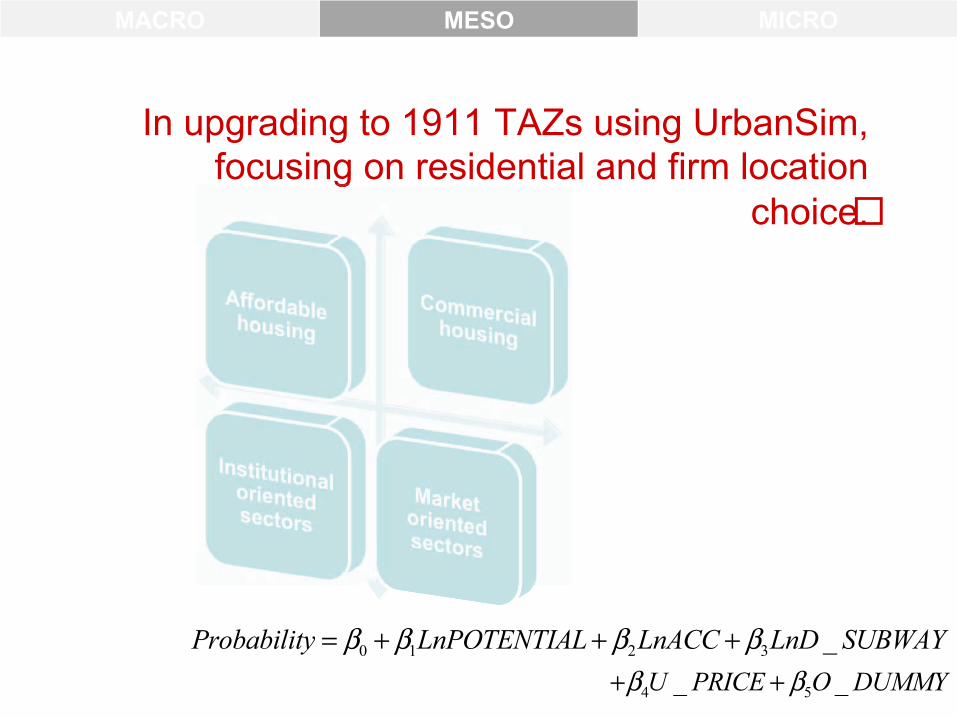
In upgrading to 1911 TAZs using UrbanSim, focusing on residential and firm location
choice. focusing on residential and firm location
0 1 2 3 _Probability LnPOTENTIAL LnACC LnD SUBWAYβ β β β= + + +
4 5_ _U PRICE O DUMMYβ β+ +
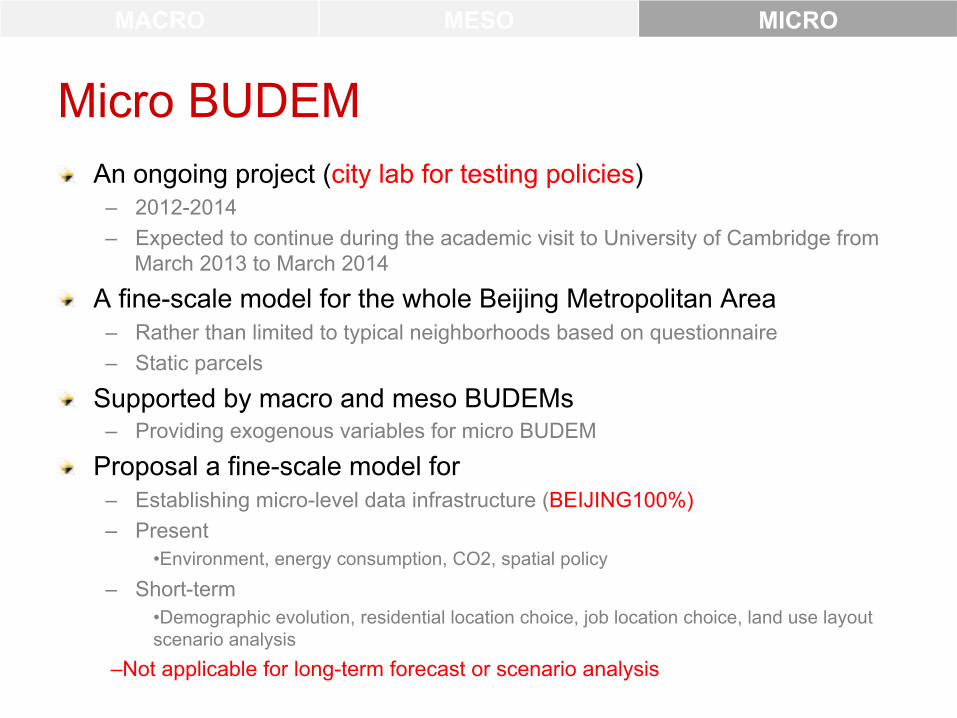
Micro BUDEM! An ongoing project (city lab for testing policies)
– 2012-2014 – Expected to continue during the academic visit to University of Cambridge from
March 2013 to March 2014
! A fine-scale model for the whole Beijing Metropolitan Area – Rather than limited to typical neighborhoods based on questionnaire – Static parcels
! Supported by macro and meso BUDEMs – Providing exogenous variables for micro BUDEM
! Proposal a fine-scale model for – Establishing micro-level data infrastructure (BEIJING100%) – Present
• Environment, energy consumption, CO2, spatial policy
– Short-term • Demographic evolution, residential location choice, job location choice, land use layout scenario analysis
– Not applicable for long-term forecast or scenario analysis
MACRO MESO MICRO
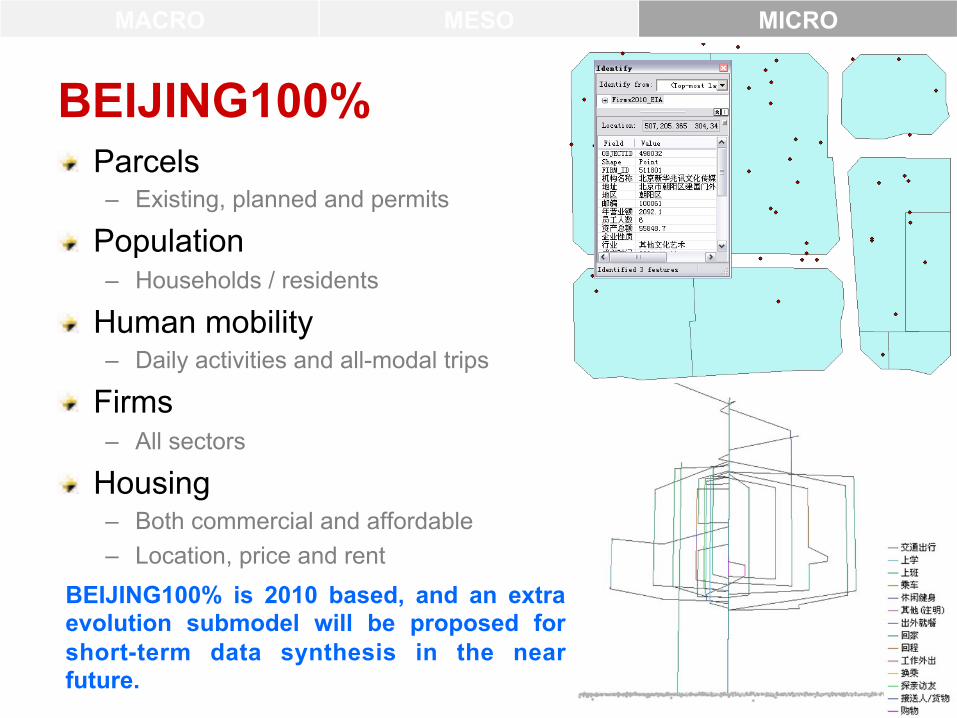
BEIJING100%! Parcels
– Existing, planned and permits
! Population – Households / residents
! Human mobility – Daily activities and all-modal trips
! Firms – All sectors
! Housing – Both commercial and affordable – Location, price and rent
MACRO MESO MICRO
BEIJING100% is 2010 based, and an extra evolution submodel will be proposed for short-term data synthesis in the near future.
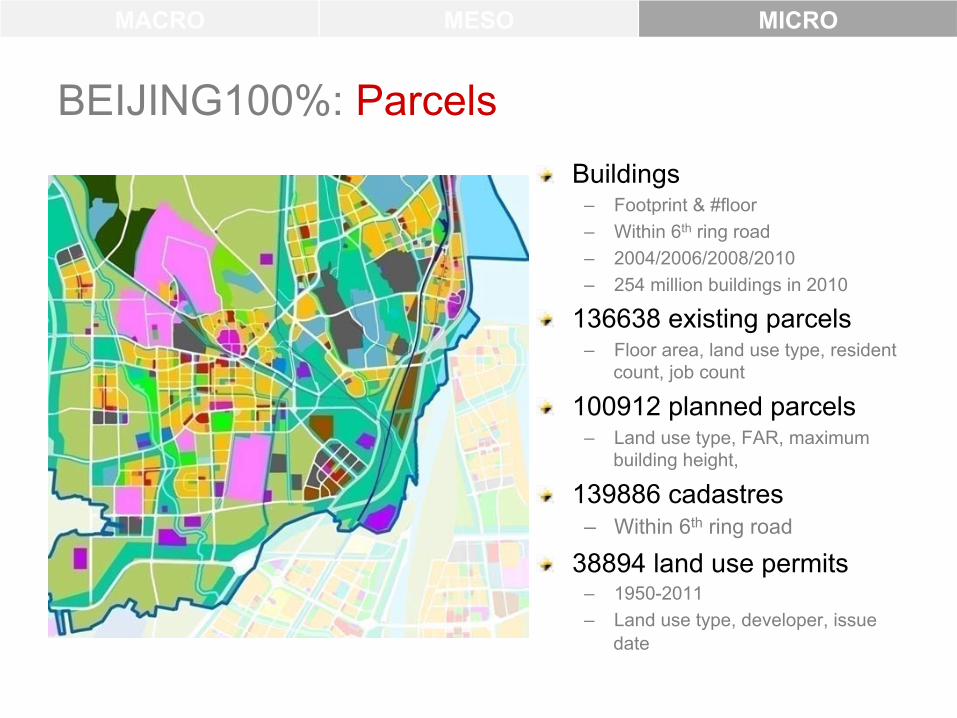
BEIJING100%: Parcels! Buildings
– Footprint & #floor – Within 6th ring road – 2004/2006/2008/2010 – 254 million buildings in 2010
! 136638 existing parcels – Floor area, land use type, resident
count, job count
! 100912 planned parcels – Land use type, FAR, maximum
building height,
! 139886 cadastres – Within 6th ring road
! 38894 land use permits – 1950-2011 – Land use type, developer, issue
date
MACRO MESO MICRO
BEIJING100%: Population! 19.1 m residents and 8.0 m households in the BMA ! Input datasets:
– Samples (116,142 residents / 46,900 households) – The 6th population census of Beijing – Existing researches regarding statistical characteristics of population
attributes and relationships among attributes
! Population synthesis – PopGen: based on samples and marginal
• Developed by Arizona State University • http://urbanmodel.asu.edu/popgen.html
– Agenter: does not need samples • Developed by Ying LONG • Long Y, Shen Z, 2012, “Disaggregating heterogeneous agent attributes and
location from aggregated data, small-scale surveys and empirical researches” Computers, Environment and Urban Systems (Revision under review)
MACRO MESO MICRO

BEIJING100%: Population
MACRO MESO MICRO
Samples F1, F2, F3, F4 Aggregated data F1, F2, F3, F4, F5, F6 Pop. = Households + Residents
Agenter
• Samples • Aggregated data
PopGen • Aggregated data • Existing researches
Pop. F1-F4
Pop. F1-F6
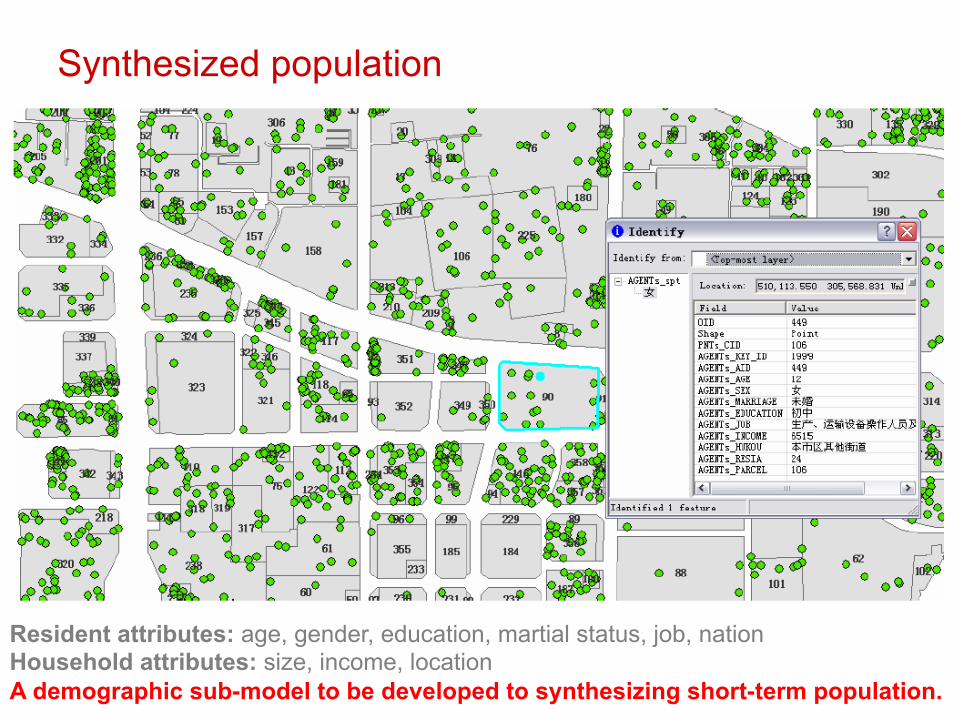
Synthesized population
Resident attributes: age, gender, education, martial status, job, nation Household attributes: size, income, location A demographic sub-model to be developed to synthesizing short-term population.
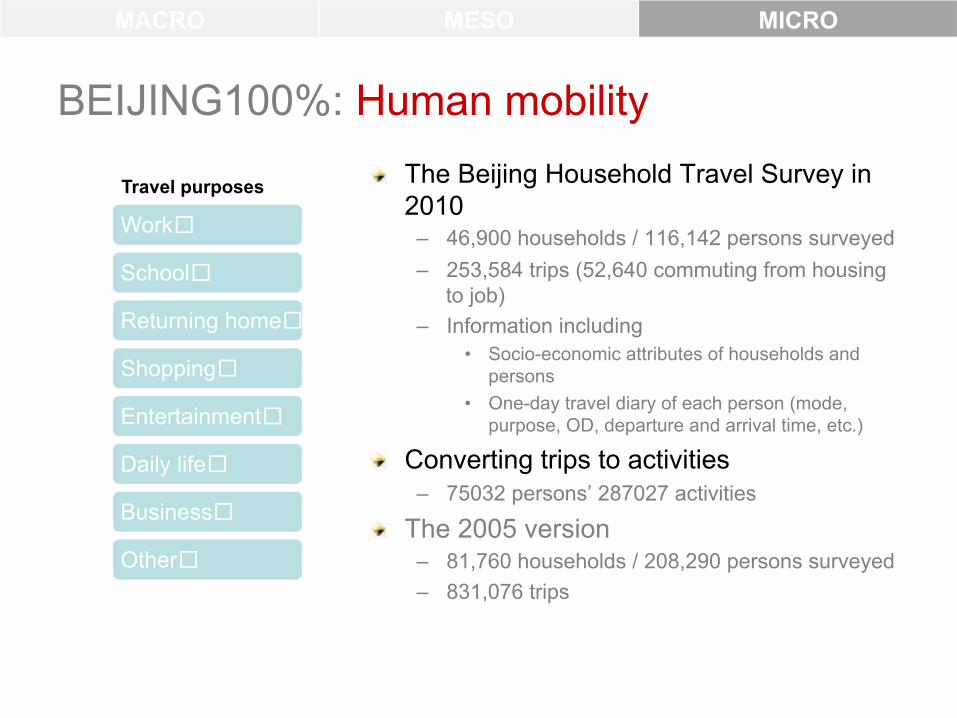
BEIJING100%: Human mobility! The Beijing Household Travel Survey in
2010 – 46,900 households / 116,142 persons surveyed – 253,584 trips (52,640 commuting from housing
to job) – Information including
• Socio-economic attributes of households and persons
• One-day travel diary of each person (mode, purpose, OD, departure and arrival time, etc.)
! Converting trips to activities – 75032 persons’ 287027 activities
! The 2005 version – 81,760 households / 208,290 persons surveyed – 831,076 trips
MACRO MESO MICRO
Work
School
Returning home
Shopping
Entertainment
Daily life
Business
Other
Travel purposes

-- Inferring urban activities from big data! Smart card data of Beijing
in 2010 – Bus and metro ridings – 10.9 million cards – Over 100 million swaps – Finishing identifying
commuting trips
! Crawled from Weibo – China “Twitter” – Check In
! Taxi trajectories – Microsoft Research Asia
(MSRA) – 30,000 taxis
! Combined with POIs – Over 100,000 categorized
POIs
MACRO MESO MICRO
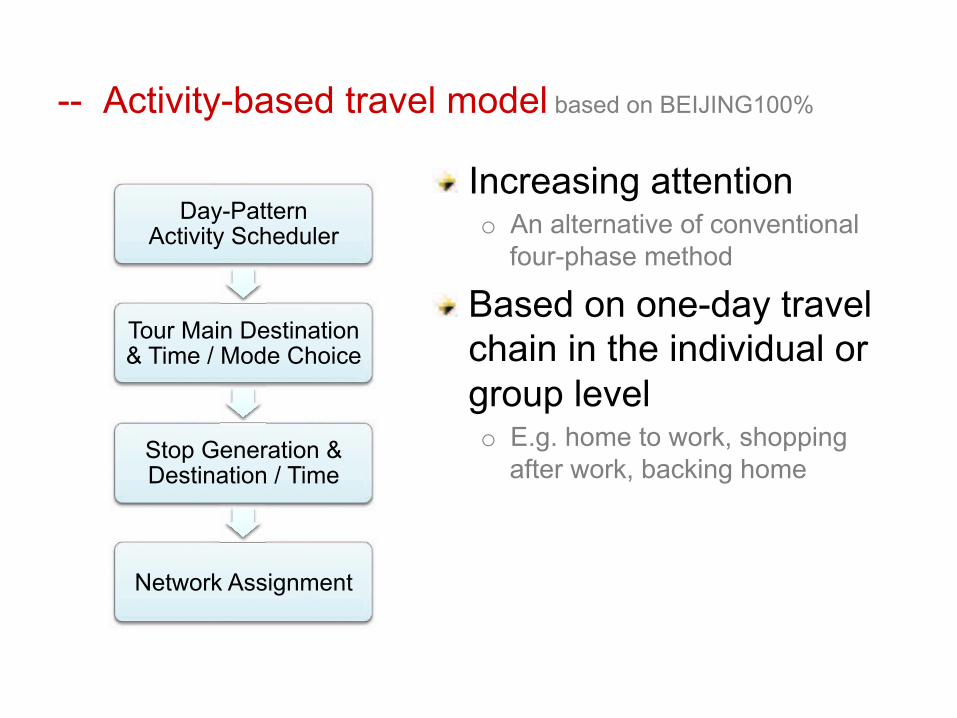
-- Activity-based travel model based on BEIJING100%
! Increasing attention o An alternative of conventional
four-phase method
! Based on one-day travel chain in the individual or group level o E.g. home to work, shopping
after work, backing home
Day-Pattern Activity Scheduler
Tour Main Destination & Time / Mode Choice
Stop Generation & Destination / Time
Network Assignment
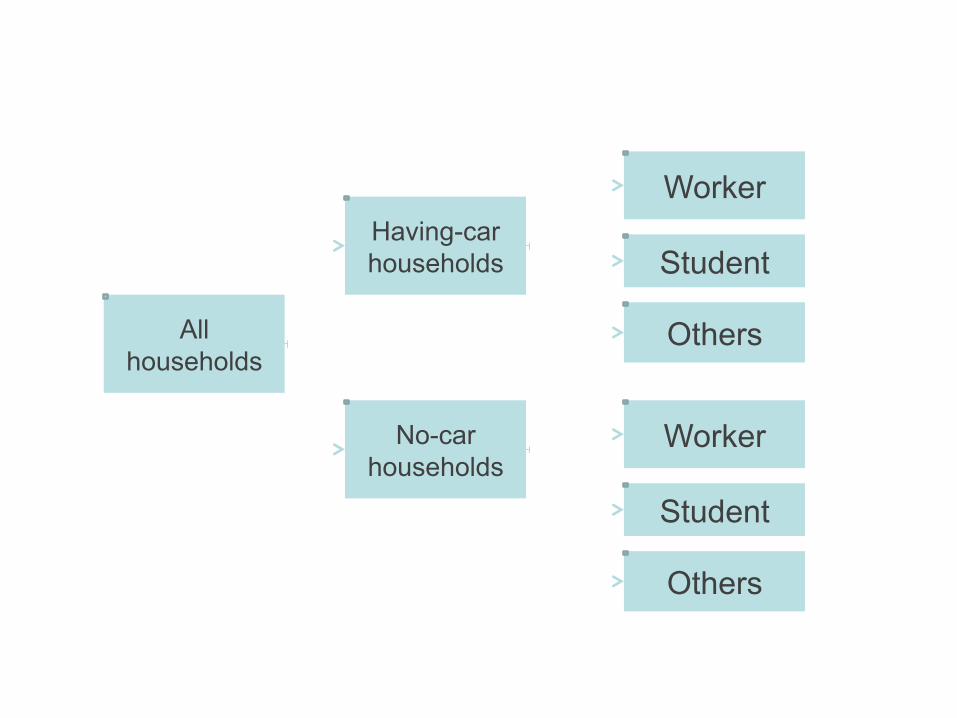
All households
Having-car households
No-car households
Worker
Student
Others
Worker
Student
Others
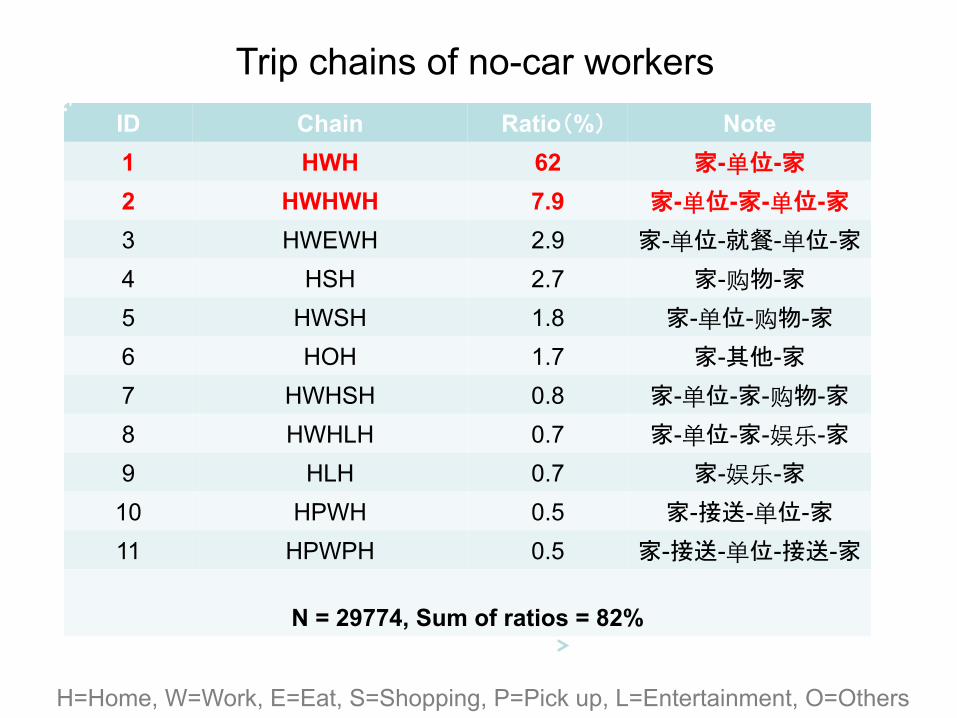
Trip chains of no-car workers ID Chain Ratio(%) Note 1 HWH 62 家-单位-家 2 HWHWH 7.9 家-单位-家-单位-家 3 HWEWH 2.9 家-单位-就餐-单位-家 4 HSH 2.7 家-购物-家 5 HWSH 1.8 家-单位-购物-家 6 HOH 1.7 家-其他-家 7 HWHSH 0.8 家-单位-家-购物-家 8 HWHLH 0.7 家-单位-家-娱乐-家 9 HLH 0.7 家-娱乐-家
10 HPWH 0.5 家-接送-单位-家 11 HPWPH 0.5 家-接送-单位-接送-家
N = 29774, Sum of ratios = 82%
H=Home, W=Work, E=Eat, S=Shopping, P=Pick up, L=Entertainment, O=Others
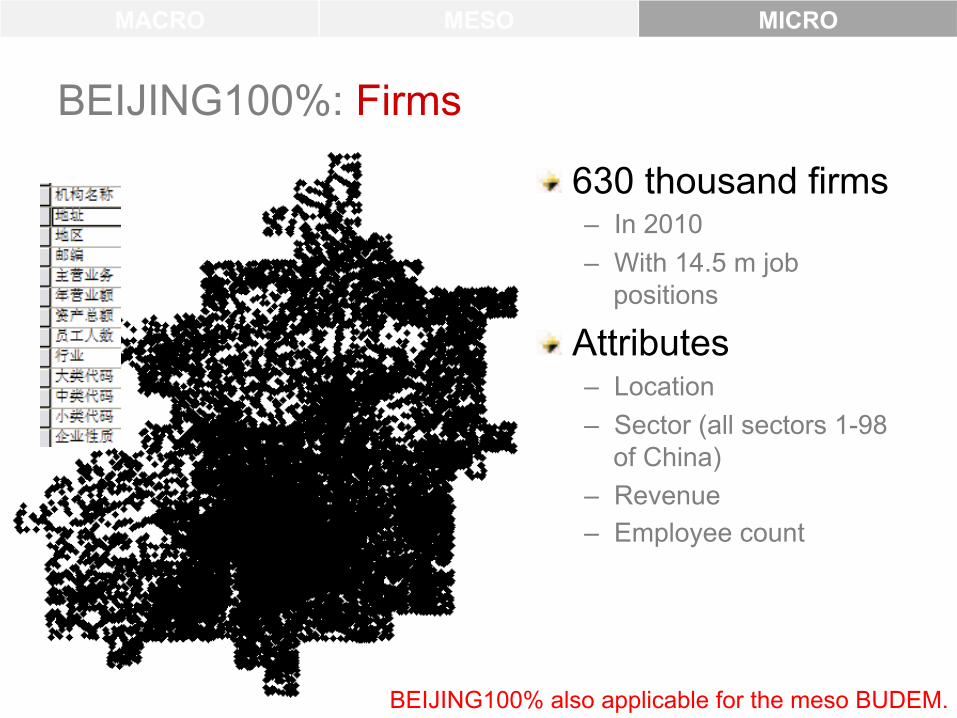
BEIJING100%: Firms
! 630 thousand firms – In 2010 – With 14.5 m job
positions
! Attributes – Location – Sector (all sectors 1-98
of China) – Revenue – Employee count
MACRO MESO MICRO
BEIJING100% also applicable for the meso BUDEM.
MACRO MESO MICRO
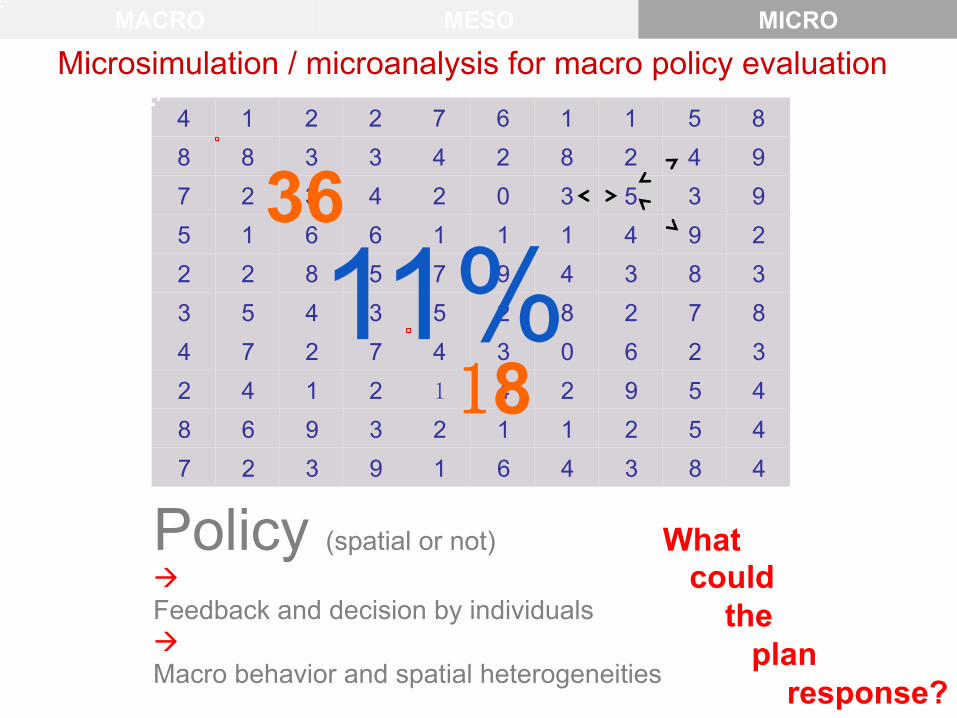
Policy (spatial or not) Feedback and decision by individuals Macro behavior and spatial heterogeneities
4 1 2 2 7 6 1 1 5 8 8 8 3 3 4 2 8 2 4 9 7 2 3 4 2 0 3 5 3 9 5 1 6 6 1 1 1 4 9 2 2 2 8 5 7 9 4 3 8 3 3 5 4 3 5 2 8 2 7 8 4 7 2 7 4 3 0 6 2 3 2 4 1 2 1 4 2 9 5 4 8 6 9 3 2 1 1 2 5 4 7 2 3 9 1 6 4 3 8 4
36
18 11%
Microsimulation / microanalysis for macro policy evaluation
What could the plan response?
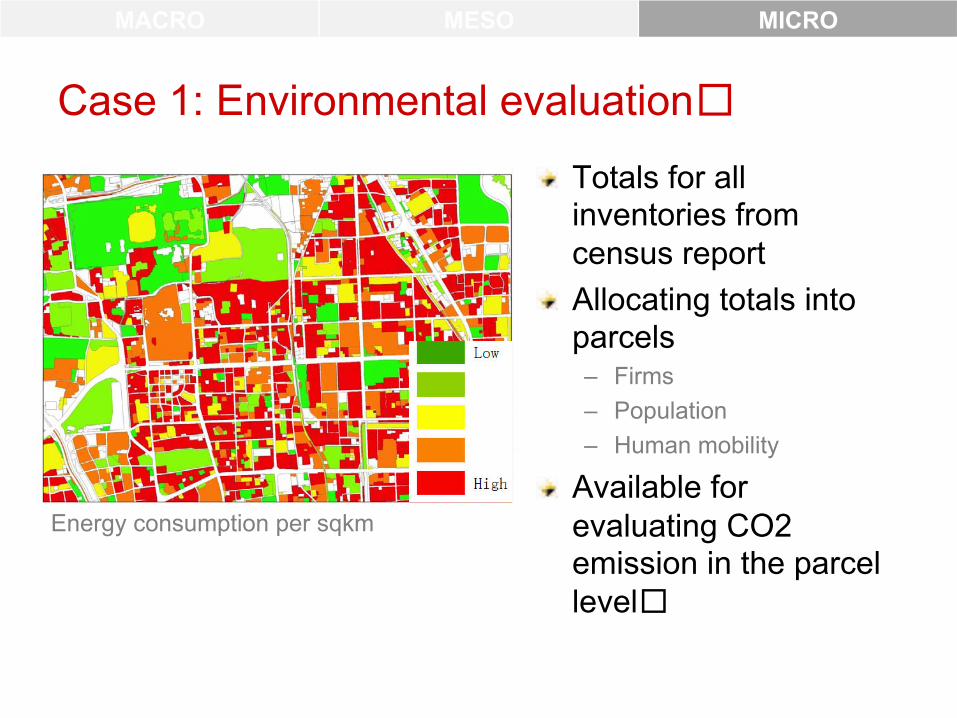
Case 1: Environmental evaluation
! Totals for all inventories from census report
! Allocating totals into parcels – Firms – Population – Human mobility
! Available for evaluating CO2 emission in the parcel level
MACRO MESO MICRO
Energy consumption per sqkm
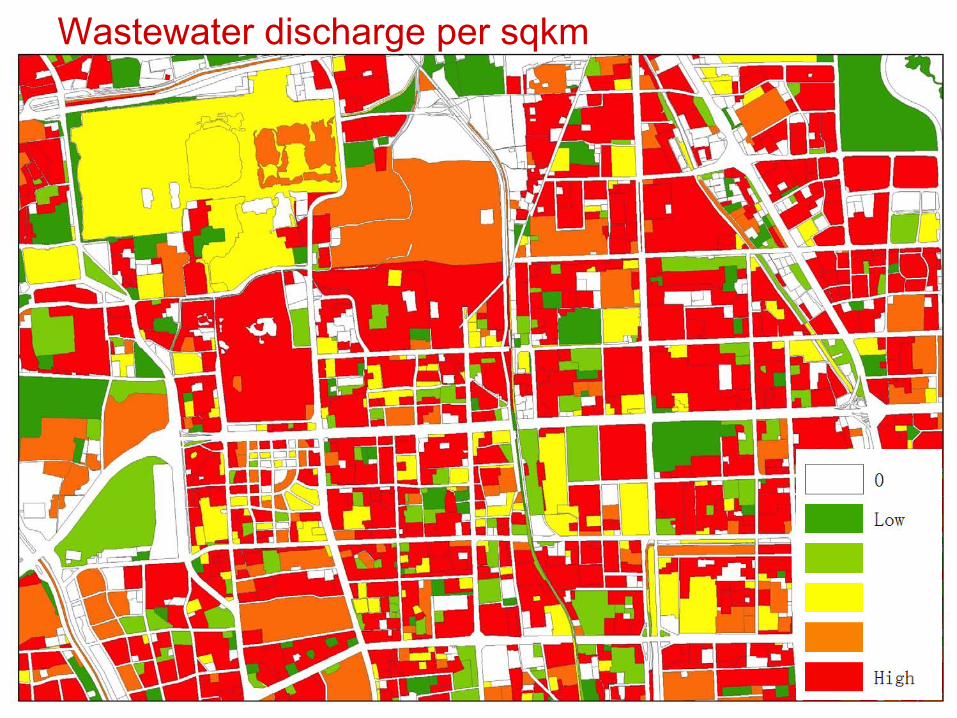
Wastewater discharge per sqkm
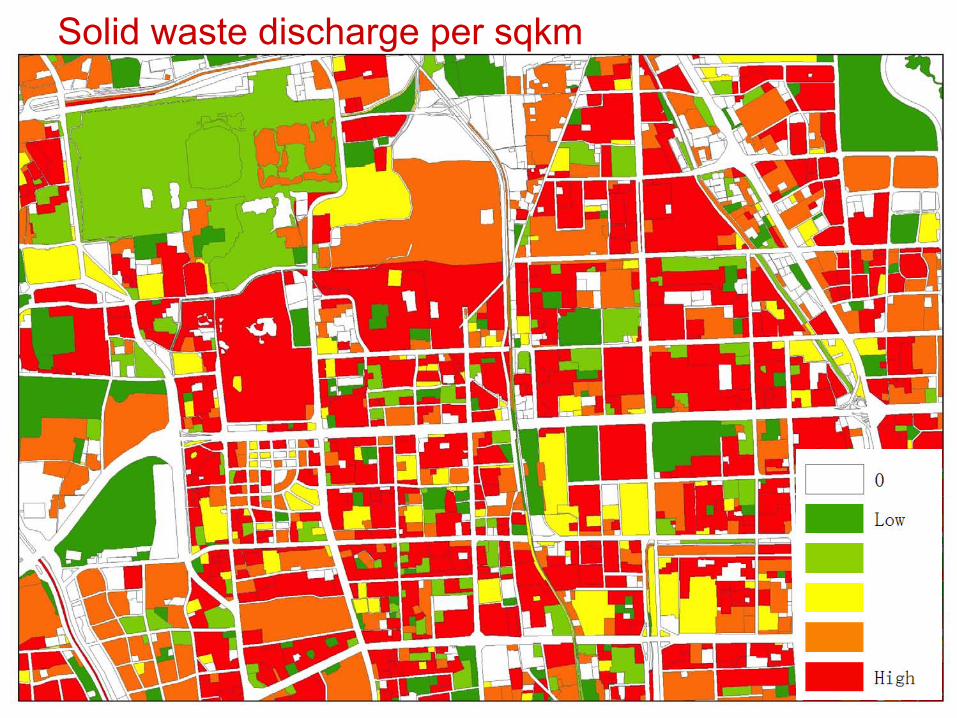
Solid waste discharge per sqkm
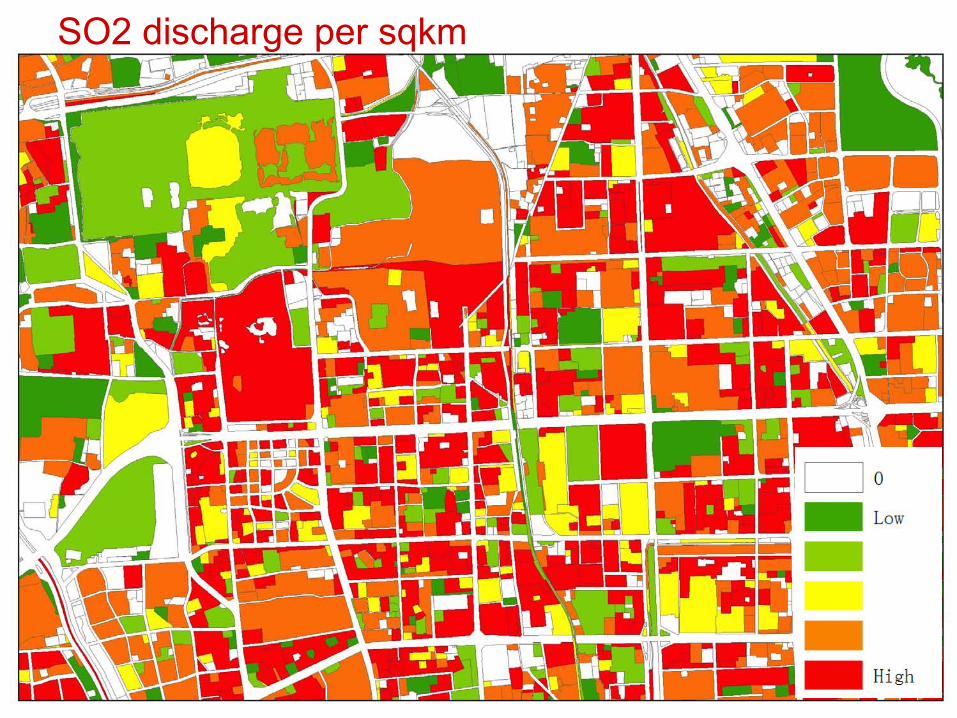
SO2 discharge per sqkm
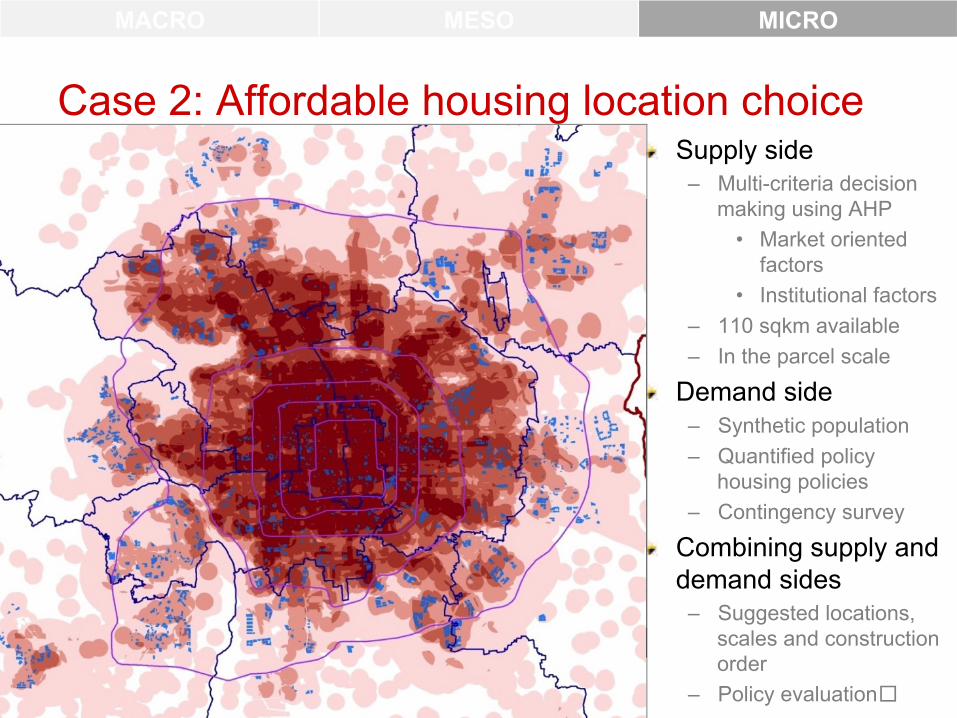
Case 2: Affordable housing location choice! Supply side
– Multi-criteria decision making using AHP
• Market oriented factors
• Institutional factors – 110 sqkm available – In the parcel scale
! Demand side – Synthetic population – Quantified policy
housing policies – Contingency survey
! Combining supply and demand sides
– Suggested locations, scales and construction order
– Policy evaluation
MACRO MESO MICRO
� %
1
0
1 0
2 3
0 5
V �
K
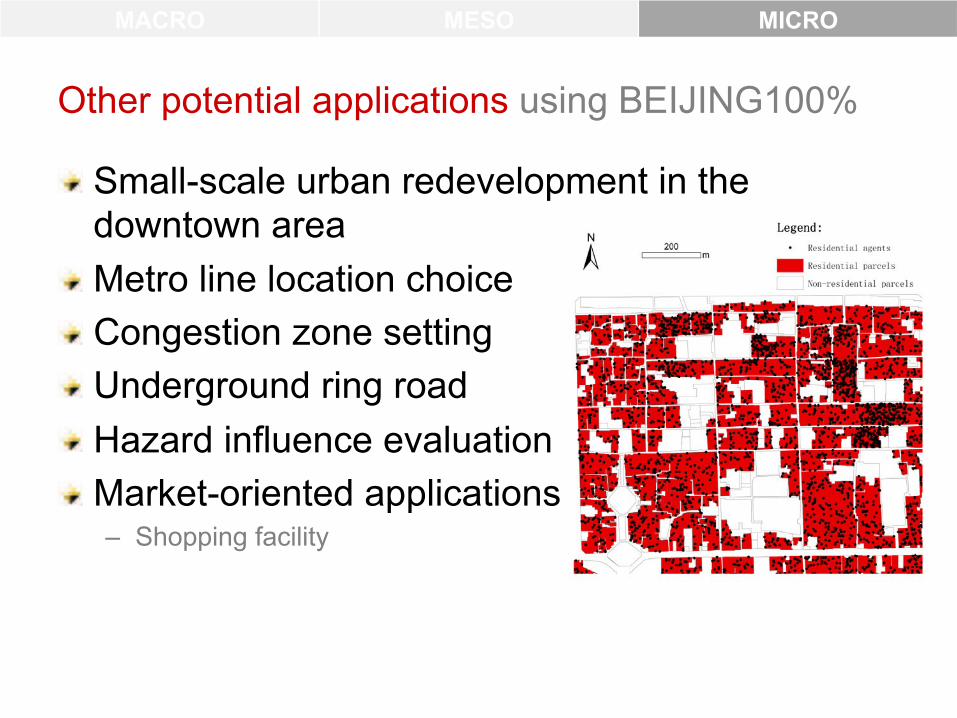
Other potential applications using BEIJING100%
! Small-scale urban redevelopment in the downtown area
! Metro line location choice ! Congestion zone setting ! Underground ring road ! Hazard influence evaluation ! Market-oriented applications
– Shopping facility
MACRO MESO MICRO
Short-term forecast / scenario analysis
On going…! Extend human behavior in BEIJING100% ! Based on the macro/meso BUDEMs ! Parcel-scale UrbanSim
– Land develop, residential location choice, firm location choice
! Activity-based travel model – Representative travel chains extracted from the 2010 survey
MACRO MESO MICRO
Conclusions Three urban spatial development models in Beijing! A family of BUDEMs
– Applicable urban models – Ranging from macro, meso to micro levels
! Macro and meso BUDEMs – Applications in strategic and master plans
! Micro BUDEM – BEIJING100% – Applications in the detailed plan scale, e.g. plan scheme
evaluation, policy evaluation and EIA – More frequent application in plan practices
! Demanding continuing efforts
Conclusions Urban models in the era of “big data”! “Big data”
– GSM, GPS trajectories, smart card swaps, credit card, SNS, etc. – Individual based – Increasing availability
! Opportunities or challenges – Population synthesis v.s. – inferring urban activities from bus/metro smart card data
! The second requiem for large-scale urban models? – Too much data, rather than limited computation capacity, in contrast to
the first requiem in 1970s (Lee, 1973)
! Urban modelling using “big data”? – Enriching data related with urban physical space, transportation, and
human mobility/ activities