Embed Size (px)
Citation preview
1,-'. . ... ~ "-'-"';~-.. ----.-.. ,~ ~:.(
Ji ...ul .:', t; I ~. : .......... 1 i I , j I
,~~ i
~ .
;.:: 11 I.. .;j, j I ' -41
l. • .J ~ . ;,"l ... _ .. .." ..... ,! .A. ........ 1
BELCHER'S BAY LINK
ENVIRONMENTAL ASSESSMENT REPORT
VOLUME 11' - WATER QUALlrY & AIR QUALITY
PYPUN • HOWARD HUMPHREYS LTD. :_
r\ , t .,. ,
I'
"".-"" \ .J ..
tl nl l ,
'. [l -r,l l ; J . n] I i I ! !]I
'1 rl ( ) ,
,. j BELCHERS BAY RECLAMATION
nl WATER QUALITY AND AIR QUALITY ASSESSMENT
.=
rl I . ,. rJ L..
: FJ ! l ' ;]I -
nl "~
A] I .
l ,-
.~ 1 I, , .. -[ -I ; fI. r] CJ -rJ I I
~'fl
rl
rl .E
rl It ~! l ,: , - ~ i
; ni
i I i I • !
I
I nl Ul l!
l-J 12
nl Cl IJ -'\It
!lJ l ;
ri l ' I ;. ;
Page ·2-
CONTENTS LIST
1.0 INTRODUCTION
2.0 LEGISLATIVE CONTROLS
3.0 EXISTING SITUATION
. '3', ;l.···Exist·ing t.:rater Quality 3.2 Existing Water Flow Patterns 3.3 Existing Air Quality
4.0 PROPOSALS
5.0 CONSTRUCTION EFFECTS
5.1 Water Quality . 5.2 Water Quality Monitoring 5,3 Air Quality
6.0 OPERATIONAL EFFECTS*
6~1 Water Quality 6.2 Air Quality
7.0 CONCLUSIONS
Appendix I Comments and Responses
"
1 ~ I , I
~l .-
~ ) a:
• ~l ~ ] ~ ...
! 1
~j \&
'~~ 1
,:J \: J
1.0
Page .. 3 ..
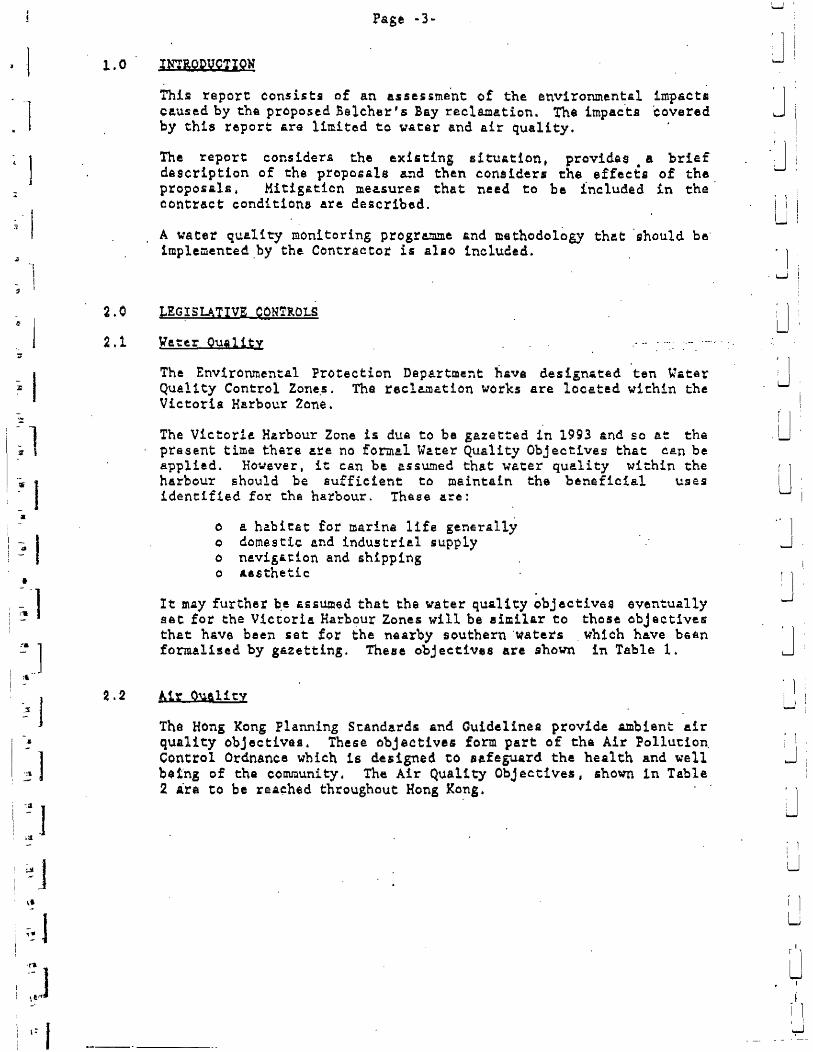
INI&QQUCTIQN
This report eon.sist$l of an a,5sessme'nt of the. environmenta.l impacts cl!.used by the proposed Beleher's Say recls.mation. The impac'ts covered by this report are limited to water and air quality_
The report considers the existing situAtion, provides.& brief description of the proposals ~~d then considers the effects of the proposals I Mitigs.tien measures that need to be included in the oontract eondition8 are described.
A watet que.lity monitoring progrc!.!Ilme and methodology th!.t: 'should be' implemented ,by the Contraetot is allo included.
2.0 LEGISLATIVE QONTROLS
2.1 V~ter QUil1t~
~.2
The Environmental Protection DepArtment havQ design.tfld ten ~.;.t6r Quality Control Zone,s. The recle.mation work5 are located within the Victotia Harbour Zone.
The Victoria Hzrbour Zone is dUQ to be gazetted in 1993 and so At th~ present time there I!.te no form~l Water Quality Object1~es that c~n be applied. However. it can be assumed that water quality within the harbour should be sufficient to maintain the beneficial uses identified for the harbour. Thase are:
o a habitat for marine 11fe gen£rally o domestic and industrial supply o navigAtion and shipping o ... ~sthetic
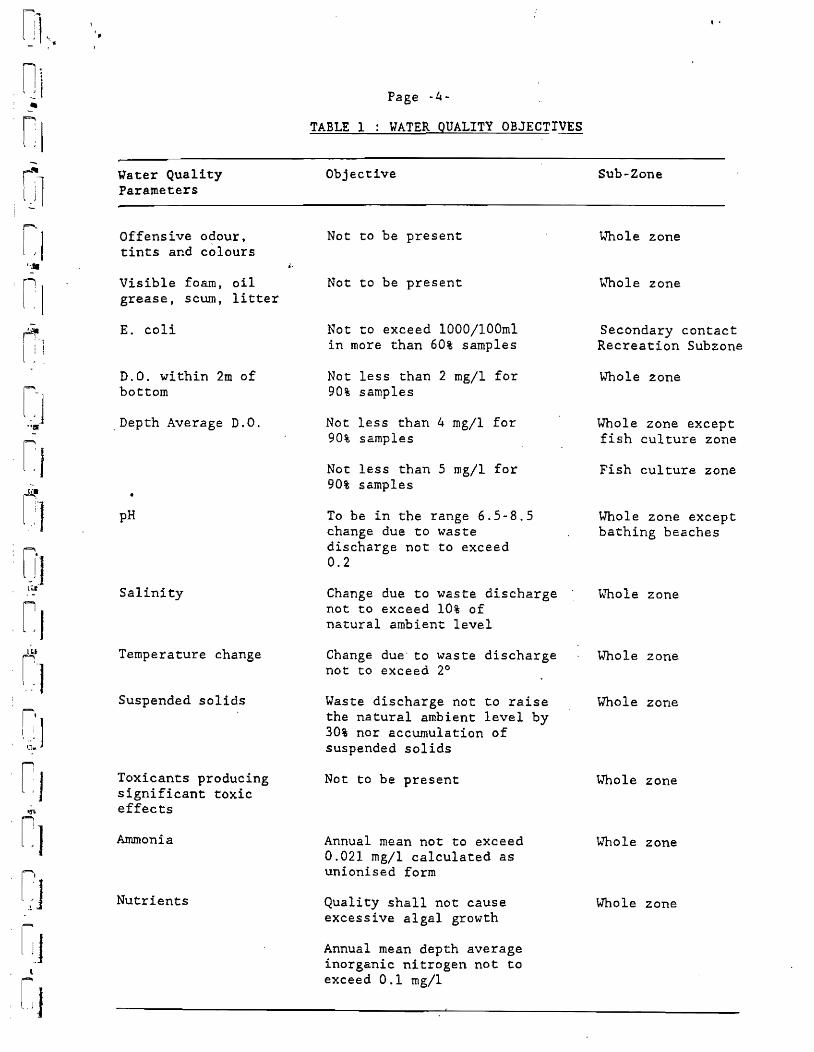
It may further b.! assumed that the water quality obj ectives eventually set for the Victoria Harb~ur Zones will be aimila.r to those ohj ac.tives that have been set for the naarby southern 'waters ,which have b6Qn formalised by ga2etting. These objectives are shown in Table 1.
A1; Q'Ualitv
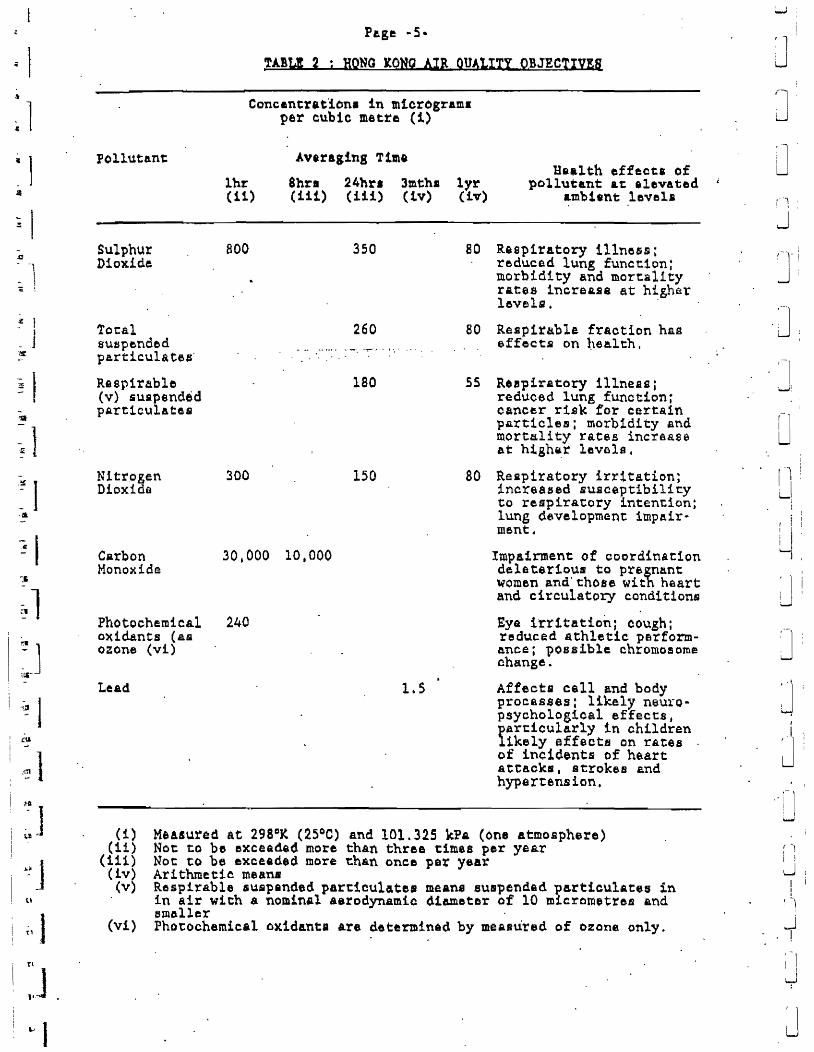
The Hong Kong Planning Standards and Guidelines provide ambient air quality objectivas. These objectives form part of the Air Pollution, Control Ordnance which 1s designed to B~feguard the health and well b.tng of the community. The Air Qua11~ Objecti~e5, shown in Table 2 Are to be reached throughout Hong Ko~g.
.---"----
I I ' ""-'
~ 1 ' ! i I i.J [
J
J
I 1 I ; W
U I
nl" - ,
r: I' \ J i ~
rl .....
~l I : \ .J
,I I ". 1'1 r'-1
i t l : \
I.j .oS
I -
r"l DJ \~ , -
[,1
Cl ;.;; 1 -
[,J ~
l.] [;'1
J l
[J
,
W'ater Quality Parameters
Offensive odour, tints and colours
Visible foam, oil grease, scum, litter
E. coli
D.O. within 2m of bottom
. Depth Average 0.0.
pH
Salinity
Temperature change
Suspended solids
Toxicants producing significant toxic effects
Ammonia
Nutrients
i.
Page -4~
TABLE 1 WATER QUALITY OBJECTIVES
Objective
Not to be present
Not to be present
Not to exceed 1000/10Oml in more than 60% samples
Not less than 2 mg/l for 90% samples
Not less than 4 mg/1 for 90% samples
Not less than 5 mg/l for 90% samples
To be in the range 6.5-8.5 change due to waste discharge not to exceed 0.2
Change due to waste discharge not to exceed 10% of natural ambient level
Change due' to waste discharge not to exceed 2°
Waste discharge not to raise the natural ambient level by 30% nor accumulation of suspended solids
Not to be present
Annual mean not to exceed 0.021 mg/l calculated as unionised form
Quality shall not cause excessive algal growth
Annual mean depth average inorganic nitrogen not to exceed 0.1 mg/l
, .
Sub-Zone
tJhole zone
\.-'Thole zone
Secondary contact Recreation Subzone
Whole zone
Whole zone except fish culture zone
Fish culture zone
Whole zone except bathing beaches
\..'Thole zone
tJhole zone
Whole zone
Whole zone
Whole zone
Whole zone
. I
-.:
.if: J 1
- .J .~
= I
~ I
':1
~l
~.J it'"
"~ 1 :]
, ~ J I u
;, J
::J ~ 1
Page .. 5·
TABLI 2 ; HONG lONG AIR QUAlITY QBJECTIVE(
pollutant
Sulphur Dioxide
Total suspended particula tetf
Respirable (v) liu.ipend&d pArt1culates
Nitr.o~en Dioxi a
Carbon Monoxide
Photochemical oxidants (as ozone (vi)
Lead
Concantratlona in m1crogram. per cubic metre (1)
Av.raging Time
lhr 8hrl 24hr. 3m.ths lyr (11) (i11) (i11) (tv) (i.,,)
800 350 80
260 80 .. _'. ~""""J . \
180 55
300 150 80
30 J OOO 10.000
240
1.5
Health effec~a of pollutant &t alevated
a.mb1tnt levell1
Respiratory illness; reduced lung function; morbidity and mor~ality rates increase at higher levelQ. .
Respirable fraction has effect5 on health.
R&8piratory 1l1nes8j reduced lung function; oancer risk for certain particles: morbidity and mortality rates increase at h1gh~r levels,
Respiratory irritation; increased suacept1bili~y to respiratory intention: lung development impair· went.
Impairment of coordination deleterious to pretnant women and' those wit htsart and circulatory conditions
Eya irritation; oough; reduced athletic perform-ance; possible chromo~ome change ..
AffectQ cell and body proc2sses: likely neuro-psychologioal effects, lAr&iOUlarly in children
1kely effecta on rates ' of inoidents of heart attacks. strokes and hypertension.
(i) (1i)
(111) (iv) (v)
MeAsured at 298 CK (25°0) and 101.325 kPa (one atmosphere) Not to be exceaded more thAn three times per year Not to be exceade~ more than once per year
(\11)
Arithmeti~ mean. Respirable s~QP8nded particulate. mean. suspended particulates in in air with a nominal aerDdynamic ~1&meter of 10 micrometrea and smaller . Photochemical ox1d&nta Are determinQd by meaBure~ of Ozone only_
, , ......
'1 J
J lJ
J
.J .]
o I .'~
I I . I l..1
t
i
: I '-I
: 1 u
J I
.1
J
(
I ~ ,,J
I I
L
j , !
; 1 , I
-:J
~
rl l_ ~ I
I:J ili
, , . t
l , I -~
r I i
!!II
:,1'] I I L;
-r i 1 '~' 1
r i
rl C.J
.B
~ I ! 1
3.0
3.1
, .
Page -6-
EXISTING SITUATION
Existing ~ater Quality
There are several monitoring stations at which EPD obtain samples of water to assess marine water quality and which provide data relevant to the present project.
Of particular interest to this project are water quality parameters of transparency and light penetration that are affected by suspended particles such as clay, silt, finely divided organic and inorganic matter. The transparency and light penetration of waters of Hong Kong, in particular the western waters I are to a large extent, influenced by the Pearl River, which discharges a substantial quantity of suspended solids.
~estern waters and Victoria Harbour (appropriate sampling areas for the present study) generally have ~ower transparency than the eastern and southern waters. Typical annual': rfisuli::s· .... {or:" Secchi' 'Disk disappearance vary between 0.5m and 1.9. In Victoria Harbour the low transparency of waters has been accredited to waste discharge from sewage outfalls and urban stormwater runoff.
Victoria Harbour serves as a main channel for navigation and forms the central harbour and main port of Hong Kong. Water movement wi thin the harbour area, especially the central area ensures that effective tidal exchange is experienced.
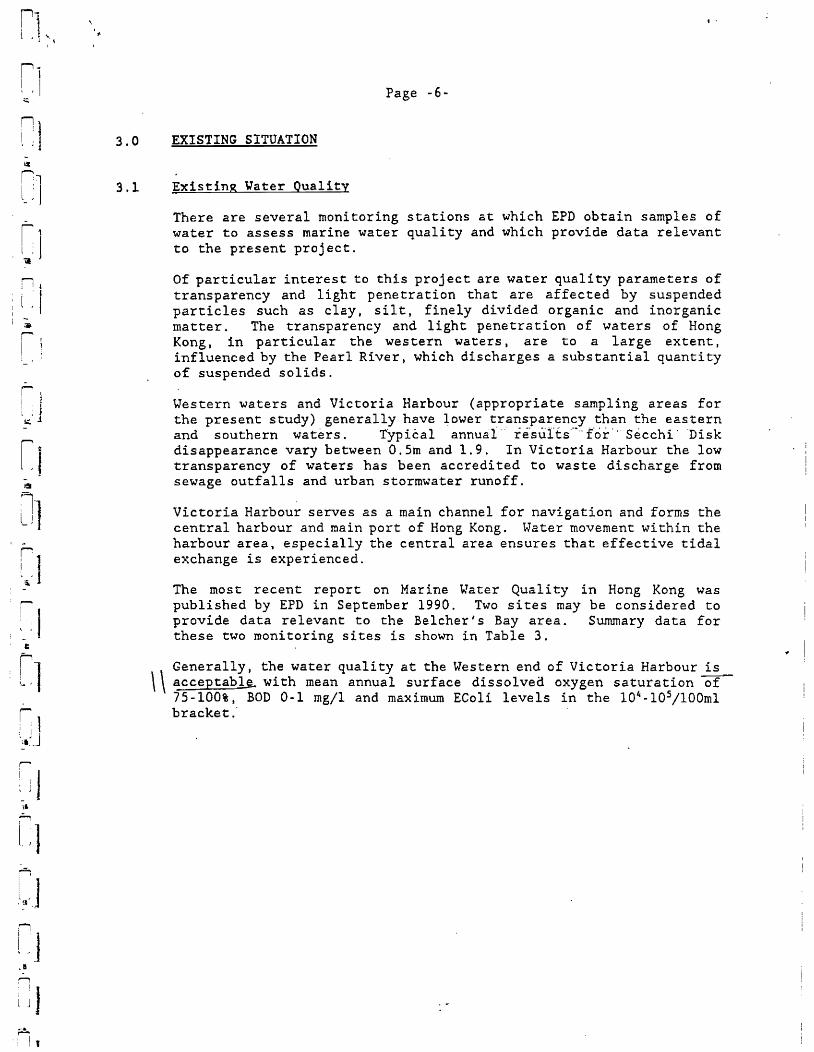
The most recent report on Marine ~Tater Quality in Hong Kong was published by EPD in September 1990. Two sites may be considered to provide data relevant to the Belcher's Bay area. Summary data for these two monitoring sites is shown in Table 3.
Generally, the water quality at the Western end of Victoria Harbour is \ \ acceptab~ with mean annual surface dissolveo oxygen saturation ~
75-100%, BOD 0-1 mg/l and maximum EColi levels in the l04.105/100ml bracket:
'.
'1 J
1:
- I :.I
~
~
::: -
-.si
I : .J
'"
::: -
~ I ..
~l i'iil -
.~ I
... . ~ I 0
1 n
:;
1 -
~iI.
,; J
': ) I,
3 }
..
L J (
. I 1 • .1
\ I
Page -7-
Monitoring data show that although generally acceptable. variations do occur and vigilance in preventing pollution is necessary to prevent deteriorating water gua l;ty.
As with most areas of Hong Kong, sewerage and surface drainage systems exist in the Belcher's Bay area. However, expedient connections allow surface drainage to become contaminated with foul drainage and this subsequently flows into harbour waters. The waters immediately offshore in the study area are contaminated in this way to some extent.
TABLE 3 SUMMARY STATISTICS FOR 1989 WATER QUALITY
Determinand
Temperature QC Surface
Bottom
Salinity (ppt) Surface
Bottom
DO %Satn Surface
Bottom
Turbidity (NTU)
S S (mg/I)
BODs (mg/l)
E Coli (no/lOOm1)
Harbour East & Central
22.6 (15.l-28.3)
22.1 (15.2-28.1)
31.0 ' (22.8-33.2)
31.7 (23.6-33.7)
66.0 (33.2-143.7)
56.8 (12.0 .. 97.1)
5.9 (1.5-21.8)
5.2 (1.2-19.5)
1.1 (O~3 .. 2.9)
Harbour West
22.7 (15.3·28.4)
22.5 (15.3-28.2)
30.6 (19.1-33.1)
31.3 (25.9-33.3)
74.4 (38.6-139.0)
68.8 (26.3-98.6)
8.8_ (2.5-37.0)
8.6 (2.0-30.0)
0.9 (0.1-3.2)
960 (0-11.133)
The lighterage traffic that currently utilises the sea wall facilities at Belcher's Bay will also give rise to Harbour Water contamination. This will occur due both to cargo spillage and domestic wastes discharged from the boats which often provide residential accommodation for the operators.
, 1 I
..J
J ~ I
, 1
! ......;
J , 1 i i I ' I i....i
J
J r '
J
u r 1 I '
J
111 ; I' , , ,L I.) I i
rl I ' I ! l , I
~I
r "1 i ~ I"
;'! 1 , I ; I
~ -' 1 ~
-';:;a
~1
Cl .;;:a
I , 1, -g
r
1-,1 r
i : : 1 -.:' .1
::1 i I
l , -....
Cl nl l , ~ t .iI -
I. r I J I i \ ,
3.2
3.3
. '
Existing Yater Flov Patterns
Flow patterns and velocities within the harbour waters are available from both physical and computer modelling, (WAHMO studies and from measurements taken in situ),
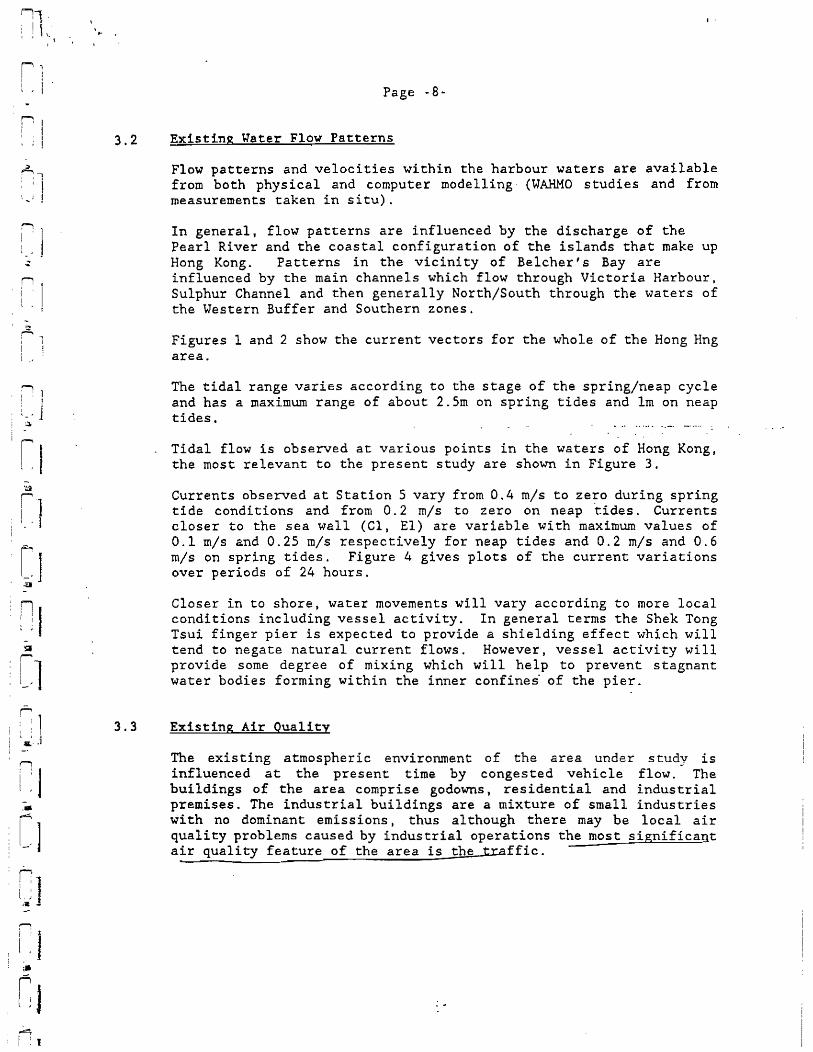
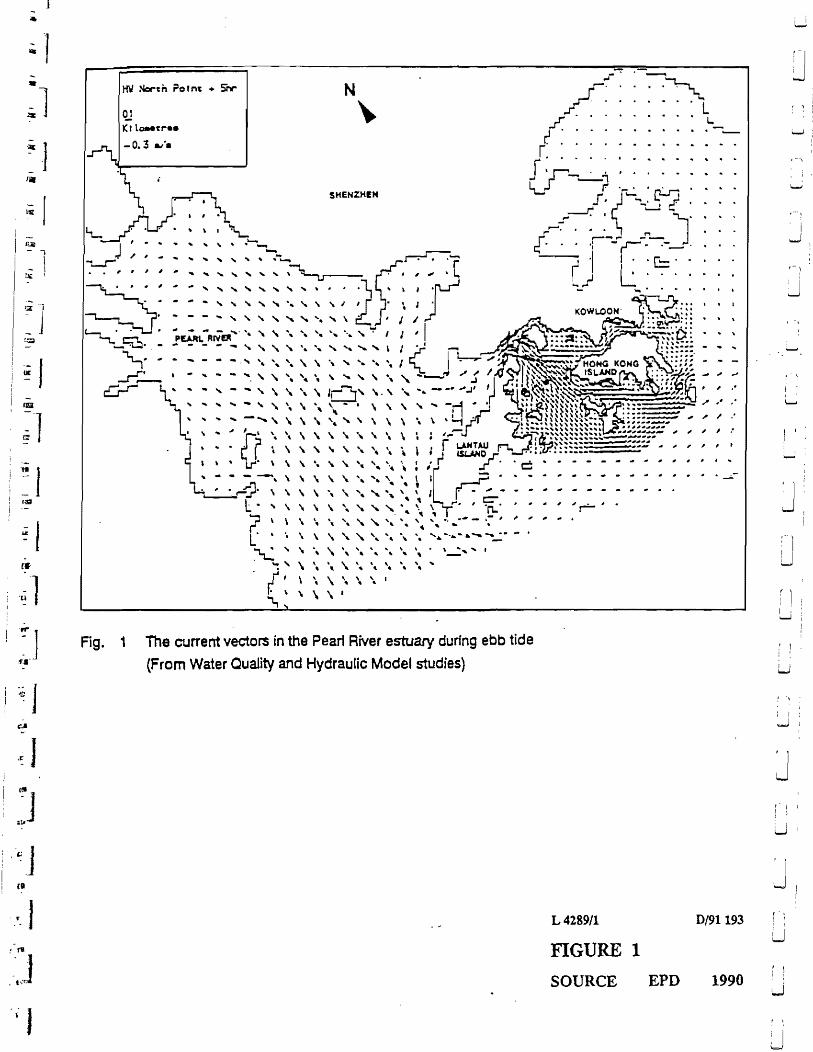
In general. flow patterns are influenced by the discharge of the Pearl River and the coastal configuration of the islands that make up Hong Kong. Patterns in the vicinity of Belcher' s Bay are influenced by the main channels which flow through Victoria Harbour. Sulphur Channel and then generally North/South through the waters of the Western Buffer and Southern zones.
Figures 1 and 2 show the current vectors for the whole of the Hong Hng area.
The tidal range varies according to the stage of the spring/neap cycle and has a maximum range of about 2.Sm on spring tides and lm on neap tides.
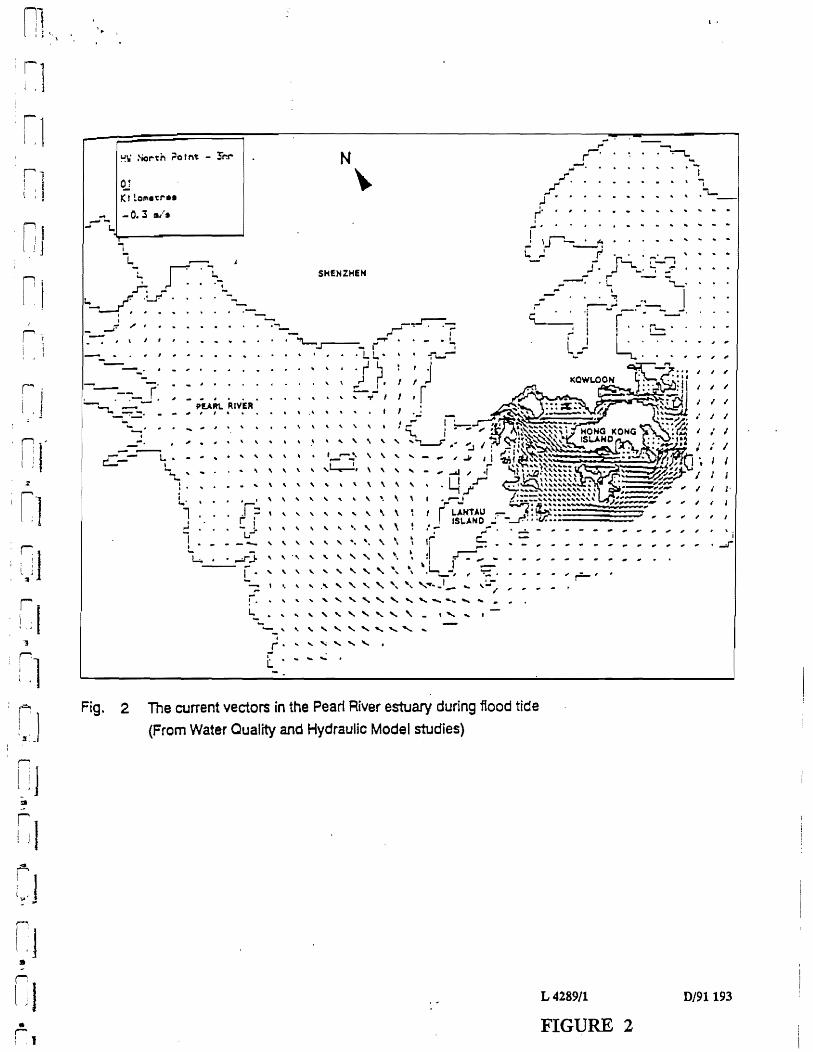
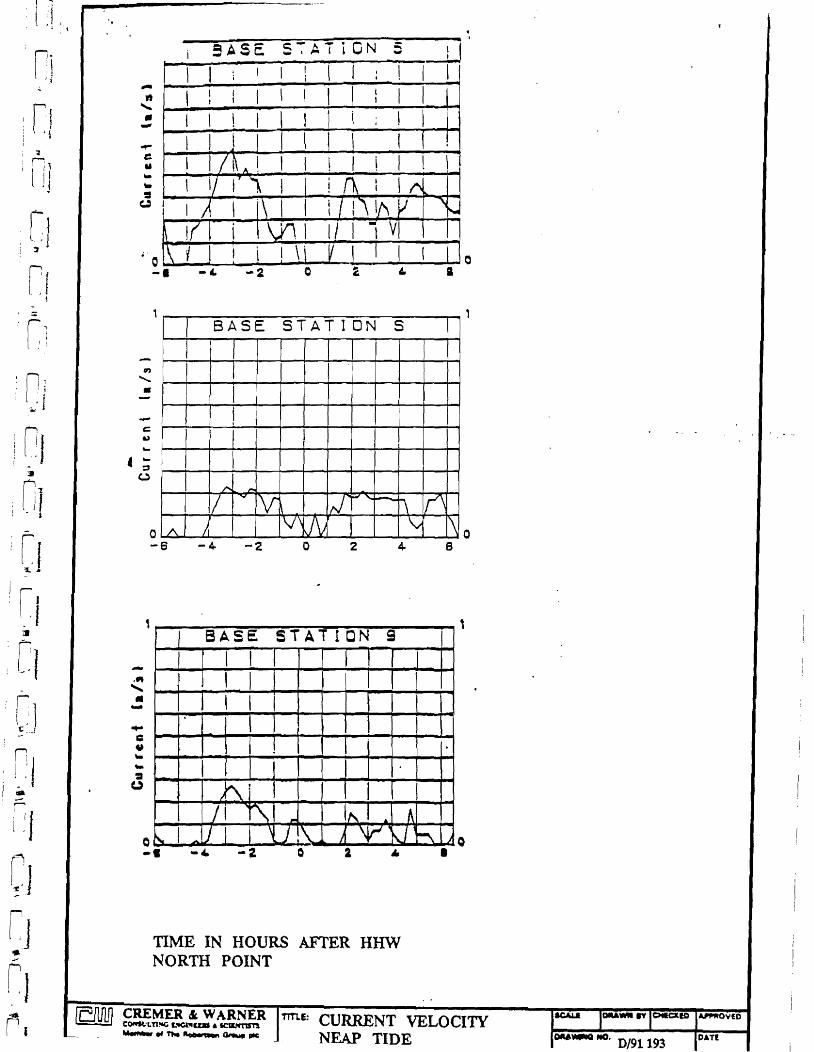
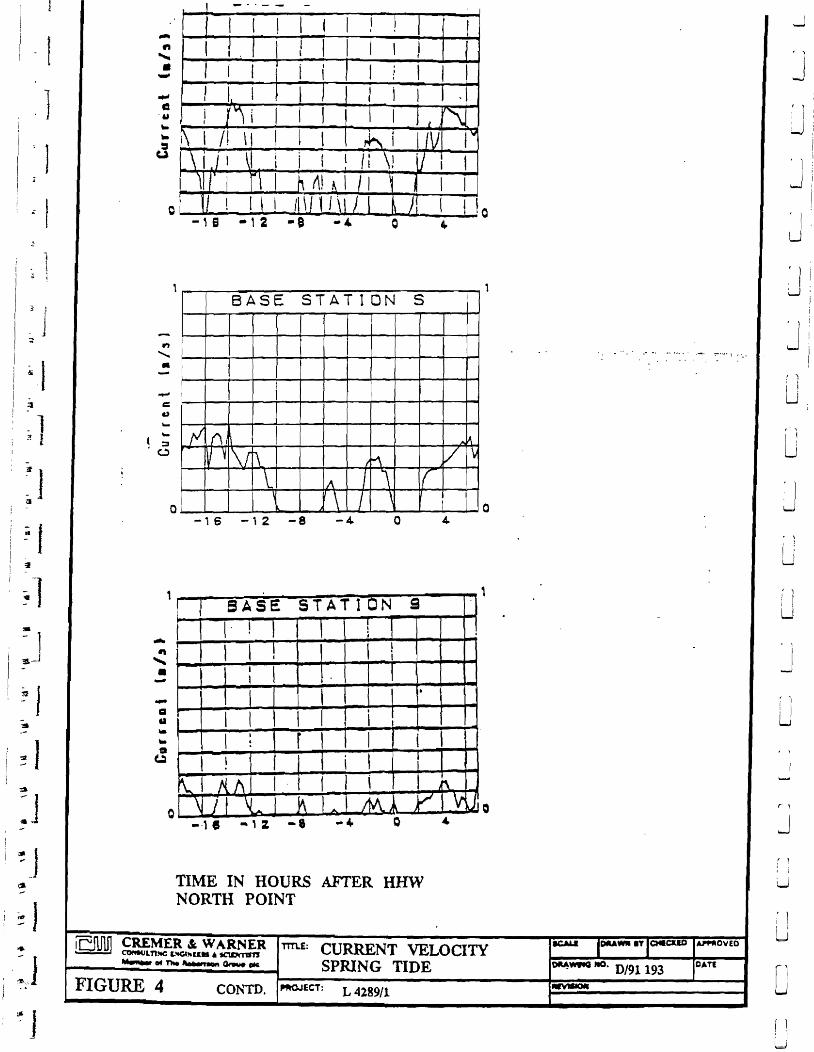
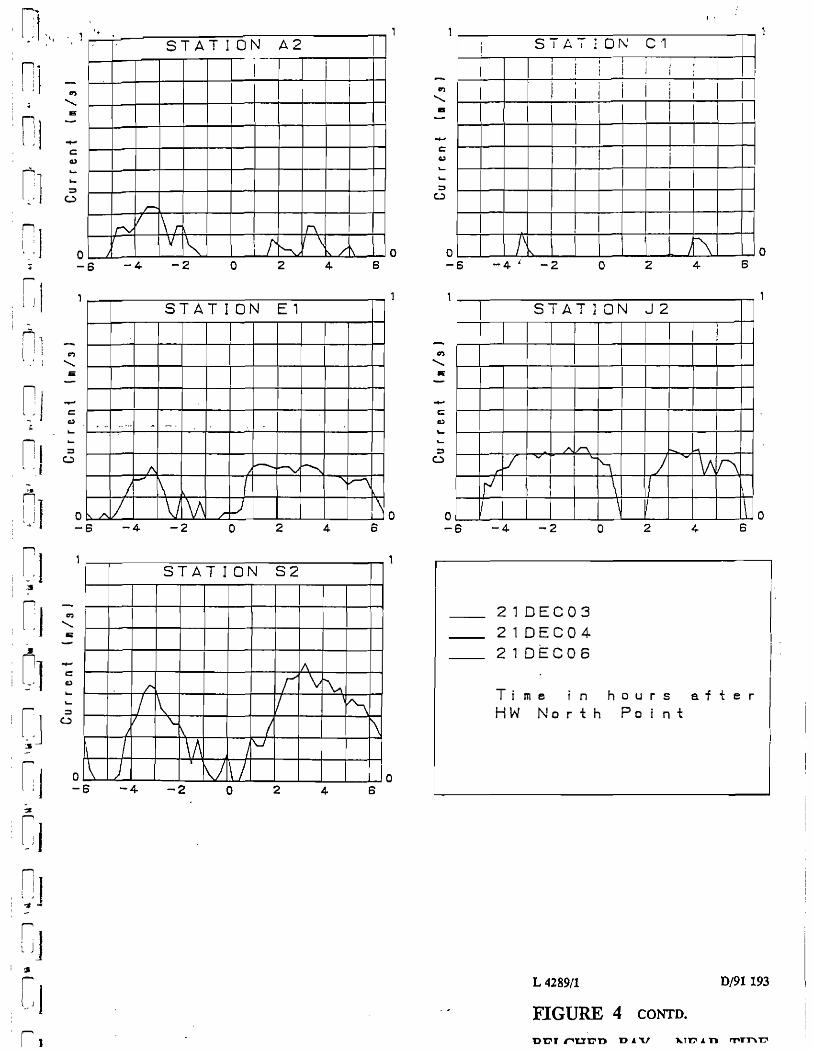
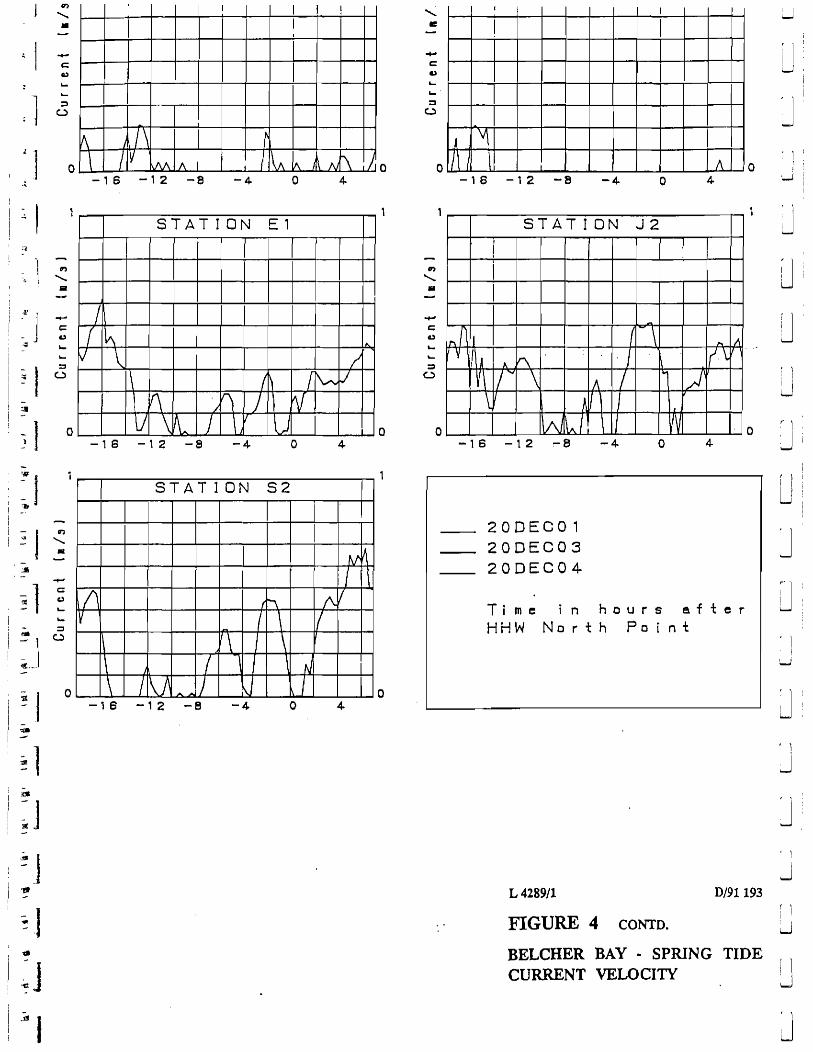
Tidal flow is observed at various points in the waters of Hong Kong, the most relevant to the present study are shown in Figure 3.
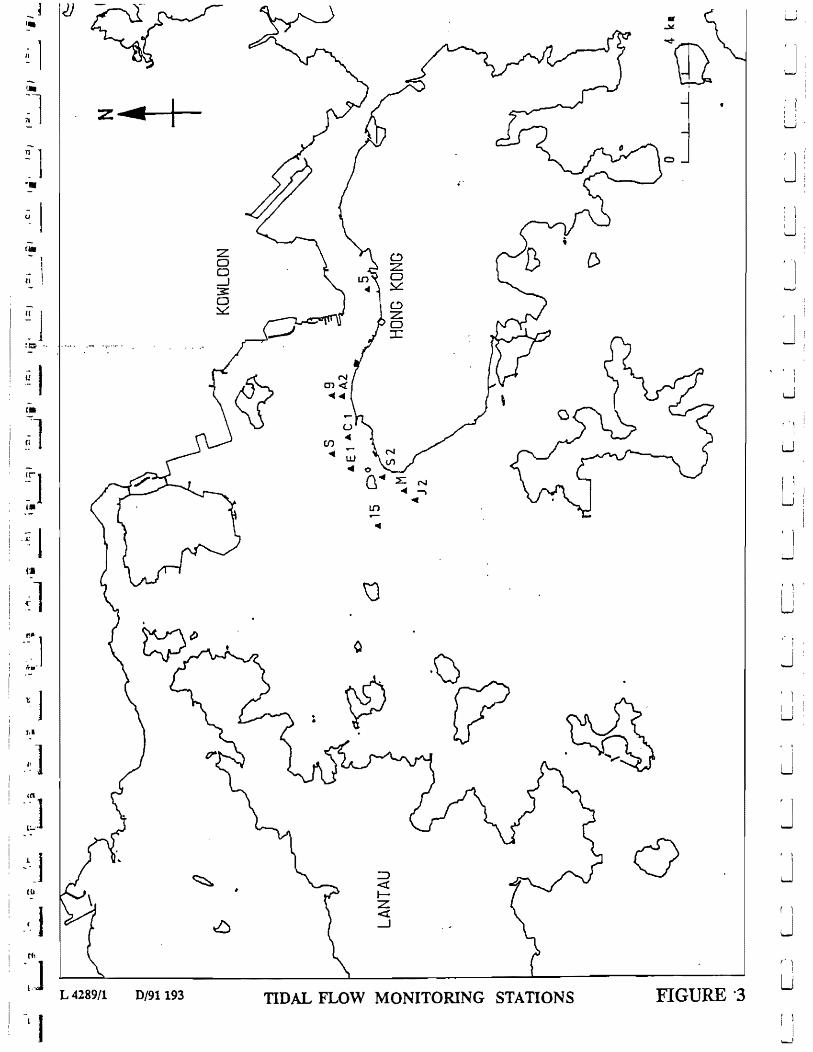
Currents observed at Station 5 vary from 0.4 m/s to zero during spring tide conditions and from 0.2 m/s to zero on neap tides. Currents closer to the sea wall (Cl, El) are variable with maximum values of 0.1 m/s and 0.25 m/s respectively for neap tides and 0.2 m/s and 0.6 m/s on spring tides. Figure 4 gives plots of the current variations over periods of 24 hours .
Closer in to shore. water movements will vary according to more local conditions including vessel activity. In general terms the Shek Tong Tsui finger pier is expected to provide a shielding effect which will tend to negate natural current flows. However, vessel activity will provide some degree of mixing which will help to prevent stagnant water bodies forming wi thin the inner confines' of the pier.
Existing Air Quality
The existing atmospheric envirorunent of the area under study is influenced at the present time by congested vehicle flow. The buildings of the area comprise godowns, residential and industrial premises. The industrial buildings are a mixture of small industries with no dominant emissions J thus although there may be local air quality problems caused by industrial operations the most significant air quality feature of the area is the traffic.
III
'-~ -, !li. I
-ra
~ I
:1 :e J
(I
'r J ..
N
Q.1 ~ KI LOIte'Cr ••
-0 .. 3 a/a
""":" --/: (: :: ~ . : : : L
SHENZHEN
r: ~_ .. · ..... V -~ '-' .. . ...
j. )-~' t:-) r:'"~ : \ ~""t..
'\ , ........... -...... ~ .....
Fig. 1 The current vectors in the F'earl River estuary durfng ebb tide
(From Water Quality and Hydraulic Model studies)
[. . . ·r-: r·-:--/ ~ '/ !. -C:::' . L,r L:. - . . . . . · - .... . . . . . .
L 4289/1
FIGURE 1
SOURCE EPD
• • I · . \
· .. \
, "
," ,. ,. ...... '
, t
D/91193
1990
u
, i
i ...J
, "
~ - ')
! I
J ,", : I I I \......;
~ I j 1
: I ...-.J
, 1
J
,J r \ ! 1
u r \ I " 1 l
W
r 1
, I I .1
1.1
r·' I !
i I
[. : J
I . 1
I : r'I' I }
'.I
rl '~: J
nl l J j
rl ' )
r 1
rj , , ..
• r-: 1
... _ ... Q.! Kr tOIl'l.t,."
-0.3 Ill • .... L.,
~--------------~ i
1. -~ r 1..
. - ..
SH£H%HEN
JV.: • # 11 .. .. • ,
---.;-t-": ~ f ,,--'-'
. , -'
"'-' I --. r::::----~ . ...
, .
'1... .. I I'
; "". 1 , .... i L
~ . \
. . ..
L..
~ . .. -"- ... I
j.
L
.. , , ' .. , ..... " ..... , - l' .... , "- "
, ..... ..... ..... ....., ... .. ... ... "'- " " ..;
Fig. 2 The current vectors in the Pearl River estuary during flood tid e
(From Water Quality and Hydraulic Model studies)
L4289/1
FIGURE 2
I'
-« ":'I.. ... 'j
"i -I.-
.. .. , ...
I I /
I ( I
.. I I
" I : I
.. , ,
I
I'
i ...r
D/91193
fa. 1 I
.. I fI !
-~ j :C " .
. ~ I -,.
-~ J ..
tl
:(~ 1 I'!lIIl ~~ ..
t J
J!l
::1 ~L )
(lI
« J tt,
"1,.1
z ..
L 4289/1 D/91 193
z o o --1 3: o ~
TIDAL FLOW MONITORING STATIONS FIGURE -3
w,
, I
, ' J: I
: 1 , I I I ,
w:
'1 I
J , . \
I
W I ,', :
u I \
I ' ,
LJ' i
, 1
, I ~
, \ ' I .
I I w
j'
, 1
i ! U
.. i
U
J J r 1
J (' i
!
U r I I I --.J
: I ~ , \ ,
, \
;r
n'l I1 j j
~ n 1
; l:w~; i
in, 31
:, nJ I •
; rl '1. "
'f
9ASE S"7AT10N 5 --LJ \ I I I
~ ~~~--~~~-r~~~I~~
~ ~~~--~~~~~~~I~~ - --~~~~~~~~~~~~ ~ ~~~~~~~~~~~~~ It -~~~~~--~~~~;-~~ .. J ~I --~~~~~~~~~~~
., ........
•
-c:: &) . ... = e,.:)
o
I
I
A /
BASE STATION S
I I !
I L'- ,..
/ ..., IV~ ,J
,....., r--C\ V\ Iv \t
-6 -4 -2 o 2 4
.ft
" • ..
I
I
BASE STATION 9
I , I I I I I I
I
hi I I }I 1\1 ~ I" ~ A
ILJ \ B
o
o ~I ..... U 'tJ ~\ -I -4 -2 Q
) -Y ~ 2 ..
h ..I o •
TIME IN HOURS AFrER HHW NORTH POINT
1 : \ • !
. 1 -::
1 ;f I ,
~'-l
:J i' I 'is
I ........ -- -
I I ! I J I I ! I .... i . ft I I I I I i I I
"- I I
• i I i I
I t I ...- I ,
J L I I I I I .., I I
cs i '1 I I I I I ~ ..
1 lilt I
'- ~I /I \ I I I t _~i IV I" :I U \ 1.1 I \ t i I 1 /I \! I I I
I IT I r-'\ I l\tdh.1/1 ~ I I I
0 1 ! I \ i 1\111\\/ ~ ) I ! ~ Q -16 -12 -8 -4 Q ..
1 1 BASE STATION S
-.., I .........
• -....... I c 4Y .... "" tl An ... ~ t :,:,
'0 ~ ~ 1\/1\ Ih V ~ . ~ I \ I( lA
~ \ I \ ~
0 0 -16 -12 -8 -4- 0 4-
1 ,
eASE STATl-ON sa I' ! ! ! I ...
! \ I ., , I i "-• I ! I - I I , . .....
Cl • I I I I I i .. I
-- I I r I I I , .. ! Cl
I u I I I re, J " 1 ' I ,
~
\Jj \~ J\ M~ v Y UJ o 0 JIo.
-·le -1Z -8 -4 \) 4
TIME IN HOURS AFTER HHW NORTH POINT
~ CREMER & WARNER nTLE: CURRENT VELOCITY C'OI'I'MSLT1!IIC '-"IGIi'llI.M .. ~ ........ .,n..~ar...'* SPRING TIDE
FIGURE 4 COy...'TD. III'tItOJECT: L 4289/1
.-.. -. oH ~"'.' ' '.-' ,,:,,""""#" ~ • '~T ..
.
..cAI.I (OAAtMI IV IQ4ICUD .,.,.OV£D
~WIIIO 110. D/91 193 cion
.......,.
J :' I : Ui
JI I
J' , , , I , \.....J '
! i
, 1 !
J: I
! )
: 1
LJ,
J , \
i ; U
, \
! I U
J U , 1
,
J
r ) , i
:' 1 ! : i.......I
I
[1:., 1
· n]
1'1 l;." I
-c Cl)
I
r] .. ~
o -6
~
r=: :!1 -I ! i ~ . '. ,
&
o
. STATION A2
I I
r-
~'/ \r I f\ ,
rr V \. It il \ ~A / h. -4 -2 o 2 6
STATION E ,
I
- .' .~ ... ~ -.
1\ - -~ ~
/ - \ -r ,~
A V V \j\ r. l) \ -6 -4 -2 o 4 6
; [I i .3
STATION 82 I -
. rj s i Cl ~ lA
/' / 'v "" ....
: I:J 0 :s
j 1\ / ~ / \.. I \ / \
~ L \/\ 11\-1
I: j ~6 \ ) \
01 \7 I -4 -2 2 o 4 6
':t
[I n I ! I ' ,
I ~ i
: '!-
rJ L J
, \S
r , t., j I
o
o
o
-c Cl)
o -6
o
i STAI iON
I I ! I
1 i
I ,
i i i I
I l I
, ! I I I
I I
I ! I /\. I
-4' -2 o
I STATION
I I
L'... L"""..
r/ .... I ~ '\
Irl \ 1I \
I'
C "
I ) I I I I , ,
i i I I , ! I j
!
I i , I I ,
1 ,1\ o 2 6
J2
! I
I
I
- "'" J
...., \A r\
I { 11 \ o
-6 -4 -2 o 2 4- 6
21DEC03 21DEC04 21DEC06
I i : I
Time in hours after I HW No r t h Po i n t I
I
L 4289/1 D/91193
FIGURE 4 CONTD.
er)
........ • -
I I I !
1 I I
~ I -c: Al
1 :
; 1 .... ~
0
: ] 0
lA I /\ ~ \ I v
~ A I I I~ 1\ J ,\. Ai \ r/l -16 -12 -8 -4 o 4
~
I ..:,
STATION El ;.~
I -1
en
- ........ IiiI
,1'
I -+-
c:: ~ J a)
~ '-- .... -
I :::;,
~ 0 -
-:JII
/ ( ~ I~
V \.1 / 1 I~ l~ J
\ V\ "), j rv -- I 0
)
-
V \ Ifl J \ v J -18 -12 -8 -4 o
-
~I STATION S2 --
-
I Cl)
....
" - • - -
1
fV"~ .:Jl
" --+-
~l c:: Cl
'-.... - :::::I
I \ f\ (1\ (\V
V I \ I .. 0
~ 1 oK •• -. -
1\ 1 I \ \ I \ I \N
-
.I
0 11 -\ /V A.~ ) ,J 1
-1e -12 -8 -4 o ;. .-
~l :dl
~J
~J '!I -~ .J -cS
.~J .:IS
I
o 0
en
" 51
.... = o
o 0
o
( I I
I 1
I
A 'vi III \ t
-16 -12 -8 -4 o
STATION J2
I i 1
-I" r J l -' Y ! A . J
f.. f\ 1\
V\ j" \ A / \1 hll \ J
W ,I.A I l 1 -16 -12 ~8 -4
20DEC01 20DEC03 20DEC04-
Iw,
o
1
A 4
1'!. A (\ v -
,)1
I
VV 4
Time in hours after HHW North Point
0
0
L 4289/1 D/91193
FIGURE 4 CONTD.
I i W
,
1 i W
J 1 I
~
, i
U
U
:J r 1 ~ r
1
J r 1
U
J [J i
1 w
J , 1
J
,J , ~
i
..J
( \
! I
~
BELCHER BAY .. SPRING TIDE r 1
CURRENT VELOCITY ~
, 1
J
:
;
i
i
;
i
i
I
i
I ~
:
: ,
r~ , I I ! ..... ,I
ni : ~ r • ;It
l ,:1
D r i I
il_ ' t :2
r-" : I " r
-r..
l 4.
rl i i' I : I ' , -. , ... -
Gl -
Cl ,.......
i : I \ ; :
I .-3 I -
n
'I. ~J . 't ~
! '1 I ,
l ... ;
rl !Jr
~l "Go
rl ,_J
n1 I I I )
~J
~I ! I , )
'0
[I II
"
I'
Page ·9·
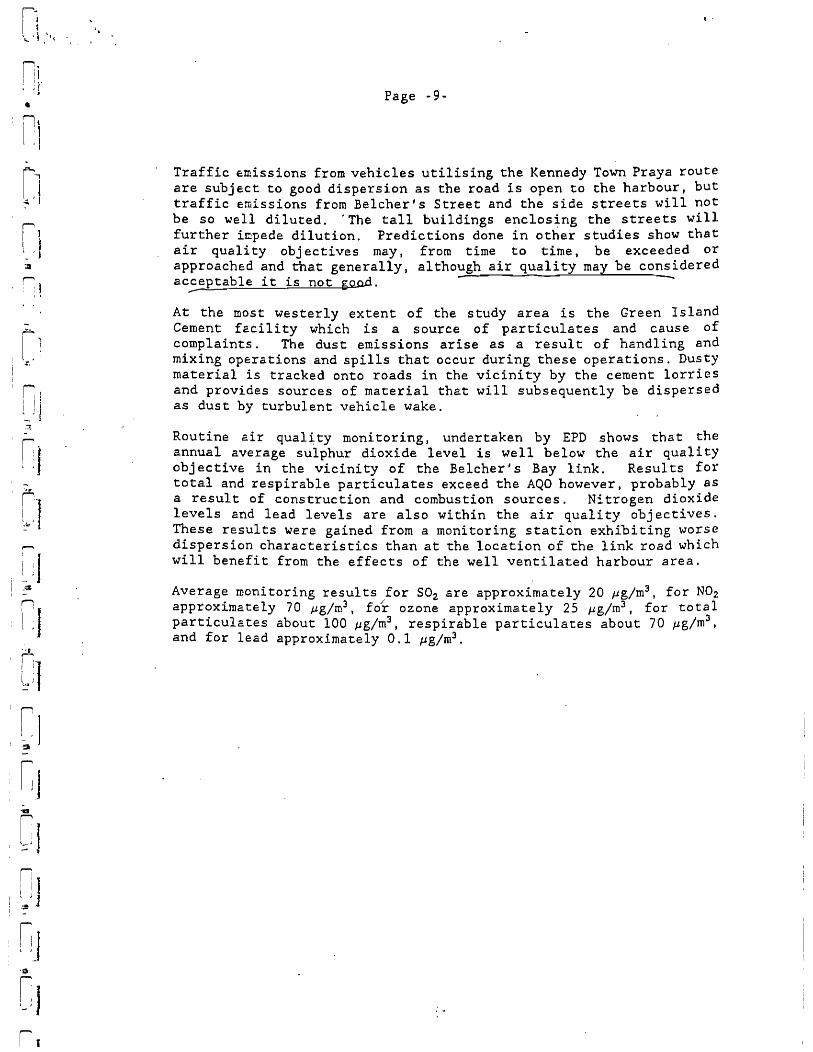
Traffic emissions from vehicles utilising the Kennedy Town Praya route are subject to good dispersion as the road is open to the harbour, but traffic emissions from Belcher's Street and the side streets will not be so well diluted. 'The tall buildings enclosing the streets will further i~pede dilution. Predictions done in other studies show that air quality objectives may, from time to time, be exceeded or approached and that generally, although air quality may be considered ac~eptable it is not gond. --
At the most westerly extent of the study area is the Green Island Cement fa.cility which is a source of particulates and cause of complaints. The dust emissions arise as a result of handling and mixing operations and spills that occur during these operations. Dusty material is tracked onto roads in the vicinity by the cement lorries and provides sources of material that will subsequently be dispersed as dust by turbulent vehicle wake.
Routine air qual i ty monitoring, undertaken by EPD shows tha t the annual average sulphur dioxide level is well below the air quality obj ective in the vicini ty of the Belcher' s Bay link. Resul ts for total and respirable particulates exceed the AQO however, probably as a result of construction and combustion sources. Nitrogen dioxide levels and lead levels are also within the air quality objectives. These results were gained from a monitoring station exhibiting worse dispersion characteristics than at the location of the link road which will benefit from the effects of the well ventilated harbour area.
Average monitoring results for S02 are approximately 20 pg/m3 , for N02
approximately 70 pg/m3 , fo~ ozone approximately 25 pg/m3 , for total particulates about 100 ~g/rn3, respirable particulates about 70 pg/m3
,
and for lead apprOXimately 0.1 pg/rn3 •
~ I
,-.:;1
-~ 1
J .'12
~ 1
~l -. ~J '. ;;. I - '
4.0 THE PROPOSED RECLAMATION
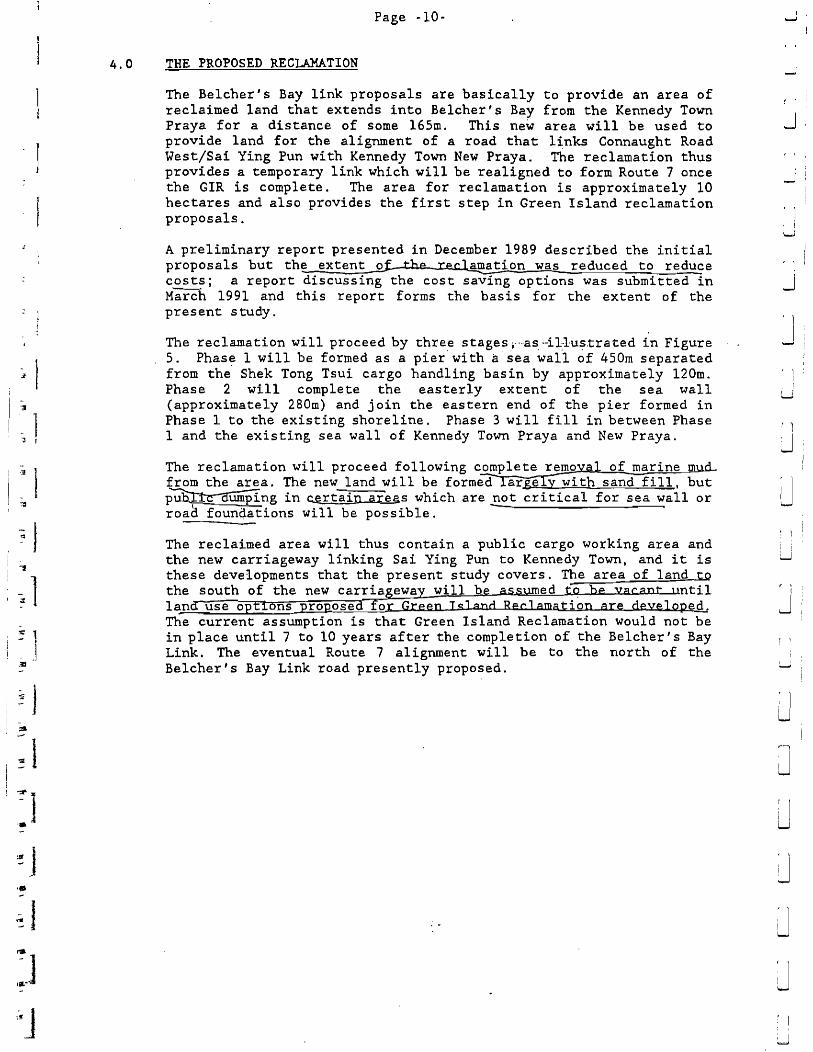
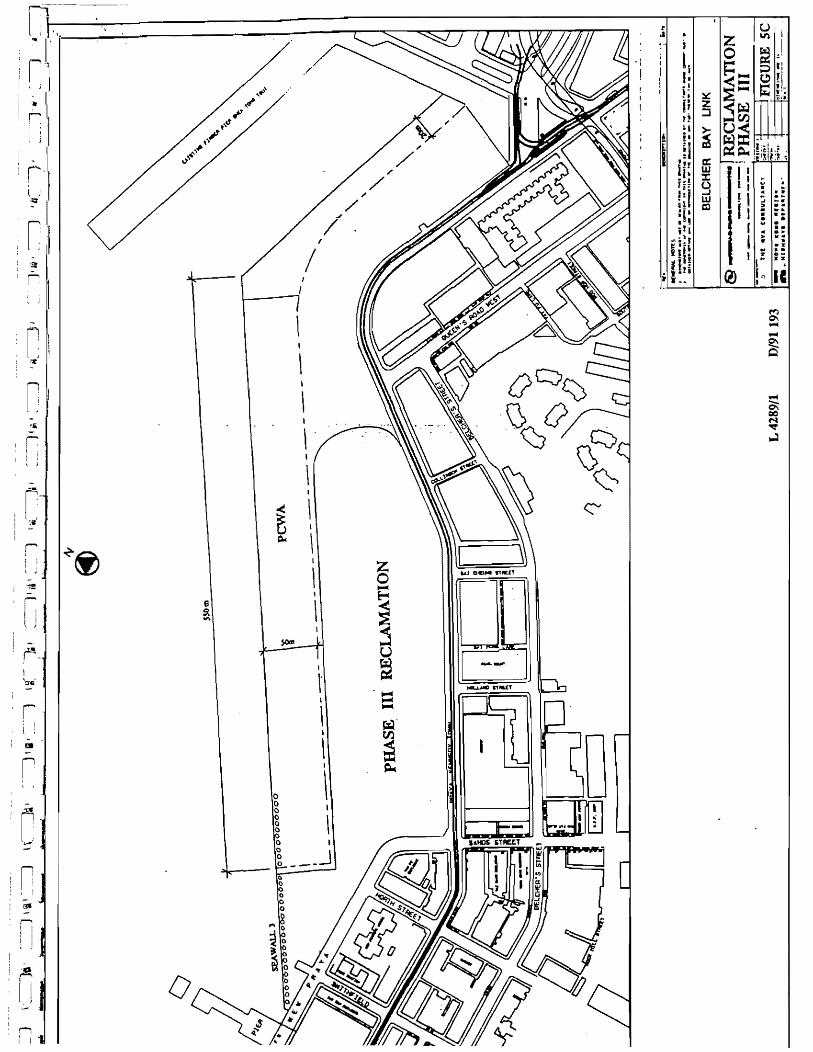
The Belcher's Bay link proposals are basically to provide an area of reclaimed land that extends into Belcher's Bay from the Kennedy Town Praya for a distance of some l65m. This new area will be used to provide land for the alignment of a road that links Connaught Road West/Sai Ying Pun with Kennedy Town New Praya. The reclamation thus provides a temporary link which will be realigned to form Route 7 once the GIR is complete. The area for reclamation is approximately 10 hectares and also provides the first step in Green Island reclamation proposals.
A preliminary report presented in December 1989 described the initial proposals but the extent.$. the .recl~ation was reduced to reduce costs; a report discussing the cost saving options was submitted in March 1991 and this report forms the basis for the extent of the present study.
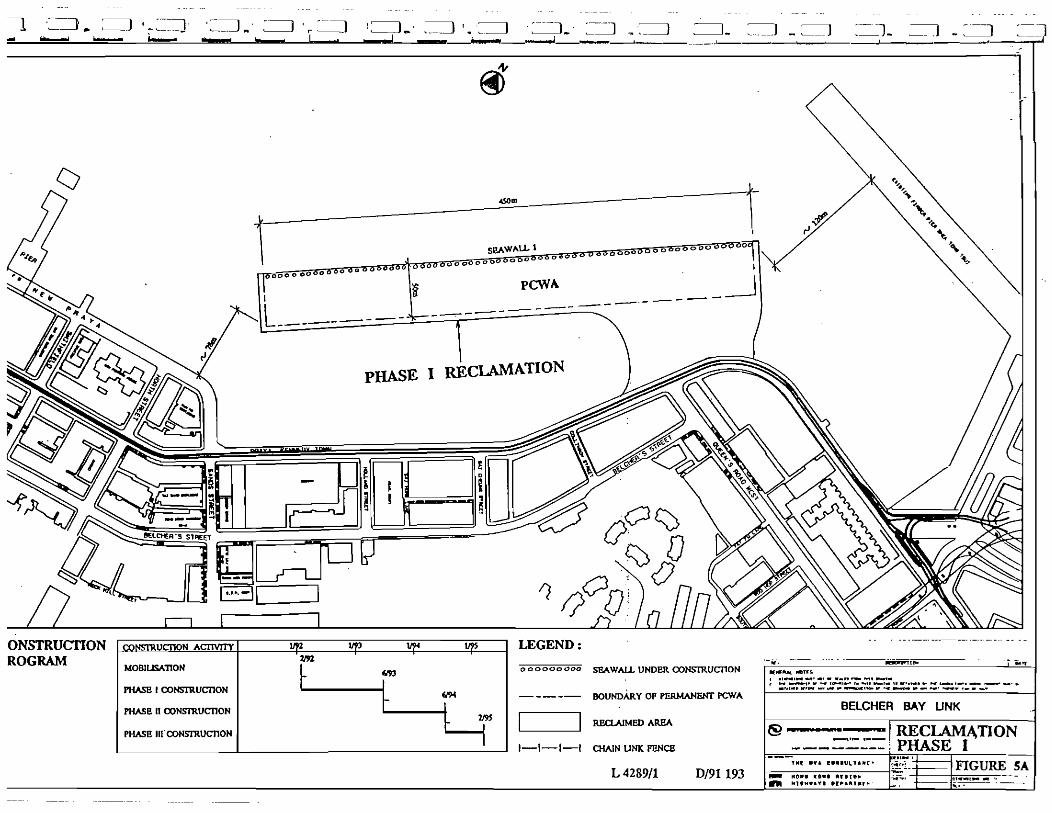
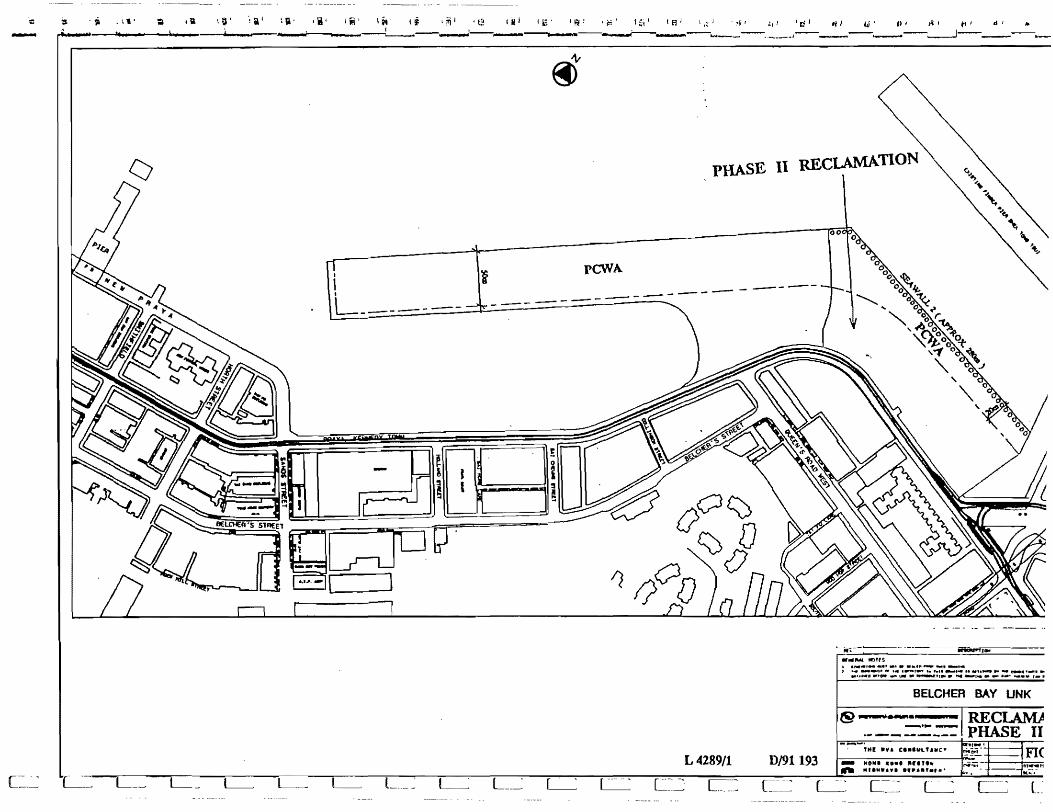
The reclamation will proceed by three stages ;····as --il-lus.trated in Figure 5. Phas~ 1 will be formed as a pier' with a'sea wall of 450rn separated from the Shek Tong Tsui cargo handling basin by approximately l20m. Phase 2 will complete the easterly extent of the sea wall (approximately 280m) and join the eastern end of the pier formed in Phase 1 to the existing shoreline. Phase 3 will fill in between Phase I and the existing sea wall of Kennedy Town Praya and New Praya.
The reclamation will proceed following complete removal of marine mudfrom the area. The new land will be forrnecllar.&-ery;.ith sand fill, but p~ng in certain aregs which are~t critical for sea wall or road foundations will be possible.
The reclaimed area will thus contain a public cargo working area and the new carriageway linking Sai Ying Pun to Kennedy Town, and it is these developments that the present study covers. The area of land to the south of the new carriageway will b; a5~~ed tq b~ ~a~:~: l1ntil land use options proRosed for Green Is' a;\d R
J
;(.1;;matioIL;re d;;;lope9..t The current assumption is that Green Island Reclamation would not be in place until 7 to 10 years after the completion of the Belcher's Bay Link. The eventual Route 7 alignment will be to the north of the Belcher's Bay Link road presently proposed.
r 1 I I LJ
: 1 '
J
J , 1
J , )
i r
U
! ~
j
j
J ,~ ) , ,
~
~ '~=:l.. =----_J t - ~::::==:J . '=~=:J .. ' =-=:I ',~ -=::::] ! ~::J _' ==:J r .. '==:::J . r-'--J ... ' =~ "".~ =::::J _ ,-__ . __ J _. __ J ~ ........- '-- I." ... __ .---J ___ ---' _____ ,_~_ .. I ___ , _______ .
==J _ _.J.. =::::J ~=.:..l ...
:ONSTRUcnON 'ROGRAM
UCllON ACI1VJTY vn
NOBIL&.nON
PHASE I CONSTRUcnON
PHASE 11 CONsm.UcnON
PHASE Ill" CONsntUcnON
, -..... iI
@ AT
otSOm
SCAWAlLl 00 0 00
00000 0 000000000
0000000000
-----
PHASE I RECLAMATION
LEGEND:
03 000000<300 SEAWAU. UNDER CONSrRUcnON
BOUNDARY OP PERMANENT PCWA
REClAIMED AREA
1-1-1-1 OWN UNK PENCB
L4289/1 D/91193
----_.--_ .. _ .. , _ .. __ ..... ~ . ~
--'"'--_ ..... ·----lIiiii:JrrrTtDlf -- 'i"''' ............. TH
...... , ......... ' .. ' - ..... "'"'I!/III..." ........ .. --.. ......... I"." .... ( ..... I ..... r ...... 1' ..... r .. "_' .... D ....... CJIiIIIeI& ......... ~ .... • ... .' •• "''' wrOl'lf ............ ~"4'.JiI>. r ....... , ... ..., ...-- ~'P ~_ • _w
BELCHER BAY UNK
@ • ... ~._I .. -=I RECLAMJ\TION --------; PHASE I HII .Ir' C .... VL'. lie'
_ "(I'" UI'" .,.u .. .. "" .. 11.". 'I~a"'"r.' FIGURE SA
___ .~~:-'fllJllll ~ ': _____ _
la l -
PHASE 11
i.J' i~1 ..,1 d f __
11_1 - ... _J-- __
lAMATlON REC
'r I ; : I ' ,
-, n ; , l ~ ;
~
-'. ~r : l ;
-r I 1 , i ~iI i -I
: G j i.;-. , r-
I , ;
~c
1 at-
r I
~ ~
S ~ ~
;
/
/ J'
/
I
\ <:::" I
\ I
Z \ 0
....-c I
~ \
U I ~ \' I .= \
..... ~. ,
~ \ I
\
~ I
-::.1
t, •
.;~ I :,:.1
Page -11-
/1 The 50m wide ycwa allows for internal traffic, loading and 'unloading parking. crane operation zones and goods deposit areas. Generally therefore the northern edge of the road will be exposed to the open harbour whereas for most of its length, the southern edge will have approximately 90m "buffer" before sensitive receiver locations are reached. At the study area west and east boundaries, however, the proposed road is in close proximity to residential buildings. As the subject matters of the present study will influence the air quality of the 90m buffer to the south of the roadway it is important that this feature is further studied as other proposals are developed.
As the road alignment has been dictated by cost considerations and the need to proceed with a reduced reclamation area, it has not been possible to introduce extensive buffers to control exposure to vehicle emitted pollutants .
. ' ~- . - -
:.J'
, 1
J ~ 1
!
U
J
J
, 1
J
, 1
J
J
, \ , \
, i U
. 1 ! I L.J
nl II lj
) 1
, , 1 ;r
I~' I
n'l l ;
n1
l:l ... ~
l.l r \~"l r~J III
rl l •
Cl ri
I)] \1..
n} l )
" " ~ l , 1
5.0
5.1
, .
Page ~12-
EFFECTS DURING CONSTRUCTION PHASE
Any consideration of effects caused by the Belcher's Bay reclamation project must also take into account the fact that other reclamation projects in the immediate vicinity and overall plans for the development of Hong Kong will also have an impact on the water and air quality of the area presently under study.
The Green Island Reclamation study, for example t has identified extensive reclamation limits which will eventually alter the seaward extent of the Belcher's Bay proposals. Once the Green Island reclamation has proceeded the'Belcher1s Bay reclamation will not have any identifiable. specific impact as the effects of Belcher's Bay and Green Island will combine.
It is thus important that an overview is undertaken that considers the combined effects of development proposals. This overview is outside the scope of the present study. It is nevertheless, considered, an important step in the assessment of Hong Kong's environmental quality and it is recommended that Government should undertake' 'or' commission such a study.
Water Quality
5.1.1 General
The effects of the construction process on water quality are determined by:
o reclamation construction methods o reclamation construction timetable and phasing o reclamation construction materials o sea wall limit.
The construction method that is proposed will be to dredge sea muds from the reclamation area; provide a sea wall and then fill the area enclosed by the new sea wall and the existing sea wall with marine sourced fill. It is probable that S!-~dr..e_dge.1:s_.w.ill~e_u~j3d_fQr.-l:he ~cavation o(jmarin~u~ and sand f~ Although suction dredgers are preferable in terms of ability for enhanced pollution control and have the additional benefit of speed of operation it is unlikely that their use could be justified for this operation on economic grounds.
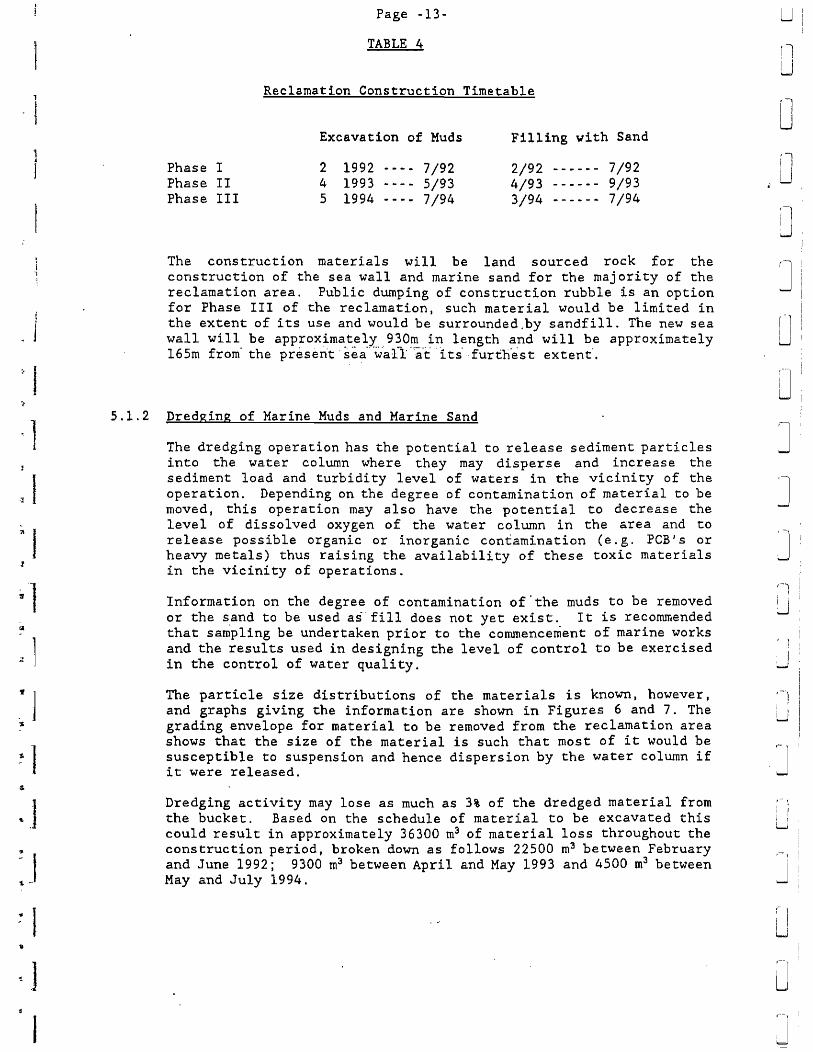
The reclamation construction timetable is shown in Table 4. Due to the relatively small areal extent of the proposed reclamation the timetable extends for a period of thirty months from February 1992 to July 1994. ~
~ ,
'I
Page -13-
TABLE 4
Reclamation Construction Timetable
Phase I Phase 11 Phase III
Excavation of Huds
2 1992 4 1993 5 1994
7/92 5/93 7/94
Filling with Sand
2/92 ------ 7/92 4/93 ------ 9/93 3/94 ------ 7/94
The construction materials will be land sourced rock for the construction of the sea wall and marine sand for the majority of the reclamation area. Public dumping of construction rubble is an option for Phase III of the reclamation, such material would be limited in the extent of its use and would be surrounded.by sandfil1. The new sea wall will be approximately ,930m in length and will be approximately 165m from" the present' sea"'w"a11'"a"c "1 ts' . furthest' extent",
5.1.2 Dredging of Marine Huds and Marine Sand
The dredging operation has the potential to release sediment particles into the water column where they may disperse and increase the sediment load and turbidity level of waters in the vicinity of the operation. Depending on the degree of contamination of material to be moved, this operation may also have the potential to decrease the level of dissolved oxygen of the water colwnn in the area and to release possible organic or inorganic contamination (e.g. PCB's or heavy metals) thus raising the availability of these toxic materials in the vicinity of operations.
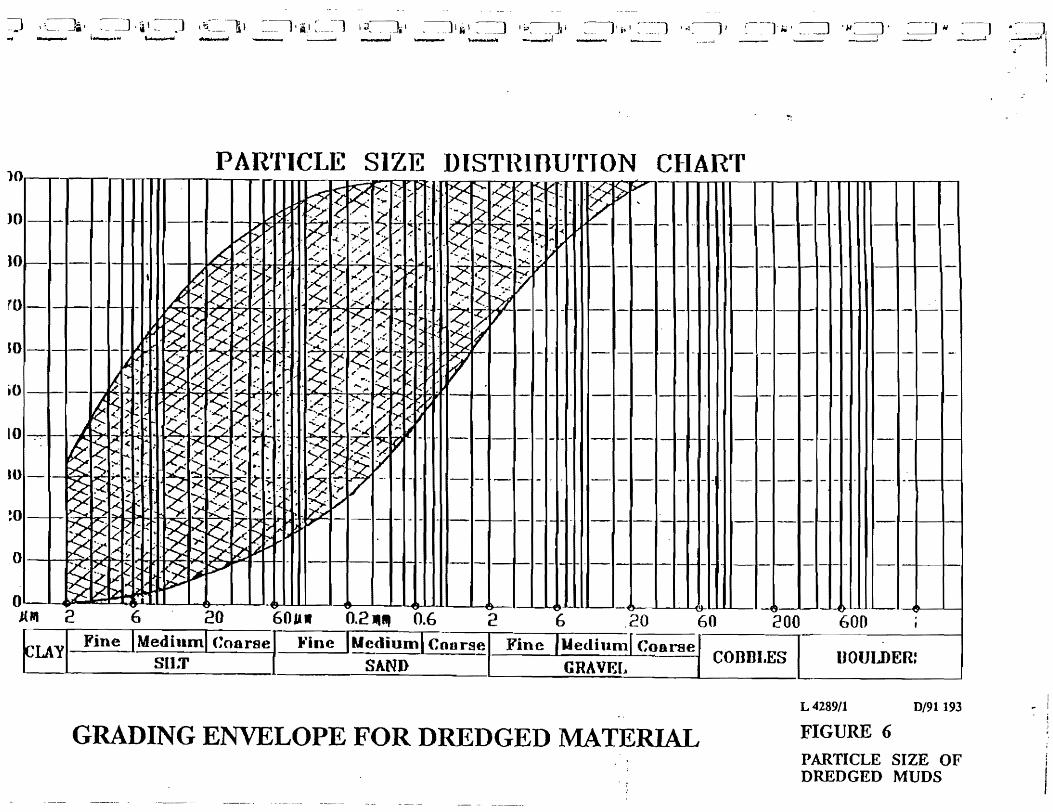
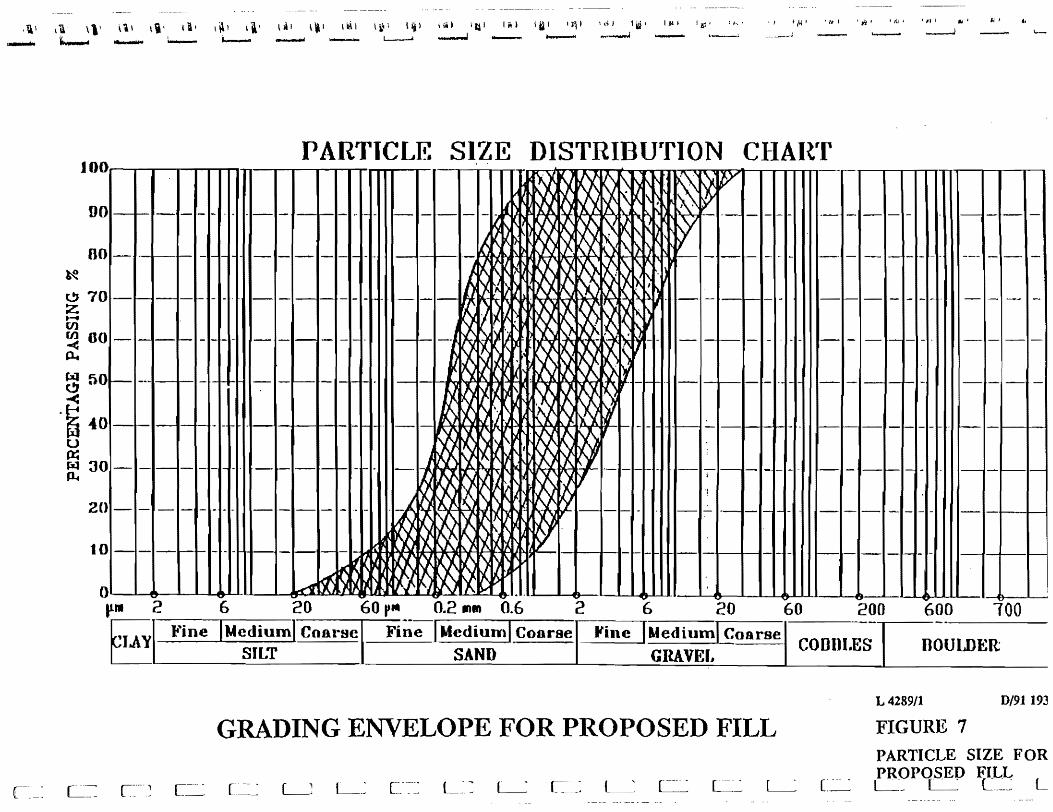
Information on the degree of contamination of "the muds to be removed or the sand to be used as' fill does not yet exist. It is recommended that sampling be undertaken prior to the commencement of marine works and the results used in designing the level of control to be exercised in the control of water quality,
The particle size distributions of the materials is known, however, and graphs giving the information are shown in Figures 6 and 7. The grading envelope for material to be removed from the reclamation area shows that the size of the material is such that most of it would be susceptible to suspension and hence dispersion by the water column if it were released.
Dredging activity may lose as much as 3% of the dredged material from the bucket. Based on the schedule of material to be excavated this could result in approximately 36300 m3 of material loss throughout the construction period, broken down as follows 22500 rn3 between February and June 1992; 9300 m3 between April and May 1993 and 4500 m3 between May and July 1994.
u rl U 'I I I
U
i1 U
J
[J
J ]
J
, )
I ~
1-' •
,: i u
I-I,
J (" I
i !
U
f---\
J
\ ---Ji, , ·i' -- '-" ~
)0
)0 - - 1- -' -1-
10 I--- I- - - 1- ""'1--, ~ - 1-10- - '-- r- - .
~ ~ - ,- - 1- - I- ,; '"
~ ~~. '
~ ~ .... v' . 1')-
ro
o
~ ~ I> , I; R I; ~ ~ ~ -t.,
I~ j 1'< ~.~k ..
~ t:? ~ < I'" .~ ~
.c i'" ~
~:
"'> ;.. . :-l~ -
~ r--. I'il-. ; ~...(. k .....
~ .. R:: k: 'i< . ~
1-. -< ~
~ R I' ,. "l{
:.~ k ~1. ~ . k I.~ '1*
~ :,-
~ P"-~ i? I' < ~ ~ ~ ~~ i' t2: ~li
(0
10
~o
o
li:C~ .. ·§l 'j,1 " --1 I;(-:-~il i,1 ~ ~
~ -----J __ 1i,;.~,1 ----1 1.,1,
--I I I~---l;.,·
PAR'I'ICLE SIZE DISTl~InurltJON CI-IAR.
~ ~ ~ '>< r> ~ p 1'--' K ""- I~ ~.
r<'. ~~ :~ ~ r>" ~" "" .
I~
~ ..( '.,.. ,( ; I- ~ .
,.k~ ~ ,f<: . ~2:. I> ,.( V
. ~ , .
7' r-:-. 'c r ..:.. .... 12' i: r-- - - .. - - . i- -- -
~ ~ P' , I' -r'" ~ ;. .. .. X I~ ,~ I~ 1:>-
.( I..-: .. ~. . )-,
" , .~ - ~~ ~> -..
h / . ~ . ;-.;
'/ ,; ..... ~
r ,. )".. .. ,..~
, '" ~ ./ <.. ... ~ -...;. " r? I--- - - I--- - -
I~ ~ V r> p.
.~ ">- ,,' 4" ,r ~ .. , I· : .~ ~f ~ P" ~ ,
>- '-' I~ 74.".", -;, I)'" .~,
,~' ..
~ .,' ~
I~ ~ ~.t::.' I)' ~ ; . ~.~ ;t'I-. ",' <;
. ~
~ [)c' ~ r/ ./ J!{ "-..
.,. ........ J - .. '.~' - r---
~ ~ l)'t' "17.; ,<.J ~/
fl"' .... 1 ' 1>-1;
1% 1-<. I' - - - r--- - r--- - i- I-
< ) . ".:.' t:> ..
k:" V~~ ,/ i>., .-
~ JIi". ;,..<.... 7'/ .. > ~ ,.( ~ /<" ~« •• I? ) )< k' .
:.I~ , .' "'/
~ - - - - 1- - -1- - - -/. ~ l5-' !o< .,:t - ~-19 I .... "
.~ >< c-( '. /'
r/ ~ ,..
~ k'; .,,< I~ ;11
.r "')0( ."< v , . ' .... I~ k~ ~ 'I' " ""-, -.'" J'
-1-1-- - r--- - 1- - -I~ ~~ ~ r-. 1/ ~ . ~/. ., V 2' v: I)~ ~ ,(
. ,
.( , ...... :,:: '/ ;. r)o< k:~ ...... ~~ ~ ." ,
.< 0 :)" ;. ~ . 'r ~~ 1:/ ~ '.J_ .....
~ IT ...... : I....: I"- - -, - - ,.....~ - - - ,- -I- I- .. - t- -~ r9 ~ ~ ,
7-
I~ ~ r~ ~ 1-
15 7 ,..c. -l~ 1I .'')'~ < ... ~ ~
~ ~ I~ ;I~ t~ 1- - ->< '" / - -- .- -. - - - -- - - - . - -')< -1"
1>= ..( ..:..~~ >' ~ ~
.~.
')-C '"' -.~ I~ , "'" ,- -i- i- . _. - - . - - -K
~ K ~ D-Ir
.,..: ~ ~ ~~i.I' ~ :..-
~ 1- i-i- - -I- f- 1-- ~
~
J{PII 2 6 20 60". 0.2 11 lit O.G 2 6 .20 60 200
~LAY Fine Medium (!oarse )'inc IUediuml Coorse Fine Uedhl~l Coarse
SI1.T SAND GRAVEL COnDI.ES
GRADING ENVELOPE FOR DREDGED MATERIAL
- - . - - - -
r- i- - - . - r- - -
-f- ~- - - -
1- - -- - - - _.
- - r-- 1-
- -i- - -
- - - 1- . -. -
- '-- -
- i- f-" -
600 I
UOUIJ)ER:
L 4289/1 D/91193
FIGURE 6 PARTICLE SIZE OF DREDGED MUDS
I - I
~ "
Hil 'r,al lid liJ 1Jl' \ <-i I 1 W I I III I I ~~' "'. ' ) I j.! ' • It I • it, , 11, ,
.--J - -~ ~ ~---....- ...
PARTTCI ... E SIZE DISTRIBUrrION CI-IAI~rr JOO
DO
H ~~ ~ ~ 1\ R~ \
~ ~ lY ~K K '\
~ _ l . - .
, r\ - - .- - ... - - - - - - .- - -- - .- - - - - 1- - - -
~~ , ~~ ~ ~
~ ~~ ~ ~ ~ ~ \ [}.) - - - - - 1- ~ .. I [\ - f--. - - - - -~- --- - _. -
~ ~ (I ~ r ~ ~ ~
[\t'
~~ .} Ai. , ~ \.~ - - --- - r- - - - - - r" - "- I I)~ . ~ ~ ~ ~ , . - ;- - - - - - -- - - - -
~ \ 1'\' '\ Q' - - - - - i-- - - 1- - - 1-- ~ I~'l - f-- - - - .- - _. - - - -
~ ~ ,~
,.
~~ ~ ~ ~ I
f.,~ ~;
~ '\ - --- ._'-f- - - '------ - 1- -f-'
~ ~ ~ I
~ i -- -. - - - - - - - -
'f'.,'" ~ ~:J '. \
- - -I-.j \ - . - - - - I- - - --
J~ ~ ~ ~~ 'J. . i
\ I
- - 1- - -- - . - r-- - ,- r-- - -..
~ ~ ~ K ~Kt \~ ~ '- - 1-- . - i-' - --- - - I-
S
i - - - - - - .. - - 1- - - -.. -
~ ~ ~ ~ ~ I" IJ ~
, 1- r-- - - '- - 1- 1- - - - 1- -. -1- - -~l'\
- - - - r- - - . k' X~, -. - - -'f '}
fh ~~ t" -
~ K
~~
~ X~ ~~ ~ IJ \, ;
80
20
to
o li. 2 6 20 60 ,.. 0.2... 0.6 2 6 20 60 200 600 100
flAY l·-ine I Mediuml C08.1"'SC Fi;;e J MediumLcoor8e Fine IUediuml Coarse -.
CODDI.ES nOU[J)ER: SILT SAND GRAVEl.
L 4289/1 D/91 193
GRADING ENVELOPE FOR PROPOSED FILL FIGURE 7
PARTICLE SIZE FOR PROPOSED FILL
~ ['... L..:"~ ~ L_~~ L
rYj l' ;, , ,
, , .
rt l ~ I
[:,1 , I I i
~l , f ; f ! I I ,
r: t ' •
l ;
ni , 1
: j , .
'.
nf , ,,, .
nI n'-! 1 _, I
,I
"" i""11 [.I..
~I l J
',. ill • I
t,
Page -14~
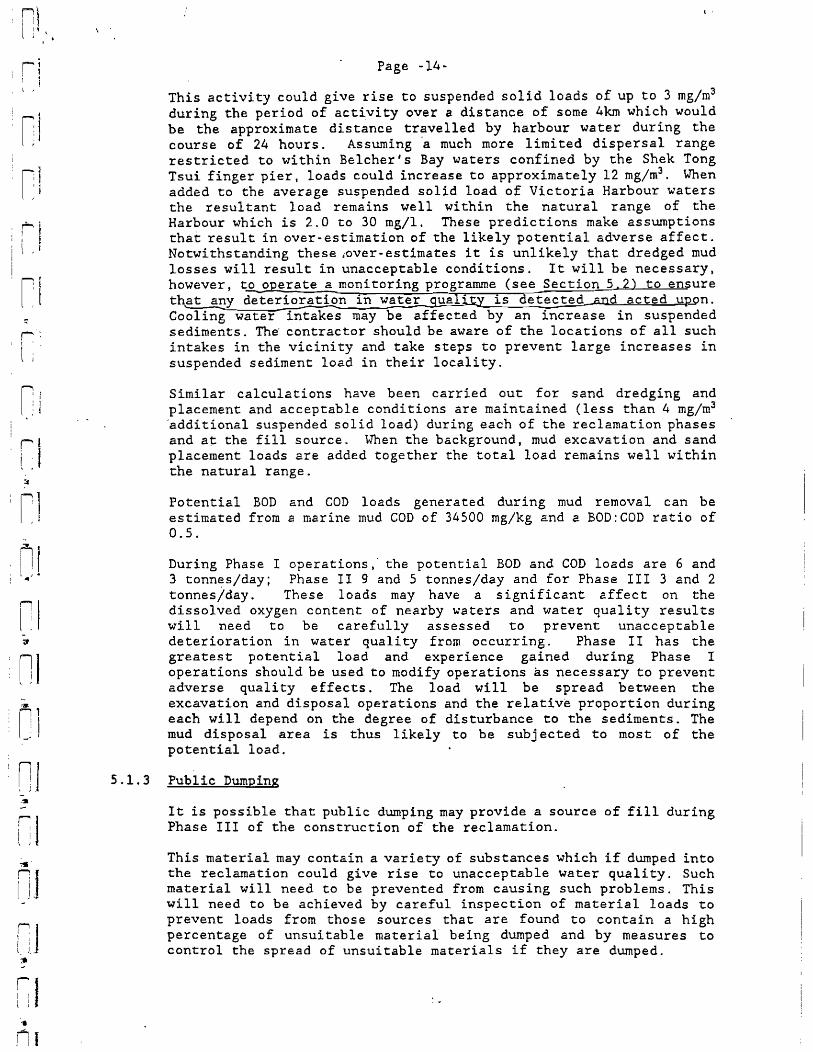
This activity could give rise to suspended solid loads of up to 3 mg/m3
during the period of activity over a distance of some 4km which would be the approximate distance travelled by harbour water during the course of 24 hours. Assuming 'a much more limited dispersal range restricted to within Belcher's Bay waters confined by the Shek Tong Tsui finger pier. loads could increase to approximately 12 mg/m3 • When added to the average suspended solid load of Victoria Harbour waters the resultant load remains well within the natural range of the Harbour which is 2.0 to 30 mg/l. These predictions make assumptions that result in over-estimation of the likely potential adverse affect. Notwithstanding these .over-estimates it is unlikely that dredged mud losses will result in unacceptable conditions. It will be necessary, however, to 0 erate a monitoring programme (see Section 5 to ensure th~y deterioration 1n water sua ~y ~s detected_and acted up~n. Cooling water intakes may be affected by an increase in suspended sediments. The' contractor should be aware of the locations of all such intakes in the vicinity and take steps to prevent large increases in suspended sediment load in their locality.
Similar calculations have been carried out for sand dredging and placement and acceptable conditions are maintained (less than 4 mg/m3
~dditional suspended solid load) during each of the reclamation phases and ae the fill source. When the background. mud excavation and sand placement loads are added together the total load remains well within the natural range.
Potential BOD and COD loads generated during mud removal can be estimated from a marine mud COD of 34500 mg/kg and a BOD:COD ratio of 0.5.
During Phase I operations, the potential BOO and COD loads are 6 and 3 tonnes/day; Phase 11 9 and 5 tonnes/day and for Phase III 3 and 2 tonnesiday. These loads may have a significant affect on the dissolved oxygen content of nearby waters and water quality results will need to be carefully assessed to prevent unacceptable deterioration in water quality from occurring. Phase 11 has the greatest potential load and experience gained during Phase I operations should be used to modify operations as necessary to prevent adverse quality effects. The load will be spread between the excavation and disposal operations and the relative proportion during each will depend on the degree of disturbance to the sediments. The mud disposal area is thus likely to be subj ected to most of the potential load.
5.1.3 Public Dumping
It is possible that public dumping may provide a source of fill during Phase III of the construction of' the reclamation.
This material may contain a variety of substances which if dumped into the reclamation could give rise to unacceptable water quality. Such material will need to be prevented from causing such problems. This will need to be achieved by careful inspection of material loads to prevent loads from those sources that are found to contain a high percentage of unsui table material being dumped and by measures to control the spread of unsuitable materials if they are dumped.
1
]
-",.
~J ~ J
:.1
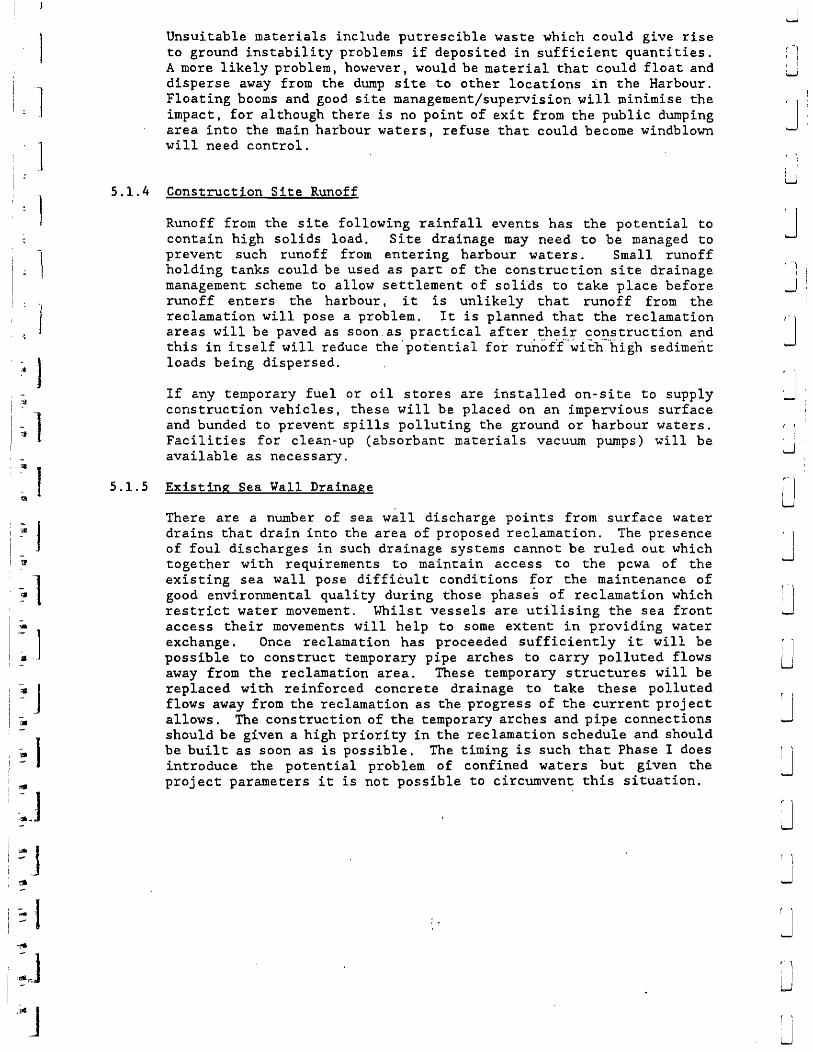
Unsuitable materials include putrescible waste which could give rise to ground instability problems if deposited in sufficient quantities. A more likely problem, however, would be material that could float and disperse away from the dump site to other locations in the Harbour. Floating booms and good site management/supervision will minimise the impact, for although there is no point of exit from the public dumping area into the main harbour waters, refuse that could become windblown will need control.
5.1.4 Construction Site Runoff
Runoff from the site following rainfall events has the potential to contain high solids load. Site drainage may need to be managed to prevent such runoff from entering harbour waters. Small runoff holding tanks could be used as part of the construction site drainage management scheme to allow settlement of solids to take place before runoff enters the harbour lit is unlikely that runoff from the reclamation will pose a problem. It is planned that the reclamation areas will be paved as soon.as practical after their construction and this in itself will reduce the' pot"ential for runo{Cwi th-"h1.gh sediment loads being dispersed.
If any temporary fuel or oil stores are installed on-site to supply construction vehicles, these will be placed on an impervious surface and bunded to prevent spills polluting the ground or harbour waters. Facilities for clean-up (absorbant materials vacuum pumps) will be available as necessary.
5.1.5 Existing Sea ~all Drainage
There are a number of sea wall discharge points from surface water drains that drain into the area of proposed reclamation. The presence of foul discharges in such drainage systems cannot be ruled out which together with requirements to maintain access to the pcwa of the existing sea wall pose difficult conditions for the maintenance of good environmental quality during those phases of reclamation which restrict water movement. Whilst vessels are uti1ising the sea front access their movements will help to some extent in providing water exchange. Once reclamation has proceeded suffiCiently it will be possible to construct temporary pipe arches to carry polluted flows away from the reclamation area. These temporary structures will be replaced with reinforced concrete drainage to take these polluted flows away from the reclamation as the progress of the current project allows. The construction of the temporary arches and pipe connections should be given a high priority in the reclamation schedule and should be built as soon as is possible. The timing is such that Phase I does introduce the potential problem of confined waters but given the project parameters it is not possible to circumvent this situation.
; ':
I ,
U
J
J
, 1 I
...J
J
J ( 1
J ( , " I
I
.J
r 1
J"
:l\ I • I ';
I J:
rji ~ ; I : ! I l J.
~1 l) j
ill , I ~ J' I
I
n~ ! I I:
l) !
f""1j I I
l "
rl) ~ J -
If
[1 :'S
~l l. j
1.1 rj : I LJ rt3
nt l J
rt!I
rl
I'
It will be necessary to make all reasonable efforts to prevent additional contaminants entering these waters and it may be necessary to ~raw up a code of 2racttse for~ of the confined pcwa to be followed durin r w en Phase I reclamation is being constructed.
5.1.6 Vater Flow Patterns
The new sea wall position will effect the existing water flow pattern of the area. However, the extent of the effect is limited because the reclamation is also of limited extent. The existing finger pier of Shek Tong Tsiu is a feature which will significantly affect existing flow patterns acting as a restriction to flow following the length of Victoria Harbour sea wall. This finger pier remains as a feature of the proposed reclamation and the restriction to flow will also remain.
It has not been possible to utilise the WAHMO prediction model or physical model to investigate the effects of the Belcher' s Bay reclamation proposals in isolation to other reclamation proj ects proposed for the a.rea. . . -.~-... ~-." .'
However, predictions that have been run indicate that the Belcher's Bay proposal should not affect the flow patterns adversely. The much more extensive Green Island reclamation, although possibly resulting in low flow rates and exchange within the confined port areas does not
.adversely affect the main flow regime within the harbour waters. This will be the case with the Belcher's Bay reclamation which is relatively small in extent and does not significantly a1 ter the existing situation.
5.2 I r Vater Quality Monitoring
To ensure that water quality of the area is not detrimentally affected ~ the reclamation work, it will be necessary to undertake a programme of water quality monitoring. In the event of deterioration in water quality being detected by the monitoring programme a plan comprising of all necessary steps to enSllte tbat it is not the reclamation activities that are contributing to the deterioration will put into action.
5.2.1 General Requirement
The contractor shall carry out the works in such a manner as to minimise adverse impacts on the environment during execution of the works. In particular he shall arrange his method of working to minimise the effects on the water quality within the site, adjacent to the site, on the transport routes and at the loading, dredging and dumping areas.
.--\
if 1 ::i
.f-
-~
-:::
-i;
--~
:;s
-} '"
-:a -
; 1 ,-'"
+- I :a -.... wc
-;'>1
- '1 :tI -
--.. --~ -
-"j "SI. --:os
J -,
~J ~j CS
~ I ~
~.J
"J
The overall objective is to m~n~mlse adverse impacts resulting from the reclamation operations on 'the water quality within Hong Kong waters. To achieve this obj ective the methods of working to be employed should be designed to:
minimise disturbance to the seabed while dredging;
minimise leakage of dredged material during lifting;
minimise loss of material during transport of fill or dredged material;
prevent discharge of fill or dredged material except at approved locations;
prevent the unacceptable reduction, due to the works, of the dissolved oxygen content of the water adjacent to the works; and
prevent excess suspended solids from being generated.
Before marine works corrunt;nce, all marine plant to be utilised on site will be inspected to ensure that it: conforms with the following guidelines that are designed to avoid or minimise pollution.
i)
ii)
All construction plant shall be designed' and maintained to minimise the risk of silt and other contaminants being released into the water column or deposited in other than designated locations.
Pollution avoidance measures to be included (but not limited to)
a) mechanical grabs shall be designed and maintained to avoid spillage and shall seal tightly while being lifted (closed grabs shall be used);
b) cutterheads of suction dredgers if used, shall be suitable for the material being excavated and shall minimise overbreak and sedimentation around the cutter;
c) where trailing suction hopper dredgers are in use for dredging of marine mud, overflow from the dredger, and the operation of lean mixture overboard systems, shall not be permitted:
d) all vessels shall be sized such that adequate clearance is maintained between vessels and the seabed at all states of the tide to ensure that undue turbidity is not generated by turbulence from vessel movement or propellor wash;
e) all pipe leakages are to be repaired promptly and plant is not to be operated with leaking pipes;
I • I
I ~
u r 1 I _
LJ
( , , ;
l.J
u
u i 1
U
r 1 I , W
r 1
l.J ( ,
j r :
J f 1 ! 1
r 1
U r 1 I ,
U
,........ I
i I I , ; I l }
......, I
. :!
1
nl ' I
i'l l ,
r,j I 1
i 1
~. ~ .
•
rl l ,
-:I
: n,l ! !
~ ~.!
r;J ' I I, J
... ,.
i"'il I 'I
iii)
iv)
v)
vi)
Page -18-
f) the works shall cause no visible foam, oil, grease. scum, litter or other objectionable matter to be present on the water within the site (or dumping grounds);
g) all barges and hopper dredgers shall be fitted with tight fitting seals to their bottom openings to prevent leakage of material;
h) excess material shall be cleaned from the decks and exposed fittings of barges and hopper dredgers before the vessel is moved; and
i) loading of barges and hoppers shall be controlled to prevent splashing of dredged material to the surrounding water and barges or hoppers shall not be filled to a level which will cause overflowing of material or polluted water during loading or transportation.
The engineer may monitor any or all vessels transporting material to ensure that no dumping takes place' outside the approved location. (Dumping outside approved locations is an offence under the Dumping at Sea Act 1974 (Overseas Territories) Order 1975}. The Contractor shall provide all reasonable assistance to the Engineer for this purpose.
The Contractor shall ensure that all marine mud and unsuitable material is disposed of at the approved location. He will be required to ensure accurate positioning of vessels before discharge and will be required to submit and agree proposals with the Engineer for accurate positional control at disposal sites before commencing dredging.
The Engineer may moni tor, any or all vessels transporting material to ensure that loss of material does not take place. during transportation. The Contractor is to provide all reasonable assistance to the Engineer for this purpose.
A monitoring programme will be implemented that will be designed to identify any changes in water quali ty that may arise as a result of the reclamation operations.
5.2.2 Vater Oualitv Monitoring Parameters and Equipment
The most important monitoring parameter is turbidity. This parameter gives a direct indication of the degree of disturbance and hence the potential for contaminant release. Turbidity shall be measured onsite at the locations specified in Figure 8 in accordance with the schedule given in Table 5 or otherwise agreed.
.. -I
'!" I
"
..;
I,
,~
~
:e
.. '1 'f
,~
~ I - I
~,l
-• ~ ] .. "
'IS
~ I
Dissolved oxygen will also be monitored together with temperature and dissolved oxygen saturation in situ according to the schedule in Table 5. Suspended solids shall be determined by laboratory analysis of water samples collected in situ according to the schedule .
a) Turbidity Measurement Instrument
Turbidity within the water shall be measured in situ by the nephelometric method. The instrument shall be a portable J
wea ther proof turbidity-measuring instrument comp lete wi th cable, sensor and comprehensive operation manuals. The equipment shall be operable from a DC power source supplied by the Contractor I it shall have a photoelectric sensor capable of me·asuring turbidity between 0-100 NW and be complete wit:h at least 2sm of cable. (Partech Turbidime~er Model 7000 3RP Mark 2 or similar approved instrument).
b) Dissolved Oxygen and Temperature Measurement Equipment
c)
Dissolved oxygen and temperature of the water shall be measured in 's i tu. The, iirs tt:umertt: '~shall' be a 'portable I wea therproof dissolved oxygen measuring' instrument complete with cable I
sensor, comprehensive operation manuals and be operable from a DC power source supplied by the Contractor. It shall be capable of measuring:
i) a dissolved oxygen level in the range of 0-20 rng/l and 0-200% saturation; and
ii) a temperature of 0-4SoC.
It shall have a membrane electrode with automatic temperature cornpension, complete with a cable of not less than 2Sm in length. Sufficient stocks of spare electrodes and cables shall be maintained for replacement as necessary. (YSI' model 58 meter YSI 5739 probe, YSI 579SA submersible stirrer with reel and cable or similar approved instrument).
Suspended Solids
Water samples shall be collected for the determination of suspended solids. A 12 volt DC powered peristal tic pump equipped with Tygon tubing of at least 2sm shall be used to collect samples. Samples should be collected into high density polyethylene bottles I packed in ice (cooled to 5°C without being frozen), and delivered to the laboratory for analysis as soon as possible after 'collection. Upon arrival to the laboratory, samples should be well mixed and then immediately fil tered (with a vacuum of less than 381nun of Hg) through preweighed Millipore matched pair filters (for <Smg/l) or Yhatman GF/C filters (for >smg/l) .
u I
.J
: 1 : I : !
W
i ' i
i L..
r 1 J , 1 ! ' I i I , :.....0
, 1
J
I '--'
: 1
U r "
I
.J
'r,t I I, ~ • j '"
P""'\1 , I1
l i I , )
. f !.. I i I l, ;
:-
r:j L ; :5
n] l ;
-!ill
rl rJ ::a
'. rJ rJ JIOII.'
d)
e)
t '
Page ~20·
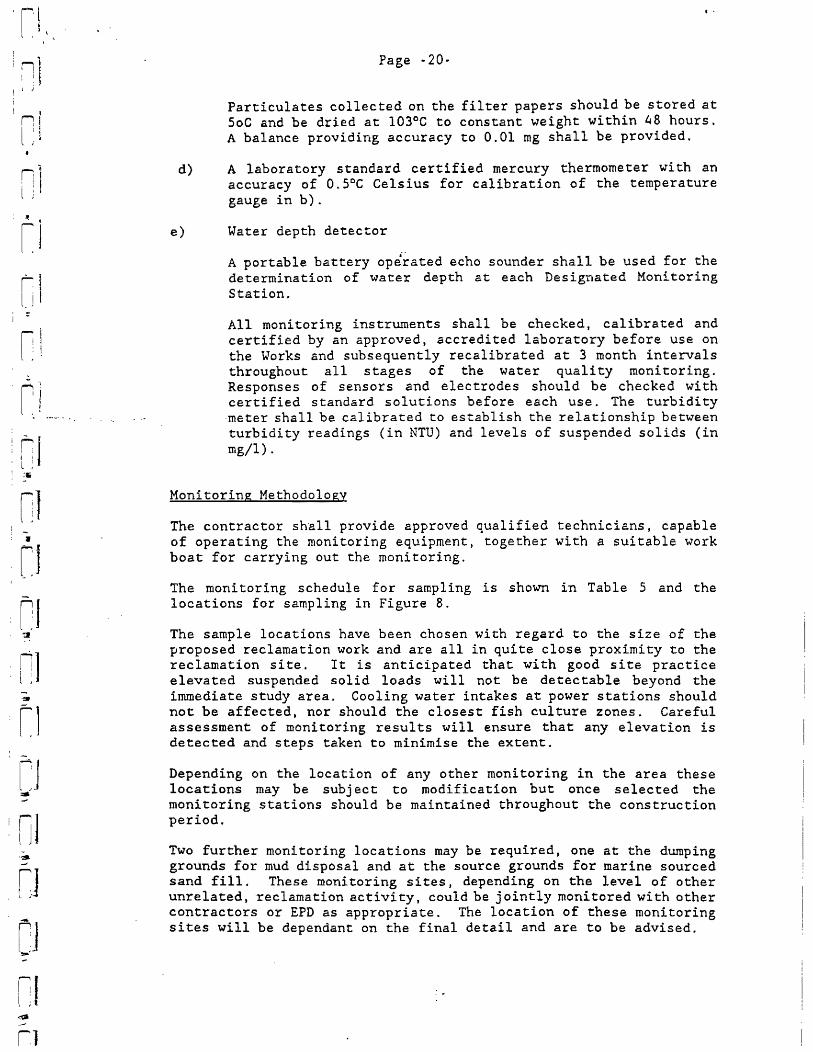
Particulates collected on the filter papers should be stored at SoC and be dried at 103°C to constant weight within 48 hours. A balance providing accuracy to 0.01 mg shall be provided.
A laboratory standard certified mercury thermometer with an accuracy of O.soC Celsius for calibration of the temperature gauge in b).
Water depth detector
A portable battery op~rated echo sounder shall be used for the determination of water depth at each Designated Monitoring Station.
All monitoring instruments shall be checked, calibrated and certified by an approved, accredited laboratory before use on the Works and subsequently recalibrated at 3 month intervals throughout all stages of the water quality monitoring. Responses of sensors and electrodes should be checked with certified standard solutions before each use. The turbidity 'meter shall be calibrated to establish the relationship between turbidity readings (in NTU) and levels of suspended solids (in mg/l) .
Monitoring Methodology
The contractor shall provide approved qualified technicians, capable of operating the monitoring equipment, together with a suitable work boat for carrying out the monitoring.
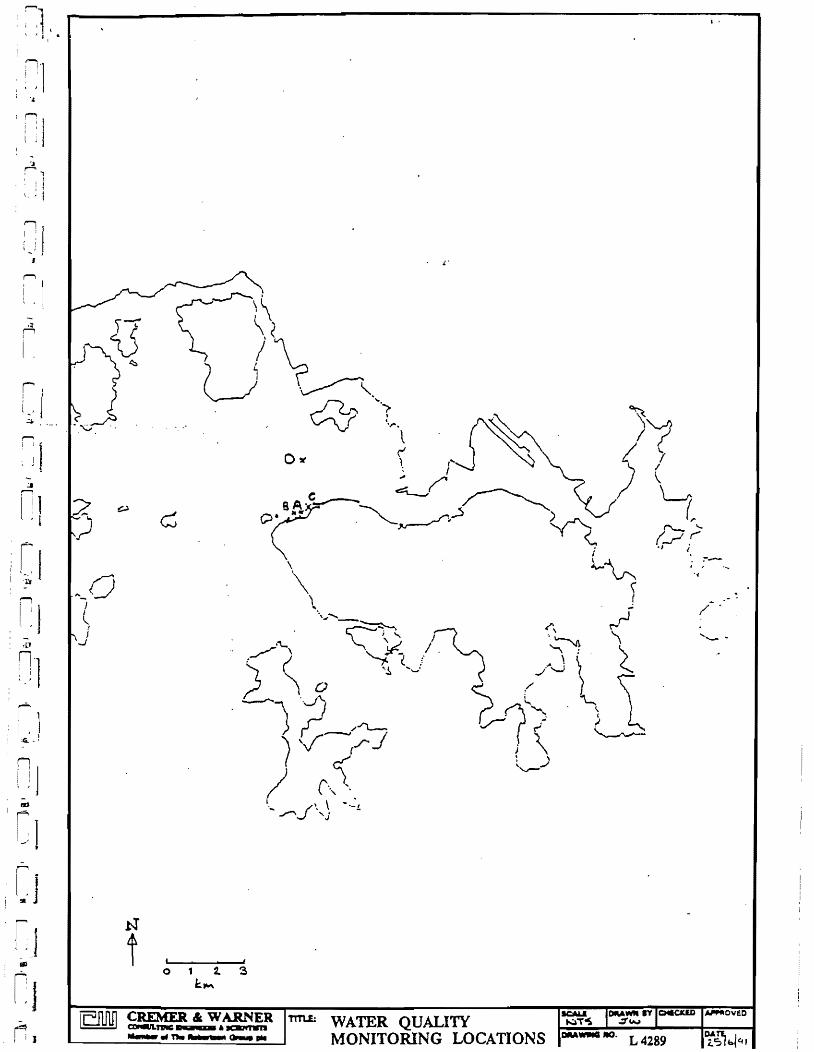
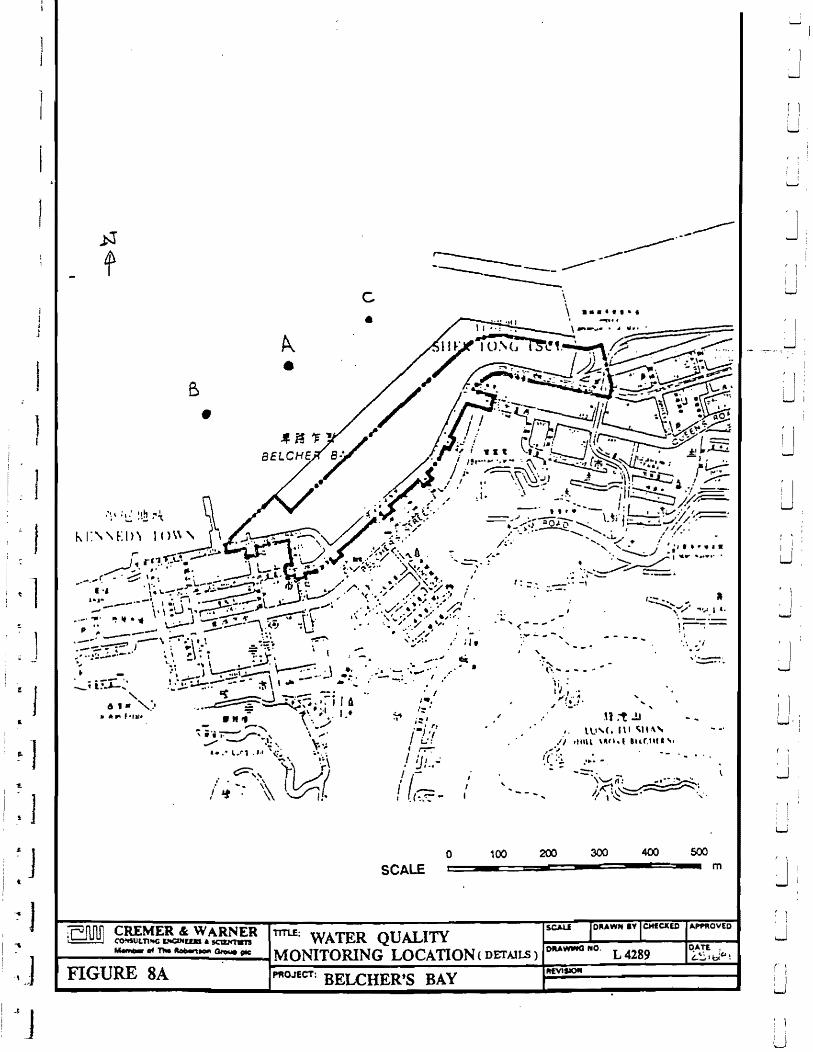
The monitoring schedule for sampling is shown in Table 5 and the locations for sampling in Figure B.
The sample locations have been chosen with regard to the size of the proposed reclamation work and are all in quite close proximity to the reclamation site. It is anticipated that with good site practice elevated suspended solid loads will not be detecta.ble beyond the immediate study area. Cooling water intakes at power stations should not be affected. nor should the closest fish culture zones. Careful assessment of monitoring results will ensure that any elevation is detected and steps taken to minimise the extent.
Depending on the location of any other monitoring in the area these locations may be subj ect to modification but once selected the monitoring stations should be maintained throughout the construction period.
Two further monitoring locations may be required, one at the dumping grounds for mud disposal and at the source grounds for marine sourced sand fill. These monitoring sites, depending on the level of other unrelated, reclamation activity, could be jointly monitored with other contractors or EPD as appropriate. The location of these monitoring sites will be dependant on the final detail and are to be advised.
i I
- ~
. i I J
~ I
A)
.... -"
B)
C)
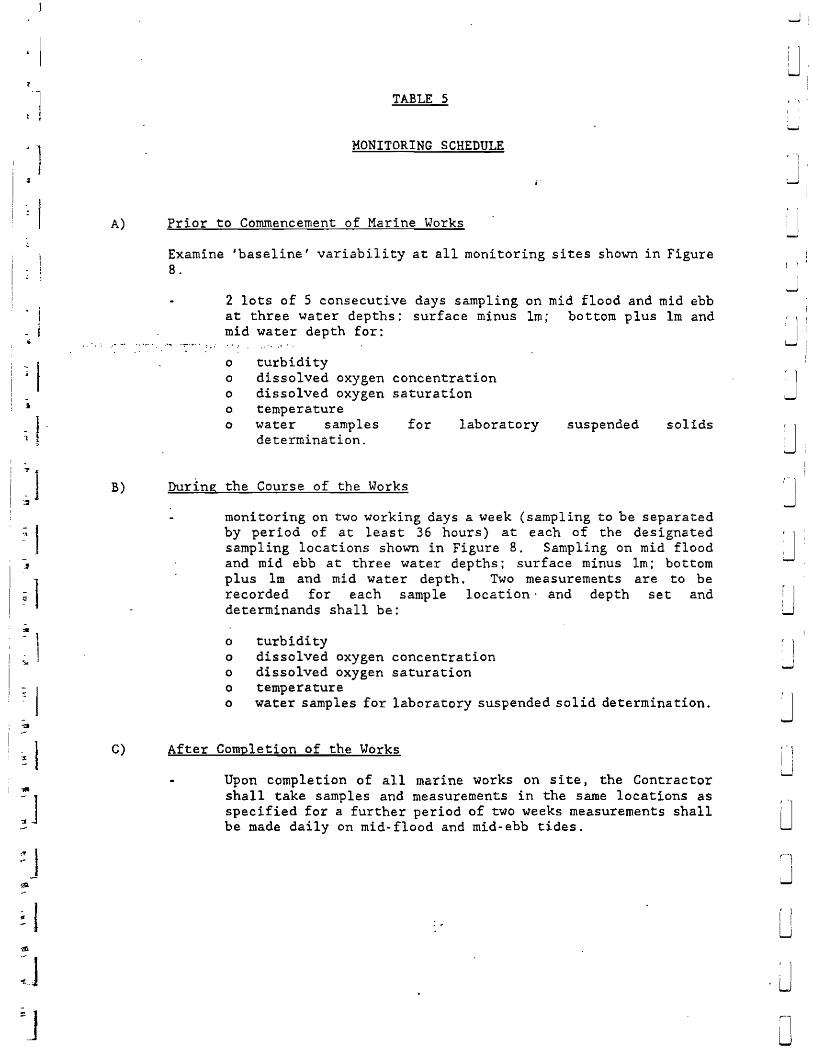
TABLE 5
MONITORING SCHEDULE
i'
Prior to Commencement of Marine ~orks
Examine 'baseline' variability at all monitoring sites shown in Figure 8.
2 lots of 5 consecutive days sampling on mid flood and mid ebb at three water depths: surface minus lm; bottom plus lm and mid water depth for:
o o o o o
turbidity dissolved oxygen concentration dissolved oxygen saturation temperature water samples determination.
for laboratory
During the Course of the Works
suspended solids
monitoring on two working days a week (sampling to be separated by period of at least 36 hours) at each of the deSignated sampling locations shown in Figure 8. Sampling on mid flood and mid ebb at three water depths; surface minus lm; bottom plus Im and mid water depth. Two measurements are to be recorded for each sample location- and depth set and determinands shall be:
o turbidity o dissolved oxygen concentration o dissolved oxygen saturation o temperature o water samples for laboratory suspended solid determination.
After Completion of the Works
Upon completion of all marine works on site, the Contractor shall take samples and measurements in the same locations as specified for a further period of two weeks measurements shall be made daily on mid-flood and mid-ebb tides.
i 1 w
J
~ 1
J
J J
J ,-, I ~ LJ
u
, I I I I ! I ' U
~l u
~'I ' ,
: ....
: :: I I I!
l;j -'')
:--', , " i I
" ; I
-.:,t ,...., I
l ,
, i 1 , J f
I [I I 'u , -
r i : 1
I .; i I cG. • '
n.] I ! , ,
......
I r
: l , J" ! ..
J
f ,
o 1 2. 2. &:.~
I'
/"
ICALI tDMWN aY lCMICJCI.D JoIIIP'ROVED ii=\Jnnn CREMER" WARNER JTrTU.;, WATER QUALITY to.:l'T"S .::I~ ~ =~:=!=-: MONITORING LOCATIONS OM_JIG. L4289 't~bI41
i J
I •
I
"\' 1 ~ ,
.J
~ 1 So
~ ] -
~
1 .. J
t
.~
J "' .~ ]
'" FIGURE SA
.C J
-~ ~ ----~.-------------------~ ------c
•
•
, -- ...
o 100
SCALE
mu: WATER QUALITY MONITORING LOCATION ( DETAILS)
PROJECT: BELCHER'S BAY
'. \ •••• tt ... t
- .. /1 ltu\!. \ IH" I 11Lr.1U.', ,,-.,.
~(:::, ..... -..
... - --::-:.. -. \~f1: _::_.-~ .".\.~:
~I ,'~~' .......
300
SCALE
L4289
m
APPROY£D
qATt , t..~lbI" !
J r 1 ; I w
f ,
, 1
J , 1
I
~J
, I
j ~- --:-- ~- "- '
~ 1 ' . I W
i I ....J
u I •
i ! LJ
, \
1 , I ...J
j , \
I i
U,'
, \
, I
~
[ I \....J
J ~ 1
(
J
i 1 ,J
n-,-! I , I ; i
~; l ,!
,
n:1 'j
[:1 .1.
~l \ ,
,..... ! ; 1 ; , , J.
rj n·
1 l ,:
n:) <; J J
r : 'j ~ J
~J t )
I'
Page .. 24-
5.2.3 Reporting of Monitoring Data and Actions
5.3
The results of all Water Quality Monitoring shall be provided by the Contractor to the Engineer, in an agreed format, no later than 24 hours after the sampling, except for the results for the suspended solids which shall be reported no later than 48 hours after sampling.
A monthly summary report including any measures taken to minimise the effect on water quality shall also be pr9vided by the Contractor. This monthly' summary report should be forwarded to the EPD for infQUDatio.J) and dissemination to other interested parties. In a similar way monitoring results from other reclamation projects should be made available to the Engineer.
Should the monitoring results of turbidity, DO or DOS at any monitoring station indicate that, in the opinion of the Engineer, a significant deterioration in water quality, monitoring shall be repeated daily at each monitoring station until such time as considered appropriate by the Engineer. In the meantime, the Contractor shall impl~men~ improvem~n~s._ ~.(> __ his_ .. , working ,I1!ethods in order to reduce water quality impacts.: '-... , . .
Should the situation persist and, in the opinion of the Engineer, the Contractor has not take appropriate and reasonable means to improve the situation, the Engineer may ins'truct the Contractor to take immediate and effective measures to curtail excessive sediment release and dispersal. No claim for extension of time and/or any additional costs incurred by the Contractor by reason of such measures imposed by the Engineer shall be entertained. Such measures may be relaxed when, in the opinion of the Engineer, the water quality within the Site and around the monitoring stations ~as improved.
Air Quality
Reclamation and construction activities have been identified in Hong Kong as maj or sources of fugitive dust. Dust emiss ions can be generated by two basic physical phenomena - the entrainment of dust particles by the action of turbulent air currents and the pulverisation and abrasion of surface materials by the application of mechanical force.
In order to estimate the impact of fugitive dust, emission factors, developed in the United States, can be used to predict the quantities of dust that might be generated by a variety of activi ties. In conjunction with the size characteristics of the dust and meteorological data it is possible to predict the dispersion of dust and its potential atmospheric concentration and deposition rate. This will give an indication of the need for and extent of dust control measures during the work programme.
'If I .,
11
-, I
.l" I ~
~
::
ot
,. I
~ i
-:cif
~ .,'
3J 3J ,
3 I ~
oil ) ,~
~J
5.3.1 Reclamation
t,
The reclamation material will,. for the most part, be marine sand, and as such, will not produce a potential dust source. Above 2.5 mPD, CDG will be used. Once the surface is able to dry out and is formed by earth moving equipment however, this new land surface will become a dust source.
It is assumed that once Phase I is in place ,(July 1992) I the main potential for fugitive dust commences. There will however be some dust generated when the construction site office/storage compounds are established.
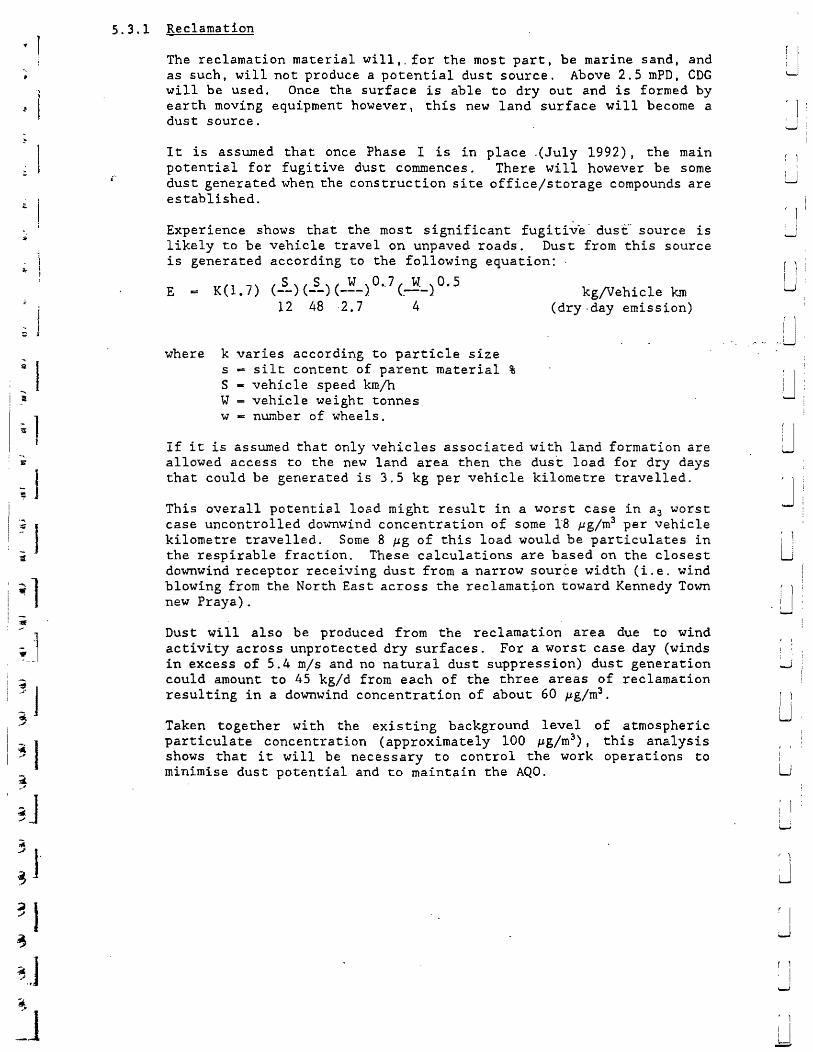
Experience shows that the most significant fugiti~""e' dust"' source is likely to be vehicle travel on unpaved roads. Dust from this source is generated according to the following equation:
E K ( 1 • 7) ( y_ ) (J_) (_~_ ). 0 •. 7 (~_) O. 5 12 48 ,2.7 4
where k varies according to particle size s - silt content of parent material % S - vehicle speed km/h W = vehicle weight tonnes w - number of wheels.
kg/Vehicle km (dry day emission)
If it is assumed that only vehicles associated with land formation are allowed access to the new land area then the dust load for dry days that could be generated is 3.5 kg per vehicle kilometre travelled.
This overall potential load might result in a wor·st case in a3 worst case uncontrolled downwind concentration of some 18 J.lg/m3 per vehicle kilometre travelled. Some 8 J.lg of this load would be particulates in the respirable fraction. These calculations are based on the closest downwind receptor receiving dust from a narrow source width (i.e. wind blowing from the North East across the reclamation toward Kennedy Town new Praya).
Dust will also be produced from the reclamation area due to wind activity across unprotected dry surfaces. For a worst case day (winds in excess of 5.4 m/s and no natural dust suppression) dust generation could amount to 45 kgjd from each of the three areas of reclamation resulting in a downwind concentration of about 60 pgjm3 •
Taken together with the existing background level of atmospheric particulate concentration (approximately 100 pg/m3) I this analysis shows that it will be necessary to control the work operations to minimise dust potential and to maintain the AQO.
u , 1 ' , r
'-'
f ) 1
U
, 1 ; I ~
r 1 i 1 u
r 1
U
, 1
r I I
W
, 1
LJ -
i IJ Ji
ut
~1
, r: j I, ; i
. n1 nJ :s
~!I t ;
rl , 1.1
~ ,
l.j
QJ
rl o
1,1
. ,
8525295056'" + 852 591 0556;# 6
Page .. 26 ..
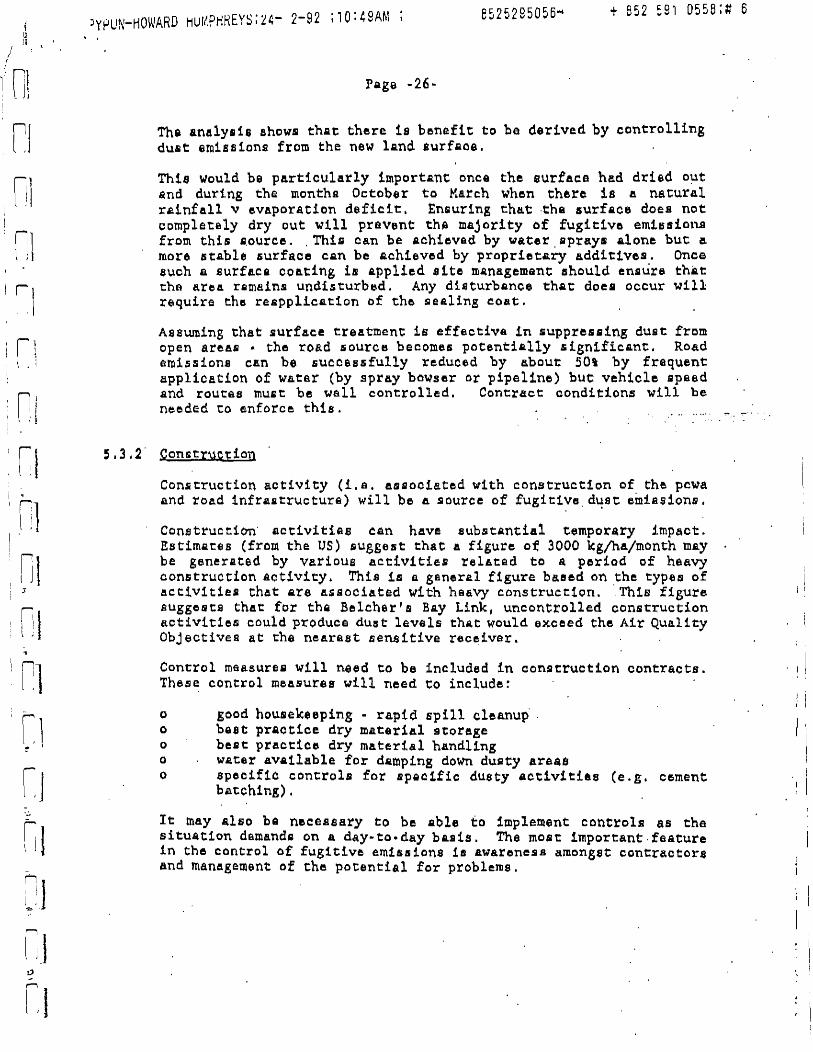
Tha analysis shows that there is benefit to be derived by controlling dust emissions from the new lan~ a~rfaoe.
This would be particularly importAnt oncQ the surface had dried o~t Qnd during the mcntha October to March when th~re is a natural rainfall v eVAporation deficit. En,ur1ng tha.t ·the surface does not completely dry out will prevent th~ majority of fugit1vo emissiolU from this Q.ource. . This can be aehievQd by water. sprays alone but a more 5table 5urface can be Qch1eved by proprietary additives. Once such a BurfACQ cOAting is applied site m~nagemQnt should ensure that the area rQmains undisturb~d. Any di~turbance thQt does occur will require th8 reapplication of th~ ~ealing ~oat.
Assuming that surface treatment is effectivQ in supp.ressing dust from open ar~a5 • the road source becomes potentially significant. Road emission.e can be 5ucc&s5fully reduce.d by about SOt by frequent application of watsr (by spray bo~ser or pipeline) bue vehicle speed and routes rnu£t be wall controlled. Contract conditions will be needed to enforce this.
5.3,2· Con&tIuction
Construction activity (i.a. associated with construction of the pcwa and road infrastructure) will be 4 source of fugitive dust emias1ons . . .
Construct1~· activities ean have Bubstantial temporary impact. Estimates (from the US) suggest that a figure ot 3000 kg/ha/month may be gsnerated by various actiVitieS! relfot9d to It period of heavy construction activity. This is a gAneral figure baaed on the types of actiVities that Qre Associated w1 th hBavy construction ... This figure 8Uggemts that for thQ Belch&r's Bay Link, uncontrolled construction activities could produce dust levels thAt would exceed the Air Quality Objectives at the neArest se~1tive receiver.
Control maasureQ will need to be included in construction contracts. These control measures will need to include!
o good housekeeping - rapid spill cleanup . o bQ8t practice dry materiAl storage o best practice dry material handling o water Ava11able for damping down dusty areas o specific controls for sPQQ1fic dusty activities (e.g. c~ment
batch1ng) .
It tnay ~lso ba nec:e.ssary to be able to 1mpletnent controls as the situ4t1on demands on A day-to-day basis. The mos~ important.feature in the control of fugitive em1ssions ls awareness amongst contractors And management of the potential for problems.
) i • I I I
I " I
:-
-:.
-\ ,
.;.
-
j
- i ...
~ I ~ I ..
-.,
~l -
~l .:t. .J
. "..
.~J
~ 1 .-.. .~j iJ
6.0 OPERATIONAL EFFECTS
6.1 Vater Quality
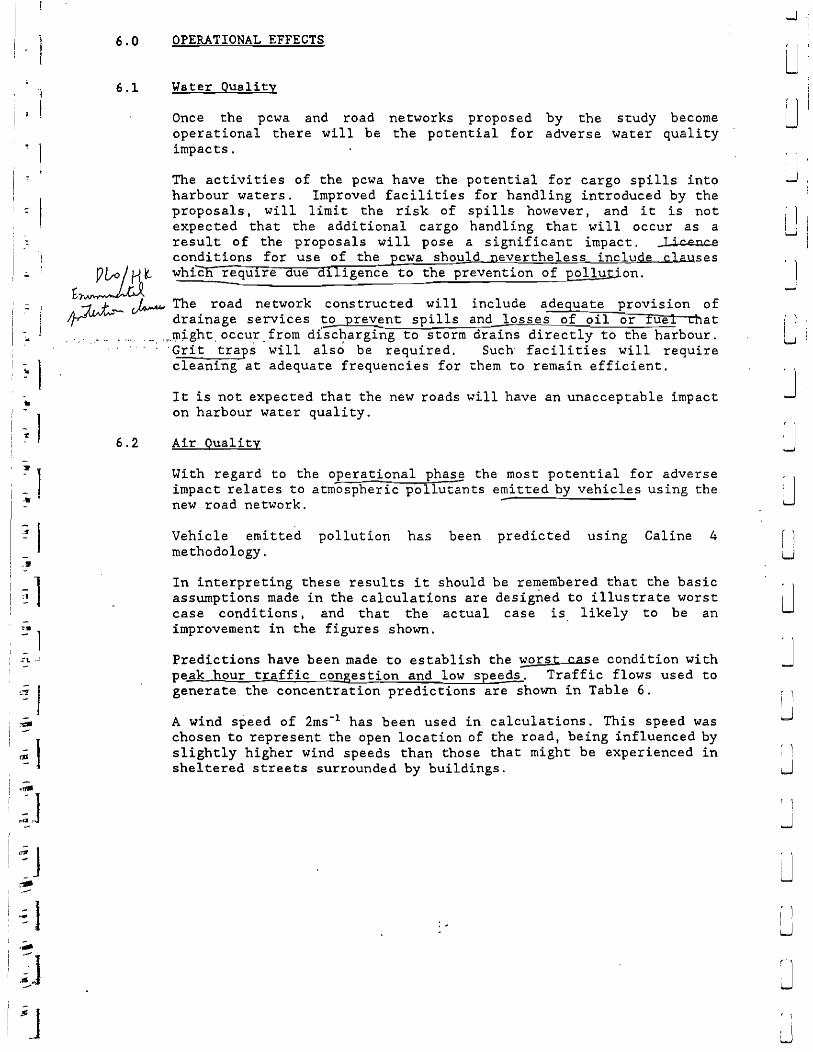
Once the pcwa and road networks proposed by the study become operational there will be the potential for adverse water quali ty impacts.
The activities of the pcwa have the potential for cargo spills into harbour waters. Improved facilities for handling introduced by the proposals I will limit the risk of spills ho\-1ever, and it is not expected that the addi tional cargo handling that will occur as a result of the proposals will pose a significant impact. conditions for use of the cwa should evertheless inclu e whic requlre the prevention of pollution .
... ses
!::J1/ ~ J/~:f~ ~ The road network const.ructed will include adeguate provision of /~-~~- drainage services to prevent spills and losses of oil or fuel that
.,.. .. m~ght. occu:r. from discl:arging to storm drains directly to the harbour. . Gri t traps will also be require d. Such fac i li ties will require cleaning at adequate frequencies for them to remain efficient.
It is not expected that the new roads will have an unacceptable impact on harbour water quality.
6.2 Air Quality
With regard to the operational phase the most potential for adverse impact relates to atmospheric pollutants emitted by vehicles using the new road network.
Vehicle emitted pollution has been predicted using Caline 4 methodology.
In interpreting these results it should be remembered that the basic assumptions made in the calculations are designed to illustrate worst case conditions, and that the actual case is. likely to be an improvement in the figures shown.
Predictions have been made to establish the worst case condition with peak hour t~ffic congestion and low speeds. Traffic flows used to generate the concentration predictions are shown in Table 6.
A wind speed of 2rns-1 has been used in calculations. This speed was chosen to represent the open location of the road, being influenced by slightly higher wind speeds than those that might be experienced in sheltered streets surrounded by buildings .
u u
" ) i '
U
J
r ) i )
L.J
J I .:
J
r \
i
~
J ! 1 U
, 1

I :t
",l _Ii
rl l '.
1.1 z
n-' l ,: .
-L
I:J a
r,
Cl I., -" J
Page -28-
TABLE 6
TRAFFIC FLOW'S
1996 Flows - am (pm) peak pcu's
614 1406 (682) ~~6) :_---::E;;-----___ ~-~S)
1312 (1438) ~ 487
( S40) 81S
( 898)
2006 Flows
1810 (1106)
, '
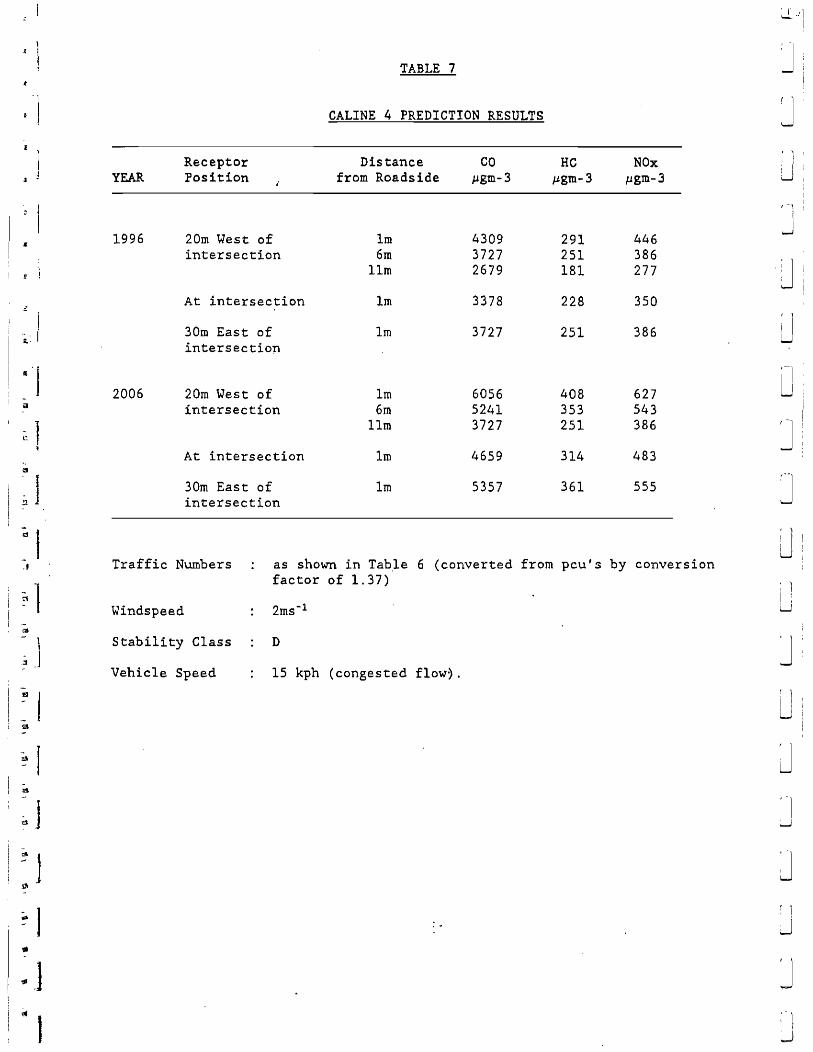
Table 7 gives the results of the ·predictions. Predictions were made for the receptors 1, 6 and Ilm from the carriageway at three locations: 20m west of the intersection, at the intersection and 30m east of the intersection adjacent to Queens Road East.
These locations and receptor points were chosen to give representative answers for the worst case situations. Values in the table refer to carbon monoxide, hydrocarbons and oxides of nitrogen. Lead emissions have not been predicted due to the uncertainties on the extent of the use of unleaded fuel by the prediction dates. Lead levels are not expected to represent problems however.
The predicted carbon monoxide levels are all well within the standards set by the air quality objectives and it is not anticipated that there should be any problems from the proposed road in this regard.
The air quality obj ectives give values for ,ni trogen dioxide. The oxides of ni trogen emitted by vehicles consist mainly of nitrogen monoxide. This oxidises in the atmosphere to the more toxic nitrogen dioxide. The oxidation rate is dependant on a variety of factors including NOx concentration, ambient temperature and sunshine. A conversion rate of 20% is the rate usually applied to roadside situations such as the one being modelled here.
i.-
•
-a
I ~ 1 I
-Cl
-.f
--::is
-El
-9
-:.,
-..
YEAR
1996
2006
Receptor Position
20m West of intersection
At intersection
30m East of intersection
20rn West of intersection
At intersection
30m East of intersection
TABLE 7
CALINE 4 PREDICTION RESULTS
Distance from Roadside
1m 6m
11m
lID
1rn
1m 6m
11m
lm
lm
CO JJgm-3
4309 3727 2679
3378
3727
6056 5241 3727
4659
5357
HC JJgm-3
291 251 181
228
251
408 353 251
314
361
NOx pgm-3
446 386 277
350
386
627 543 386
483
555
Traffic Numbers as shown in Table 6 (converted from pcu's by conversion factor of 1.37)
Windspeed
Stability Class D
Vehicle Speed 15 kph (congested flow~.
~··'I !
~ 1 : I i......J I
J
J J
: 1 i : u
J r 1 I !
U
J
J : i j
J
,i -,,)1
1
.1
lil ut
ri
l ,., : \
Cl rl
~l ' ,
-
~·l l.,! .
r-I ' , Il j
r, l J
,r.'j l " iI-
IJ l ;
~
Page -30 a
Thus - the worst case prediction for congested flows of 627 pg/m3
nitrogen oxides represents a concentration of 125 p.g/m3 nitrogen dioxide. This figure is a prediction relating to an averaging time of ten minutes and is thus well within the air quality objective for N02. When added to a representative figure for existing N02 concentrations of approximately 70 pg/m3 the air quality objective is still met.
When traffic speeds increase the emission rate of nitrogen oxides also increases. Predictions for a free flowing traffic situation at the design speeds of 50 kph for Belcher's Bay Link and 70 kph for Route 7 indicates that the concentrations of nitrogen dioxide that could be generated are within the air quality objectives.
At lower wind speeds the natural dispersive capacity of the atmosphere is reduced. At wind speeds of 1 m/s levels of nitrogen dioxide that when added to a background N02 level of about 70 pg/m2. approach the air quality objective are predicted for the year 2006 close to the road side (i.e. at lm from the roadside). At distances greater than 6m from the roadside, levels are diluted to acceptable levels.
This means that pedestrian,!;: ~ho'tild n61:" he ;:i.llowed" to gain close access to busy major highways. 'To prevent unacceptable exposure to pedestrians it is suggested that pedestrian footways are located away from the roadside, particularly at intersections. Alternative pedestrian access and routes should also be provided.
It should be pointed out, however I that cond~tions where AQO are exceeded will be rare as low wind speeds are not likely to be encountered during periods of peak traffic movements.
~ .. 1" 00.
:! J :so
~ I
7.0 CONCLUSIONS
Reclamation projects cannot proceed without some degree of environmental impact. Recognition of the potential problems at an early stage, however, allows mitigation measures to be incorporated into the design of the project and into the management of the project to reduce the level of adverse impact where possible. Y'here it is not possible to reduce the impact to acceptable standards steps to prevent exposure-to the unacceptable water or air quality can be implemented.
In the case of the Belcher' s Bay reclamation proj ect, any adversei
"
water quality affects will be detected by the recommended monitoring regime and the appropriate steps to prevent further adverse effects can be taken. Any adverse effects on water quality are not anticipated beyond the construction phase however.
Air quality objectives will continue to be met in the vicinity despite the expected increases in vehicle activity.
It is recommended, however, that pedestrian access to the roadside is limited ·tC?preven~·"adverse', impacts·oof levels of n1 trogen dioxide which, in ~xceptional conditions could increase to levels above those deemed satisfactory.
J J : 1 I . I
:.J
J
t 1
LJ
: I I ; , I
--'
I 1 ~ I ........
; 1 I I
~
, 1
L r 1 ! :..J
LJ
-J -
Al , I J4:
, I· : : I 11" ...
; ;"1\ I : I
, r " 1 :I
, t
[,1 '; I I
, ' , t
: ~.
:r· ~ 'I I • , I
~J .....
'''!.If
°1 i ~ , )
r-I :~
!J il] \ .
: -~
nJ I I ' l ,
!~
nJ i ' \ --'.
r-=l I : 1
, APPENDIX I
" . .,
, .
Refer.ence
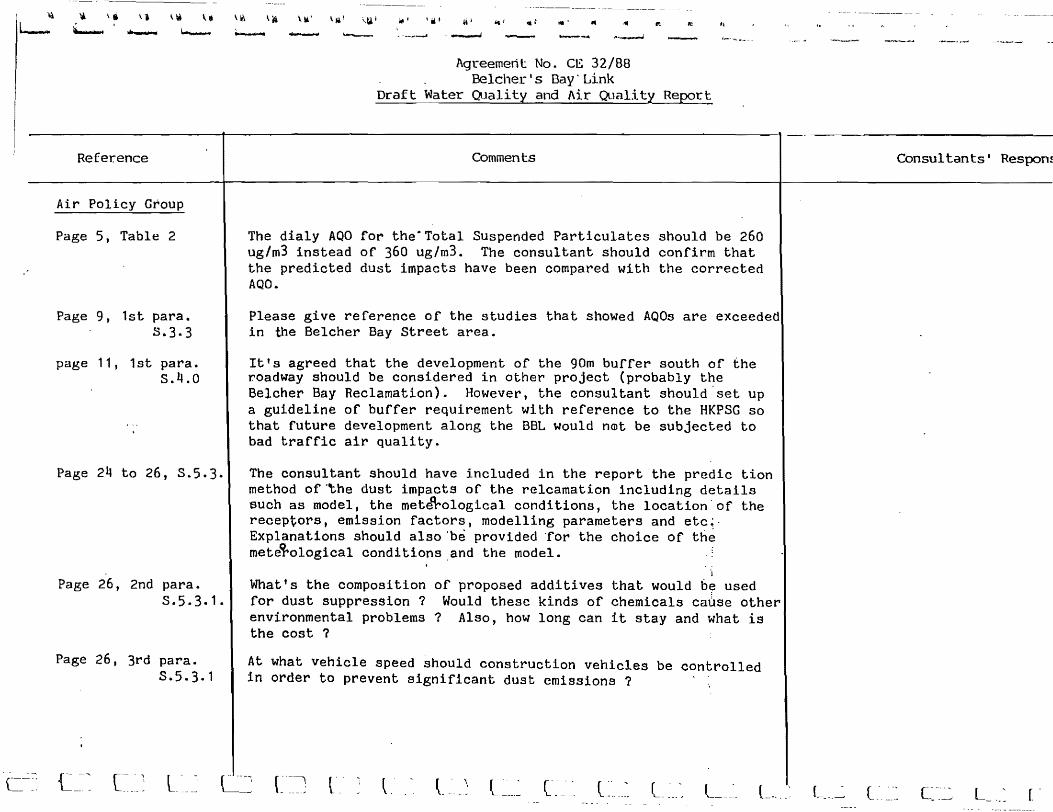
Air Policy Group
Page 5, Table 2
Page 9, 1st para. 3.3·3
page 11, 1st para. S.It.O
Page 2~ to 26, S.5.3.
Page 26, 2nd para. S.5.3.1.
Page 26, 3rd para. 8.5.3.1
L
- k1' I Ii' it I .... .. . -_N........ ----"" ... ----"
Agreement No. CE 32/88 l3elcher's Bay'Link
Draft Water Quality and Air Quality Report
Comments
'I
The dialy AQO for the· Total Suspended Particulates should be 260 ug/m3 instead of 360 ug/m3. The consultant should confirm that the predicted dust impacts have been compared with the corrected AQO.
Please give reference of the studies that showed AQOs are exceeded in the Belcher Bay street area.
It's agreed that the development of the 90m buffer south of the roadway should be considered in other project (probably the Belcher Bay Reclamation). However, the consultant should 'set up a guideline of buffer requirement with reference to the HKPSG so that future development along the BBL would n@t be subjected to bad traffic air quality.
The consultant should have included in the report the predic tion method of 'the dust impacts of the relcamation including details such as model. the met~ological conditions, the location'of the receptors, emission factors, modelling parameters and etc;, Explanations should also 'be provided "for the choice of the mete~ological conditions ,and the model. "
'I
What's the composition of proposed additives that would b~ used for dust suppression 7 Would these kinds of chemicals ca~se other environmental problems 7 Also, how long can it stay and what is the cost ?
At what vehicle speed shoUld construction vehicles be controlled in order to prevent significant dust emissions ?
Consultants' Respon!
r. -
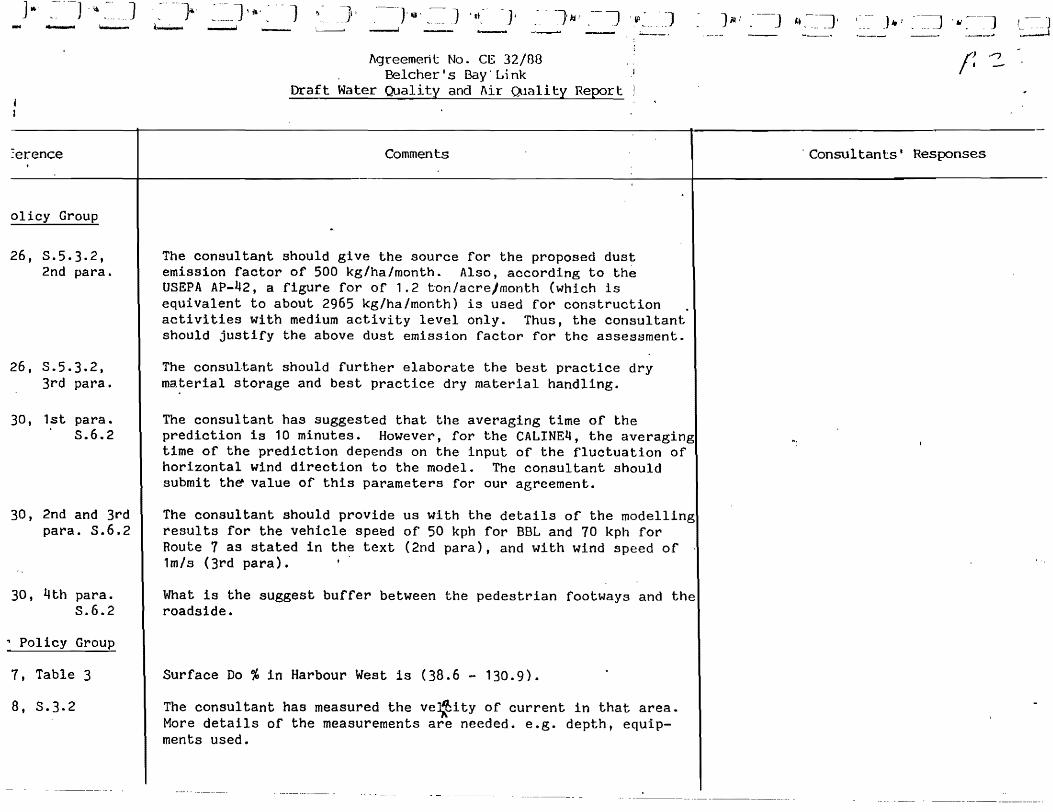
J It· J ~] -}, .~.-__ ~_l' fa' ~ - 1 - "'-- (.......;..... --'
~er.ence
olicy Group
26, S.5.3.2, 2nd para.
26, S.5.3.2, 3rd para.
30, 1st para .. S.6 .. 2
30, 2nd and 3rd para. S.6.2
30, 4th para. s .. 6.2
.. Policy Group
7, Table 3
8, 3.3.2
Agreement No. CE 32/80 Belcher's Bay'Link
Draft Water Quality and Air Quality Report' I
Comments
The consultant should give the source for the proposed dust emission factor of 500 kg/ha/month. Also, according to the
---_.
USEPA AP-42, a figure for of 1.2 ton/acre/month (which is equivalent to about 2965 kg/ha/month) is used for construction activities with medium activity level only. Thus, the consultant should justify the above dust emission factor for the assessment.
The consul·tant should further elaborate the best practice dry material storage and best practice dry material handling.
The consultant has suggested that the averaging time of the prediction is 10 minutes. However, for the CALINE4, the averaging time of the prediction depends on the input of the fluctuation of horizontal wind direction to the model. The consultant should submit th~ value of this parameters for our agreement.
The consultant should provide us with the details of the modelling results for the vehicle spe~d of 50 kph for BBL and 70 kph for Route 7 as stated in the text (2nd para), and with wind speed of . lm/s (3rd para).
What is the suggest buffer between the pedestrian footways and the roadside.
Surface Do % in Harbour West is (38.6 - 130.9).
The consultant has measured the ve~ity of current in that area. More details of the measurements are needed. e.g. depth. equipments used.
J.' :-~ ',. ~ __ ,JI
( ' ,"/ . -
Consultants' Responses
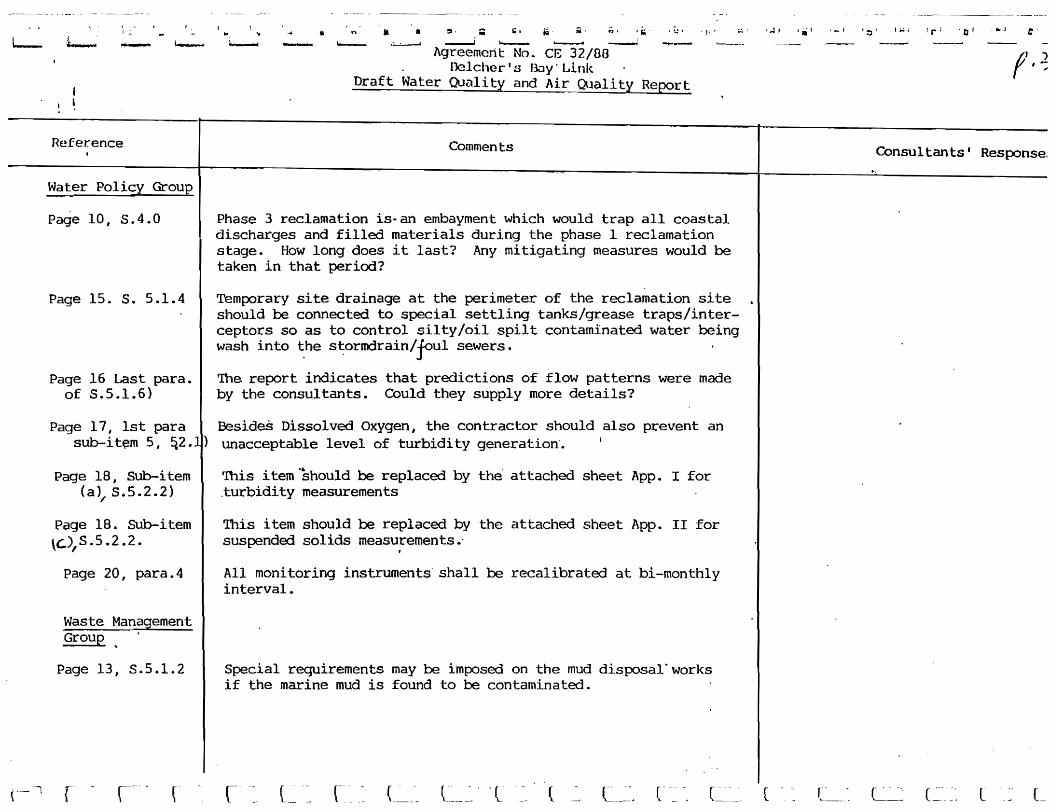
'-
Refer.ence
Water Policy Group
Page 10, 5.4.0
Page 15. s. 5.1.4
Page 16 Last para. of 5.5.1.6)
Page 17, 1st para sub-it~m 5, ~2.
Page 18, Sub-item (a); S.5.2.2)
Page 18. Sub-item \C),S.5.2.2.
Page 20, para.4
Waste Management Group , ,
Page 13, 5.5.1.2
ti 'n' .. • :::I. ;;;; 1;. jA. ;, ;:,. ,i;., .\,!,
�oo___ .~ ------i "'--- """"--" -----' Agreement No. CE 32/00
I1clcher's Buy' Link Draft Water Quality and Air Quality Report
Comments
Phase 3 reclamation is-an embayment which would trap all coastal discharges and filled materials during the phase 1 reclamation stage. How long does it last? Any mitigating measures would be taken in that period?
Temporary site drainage at the perimeter of-the reclamation site should be connected to special settling tanks/grease traps/interceptors so as to control silty/oil spilt contaminated water being wash into ~he s~ormdrain/joul sewers_
The report indicates that predictions of flow patterns were made by the consultants. Gould they supply more details?
Besides Dissolved Oxygen, the contractor should also prevent an unacceptable level of turbidity generation'.
This item 'should be replaced by the attached sheet App. I for ,turbidity measurements
This item should be replaced by the attached sheet App. 11 for suspended solids measurements.'
f
All monitoring instruments' shall be recalibrated at bi-monthly interval.
Special requirements may be imposed on the mud disposal" works if the marine mud is found to be contaminated.
( .. . r . \_._-- --~. . \. C"
.~ , '.' '- , ':';I , 1;';1 '0 I .. ,
Consul tan ts' Response;
( - - l

!1 , j 1 l ; I
l._:1 ~t I "
l : -~ r-: , \
l I
-1': , ! ',_' 1
~1 i~l , "
I~" : ~;f
ill '~1
-) 1 :}
-
, '
b) Turbidity Measurement Instrument
Turbidity measured on site could be done using either of the fol1o~ing ~o methods :
(i)
(ii)
111·situ ~easurement ~ith the probe totally submerged in the ~ater column; or
~ith 0.25 litre of ~ater sample collected at the specified depth and shaked ~ell ~hen a measurement is being taken on board.
The contractor is free to choose either method; Ho~ever, once he ha.s chosen one method, he must apply 1:he sam~ method. throughout both !aseline Monitoring 'iirid "Ro~tin~7 Moni toring' Periods. The same method viI1 also have to apply to all monitoring/control stations.
The instrument shall be a portable, ~ea therproof turbidi ty·measuri ng instrument complete with cable, sensor and comprehensive operation ttanuals. The equipment shall be operable from a DC po\:er source. it shall have a photoelectric-sensor capable of measuring turbidity be~een 0·100 ~~ and be complete vith cable vith at least 25 meters long. (R~CH Turbidimeter Model 16800 or similar approved).
" .
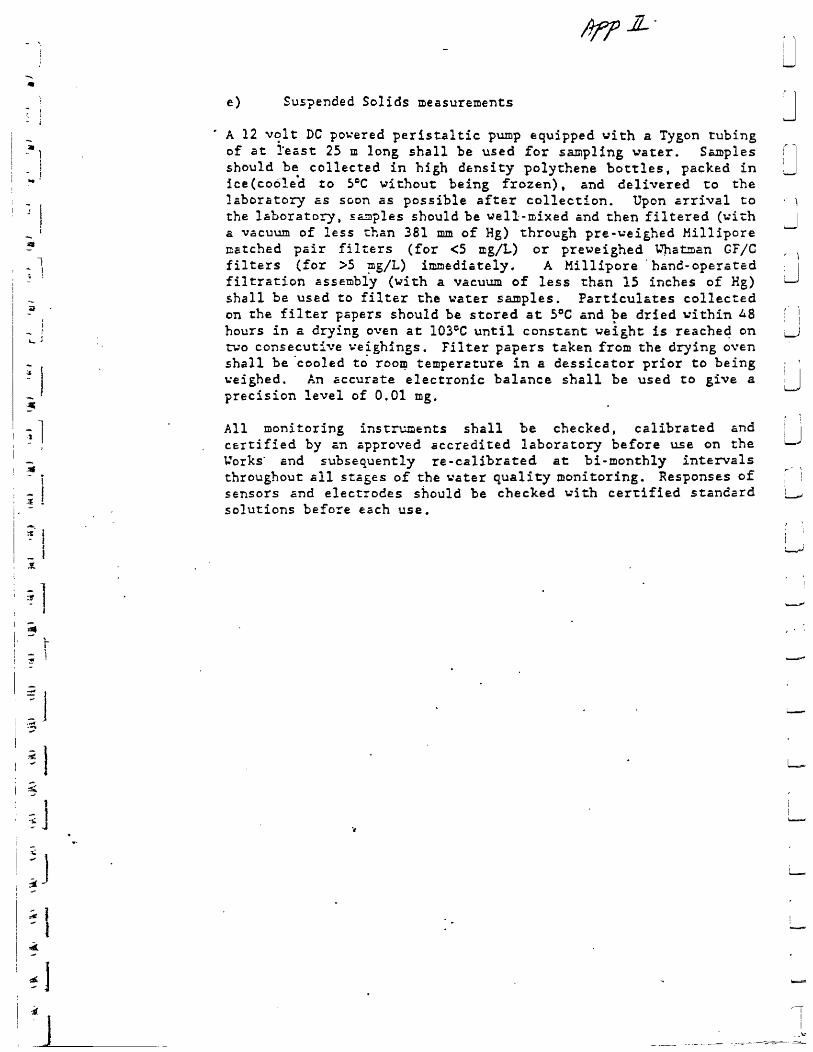
-•
I ~ i I -4
1 - I " ;
-a .
~ I i~
1
~ 1 , J
e) Suspended Solids measurements
, A 12 v~lt DC po~ered peristaltic pump equipped with a Tygon tubing of at l'eiis't 25 m long shall be used for sampling ""ater. S.smples should be collected in high density polythene bottles, packed in ice (co61ed to SCC wi thou't being frozen) t and delivered to the laboratory as soon as possible after col1eetion. Upon arrival to the laboratory, samples should be well~mixed and then filtered (""i~h a vacuum of less than 381 mm of Hg) through pre-weighed Mi11ipore matched pair filters (for <5 mg/L) or preweighed \Jha'bDan GF le fil ters (for >5 :ng/L) im.rnedia tely .. A Mi llipore . hand- oper a ted filtration assembly (with a vacuum of less than 15 inches of Hg) shall be used to filter the water samples. Particulates collected on the filter Fcpers should be stored at 5cC and be dried ""ithin 48 hours in a drying oven at l03CC until constant weight is reache4 on ~o consecutive ~eighings. Filter papers taken from the drying oven shall be 'cooled to roo~ temperature in a dessicator prior to being ~eighed. An cccurate electronic balance shall be used to give a precision level of 0.01 mg.
All monitoring ins~r~ents shall be checked, calibrated cnd certified by en approved accredited laboratory before use on the \., ... orks· and subsequently re-calibrated at bi-mont.hly intervals throughout all stcges of the 'l.:'a ter quali ty moni toring. Responses of sensors and electrodes shOUld be checked ~ith cer~ified standard solutions before ecch use.
, ,
J
, '
_.100 _ ~'-:;-_"'_--=-___ -- ..:.:::::...t-
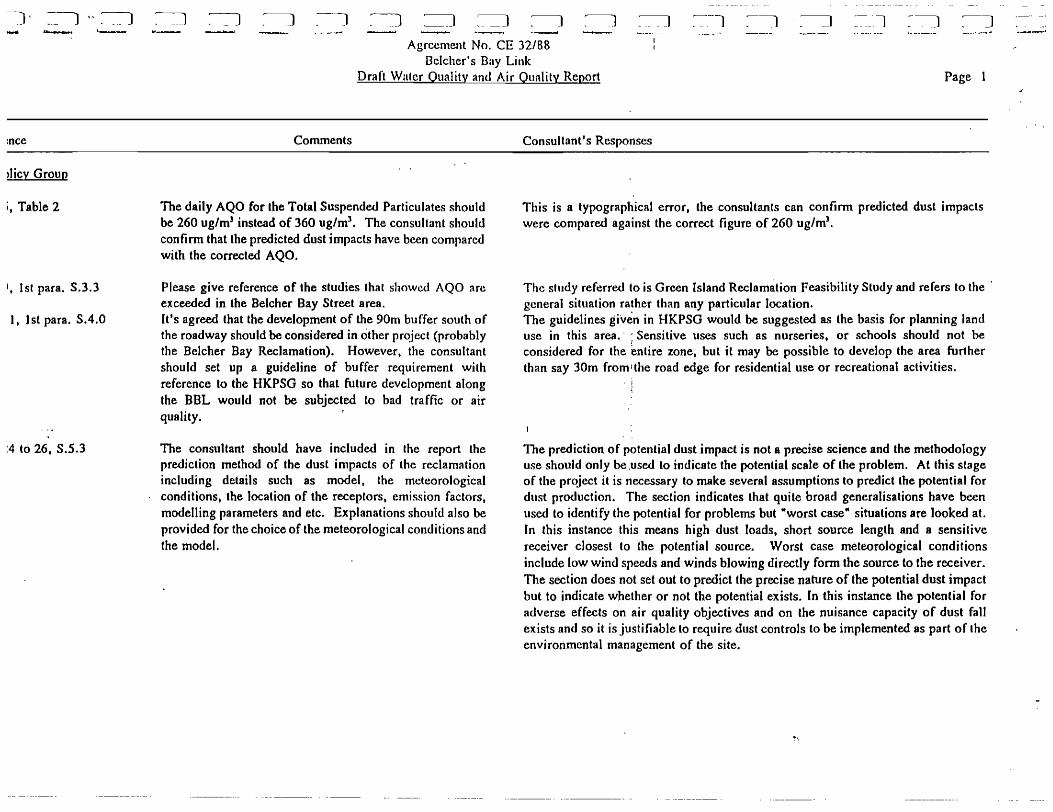
-
:nce
)licy Group
i, Table 2
I, 1st para. S.3.3
., 1st para. S.4.0
:4 to 26, S.5.3
-~
Agreement No. CE 32/88 Belcher's Day Link
Draft Waler Quality anti Air Quality Report Page 1
Comments
The daily AQO for the Total Suspended Particulates should be 260 ug/ml instead of 360 ug/ml. The consultant should confirm that the predicted dust impacts have been compared with the corrected AQO.
Please give reference of the studies that showed AQO are exceeded in the Belcher Bay Street area. It's agreed that the development of the 90m buffer south of the roadway should be considered in other prqject (probably the Belcher Bay Reclamation). However, the consultant should set up a guideline of buffer requirement with reference to the HKPSG so that future development along the BBL would not be subjected to bad traffic or air quality.
The consultant should have included in the report the prediction method of the dust impacts of lhe reclamation including details such as model, the meteorological conditions, the location of the receptors, emission factors. modelling parameters and etc. Explanations should also be provided for the choice of the meteorological conditions and the model.
Consultant's Responses
This is a typographical error, the consultants can continn predicted dust impacts were compared against the correct figure of 260 ug/ml.
The study referred to is Green Island Reclamation Feasibility Study and refers to the ' general situation rather than any particular location. The guidelines given in HKPSG would be suggested as the basis for planning land use in this area. - : Sensitive uses such as nurseries, or schools should not be considered for the ~ntire zone. but it may be possible to develop the area further than say 30m fro~ I the road edge for residential use or recreational activities.
The prediction of potential dust impact is not a precise science and the methodology use should only be ,used to indicate the potential scale of the problem. At this stage of the project it is necessary to make several assumptions to predict the potential for dust production. The section indicates that quite broad generalisations have been used to identify the potential for problems but ·worst case" situations are looked at. In this instance this means high dust loads, short source length and a sensitive receiver closest to the potential source. Worst case meteoroJogical conditions include low wind speeds and winds blowing directly form the source to the receiver. The section does not set out to predict the precise nature of the potential dust impact but to indicate whether or not the potential exists. In this instance the potential for adverse effects on air quality objectives and on the nuisance capacity of dust fall exists nnd so it is justifiable to require dust controls to be implemented as part of the environmental management of the site.
--------_._-- -.------
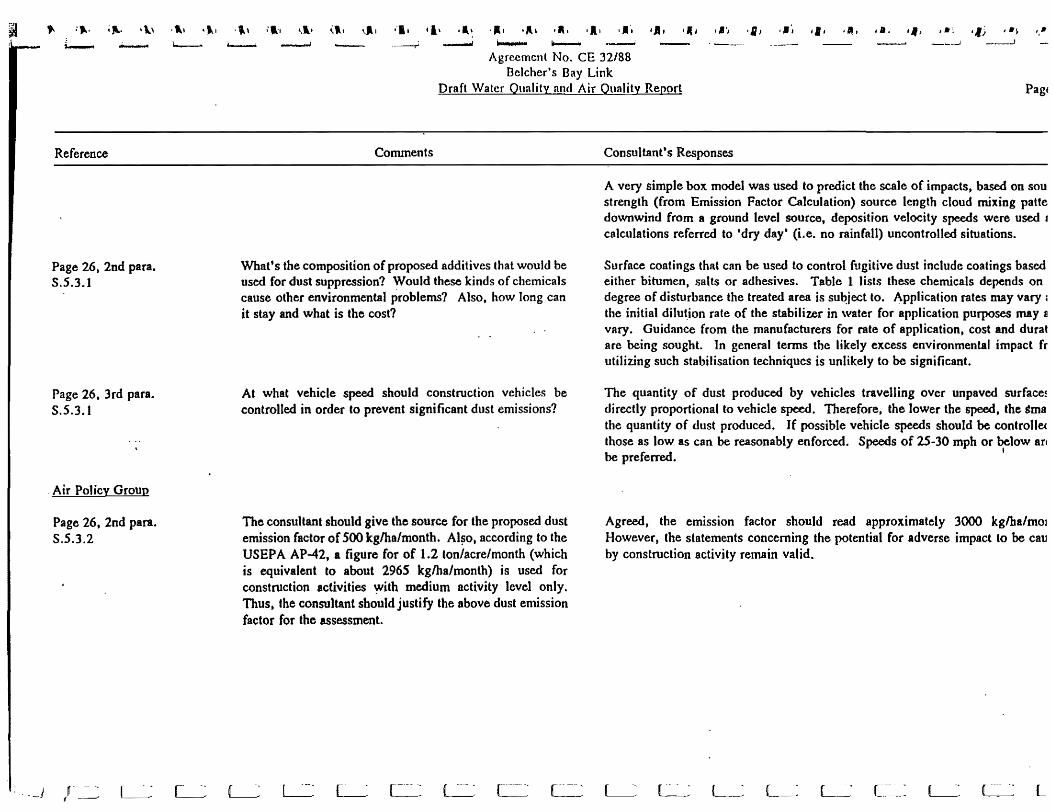
" :,.. ;~ '\' .... , ,,.1 . \' .'1:. '.1.. \.1 ,,'1 "I, ll\ 'l~ .", -Il' I.. ·1. ,I't '.I. ,~, ,", '11, .,.. ,11. '.' ,.'. I'; ,.} t,. s-.. ""-- I....-- '----' ~ __ -----.-' ____ ........ ~~.--i 1...-......-. __ ......J __ • .J
Reference
Page 26. 2nd para. S.S.3.1
Page 26. 3rd para. S.S.3.1
,Air Policy Group
Page 26, 2nd para. S.S.3.2
Agreement No. CE 32/88 Belcher's Bay Link
Draft Water Quality and Air Quality Report
Comments
What's the composition of proposed additives that would be used for dust suppression? Would these kinds of chemicals cause other environmental problems? Also, how long can it stay and what is the cost?
At what vehicle speed should construction vehicles be controlled in order to prevent significant dust emissions?
The consultant should give the source for the proposed dust emission factor of 500 kglha/month. Al~o. according to the USEPA AP-42, a figure for of 1.2 ton/acre/month (which is equivalent to about 2965 kglha/month) is used for construction activities ~ith medium activity level only. Thus, the consultant should justify the above dust emission factor for the assessment.
Consultant's Responses
A very simple box model was used to predict the scale of impacts, based on sou strength (from Emission Factor Calculation) source length cloud mixing patte downwind from a ground level source, deposition velocity speeds were used I
calculations referred to 'dry day' (Le. no rainfall) uncontrolled situations.
Surface coatings that can be used to control fugitive dust include coatings based either bitumen, salts or adhesives. Table 1 lists these chemicals depends on degree of disturbance the treated area is su~iect to. Application rates may vary l
the initial di1u~ion rate of the stabilizer in water for application purposes may 11
vary. Guidance from the manufacturers for rate of application, cost and durat are being sought. In general terms the like1y excess environmental impact rr utilizing such stabilisation techniques is unlikely to be significant.
The quantity of dust produced by vehicles travelling OVer unpaved surface~
directly proportional to vehicle speed. Therefore. the lower the speed, tbe Sma the quantity of dust produced. If possible vehicle speeds should be control1e< those as low as can be reasonably enforced. Speeds of 25-30 mph or below arl
I be preferred.
Agreed, the emiSSion factor should read approximately 3000 kglba/mol However, the statements concerning the potential for adverse impact 10 be eau by construction activity remain valid.
L
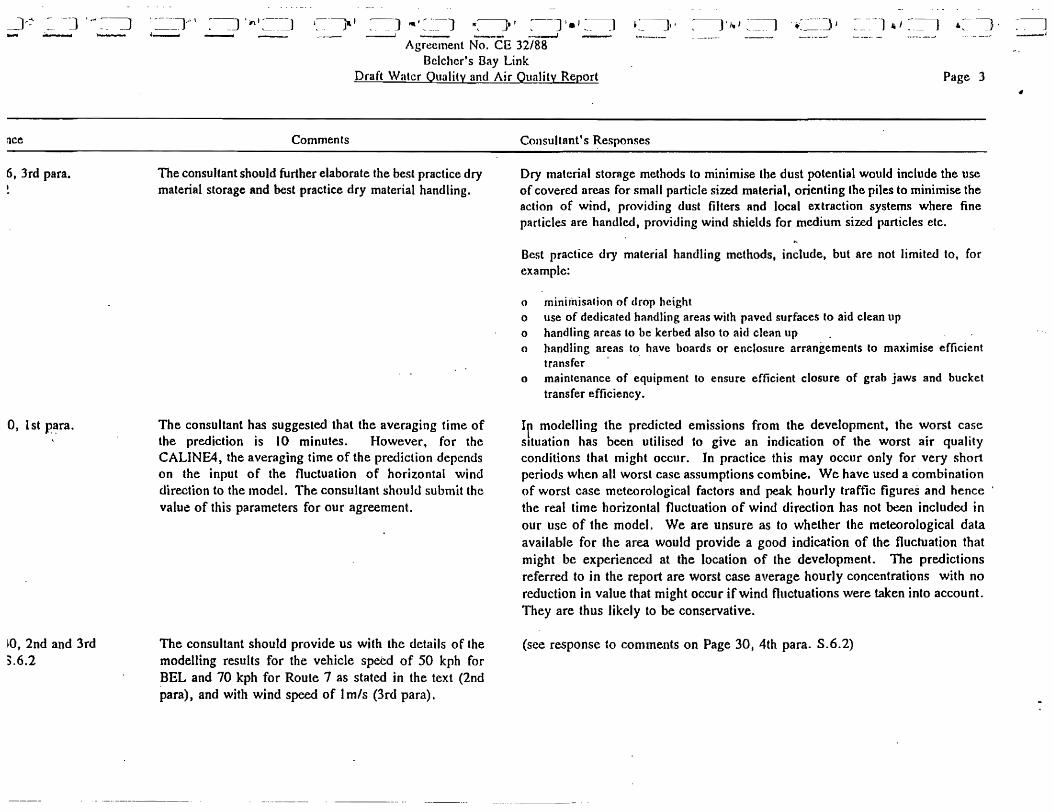
=-] '.-- """'-- -
flce
6, 3rd para.
0, 1st p'~ra.
~O, 2nd and 3rd ),6.2
"'~_~:=-1 I ~--]'.'~ __ ______ .. _._-.J
Agr~cment No. Cl! 32/88 Belcher's Bay Link
Draft Wutcr Quality and Air Quality Report Page 3
Comments
The consultant should further elaborate the best practice dry maferial storage and best practice dry material handling.
The consultant has suggested that the averaging time of the prediction is 10 minutes. However, for the CALINE4, the averaging time of the prediction depends on the input of the fluctuation of horizontal wind direction to the model. The consultant should submit the value of this parameters for our agreement.
The consultant should provide us with the details of the modelling results for the vehicle speed of 50 kph for BEL and 70 kph for Route 7 as stated in the text (2nd para), and with wind speed of lmls (3rd para).
Consultant's Responses
Dry material storage methods to minimise the dust potential would include the use of covered areas for small particle sized material, orienting the piles to minimise the action of wind. providing dust filters Rnd local extraction systems where fine particles are handled, providing wind shields for medium sized particles etc.
Best practice dry material handling methods, include, but are not limited to, for example:
o minithisation of drop hcight o use of dedicated handling areas with paved surfaces fo aid clean up o handling areas to be kerbed also to aid clean up o handling areas to have boards or enclosure arrangements to maximise efficient
transfer . o maintenance of equipment to ensure efficient closure of grab jaws and bucket
transfer efficiency.
In modelling the predicted emissions from the development, the worst case situation has been utilised to give an indication of the worst air quality conditions that might occur. In practice this may occur only for very short periods when all worst case assumptions combine. We have used a combination of worst case meteorological factors and peak hourly traffic figures and hence the real time horizontal fluctuation of wind direction has not been included in our use of the model. We are unsure as to whether the meteorological data available for the area would provide a good indication of the fluctuation that might be experienced at the location of the deveJopment. The predictions referred to in the report are worst case average hourly concentrations with no reduction in value that might occur if wind fluctuations were taken into account. They are thus likely to be conservative.
(see response to comments on Page 30, 4th para. S.6.2)
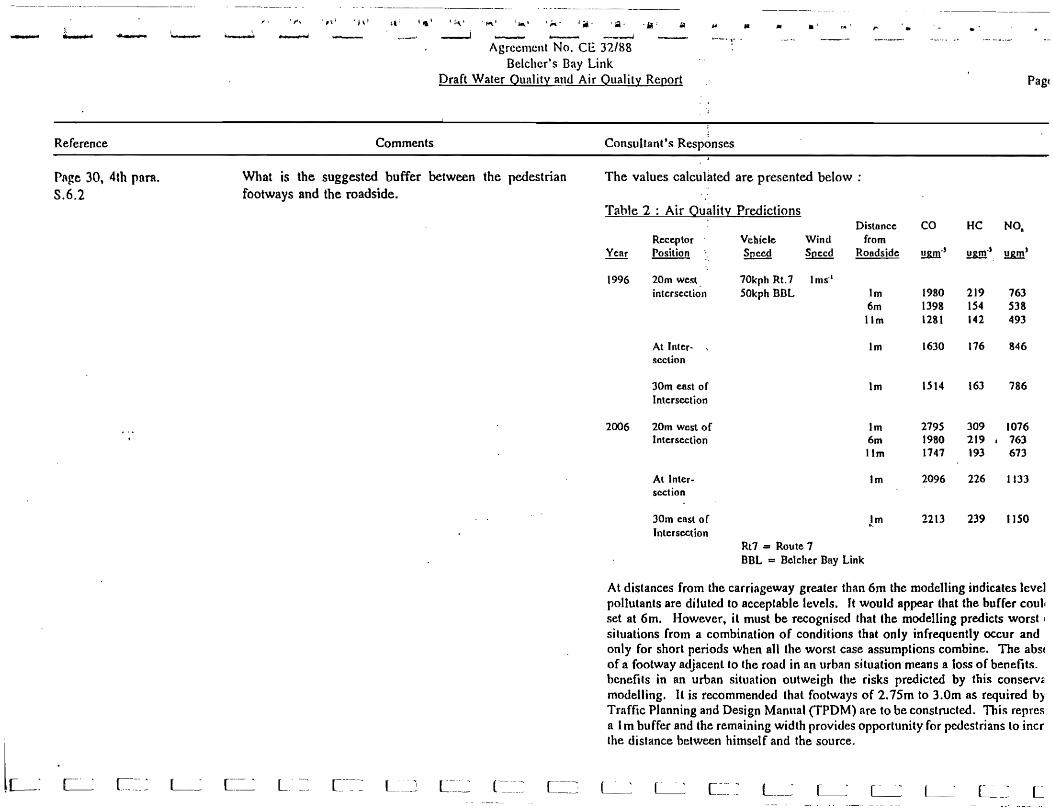
- l
~
Reference
PAge 30, 4th pAra. S.6.2
l - .", l,,1 111 .' , ;'\' ' "", , -. • , ;.... • I ill. . . Iil . . iI ' ..
~ --~ ,..
Agreement No. CE 32/88 Belchcr's Bay Link
Draft Water Quality and Air Quality Report Pag~
Comments Consultant t s Responses
Wbat is the suggested buffer between the pedestrian footways and the roadside.
The values calcuHlted are presented below:
L.·
Table 2 : Air Quality Predictions
1996
2006
Receptor Position
20m west intersection
At Inter- , section
30m east of I ntersCCl ion
20m west of Intersection
At Intersection
30m east of Intersection
Vehicle Speed
Wind Speed
70kph Rt.7 1 ms· t
50kph BDL
Rt7 = Route 7
Distance from
Roadside
Im 6m tlm
Im
Im
Im 6m lIm
Im
Jm
SBL :::: Belc:her Bay Link
co He NO.
!!.&m:'
1980 2)9 763 1398 154 SJ8 1281 142 493
1630 176 846
1514 163 786
2795 309 1076 1980 219 I 763 1741 193 673
2096 226 1133
2213 239 1150
At distances from the carriageway greater than 6m the modelling indicates level pollutants are diluted to acceptable levels. It would appear that the buffer coull set at 6m. However, it must be recognised that the modelling predicts worst I
situations from a combination of conditions that only infrequently occur and only for short periods when all the worst case assumptions combine. The absc of a footway adjacent to the road in an urban situation means a loss of benefits. benefits in an urban situation outweigh the risks predicted by this conservOl modelling. It is recommended that footways of 2.75m to 3.0m as required b~ Traffic Planning and Design Manual (TPDM) are to be constructed. This repres a 1 m buffer and the remaining width provides opportunity for pedestrians to incr the distance between himself and the source.
L· -~ L
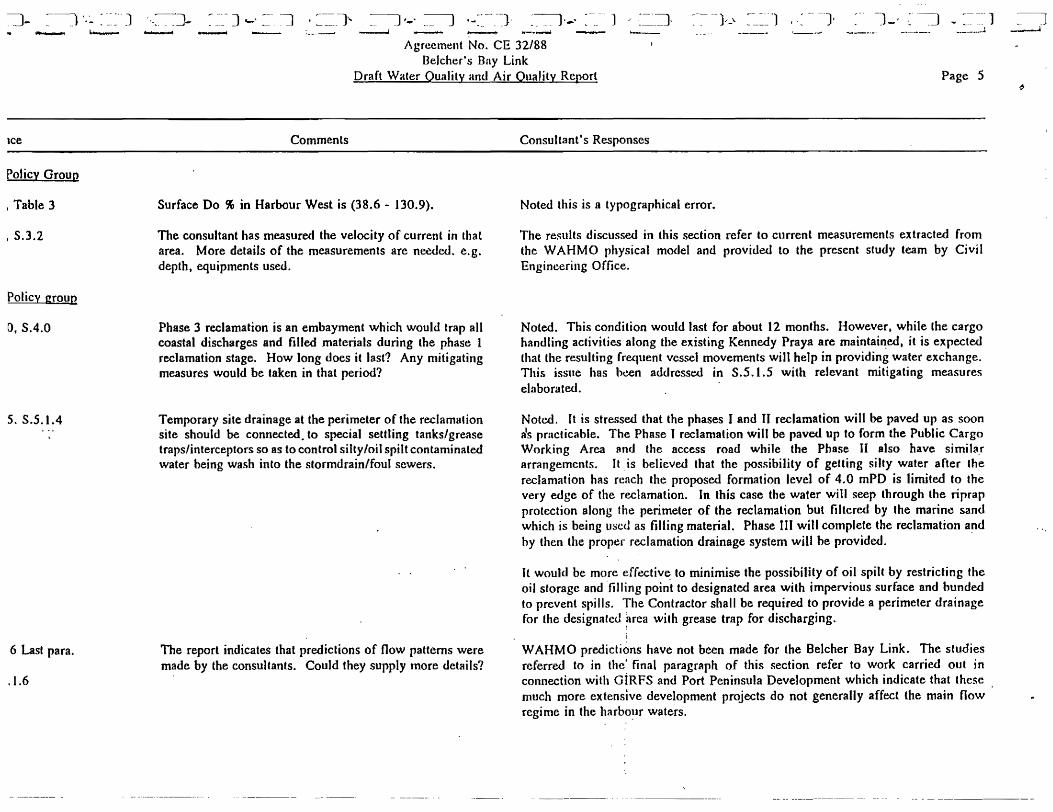
-
Ice
Policy Group
, Table 3
, S.3.2
Policy group
0, S.4.0
S. S.5.1.4
6 Last para.
.1.6
] . - - ""' .. _-.............
Agreement No. CE 32/88 Belcher's Bay Link
Draft Water Qmllity and Air Quality Report Page 5
Comments
Surface Do % in Harbour West is (38.6 - 130.9).
The consultant has measured the velocity of current in that area. More details of the measurements are needed. e.g. depth, equipments used.
Phase 3 reclamation is an embayment which would trap all coastal discharges and filled materials during the phase 1 reclamation stage. How long does it last? Any mitigating measures would be taken in that period?
Temporary site drainage at the perimeter of the reclamation site should be connected. to special settling tanks/grease traps/interceptors so as to control silly/oil spilt contaminated water being wash into the stormdrain/foul sewers,
The report indicates that predictions of flow patterns were made by the consultants. Could they supply more details?
Consultant's Responses
Noted this is a typographical error.
The results discussed in this section refer to current measurements extracted from the WAHMO physical model and provided to the present study team by Civil Engineering Office.
Noted. This condition would last for about 12 months. However, while (he cargo handling activities along the existing Kennedy Praya are maintai~ed, it is expected that the resulting frequent vessel movements wi1l help in providing water exchange. This issue has been addressed in S.5.1.5 with relevant mitigating measures elaborated.
Noted. It is stressed that the phases I and 11 reclamation will be paved up as soon a's pr:lclicable. The Phase I reclamation wilt be paved up to form the Public Cargo Working Area and the access road while the Phase 11 also have similar arrangements. It is believed that the possibility of getting silty water after (he reclamation has reach the proposed formation level of 4.0 mPD is limited to the very edge of the reclamation. In this case the wafer will seep through the riprap protection along the perimeter of the reclamation but filtered by the marine sand which is being used as filling material. Phase III will complete the reclamation a~d by then the proper reclamation drainage system will be provided.
It would be more effectiv~ to minimise the possibility of oil spilt by restricting the oil storage and "filling point to designated area with impervious surface and bunded to prevent spills. The Contractor shall be required to provide a perimeter drainage for the designated ~rea with grease trap for discharging.
WAHMO predictions have not been made for the Belcher Bay Link. The studies referred to in the' final paragraph of this section refer to work carried out in connection with GiRFS and Port Peninsula Development which indicate that these much more extensive development projects do not generally affect the main flow' regime in the harbo~r waters.
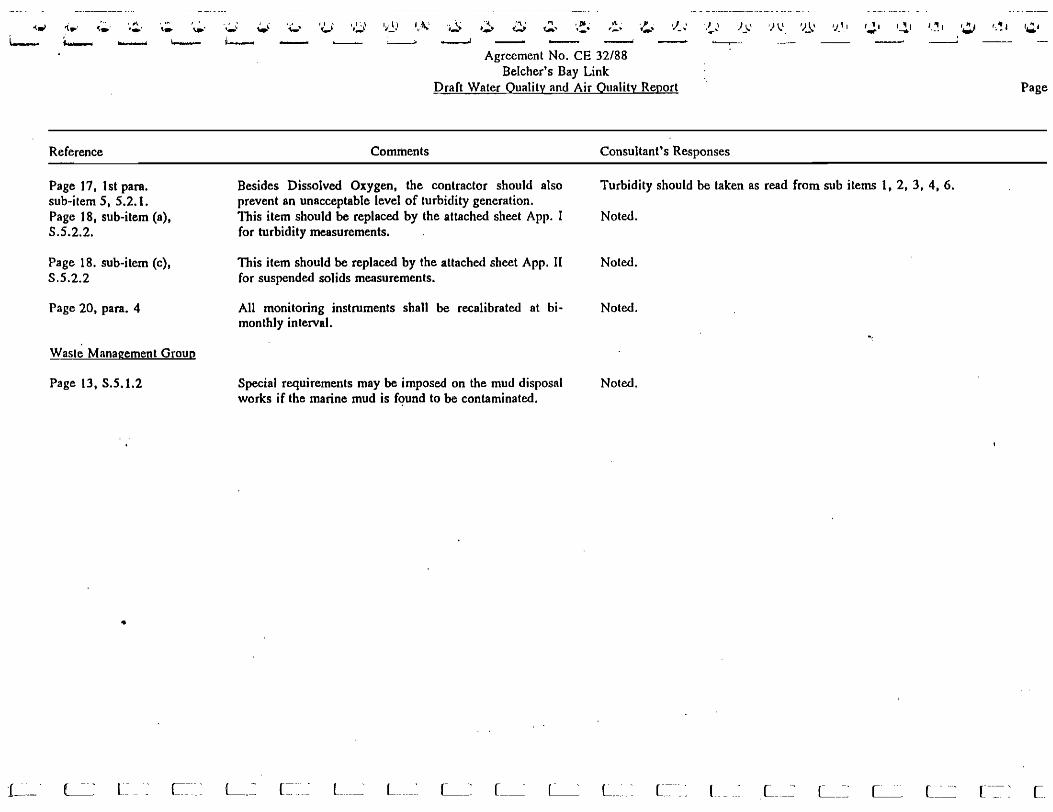
1-~-:.-
',. ....
Reference
'A '-'
Page 17, J st para. sub-item 5, 5.2.1. Page t 8, sUb-item (a), S.5.2.2.
Page 18. sUb-item (c), S.5.2.2
Page 20, para. 4
Waste Management Group
Page 13, S.5.1.2
•
~: r-... C~-~~.~
Comments
.DJ' '--Agreement No. CH 32/88
BeIcher's Bay Link Draft Water Quality and Air Quality Report
Consultant's Responses
'/'.1 I 11 ..".
Besides Dissolved Oxygen, the contractor should also prevent an unacceptable level of turbidity generation.
Turbidity should be taken as read from sub items 1, 2, 3, 4, 6.
This item should be replaced by the attached sheet App. I for turbidity measurements.
This item should be replaced by the attached sheet App. 11 for suspended solids measurements.
All monitoring instruments shall be recalibrated at bimonthly interval.
Special requirements may be imposed on the mud disposal works if the marine mud is f<?und to be contaminated .
L .. -= C~~:· .. ~ L. __ ._- L_ .. _ .. _._~ L~ [--- ~
Noted.
Noted.
Noted.
Noted.
L._.· [~ .. -- l.. L_._~· L_=~ C'" L_:---=
Page
r--- , [ .
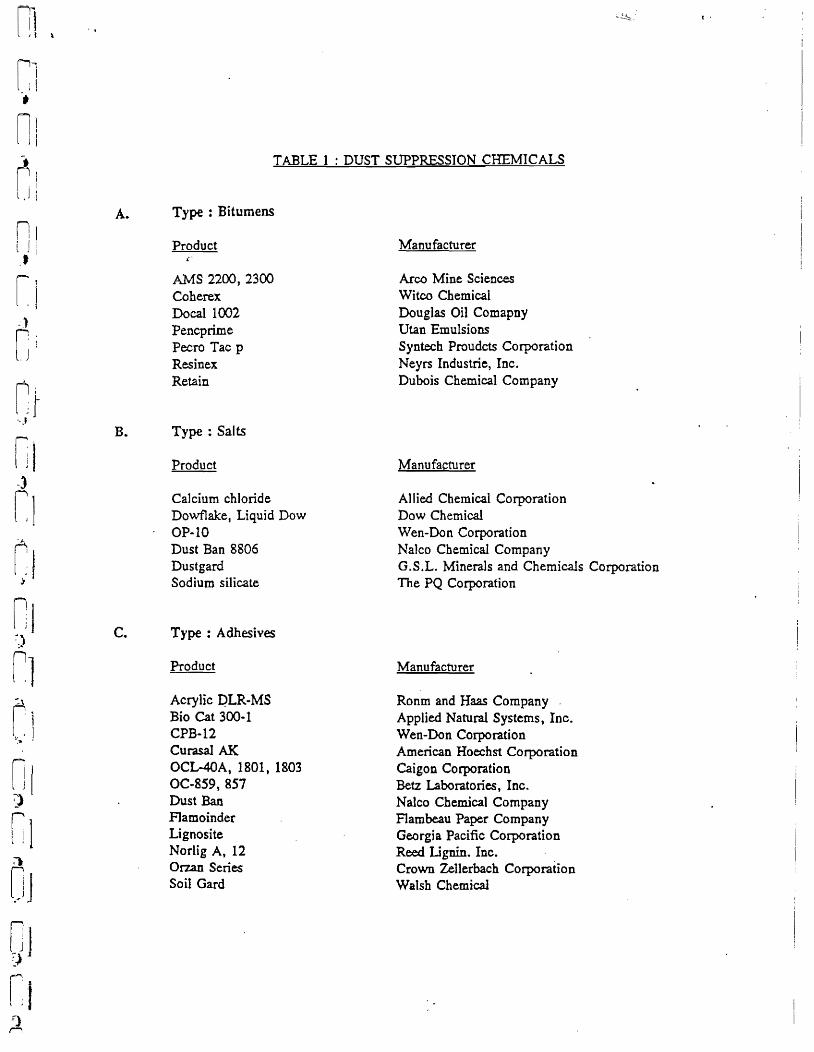
• ~l l J I
nl )
GI :a
DJ
nJ )
rl e) r-,
A.
B.
c.
TABLE 1 : DUST SUPPRESSION CHEMICALS
Type : Bitumens
Product
AMS 2200, 2300 Coherex Docal 1002 Pencprime Pecro Tac p Resinex Retain
Type: Salts
Product
Calcium chloride Dowfl ake , Liquid Dew OP-IO Dust Ban 8806 Dustgard Sodium silicate
Type : Adhesives
Product
Acrylic pLR·MS Bio Cat 300-1 CPB-12 Curasal AI(
OCL-40A, 1801, 1803 OC-859,857 Dust Ban Flamoinder Lignosite Norlig A, 12 Orzan Series Soil Gard
Manufacturer
Arco Mine Sciences Witco Chemical Douglas Oil Comapny Utan Emulsions Syntech Proudcts Corporation Neyrs Industrie, Inc. Dubois Chemical Company
Manufacturer
Allied Chemical Corporation Dow Chemical Wen-Don Corporation Nalco Chemical Company G.S.L. Minerals arid Chemicals Corporation The PQ Corporation
Manufacturer
Ronm and Haas Company Applied Natural Systems, Inc. Wen-Don Corporation American Hoechst Corporation Caigon Corporation Betz Laboratories, Inc. Nalco Chemical Company Flambeau Paper Company Georgia Pacific Corporation Reed Lignin. Inc. Crown Zellerbach Corporation Walsh Chemical
t·

, ,,, ." ~ III \ " " . I 1"\ \..-- ........... ~ 4 .. 1....-,... .......
Reference
Volume I - Noic;e
Volume n
Air OnaJjtv
Table 2p page S
Page 26~ 5.5.3.2
W2Ier Quality
Item 2. ] ~ 2nd panL
TableS A
,~_\ ,~.. ,--. \
_~.' -........I
/ or: \ I , \ . 'i , . ,:' \ • '" \ \_~. ___ .. .----.I r;;:. __ •
1-' • .., \
, I"!'. ................. ~ .. ,., ~ .. - '6' __ _ ,; .--:
"l1 •• ___ ,i),.' ~\ -.,I:(;;~-<"''''''-.
, I! ..
r-- Agreement No. CE 32/88 Belcher's Bay Link
Draft Walcr Quality and Air Quality Report Pag4
Comments
No COIl1tI:If;Itf.
Some Lypog:tapbical errors have DOl been ame:oded:
The daily AQO rOl" dJe Tobll SuspeOded ParticnJales !ibonJd be 260 ILg/m" instead of 360 pr/m-).
The dust emiAioa factor proposed by USEPA AP-42 sbouJd be about 3CX)() l:gIhaIJJlOI11.b in..~ of 500 tg/halmcmth.
Should be : 1be V~ Ha.rbour %ODe is sclIMuIed to be eazrtfed in 1993 .....
leacbate from pohI.ie dllmping ground in Phase ill which wooJd affect the '9tIi1d.cc qnality "WB.S not .addressed in the report..
2 IoEs of S 00DSeCIltive days saxnpiing is DOt sufficient to provide 'baseIioe' for the subseqneot monitoring weds •
..
. Con.crultanL·s ~
Noted.
Noted.
Noted..
The Phase ,m recla.m:I6on 'Will be coostrucCed with mariDe and and COO topJ
N~ &he sampling frequ.eucy is revised to 4 san:yfing per weel. at mid-fkxx mid-ebb~ fur 4 ~ve 'Weei.s w:ithin 6 weeb of com.meoce.mect of worb
" [ -. ~ L-=: [_._._., . ~ ~ ~- ~ [~ ... ~ 'L_~