Embed Size (px)
Citation preview
HAL Id: dumas-01108286https://dumas.ccsd.cnrs.fr/dumas-01108286
Submitted on 22 Jan 2015
HAL is a multi-disciplinary open accessarchive for the deposit and dissemination of sci-entific research documents, whether they are pub-lished or not. The documents may come fromteaching and research institutions in France orabroad, or from public or private research centers.
L’archive ouverte pluridisciplinaire HAL, estdestinée au dépôt et à la diffusion de documentsscientifiques de niveau recherche, publiés ou non,émanant des établissements d’enseignement et derecherche français ou étrangers, des laboratoirespublics ou privés.
Belief Elicitation and Information Search inNormal-Form Games. An Eye-Tracking Study
Nathalie Popović
To cite this version:Nathalie Popović. Belief Elicitation and Information Search in Normal-Form Games. An Eye-TrackingStudy. Economics and Finance. 2014. �dumas-01108286�
Université Paris1
UFR 02 Sciences Economiques
Mention du Master
Master 2 Recherche Economie et Psychologie
Belief Elicitation and Information Search in Normal-Form Games
—
An Eye-Tracking Study
Tutors : Guillaume Hollard, Vincent de Gardelle
Jury : Franck Zenasni, Jean Christophe Vergnaud
Presented and defended by: Nathalie Franziska Popović
Date : June 2014
ii
L’université de Paris 1 Panthéon Sorbonne n’entend donner aucune approbation, ni
désapprobation aux opinions émises dans ce mémoire ; elles doivent être considérées comme
propre à leur auteur
iii
Table of Contents
I. Acknowledgements……………………………………………................................ iv
II. Abstract………………………...……………………………………………………. v
1. Introduction & Literature Review...…………………………………………………... 1
2. Hypotheses and Overview of Study…………………………………………………… 5
3. Method……………………………………………………………………………....…... 6
3.1. Experimental Design………………………………………………… 6
3.2. Games………………………………………………………………… 7
3.3. Experimental Procedure……………………………………………… 8
4. Results…………………………………………………………………………………... 11
4.1. Behavioral Data……………………………………………………… 11
4.2. Eye-tracking Data………………………………………………...…. 18
5. Discussion……………………………………………………………………………….. 26
6. Conclusion………………………………………………………………………………. 29
7. References………………………………………………………………………………. 31
8. Appendix ……………………………………………………………………………….. 34

iv
Acknowledgements
It is with immense gratitude that I acknowledge the support and help of my two tutors
Guillaume Hollard and Vincent de Gardelle. They did not only make it possible to get access
to financial means and to the eye-tracking device, they also supported us in every step of this
research project: from developing the idea to designing and programming the experiment to
analyzing and interpreting the data.
I performed this research project together with Francisco Nicolas Olano, student at EHESS,
who I thank for the great cooperation.
v
Abstract
We study the influence of belief elicitation on participants’ behavior and information search
pattern in normal-form games. We hypothesize 1) that people will take the opponent’s payoff
more into account after (compared to before) they have been asked to form beliefs about the
opponent’s behavior, and 2) that people will show a one-sided search pattern when forming
beliefs, taking much less into account their own payoff compared to the opponents payoff.
Whereas our results couldn’t confirm our first hypothesis, the second hypothesis was
supported: subjects analyzed the matrix more partially and one-sided when asked to form
beliefs about the other player’s behavior compared to when choosing for themselves.
Moreover, our results provide further evidence for the assumption that people often don’t act
strategically when playing economic games and rather base their decisions on simple decision
rules.
Keywords: eye-tracking, game theory, beliefs, experimental economics, normal-form games.
1
1. Introduction and Literature Review
In order to explain strategic behavior, economists often make use of simple games like
normal-form games. In such games, the decision problem is presented in a matrix where one
of the players chooses a row and the other one chooses a column. Each cell of the matrix
contains two numbers that are associated to the both player’s payoff. The final payoff is then
defined by the intercept of both choices (row and column). Traditional economic theories of
behavior in such games are based on two assumptions: First, that players form correct beliefs
about the behavior of the other player, and second, that players best-respond to these beliefs
(Camerer, Ho, & Chong, 2004; Devetag, Guida, & Polonio, 2013). Players are, hence,
assumed to take into account all the relevant information, to know which column(or row) the
other player is going to choose and, based on this belief, to choose the strategy that maximizes
the own payoff. Following this reasoning, both players will end up in the so called Nash
equilibrium in which none of the players has an incentive to change his or her strategy.
Looking on experimental data of behavior in such games, however, these assumptions do not
seem to hold in most of the cases. It rather seems that people systematically deviate from the
predicted Nash equilibrium, and sometimes even violate dominance (meaning that they fail to
choose the strategy that is better than all the other strategies regardless of the other player’s
behavior) (Rydval, Ortmann, & Ostatnicky, 2008). To deal with this problem, some
economists have developed models that incorporate this kind of bounded rationality, such as
the Level-k model (cognitive hierarchy model) (Camerer et al., 2004) and the Quantal-
Response-Equilibrium model (QRE)(Mckelvey& Palfrey, 1998; McKelvey & Palfrey, 1995).
The QRE is based on the assumption that people make some mistakes when trying to best
respond to their beliefs. It extends the logic of Nash equilibrium by allowing for some noise in
the behavior using a logit function. The Level-k model assumes that people have different
2
levels of cognitive reasoning abilities and that they best respond to the believe that all other
players have a lower level than them. A level-0 player would be somebody who plays
according to a uniform distribution, a level-1 player is somebody who best-responds to a
level-0 player, and so on. Both types of models are able to fit the data better than rational
equilibrium prediction as they allow for heterogeneity in participants, but these models are
still based on the assumptions that players act strategically, meaning that they form beliefs
about the other player’s behavior and try to best respond to those beliefs (Devetag, Guida, et
al., 2013).
Studies that ask participants for their beliefs about the other player’s behavior, however,
provide evidence that participants often behave in a way that contradicts their beliefs about
others. Costa-Gomes & Weizsäcker (2008), for example, asked participants to state their
beliefs about the other player’s decision in normal-form games. They elicited beliefs before
subjects chose their own actions, after they chose their own actions and immediately before
each action. On average, participants failed to best respond to their own stated beliefs in
almost half of the games, regardless of whether the belief statements were solicited before or
after the actions were chosen. Moreover, the majority of subjects played as if they were best-
responding to an opponent that plays randomly. However, when stating beliefs, they assumed
the opponent to choose actions that are, as well, best-responses to a uniform-distribution.
They therefore assumed the other player to be a level-1 player whereas they themselves also
played according to level-1. The authors also found in most of the cases no statistically
significant effect of belief elicitation on subsequent choices. It therefore seems that sensitizing
people for the possible strategies of the other player doesn’t change their behavior. Consistent
with the findings of Costa-Gomes & Weizsäcker (2008), participants in the study of Sutter,
Czermak, & Feri (2010) also best responded to their beliefs in about half of the trials
(55.79%), whereas in the fMRI study on normal-form games of Bhatt & Camerer (2005), the
3
percentage of optimal choices given the beliefs was with 66% slightly higher. In total, those
studies suggest that participants fail to best respond to their own stated beliefs in about 40-
50% of the cases.
In the last two decades, studies that analyze people’s information search when playing
strategic games have helped to better understand the cognitive processes that underlie
decisions in such games. Such studies use process tracing measures, such as Mouse-tracking
and Eye-tracking, which provide an objective measure of what is processed at a given
moment in time. Moreover, the proportion of time and attention spent on a specific piece of
information has been found to represent the weight that piece of information has in the
decision making process (Fiedler, Glöckner, Nicklisch, & Dickert, 2013) and to influence
subsequent choice (Costa-Gomes, Crawford, & Broseta, 2001; Devetag, Guida, et al., 2013;
Johnson, Camerer, Sen, & Rymon, 2002).
Findings from Mouse- and Eye-tracking studies suggest that people often do not take into
account the other player’s option, analyze only a part of the available information and that the
information search pattern is not in line with strategic reasoning. Meijering, van Rijn, Taatgen
& Verbrugge (2012), for example, study participants’ reasoning about mental states of others
in a two-player Marble Drop game, a game in which backward induction is needed in order to
find the best strategy. Their eye-tracking data (the observed fixation frequencies) reveal that
participants apply most of time forward reasoning instead of backward reasoning. In their
experiment on sender-receiver games, Wang et al. (2010) find, as well, that information
search doesn’t correspond to the strategic and rational behavior predicted by game theory. In
their game, senders look disproportionately at the payoffs of the true state and, hence, do not
seem to think strategically enough to predict the other player’s behavior.
Stewart, Gächter and Noguchi (2013) specifically analyzed the question if eye-movements of
participants correspond to what level-k models would predict. A level-2 player, for example,
would first examine the other player’s payoffs and then the respective column of his/her own
4
payoffs. What they find is that their eye-tracking data do not fit so well a level-k model but
rather a simple accumulator model, meaning that the eye movements are either within a cell,
or are horizontal or vertical across cells. Moreover, the average fixation time was relatively
short (290 seconds), which suggest automatic processing instead of deliberative calculation as
assumed by the level-k model. The authors also found that participants tended to fixate the
own payoff slightly more often than the other player’s payoff.
Such an own payoff bias was found, as well, in studies of Devetag, Guida, et al. (2013) and
Hristova & Grinberg (2005). Those studies did not only find that participants look much less
at the opponent's payoff but also that attention is unequally distributed across one’s own
payoffs. In Hristova & Grinberg's eye-tracking study on Prisoner’s Dilemma (Hristova &
Grinberg, 2005), for example, people mainly looked at T and R payoffs (payoffs for unilateral
defection and for mutual cooperation).
Moreover, several studies on cognitive processes reveal that, instead of strategic reasoning,
our information search rather seems to correspond to simple decision rules (heuristics) (Costa-
Gomes et al., 2001; Devetag, Guida, et al., 2013; Johnson et al., 2002; Tanida & Yamagishi,
2010). Devetag, Di Guida, & Polonio (2013), for example, study decisions and information
search in normal-form games with and without certain features that offer easy and attractive
choice options, such as a cell with a high symmetric payoff (attractor cell) or a row with a
high expected payoff and a low variance. A heuristic, hence, would be to always choose the
line containing a cell with a high symmetric payoff or to always choose the line that
minimizes the risk and maximizes the expected payoff. The behavioral data of their study
suggests that participants indeed base their behavior on such heuristics as they choose
relatively more often the rows containing the special features. Moreover, when analyzing
participant’s search patterns using eye-tracking, the authors find that most of the participants
analyze the matrix only partially, ignoring the other player’s payoff and/or paying attention
5
only to the features of the matrix like the attractor cell. In their study, look-up patterns were
also correlated to subsequent choices.
2. Hypotheses and overview of study
In sum, studies using process tracing measures in strategic games have shown that we often
don’t take into account all the necessary information of the decision problem and that we,
therefore, often fail to act strategically. Additionally, studies on belief elicitation have found
that we often choose an action that is inconsistent with our before or afterwards stated belief.
Interesting questions that arise here are, for example, whether people’s information search
pattern changes after they have been asked to guess what the other one is going to play. Do
participants take more into account the opponent’s payoff after being sensitized for his or her
potential strategies? And which information do people take into account when they form
beliefs about the other player? Do they follow a similar one-sided search pattern as when
choosing a strategy for themselves?
To answer these questions, we conducted an eye-tracking study on decisions and belief
elicitation in normal-form games. In order to have a benchmark to compare our findings to,
we decided to replicate the study of Devetag, Di Guida, et al. (2013) (henceforth D&D), using
the same games and similar experimental procedure but additionally eliciting participants’
beliefs. To our best knowledge, there hasn’t been conducted any study before that combines
eye-tracking and belief elicitation during strategic games.
The overall goal of our study – to analyze the influence of belief elicitation on participants’
information search during strategic decisions – can, hence, be divided into two sub goals:
First of all, we want to analyze how people’s information search pattern changes after they
have been asked to guess what the other one is going to play. We assume that that the own
payoff bias will be reduced and that people will analyze the matrix more completely when
6
they choose their strategy after they stated their beliefs about other players behavior and,
hence, after being sensitized to take others behavior into account.
And second, we want to analyze how participants analyze the game if they are asked to guess
the other player’s behavior. Since Costa-Gomes & Weizsäcker (2008) have found that
subjects expected their opponents to choose strategies that best responses to a uniform
distribution, just as they play themselves, we assume that the search patterns when guessing
the other players strategy will be very similar to the search pattern when choosing a strategy
for oneself. Our hypothesis is, hence, that when forming beliefs about the other players
behavior, participants will analyze the game only partially and mainly focus on the payoff of
the opponent (just like the own payoff bias).
Additional to these two hypotheses, we expect to replicate findings from previous studies
stated above: Concerning the behavioral data, we assume participants to fail to best-respond
to their own stated beliefs in about 50% of the trials. Moreover, as in D&D, we expect
participants’ behavior to be influenced by the presence or absence of certain features of the
matrix that provide easy and convenient solutions. Concerning the eye-tracking data, we
expect that people will pay more attention to their own payoff compared to the other player’s
payoff (own payoff bias), that they won’t pay equal attention to all the information in the
matrix, and that where people look at last will be linked to their choice
3. Method
3.1. Experimental Design
Our experimental design looks as follows: We have two conditions: OSS and SSO. In each
condition, participants make choices in 3 blocks of 16 games. In the first condition (OSS),
participants first have a block of 16 games in which they have to guess what the other one is
7
going to play (O), followed by two blocks to make choices for themselves (S). In the second
condition (SSO), participants make first choices for themselves and then they guess what the
other one is going to play. We chose this three block design in order to be able to control for
learning effects: If we had, for example, a two block design (O-S and S-O), it would be hard
for us to compare choices and search patterns before and after belief elicitation as people
might just analyze the matrix differently after belief elicitation because they already have
faced 16 of such games before. With our design (OSS and SSO) we can compare the second S
blocks to each other while controlling for the learning effect.
For every block and every subject, the order of the matrixes was randomized. Moreover,
subjects didn’t get any feedback of the row player’s choices during the experiment.
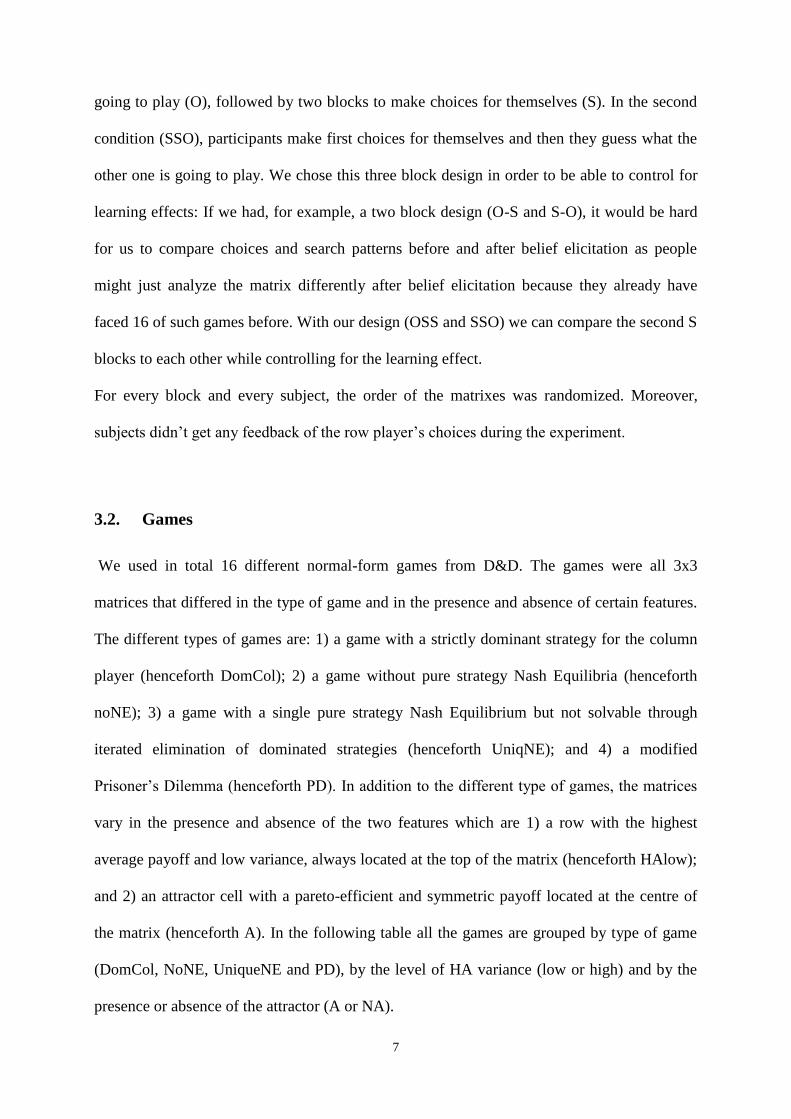
3.2. Games
We used in total 16 different normal-form games from D&D. The games were all 3x3
matrices that differed in the type of game and in the presence and absence of certain features.
The different types of games are: 1) a game with a strictly dominant strategy for the column
player (henceforth DomCol); 2) a game without pure strategy Nash Equilibria (henceforth
noNE); 3) a game with a single pure strategy Nash Equilibrium but not solvable through
iterated elimination of dominated strategies (henceforth UniqNE); and 4) a modified
Prisoner’s Dilemma (henceforth PD). In addition to the different type of games, the matrices
vary in the presence and absence of the two features which are 1) a row with the highest
average payoff and low variance, always located at the top of the matrix (henceforth HAlow);
and 2) an attractor cell with a pareto-efficient and symmetric payoff located at the centre of
the matrix (henceforth A). In the following table all the games are grouped by type of game
(DomCol, NoNE, UniqueNE and PD), by the level of HA variance (low or high) and by the
presence or absence of the attractor (A or NA).
8
3.3. Experimental Procedure
Before our eye-tracking experiment, we conducted two behavioral test experiments at the
Parisian Experimental Economics Laboratory (LEEP) of the Université Paris 1 Panthéon-
Sorbonne. Subjects were recruited via the internal data base of the laboratory and in total we
Table 1: The normal-form games used in the experiment, grouped by type of game
(DomCol, NoNE, UniqueNe, PD), level of HA variance (low, high), and presence
or absence of the attractor (A, NA). The bold numbers indicate the Nash
Equilibrium.
9
had 17 subjects in the OSS condition and 18 in the SSO condition. In each of the session,
three players were randomly chosen to play as column players in order to be able to match
participants with a real player. The responses from the column players were later also used to
calculate the gains in the eye-tracking experiment, whereas their responses were not used for
later analysis.
Our eye-tracking experiment was conducted at the Laboratoire Psychologie de la Perception
(LPP) of the Université Paris 5 Descartes. Twenty subjects were recruited via the database of
the Relais d’Information sur les Sciences de la Cognition (RISC) of the Centre National de la
Recherche Scientifique (French National Center for Scientific Research). For the eye-track
record we used a camera-based eye-tracker model “Eye-Link 1000”. As we only had one eye-
tracking device, the eye-tracking experiment was conducted one subject at a time.
For both, the behavioral test and the eye-tracking experiment, the software used for the
decision tasks was Matlab 2013b with Psychophysical Toolbox version 2.5.4 and we used the
Eye-Link Toolbox to combine it with the eye-tracker.
Before the start of the experiment, people read the instructions (see annex) in which they were
explained the procedure of the experiment and the logic of the games. Instructions about the
exact task (guessing the other player’s behavior or choosing a strategy for oneself) together
with information about payments were given only directly before the start of each block on
the screen. Subsequent to the instructions, participants answered to a short questionnaire
containing questions about their age, gender, educational level, their game theory experience
as well as comprehension questions.
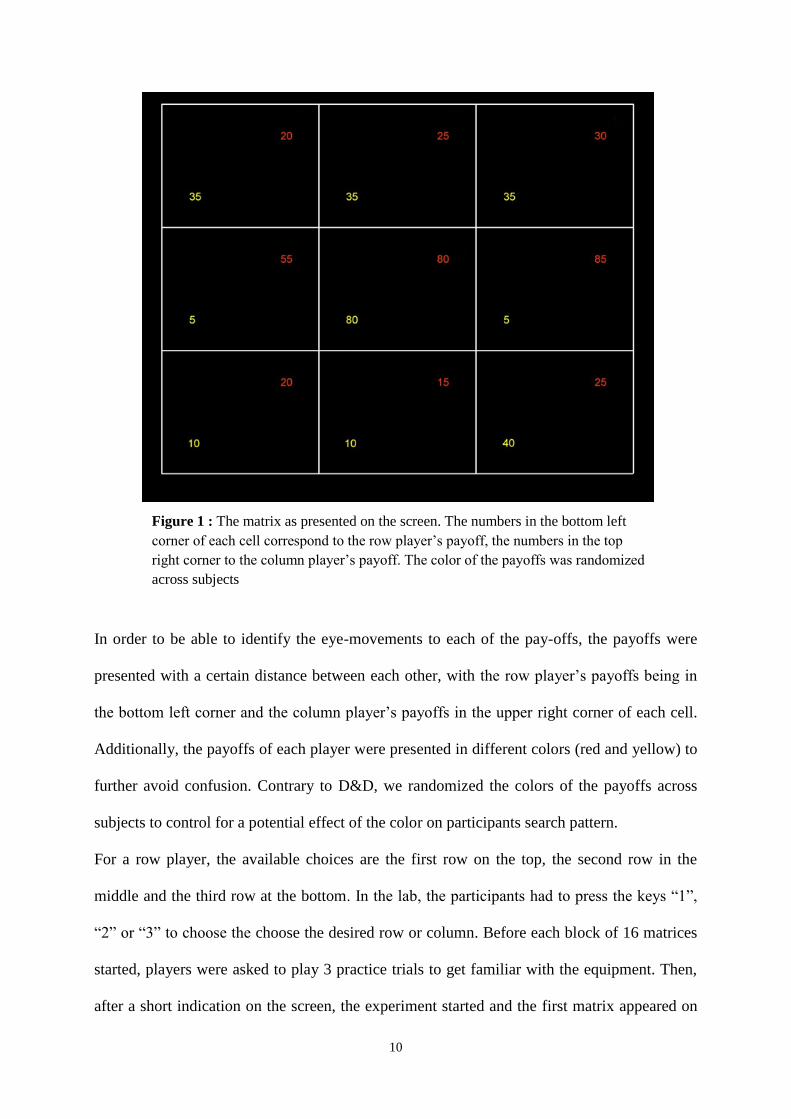
During the experiment, a matrix like the following was presented on the whole screen:
10
In order to be able to identify the eye-movements to each of the pay-offs, the payoffs were
presented with a certain distance between each other, with the row player’s payoffs being in
the bottom left corner and the column player’s payoffs in the upper right corner of each cell.
Additionally, the payoffs of each player were presented in different colors (red and yellow) to
further avoid confusion. Contrary to D&D, we randomized the colors of the payoffs across
subjects to control for a potential effect of the color on participants search pattern.
For a row player, the available choices are the first row on the top, the second row in the
middle and the third row at the bottom. In the lab, the participants had to press the keys “1”,
“2” or “3” to choose the choose the desired row or column. Before each block of 16 matrices
started, players were asked to play 3 practice trials to get familiar with the equipment. Then,
after a short indication on the screen, the experiment started and the first matrix appeared on
Figure 1 : The matrix as presented on the screen. The numbers in the bottom left
corner of each cell correspond to the row player’s payoff, the numbers in the top
right corner to the column player’s payoff. The color of the payoffs was randomized
across subjects
11
the screen. Even though we didn't impose any time constraint, we asked participants to answer
within 1 minute. If they hadn't answered within this time, the whole matrix would flash for a
few seconds to encourage the player to make a choice. At the end of each block, there was a
little break with instructions for the following block in which the participants had the
possibility to relax themselves.
For the eye-tracking experiment, all the conditions remained the same as for the behavioral
test. However, before each block a calibration of the eye-tracker was performed and before
each matrix, a fixation point located at the bottom of the screen (outside the area covered by
the matrix) appeared to minimize biases related to the starting fixation. On average, the whole
experience took between 45 and 60 minutes.
At the end the experiment, gains were calculated as follows: Each participant was randomly
matched with a column player from the behavioral test experiment. For every right guess in
the O block, participants got 0.50€. For the S blocks, four games were randomly chosen by
the computer and gains calculated according to the subject’s and the column player’s choices.
The payoffs in the matrix were presented in Experimental Currency Units (ECUs), with 10
ECU being about 0,20€. Participants could win between 5€ and 20€, with the average gain
being around 13€.
4. Results
4.1. Behavioral Data
As we only have 10 subjects per condition in the eye-tracking experiment and as those two
samples significantly differ from each other in certain characteristics (gender, amount of
people with game theory experience, average age, education level), we decided to aggregate
the behavioral data from the eye-tracking experiment with the data from our behavioral test
experiment. After aggregation, we got 24 subjects in the OSS condition and 25 in the SSO
12
condition, allowing us to identify more easily certain effects and increase the reliability of our
behavioral results.
First of all, we compared our results with those of Devetag, Di Guida, et al. (2013) to see if
we could replicate their findings.
A comparison between the
observed frequency of choice for
each strategy in each matrix was
made and a high correlation of
the percentages of each response
between our study (S1 SSO) and
their study found (r=0.86). The
following figure shows
graphically the correlation
between the percentages of each
response in Devetag, Di Guida, et al. (2013) and the block S1 from the condition SSO of our
study. The high correlation is a first indication that responses from our study and responses
from their study follow the same trend.
Effect of descriptive features on choices
As in Devetag, Di Guida, et al. (2013), we wanted to see the effects produced by the presence
of the two descriptive features: the attractor (A) and the row with the highest average payoff
and low variance (HAlow). Comparing the average response time of matrices with and
without features in all S blocks we find that people take less time to decide in matrices where
both features are present compared to matrices without any feature, supporting the assumption
of D&D that the features provide “easy and convenient solutions” (see Figure 3).
Figure 2 : Scatter plot of the frequency of each response in
each matrix (e.g. response 2 from Matrix 13). On the x-axis are
the frequencies of the responses in D&D, on the y-axis the
frequencies of the responses from our study in block 1 of SSO.
13
As in D&D, the frequency of the middle strategy was in every game higher in matrices with
attractor compared to matrices without the attractor even though this difference was only
significant for DomCOl and noNe games (see Figure 4):
In contrast to D&D, who found that choice distributions across matrices with and without
both features are significantly different from each other for every type of game, choice
distribution in our study are only significantly different in matrices with both features
compared to matrices without both features in the DomCol game (Pearson chi2(2) = 12.4706,
p = 0.002).
Figure 3 : Average response
time across different type of
features in different type of
games.
Figure 4 : Proportion of middle
strategies (response 2) chosen in
matrices with attractor
compared to matrices without
attractor, across the different
type of games.
14
Effect of treatment on choices
In order to see if there is an effect of the treatment (belief elicitation) on participant’s
behavior, we compared the choice distributions for each matrix of the S2 block of OSS to the
S2 block of SSO with a Chi-squared test. Our results suggest that eliciting participants’ beliefs
before their own choices does not have a significant effect on their behavior as the choice
distribution in all matrices of both conditions (except DomCol with A and HAlow) were not
significantly different from each other. Moreover, belief elicitation before the own choice had
no significant effect on the proportion of equilibrium strategies chosen (Pearson chi2(1) =
0.0510, p = 0.821).
Relation between choices and stated beliefs
In order to analyze if people make choices consistent with their beliefs, we counted the cases
in which participants choices were the best responses to their own stated beliefs. In total
(looking at the SSO and OSS condition together), subjects best-responded to their own stated
beliefs in 52,10% of the trials. This results is similar to what other studies on beliefs in
normal-form games have found (see Table 2)
Our study Costa-Gomes &
Weizsäcker (2008)
Sutter, Czermak, &
Feri (2010)
Bhatt & Camerer
(2005)
52,10% 55% 55.79% 66%
Table 2 : Percentages of best-responses to stated beliefs across different studies.
15
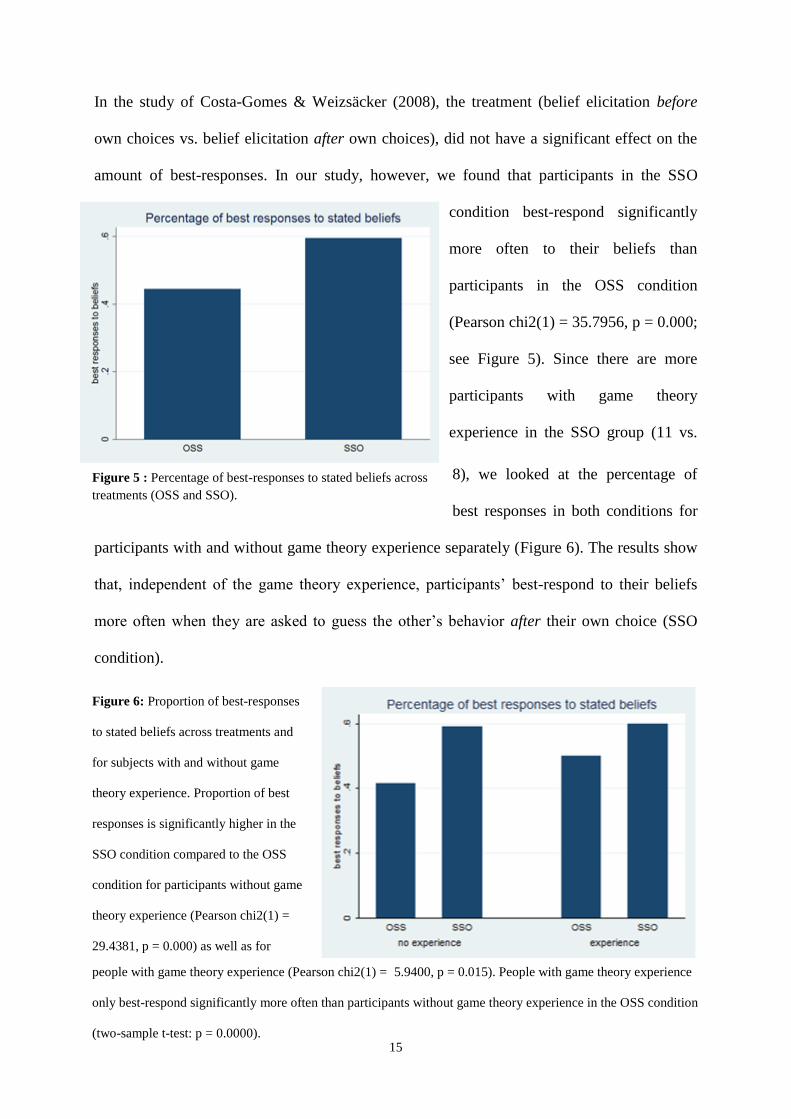
Figure 5 : Percentage of best-responses to stated beliefs across
treatments (OSS and SSO).
In the study of Costa-Gomes & Weizsäcker (2008), the treatment (belief elicitation before
own choices vs. belief elicitation after own choices), did not have a significant effect on the
amount of best-responses. In our study, however, we found that participants in the SSO
condition best-respond significantly
more often to their beliefs than
participants in the OSS condition
(Pearson chi2(1) = 35.7956, p = 0.000;
see Figure 5). Since there are more
participants with game theory
experience in the SSO group (11 vs.
8), we looked at the percentage of
best responses in both conditions for
participants with and without game theory experience separately (Figure 6). The results show
that, independent of the game theory experience, participants’ best-respond to their beliefs
more often when they are asked to guess the other’s behavior after their own choice (SSO
condition).
Figure 6: Proportion of best-responses
to stated beliefs across treatments and
for subjects with and without game
theory experience. Proportion of best
responses is significantly higher in the
SSO condition compared to the OSS
condition for participants without game
theory experience (Pearson chi2(1) =
29.4381, p = 0.000) as well as for
people with game theory experience (Pearson chi2(1) = 5.9400, p = 0.015). People with game theory experience
only best-respond significantly more often than participants without game theory experience in the OSS condition
(two-sample t-test: p = 0.0000).
16
Figure 7: Proportions of middle strategies when forming
beliefs, in matrices with and without attractor for different
type of games.
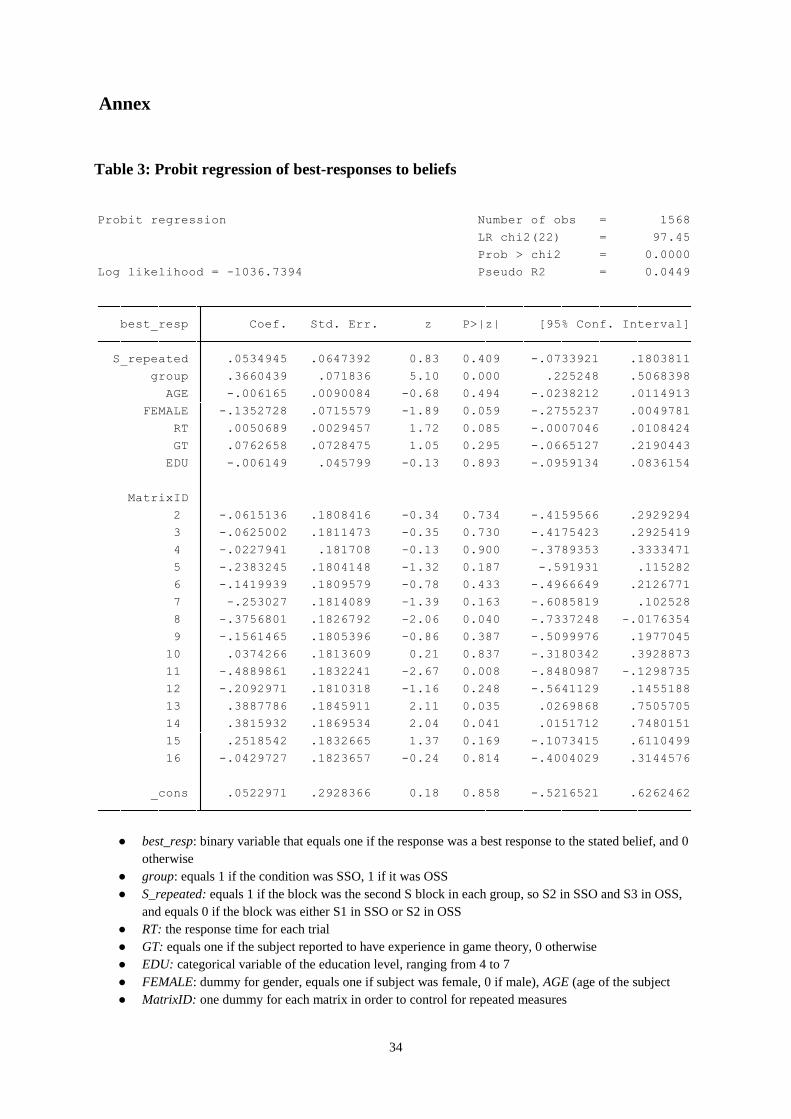
To further analyze the determinants of best responses to beliefs, we did a probit regression
with a variable that equals one if the response was a best response to the stated belief as the
dependent variable, and treatment, type of block, game theory experience, response time, age,
gender, education, and a dummy for each matrix as independent variables (see regression
output in Table 3 in annex). In this model, only the type of treatment and some matrices show
a significant effect on the probability of best-responding to one’s own stated beliefs. Eliciting
beliefs after choosing strategies for oneself seem to increases, hence, the probability of having
consistent choices and beliefs.
When guessing what the opponent is going to play, subjects seem to be influenced by the
attractor in a similar way as when they choose for themselves: In every game, besides the PD,
proportions of the middle strategy were significantly higher in matrices with the attractor
compared to matrices without the attractor. As when choosing for oneself, some participants
violate dominance when guessing
the other’s behavior: In 23% of
cases, participants thought that other
one would choose a strictly
dominated strategy (response 1 in
UniqueNE and response 2 in PD).
However, it is not clear if people
made this choice because they
assume the other one to be irrational
or because they themselves didn’t
realize that the strategy is strictly
17
dominated. Moreover, people’s beliefs don’t seem to be influenced by the treatment: For
every matrix, choice distributions in the O1 of OSS and O3 of SSO do not significantly differ
from each other (measured with a chi-squared test).
We also compared the response time of both tasks (guessing the other’s behavior vs. choosing
for oneself) by creating a standardized response time for each trial (zRT=(response time -
mean(response time))/ SD(response time)), computing the mean of zRT for each subject for
the O task and for the S task, and then comparing these values with a paired t-test. The results
suggest that people took significantly more time to respond when they had to choose an action
for themselves as when they had to state their beliefs (p = 0.000), suggesting that there is
more cognitive reasoning involved when choosing a strategy for oneself.
Effect of game theory experience on behavior
As some of our participants reported to have experience in game theory and others didn’t, we
wanted to analyze if those participants behave differently. We assumed that participants with
game theory experience would act more rational, meaning that they best-respond more often
to their own stated beliefs, and that they choose less often dominated strategies. Our results
support this assumptions: participants with game theory experience best-respond significantly
more often to their own stated beliefs than participants without game theory experience
(proportion of best responses: 0.56 vs. 0.50; two sample t-test: p = 0.0212) and they choose
less dominated strategies compared to participants without game theory experience (11,84%
versus 25,83%, Pearson chi2(1) = 6.2421, p = 0.012). Moreover, subjects experienced in
game theory had a significantly higher response time than subjects without game theory
experience (16,69 seconds versus 12,88 seconds; two-sample t-test: p = 0.000) , indicating
that former used less automatic and more cognitive reasoning.
18
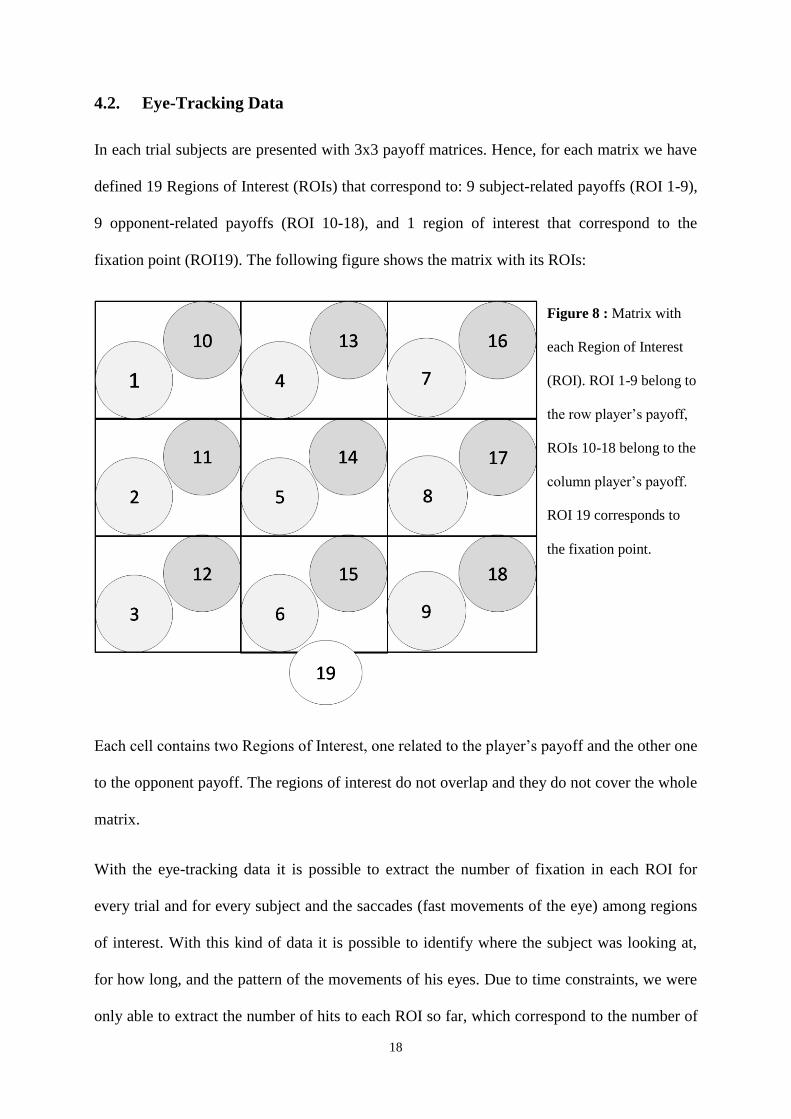
4.2. Eye-Tracking Data
In each trial subjects are presented with 3x3 payoff matrices. Hence, for each matrix we have
defined 19 Regions of Interest (ROIs) that correspond to: 9 subject-related payoffs (ROI 1-9),
9 opponent-related payoffs (ROI 10-18), and 1 region of interest that correspond to the
fixation point (ROI19). The following figure shows the matrix with its ROIs:
Each cell contains two Regions of Interest, one related to the player’s payoff and the other one
to the opponent payoff. The regions of interest do not overlap and they do not cover the whole
matrix.
With the eye-tracking data it is possible to extract the number of fixation in each ROI for
every trial and for every subject and the saccades (fast movements of the eye) among regions
of interest. With this kind of data it is possible to identify where the subject was looking at,
for how long, and the pattern of the movements of his eyes. Due to time constraints, we were
only able to extract the number of hits to each ROI so far, which correspond to the number of
Figure 8 : Matrix with
each Region of Interest
(ROI). ROI 1-9 belong to
the row player’s payoff,
ROIs 10-18 belong to the
column player’s payoff.
ROI 19 corresponds to
the fixation point.
19
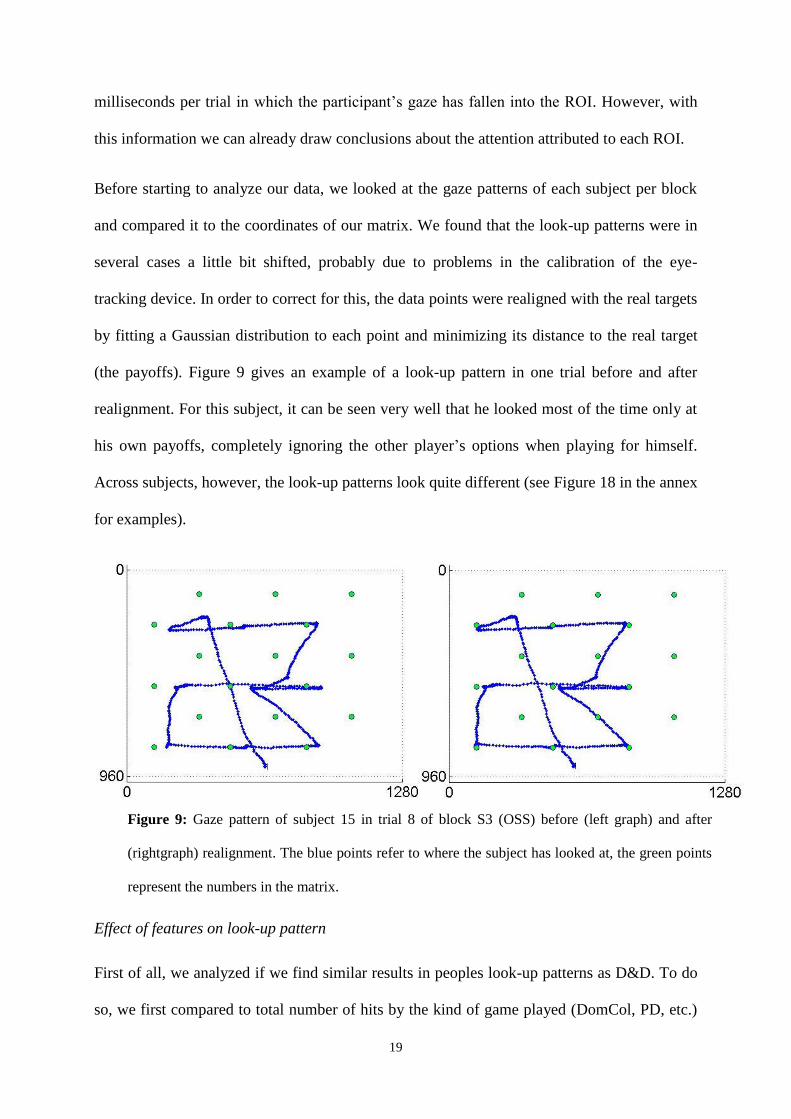
Figure 9: Gaze pattern of subject 15 in trial 8 of block S3 (OSS) before (left graph) and after
(rightgraph) realignment. The blue points refer to where the subject has looked at, the green points
represent the numbers in the matrix.
milliseconds per trial in which the participant’s gaze has fallen into the ROI. However, with
this information we can already draw conclusions about the attention attributed to each ROI.
Before starting to analyze our data, we looked at the gaze patterns of each subject per block
and compared it to the coordinates of our matrix. We found that the look-up patterns were in
several cases a little bit shifted, probably due to problems in the calibration of the eye-
tracking device. In order to correct for this, the data points were realigned with the real targets
by fitting a Gaussian distribution to each point and minimizing its distance to the real target
(the payoffs). Figure 9 gives an example of a look-up pattern in one trial before and after
realignment. For this subject, it can be seen very well that he looked most of the time only at
his own payoffs, completely ignoring the other player’s options when playing for himself.
Across subjects, however, the look-up patterns look quite different (see Figure 18 in the annex
for examples).
Effect of features on look-up pattern
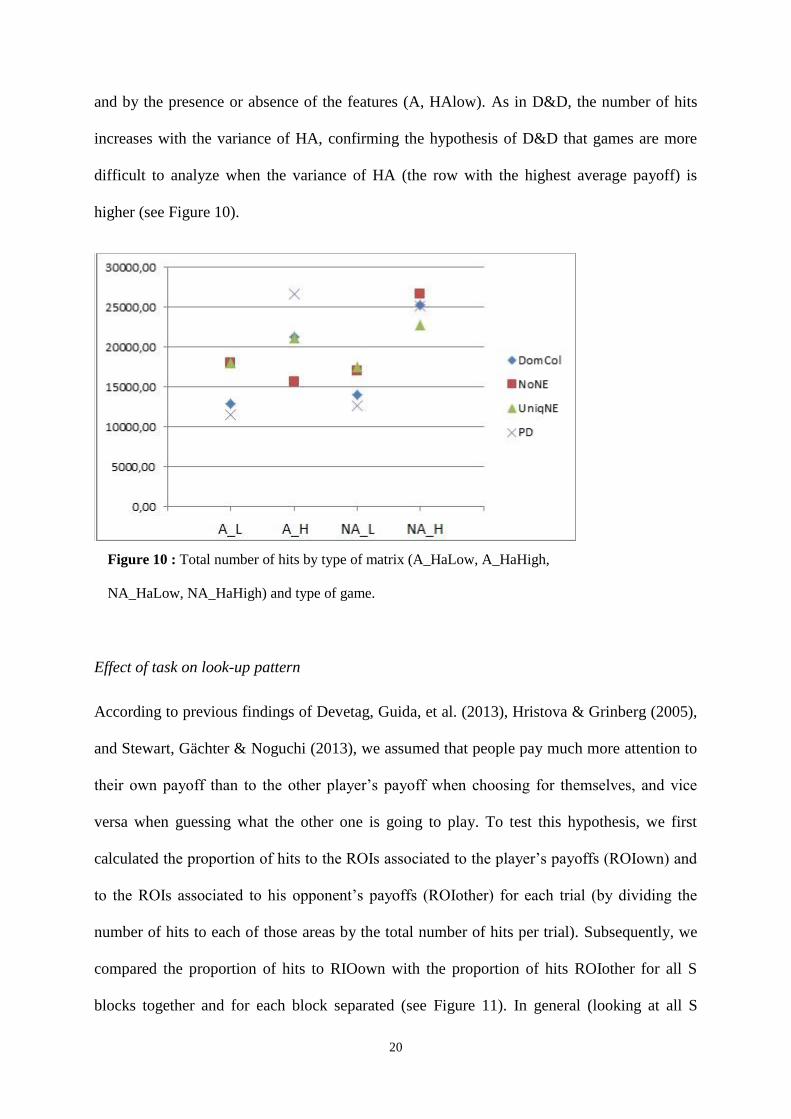
First of all, we analyzed if we find similar results in peoples look-up patterns as D&D. To do
so, we first compared to total number of hits by the kind of game played (DomCol, PD, etc.)
20
Figure 10 : Total number of hits by type of matrix (A_HaLow, A_HaHigh,
NA_HaLow, NA_HaHigh) and type of game.
and by the presence or absence of the features (A, HAlow). As in D&D, the number of hits
increases with the variance of HA, confirming the hypothesis of D&D that games are more
difficult to analyze when the variance of HA (the row with the highest average payoff) is
higher (see Figure 10).
Effect of task on look-up pattern
According to previous findings of Devetag, Guida, et al. (2013), Hristova & Grinberg (2005),
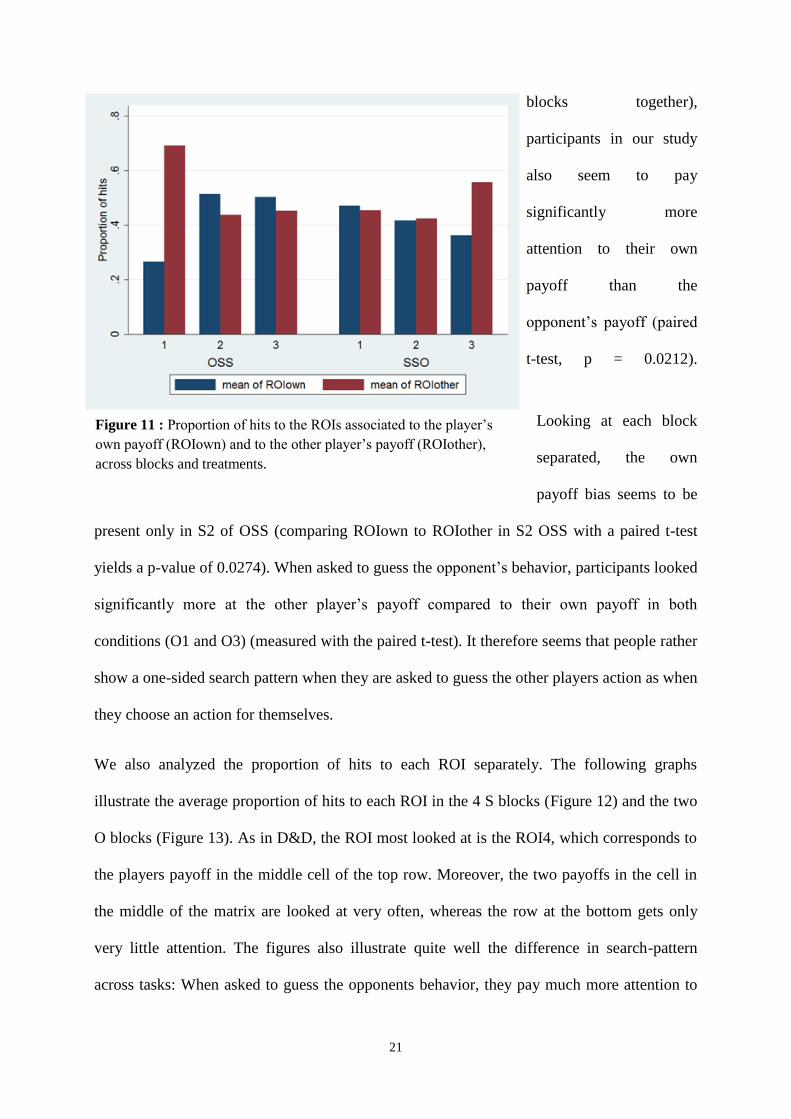
and Stewart, Gächter & Noguchi (2013), we assumed that people pay much more attention to
their own payoff than to the other player’s payoff when choosing for themselves, and vice
versa when guessing what the other one is going to play. To test this hypothesis, we first
calculated the proportion of hits to the ROIs associated to the player’s payoffs (ROIown) and
to the ROIs associated to his opponent’s payoffs (ROIother) for each trial (by dividing the
number of hits to each of those areas by the total number of hits per trial). Subsequently, we
compared the proportion of hits to RIOown with the proportion of hits ROIother for all S
blocks together and for each block separated (see Figure 11). In general (looking at all S
21
Figure 11 : Proportion of hits to the ROIs associated to the player’s
own payoff (ROIown) and to the other player’s payoff (ROIother),
across blocks and treatments.
blocks together),
participants in our study
also seem to pay
significantly more
attention to their own
payoff than the
opponent’s payoff (paired
t-test, p = 0.0212).
Looking at each block
separated, the own
payoff bias seems to be
present only in S2 of OSS (comparing ROIown to ROIother in S2 OSS with a paired t-test
yields a p-value of 0.0274). When asked to guess the opponent’s behavior, participants looked
significantly more at the other player’s payoff compared to their own payoff in both
conditions (O1 and O3) (measured with the paired t-test). It therefore seems that people rather
show a one-sided search pattern when they are asked to guess the other players action as when
they choose an action for themselves.
We also analyzed the proportion of hits to each ROI separately. The following graphs
illustrate the average proportion of hits to each ROI in the 4 S blocks (Figure 12) and the two
O blocks (Figure 13). As in D&D, the ROI most looked at is the ROI4, which corresponds to
the players payoff in the middle cell of the top row. Moreover, the two payoffs in the cell in
the middle of the matrix are looked at very often, whereas the row at the bottom gets only
very little attention. The figures also illustrate quite well the difference in search-pattern
across tasks: When asked to guess the opponents behavior, they pay much more attention to
22
the opponent’s payoff compared to their own, whereas when playing for themselves, they
seem to analyze the matrix more completely.
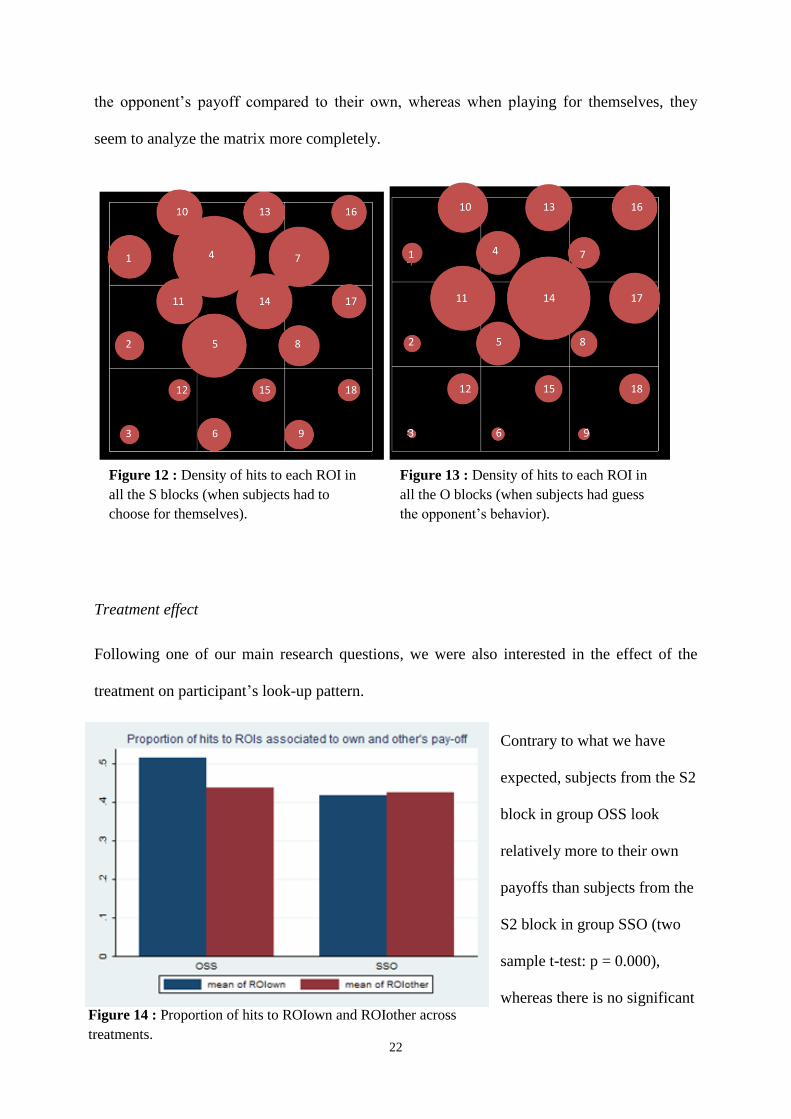
Treatment effect
Following one of our main research questions, we were also interested in the effect of the
treatment on participant’s look-up pattern.
Contrary to what we have
expected, subjects from the S2
block in group OSS look
relatively more to their own
payoffs than subjects from the
S2 block in group SSO (two
sample t-test: p = 0.000),
whereas there is no significant
Figure 12 : Density of hits to each ROI in
all the S blocks (when subjects had to
choose for themselves).
Figure 13 : Density of hits to each ROI in
all the O blocks (when subjects had guess
the opponent’s behavior).
Figure 14 : Proportion of hits to ROIown and ROIother across
treatments.
23
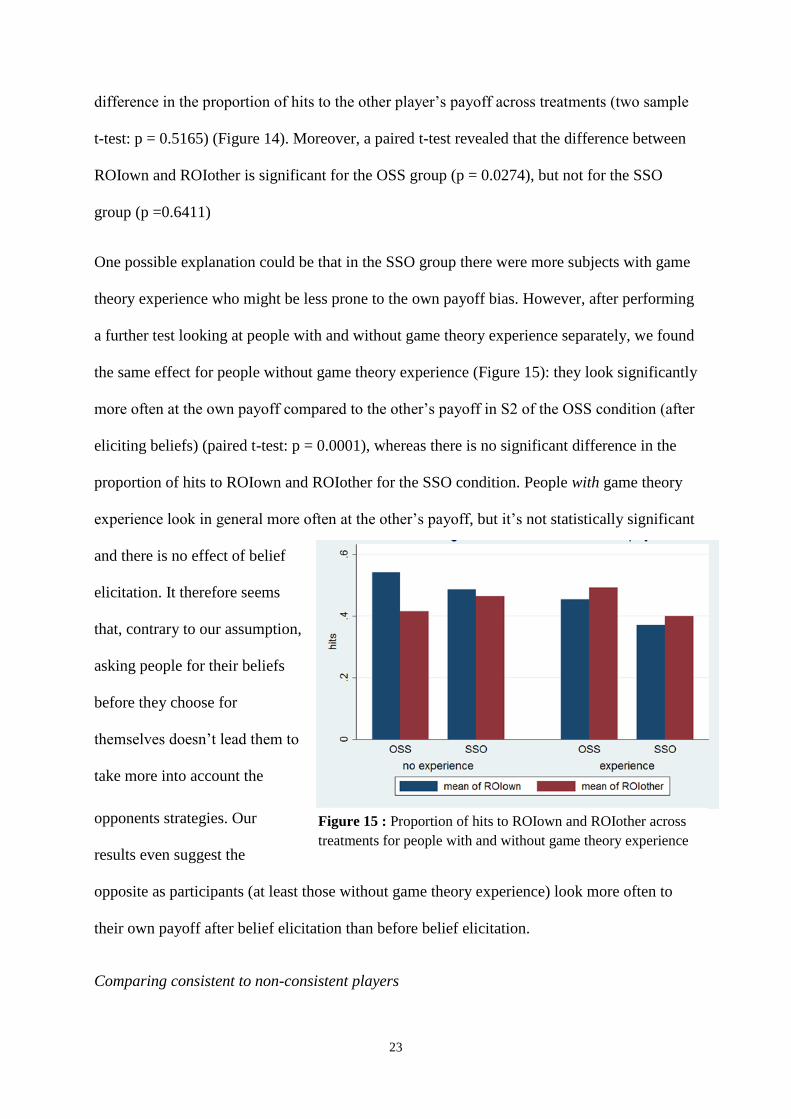
Figure 15 : Proportion of hits to ROIown and ROIother across
treatments for people with and without game theory experience
difference in the proportion of hits to the other player’s payoff across treatments (two sample
t-test: p = 0.5165) (Figure 14). Moreover, a paired t-test revealed that the difference between
ROIown and ROIother is significant for the OSS group (p = 0.0274), but not for the SSO
group (p =0.6411)
One possible explanation could be that in the SSO group there were more subjects with game
theory experience who might be less prone to the own payoff bias. However, after performing
a further test looking at people with and without game theory experience separately, we found
the same effect for people without game theory experience (Figure 15): they look significantly
more often at the own payoff compared to the other’s payoff in S2 of the OSS condition (after
eliciting beliefs) (paired t-test: p = 0.0001), whereas there is no significant difference in the
proportion of hits to ROIown and ROIother for the SSO condition. People with game theory
experience look in general more often at the other’s payoff, but it’s not statistically significant
and there is no effect of belief
elicitation. It therefore seems
that, contrary to our assumption,
asking people for their beliefs
before they choose for
themselves doesn’t lead them to
take more into account the
opponents strategies. Our
results even suggest the
opposite as participants (at least those without game theory experience) look more often to
their own payoff after belief elicitation than before belief elicitation.
Comparing consistent to non-consistent players
24
Figure 16 : Proportion of hits to ROIown and ROIother for
best-responder and non best-responder
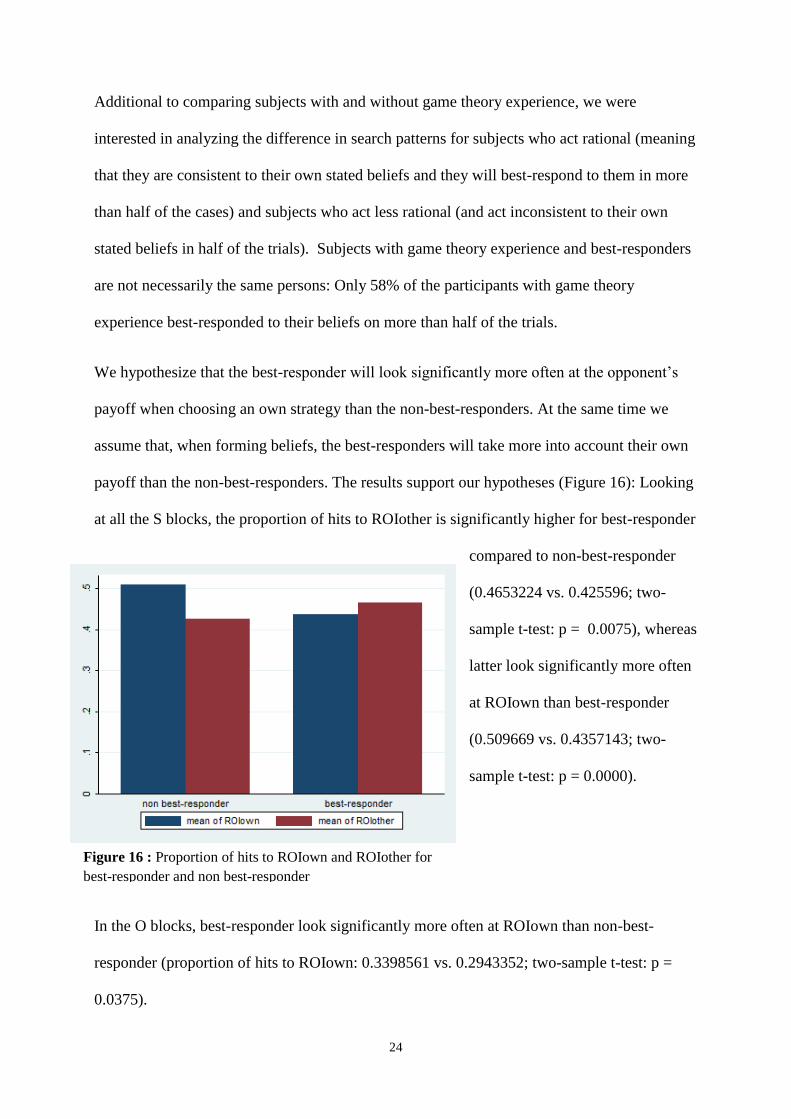
Additional to comparing subjects with and without game theory experience, we were
interested in analyzing the difference in search patterns for subjects who act rational (meaning
that they are consistent to their own stated beliefs and they will best-respond to them in more
than half of the cases) and subjects who act less rational (and act inconsistent to their own
stated beliefs in half of the trials). Subjects with game theory experience and best-responders
are not necessarily the same persons: Only 58% of the participants with game theory
experience best-responded to their beliefs on more than half of the trials.
We hypothesize that the best-responder will look significantly more often at the opponent’s
payoff when choosing an own strategy than the non-best-responders. At the same time we
assume that, when forming beliefs, the best-responders will take more into account their own
payoff than the non-best-responders. The results support our hypotheses (Figure 16): Looking
at all the S blocks, the proportion of hits to ROIother is significantly higher for best-responder
compared to non-best-responder
(0.4653224 vs. 0.425596; two-
sample t-test: p = 0.0075), whereas
latter look significantly more often
at ROIown than best-responder
(0.509669 vs. 0.4357143; two-
sample t-test: p = 0.0000).
In the O blocks, best-responder look significantly more often at ROIown than non-best-
responder (proportion of hits to ROIown: 0.3398561 vs. 0.2943352; two-sample t-test: p =
0.0375).
25
Figure 17 : Proportion of hits to ROIown and ROIother across
treatments for best-responder and non best-responder
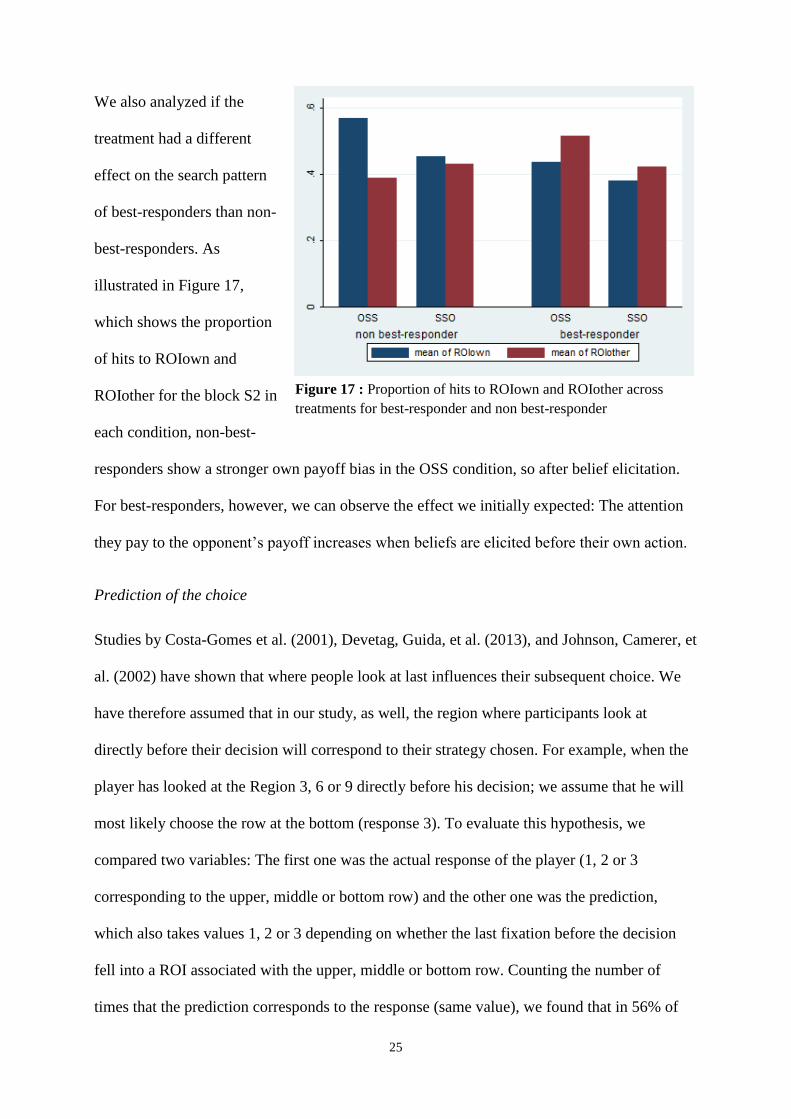
We also analyzed if the
treatment had a different
effect on the search pattern
of best-responders than non-
best-responders. As
illustrated in Figure 17,
which shows the proportion
of hits to ROIown and
ROIother for the block S2 in
each condition, non-best-
responders show a stronger own payoff bias in the OSS condition, so after belief elicitation.
For best-responders, however, we can observe the effect we initially expected: The attention
they pay to the opponent’s payoff increases when beliefs are elicited before their own action.
Prediction of the choice
Studies by Costa-Gomes et al. (2001), Devetag, Guida, et al. (2013), and Johnson, Camerer, et
al. (2002) have shown that where people look at last influences their subsequent choice. We
have therefore assumed that in our study, as well, the region where participants look at
directly before their decision will correspond to their strategy chosen. For example, when the
player has looked at the Region 3, 6 or 9 directly before his decision; we assume that he will
most likely choose the row at the bottom (response 3). To evaluate this hypothesis, we
compared two variables: The first one was the actual response of the player (1, 2 or 3
corresponding to the upper, middle or bottom row) and the other one was the prediction,
which also takes values 1, 2 or 3 depending on whether the last fixation before the decision
fell into a ROI associated with the upper, middle or bottom row. Counting the number of
times that the prediction corresponds to the response (same value), we found that in 56% of
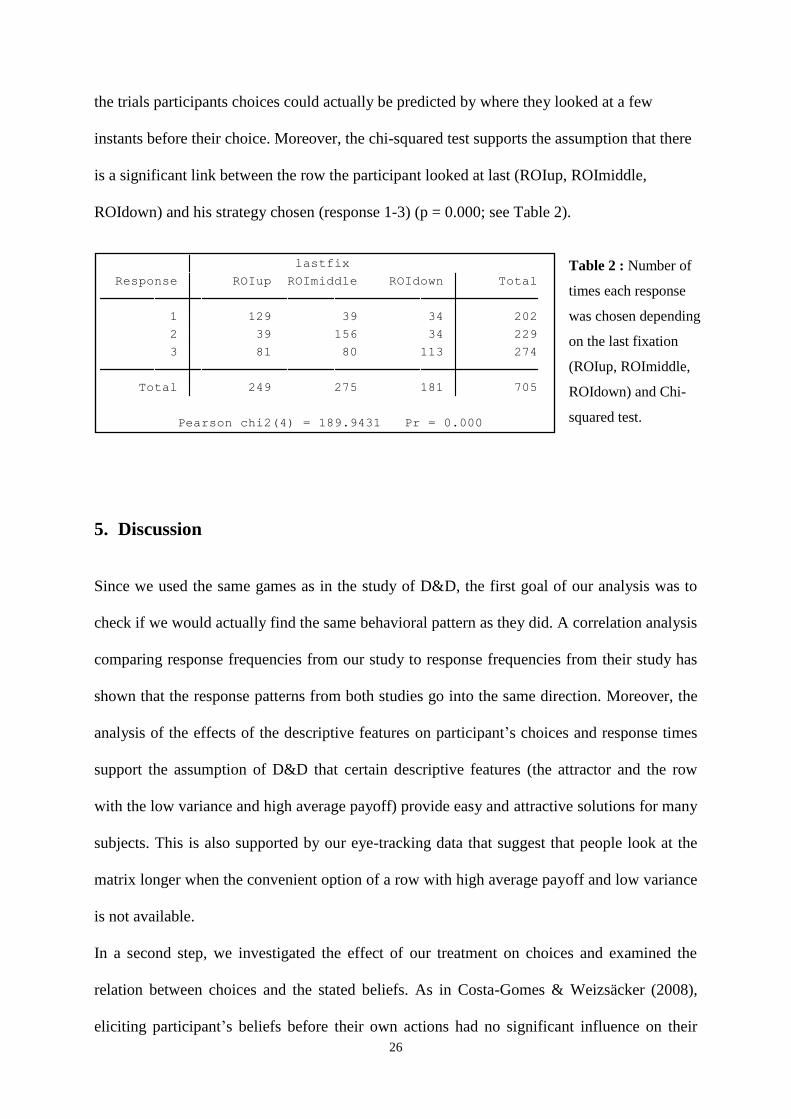
26
the trials participants choices could actually be predicted by where they looked at a few
instants before their choice. Moreover, the chi-squared test supports the assumption that there
is a significant link between the row the participant looked at last (ROIup, ROImiddle,
ROIdown) and his strategy chosen (response 1-3) (p = 0.000; see Table 2).
5. Discussion
Since we used the same games as in the study of D&D, the first goal of our analysis was to
check if we would actually find the same behavioral pattern as they did. A correlation analysis
comparing response frequencies from our study to response frequencies from their study has
shown that the response patterns from both studies go into the same direction. Moreover, the
analysis of the effects of the descriptive features on participant’s choices and response times
support the assumption of D&D that certain descriptive features (the attractor and the row
with the low variance and high average payoff) provide easy and attractive solutions for many
subjects. This is also supported by our eye-tracking data that suggest that people look at the
matrix longer when the convenient option of a row with high average payoff and low variance
is not available.
In a second step, we investigated the effect of our treatment on choices and examined the
relation between choices and the stated beliefs. As in Costa-Gomes & Weizsäcker (2008),
eliciting participant’s beliefs before their own actions had no significant influence on their
Pearson chi2(4) = 189.9431 Pr = 0.000
Total 249 275 181 705
3 81 80 113 274
2 39 156 34 229
1 129 39 34 202
Response ROIup ROImiddle ROIdown Total
lastfix Table 2 : Number of
times each response
was chosen depending
on the last fixation
(ROIup, ROImiddle,
ROIdown) and Chi-
squared test.
27
behavior. Furthermore, in line with previous studies, we found that people best respond to
their beliefs only in about half of the trials. This finding contradicts the assumption of the
Level-k and Quantal-Response-Model that subjects may have heterogeneous beliefs but best-
respond to those beliefs. In contrast to Costa-Gomes & Weizsäcker (2008), we found that
participants in our study best-responded more often when beliefs were elicited after their own
choice (SSO) than when they were elicited before their own choice (OSS). One possible
explanation could be that, when people have already chosen strategies for themselves, they
will subsequently form beliefs that justify their previous actions.
Analyzing our eye-tracking data (the proportion of hits to each ROI), we found, similar to
previous studies, that participants do not pay equal attention to all information available (the
bottom row of the matrix, for example, received on average very little attention) and that
people’s choices are linked to where they look at last. We also found that, in total, our
participants looked significantly more often at their own payoff compared to the opponent’s
payoff indicating the presence of an own-payoff bias. Looking at each block separately,
however, this bias could only be found directly after belief elicitation (in S2 of OSS). This
finding actually corresponds to the finding that people best-respond less often to their beliefs
in the OSS condition.
However, this finding seems also to contradict one of our main hypotheses that people would
pay more attention to the opponent’s payoffs after they are sensitized for his potential
strategies (after they had to form beliefs about the opponent’s behavior). Since our two
treatment groups contain a significant different number of people with game theory
experience (3 in OSS, and 6 in SSO), we tested the hypothesis again for people with and
without game theory experience separately. For people with game theory experience, eliciting
beliefs before the action didn’t have an effect on the proportion they looked to the opponent’s
payoff. Participants without game theory experience, however, were found to look even more
often to their own payoff after belief elicitation than before belief elicitation. Due to our small
28
sample size it is not clear, though, how reliable these results are: We already only have 10
participants per group before separating them into subjects with and without game theory
experience. Looking at those two types of participants makes the sample even smaller.
Moreover, our two treatment groups differ in characteristics that we haven’t controlled for but
that might have an influence on their behavior and search pattern, such as gender and
education level. Therefore, the results have to be treated with caution
Furthermore, we examined in our study people’s information search pattern when they are
asked to form beliefs about the other player’s behavior – something that has never been
studied before, as far as we know. In line with our hypothesis, our results suggest that
participants pay mainly attention to the opponent’s payoff when guessing his behavior and
much less attention to their own payoffs (the opponent of their opponent). Moreover,
participants took on average less time to state their beliefs than to choose an action for
themselves. These results suggest that subjects think much less strategically when asked to
form beliefs about others. It seems that when asked to guess the opponent’s choice, people
somehow “forget” that the other player also faces a strategic decision.
Finally, we compared the look-up patterns of relatively rational acting subjects (subjects who
best respond to their own stated beliefs in more than half of the trials) to less rational subjects
(who best-respond to their own stated beliefs in less than half of the cases). We found that
people who best-respond more often also look more often at the other players payoff and that
they also take more into account their own payoff when they have to guess the opponents
choice. It therefore seems that the reason why some people fail to best-respond to their beliefs
is that they don’t take enough into account the other player’s option or that they don’t even
form beliefs about the other one when choosing a strategy for themselves (and not because
they are not able to derive the best-response from their beliefs, for example).
29
6. Conclusion
The goal of our study was to better understand how people make strategic decisions and how
they process information in such situations. More specifically, we analyzed the influence of
belief elicitation on people’s behavior and information search in normal-form games. Our
main hypotheses were that 1) people will pay more attention to the opponents’ payoffs after
they had to guess their behavior (compared to a situation where they weren’t asked to guess
the opponent’s behavior before their own action), and 2) that when forming beliefs about the
other players behavior, people will analyze the game only partially and mainly focus on the
payoff of the opponent. Moreover, we expected to be able to replicate findings from previous
studies on belief elicitation and information search in strategic games.
Overall, our results support the assumption that people often don’t act strategically: They do
not only fail to best-respond to their own stated beliefs in about half of the times; some of
them also don’t take enough into account the other player’s options. It rather seems that
people tend found their decisions on heuristics based on special features of the matrix that
provide attractive and easy solutions. When asked to form beliefs about the other player’s
behavior, subjects seem to reason even less strategically: they take less time to respond and
display an even stronger one-sided information search pattern compared to when choosing for
themselves, supporting our second hypotheses. It seems that when asked to guess the
opponent’s choice, people somehow “forget” that the other player also faces a strategic
decision. Future studies could further analyze this issue and look for potential explanations for
this finding.
Contrary to our first hypothesis, when beliefs were elicited before the subject chose his own
strategies, participants displayed an own-payoff bias. However, this finding may be due to our
small sample size. Moreover, participant’s actions were more often consistent with their
stated beliefs when beliefs were elicited after their own actions (and not before). Since this is
30
not in line with the findings from Costa-Gomes & Weizsäcker (2008), future research could
further investigate the effect of the order of belief elicitation on the probability of best-
responding to one’s own stated beliefs.
Due to time issues, we were only able to extract from the eye-tracking data the number of hits
to each ROI. Further analysis of our data would include the number of fixations to each ROI
and the transitions from one ROI to another. Fixations differ from hits in a way that hits just
sum up all the times the gaze has fallen into the ROI, whereas fixation means that the eye has
fixed a target for a certain time (longer than 100ms). With this information it would be easier
to differentiate between unconscious and conscious fixations. Transitions would shed more
light on how the matrix is analyzed: row by row, column by column, comparing payoffs of
one cell to each other, or with a more complex search pattern.
Using this information (fixations and transitions) and replicating the study with a bigger
subject pool could help to further understand whether belief elicitation has an influence on our
information search and how we analyze the decision problem when we are asked to guess
what the other person will do. It could also be interesting to look at these questions when
beliefs are elicited directly before one’s own choices. Furthermore, it would be useful to only
take into account subjects without experience in game theory as the behavior of people with
and without experience with such games is likely to differ a lot (as also seen in our study).
31
References
Bhatt, M., & Camerer, C. F. (2005). Self-referential thinking and equilibrium as states of
mind in games: fMRI evidence. Games and Economic Behavior, 52(2), 424‑459.
doi:10.1016/j.geb.2005.03.007
Camerer, C. F., Ho, T.-H., & Chong, J.-K. (2004). A Cognitive Hierarchy Model of Games.
The Quarterly Journal of Economics, 119(3), 861‑898.
doi:10.1162/0033553041502225
Costa-Gomes, M. A., & Weizsäcker, G. (2008). Stated Beliefs and Play in Normal-Form
Games. The Review of Economic Studies, 75(3), 729‑762. doi:10.1111/j.1467-
937X.2008.00498.x
Costa-Gomes, M., Crawford, V. P., & Broseta, B. (2001). Cognition and Behavior in Normal-
Form Games: An Experimental Study. Econometrica, 69(5), 1193‑1235.
doi:10.1111/1468-0262.00239
Devetag, G., & Di Guida, S. (2010). Feature-based Choice and Similarity in Normal-form
Games: An Experimental Study (Departmental Technical Report). Trento: Università
degli Studi di Trento. Consulté à l’adresse http://www.unitn.it/disa/10528/working-
papers-anno-2010
Devetag, G., Di Guida, S., & Polonio, L. (2013). An eye-tracking study of feature-based
choice in one-shot games (No. 2013/05). LEM Working Paper Series. Consulté à
l’adresse http://www.econstor.eu/handle/10419/89336
Devetag, G., Guida, S. D., & Polonio, L. (2013). An Eye-Tracking Study of Feature-Based
Choice in One-Shot Games, 53 p.
Fiedler, S., Glöckner, A., Nicklisch, A., & Dickert, S. (2013). Social Value Orientation and
information search in social dilemmas: An eye-tracking analysis. Organizational
32
Behavior and Human Decision Processes, 120(2), 272‑284.
doi:10.1016/j.obhdp.2012.07.002
Hristova, E., & Grinberg, M. (2005). Information acquisition in the iterated prisoner’s
dilemma game: An eye-tracking study. In Proceedings of the 27th Annual Conference
of the Cognitive Science Society (p. 983–988). Consulté à l’adresse
http://csjarchive.cogsci.rpi.edu/proceedings/2005/docs/p983.pdf
Johnson, E. J., Camerer, C., Sen, S., & Rymon, T. (2002). Detecting Failures of Backward
Induction: Monitoring Information Search in Sequential Bargaining. Journal of
Economic Theory, 104(1), 16‑47. doi:10.1006/jeth.2001.2850
Mckelvey, R. D., & Palfrey, T. R. (1998). Quantal response equilibria for extensive form
games. Experimental Economics, 1(1), 9‑41. doi:10.1007/BF01426213
McKelvey, R. D., & Palfrey, T. R. (1995). Quantal Response Equilibria for Normal Form
Games. Games and Economic Behavior, 10(1), 6‑38. doi:10.1006/game.1995.1023
Meijering, B., van Rijn, H., Taatgen, N. A., & Verbrugge, R. (2012). What Eye Movements
Can Tell about Theory of Mind in a Strategic Game. PLoS ONE, 7(9), e45961.
doi:10.1371/journal.pone.0045961
Rydval, O., Ortmann, A., & Ostatnicky, M. (2008). Three Very Simple Games and What It
Takes to Solve Them (CERGE-EI Working Paper No. wp347). The Center for
Economic Research and Graduate Education - Economic Institute, Prague. Consulté à
l’adresse http://ideas.repec.org/p/cer/papers/wp347.html
Sutter, M., Czermak, S., & Feri, F. (2010). Strategic Sophistication of Individuals and Teams
in Experimental Normal-Form Games (SSRN Scholarly Paper No. ID 1549208).
Rochester, NY: Social Science Research Network. Consulté à l’adresse
http://papers.ssrn.com/abstract=1549208
33
Tanida, S., & Yamagishi, T. (2010). Testing Social Preferences Through Differential
Attention to Own and Partner’s Payoff in a Prisoner’s Dilemma Game. Letters on
Evolutionary Behavioral Science, 1(2), 31‑34. doi:10.5178/lebs.2010.8
Wang, J. T., Spezio, M., & Camerer, C. F. (2010). Pinocchio’s Pupil: Using Eyetracking and
Pupil Dilation to Understand Truth Telling and Deception in Sender-Receiver Games.
The American Economic Review, 100(3), 984‑1007. doi:10.1257/aer.100.3.984
34
Annex
Table 3: Probit regression of best-responses to beliefs
● best_resp: binary variable that equals one if the response was a best response to the stated belief, and 0
otherwise
● group: equals 1 if the condition was SSO, 1 if it was OSS
● S_repeated: equals 1 if the block was the second S block in each group, so S2 in SSO and S3 in OSS,
and equals 0 if the block was either S1 in SSO or S2 in OSS
● RT: the response time for each trial
● GT: equals one if the subject reported to have experience in game theory, 0 otherwise
● EDU: categorical variable of the education level, ranging from 4 to 7
● FEMALE: dummy for gender, equals one if subject was female, 0 if male), AGE (age of the subject
● MatrixID: one dummy for each matrix in order to control for repeated measures
_cons .0522971 .2928366 0.18 0.858 -.5216521 .6262462
16 -.0429727 .1823657 -0.24 0.814 -.4004029 .3144576
15 .2518542 .1832665 1.37 0.169 -.1073415 .6110499
14 .3815932 .1869534 2.04 0.041 .0151712 .7480151
13 .3887786 .1845911 2.11 0.035 .0269868 .7505705
12 -.2092971 .1810318 -1.16 0.248 -.5641129 .1455188
11 -.4889861 .1832241 -2.67 0.008 -.8480987 -.1298735
10 .0374266 .1813609 0.21 0.837 -.3180342 .3928873
9 -.1561465 .1805396 -0.86 0.387 -.5099976 .1977045
8 -.3756801 .1826792 -2.06 0.040 -.7337248 -.0176354
7 -.253027 .1814089 -1.39 0.163 -.6085819 .102528
6 -.1419939 .1809579 -0.78 0.433 -.4966649 .2126771
5 -.2383245 .1804148 -1.32 0.187 -.591931 .115282
4 -.0227941 .181708 -0.13 0.900 -.3789353 .3333471
3 -.0625002 .1811473 -0.35 0.730 -.4175423 .2925419
2 -.0615136 .1808416 -0.34 0.734 -.4159566 .2929294
MatrixID
EDU -.006149 .045799 -0.13 0.893 -.0959134 .0836154
GT .0762658 .0728475 1.05 0.295 -.0665127 .2190443
RT .0050689 .0029457 1.72 0.085 -.0007046 .0108424
FEMALE -.1352728 .0715579 -1.89 0.059 -.2755237 .0049781
AGE -.006165 .0090084 -0.68 0.494 -.0238212 .0114913
group .3660439 .071836 5.10 0.000 .225248 .5068398
S_repeated .0534945 .0647392 0.83 0.409 -.0733921 .1803811
best_resp Coef. Std. Err. z P>|z| [95% Conf. Interval]
Log likelihood = -1036.7394 Pseudo R2 = 0.0449
Prob > chi2 = 0.0000
LR chi2(22) = 97.45
Probit regression Number of obs = 1568
35
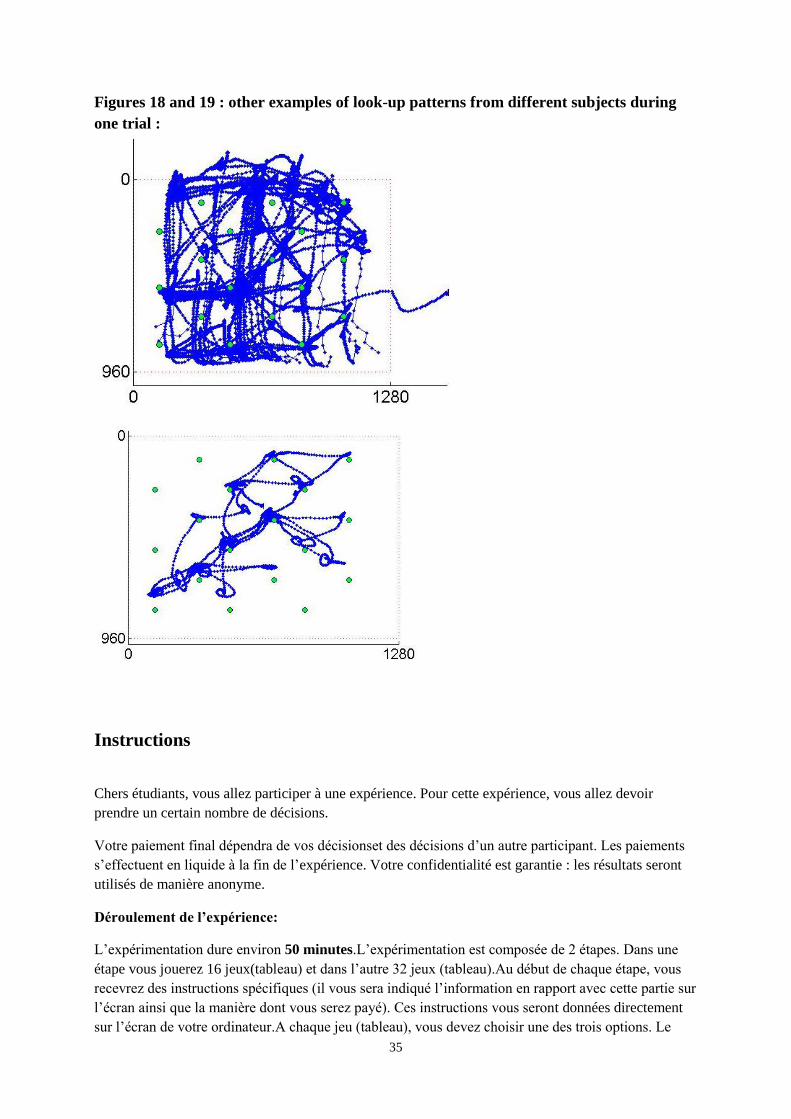
Figures 18 and 19 : other examples of look-up patterns from different subjects during
one trial :
Instructions
Chers étudiants, vous allez participer à une expérience. Pour cette expérience, vous allez devoir
prendre un certain nombre de décisions.
Votre paiement final dépendra de vos décisionset des décisions d’un autre participant. Les paiements
s’effectuent en liquide à la fin de l’expérience. Votre confidentialité est garantie : les résultats seront
utilisés de manière anonyme.
Déroulement de l’expérience:
L’expérimentation dure environ 50 minutes.L’expérimentation est composée de 2 étapes. Dans une
étape vous jouerez 16 jeux(tableau) et dans l’autre 32 jeux (tableau).Au début de chaque étape, vous
recevrez des instructions spécifiques (il vous sera indiqué l’information en rapport avec cette partie sur
l’écran ainsi que la manière dont vous serez payé). Ces instructions vous seront données directement
sur l’écran de votre ordinateur.A chaque jeu (tableau), vous devez choisir une des trois options. Le
36
résultat de votre décision sera déterminé par votre choix et le choix d’un autre participant qui sera
sélectionné au hasard à la fin de l’expérience.
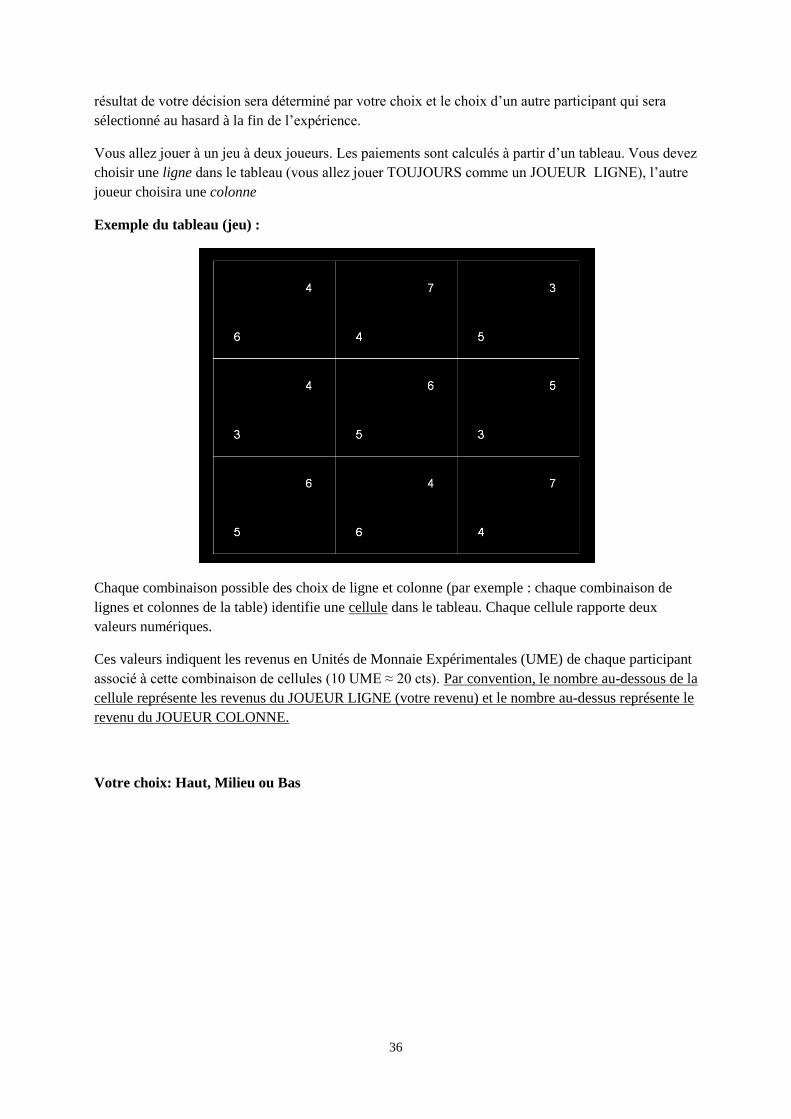
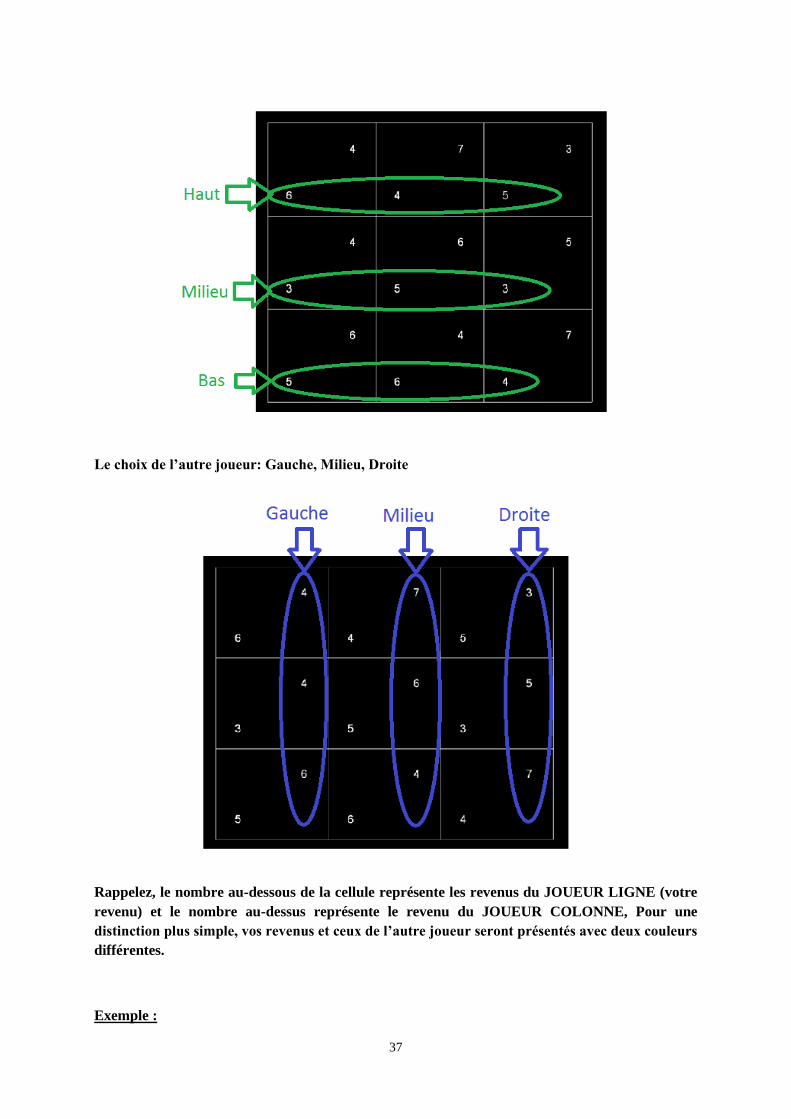
Vous allez jouer à un jeu à deux joueurs. Les paiements sont calculés à partir d’un tableau. Vous devez
choisir une ligne dans le tableau (vous allez jouer TOUJOURS comme un JOUEUR LIGNE), l’autre
joueur choisira une colonne
Exemple du tableau (jeu) :
Chaque combinaison possible des choix de ligne et colonne (par exemple : chaque combinaison de
lignes et colonnes de la table) identifie une cellule dans le tableau. Chaque cellule rapporte deux
valeurs numériques.
Ces valeurs indiquent les revenus en Unités de Monnaie Expérimentales (UME) de chaque participant
associé à cette combinaison de cellules (10 UME ≈ 20 cts). Par convention, le nombre au-dessous de la
cellule représente les revenus du JOUEUR LIGNE (votre revenu) et le nombre au-dessus représente le
revenu du JOUEUR COLONNE.
Votre choix: Haut, Milieu ou Bas
37
Le choix de l’autre joueur: Gauche, Milieu, Droite
Rappelez, le nombre au-dessous de la cellule représente les revenus du JOUEUR LIGNE (votre
revenu) et le nombre au-dessus représente le revenu du JOUEUR COLONNE, Pour une
distinction plus simple, vos revenus et ceux de l’autre joueur seront présentés avec deux couleurs
différentes.
Exemple :
38
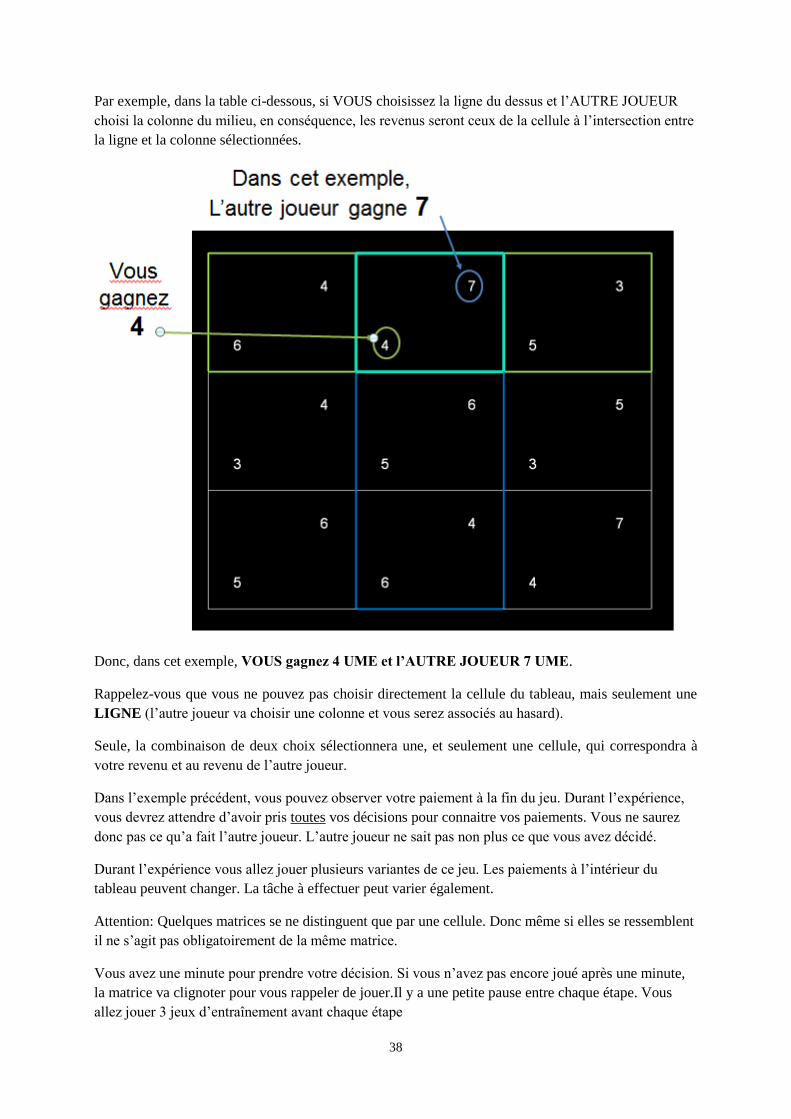
Par exemple, dans la table ci-dessous, si VOUS choisissez la ligne du dessus et l’AUTRE JOUEUR
choisi la colonne du milieu, en conséquence, les revenus seront ceux de la cellule à l’intersection entre
la ligne et la colonne sélectionnées.
Donc, dans cet exemple, VOUS gagnez 4 UME et l’AUTRE JOUEUR 7 UME.
Rappelez-vous que vous ne pouvez pas choisir directement la cellule du tableau, mais seulement une
LIGNE (l’autre joueur va choisir une colonne et vous serez associés au hasard).
Seule, la combinaison de deux choix sélectionnera une, et seulement une cellule, qui correspondra à
votre revenu et au revenu de l’autre joueur.
Dans l’exemple précédent, vous pouvez observer votre paiement à la fin du jeu. Durant l’expérience,
vous devrez attendre d’avoir pris toutes vos décisions pour connaitre vos paiements. Vous ne saurez
donc pas ce qu’a fait l’autre joueur. L’autre joueur ne sait pas non plus ce que vous avez décidé.
Durant l’expérience vous allez jouer plusieurs variantes de ce jeu. Les paiements à l’intérieur du
tableau peuvent changer. La tâche à effectuer peut varier également.
Attention: Quelques matrices se ne distinguent que par une cellule. Donc même si elles se ressemblent
il ne s’agit pas obligatoirement de la même matrice.
Vous avez une minute pour prendre votre décision. Si vous n’avez pas encore joué après une minute,
la matrice va clignoter pour vous rappeler de jouer.Il y a une petite pause entre chaque étape. Vous
allez jouer 3 jeux d’entraînement avant chaque étape

39
Avant commencer l’expérience, on vous demande de répondre à un petit questionnaire
Paiements :
Le gain final est la somme de votre gain dans chacune des deux étapes.
Vous pouvez gagner entre 5€ et 20€.
Avant chaque étape, vous recevrez des informations détaillées sur la manière dont vous serez
payé dans cette partie.
Les autres participants ne seront pas informés de vos revenus.


![elicitation mechanism 7-11-2018subjective probabilities and might find that they can only provide an interval.” [Wikipedia, Imprecise probability]). 2 The term “second-order belief”](https://img.pdfslide.net/doc/110x75/5f94f04434675848b463e7bb/elicitation-mechanism-7-11-2018-subjective-probabilities-and-might-ind-that-they.jpg)