Embed Size (px)
Citation preview
8/14/2019 BELL COUNTY - Academy ISD - 2007 Texas School Survey of Drug and Alcohol Use
http://slidepdf.com/reader/full/bell-county-academy-isd-2007-texas-school-survey-of-drug-and-alcohol-use 1/72
Academy
Spring 2007
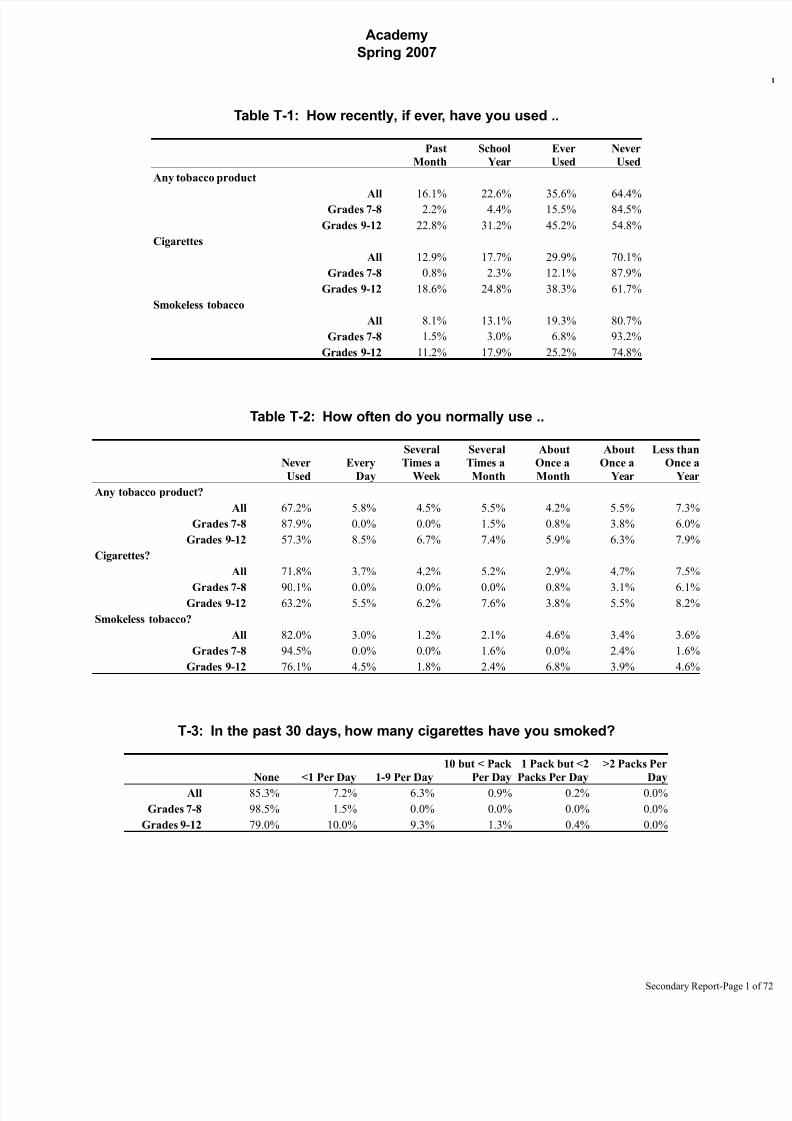
Table T-1: How recently, if ever, have you used ..
Past
Month
School
Year
Ever
Used
Never
Used
Any tobacco product
All 16.1% 22.6% 35.6% 64.4%Grades 7-8 2.2% 4.4% 15.5% 84.5%
Grades 9-12 22.8% 31.2% 45.2% 54.8%
Cigarettes
All 12.9% 17.7% 29.9% 70.1%
Grades 7-8 0.8% 2.3% 12.1% 87.9%
Grades 9-12 18.6% 24.8% 38.3% 61.7%
Smokeless tobacco
All 8.1% 13.1% 19.3% 80.7%
Grades 7-8 1.5% 3.0% 6.8% 93.2%
Grades 9-12 11.2% 17.9% 25.2% 74.8%
Table T-2: How often do you normally use ..
Never
Used
Every
Day
Several
Times a
Week
Several
Times a
Month
About
Once a
Month
About
Once a
Year
Less than
Once a
Year
Any tobacco product?
All 67.2% 5.8% 4.5% 5.5% 4.2% 5.5% 7.3%
Grades 7-8 87.9% 0.0% 0.0% 1.5% 0.8% 3.8% 6.0%
Grades 9-12 57.3% 8.5% 6.7% 7.4% 5.9% 6.3% 7.9%
Cigarettes?
All 71.8% 3.7% 4.2% 5.2% 2.9% 4.7% 7.5%
Grades 7-8 90.1% 0.0% 0.0% 0.0% 0.8% 3.1% 6.1%Grades 9-12 63.2% 5.5% 6.2% 7.6% 3.8% 5.5% 8.2%
Smokeless tobacco?
All 82.0% 3.0% 1.2% 2.1% 4.6% 3.4% 3.6%
Grades 7-8 94.5% 0.0% 0.0% 1.6% 0.0% 2.4% 1.6%
Grades 9-12 76.1% 4.5% 1.8% 2.4% 6.8% 3.9% 4.6%
T-3: In the past 30 days, how many cigarettes have you smoked?
None <1 Per Day 1-9 Per Day
10 but < Pack
Per Day
1 Pack but <2
Packs Per Day
>2 Packs Per
Day
All 85.3% 7.2% 6.3% 0.9% 0.2% 0.0%
Grades 7-8 98.5% 1.5% 0.0% 0.0% 0.0% 0.0%
Grades 9-12 79.0% 10.0% 9.3% 1.3% 0.4% 0.0%
Secondary Report-Page
8/14/2019 BELL COUNTY - Academy ISD - 2007 Texas School Survey of Drug and Alcohol Use
http://slidepdf.com/reader/full/bell-county-academy-isd-2007-texas-school-survey-of-drug-and-alcohol-use 2/72
Academy
Spring 2007
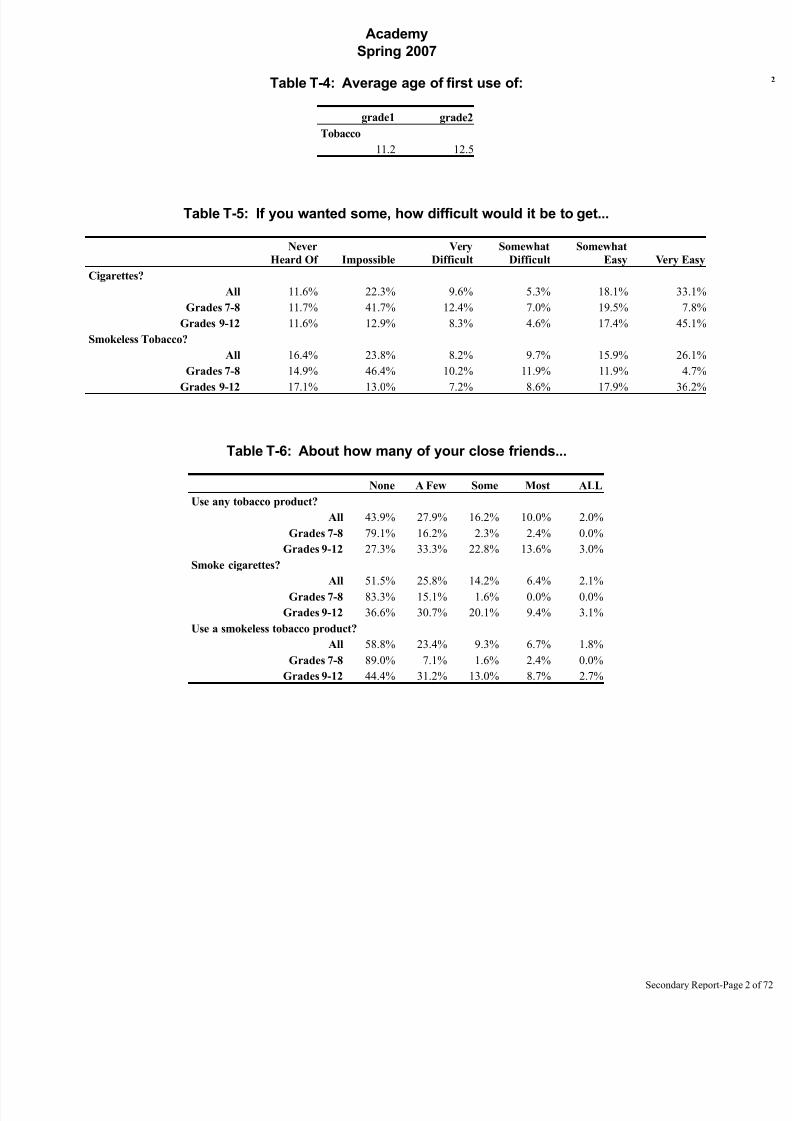
Table T-4: Average age of first use of:
grade1 grade2
Tobacco
11.2 12.5
Table T-5: If you wanted some, how difficult would it be to get...
Never
Heard Of Impossible
Very
Difficult
Somewhat
Difficult
Somewhat
Easy Very Easy
Cigarettes?
All 11.6% 22.3% 9.6% 5.3% 18.1% 33.1%
Grades 7-8 11.7% 41.7% 12.4% 7.0% 19.5% 7.8%
Grades 9-12 11.6% 12.9% 8.3% 4.6% 17.4% 45.1%
Smokeless Tobacco?
All 16.4% 23.8% 8.2% 9.7% 15.9% 26.1%
Grades 7-8 14.9% 46.4% 10.2% 11.9% 11.9% 4.7%
Grades 9-12 17.1% 13.0% 7.2% 8.6% 17.9% 36.2%
Table T-6: About how many of your close friends...
None A Few Some Most ALL
Use any tobacco product?
All 43.9% 27.9% 16.2% 10.0% 2.0%
Grades 7-8 79.1% 16.2% 2.3% 2.4% 0.0%
Grades 9-12 27.3% 33.3% 22.8% 13.6% 3.0%
Smoke cigarettes?
All 51.5% 25.8% 14.2% 6.4% 2.1%
Grades 7-8 83.3% 15.1% 1.6% 0.0% 0.0%
Grades 9-12 36.6% 30.7% 20.1% 9.4% 3.1%
Use a smokeless tobacco product?
All 58.8% 23.4% 9.3% 6.7% 1.8%
Grades 7-8 89.0% 7.1% 1.6% 2.4% 0.0%
Grades 9-12 44.4% 31.2% 13.0% 8.7% 2.7%
Secondary Report-Page
8/14/2019 BELL COUNTY - Academy ISD - 2007 Texas School Survey of Drug and Alcohol Use
http://slidepdf.com/reader/full/bell-county-academy-isd-2007-texas-school-survey-of-drug-and-alcohol-use 3/72
Academy
Spring 2007
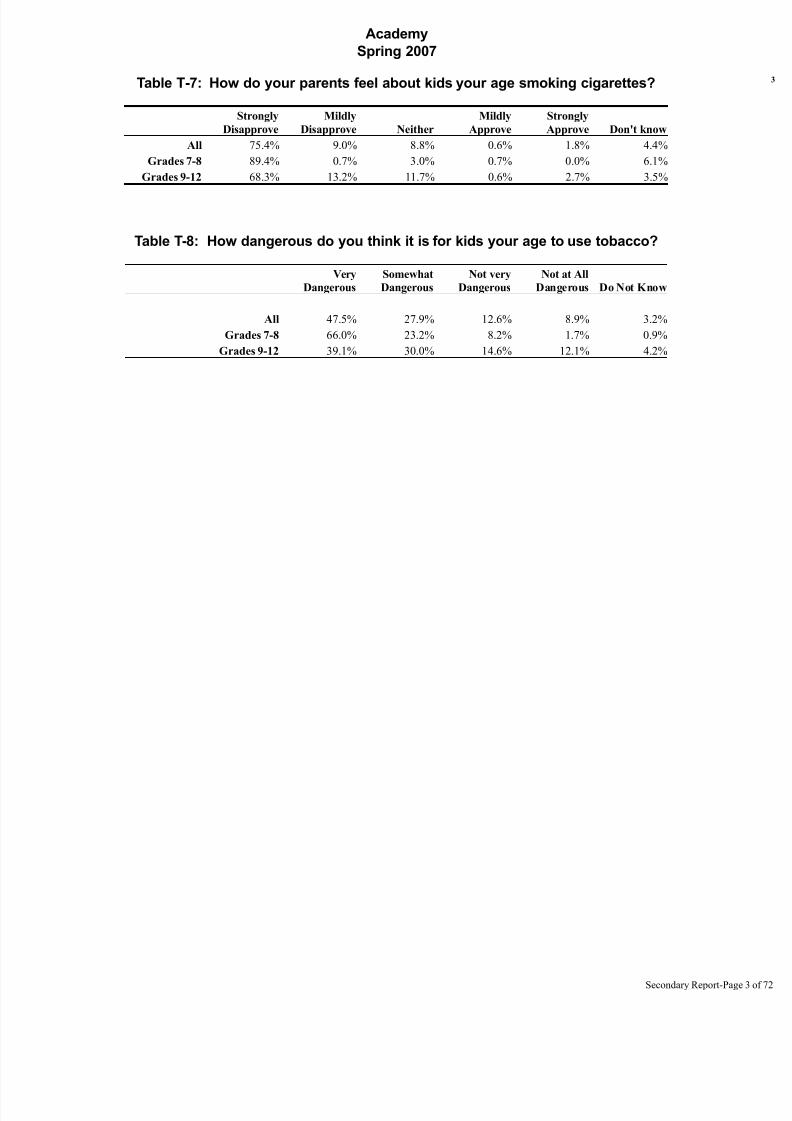
Table T-7: How do your parents feel about kids your age smoking cigarettes?
Strongly
Disapprove
Mildly
Disapprove Neither
Mildly
Approve
Strongly
Approve Don't know
All 75.4% 9.0% 8.8% 0.6% 1.8% 4.4%
Grades 7-8 89.4% 0.7% 3.0% 0.7% 0.0% 6.1%
Grades 9-12 68.3% 13.2% 11.7% 0.6% 2.7% 3.5%
Table T-8: How dangerous do you think it is for kids your age to use tobacco?
Very
Dangerous
Somewhat
Dangerous
Not very
Dangerous
Not at All
Dangerous Do Not Know
All 47.5% 27.9% 12.6% 8.9% 3.2%
Grades 7-8 66.0% 23.2% 8.2% 1.7% 0.9%
Grades 9-12 39.1% 30.0% 14.6% 12.1% 4.2%
Secondary Report-Page
8/14/2019 BELL COUNTY - Academy ISD - 2007 Texas School Survey of Drug and Alcohol Use
http://slidepdf.com/reader/full/bell-county-academy-isd-2007-texas-school-survey-of-drug-and-alcohol-use 4/72
Academy
Spring 2007
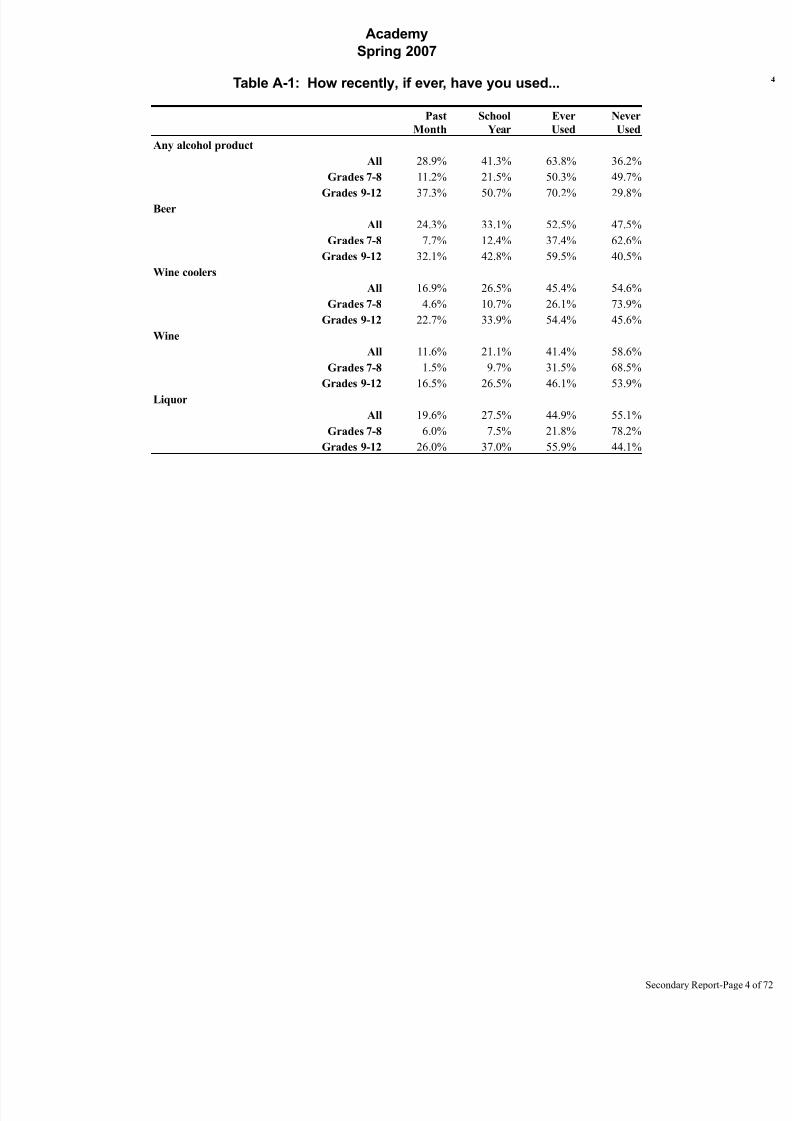
Table A-1: How recently, if ever, have you used...
Past
Month
School
Year
Ever
Used
Never
Used
Any alcohol product
All 28.9% 41.3% 63.8% 36.2%
Grades 7-8 11.2% 21.5% 50.3% 49.7%
Grades 9-12 37.3% 50.7% 70.2% 29.8%Beer
All 24.3% 33.1% 52.5% 47.5%
Grades 7-8 7.7% 12.4% 37.4% 62.6%
Grades 9-12 32.1% 42.8% 59.5% 40.5%
Wine coolers
All 16.9% 26.5% 45.4% 54.6%
Grades 7-8 4.6% 10.7% 26.1% 73.9%
Grades 9-12 22.7% 33.9% 54.4% 45.6%
Wine
All 11.6% 21.1% 41.4% 58.6%
Grades 7-8 1.5% 9.7% 31.5% 68.5%
Grades 9-12 16.5% 26.5% 46.1% 53.9%
Liquor
All 19.6% 27.5% 44.9% 55.1%
Grades 7-8 6.0% 7.5% 21.8% 78.2%
Grades 9-12 26.0% 37.0% 55.9% 44.1%
Secondary Report-Page
8/14/2019 BELL COUNTY - Academy ISD - 2007 Texas School Survey of Drug and Alcohol Use
http://slidepdf.com/reader/full/bell-county-academy-isd-2007-texas-school-survey-of-drug-and-alcohol-use 5/72
Academy
Spring 2007
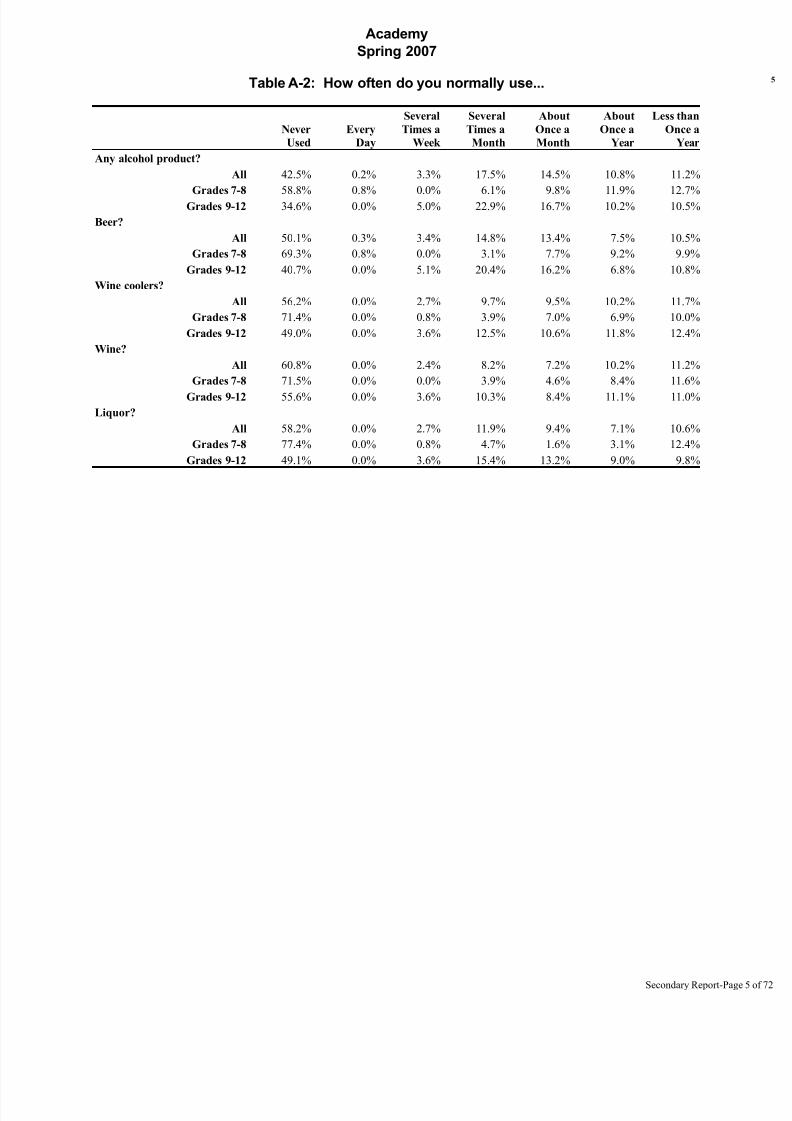
Table A-2: How often do you normally use...
Never
Used
Every
Day
Several
Times a
Week
Several
Times a
Month
About
Once a
Month
About
Once a
Year
Less than
Once a
Year
Any alcohol product?
All 42.5% 0.2% 3.3% 17.5% 14.5% 10.8% 11.2%
Grades 7-8 58.8% 0.8% 0.0% 6.1% 9.8% 11.9% 12.7%Grades 9-12 34.6% 0.0% 5.0% 22.9% 16.7% 10.2% 10.5%
Beer?
All 50.1% 0.3% 3.4% 14.8% 13.4% 7.5% 10.5%
Grades 7-8 69.3% 0.8% 0.0% 3.1% 7.7% 9.2% 9.9%
Grades 9-12 40.7% 0.0% 5.1% 20.4% 16.2% 6.8% 10.8%
Wine coolers?
All 56.2% 0.0% 2.7% 9.7% 9.5% 10.2% 11.7%
Grades 7-8 71.4% 0.0% 0.8% 3.9% 7.0% 6.9% 10.0%
Grades 9-12 49.0% 0.0% 3.6% 12.5% 10.6% 11.8% 12.4%
Wine?
All 60.8% 0.0% 2.4% 8.2% 7.2% 10.2% 11.2%
Grades 7-8 71.5% 0.0% 0.0% 3.9% 4.6% 8.4% 11.6%
Grades 9-12 55.6% 0.0% 3.6% 10.3% 8.4% 11.1% 11.0%
Liquor?
All 58.2% 0.0% 2.7% 11.9% 9.4% 7.1% 10.6%
Grades 7-8 77.4% 0.0% 0.8% 4.7% 1.6% 3.1% 12.4%
Grades 9-12 49.1% 0.0% 3.6% 15.4% 13.2% 9.0% 9.8%
Secondary Report-Page
8/14/2019 BELL COUNTY - Academy ISD - 2007 Texas School Survey of Drug and Alcohol Use
http://slidepdf.com/reader/full/bell-county-academy-isd-2007-texas-school-survey-of-drug-and-alcohol-use 6/72
Academy
Spring 2007
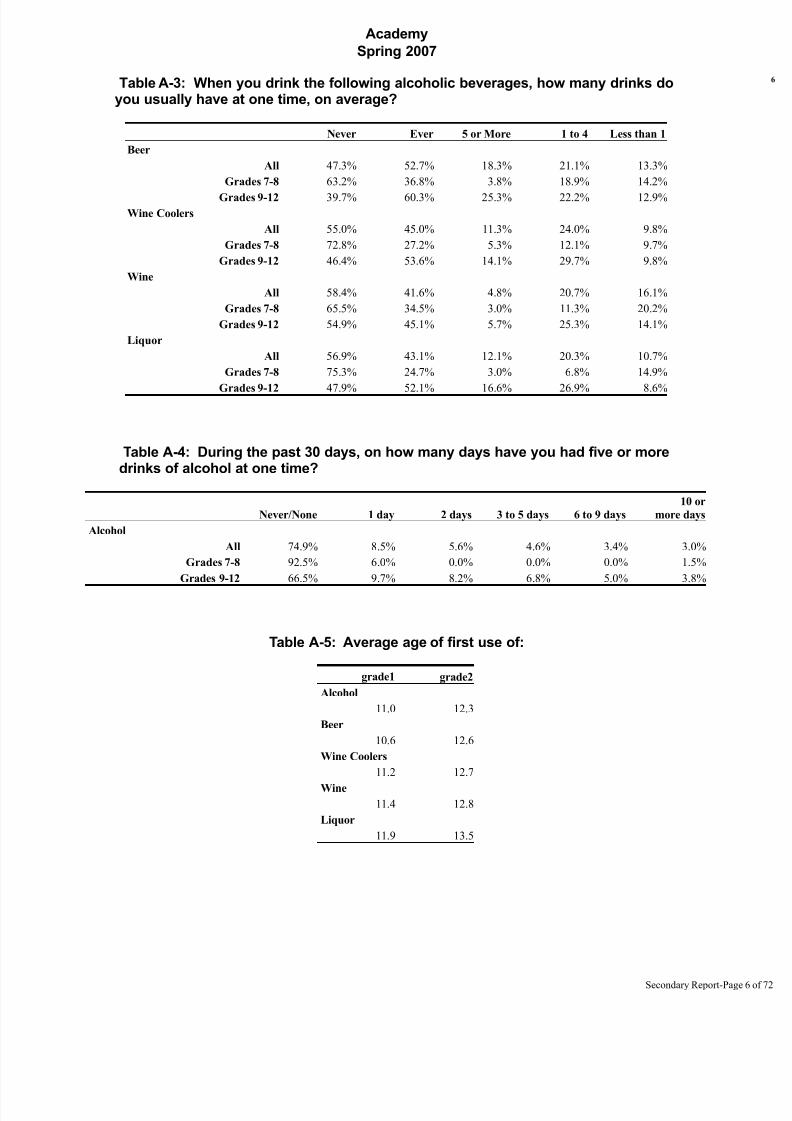
Table A-3: When you drink the following alcoholic beverages, how many drinks doyou usually have at one time, on average?
Never Ever 5 or More 1 to 4 Less than 1
Beer
All 47.3% 52.7% 18.3% 21.1% 13.3%
Grades 7-8 63.2% 36.8% 3.8% 18.9% 14.2%
Grades 9-12 39.7% 60.3% 25.3% 22.2% 12.9%Wine Coolers
All 55.0% 45.0% 11.3% 24.0% 9.8%
Grades 7-8 72.8% 27.2% 5.3% 12.1% 9.7%
Grades 9-12 46.4% 53.6% 14.1% 29.7% 9.8%
Wine
All 58.4% 41.6% 4.8% 20.7% 16.1%
Grades 7-8 65.5% 34.5% 3.0% 11.3% 20.2%
Grades 9-12 54.9% 45.1% 5.7% 25.3% 14.1%
Liquor
All 56.9% 43.1% 12.1% 20.3% 10.7%
Grades 7-8 75.3% 24.7% 3.0% 6.8% 14.9%
Grades 9-12 47.9% 52.1% 16.6% 26.9% 8.6%
Table A-4: During the past 30 days, on how many days have you had five or moredrinks of alcohol at one time?
Never/None 1 day 2 days 3 to 5 days 6 to 9 days
10 or
more days
Alcohol
All 74.9% 8.5% 5.6% 4.6% 3.4% 3.0%
Grades 7-8 92.5% 6.0% 0.0% 0.0% 0.0% 1.5%
Grades 9-12 66.5% 9.7% 8.2% 6.8% 5.0% 3.8%
Table A-5: Average age of first use of:
grade1 grade2
Alcohol
11.0 12.3
Beer
10.6 12.6
Wine Coolers
11.2 12.7
Wine
11.4 12.8
Liquor
11.9 13.5
Secondary Report-Page
8/14/2019 BELL COUNTY - Academy ISD - 2007 Texas School Survey of Drug and Alcohol Use
http://slidepdf.com/reader/full/bell-county-academy-isd-2007-texas-school-survey-of-drug-and-alcohol-use 7/72
Academy
Spring 2007
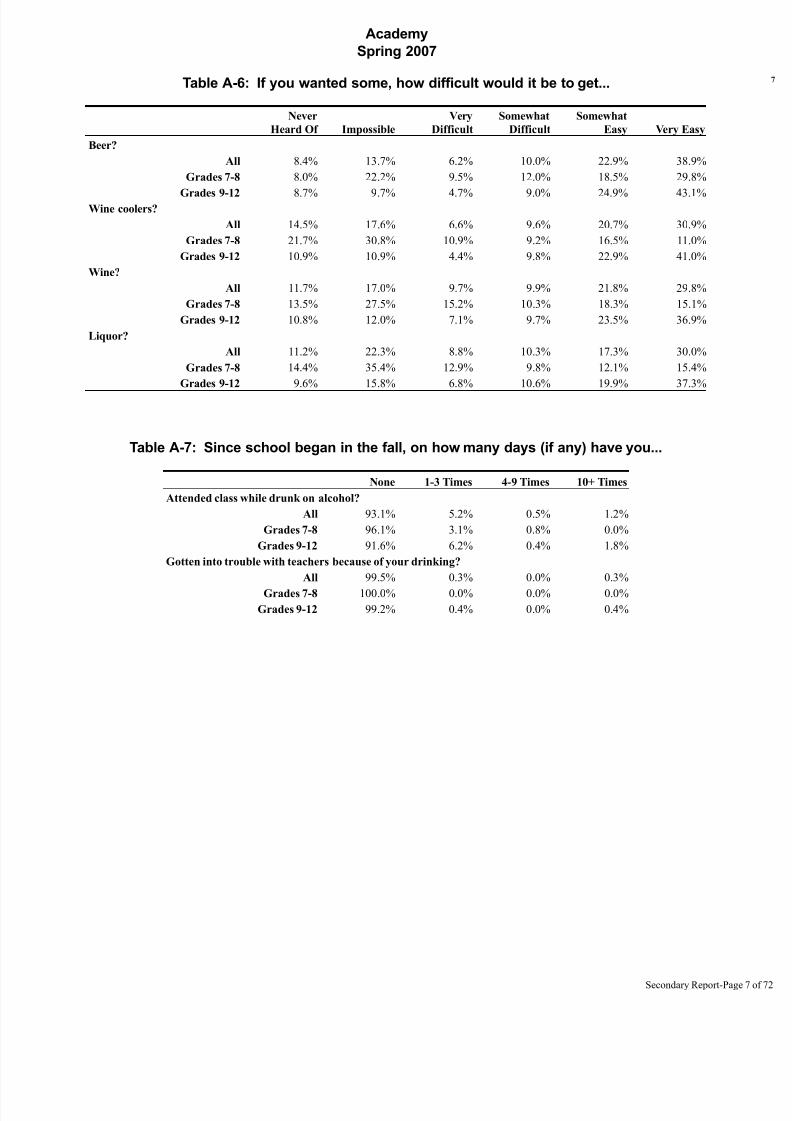
Table A-6: If you wanted some, how difficult would it be to get...
Never
Heard Of Impossible
Very
Difficult
Somewhat
Difficult
Somewhat
Easy Very Easy
Beer?
All 8.4% 13.7% 6.2% 10.0% 22.9% 38.9%
Grades 7-8 8.0% 22.2% 9.5% 12.0% 18.5% 29.8%
Grades 9-12 8.7% 9.7% 4.7% 9.0% 24.9% 43.1%Wine coolers?
All 14.5% 17.6% 6.6% 9.6% 20.7% 30.9%
Grades 7-8 21.7% 30.8% 10.9% 9.2% 16.5% 11.0%
Grades 9-12 10.9% 10.9% 4.4% 9.8% 22.9% 41.0%
Wine?
All 11.7% 17.0% 9.7% 9.9% 21.8% 29.8%
Grades 7-8 13.5% 27.5% 15.2% 10.3% 18.3% 15.1%
Grades 9-12 10.8% 12.0% 7.1% 9.7% 23.5% 36.9%
Liquor?
All 11.2% 22.3% 8.8% 10.3% 17.3% 30.0%
Grades 7-8 14.4% 35.4% 12.9% 9.8% 12.1% 15.4%
Grades 9-12 9.6% 15.8% 6.8% 10.6% 19.9% 37.3%
Table A-7: Since school began in the fall, on how many days (if any) have you...
None 1-3 Times 4-9 Times 10+ Times
Attended class while drunk on alcohol?
All 93.1% 5.2% 0.5% 1.2%
Grades 7-8 96.1% 3.1% 0.8% 0.0%
Grades 9-12 91.6% 6.2% 0.4% 1.8%
Gotten into trouble with teachers because of your drinking?
All 99.5% 0.3% 0.0% 0.3%
Grades 7-8 100.0% 0.0% 0.0% 0.0%
Grades 9-12 99.2% 0.4% 0.0% 0.4%
Secondary Report-Page
8/14/2019 BELL COUNTY - Academy ISD - 2007 Texas School Survey of Drug and Alcohol Use
http://slidepdf.com/reader/full/bell-county-academy-isd-2007-texas-school-survey-of-drug-and-alcohol-use 8/72
Academy
Spring 2007
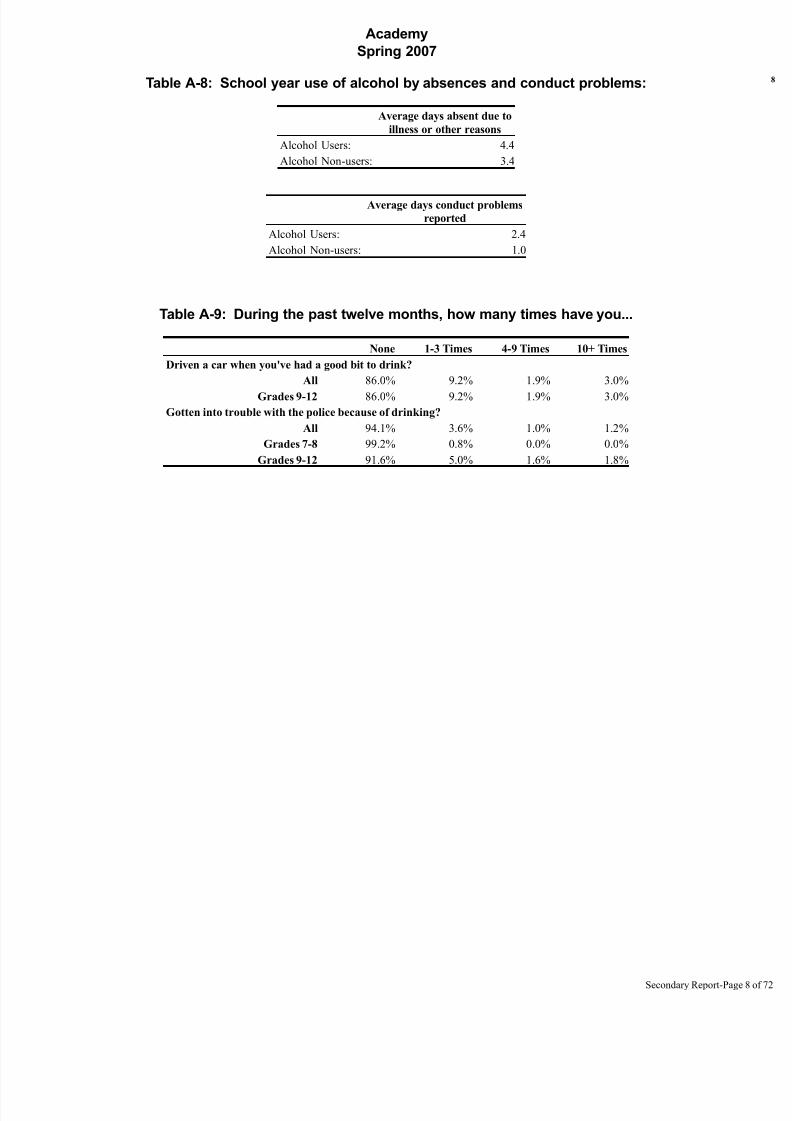
Table A-8: School year use of alcohol by absences and conduct problems:
Average days absent due to
illness or other reasons
Alcohol Users: 4.4
Alcohol Non-users: 3.4
Average days conduct problems
reported
Alcohol Users: 2.4
Alcohol Non-users: 1.0
Table A-9: During the past twelve months, how many times have you...
None 1-3 Times 4-9 Times 10+ Times
Driven a car when you've had a good bit to drink?
All 86.0% 9.2% 1.9% 3.0%
Grades 9-12 86.0% 9.2% 1.9% 3.0%
Gotten into trouble with the police because of drinking?
All 94.1% 3.6% 1.0% 1.2%
Grades 7-8 99.2% 0.8% 0.0% 0.0%
Grades 9-12 91.6% 5.0% 1.6% 1.8%
Secondary Report-Page
8/14/2019 BELL COUNTY - Academy ISD - 2007 Texas School Survey of Drug and Alcohol Use
http://slidepdf.com/reader/full/bell-county-academy-isd-2007-texas-school-survey-of-drug-and-alcohol-use 9/72
Academy
Spring 2007
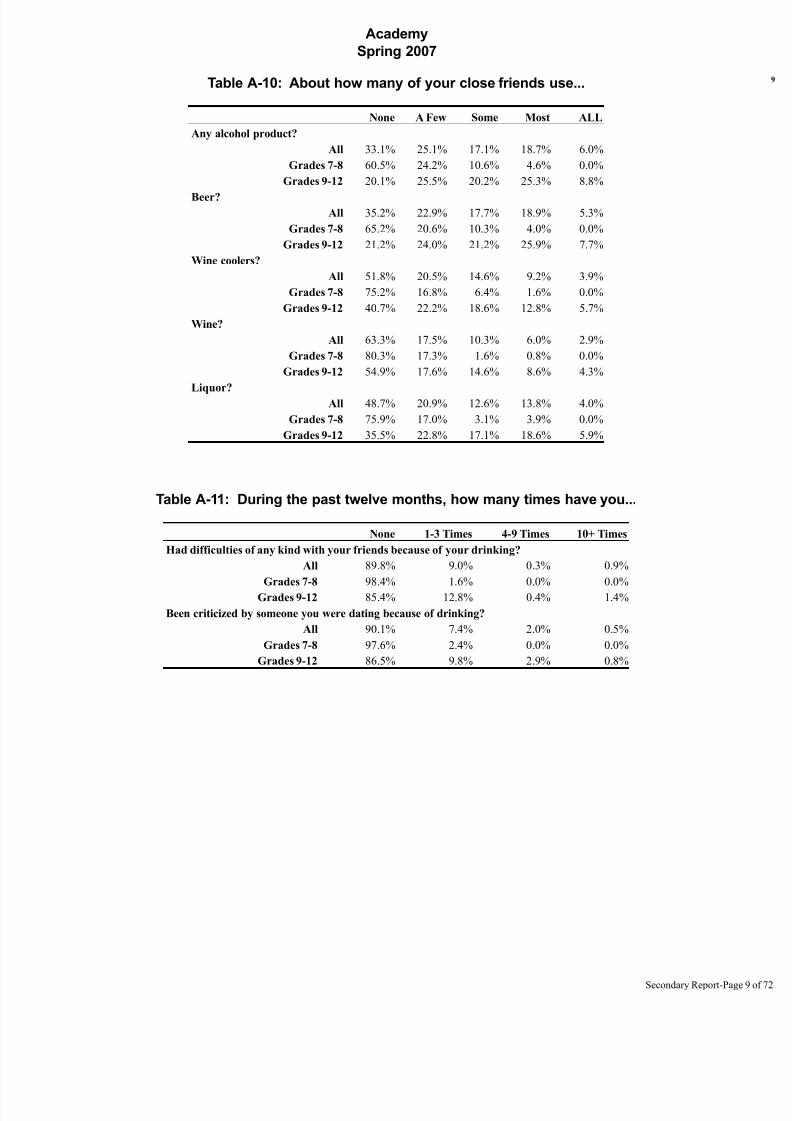
Table A-10: About how many of your close friends use...
None A Few Some Most ALL
Any alcohol product?
All 33.1% 25.1% 17.1% 18.7% 6.0%
Grades 7-8 60.5% 24.2% 10.6% 4.6% 0.0%
Grades 9-12 20.1% 25.5% 20.2% 25.3% 8.8%
Beer?All 35.2% 22.9% 17.7% 18.9% 5.3%
Grades 7-8 65.2% 20.6% 10.3% 4.0% 0.0%
Grades 9-12 21.2% 24.0% 21.2% 25.9% 7.7%
Wine coolers?
All 51.8% 20.5% 14.6% 9.2% 3.9%
Grades 7-8 75.2% 16.8% 6.4% 1.6% 0.0%
Grades 9-12 40.7% 22.2% 18.6% 12.8% 5.7%
Wine?
All 63.3% 17.5% 10.3% 6.0% 2.9%
Grades 7-8 80.3% 17.3% 1.6% 0.8% 0.0%
Grades 9-12 54.9% 17.6% 14.6% 8.6% 4.3%
Liquor?All 48.7% 20.9% 12.6% 13.8% 4.0%
Grades 7-8 75.9% 17.0% 3.1% 3.9% 0.0%
Grades 9-12 35.5% 22.8% 17.1% 18.6% 5.9%
Table A-11: During the past twelve months, how many times have you...
None 1-3 Times 4-9 Times 10+ Times
Had difficulties of any kind with your friends because of your drinking?
All 89.8% 9.0% 0.3% 0.9%
Grades 7-8 98.4% 1.6% 0.0% 0.0%
Grades 9-12 85.4% 12.8% 0.4% 1.4%
Been criticized by someone you were dating because of drinking?
All 90.1% 7.4% 2.0% 0.5%
Grades 7-8 97.6% 2.4% 0.0% 0.0%
Grades 9-12 86.5% 9.8% 2.9% 0.8%
Secondary Report-Page
8/14/2019 BELL COUNTY - Academy ISD - 2007 Texas School Survey of Drug and Alcohol Use
http://slidepdf.com/reader/full/bell-county-academy-isd-2007-texas-school-survey-of-drug-and-alcohol-use 10/72
Academy
Spring 2007
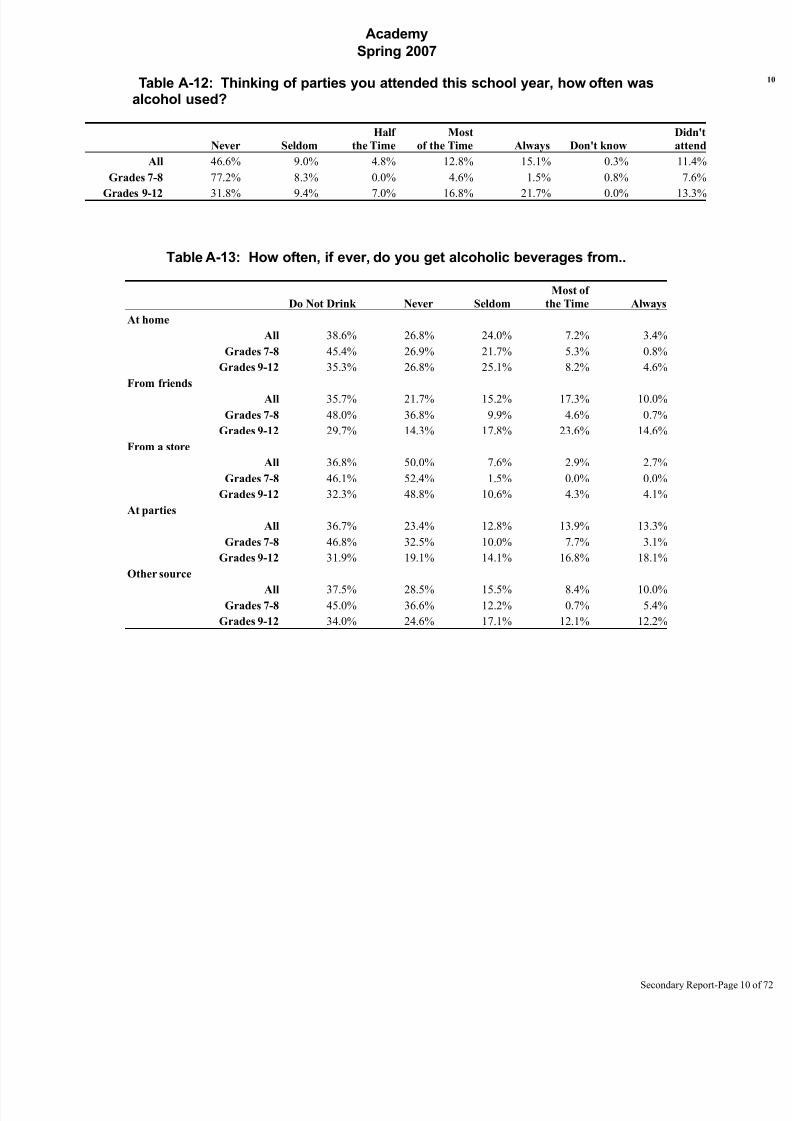
Table A-12: Thinking of parties you attended this school year, how often wasalcohol used?
Never Seldom
Half
the Time
Most
of the Time Always Don't know
Didn't
attend
All 46.6% 9.0% 4.8% 12.8% 15.1% 0.3% 11.4%
Grades 7-8 77.2% 8.3% 0.0% 4.6% 1.5% 0.8% 7.6%
Grades 9-12 31.8% 9.4% 7.0% 16.8% 21.7% 0.0% 13.3%
Table A-13: How often, if ever, do you get alcoholic beverages from..
Do Not Drink Never Seldom
Most of
the Time Always
At home
All 38.6% 26.8% 24.0% 7.2% 3.4%
Grades 7-8 45.4% 26.9% 21.7% 5.3% 0.8%
Grades 9-12 35.3% 26.8% 25.1% 8.2% 4.6%
From friends
All 35.7% 21.7% 15.2% 17.3% 10.0%
Grades 7-8 48.0% 36.8% 9.9% 4.6% 0.7%
Grades 9-12 29.7% 14.3% 17.8% 23.6% 14.6%
From a store
All 36.8% 50.0% 7.6% 2.9% 2.7%
Grades 7-8 46.1% 52.4% 1.5% 0.0% 0.0%
Grades 9-12 32.3% 48.8% 10.6% 4.3% 4.1%
At parties
All 36.7% 23.4% 12.8% 13.9% 13.3%
Grades 7-8 46.8% 32.5% 10.0% 7.7% 3.1%
Grades 9-12 31.9% 19.1% 14.1% 16.8% 18.1%
Other source
All 37.5% 28.5% 15.5% 8.4% 10.0%Grades 7-8 45.0% 36.6% 12.2% 0.7% 5.4%
Grades 9-12 34.0% 24.6% 17.1% 12.1% 12.2%
Secondary Report-Page
8/14/2019 BELL COUNTY - Academy ISD - 2007 Texas School Survey of Drug and Alcohol Use
http://slidepdf.com/reader/full/bell-county-academy-isd-2007-texas-school-survey-of-drug-and-alcohol-use 11/72
Academy
Spring 2007
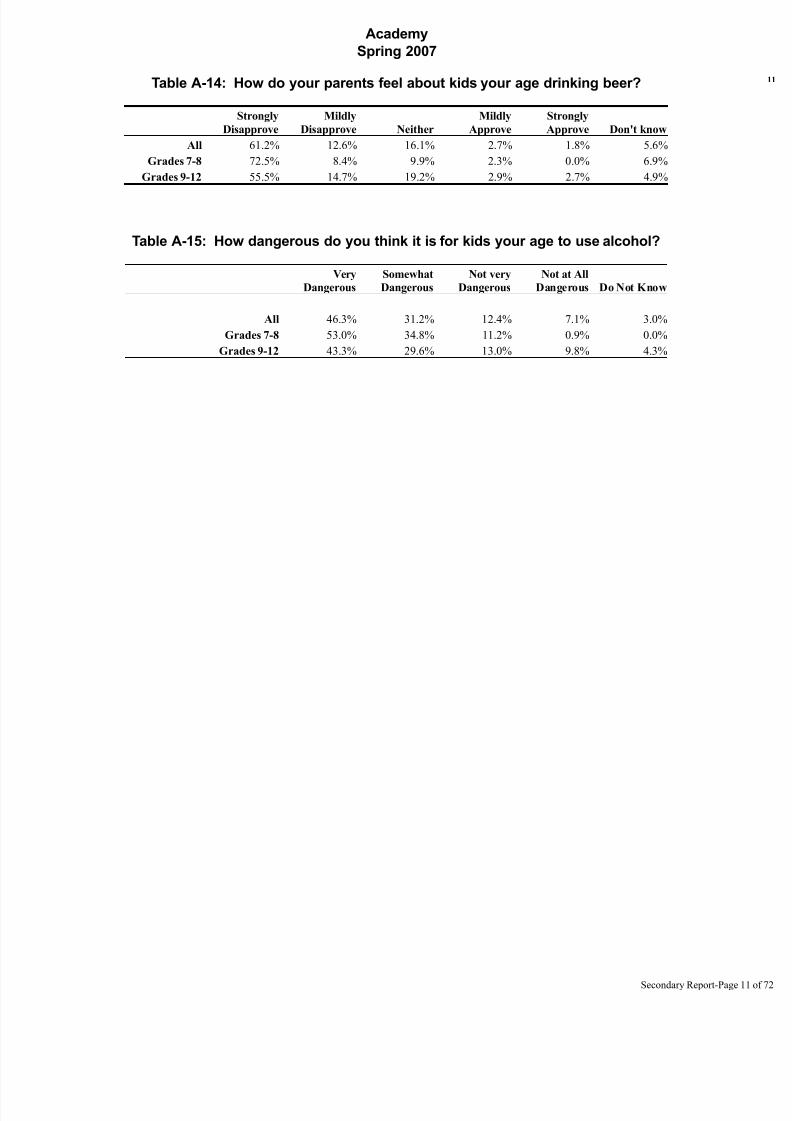
Table A-14: How do your parents feel about kids your age drinking beer?
Strongly
Disapprove
Mildly
Disapprove Neither
Mildly
Approve
Strongly
Approve Don't know
All 61.2% 12.6% 16.1% 2.7% 1.8% 5.6%
Grades 7-8 72.5% 8.4% 9.9% 2.3% 0.0% 6.9%
Grades 9-12 55.5% 14.7% 19.2% 2.9% 2.7% 4.9%
Table A-15: How dangerous do you think it is for kids your age to use alcohol?
Very
Dangerous
Somewhat
Dangerous
Not very
Dangerous
Not at All
Dangerous Do Not Know
All 46.3% 31.2% 12.4% 7.1% 3.0%
Grades 7-8 53.0% 34.8% 11.2% 0.9% 0.0%
Grades 9-12 43.3% 29.6% 13.0% 9.8% 4.3%
Secondary Report-Page
8/14/2019 BELL COUNTY - Academy ISD - 2007 Texas School Survey of Drug and Alcohol Use
http://slidepdf.com/reader/full/bell-county-academy-isd-2007-texas-school-survey-of-drug-and-alcohol-use 12/72
Academy
Spring 2007
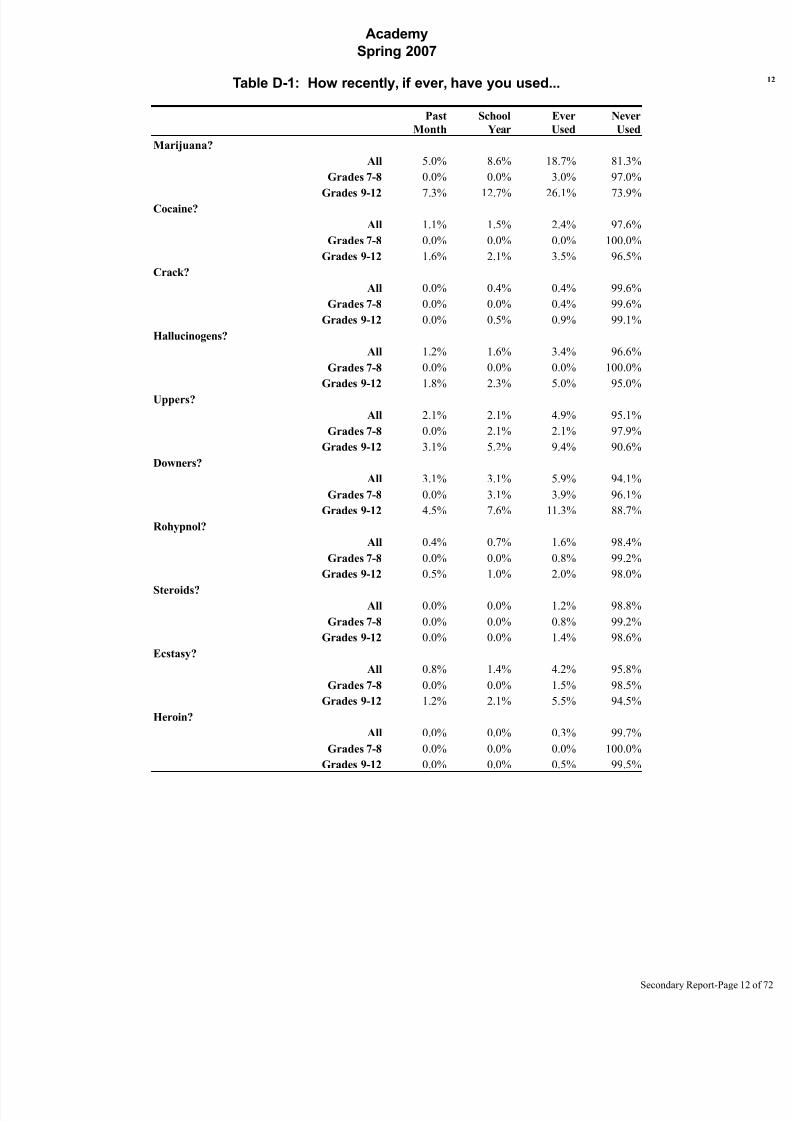
Table D-1: How recently, if ever, have you used...
Past
Month
School
Year
Ever
Used
Never
Used
Marijuana?
All 5.0% 8.6% 18.7% 81.3%
Grades 7-8 0.0% 0.0% 3.0% 97.0%
Grades 9-12 7.3% 12.7% 26.1% 73.9%Cocaine?
All 1.1% 1.5% 2.4% 97.6%
Grades 7-8 0.0% 0.0% 0.0% 100.0%
Grades 9-12 1.6% 2.1% 3.5% 96.5%
Crack?
All 0.0% 0.4% 0.4% 99.6%
Grades 7-8 0.0% 0.0% 0.4% 99.6%
Grades 9-12 0.0% 0.5% 0.9% 99.1%
Hallucinogens?
All 1.2% 1.6% 3.4% 96.6%
Grades 7-8 0.0% 0.0% 0.0% 100.0%
Grades 9-12 1.8% 2.3% 5.0% 95.0%
Uppers?
All 2.1% 2.1% 4.9% 95.1%
Grades 7-8 0.0% 2.1% 2.1% 97.9%
Grades 9-12 3.1% 5.2% 9.4% 90.6%
Downers?
All 3.1% 3.1% 5.9% 94.1%
Grades 7-8 0.0% 3.1% 3.9% 96.1%
Grades 9-12 4.5% 7.6% 11.3% 88.7%
Rohypnol?
All 0.4% 0.7% 1.6% 98.4%
Grades 7-8 0.0% 0.0% 0.8% 99.2%
Grades 9-12 0.5% 1.0% 2.0% 98.0%
Steroids?All 0.0% 0.0% 1.2% 98.8%
Grades 7-8 0.0% 0.0% 0.8% 99.2%
Grades 9-12 0.0% 0.0% 1.4% 98.6%
Ecstasy?
All 0.8% 1.4% 4.2% 95.8%
Grades 7-8 0.0% 0.0% 1.5% 98.5%
Grades 9-12 1.2% 2.1% 5.5% 94.5%
Heroin?
All 0.0% 0.0% 0.3% 99.7%
Grades 7-8 0.0% 0.0% 0.0% 100.0%
Grades 9-12 0.0% 0.0% 0.5% 99.5%
Secondary Report-Page
8/14/2019 BELL COUNTY - Academy ISD - 2007 Texas School Survey of Drug and Alcohol Use
http://slidepdf.com/reader/full/bell-county-academy-isd-2007-texas-school-survey-of-drug-and-alcohol-use 13/72
Academy
Spring 2007
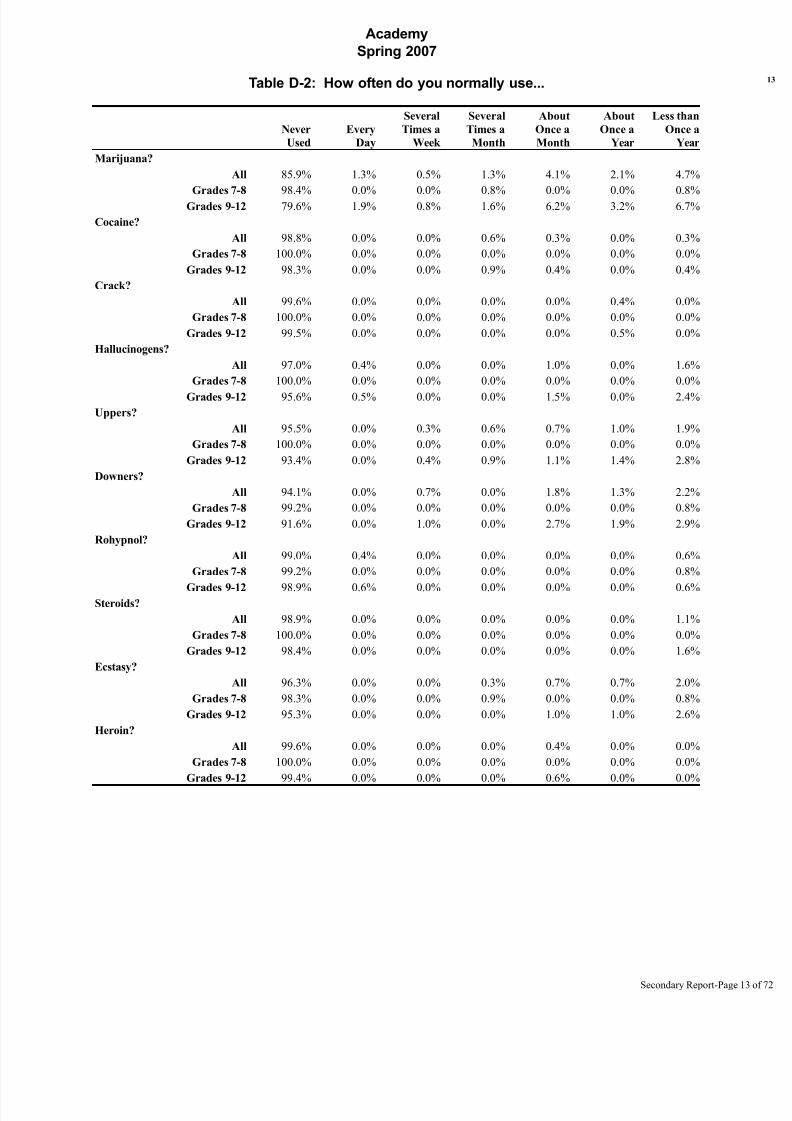
Table D-2: How often do you normally use...
Never
Used
Every
Day
Several
Times a
Week
Several
Times a
Month
About
Once a
Month
About
Once a
Year
Less than
Once a
Year
Marijuana?
All 85.9% 1.3% 0.5% 1.3% 4.1% 2.1% 4.7%
Grades 7-8 98.4% 0.0% 0.0% 0.8% 0.0% 0.0% 0.8%Grades 9-12 79.6% 1.9% 0.8% 1.6% 6.2% 3.2% 6.7%
Cocaine?
All 98.8% 0.0% 0.0% 0.6% 0.3% 0.0% 0.3%
Grades 7-8 100.0% 0.0% 0.0% 0.0% 0.0% 0.0% 0.0%
Grades 9-12 98.3% 0.0% 0.0% 0.9% 0.4% 0.0% 0.4%
Crack?
All 99.6% 0.0% 0.0% 0.0% 0.0% 0.4% 0.0%
Grades 7-8 100.0% 0.0% 0.0% 0.0% 0.0% 0.0% 0.0%
Grades 9-12 99.5% 0.0% 0.0% 0.0% 0.0% 0.5% 0.0%
Hallucinogens?
All 97.0% 0.4% 0.0% 0.0% 1.0% 0.0% 1.6%
Grades 7-8 100.0% 0.0% 0.0% 0.0% 0.0% 0.0% 0.0%
Grades 9-12 95.6% 0.5% 0.0% 0.0% 1.5% 0.0% 2.4%
Uppers?
All 95.5% 0.0% 0.3% 0.6% 0.7% 1.0% 1.9%
Grades 7-8 100.0% 0.0% 0.0% 0.0% 0.0% 0.0% 0.0%
Grades 9-12 93.4% 0.0% 0.4% 0.9% 1.1% 1.4% 2.8%
Downers?
All 94.1% 0.0% 0.7% 0.0% 1.8% 1.3% 2.2%
Grades 7-8 99.2% 0.0% 0.0% 0.0% 0.0% 0.0% 0.8%
Grades 9-12 91.6% 0.0% 1.0% 0.0% 2.7% 1.9% 2.9%
Rohypnol?
All 99.0% 0.4% 0.0% 0.0% 0.0% 0.0% 0.6%
Grades 7-8 99.2% 0.0% 0.0% 0.0% 0.0% 0.0% 0.8%
Grades 9-12 98.9% 0.6% 0.0% 0.0% 0.0% 0.0% 0.6%Steroids?
All 98.9% 0.0% 0.0% 0.0% 0.0% 0.0% 1.1%
Grades 7-8 100.0% 0.0% 0.0% 0.0% 0.0% 0.0% 0.0%
Grades 9-12 98.4% 0.0% 0.0% 0.0% 0.0% 0.0% 1.6%
Ecstasy?
All 96.3% 0.0% 0.0% 0.3% 0.7% 0.7% 2.0%
Grades 7-8 98.3% 0.0% 0.0% 0.9% 0.0% 0.0% 0.8%
Grades 9-12 95.3% 0.0% 0.0% 0.0% 1.0% 1.0% 2.6%
Heroin?
All 99.6% 0.0% 0.0% 0.0% 0.4% 0.0% 0.0%
Grades 7-8 100.0% 0.0% 0.0% 0.0% 0.0% 0.0% 0.0%
Grades 9-12 99.4% 0.0% 0.0% 0.0% 0.6% 0.0% 0.0%
Secondary Report-Page
8/14/2019 BELL COUNTY - Academy ISD - 2007 Texas School Survey of Drug and Alcohol Use
http://slidepdf.com/reader/full/bell-county-academy-isd-2007-texas-school-survey-of-drug-and-alcohol-use 14/72
Academy
Spring 2007
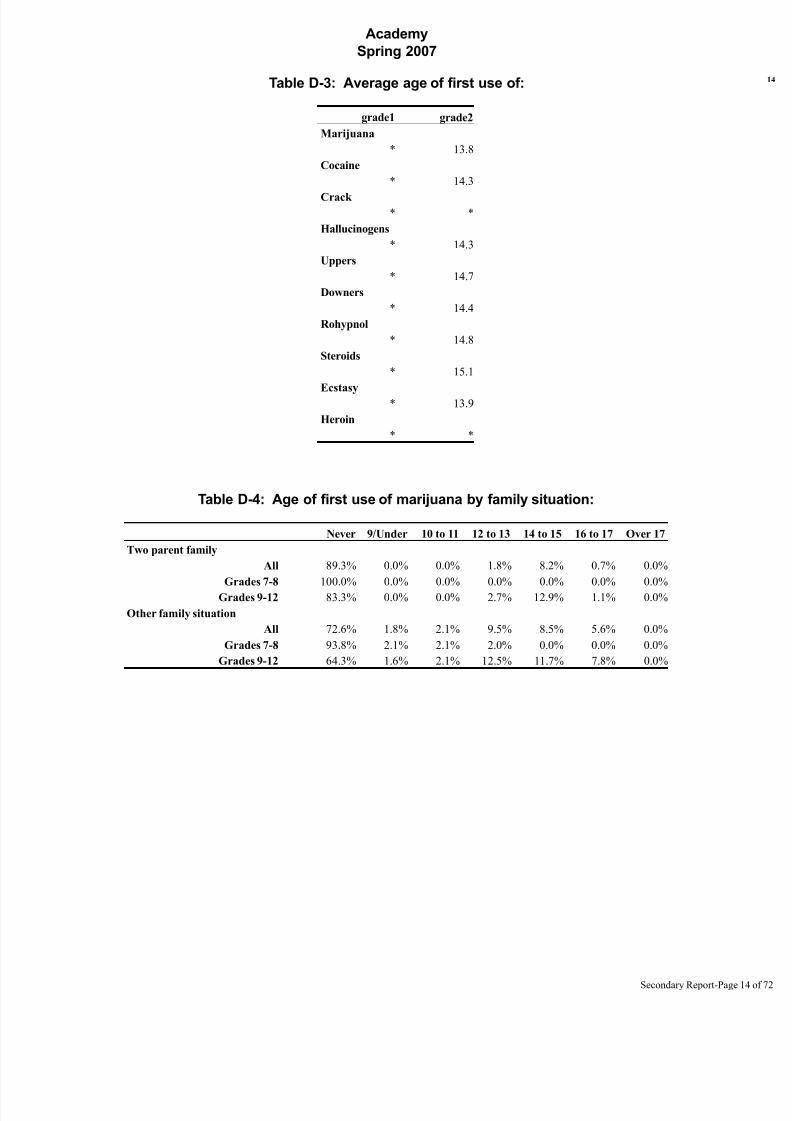
Table D-3: Average age of first use of:
grade1 grade2
Marijuana
* 13.8
Cocaine
* 14.3
Crack * *
Hallucinogens
* 14.3
Uppers
* 14.7
Downers
* 14.4
Rohypnol
* 14.8
Steroids
* 15.1
Ecstasy* 13.9
Heroin
* *
Table D-4: Age of first use of marijuana by family situation:
Never 9/Under 10 to 11 12 to 13 14 to 15 16 to 17 Over 17
Two parent family
All 89.3% 0.0% 0.0% 1.8% 8.2% 0.7% 0.0%
Grades 7-8 100.0% 0.0% 0.0% 0.0% 0.0% 0.0% 0.0%
Grades 9-12 83.3% 0.0% 0.0% 2.7% 12.9% 1.1% 0.0%
Other family situation
All 72.6% 1.8% 2.1% 9.5% 8.5% 5.6% 0.0%
Grades 7-8 93.8% 2.1% 2.1% 2.0% 0.0% 0.0% 0.0%
Grades 9-12 64.3% 1.6% 2.1% 12.5% 11.7% 7.8% 0.0%
Secondary Report-Page
8/14/2019 BELL COUNTY - Academy ISD - 2007 Texas School Survey of Drug and Alcohol Use
http://slidepdf.com/reader/full/bell-county-academy-isd-2007-texas-school-survey-of-drug-and-alcohol-use 15/72
Academy
Spring 2007
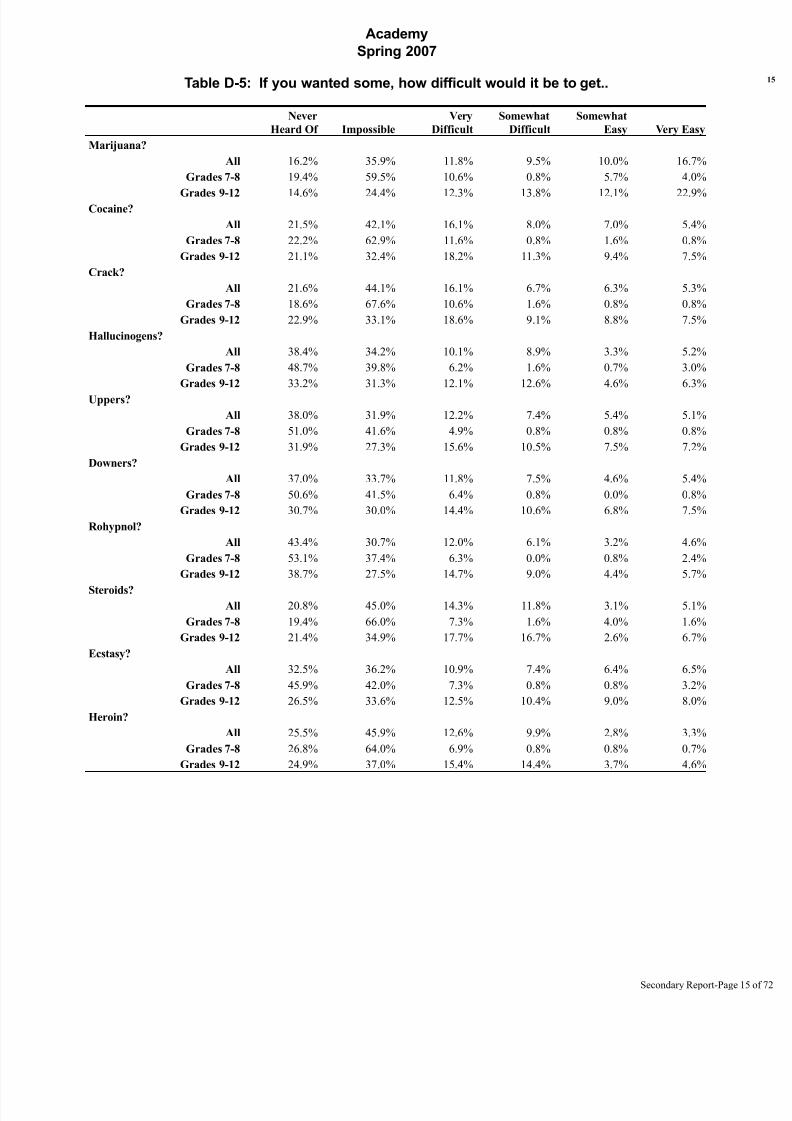
Table D-5: If you wanted some, how difficult would it be to get..
Never
Heard Of Impossible
Very
Difficult
Somewhat
Difficult
Somewhat
Easy Very Easy
Marijuana?
All 16.2% 35.9% 11.8% 9.5% 10.0% 16.7%
Grades 7-8 19.4% 59.5% 10.6% 0.8% 5.7% 4.0%
Grades 9-12 14.6% 24.4% 12.3% 13.8% 12.1% 22.9%Cocaine?
All 21.5% 42.1% 16.1% 8.0% 7.0% 5.4%
Grades 7-8 22.2% 62.9% 11.6% 0.8% 1.6% 0.8%
Grades 9-12 21.1% 32.4% 18.2% 11.3% 9.4% 7.5%
Crack?
All 21.6% 44.1% 16.1% 6.7% 6.3% 5.3%
Grades 7-8 18.6% 67.6% 10.6% 1.6% 0.8% 0.8%
Grades 9-12 22.9% 33.1% 18.6% 9.1% 8.8% 7.5%
Hallucinogens?
All 38.4% 34.2% 10.1% 8.9% 3.3% 5.2%
Grades 7-8 48.7% 39.8% 6.2% 1.6% 0.7% 3.0%
Grades 9-12 33.2% 31.3% 12.1% 12.6% 4.6% 6.3%
Uppers?
All 38.0% 31.9% 12.2% 7.4% 5.4% 5.1%
Grades 7-8 51.0% 41.6% 4.9% 0.8% 0.8% 0.8%
Grades 9-12 31.9% 27.3% 15.6% 10.5% 7.5% 7.2%
Downers?
All 37.0% 33.7% 11.8% 7.5% 4.6% 5.4%
Grades 7-8 50.6% 41.5% 6.4% 0.8% 0.0% 0.8%
Grades 9-12 30.7% 30.0% 14.4% 10.6% 6.8% 7.5%
Rohypnol?
All 43.4% 30.7% 12.0% 6.1% 3.2% 4.6%
Grades 7-8 53.1% 37.4% 6.3% 0.0% 0.8% 2.4%
Grades 9-12 38.7% 27.5% 14.7% 9.0% 4.4% 5.7%
Steroids?All 20.8% 45.0% 14.3% 11.8% 3.1% 5.1%
Grades 7-8 19.4% 66.0% 7.3% 1.6% 4.0% 1.6%
Grades 9-12 21.4% 34.9% 17.7% 16.7% 2.6% 6.7%
Ecstasy?
All 32.5% 36.2% 10.9% 7.4% 6.4% 6.5%
Grades 7-8 45.9% 42.0% 7.3% 0.8% 0.8% 3.2%
Grades 9-12 26.5% 33.6% 12.5% 10.4% 9.0% 8.0%
Heroin?
All 25.5% 45.9% 12.6% 9.9% 2.8% 3.3%
Grades 7-8 26.8% 64.0% 6.9% 0.8% 0.8% 0.7%
Grades 9-12 24.9% 37.0% 15.4% 14.4% 3.7% 4.6%
Secondary Report-Page
8/14/2019 BELL COUNTY - Academy ISD - 2007 Texas School Survey of Drug and Alcohol Use
http://slidepdf.com/reader/full/bell-county-academy-isd-2007-texas-school-survey-of-drug-and-alcohol-use 16/72
Academy
Spring 2007
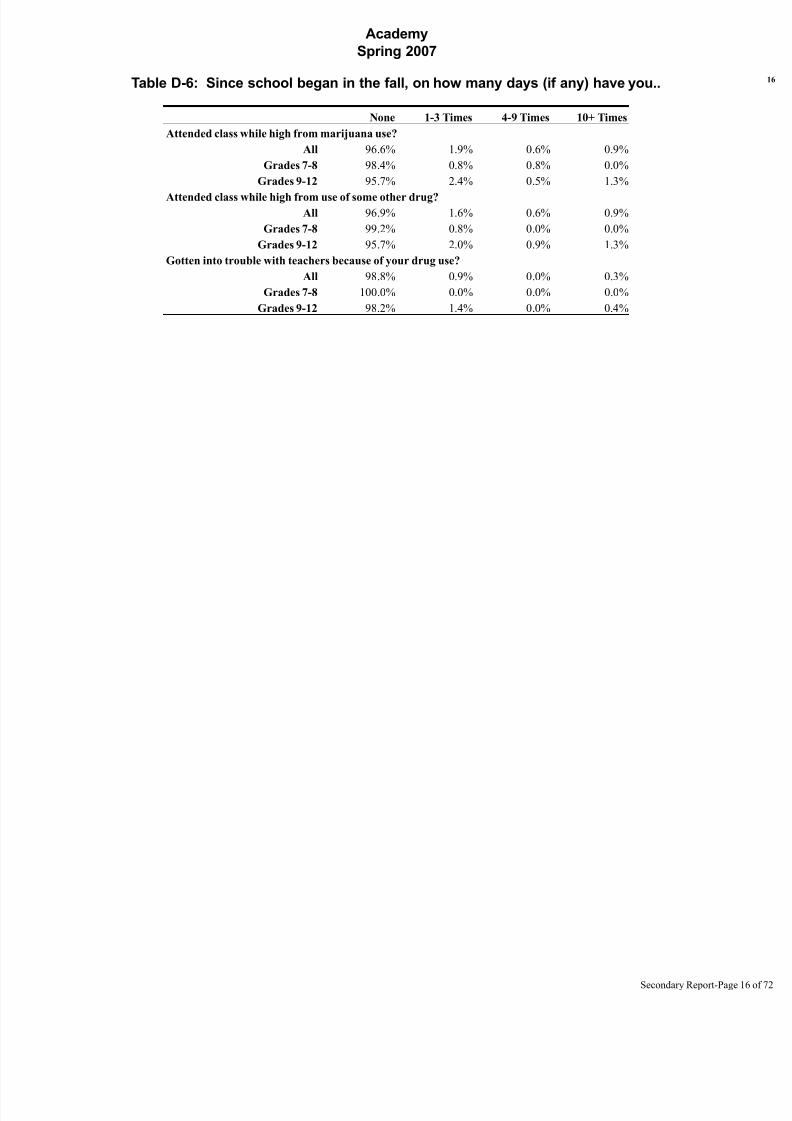
Table D-6: Since school began in the fall, on how many days (if any) have you..
None 1-3 Times 4-9 Times 10+ Times
Attended class while high from marijuana use?
All 96.6% 1.9% 0.6% 0.9%
Grades 7-8 98.4% 0.8% 0.8% 0.0%
Grades 9-12 95.7% 2.4% 0.5% 1.3%
Attended class while high from use of some other drug?All 96.9% 1.6% 0.6% 0.9%
Grades 7-8 99.2% 0.8% 0.0% 0.0%
Grades 9-12 95.7% 2.0% 0.9% 1.3%
Gotten into trouble with teachers because of your drug use?
All 98.8% 0.9% 0.0% 0.3%
Grades 7-8 100.0% 0.0% 0.0% 0.0%
Grades 9-12 98.2% 1.4% 0.0% 0.4%
Secondary Report-Page
8/14/2019 BELL COUNTY - Academy ISD - 2007 Texas School Survey of Drug and Alcohol Use
http://slidepdf.com/reader/full/bell-county-academy-isd-2007-texas-school-survey-of-drug-and-alcohol-use 17/72
Academy
Spring 2007
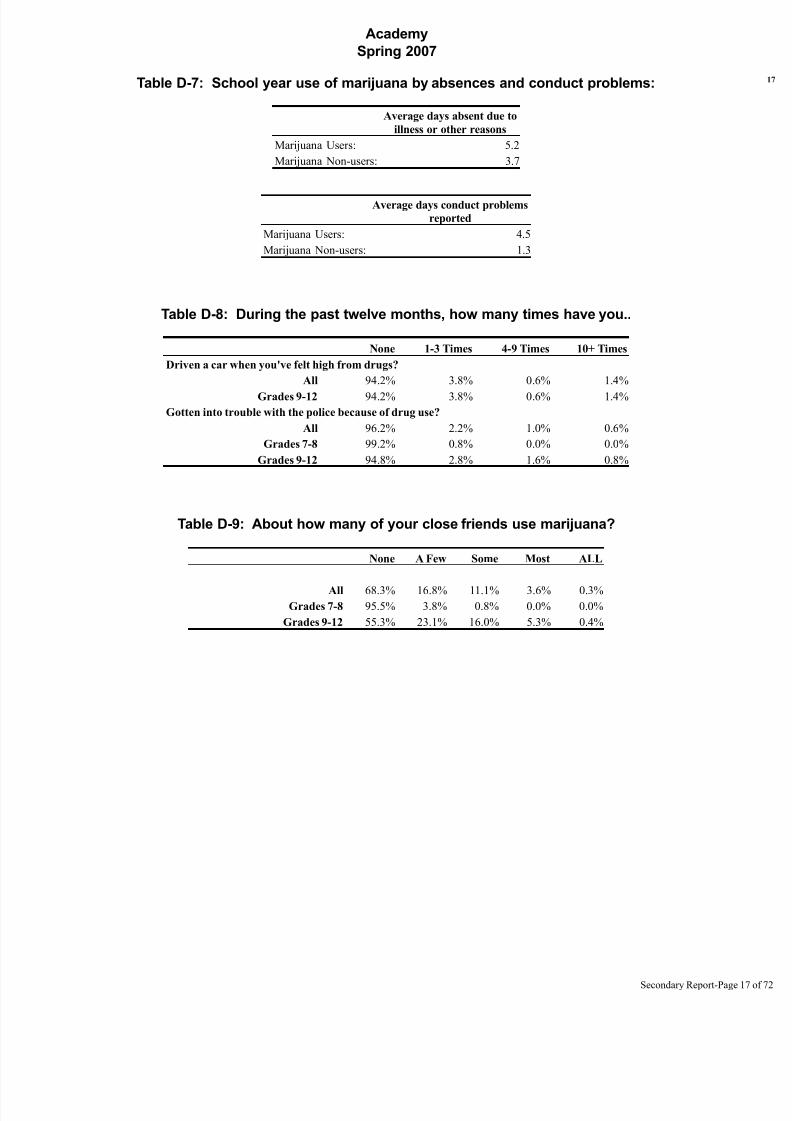
Table D-7: School year use of marijuana by absences and conduct problems:
Average days absent due to
illness or other reasons
Marijuana Users: 5.2
Marijuana Non-users: 3.7
Average days conduct problems
reported
Marijuana Users: 4.5
Marijuana Non-users: 1.3
Table D-8: During the past twelve months, how many times have you..
None 1-3 Times 4-9 Times 10+ Times
Driven a car when you've felt high from drugs?
All 94.2% 3.8% 0.6% 1.4%
Grades 9-12 94.2% 3.8% 0.6% 1.4%
Gotten into trouble with the police because of drug use?
All 96.2% 2.2% 1.0% 0.6%
Grades 7-8 99.2% 0.8% 0.0% 0.0%
Grades 9-12 94.8% 2.8% 1.6% 0.8%
Table D-9: About how many of your close friends use marijuana?
None A Few Some Most ALL
All 68.3% 16.8% 11.1% 3.6% 0.3%Grades 7-8 95.5% 3.8% 0.8% 0.0% 0.0%
Grades 9-12 55.3% 23.1% 16.0% 5.3% 0.4%
Secondary Report-Page
8/14/2019 BELL COUNTY - Academy ISD - 2007 Texas School Survey of Drug and Alcohol Use
http://slidepdf.com/reader/full/bell-county-academy-isd-2007-texas-school-survey-of-drug-and-alcohol-use 18/72
Academy
Spring 2007
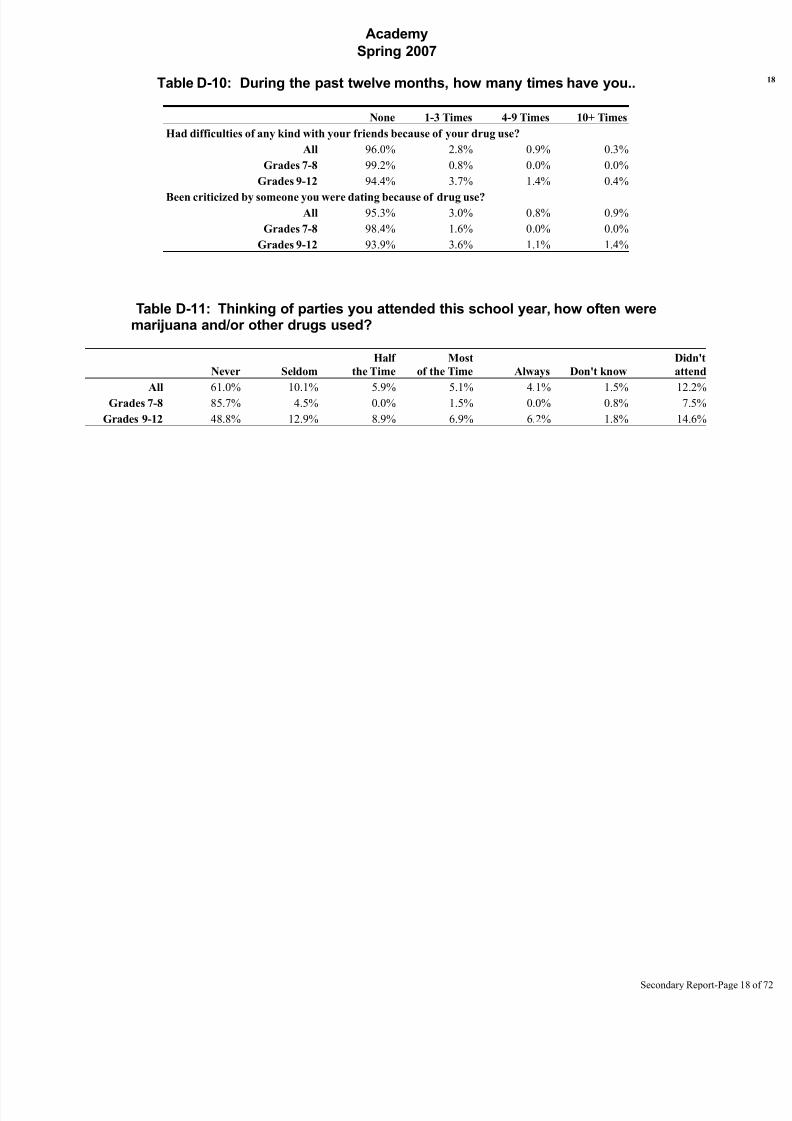
Table D-10: During the past twelve months, how many times have you..
None 1-3 Times 4-9 Times 10+ Times
Had difficulties of any kind with your friends because of your drug use?
All 96.0% 2.8% 0.9% 0.3%
Grades 7-8 99.2% 0.8% 0.0% 0.0%
Grades 9-12 94.4% 3.7% 1.4% 0.4%
Been criticized by someone you were dating because of drug use?All 95.3% 3.0% 0.8% 0.9%
Grades 7-8 98.4% 1.6% 0.0% 0.0%
Grades 9-12 93.9% 3.6% 1.1% 1.4%
Table D-11: Thinking of parties you attended this school year, how often weremarijuana and/or other drugs used?
Never Seldom
Half
the Time
Most
of the Time Always Don't know
Didn't
attend
All 61.0% 10.1% 5.9% 5.1% 4.1% 1.5% 12.2%Grades 7-8 85.7% 4.5% 0.0% 1.5% 0.0% 0.8% 7.5%
Grades 9-12 48.8% 12.9% 8.9% 6.9% 6.2% 1.8% 14.6%
Secondary Report-Page
8/14/2019 BELL COUNTY - Academy ISD - 2007 Texas School Survey of Drug and Alcohol Use
http://slidepdf.com/reader/full/bell-county-academy-isd-2007-texas-school-survey-of-drug-and-alcohol-use 19/72
Academy
Spring 2007
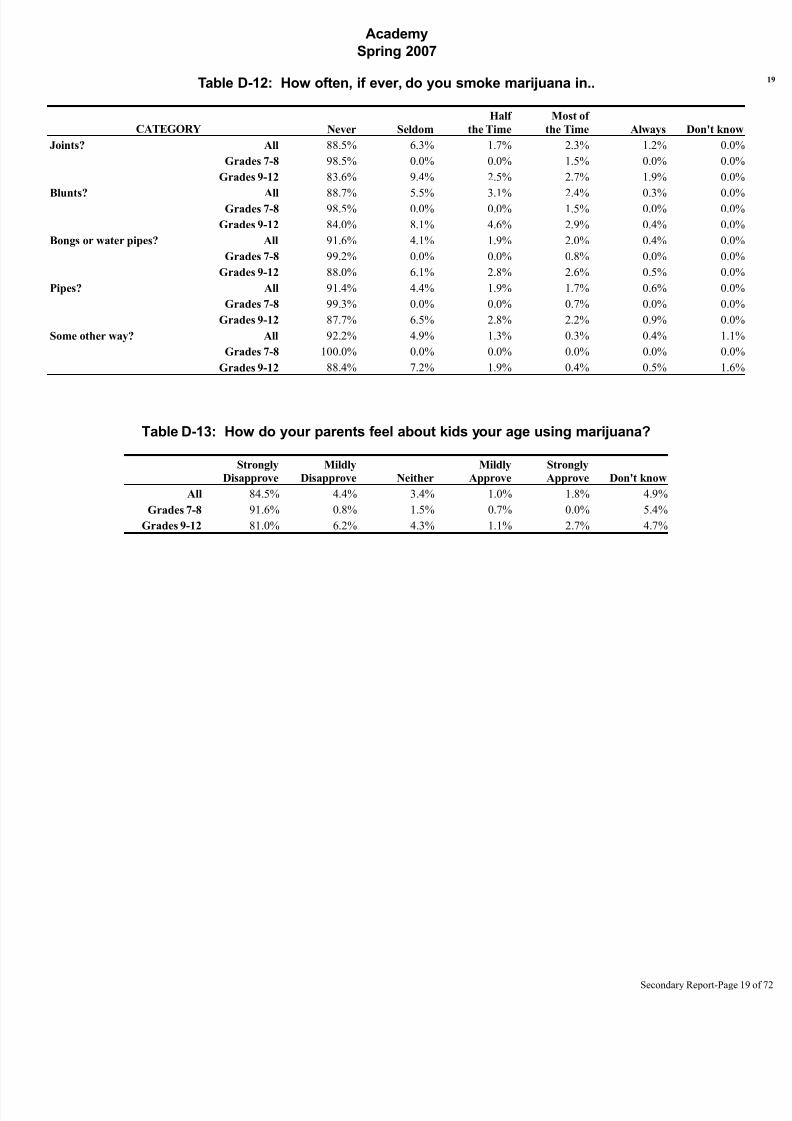
Table D-12: How often, if ever, do you smoke marijuana in..
CATEGORY Never Seldom
Half
the Time
Most of
the Time Always Don't know
Joints? All 88.5% 6.3% 1.7% 2.3% 1.2% 0.0%
Grades 7-8 98.5% 0.0% 0.0% 1.5% 0.0% 0.0%
Grades 9-12 83.6% 9.4% 2.5% 2.7% 1.9% 0.0%
Blunts? All 88.7% 5.5% 3.1% 2.4% 0.3% 0.0%Grades 7-8 98.5% 0.0% 0.0% 1.5% 0.0% 0.0%
Grades 9-12 84.0% 8.1% 4.6% 2.9% 0.4% 0.0%
Bongs or water pipes? All 91.6% 4.1% 1.9% 2.0% 0.4% 0.0%
Grades 7-8 99.2% 0.0% 0.0% 0.8% 0.0% 0.0%
Grades 9-12 88.0% 6.1% 2.8% 2.6% 0.5% 0.0%
Pipes? All 91.4% 4.4% 1.9% 1.7% 0.6% 0.0%
Grades 7-8 99.3% 0.0% 0.0% 0.7% 0.0% 0.0%
Grades 9-12 87.7% 6.5% 2.8% 2.2% 0.9% 0.0%
Some other way? All 92.2% 4.9% 1.3% 0.3% 0.4% 1.1%
Grades 7-8 100.0% 0.0% 0.0% 0.0% 0.0% 0.0%
Grades 9-12 88.4% 7.2% 1.9% 0.4% 0.5% 1.6%
Table D-13: How do your parents feel about kids your age using marijuana?
Strongly
Disapprove
Mildly
Disapprove Neither
Mildly
Approve
Strongly
Approve Don't know
All 84.5% 4.4% 3.4% 1.0% 1.8% 4.9%
Grades 7-8 91.6% 0.8% 1.5% 0.7% 0.0% 5.4%
Grades 9-12 81.0% 6.2% 4.3% 1.1% 2.7% 4.7%
Secondary Report-Page
8/14/2019 BELL COUNTY - Academy ISD - 2007 Texas School Survey of Drug and Alcohol Use
http://slidepdf.com/reader/full/bell-county-academy-isd-2007-texas-school-survey-of-drug-and-alcohol-use 20/72
Academy
Spring 2007
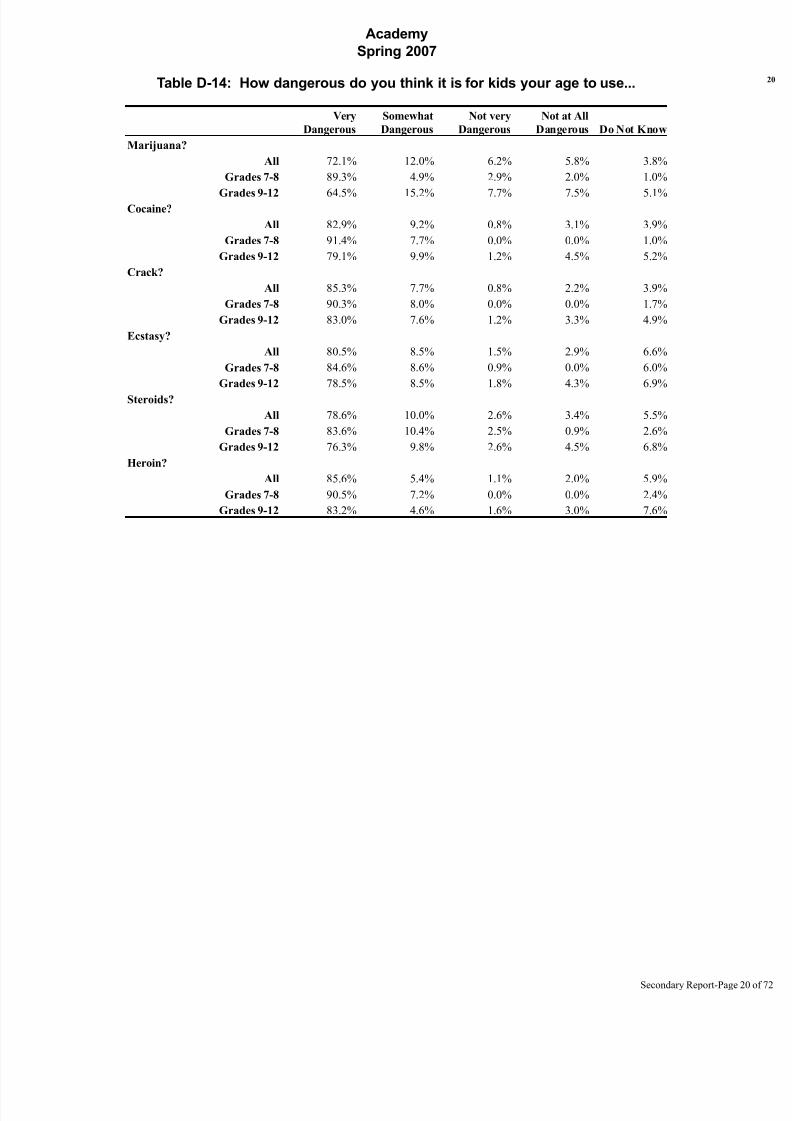
Table D-14: How dangerous do you think it is for kids your age to use...
Very
Dangerous
Somewhat
Dangerous
Not very
Dangerous
Not at All
Dangerous Do Not Know
Marijuana?
All 72.1% 12.0% 6.2% 5.8% 3.8%
Grades 7-8 89.3% 4.9% 2.9% 2.0% 1.0%
Grades 9-12 64.5% 15.2% 7.7% 7.5% 5.1%Cocaine?
All 82.9% 9.2% 0.8% 3.1% 3.9%
Grades 7-8 91.4% 7.7% 0.0% 0.0% 1.0%
Grades 9-12 79.1% 9.9% 1.2% 4.5% 5.2%
Crack?
All 85.3% 7.7% 0.8% 2.2% 3.9%
Grades 7-8 90.3% 8.0% 0.0% 0.0% 1.7%
Grades 9-12 83.0% 7.6% 1.2% 3.3% 4.9%
Ecstasy?
All 80.5% 8.5% 1.5% 2.9% 6.6%
Grades 7-8 84.6% 8.6% 0.9% 0.0% 6.0%
Grades 9-12 78.5% 8.5% 1.8% 4.3% 6.9%
Steroids?
All 78.6% 10.0% 2.6% 3.4% 5.5%
Grades 7-8 83.6% 10.4% 2.5% 0.9% 2.6%
Grades 9-12 76.3% 9.8% 2.6% 4.5% 6.8%
Heroin?
All 85.6% 5.4% 1.1% 2.0% 5.9%
Grades 7-8 90.5% 7.2% 0.0% 0.0% 2.4%
Grades 9-12 83.2% 4.6% 1.6% 3.0% 7.6%
Secondary Report-Page
8/14/2019 BELL COUNTY - Academy ISD - 2007 Texas School Survey of Drug and Alcohol Use
http://slidepdf.com/reader/full/bell-county-academy-isd-2007-texas-school-survey-of-drug-and-alcohol-use 21/72
Academy
Spring 2007
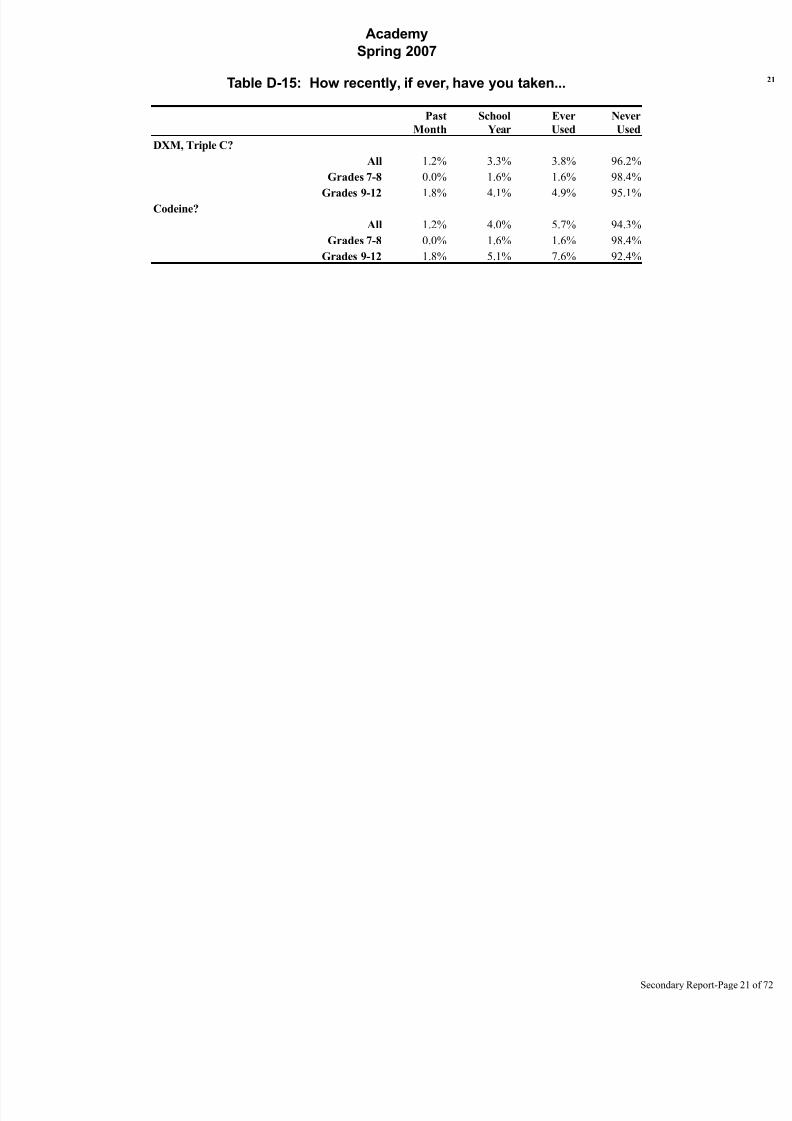
Table D-15: How recently, if ever, have you taken...
Past
Month
School
Year
Ever
Used
Never
Used
DXM, Triple C?
All 1.2% 3.3% 3.8% 96.2%
Grades 7-8 0.0% 1.6% 1.6% 98.4%
Grades 9-12 1.8% 4.1% 4.9% 95.1%Codeine?
All 1.2% 4.0% 5.7% 94.3%
Grades 7-8 0.0% 1.6% 1.6% 98.4%
Grades 9-12 1.8% 5.1% 7.6% 92.4%
Secondary Report-Page
8/14/2019 BELL COUNTY - Academy ISD - 2007 Texas School Survey of Drug and Alcohol Use
http://slidepdf.com/reader/full/bell-county-academy-isd-2007-texas-school-survey-of-drug-and-alcohol-use 22/72
Academy
Spring 2007
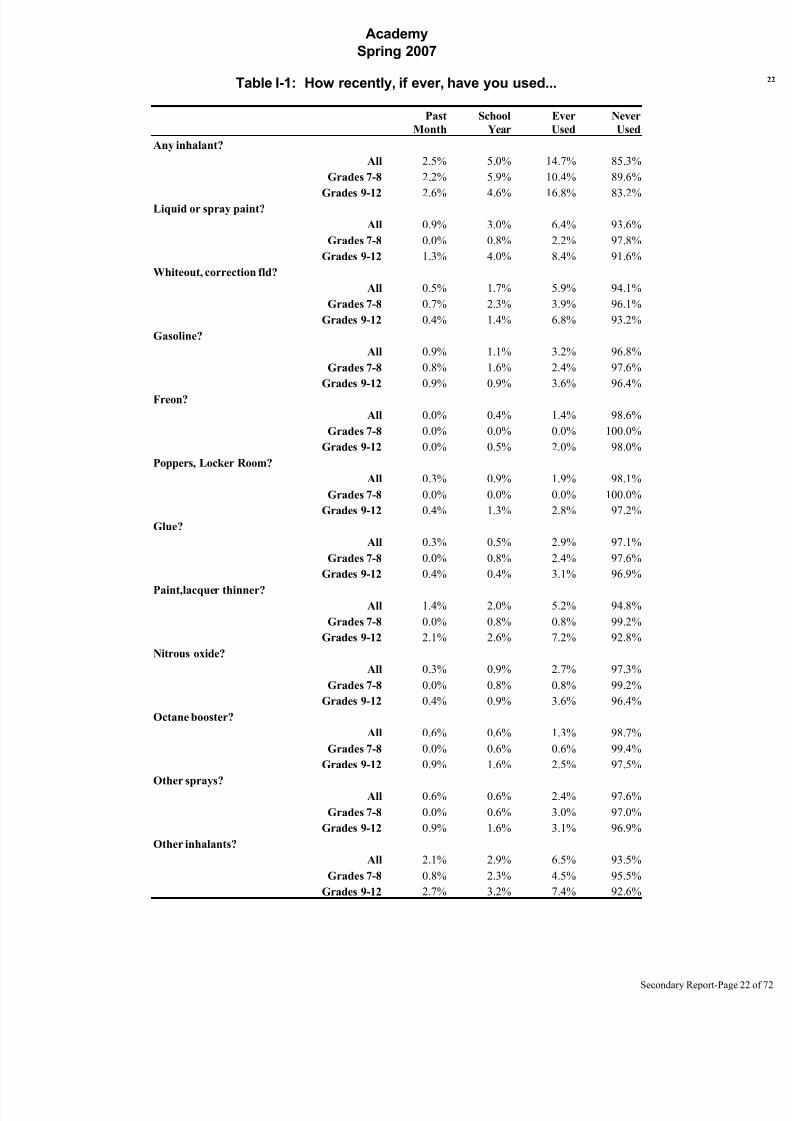
Table I-1: How recently, if ever, have you used...
Past
Month
School
Year
Ever
Used
Never
Used
Any inhalant?
All 2.5% 5.0% 14.7% 85.3%
Grades 7-8 2.2% 5.9% 10.4% 89.6%
Grades 9-12 2.6% 4.6% 16.8% 83.2%Liquid or spray paint?
All 0.9% 3.0% 6.4% 93.6%
Grades 7-8 0.0% 0.8% 2.2% 97.8%
Grades 9-12 1.3% 4.0% 8.4% 91.6%
Whiteout, correction fld?
All 0.5% 1.7% 5.9% 94.1%
Grades 7-8 0.7% 2.3% 3.9% 96.1%
Grades 9-12 0.4% 1.4% 6.8% 93.2%
Gasoline?
All 0.9% 1.1% 3.2% 96.8%
Grades 7-8 0.8% 1.6% 2.4% 97.6%
Grades 9-12 0.9% 0.9% 3.6% 96.4%
Freon?
All 0.0% 0.4% 1.4% 98.6%
Grades 7-8 0.0% 0.0% 0.0% 100.0%
Grades 9-12 0.0% 0.5% 2.0% 98.0%
Poppers, Locker Room?
All 0.3% 0.9% 1.9% 98.1%
Grades 7-8 0.0% 0.0% 0.0% 100.0%
Grades 9-12 0.4% 1.3% 2.8% 97.2%
Glue?
All 0.3% 0.5% 2.9% 97.1%
Grades 7-8 0.0% 0.8% 2.4% 97.6%
Grades 9-12 0.4% 0.4% 3.1% 96.9%
Paint,lacquer thinner?All 1.4% 2.0% 5.2% 94.8%
Grades 7-8 0.0% 0.8% 0.8% 99.2%
Grades 9-12 2.1% 2.6% 7.2% 92.8%
Nitrous oxide?
All 0.3% 0.9% 2.7% 97.3%
Grades 7-8 0.0% 0.8% 0.8% 99.2%
Grades 9-12 0.4% 0.9% 3.6% 96.4%
Octane booster?
All 0.6% 0.6% 1.3% 98.7%
Grades 7-8 0.0% 0.6% 0.6% 99.4%
Grades 9-12 0.9% 1.6% 2.5% 97.5%
Other sprays?All 0.6% 0.6% 2.4% 97.6%
Grades 7-8 0.0% 0.6% 3.0% 97.0%
Grades 9-12 0.9% 1.6% 3.1% 96.9%
Other inhalants?
All 2.1% 2.9% 6.5% 93.5%
Grades 7-8 0.8% 2.3% 4.5% 95.5%
Grades 9-12 2.7% 3.2% 7.4% 92.6%
Secondary Report-Page
8/14/2019 BELL COUNTY - Academy ISD - 2007 Texas School Survey of Drug and Alcohol Use
http://slidepdf.com/reader/full/bell-county-academy-isd-2007-texas-school-survey-of-drug-and-alcohol-use 23/72
Academy
Spring 2007
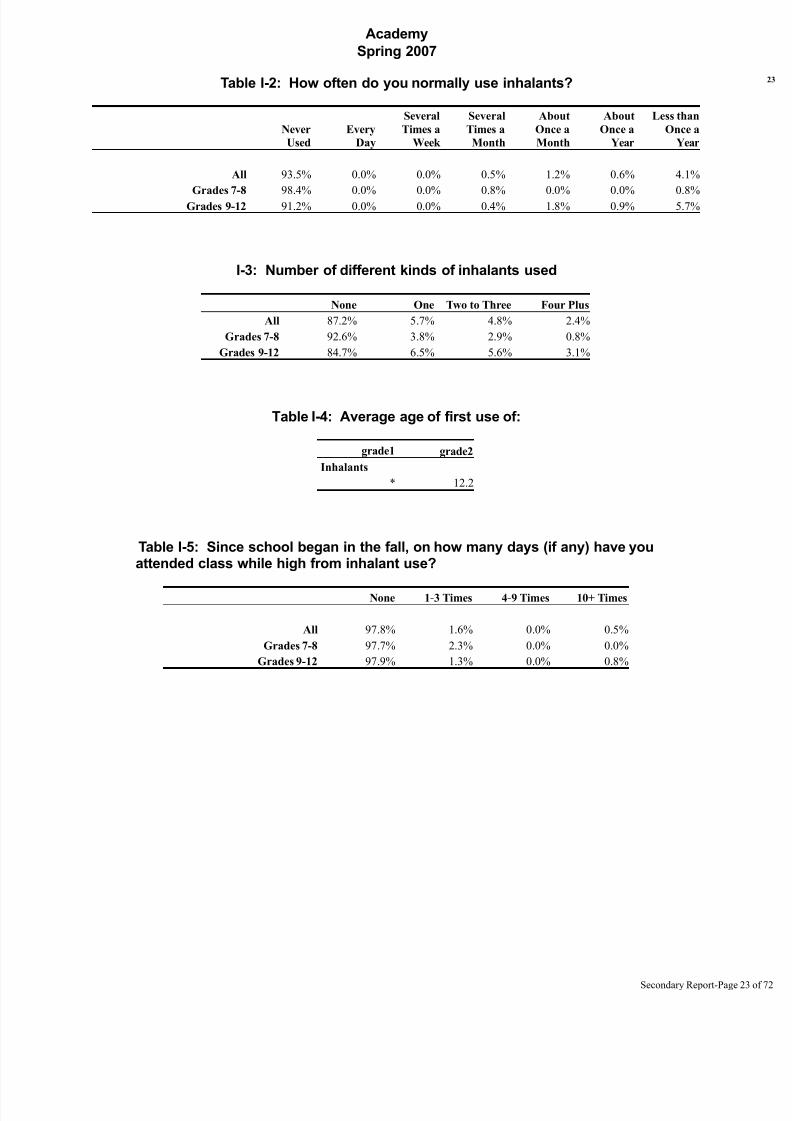
Table I-2: How often do you normally use inhalants?
Never
Used
Every
Day
Several
Times a
Week
Several
Times a
Month
About
Once a
Month
About
Once a
Year
Less than
Once a
Year
All 93.5% 0.0% 0.0% 0.5% 1.2% 0.6% 4.1%
Grades 7-8 98.4% 0.0% 0.0% 0.8% 0.0% 0.0% 0.8%Grades 9-12 91.2% 0.0% 0.0% 0.4% 1.8% 0.9% 5.7%
I-3: Number of different kinds of inhalants used
None One Two to Three Four Plus
All 87.2% 5.7% 4.8% 2.4%
Grades 7-8 92.6% 3.8% 2.9% 0.8%
Grades 9-12 84.7% 6.5% 5.6% 3.1%
Table I-4: Average age of first use of:
grade1 grade2
Inhalants
* 12.2
Table I-5: Since school began in the fall, on how many days (if any) have youattended class while high from inhalant use?
None 1-3 Times 4-9 Times 10+ Times
All 97.8% 1.6% 0.0% 0.5%
Grades 7-8 97.7% 2.3% 0.0% 0.0%
Grades 9-12 97.9% 1.3% 0.0% 0.8%
Secondary Report-Page
8/14/2019 BELL COUNTY - Academy ISD - 2007 Texas School Survey of Drug and Alcohol Use
http://slidepdf.com/reader/full/bell-county-academy-isd-2007-texas-school-survey-of-drug-and-alcohol-use 24/72
Academy
Spring 2007
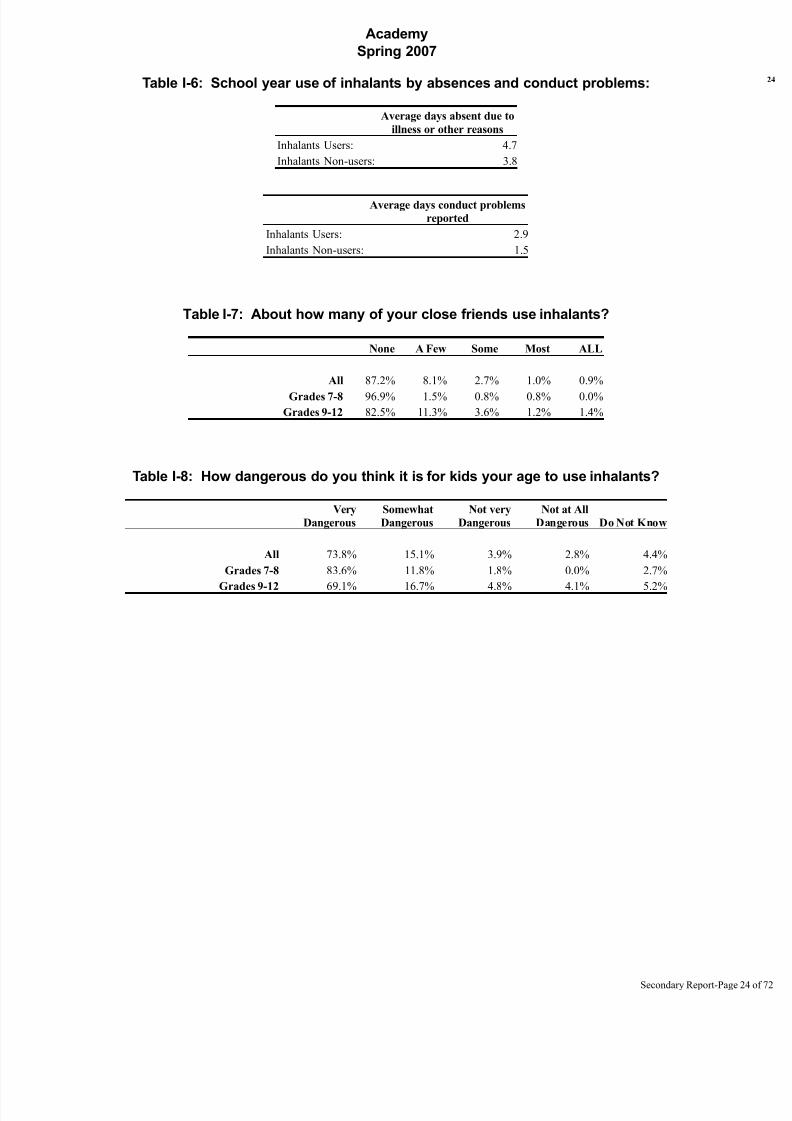
Table I-6: School year use of inhalants by absences and conduct problems:
Average days absent due to
illness or other reasons
Inhalants Users: 4.7
Inhalants Non-users: 3.8
Average days conduct problems
reported
Inhalants Users: 2.9
Inhalants Non-users: 1.5
Table I-7: About how many of your close friends use inhalants?
None A Few Some Most ALL
All 87.2% 8.1% 2.7% 1.0% 0.9%
Grades 7-8 96.9% 1.5% 0.8% 0.8% 0.0%
Grades 9-12 82.5% 11.3% 3.6% 1.2% 1.4%
Table I-8: How dangerous do you think it is for kids your age to use inhalants?
Very
Dangerous
Somewhat
Dangerous
Not very
Dangerous
Not at All
Dangerous Do Not Know
All 73.8% 15.1% 3.9% 2.8% 4.4%
Grades 7-8 83.6% 11.8% 1.8% 0.0% 2.7%
Grades 9-12 69.1% 16.7% 4.8% 4.1% 5.2%
Secondary Report-Page
8/14/2019 BELL COUNTY - Academy ISD - 2007 Texas School Survey of Drug and Alcohol Use
http://slidepdf.com/reader/full/bell-county-academy-isd-2007-texas-school-survey-of-drug-and-alcohol-use 25/72
Academy
Spring 2007
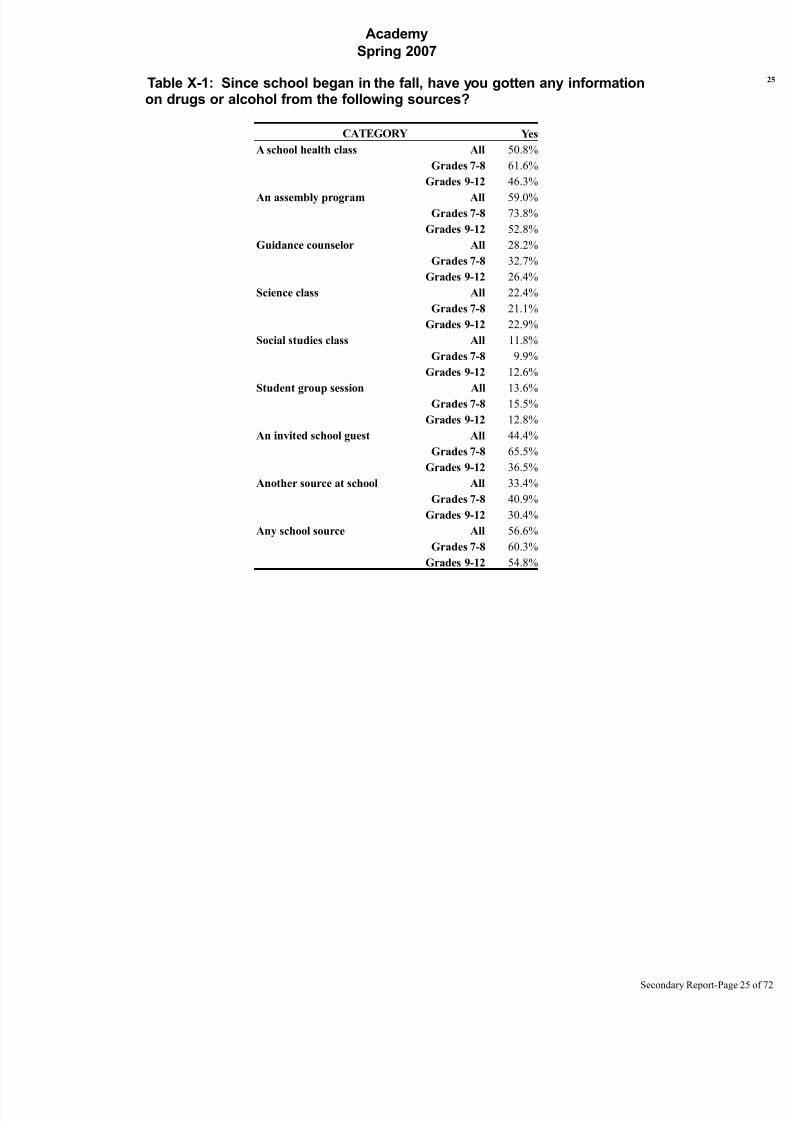
Table X-1: Since school began in the fall, have you gotten any informationon drugs or alcohol from the following sources?
CATEGORY Yes
A school health class All 50.8%
Grades 7-8 61.6%
Grades 9-12 46.3%
An assembly program All 59.0%Grades 7-8 73.8%
Grades 9-12 52.8%
Guidance counselor All 28.2%
Grades 7-8 32.7%
Grades 9-12 26.4%
Science class All 22.4%
Grades 7-8 21.1%
Grades 9-12 22.9%
Social studies class All 11.8%
Grades 7-8 9.9%
Grades 9-12 12.6%
Student group session All 13.6%Grades 7-8 15.5%
Grades 9-12 12.8%
An invited school guest All 44.4%
Grades 7-8 65.5%
Grades 9-12 36.5%
Another source at school All 33.4%
Grades 7-8 40.9%
Grades 9-12 30.4%
Any school source All 56.6%
Grades 7-8 60.3%
Grades 9-12 54.8%
Secondary Report-Page
8/14/2019 BELL COUNTY - Academy ISD - 2007 Texas School Survey of Drug and Alcohol Use
http://slidepdf.com/reader/full/bell-county-academy-isd-2007-texas-school-survey-of-drug-and-alcohol-use 26/72
Academy
Spring 2007
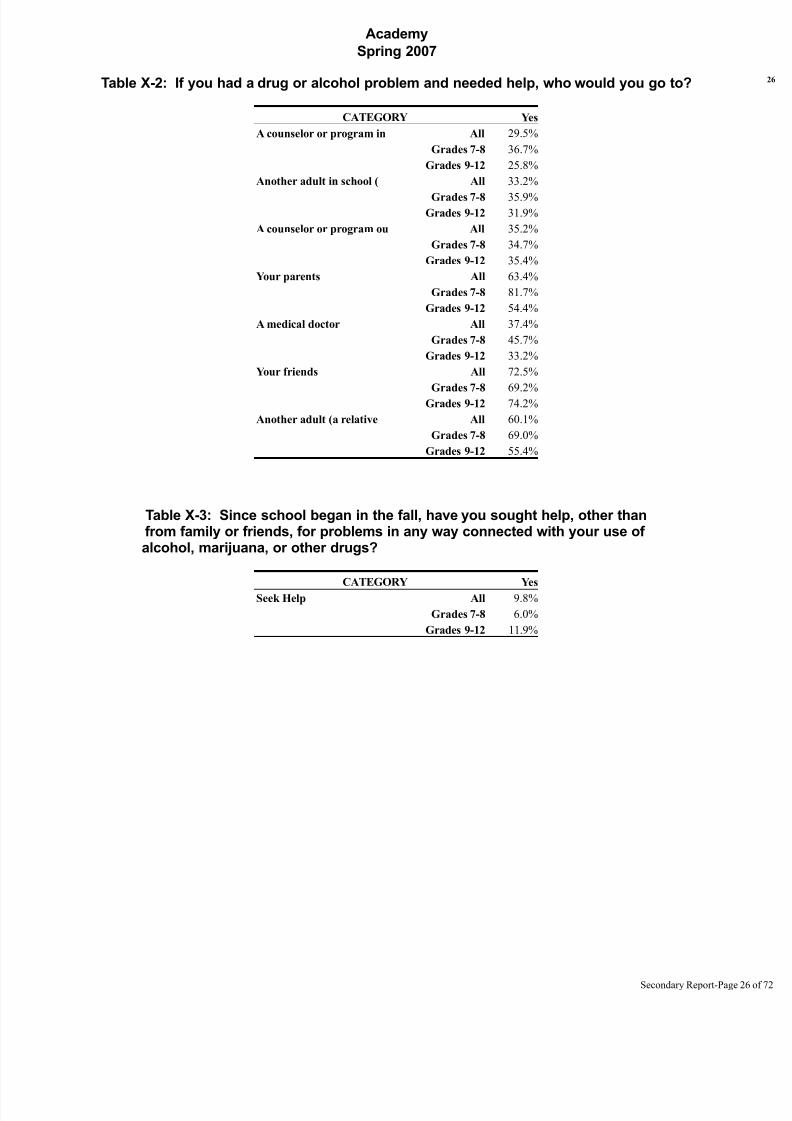
Table X-2: If you had a drug or alcohol problem and needed help, who would you go to?
CATEGORY Yes
A counselor or program in All 29.5%
Grades 7-8 36.7%
Grades 9-12 25.8%
Another adult in school ( All 33.2%
Grades 7-8 35.9%Grades 9-12 31.9%
A counselor or program ou All 35.2%
Grades 7-8 34.7%
Grades 9-12 35.4%
Your parents All 63.4%
Grades 7-8 81.7%
Grades 9-12 54.4%
A medical doctor All 37.4%
Grades 7-8 45.7%
Grades 9-12 33.2%
Your friends All 72.5%
Grades 7-8 69.2%Grades 9-12 74.2%
Another adult (a relative All 60.1%
Grades 7-8 69.0%
Grades 9-12 55.4%
Table X-3: Since school began in the fall, have you sought help, other thanfrom family or friends, for problems in any way connected with your use of alcohol, marijuana, or other drugs?
CATEGORY Yes
Seek Help All 9.8%
Grades 7-8 6.0%
Grades 9-12 11.9%
Secondary Report-Page
8/14/2019 BELL COUNTY - Academy ISD - 2007 Texas School Survey of Drug and Alcohol Use
http://slidepdf.com/reader/full/bell-county-academy-isd-2007-texas-school-survey-of-drug-and-alcohol-use 27/72
Academy
Spring 2007
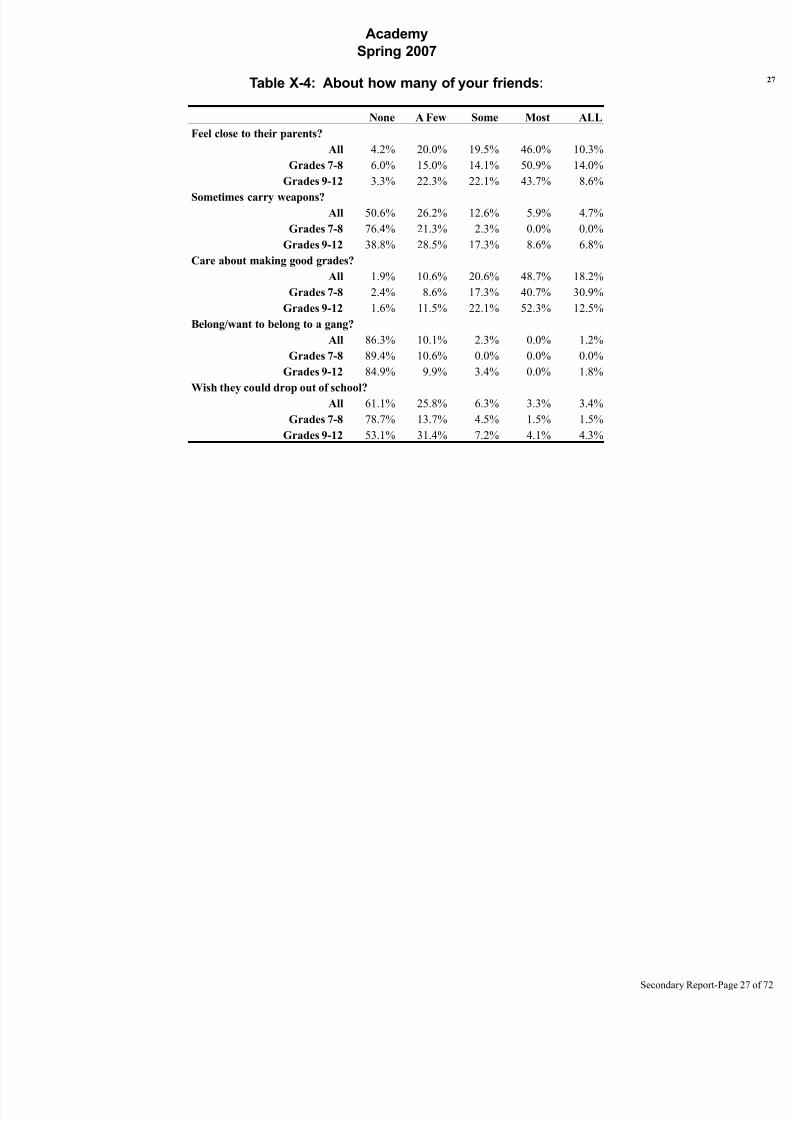
Table X-4: About how many of your friends:
None A Few Some Most ALL
Feel close to their parents?
All 4.2% 20.0% 19.5% 46.0% 10.3%
Grades 7-8 6.0% 15.0% 14.1% 50.9% 14.0%
Grades 9-12 3.3% 22.3% 22.1% 43.7% 8.6%
Sometimes carry weapons?All 50.6% 26.2% 12.6% 5.9% 4.7%
Grades 7-8 76.4% 21.3% 2.3% 0.0% 0.0%
Grades 9-12 38.8% 28.5% 17.3% 8.6% 6.8%
Care about making good grades?
All 1.9% 10.6% 20.6% 48.7% 18.2%
Grades 7-8 2.4% 8.6% 17.3% 40.7% 30.9%
Grades 9-12 1.6% 11.5% 22.1% 52.3% 12.5%
Belong/want to belong to a gang?
All 86.3% 10.1% 2.3% 0.0% 1.2%
Grades 7-8 89.4% 10.6% 0.0% 0.0% 0.0%
Grades 9-12 84.9% 9.9% 3.4% 0.0% 1.8%
Wish they could drop out of school?All 61.1% 25.8% 6.3% 3.3% 3.4%
Grades 7-8 78.7% 13.7% 4.5% 1.5% 1.5%
Grades 9-12 53.1% 31.4% 7.2% 4.1% 4.3%
Secondary Report-Page
8/14/2019 BELL COUNTY - Academy ISD - 2007 Texas School Survey of Drug and Alcohol Use
http://slidepdf.com/reader/full/bell-county-academy-isd-2007-texas-school-survey-of-drug-and-alcohol-use 28/72
Academy
Spring 2007
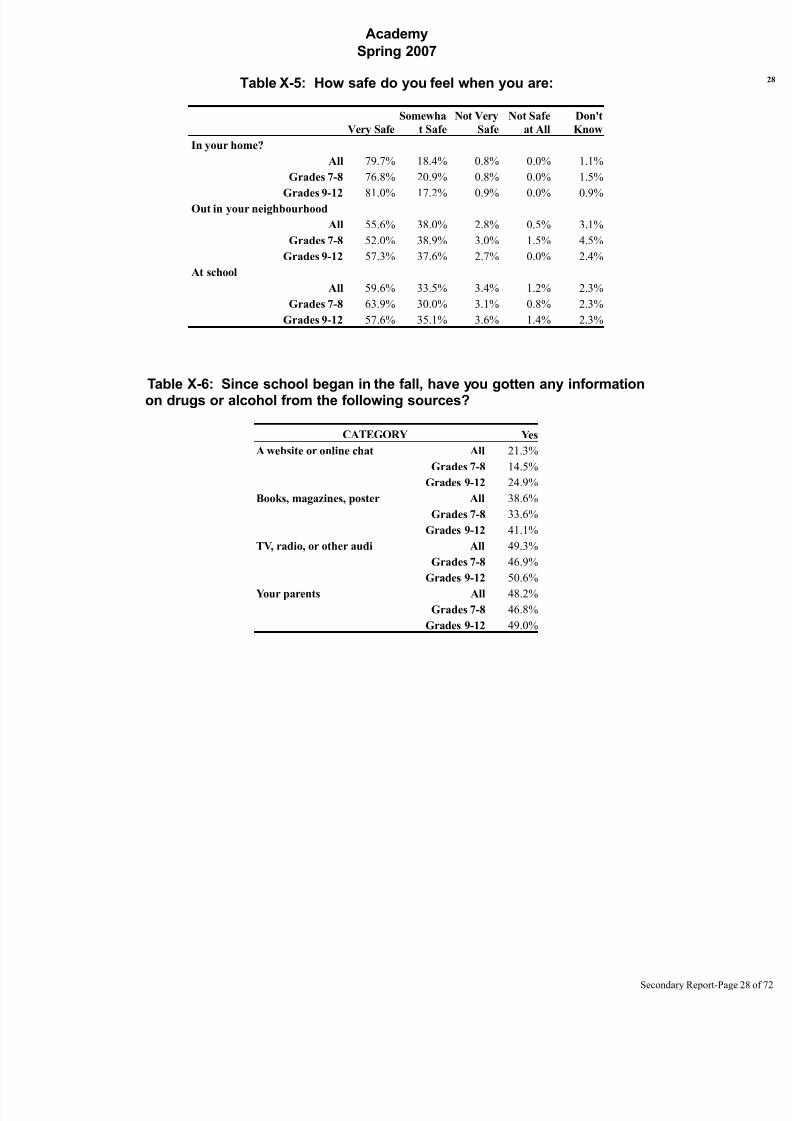
Table X-5: How safe do you feel when you are:
Very Safe
Somewha
t Safe
Not Very
Safe
Not Safe
at All
Don't
Know
In your home?
All 79.7% 18.4% 0.8% 0.0% 1.1%
Grades 7-8 76.8% 20.9% 0.8% 0.0% 1.5%
Grades 9-12 81.0% 17.2% 0.9% 0.0% 0.9%Out in your neighbourhood
All 55.6% 38.0% 2.8% 0.5% 3.1%
Grades 7-8 52.0% 38.9% 3.0% 1.5% 4.5%
Grades 9-12 57.3% 37.6% 2.7% 0.0% 2.4%
At school
All 59.6% 33.5% 3.4% 1.2% 2.3%
Grades 7-8 63.9% 30.0% 3.1% 0.8% 2.3%
Grades 9-12 57.6% 35.1% 3.6% 1.4% 2.3%
Table X-6: Since school began in the fall, have you gotten any informationon drugs or alcohol from the following sources?
CATEGORY Yes
A website or online chat All 21.3%
Grades 7-8 14.5%
Grades 9-12 24.9%
Books, magazines, poster All 38.6%
Grades 7-8 33.6%
Grades 9-12 41.1%
TV, radio, or other audi All 49.3%
Grades 7-8 46.9%
Grades 9-12 50.6%
Your parents All 48.2%
Grades 7-8 46.8%
Grades 9-12 49.0%
Secondary Report-Page

8/14/2019 BELL COUNTY - Academy ISD - 2007 Texas School Survey of Drug and Alcohol Use
http://slidepdf.com/reader/full/bell-county-academy-isd-2007-texas-school-survey-of-drug-and-alcohol-use 29/72
Academy
Spring 2007
Table B1: Prevalence and recency of use of selected substances by gradeAll students
Past
Month
School
Year
Ever
Used
Never
Used
Tobacco
All 16.1% 22.6% 35.6% 64.4%
Grades 7-8 2.2% 4.4% 15.5% 84.5%Grades 9-12 22.8% 31.2% 45.2% 54.8%
Alcohol
All 28.9% 41.3% 63.8% 36.2%
Grades 7-8 11.2% 21.5% 50.3% 49.7%
Grades 9-12 37.3% 50.7% 70.2% 29.8%
Inhalants
All 2.5% 5.0% 14.7% 85.3%
Grades 7-8 2.2% 5.9% 10.4% 89.6%
Grades 9-12 2.6% 4.6% 16.8% 83.2%
Any Illicit Drug
All 5.7% 9.1% 18.7% 81.3%
Grades 7-8 0.0% 0.0% 3.7% 96.3%
Grades 9-12 8.4% 13.4% 25.7% 74.3%
Marijuana
All 5.0% 8.6% 18.7% 81.3%
Grades 7-8 0.0% 0.0% 3.0% 97.0%
Grades 9-12 7.3% 12.7% 26.1% 73.9%
Marijuana Only
All 2.3% 4.0% 10.4% 89.6%
Grades 7-8 0.0% 0.0% 2.2% 97.8%
Grades 9-12 3.3% 5.9% 14.1% 85.9%
Cocaine or Crack
All 1.1% 1.8% 2.7% 97.3%
Grades 7-8 0.0% 0.0% 0.0% 100.0%
Grades 9-12 1.6% 2.6% 3.9% 96.1%Cocaine
All 1.1% 1.5% 2.4% 97.6%
Grades 7-8 0.0% 0.0% 0.0% 100.0%
Grades 9-12 1.6% 2.1% 3.5% 96.5%
Crack
All 0.0% 0.4% 0.4% 99.6%
Grades 7-8 0.0% 0.0% 0.0% 100.0%
Grades 9-12 0.0% 0.5% 0.5% 99.5%
Hallucinogens
All 1.2% 1.6% 3.4% 96.6%
Grades 7-8 0.0% 0.0% 0.0% 100.0%
Grades 9-12 1.8% 2.3% 5.0% 95.0%Uppers
All 2.1% 2.1% 4.9% 95.1%
Grades 7-8 0.0% 0.0% 0.0% 100.0%
Grades 9-12 3.1% 3.1% 7.3% 92.7%
Downers
All 3.1% 3.1% 5.9% 94.1%
Grades 7-8 0.0% 0.0% 0.8% 99.2%
Grades 9-12 4.5% 4.5% 8.2% 91.8%
Secondary Report-Page
8/14/2019 BELL COUNTY - Academy ISD - 2007 Texas School Survey of Drug and Alcohol Use
http://slidepdf.com/reader/full/bell-county-academy-isd-2007-texas-school-survey-of-drug-and-alcohol-use 30/72
Academy
Spring 2007
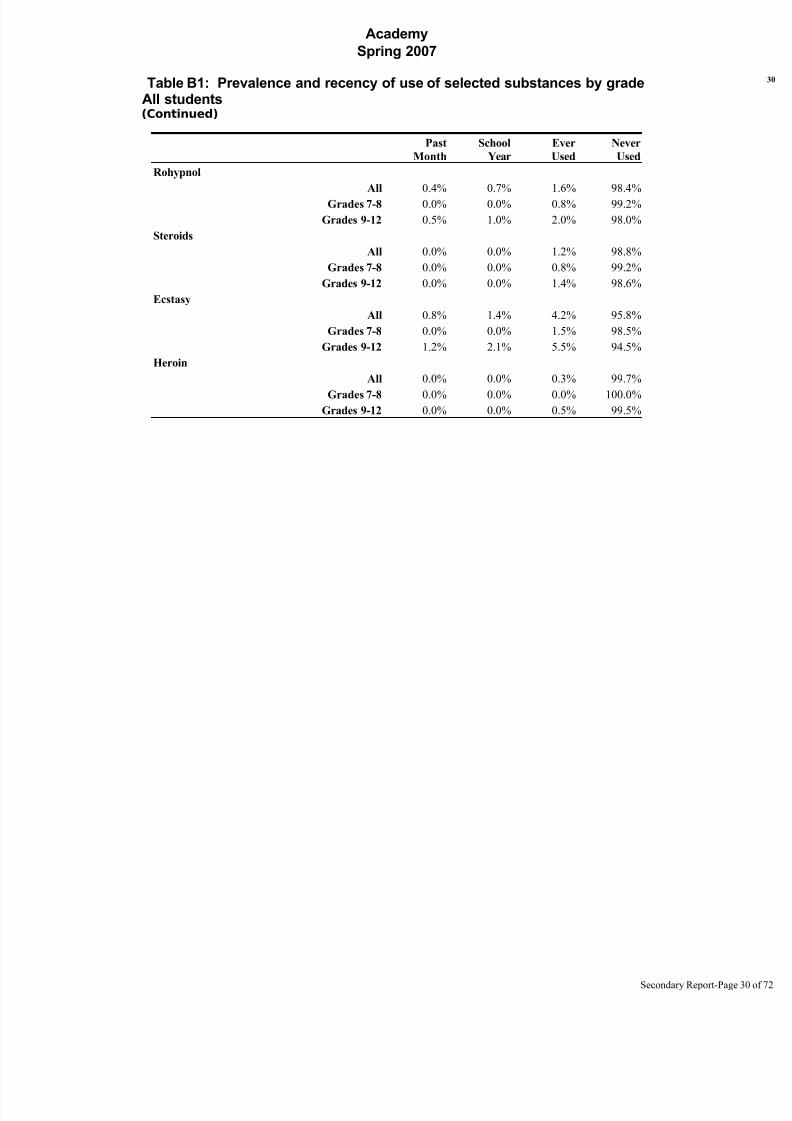
Table B1: Prevalence and recency of use of selected substances by gradeAll students(Continued)
Past
Month
School
Year
Ever
Used
Never
Used
Rohypnol
All 0.4% 0.7% 1.6% 98.4%
Grades 7-8 0.0% 0.0% 0.8% 99.2%
Grades 9-12 0.5% 1.0% 2.0% 98.0%
Steroids
All 0.0% 0.0% 1.2% 98.8%
Grades 7-8 0.0% 0.0% 0.8% 99.2%
Grades 9-12 0.0% 0.0% 1.4% 98.6%
Ecstasy
All 0.8% 1.4% 4.2% 95.8%
Grades 7-8 0.0% 0.0% 1.5% 98.5%
Grades 9-12 1.2% 2.1% 5.5% 94.5%
Heroin
All 0.0% 0.0% 0.3% 99.7%
Grades 7-8 0.0% 0.0% 0.0% 100.0%Grades 9-12 0.0% 0.0% 0.5% 99.5%
Secondary Report-Page
8/14/2019 BELL COUNTY - Academy ISD - 2007 Texas School Survey of Drug and Alcohol Use
http://slidepdf.com/reader/full/bell-county-academy-isd-2007-texas-school-survey-of-drug-and-alcohol-use 31/72
Academy
Spring 2007
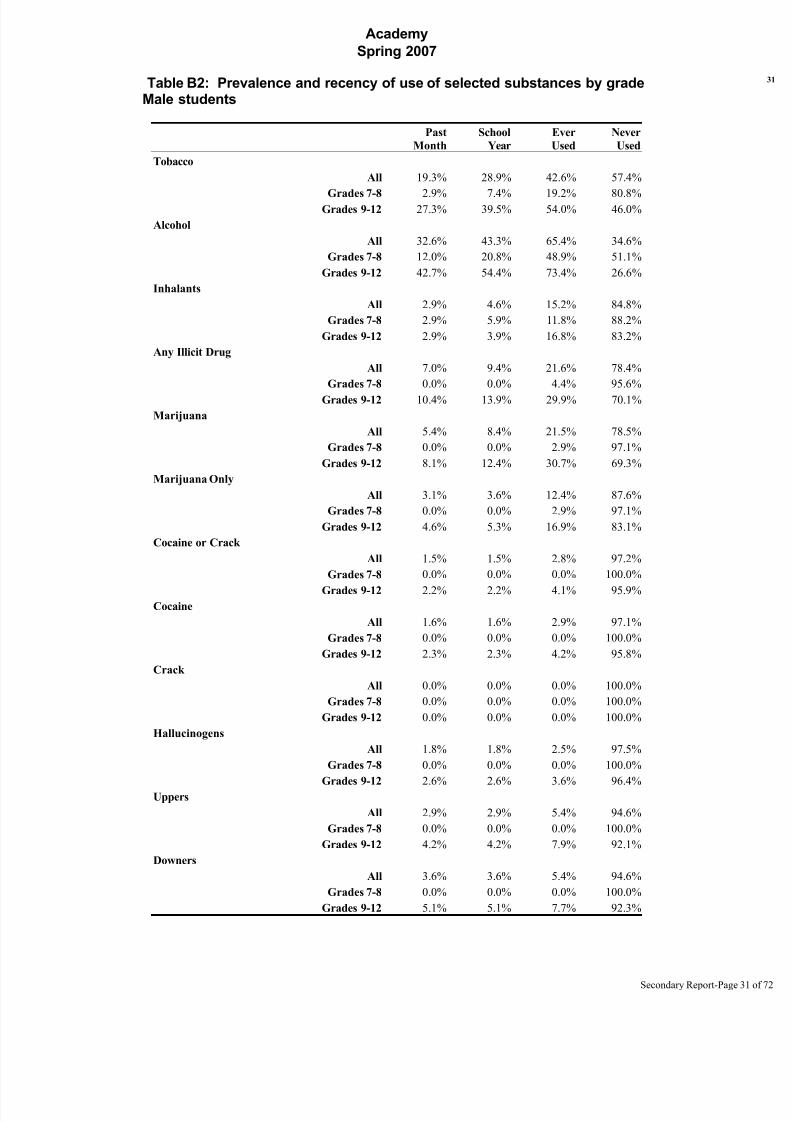
Table B2: Prevalence and recency of use of selected substances by gradeMale students
Past
Month
School
Year
Ever
Used
Never
Used
Tobacco
All 19.3% 28.9% 42.6% 57.4%
Grades 7-8 2.9% 7.4% 19.2% 80.8%Grades 9-12 27.3% 39.5% 54.0% 46.0%
Alcohol
All 32.6% 43.3% 65.4% 34.6%
Grades 7-8 12.0% 20.8% 48.9% 51.1%
Grades 9-12 42.7% 54.4% 73.4% 26.6%
Inhalants
All 2.9% 4.6% 15.2% 84.8%
Grades 7-8 2.9% 5.9% 11.8% 88.2%
Grades 9-12 2.9% 3.9% 16.8% 83.2%
Any Illicit Drug
All 7.0% 9.4% 21.6% 78.4%
Grades 7-8 0.0% 0.0% 4.4% 95.6%
Grades 9-12 10.4% 13.9% 29.9% 70.1%
Marijuana
All 5.4% 8.4% 21.5% 78.5%
Grades 7-8 0.0% 0.0% 2.9% 97.1%
Grades 9-12 8.1% 12.4% 30.7% 69.3%
Marijuana Only
All 3.1% 3.6% 12.4% 87.6%
Grades 7-8 0.0% 0.0% 2.9% 97.1%
Grades 9-12 4.6% 5.3% 16.9% 83.1%
Cocaine or Crack
All 1.5% 1.5% 2.8% 97.2%
Grades 7-8 0.0% 0.0% 0.0% 100.0%
Grades 9-12 2.2% 2.2% 4.1% 95.9%Cocaine
All 1.6% 1.6% 2.9% 97.1%
Grades 7-8 0.0% 0.0% 0.0% 100.0%
Grades 9-12 2.3% 2.3% 4.2% 95.8%
Crack
All 0.0% 0.0% 0.0% 100.0%
Grades 7-8 0.0% 0.0% 0.0% 100.0%
Grades 9-12 0.0% 0.0% 0.0% 100.0%
Hallucinogens
All 1.8% 1.8% 2.5% 97.5%
Grades 7-8 0.0% 0.0% 0.0% 100.0%
Grades 9-12 2.6% 2.6% 3.6% 96.4%Uppers
All 2.9% 2.9% 5.4% 94.6%
Grades 7-8 0.0% 0.0% 0.0% 100.0%
Grades 9-12 4.2% 4.2% 7.9% 92.1%
Downers
All 3.6% 3.6% 5.4% 94.6%
Grades 7-8 0.0% 0.0% 0.0% 100.0%
Grades 9-12 5.1% 5.1% 7.7% 92.3%
Secondary Report-Page
8/14/2019 BELL COUNTY - Academy ISD - 2007 Texas School Survey of Drug and Alcohol Use
http://slidepdf.com/reader/full/bell-county-academy-isd-2007-texas-school-survey-of-drug-and-alcohol-use 32/72
Academy
Spring 2007
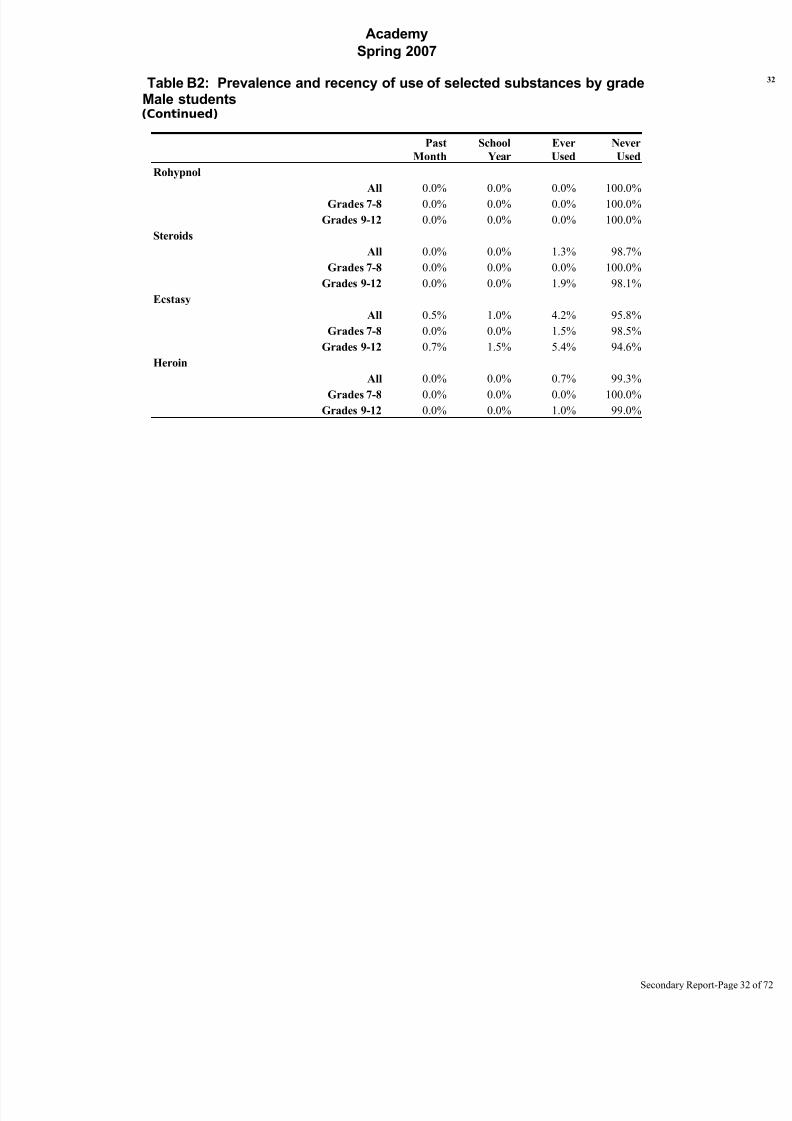
Table B2: Prevalence and recency of use of selected substances by gradeMale students(Continued)
Past
Month
School
Year
Ever
Used
Never
Used
Rohypnol
All 0.0% 0.0% 0.0% 100.0%
Grades 7-8 0.0% 0.0% 0.0% 100.0%
Grades 9-12 0.0% 0.0% 0.0% 100.0%
Steroids
All 0.0% 0.0% 1.3% 98.7%
Grades 7-8 0.0% 0.0% 0.0% 100.0%
Grades 9-12 0.0% 0.0% 1.9% 98.1%
Ecstasy
All 0.5% 1.0% 4.2% 95.8%
Grades 7-8 0.0% 0.0% 1.5% 98.5%
Grades 9-12 0.7% 1.5% 5.4% 94.6%
Heroin
All 0.0% 0.0% 0.7% 99.3%
Grades 7-8 0.0% 0.0% 0.0% 100.0%Grades 9-12 0.0% 0.0% 1.0% 99.0%
Secondary Report-Page
8/14/2019 BELL COUNTY - Academy ISD - 2007 Texas School Survey of Drug and Alcohol Use
http://slidepdf.com/reader/full/bell-county-academy-isd-2007-texas-school-survey-of-drug-and-alcohol-use 33/72
Academy
Spring 2007
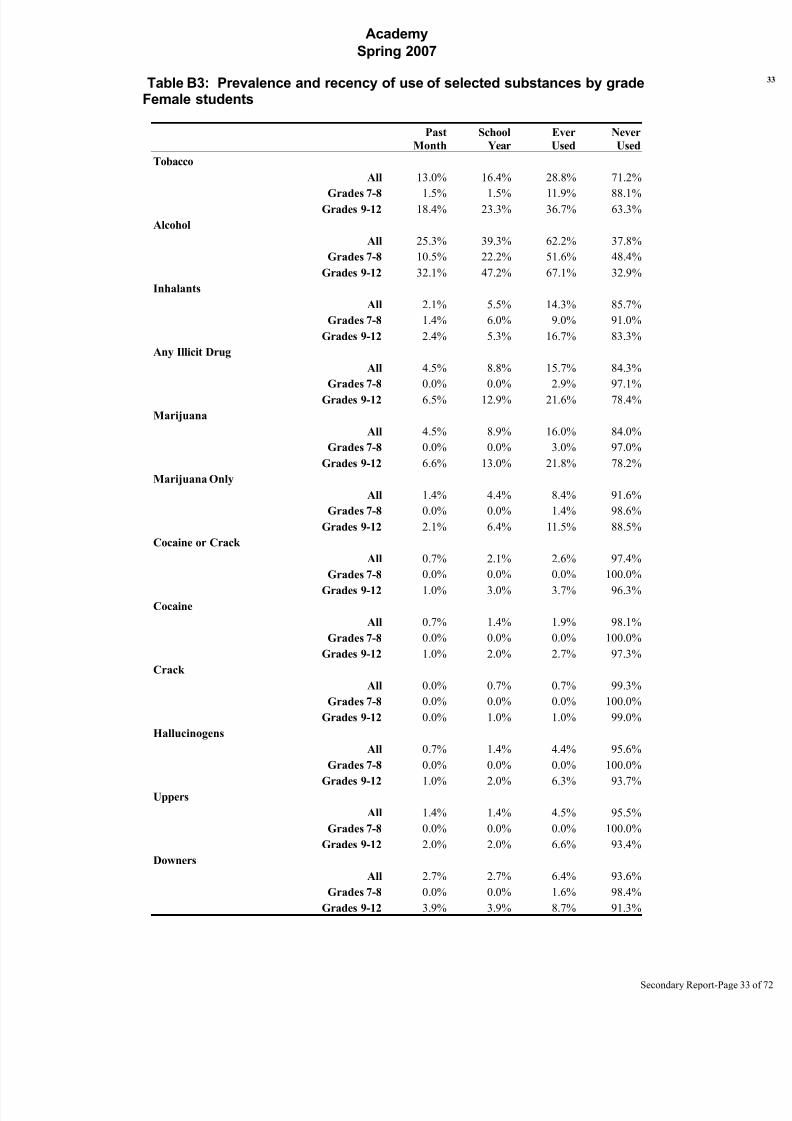
Table B3: Prevalence and recency of use of selected substances by gradeFemale students
Past
Month
School
Year
Ever
Used
Never
Used
Tobacco
All 13.0% 16.4% 28.8% 71.2%
Grades 7-8 1.5% 1.5% 11.9% 88.1%Grades 9-12 18.4% 23.3% 36.7% 63.3%
Alcohol
All 25.3% 39.3% 62.2% 37.8%
Grades 7-8 10.5% 22.2% 51.6% 48.4%
Grades 9-12 32.1% 47.2% 67.1% 32.9%
Inhalants
All 2.1% 5.5% 14.3% 85.7%
Grades 7-8 1.4% 6.0% 9.0% 91.0%
Grades 9-12 2.4% 5.3% 16.7% 83.3%
Any Illicit Drug
All 4.5% 8.8% 15.7% 84.3%
Grades 7-8 0.0% 0.0% 2.9% 97.1%
Grades 9-12 6.5% 12.9% 21.6% 78.4%
Marijuana
All 4.5% 8.9% 16.0% 84.0%
Grades 7-8 0.0% 0.0% 3.0% 97.0%
Grades 9-12 6.6% 13.0% 21.8% 78.2%
Marijuana Only
All 1.4% 4.4% 8.4% 91.6%
Grades 7-8 0.0% 0.0% 1.4% 98.6%
Grades 9-12 2.1% 6.4% 11.5% 88.5%
Cocaine or Crack
All 0.7% 2.1% 2.6% 97.4%
Grades 7-8 0.0% 0.0% 0.0% 100.0%
Grades 9-12 1.0% 3.0% 3.7% 96.3%Cocaine
All 0.7% 1.4% 1.9% 98.1%
Grades 7-8 0.0% 0.0% 0.0% 100.0%
Grades 9-12 1.0% 2.0% 2.7% 97.3%
Crack
All 0.0% 0.7% 0.7% 99.3%
Grades 7-8 0.0% 0.0% 0.0% 100.0%
Grades 9-12 0.0% 1.0% 1.0% 99.0%
Hallucinogens
All 0.7% 1.4% 4.4% 95.6%
Grades 7-8 0.0% 0.0% 0.0% 100.0%
Grades 9-12 1.0% 2.0% 6.3% 93.7%Uppers
All 1.4% 1.4% 4.5% 95.5%
Grades 7-8 0.0% 0.0% 0.0% 100.0%
Grades 9-12 2.0% 2.0% 6.6% 93.4%
Downers
All 2.7% 2.7% 6.4% 93.6%
Grades 7-8 0.0% 0.0% 1.6% 98.4%
Grades 9-12 3.9% 3.9% 8.7% 91.3%
Secondary Report-Page

8/14/2019 BELL COUNTY - Academy ISD - 2007 Texas School Survey of Drug and Alcohol Use
http://slidepdf.com/reader/full/bell-county-academy-isd-2007-texas-school-survey-of-drug-and-alcohol-use 34/72
Academy
Spring 2007
Table B3: Prevalence and recency of use of selected substances by gradeFemale students(Continued)
Past
Month
School
Year
Ever
Used
Never
Used
Rohypnol
All 0.7% 1.4% 3.2% 96.8%
Grades 7-8 0.0% 0.0% 1.6% 98.4%
Grades 9-12 1.0% 2.0% 3.9% 96.1%
Steroids
All 0.0% 0.0% 1.2% 98.8%
Grades 7-8 0.0% 0.0% 1.6% 98.4%
Grades 9-12 0.0% 0.0% 1.0% 99.0%
Ecstasy
All 1.2% 1.9% 4.3% 95.7%
Grades 7-8 0.0% 0.0% 1.5% 98.5%
Grades 9-12 1.7% 2.7% 5.5% 94.5%
Heroin
All 0.0% 0.0% 0.0% 100.0%
Grades 7-8 0.0% 0.0% 0.0% 100.0%Grades 9-12 0.0% 0.0% 0.0% 100.0%
Secondary Report-Page
8/14/2019 BELL COUNTY - Academy ISD - 2007 Texas School Survey of Drug and Alcohol Use
http://slidepdf.com/reader/full/bell-county-academy-isd-2007-texas-school-survey-of-drug-and-alcohol-use 35/72
Academy
Spring 2007
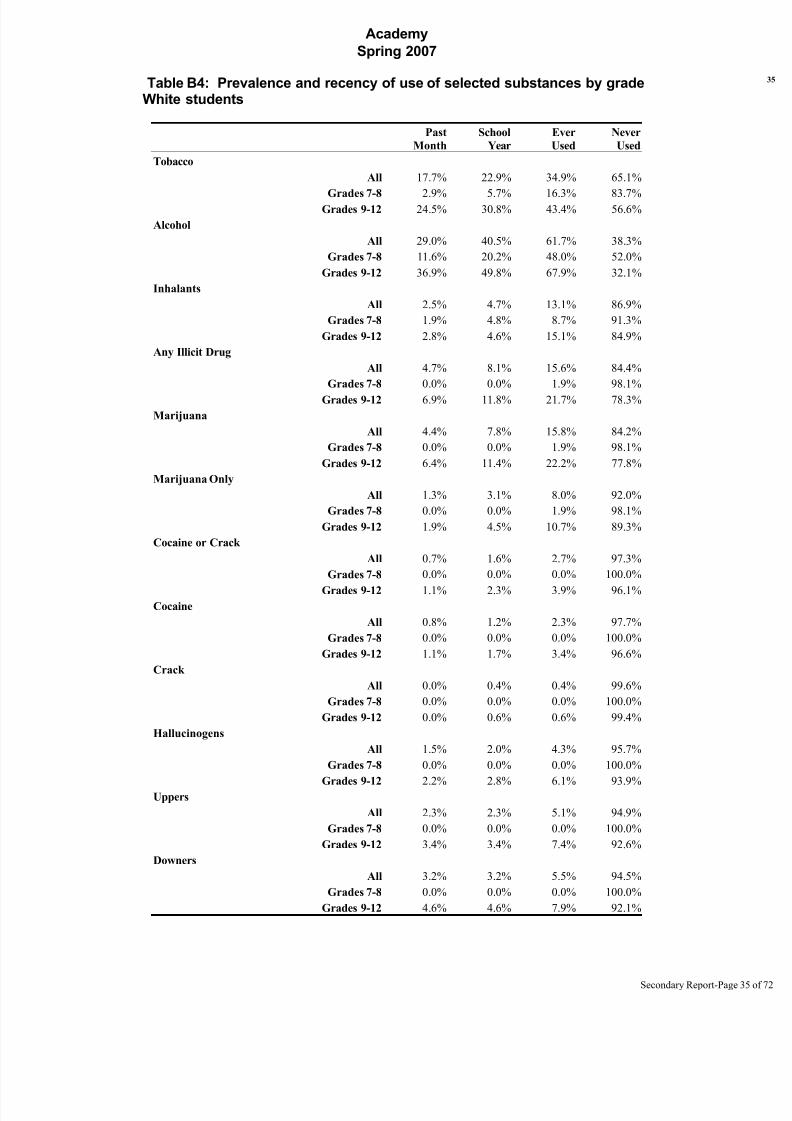
Table B4: Prevalence and recency of use of selected substances by gradeWhite students
Past
Month
School
Year
Ever
Used
Never
Used
Tobacco
All 17.7% 22.9% 34.9% 65.1%
Grades 7-8 2.9% 5.7% 16.3% 83.7%Grades 9-12 24.5% 30.8% 43.4% 56.6%
Alcohol
All 29.0% 40.5% 61.7% 38.3%
Grades 7-8 11.6% 20.2% 48.0% 52.0%
Grades 9-12 36.9% 49.8% 67.9% 32.1%
Inhalants
All 2.5% 4.7% 13.1% 86.9%
Grades 7-8 1.9% 4.8% 8.7% 91.3%
Grades 9-12 2.8% 4.6% 15.1% 84.9%
Any Illicit Drug
All 4.7% 8.1% 15.6% 84.4%
Grades 7-8 0.0% 0.0% 1.9% 98.1%
Grades 9-12 6.9% 11.8% 21.7% 78.3%
Marijuana
All 4.4% 7.8% 15.8% 84.2%
Grades 7-8 0.0% 0.0% 1.9% 98.1%
Grades 9-12 6.4% 11.4% 22.2% 77.8%
Marijuana Only
All 1.3% 3.1% 8.0% 92.0%
Grades 7-8 0.0% 0.0% 1.9% 98.1%
Grades 9-12 1.9% 4.5% 10.7% 89.3%
Cocaine or Crack
All 0.7% 1.6% 2.7% 97.3%
Grades 7-8 0.0% 0.0% 0.0% 100.0%
Grades 9-12 1.1% 2.3% 3.9% 96.1%Cocaine
All 0.8% 1.2% 2.3% 97.7%
Grades 7-8 0.0% 0.0% 0.0% 100.0%
Grades 9-12 1.1% 1.7% 3.4% 96.6%
Crack
All 0.0% 0.4% 0.4% 99.6%
Grades 7-8 0.0% 0.0% 0.0% 100.0%
Grades 9-12 0.0% 0.6% 0.6% 99.4%
Hallucinogens
All 1.5% 2.0% 4.3% 95.7%
Grades 7-8 0.0% 0.0% 0.0% 100.0%
Grades 9-12 2.2% 2.8% 6.1% 93.9%Uppers
All 2.3% 2.3% 5.1% 94.9%
Grades 7-8 0.0% 0.0% 0.0% 100.0%
Grades 9-12 3.4% 3.4% 7.4% 92.6%
Downers
All 3.2% 3.2% 5.5% 94.5%
Grades 7-8 0.0% 0.0% 0.0% 100.0%
Grades 9-12 4.6% 4.6% 7.9% 92.1%
Secondary Report-Page
8/14/2019 BELL COUNTY - Academy ISD - 2007 Texas School Survey of Drug and Alcohol Use
http://slidepdf.com/reader/full/bell-county-academy-isd-2007-texas-school-survey-of-drug-and-alcohol-use 36/72
Academy
Spring 2007
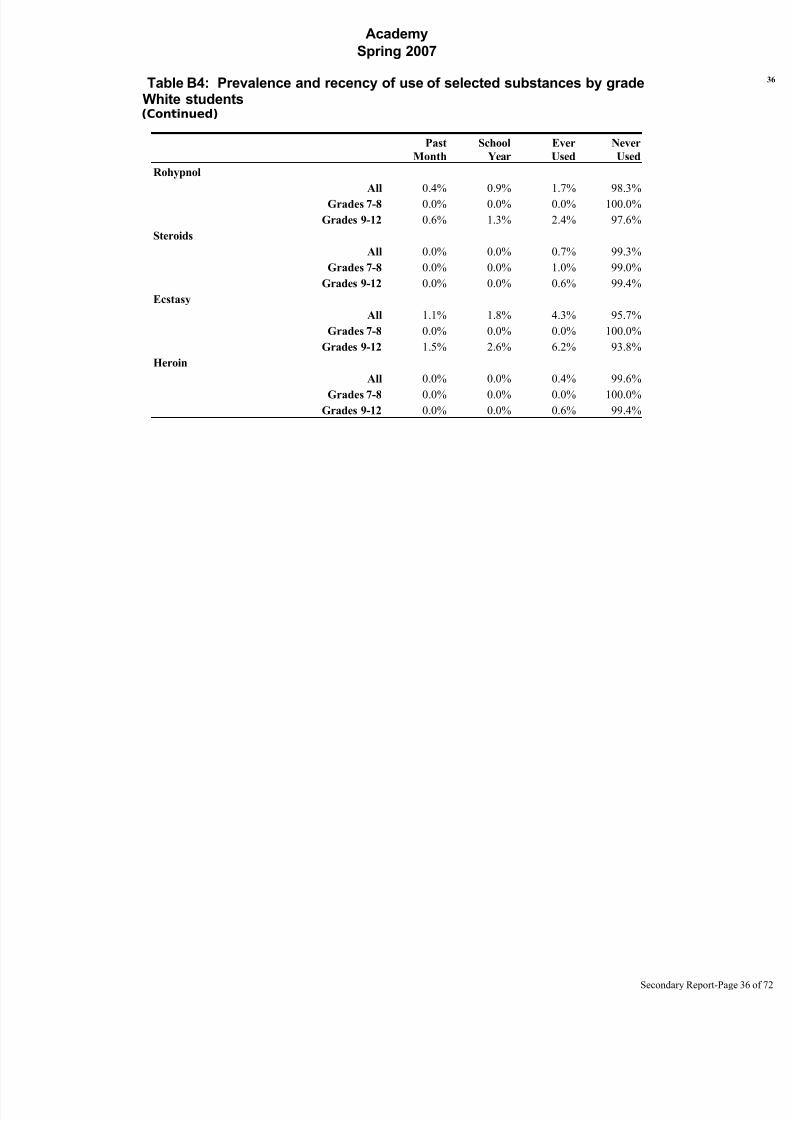
Table B4: Prevalence and recency of use of selected substances by gradeWhite students(Continued)
Past
Month
School
Year
Ever
Used
Never
Used
Rohypnol
All 0.4% 0.9% 1.7% 98.3%
Grades 7-8 0.0% 0.0% 0.0% 100.0%
Grades 9-12 0.6% 1.3% 2.4% 97.6%
Steroids
All 0.0% 0.0% 0.7% 99.3%
Grades 7-8 0.0% 0.0% 1.0% 99.0%
Grades 9-12 0.0% 0.0% 0.6% 99.4%
Ecstasy
All 1.1% 1.8% 4.3% 95.7%
Grades 7-8 0.0% 0.0% 0.0% 100.0%
Grades 9-12 1.5% 2.6% 6.2% 93.8%
Heroin
All 0.0% 0.0% 0.4% 99.6%
Grades 7-8 0.0% 0.0% 0.0% 100.0%Grades 9-12 0.0% 0.0% 0.6% 99.4%
Secondary Report-Page
8/14/2019 BELL COUNTY - Academy ISD - 2007 Texas School Survey of Drug and Alcohol Use
http://slidepdf.com/reader/full/bell-county-academy-isd-2007-texas-school-survey-of-drug-and-alcohol-use 37/72
Academy
Spring 2007
Table B5: Prevalence and recency of use of selected substances by gradeBlack students
Table skipped because an insufficient number of cases.
Secondary Report-Page
8/14/2019 BELL COUNTY - Academy ISD - 2007 Texas School Survey of Drug and Alcohol Use
http://slidepdf.com/reader/full/bell-county-academy-isd-2007-texas-school-survey-of-drug-and-alcohol-use 38/72
Academy
Spring 2007
Table B5: Prevalence and recency of use of selected substances by gradeBlack students(Continued)
Table skipped because an insufficient number of cases.
Secondary Report-Page
8/14/2019 BELL COUNTY - Academy ISD - 2007 Texas School Survey of Drug and Alcohol Use
http://slidepdf.com/reader/full/bell-county-academy-isd-2007-texas-school-survey-of-drug-and-alcohol-use 39/72
Academy
Spring 2007
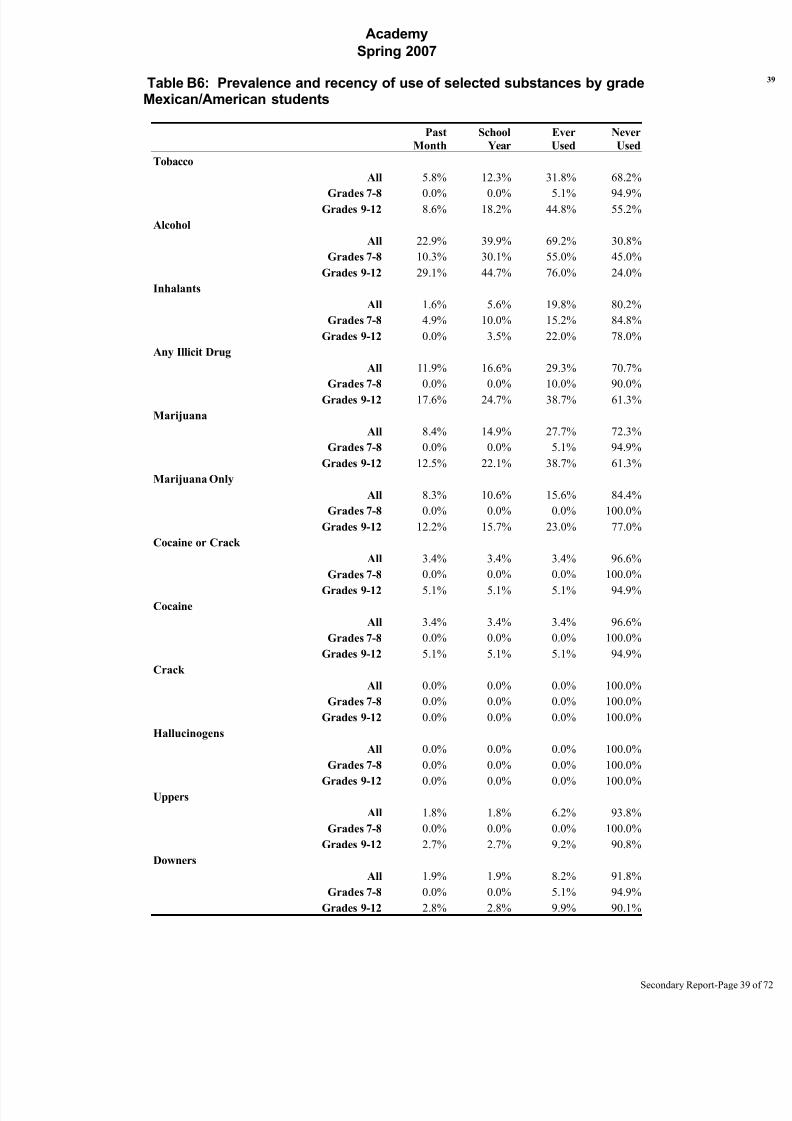
Table B6: Prevalence and recency of use of selected substances by gradeMexican/American students
Past
Month
School
Year
Ever
Used
Never
Used
Tobacco
All 5.8% 12.3% 31.8% 68.2%
Grades 7-8 0.0% 0.0% 5.1% 94.9%Grades 9-12 8.6% 18.2% 44.8% 55.2%
Alcohol
All 22.9% 39.9% 69.2% 30.8%
Grades 7-8 10.3% 30.1% 55.0% 45.0%
Grades 9-12 29.1% 44.7% 76.0% 24.0%
Inhalants
All 1.6% 5.6% 19.8% 80.2%
Grades 7-8 4.9% 10.0% 15.2% 84.8%
Grades 9-12 0.0% 3.5% 22.0% 78.0%
Any Illicit Drug
All 11.9% 16.6% 29.3% 70.7%
Grades 7-8 0.0% 0.0% 10.0% 90.0%
Grades 9-12 17.6% 24.7% 38.7% 61.3%
Marijuana
All 8.4% 14.9% 27.7% 72.3%
Grades 7-8 0.0% 0.0% 5.1% 94.9%
Grades 9-12 12.5% 22.1% 38.7% 61.3%
Marijuana Only
All 8.3% 10.6% 15.6% 84.4%
Grades 7-8 0.0% 0.0% 0.0% 100.0%
Grades 9-12 12.2% 15.7% 23.0% 77.0%
Cocaine or Crack
All 3.4% 3.4% 3.4% 96.6%
Grades 7-8 0.0% 0.0% 0.0% 100.0%
Grades 9-12 5.1% 5.1% 5.1% 94.9%Cocaine
All 3.4% 3.4% 3.4% 96.6%
Grades 7-8 0.0% 0.0% 0.0% 100.0%
Grades 9-12 5.1% 5.1% 5.1% 94.9%
Crack
All 0.0% 0.0% 0.0% 100.0%
Grades 7-8 0.0% 0.0% 0.0% 100.0%
Grades 9-12 0.0% 0.0% 0.0% 100.0%
Hallucinogens
All 0.0% 0.0% 0.0% 100.0%
Grades 7-8 0.0% 0.0% 0.0% 100.0%
Grades 9-12 0.0% 0.0% 0.0% 100.0%Uppers
All 1.8% 1.8% 6.2% 93.8%
Grades 7-8 0.0% 0.0% 0.0% 100.0%
Grades 9-12 2.7% 2.7% 9.2% 90.8%
Downers
All 1.9% 1.9% 8.2% 91.8%
Grades 7-8 0.0% 0.0% 5.1% 94.9%
Grades 9-12 2.8% 2.8% 9.9% 90.1%
Secondary Report-Page
8/14/2019 BELL COUNTY - Academy ISD - 2007 Texas School Survey of Drug and Alcohol Use
http://slidepdf.com/reader/full/bell-county-academy-isd-2007-texas-school-survey-of-drug-and-alcohol-use 40/72
Academy
Spring 2007
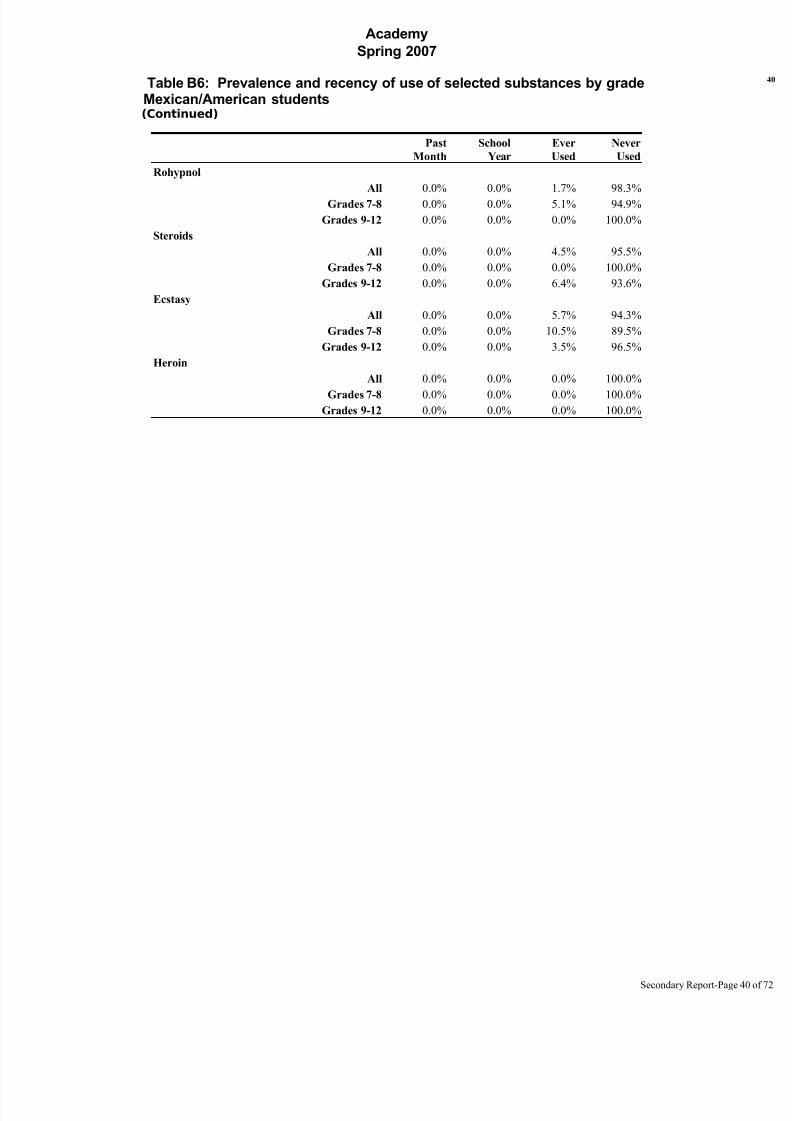
Table B6: Prevalence and recency of use of selected substances by gradeMexican/American students(Continued)
Past
Month
School
Year
Ever
Used
Never
Used
Rohypnol
All 0.0% 0.0% 1.7% 98.3%
Grades 7-8 0.0% 0.0% 5.1% 94.9%
Grades 9-12 0.0% 0.0% 0.0% 100.0%
Steroids
All 0.0% 0.0% 4.5% 95.5%
Grades 7-8 0.0% 0.0% 0.0% 100.0%
Grades 9-12 0.0% 0.0% 6.4% 93.6%
Ecstasy
All 0.0% 0.0% 5.7% 94.3%
Grades 7-8 0.0% 0.0% 10.5% 89.5%
Grades 9-12 0.0% 0.0% 3.5% 96.5%
Heroin
All 0.0% 0.0% 0.0% 100.0%
Grades 7-8 0.0% 0.0% 0.0% 100.0%Grades 9-12 0.0% 0.0% 0.0% 100.0%
Secondary Report-Page
8/14/2019 BELL COUNTY - Academy ISD - 2007 Texas School Survey of Drug and Alcohol Use
http://slidepdf.com/reader/full/bell-county-academy-isd-2007-texas-school-survey-of-drug-and-alcohol-use 41/72
Academy
Spring 2007
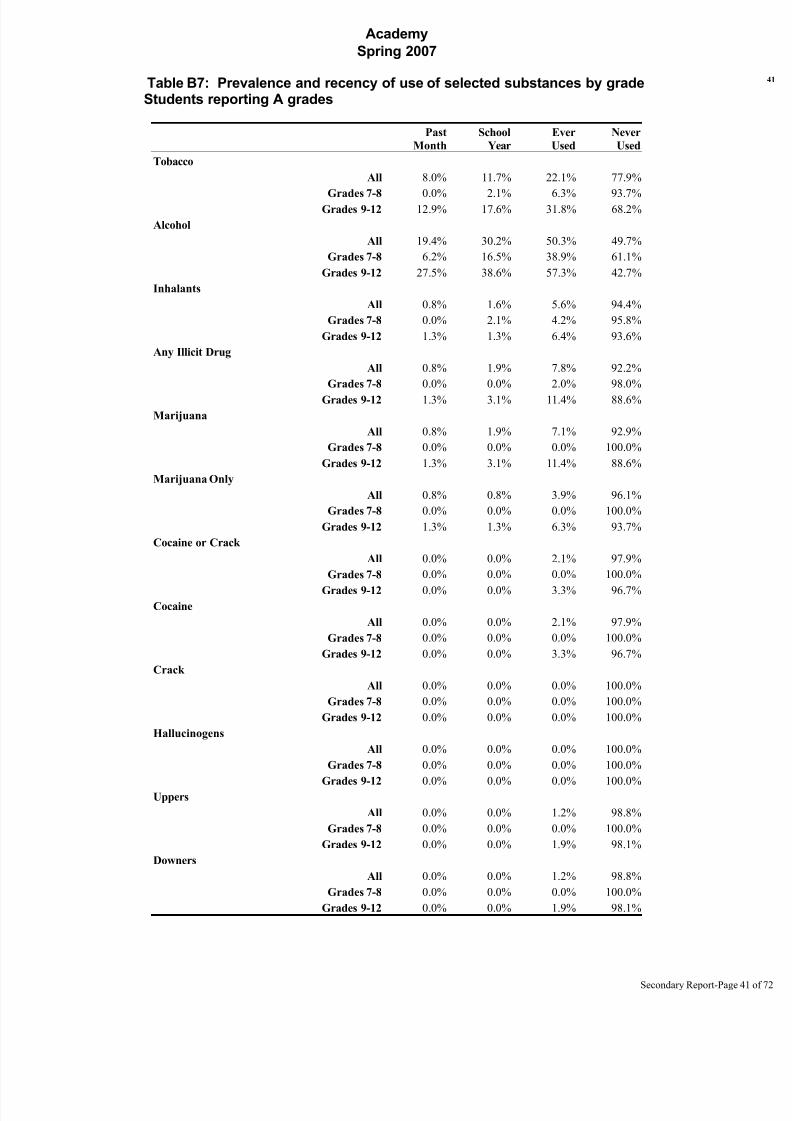
Table B7: Prevalence and recency of use of selected substances by gradeStudents reporting A grades
Past
Month
School
Year
Ever
Used
Never
Used
Tobacco
All 8.0% 11.7% 22.1% 77.9%
Grades 7-8 0.0% 2.1% 6.3% 93.7%Grades 9-12 12.9% 17.6% 31.8% 68.2%
Alcohol
All 19.4% 30.2% 50.3% 49.7%
Grades 7-8 6.2% 16.5% 38.9% 61.1%
Grades 9-12 27.5% 38.6% 57.3% 42.7%
Inhalants
All 0.8% 1.6% 5.6% 94.4%
Grades 7-8 0.0% 2.1% 4.2% 95.8%
Grades 9-12 1.3% 1.3% 6.4% 93.6%
Any Illicit Drug
All 0.8% 1.9% 7.8% 92.2%
Grades 7-8 0.0% 0.0% 2.0% 98.0%
Grades 9-12 1.3% 3.1% 11.4% 88.6%
Marijuana
All 0.8% 1.9% 7.1% 92.9%
Grades 7-8 0.0% 0.0% 0.0% 100.0%
Grades 9-12 1.3% 3.1% 11.4% 88.6%
Marijuana Only
All 0.8% 0.8% 3.9% 96.1%
Grades 7-8 0.0% 0.0% 0.0% 100.0%
Grades 9-12 1.3% 1.3% 6.3% 93.7%
Cocaine or Crack
All 0.0% 0.0% 2.1% 97.9%
Grades 7-8 0.0% 0.0% 0.0% 100.0%
Grades 9-12 0.0% 0.0% 3.3% 96.7%Cocaine
All 0.0% 0.0% 2.1% 97.9%
Grades 7-8 0.0% 0.0% 0.0% 100.0%
Grades 9-12 0.0% 0.0% 3.3% 96.7%
Crack
All 0.0% 0.0% 0.0% 100.0%
Grades 7-8 0.0% 0.0% 0.0% 100.0%
Grades 9-12 0.0% 0.0% 0.0% 100.0%
Hallucinogens
All 0.0% 0.0% 0.0% 100.0%
Grades 7-8 0.0% 0.0% 0.0% 100.0%
Grades 9-12 0.0% 0.0% 0.0% 100.0%Uppers
All 0.0% 0.0% 1.2% 98.8%
Grades 7-8 0.0% 0.0% 0.0% 100.0%
Grades 9-12 0.0% 0.0% 1.9% 98.1%
Downers
All 0.0% 0.0% 1.2% 98.8%
Grades 7-8 0.0% 0.0% 0.0% 100.0%
Grades 9-12 0.0% 0.0% 1.9% 98.1%
Secondary Report-Page

8/14/2019 BELL COUNTY - Academy ISD - 2007 Texas School Survey of Drug and Alcohol Use
http://slidepdf.com/reader/full/bell-county-academy-isd-2007-texas-school-survey-of-drug-and-alcohol-use 42/72
Academy
Spring 2007
Table B7: Prevalence and recency of use of selected substances by gradeStudents reporting A grades(Continued)
Past
Month
School
Year
Ever
Used
Never
Used
Rohypnol
All 0.0% 1.2% 1.2% 98.8%
Grades 7-8 0.0% 0.0% 0.0% 100.0%
Grades 9-12 0.0% 1.8% 1.8% 98.2%
Steroids
All 0.0% 0.0% 0.0% 100.0%
Grades 7-8 0.0% 0.0% 0.0% 100.0%
Grades 9-12 0.0% 0.0% 0.0% 100.0%
Ecstasy
All 0.0% 0.0% 2.9% 97.1%
Grades 7-8 0.0% 0.0% 2.1% 97.9%
Grades 9-12 0.0% 0.0% 3.4% 96.6%
Heroin
All 0.0% 0.0% 0.0% 100.0%
Grades 7-8 0.0% 0.0% 0.0% 100.0%Grades 9-12 0.0% 0.0% 0.0% 100.0%
Secondary Report-Page
8/14/2019 BELL COUNTY - Academy ISD - 2007 Texas School Survey of Drug and Alcohol Use
http://slidepdf.com/reader/full/bell-county-academy-isd-2007-texas-school-survey-of-drug-and-alcohol-use 43/72
Academy
Spring 2007
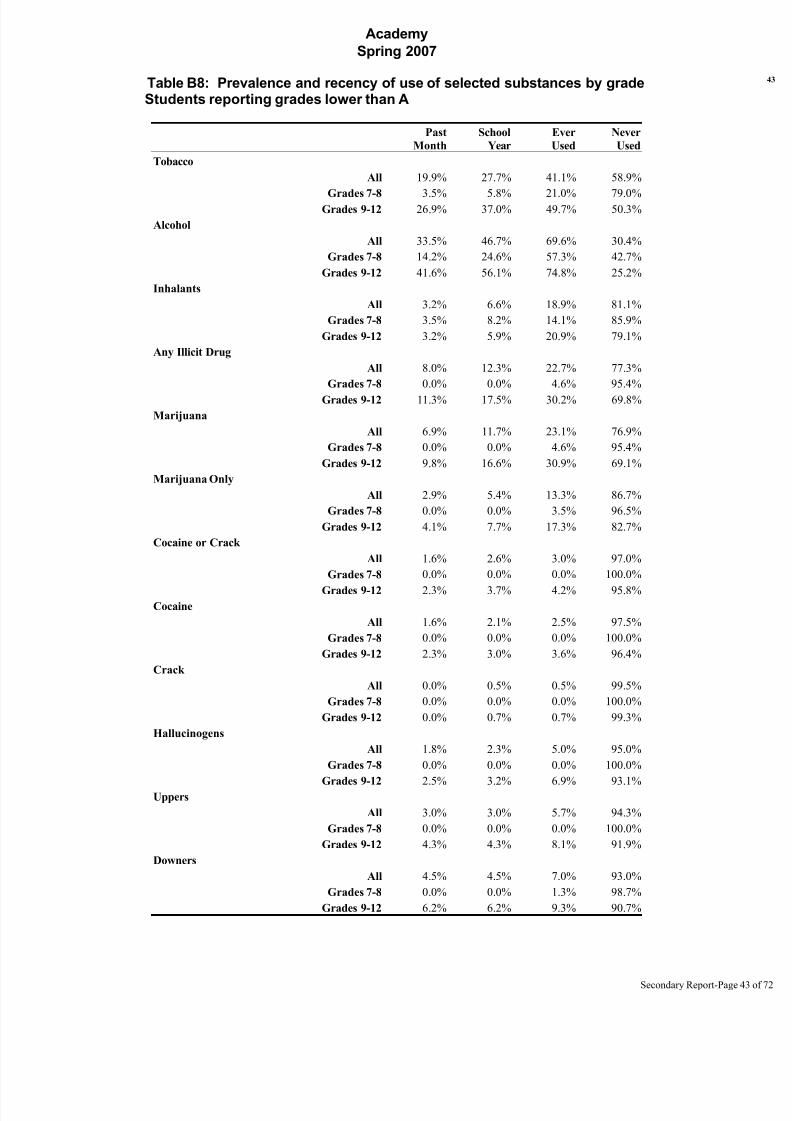
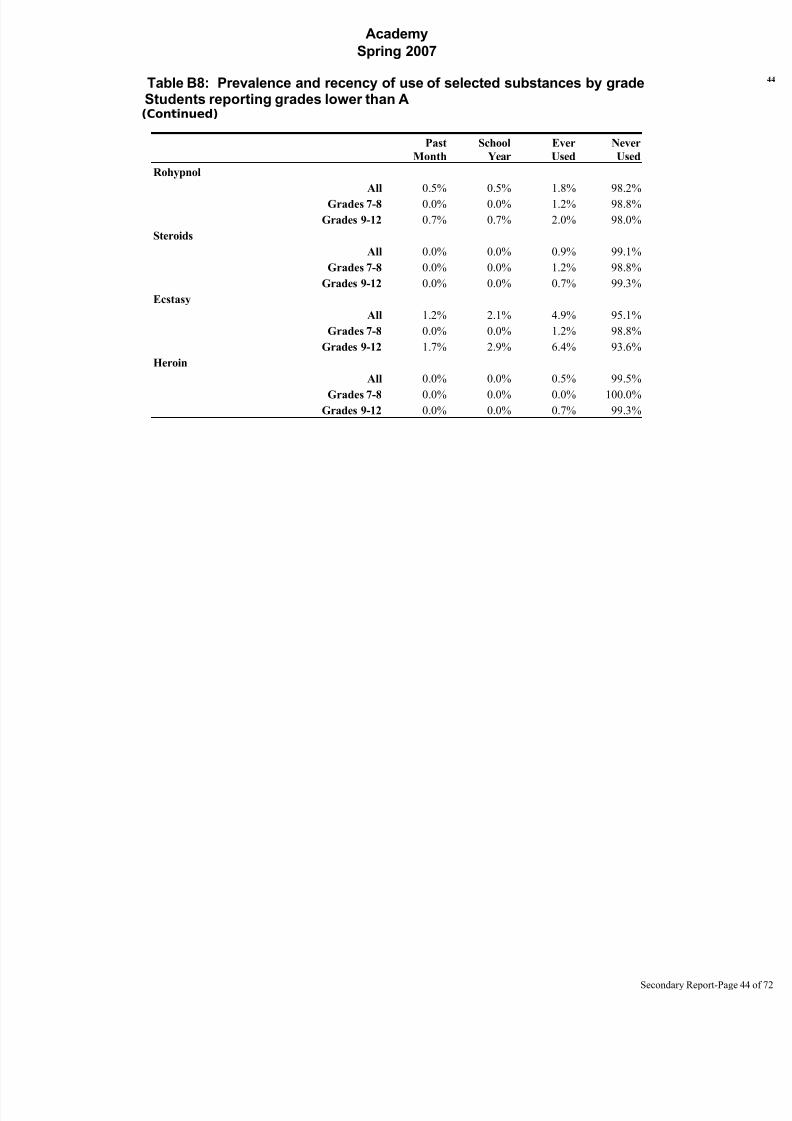
Table B8: Prevalence and recency of use of selected substances by gradeStudents reporting grades lower than A
Past
Month
School
Year
Ever
Used
Never
Used
Tobacco
All 19.9% 27.7% 41.1% 58.9%
Grades 7-8 3.5% 5.8% 21.0% 79.0%Grades 9-12 26.9% 37.0% 49.7% 50.3%
Alcohol
All 33.5% 46.7% 69.6% 30.4%
Grades 7-8 14.2% 24.6% 57.3% 42.7%
Grades 9-12 41.6% 56.1% 74.8% 25.2%
Inhalants
All 3.2% 6.6% 18.9% 81.1%
Grades 7-8 3.5% 8.2% 14.1% 85.9%
Grades 9-12 3.2% 5.9% 20.9% 79.1%
Any Illicit Drug
All 8.0% 12.3% 22.7% 77.3%
Grades 7-8 0.0% 0.0% 4.6% 95.4%
Grades 9-12 11.3% 17.5% 30.2% 69.8%
Marijuana
All 6.9% 11.7% 23.1% 76.9%
Grades 7-8 0.0% 0.0% 4.6% 95.4%
Grades 9-12 9.8% 16.6% 30.9% 69.1%
Marijuana Only
All 2.9% 5.4% 13.3% 86.7%
Grades 7-8 0.0% 0.0% 3.5% 96.5%
Grades 9-12 4.1% 7.7% 17.3% 82.7%
Cocaine or Crack
All 1.6% 2.6% 3.0% 97.0%
Grades 7-8 0.0% 0.0% 0.0% 100.0%
Grades 9-12 2.3% 3.7% 4.2% 95.8%Cocaine
All 1.6% 2.1% 2.5% 97.5%
Grades 7-8 0.0% 0.0% 0.0% 100.0%
Grades 9-12 2.3% 3.0% 3.6% 96.4%
Crack
All 0.0% 0.5% 0.5% 99.5%
Grades 7-8 0.0% 0.0% 0.0% 100.0%
Grades 9-12 0.0% 0.7% 0.7% 99.3%
Hallucinogens
All 1.8% 2.3% 5.0% 95.0%
Grades 7-8 0.0% 0.0% 0.0% 100.0%
Grades 9-12 2.5% 3.2% 6.9% 93.1%Uppers
All 3.0% 3.0% 5.7% 94.3%
Grades 7-8 0.0% 0.0% 0.0% 100.0%
Grades 9-12 4.3% 4.3% 8.1% 91.9%
Downers
All 4.5% 4.5% 7.0% 93.0%
Grades 7-8 0.0% 0.0% 1.3% 98.7%
Grades 9-12 6.2% 6.2% 9.3% 90.7%
Secondary Report-Page
8/14/2019 BELL COUNTY - Academy ISD - 2007 Texas School Survey of Drug and Alcohol Use
http://slidepdf.com/reader/full/bell-county-academy-isd-2007-texas-school-survey-of-drug-and-alcohol-use 44/72
Academy
Spring 2007
Table B8: Prevalence and recency of use of selected substances by gradeStudents reporting grades lower than A(Continued)
Past
Month
School
Year
Ever
Used
Never
Used
Rohypnol
All 0.5% 0.5% 1.8% 98.2%
Grades 7-8 0.0% 0.0% 1.2% 98.8%
Grades 9-12 0.7% 0.7% 2.0% 98.0%
Steroids
All 0.0% 0.0% 0.9% 99.1%
Grades 7-8 0.0% 0.0% 1.2% 98.8%
Grades 9-12 0.0% 0.0% 0.7% 99.3%
Ecstasy
All 1.2% 2.1% 4.9% 95.1%
Grades 7-8 0.0% 0.0% 1.2% 98.8%
Grades 9-12 1.7% 2.9% 6.4% 93.6%
Heroin
All 0.0% 0.0% 0.5% 99.5%
Grades 7-8 0.0% 0.0% 0.0% 100.0%Grades 9-12 0.0% 0.0% 0.7% 99.3%
Secondary Report-Page

8/14/2019 BELL COUNTY - Academy ISD - 2007 Texas School Survey of Drug and Alcohol Use
http://slidepdf.com/reader/full/bell-county-academy-isd-2007-texas-school-survey-of-drug-and-alcohol-use 45/72
Academy
Spring 2007
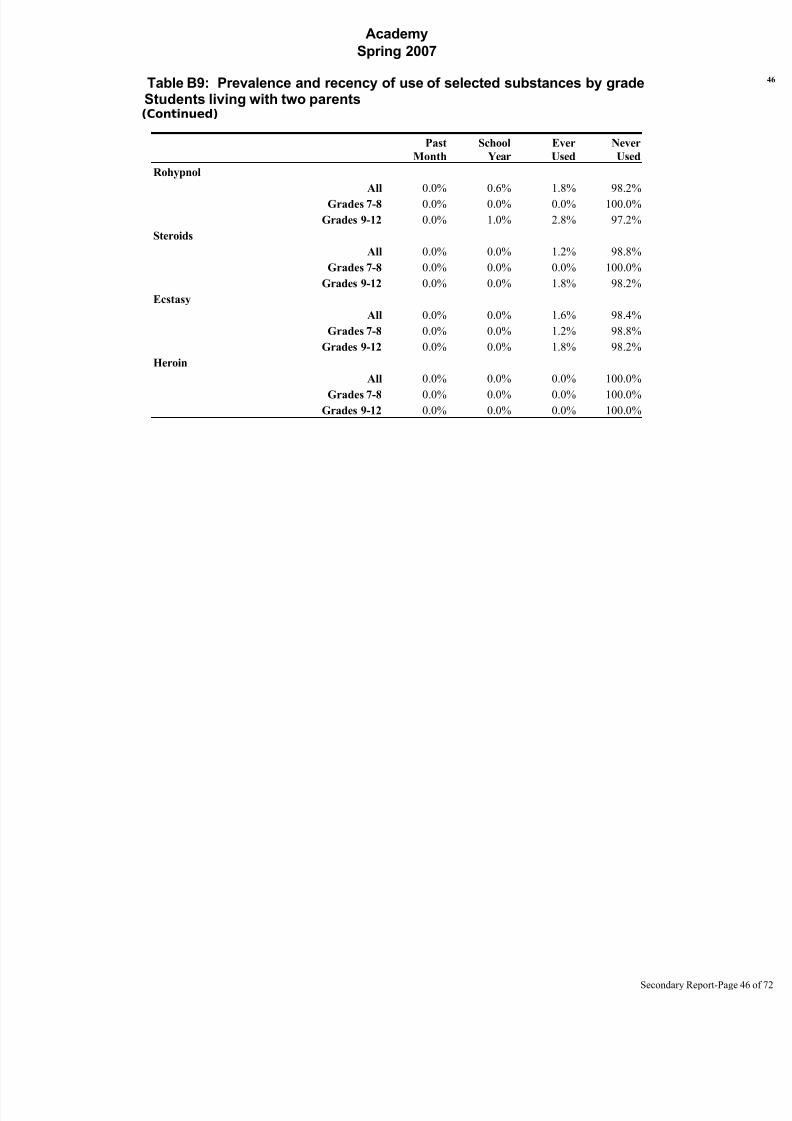
Table B9: Prevalence and recency of use of selected substances by gradeStudents living with two parents
Past
Month
School
Year
Ever
Used
Never
Used
Tobacco
All 11.5% 17.3% 28.3% 71.7%
Grades 7-8 0.0% 3.7% 12.3% 87.7%Grades 9-12 17.9% 24.9% 37.2% 62.8%
Alcohol
All 24.0% 38.1% 57.9% 42.1%
Grades 7-8 10.0% 23.3% 49.0% 51.0%
Grades 9-12 31.9% 46.3% 62.9% 37.1%
Inhalants
All 1.5% 3.4% 12.4% 87.6%
Grades 7-8 2.4% 6.2% 8.7% 91.3%
Grades 9-12 0.9% 1.9% 14.4% 85.6%
Any Illicit Drug
All 3.3% 5.0% 12.2% 87.8%
Grades 7-8 0.0% 0.0% 2.4% 97.6%
Grades 9-12 5.1% 7.7% 17.6% 82.4%
Marijuana
All 2.9% 5.0% 12.0% 88.0%
Grades 7-8 0.0% 0.0% 1.2% 98.8%
Grades 9-12 4.4% 7.8% 17.8% 82.2%
Marijuana Only
All 2.2% 3.2% 7.3% 92.7%
Grades 7-8 0.0% 0.0% 1.2% 98.8%
Grades 9-12 3.3% 5.0% 10.5% 89.5%
Cocaine or Crack
All 1.1% 1.1% 1.1% 98.9%
Grades 7-8 0.0% 0.0% 0.0% 100.0%
Grades 9-12 1.7% 1.7% 1.7% 98.3%Cocaine
All 1.1% 1.1% 1.1% 98.9%
Grades 7-8 0.0% 0.0% 0.0% 100.0%
Grades 9-12 1.7% 1.7% 1.7% 98.3%
Crack
All 0.0% 0.0% 0.0% 100.0%
Grades 7-8 0.0% 0.0% 0.0% 100.0%
Grades 9-12 0.0% 0.0% 0.0% 100.0%
Hallucinogens
All 0.0% 0.6% 2.3% 97.7%
Grades 7-8 0.0% 0.0% 0.0% 100.0%
Grades 9-12 0.0% 1.0% 3.5% 96.5%Uppers
All 0.6% 0.6% 4.1% 95.9%
Grades 7-8 0.0% 0.0% 0.0% 100.0%
Grades 9-12 1.0% 1.0% 6.3% 93.7%
Downers
All 0.6% 0.6% 4.1% 95.9%
Grades 7-8 0.0% 0.0% 0.0% 100.0%
Grades 9-12 1.0% 1.0% 6.3% 93.7%
Secondary Report-Page
8/14/2019 BELL COUNTY - Academy ISD - 2007 Texas School Survey of Drug and Alcohol Use
http://slidepdf.com/reader/full/bell-county-academy-isd-2007-texas-school-survey-of-drug-and-alcohol-use 46/72
Academy
Spring 2007
Table B9: Prevalence and recency of use of selected substances by gradeStudents living with two parents(Continued)
Past
Month
School
Year
Ever
Used
Never
Used
Rohypnol
All 0.0% 0.6% 1.8% 98.2%
Grades 7-8 0.0% 0.0% 0.0% 100.0%
Grades 9-12 0.0% 1.0% 2.8% 97.2%
Steroids
All 0.0% 0.0% 1.2% 98.8%
Grades 7-8 0.0% 0.0% 0.0% 100.0%
Grades 9-12 0.0% 0.0% 1.8% 98.2%
Ecstasy
All 0.0% 0.0% 1.6% 98.4%
Grades 7-8 0.0% 0.0% 1.2% 98.8%
Grades 9-12 0.0% 0.0% 1.8% 98.2%
Heroin
All 0.0% 0.0% 0.0% 100.0%
Grades 7-8 0.0% 0.0% 0.0% 100.0%Grades 9-12 0.0% 0.0% 0.0% 100.0%
Secondary Report-Page

8/14/2019 BELL COUNTY - Academy ISD - 2007 Texas School Survey of Drug and Alcohol Use
http://slidepdf.com/reader/full/bell-county-academy-isd-2007-texas-school-survey-of-drug-and-alcohol-use 47/72
Academy
Spring 2007
Table B10: Prevalence and recency of use of selected substances by gradeStudents not living with two parents
Past
Month
School
Year
Ever
Used
Never
Used
Tobacco
All 21.7% 28.9% 44.4% 55.6%
Grades 7-8 5.6% 5.6% 20.5% 79.5%Grades 9-12 28.0% 38.0% 53.8% 46.2%
Alcohol
All 34.7% 45.1% 70.7% 29.3%
Grades 7-8 13.2% 18.8% 52.3% 47.7%
Grades 9-12 42.9% 55.3% 77.8% 22.2%
Inhalants
All 3.7% 7.0% 17.6% 82.4%
Grades 7-8 1.8% 5.6% 13.1% 86.9%
Grades 9-12 4.5% 7.6% 19.3% 80.7%
Any Illicit Drug
All 8.7% 14.0% 26.3% 73.7%
Grades 7-8 0.0% 0.0% 5.6% 94.4%
Grades 9-12 12.0% 19.4% 34.3% 65.7%
Marijuana
All 7.5% 13.0% 26.9% 73.1%
Grades 7-8 0.0% 0.0% 5.6% 94.4%
Grades 9-12 10.5% 18.1% 35.3% 64.7%
Marijuana Only
All 2.4% 5.0% 14.1% 85.9%
Grades 7-8 0.0% 0.0% 3.7% 96.3%
Grades 9-12 3.3% 6.9% 18.1% 81.9%
Cocaine or Crack
All 1.1% 2.6% 4.5% 95.5%
Grades 7-8 0.0% 0.0% 0.0% 100.0%
Grades 9-12 1.5% 3.6% 6.2% 93.8%Cocaine
All 1.1% 1.9% 3.8% 96.2%
Grades 7-8 0.0% 0.0% 0.0% 100.0%
Grades 9-12 1.5% 2.6% 5.3% 94.7%
Crack
All 0.0% 0.8% 0.8% 99.2%
Grades 7-8 0.0% 0.0% 0.0% 100.0%
Grades 9-12 0.0% 1.0% 1.0% 99.0%
Hallucinogens
All 2.7% 2.7% 4.9% 95.1%
Grades 7-8 0.0% 0.0% 0.0% 100.0%
Grades 9-12 3.8% 3.8% 6.6% 93.4%Uppers
All 3.9% 3.9% 6.0% 94.0%
Grades 7-8 0.0% 0.0% 0.0% 100.0%
Grades 9-12 5.4% 5.4% 8.3% 91.7%
Downers
All 6.1% 6.1% 8.1% 91.9%
Grades 7-8 0.0% 0.0% 2.1% 97.9%
Grades 9-12 8.4% 8.4% 10.3% 89.7%
Secondary Report-Page

8/14/2019 BELL COUNTY - Academy ISD - 2007 Texas School Survey of Drug and Alcohol Use
http://slidepdf.com/reader/full/bell-county-academy-isd-2007-texas-school-survey-of-drug-and-alcohol-use 48/72
Academy
Spring 2007
Table B10: Prevalence and recency of use of selected substances by gradeStudents not living with two parents(Continued)
Past
Month
School
Year
Ever
Used
Never
Used
Rohypnol
All 0.8% 0.8% 1.3% 98.7%
Grades 7-8 0.0% 0.0% 2.0% 98.0%
Grades 9-12 1.1% 1.1% 1.1% 98.9%
Steroids
All 0.0% 0.0% 1.3% 98.7%
Grades 7-8 0.0% 0.0% 2.0% 98.0%
Grades 9-12 0.0% 0.0% 1.0% 99.0%
Ecstasy
All 1.9% 3.2% 7.4% 92.6%
Grades 7-8 0.0% 0.0% 2.0% 98.0%
Grades 9-12 2.5% 4.4% 9.4% 90.6%
Heroin
All 0.0% 0.0% 0.8% 99.2%
Grades 7-8 0.0% 0.0% 0.0% 100.0%Grades 9-12 0.0% 0.0% 1.0% 99.0%
Secondary Report-Page
8/14/2019 BELL COUNTY - Academy ISD - 2007 Texas School Survey of Drug and Alcohol Use
http://slidepdf.com/reader/full/bell-county-academy-isd-2007-texas-school-survey-of-drug-and-alcohol-use 49/72
Academy
Spring 2007
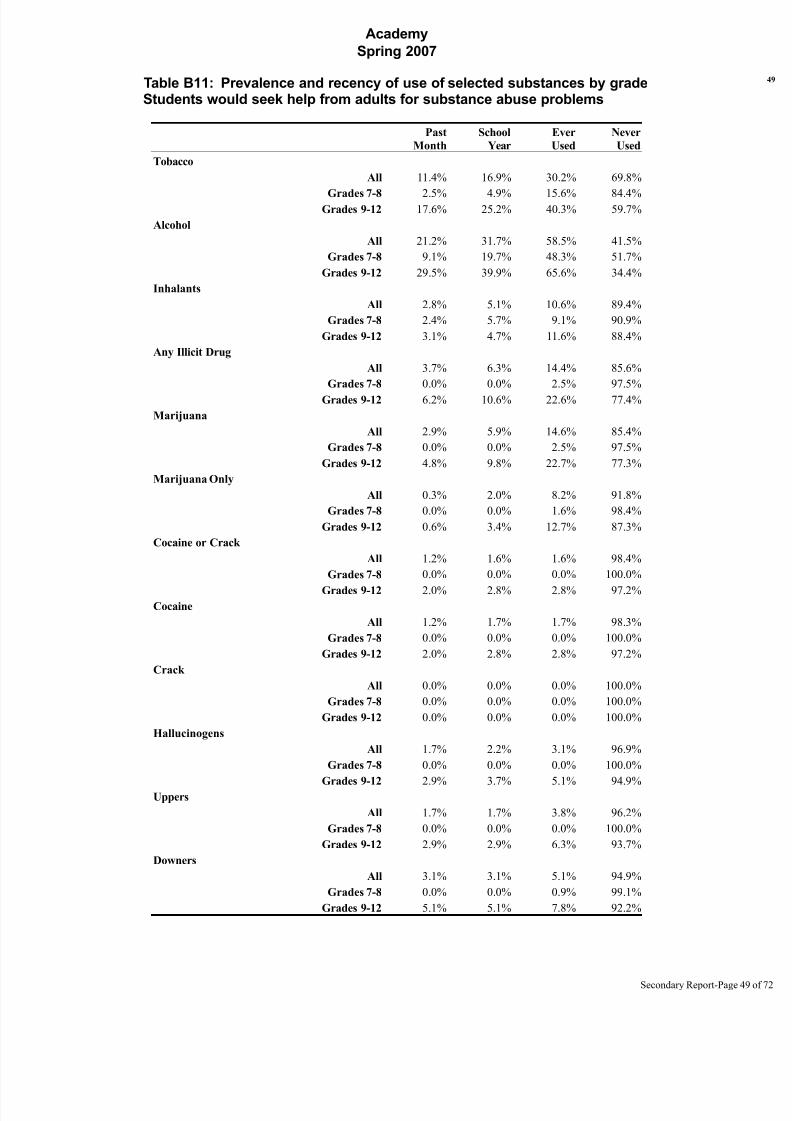
Table B11: Prevalence and recency of use of selected substances by gradeStudents would seek help from adults for substance abuse problems
Past
Month
School
Year
Ever
Used
Never
Used
Tobacco
All 11.4% 16.9% 30.2% 69.8%
Grades 7-8 2.5% 4.9% 15.6% 84.4%Grades 9-12 17.6% 25.2% 40.3% 59.7%
Alcohol
All 21.2% 31.7% 58.5% 41.5%
Grades 7-8 9.1% 19.7% 48.3% 51.7%
Grades 9-12 29.5% 39.9% 65.6% 34.4%
Inhalants
All 2.8% 5.1% 10.6% 89.4%
Grades 7-8 2.4% 5.7% 9.1% 90.9%
Grades 9-12 3.1% 4.7% 11.6% 88.4%
Any Illicit Drug
All 3.7% 6.3% 14.4% 85.6%
Grades 7-8 0.0% 0.0% 2.5% 97.5%
Grades 9-12 6.2% 10.6% 22.6% 77.4%
Marijuana
All 2.9% 5.9% 14.6% 85.4%
Grades 7-8 0.0% 0.0% 2.5% 97.5%
Grades 9-12 4.8% 9.8% 22.7% 77.3%
Marijuana Only
All 0.3% 2.0% 8.2% 91.8%
Grades 7-8 0.0% 0.0% 1.6% 98.4%
Grades 9-12 0.6% 3.4% 12.7% 87.3%
Cocaine or Crack
All 1.2% 1.6% 1.6% 98.4%
Grades 7-8 0.0% 0.0% 0.0% 100.0%
Grades 9-12 2.0% 2.8% 2.8% 97.2%Cocaine
All 1.2% 1.7% 1.7% 98.3%
Grades 7-8 0.0% 0.0% 0.0% 100.0%
Grades 9-12 2.0% 2.8% 2.8% 97.2%
Crack
All 0.0% 0.0% 0.0% 100.0%
Grades 7-8 0.0% 0.0% 0.0% 100.0%
Grades 9-12 0.0% 0.0% 0.0% 100.0%
Hallucinogens
All 1.7% 2.2% 3.1% 96.9%
Grades 7-8 0.0% 0.0% 0.0% 100.0%
Grades 9-12 2.9% 3.7% 5.1% 94.9%Uppers
All 1.7% 1.7% 3.8% 96.2%
Grades 7-8 0.0% 0.0% 0.0% 100.0%
Grades 9-12 2.9% 2.9% 6.3% 93.7%
Downers
All 3.1% 3.1% 5.1% 94.9%
Grades 7-8 0.0% 0.0% 0.9% 99.1%
Grades 9-12 5.1% 5.1% 7.8% 92.2%
Secondary Report-Page
8/14/2019 BELL COUNTY - Academy ISD - 2007 Texas School Survey of Drug and Alcohol Use
http://slidepdf.com/reader/full/bell-county-academy-isd-2007-texas-school-survey-of-drug-and-alcohol-use 50/72
Academy
Spring 2007
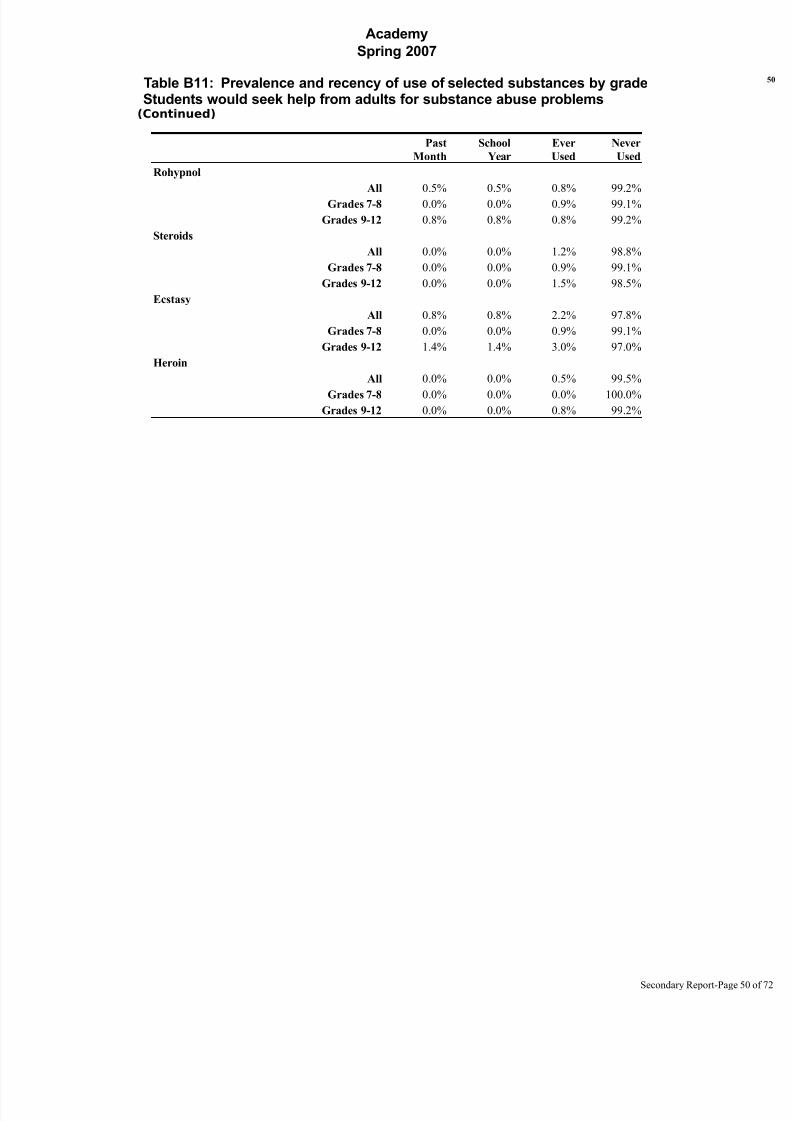
Table B11: Prevalence and recency of use of selected substances by gradeStudents would seek help from adults for substance abuse problems(Continued)
Past
Month
School
Year
Ever
Used
Never
Used
Rohypnol
All 0.5% 0.5% 0.8% 99.2%
Grades 7-8 0.0% 0.0% 0.9% 99.1%
Grades 9-12 0.8% 0.8% 0.8% 99.2%
Steroids
All 0.0% 0.0% 1.2% 98.8%
Grades 7-8 0.0% 0.0% 0.9% 99.1%
Grades 9-12 0.0% 0.0% 1.5% 98.5%
Ecstasy
All 0.8% 0.8% 2.2% 97.8%
Grades 7-8 0.0% 0.0% 0.9% 99.1%
Grades 9-12 1.4% 1.4% 3.0% 97.0%
Heroin
All 0.0% 0.0% 0.5% 99.5%
Grades 7-8 0.0% 0.0% 0.0% 100.0%Grades 9-12 0.0% 0.0% 0.8% 99.2%
Secondary Report-Page
8/14/2019 BELL COUNTY - Academy ISD - 2007 Texas School Survey of Drug and Alcohol Use
http://slidepdf.com/reader/full/bell-county-academy-isd-2007-texas-school-survey-of-drug-and-alcohol-use 51/72
Academy
Spring 2007
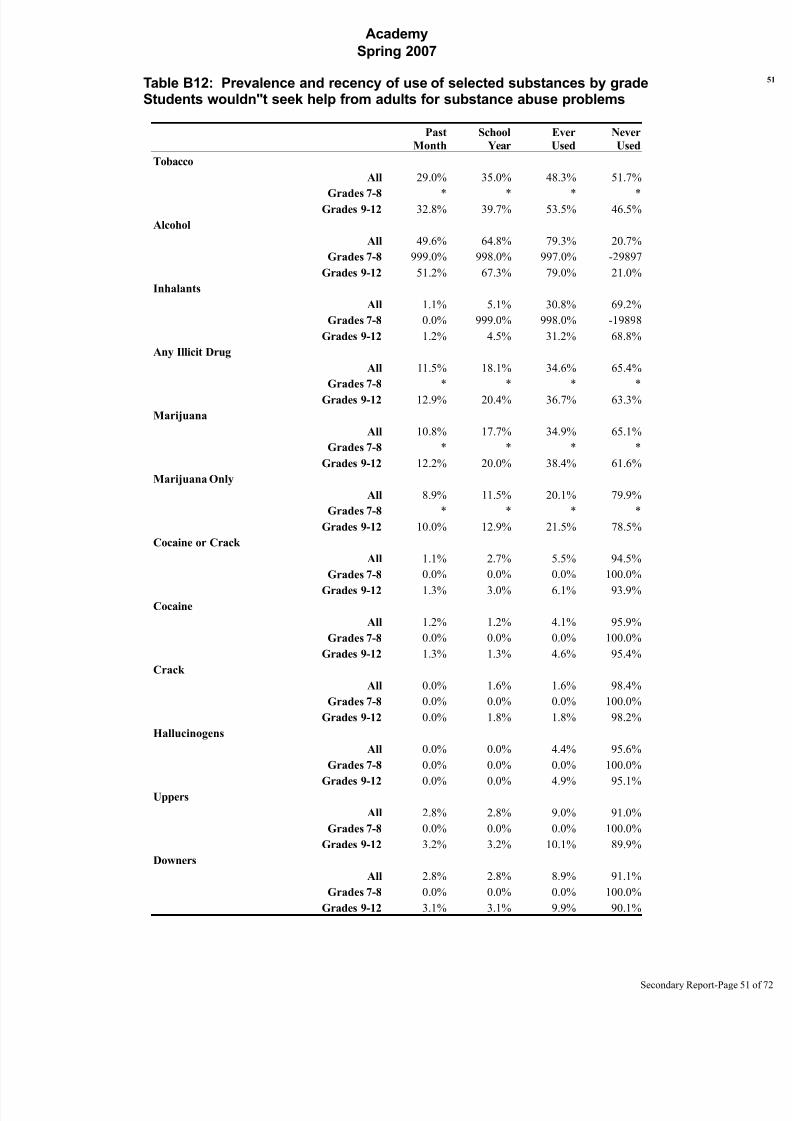
Table B12: Prevalence and recency of use of selected substances by gradeStudents wouldn''t seek help from adults for substance abuse problems
Past
Month
School
Year
Ever
Used
Never
Used
Tobacco
All 29.0% 35.0% 48.3% 51.7%
Grades 7-8 * * * *Grades 9-12 32.8% 39.7% 53.5% 46.5%
Alcohol
All 49.6% 64.8% 79.3% 20.7%
Grades 7-8 999.0% 998.0% 997.0% -29897
Grades 9-12 51.2% 67.3% 79.0% 21.0%
Inhalants
All 1.1% 5.1% 30.8% 69.2%
Grades 7-8 0.0% 999.0% 998.0% -19898
Grades 9-12 1.2% 4.5% 31.2% 68.8%
Any Illicit Drug
All 11.5% 18.1% 34.6% 65.4%
Grades 7-8 * * * *
Grades 9-12 12.9% 20.4% 36.7% 63.3%
Marijuana
All 10.8% 17.7% 34.9% 65.1%
Grades 7-8 * * * *
Grades 9-12 12.2% 20.0% 38.4% 61.6%
Marijuana Only
All 8.9% 11.5% 20.1% 79.9%
Grades 7-8 * * * *
Grades 9-12 10.0% 12.9% 21.5% 78.5%
Cocaine or Crack
All 1.1% 2.7% 5.5% 94.5%
Grades 7-8 0.0% 0.0% 0.0% 100.0%
Grades 9-12 1.3% 3.0% 6.1% 93.9%Cocaine
All 1.2% 1.2% 4.1% 95.9%
Grades 7-8 0.0% 0.0% 0.0% 100.0%
Grades 9-12 1.3% 1.3% 4.6% 95.4%
Crack
All 0.0% 1.6% 1.6% 98.4%
Grades 7-8 0.0% 0.0% 0.0% 100.0%
Grades 9-12 0.0% 1.8% 1.8% 98.2%
Hallucinogens
All 0.0% 0.0% 4.4% 95.6%
Grades 7-8 0.0% 0.0% 0.0% 100.0%
Grades 9-12 0.0% 0.0% 4.9% 95.1%Uppers
All 2.8% 2.8% 9.0% 91.0%
Grades 7-8 0.0% 0.0% 0.0% 100.0%
Grades 9-12 3.2% 3.2% 10.1% 89.9%
Downers
All 2.8% 2.8% 8.9% 91.1%
Grades 7-8 0.0% 0.0% 0.0% 100.0%
Grades 9-12 3.1% 3.1% 9.9% 90.1%
Secondary Report-Page
8/14/2019 BELL COUNTY - Academy ISD - 2007 Texas School Survey of Drug and Alcohol Use
http://slidepdf.com/reader/full/bell-county-academy-isd-2007-texas-school-survey-of-drug-and-alcohol-use 52/72
Academy
Spring 2007
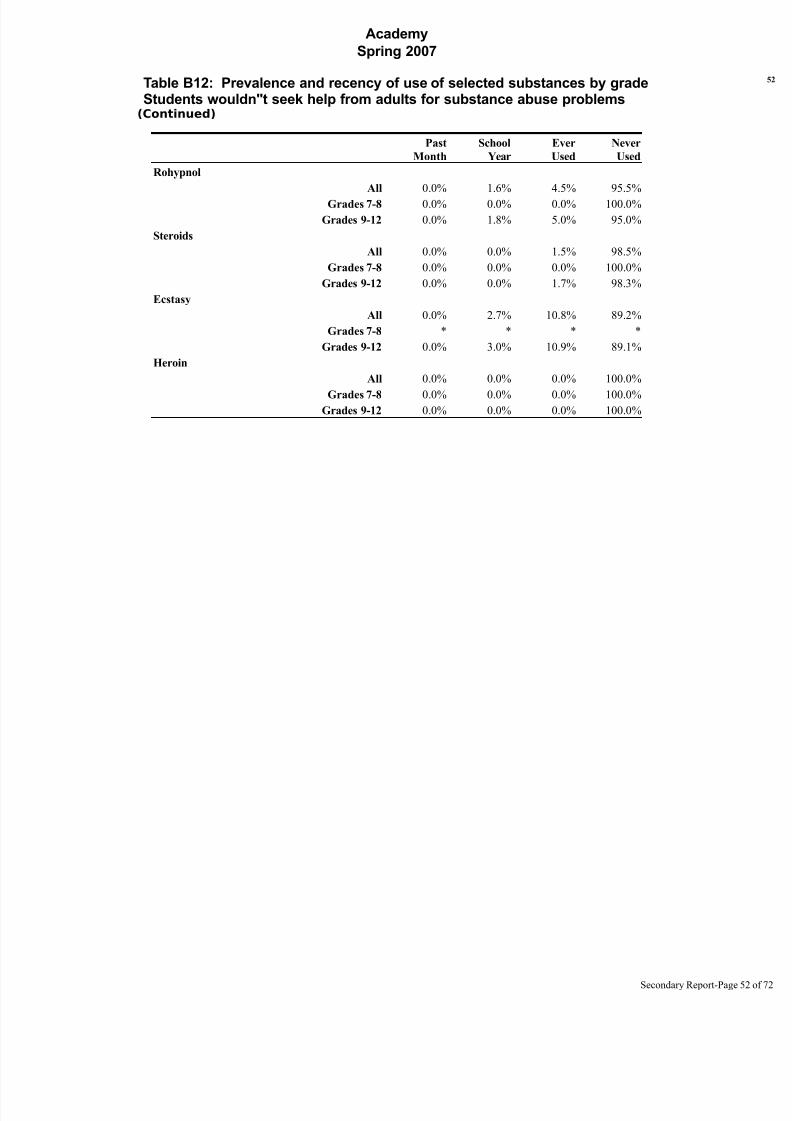
Table B12: Prevalence and recency of use of selected substances by gradeStudents wouldn''t seek help from adults for substance abuse problems(Continued)
Past
Month
School
Year
Ever
Used
Never
Used
Rohypnol
All 0.0% 1.6% 4.5% 95.5%
Grades 7-8 0.0% 0.0% 0.0% 100.0%
Grades 9-12 0.0% 1.8% 5.0% 95.0%
Steroids
All 0.0% 0.0% 1.5% 98.5%
Grades 7-8 0.0% 0.0% 0.0% 100.0%
Grades 9-12 0.0% 0.0% 1.7% 98.3%
Ecstasy
All 0.0% 2.7% 10.8% 89.2%
Grades 7-8 * * * *
Grades 9-12 0.0% 3.0% 10.9% 89.1%
Heroin
All 0.0% 0.0% 0.0% 100.0%
Grades 7-8 0.0% 0.0% 0.0% 100.0%Grades 9-12 0.0% 0.0% 0.0% 100.0%
Secondary Report-Page
8/14/2019 BELL COUNTY - Academy ISD - 2007 Texas School Survey of Drug and Alcohol Use
http://slidepdf.com/reader/full/bell-county-academy-isd-2007-texas-school-survey-of-drug-and-alcohol-use 53/72
Academy
Spring 2007
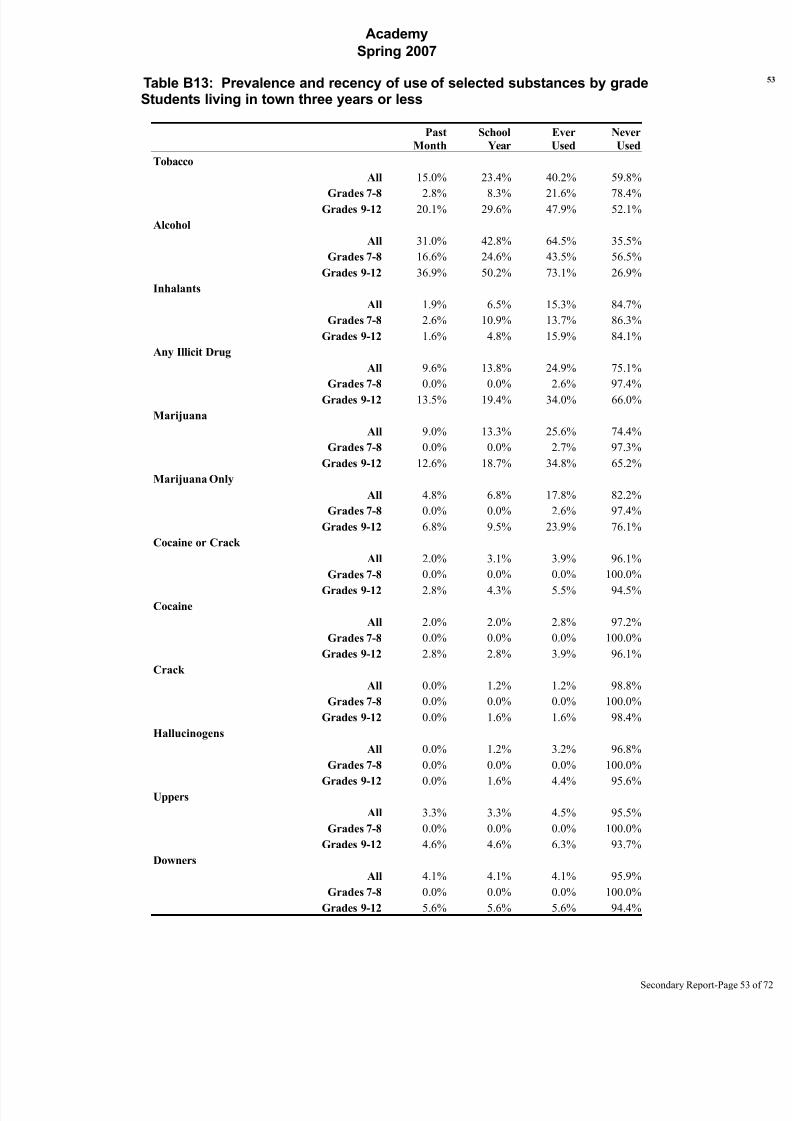
Table B13: Prevalence and recency of use of selected substances by gradeStudents living in town three years or less
Past
Month
School
Year
Ever
Used
Never
Used
Tobacco
All 15.0% 23.4% 40.2% 59.8%
Grades 7-8 2.8% 8.3% 21.6% 78.4%Grades 9-12 20.1% 29.6% 47.9% 52.1%
Alcohol
All 31.0% 42.8% 64.5% 35.5%
Grades 7-8 16.6% 24.6% 43.5% 56.5%
Grades 9-12 36.9% 50.2% 73.1% 26.9%
Inhalants
All 1.9% 6.5% 15.3% 84.7%
Grades 7-8 2.6% 10.9% 13.7% 86.3%
Grades 9-12 1.6% 4.8% 15.9% 84.1%
Any Illicit Drug
All 9.6% 13.8% 24.9% 75.1%
Grades 7-8 0.0% 0.0% 2.6% 97.4%
Grades 9-12 13.5% 19.4% 34.0% 66.0%
Marijuana
All 9.0% 13.3% 25.6% 74.4%
Grades 7-8 0.0% 0.0% 2.7% 97.3%
Grades 9-12 12.6% 18.7% 34.8% 65.2%
Marijuana Only
All 4.8% 6.8% 17.8% 82.2%
Grades 7-8 0.0% 0.0% 2.6% 97.4%
Grades 9-12 6.8% 9.5% 23.9% 76.1%
Cocaine or Crack
All 2.0% 3.1% 3.9% 96.1%
Grades 7-8 0.0% 0.0% 0.0% 100.0%
Grades 9-12 2.8% 4.3% 5.5% 94.5%Cocaine
All 2.0% 2.0% 2.8% 97.2%
Grades 7-8 0.0% 0.0% 0.0% 100.0%
Grades 9-12 2.8% 2.8% 3.9% 96.1%
Crack
All 0.0% 1.2% 1.2% 98.8%
Grades 7-8 0.0% 0.0% 0.0% 100.0%
Grades 9-12 0.0% 1.6% 1.6% 98.4%
Hallucinogens
All 0.0% 1.2% 3.2% 96.8%
Grades 7-8 0.0% 0.0% 0.0% 100.0%
Grades 9-12 0.0% 1.6% 4.4% 95.6%Uppers
All 3.3% 3.3% 4.5% 95.5%
Grades 7-8 0.0% 0.0% 0.0% 100.0%
Grades 9-12 4.6% 4.6% 6.3% 93.7%
Downers
All 4.1% 4.1% 4.1% 95.9%
Grades 7-8 0.0% 0.0% 0.0% 100.0%
Grades 9-12 5.6% 5.6% 5.6% 94.4%
Secondary Report-Page
8/14/2019 BELL COUNTY - Academy ISD - 2007 Texas School Survey of Drug and Alcohol Use
http://slidepdf.com/reader/full/bell-county-academy-isd-2007-texas-school-survey-of-drug-and-alcohol-use 54/72
Academy
Spring 2007
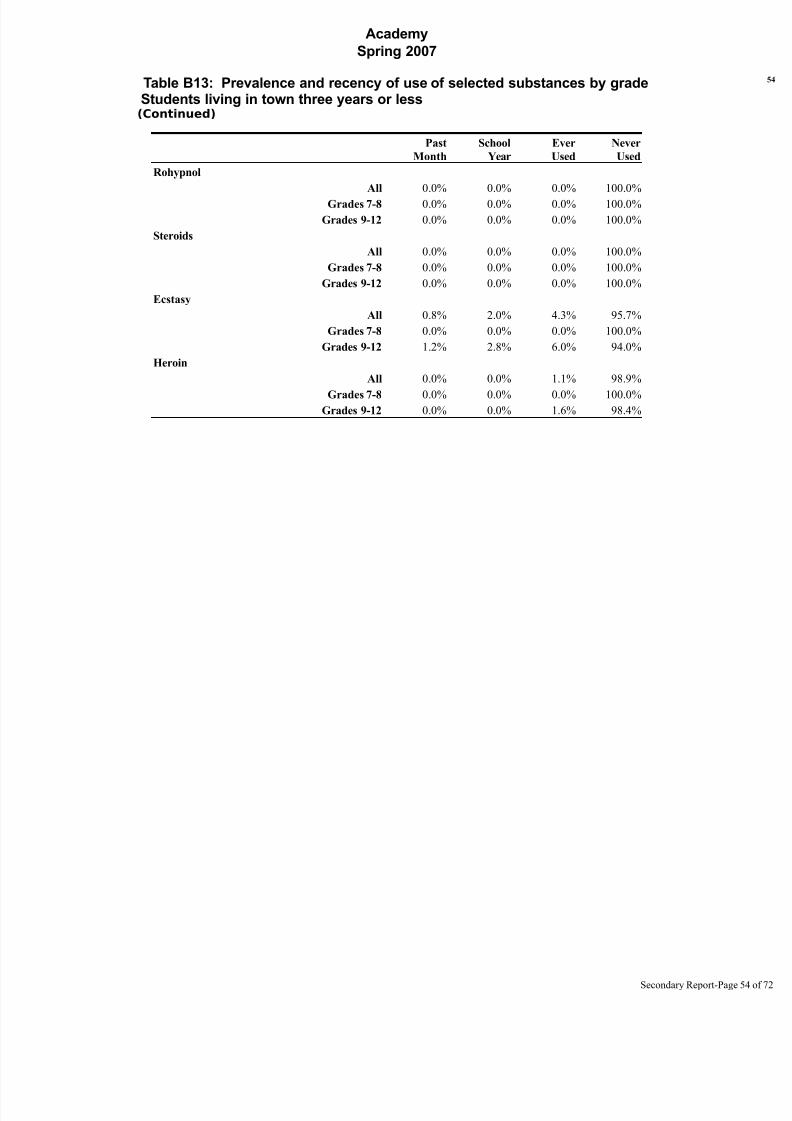
Table B13: Prevalence and recency of use of selected substances by gradeStudents living in town three years or less(Continued)
Past
Month
School
Year
Ever
Used
Never
Used
Rohypnol
All 0.0% 0.0% 0.0% 100.0%
Grades 7-8 0.0% 0.0% 0.0% 100.0%
Grades 9-12 0.0% 0.0% 0.0% 100.0%
Steroids
All 0.0% 0.0% 0.0% 100.0%
Grades 7-8 0.0% 0.0% 0.0% 100.0%
Grades 9-12 0.0% 0.0% 0.0% 100.0%
Ecstasy
All 0.8% 2.0% 4.3% 95.7%
Grades 7-8 0.0% 0.0% 0.0% 100.0%
Grades 9-12 1.2% 2.8% 6.0% 94.0%
Heroin
All 0.0% 0.0% 1.1% 98.9%
Grades 7-8 0.0% 0.0% 0.0% 100.0%Grades 9-12 0.0% 0.0% 1.6% 98.4%
Secondary Report-Page
8/14/2019 BELL COUNTY - Academy ISD - 2007 Texas School Survey of Drug and Alcohol Use
http://slidepdf.com/reader/full/bell-county-academy-isd-2007-texas-school-survey-of-drug-and-alcohol-use 55/72
Academy
Spring 2007
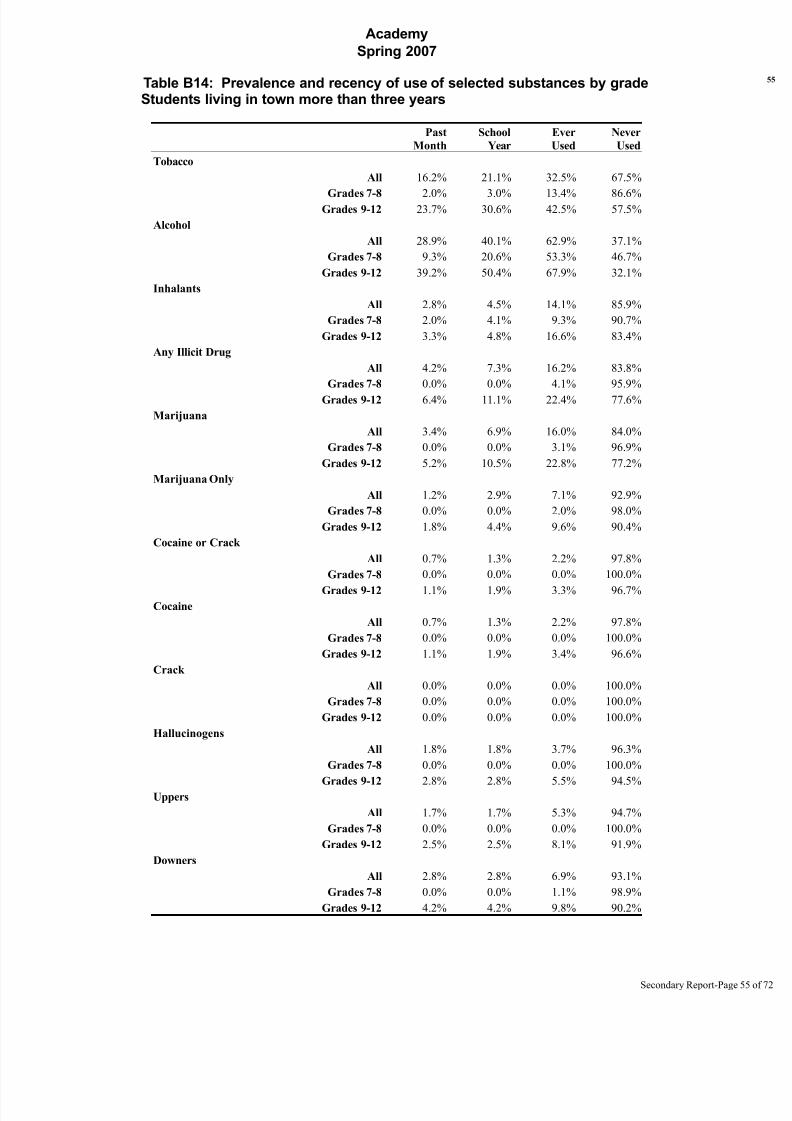
Table B14: Prevalence and recency of use of selected substances by gradeStudents living in town more than three years
Past
Month
School
Year
Ever
Used
Never
Used
Tobacco
All 16.2% 21.1% 32.5% 67.5%
Grades 7-8 2.0% 3.0% 13.4% 86.6%Grades 9-12 23.7% 30.6% 42.5% 57.5%
Alcohol
All 28.9% 40.1% 62.9% 37.1%
Grades 7-8 9.3% 20.6% 53.3% 46.7%
Grades 9-12 39.2% 50.4% 67.9% 32.1%
Inhalants
All 2.8% 4.5% 14.1% 85.9%
Grades 7-8 2.0% 4.1% 9.3% 90.7%
Grades 9-12 3.3% 4.8% 16.6% 83.4%
Any Illicit Drug
All 4.2% 7.3% 16.2% 83.8%
Grades 7-8 0.0% 0.0% 4.1% 95.9%
Grades 9-12 6.4% 11.1% 22.4% 77.6%
Marijuana
All 3.4% 6.9% 16.0% 84.0%
Grades 7-8 0.0% 0.0% 3.1% 96.9%
Grades 9-12 5.2% 10.5% 22.8% 77.2%
Marijuana Only
All 1.2% 2.9% 7.1% 92.9%
Grades 7-8 0.0% 0.0% 2.0% 98.0%
Grades 9-12 1.8% 4.4% 9.6% 90.4%
Cocaine or Crack
All 0.7% 1.3% 2.2% 97.8%
Grades 7-8 0.0% 0.0% 0.0% 100.0%
Grades 9-12 1.1% 1.9% 3.3% 96.7%Cocaine
All 0.7% 1.3% 2.2% 97.8%
Grades 7-8 0.0% 0.0% 0.0% 100.0%
Grades 9-12 1.1% 1.9% 3.4% 96.6%
Crack
All 0.0% 0.0% 0.0% 100.0%
Grades 7-8 0.0% 0.0% 0.0% 100.0%
Grades 9-12 0.0% 0.0% 0.0% 100.0%
Hallucinogens
All 1.8% 1.8% 3.7% 96.3%
Grades 7-8 0.0% 0.0% 0.0% 100.0%
Grades 9-12 2.8% 2.8% 5.5% 94.5%Uppers
All 1.7% 1.7% 5.3% 94.7%
Grades 7-8 0.0% 0.0% 0.0% 100.0%
Grades 9-12 2.5% 2.5% 8.1% 91.9%
Downers
All 2.8% 2.8% 6.9% 93.1%
Grades 7-8 0.0% 0.0% 1.1% 98.9%
Grades 9-12 4.2% 4.2% 9.8% 90.2%
Secondary Report-Page
8/14/2019 BELL COUNTY - Academy ISD - 2007 Texas School Survey of Drug and Alcohol Use
http://slidepdf.com/reader/full/bell-county-academy-isd-2007-texas-school-survey-of-drug-and-alcohol-use 56/72
Academy
Spring 2007
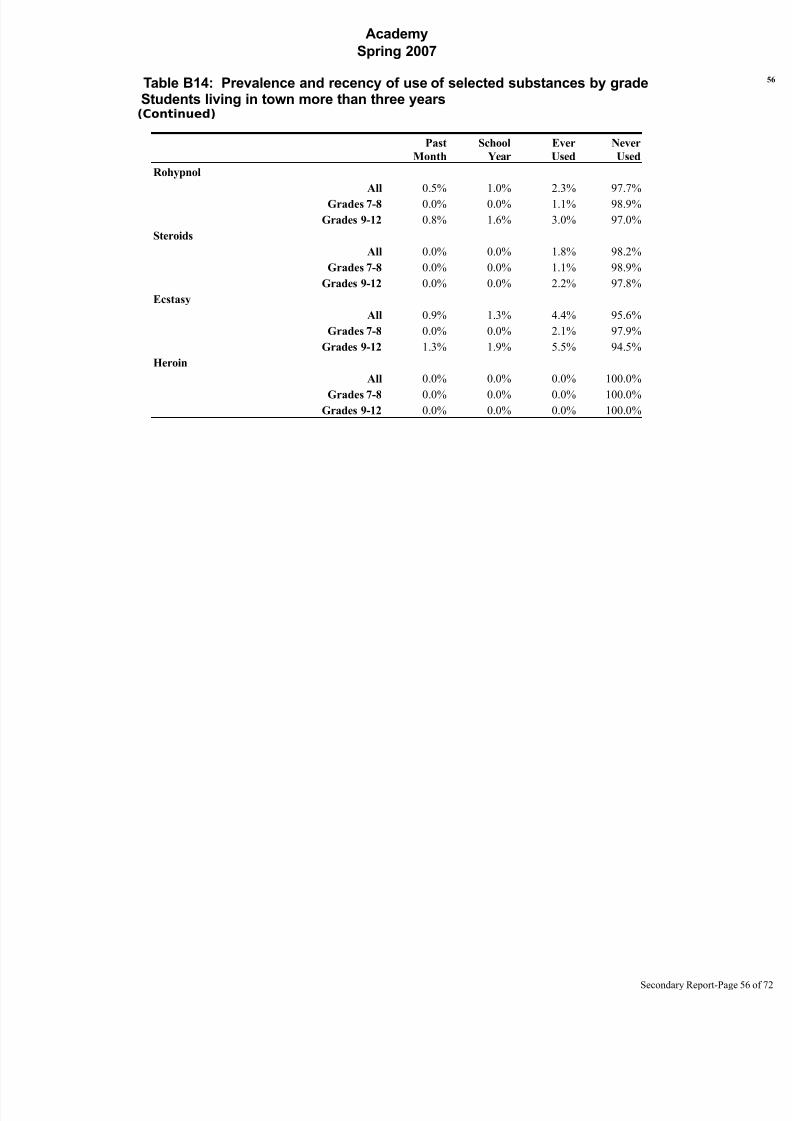
Table B14: Prevalence and recency of use of selected substances by gradeStudents living in town more than three years(Continued)
Past
Month
School
Year
Ever
Used
Never
Used
Rohypnol
All 0.5% 1.0% 2.3% 97.7%
Grades 7-8 0.0% 0.0% 1.1% 98.9%
Grades 9-12 0.8% 1.6% 3.0% 97.0%
Steroids
All 0.0% 0.0% 1.8% 98.2%
Grades 7-8 0.0% 0.0% 1.1% 98.9%
Grades 9-12 0.0% 0.0% 2.2% 97.8%
Ecstasy
All 0.9% 1.3% 4.4% 95.6%
Grades 7-8 0.0% 0.0% 2.1% 97.9%
Grades 9-12 1.3% 1.9% 5.5% 94.5%
Heroin
All 0.0% 0.0% 0.0% 100.0%
Grades 7-8 0.0% 0.0% 0.0% 100.0%Grades 9-12 0.0% 0.0% 0.0% 100.0%
Secondary Report-Page
8/14/2019 BELL COUNTY - Academy ISD - 2007 Texas School Survey of Drug and Alcohol Use
http://slidepdf.com/reader/full/bell-county-academy-isd-2007-texas-school-survey-of-drug-and-alcohol-use 57/72
Academy
Spring 2007
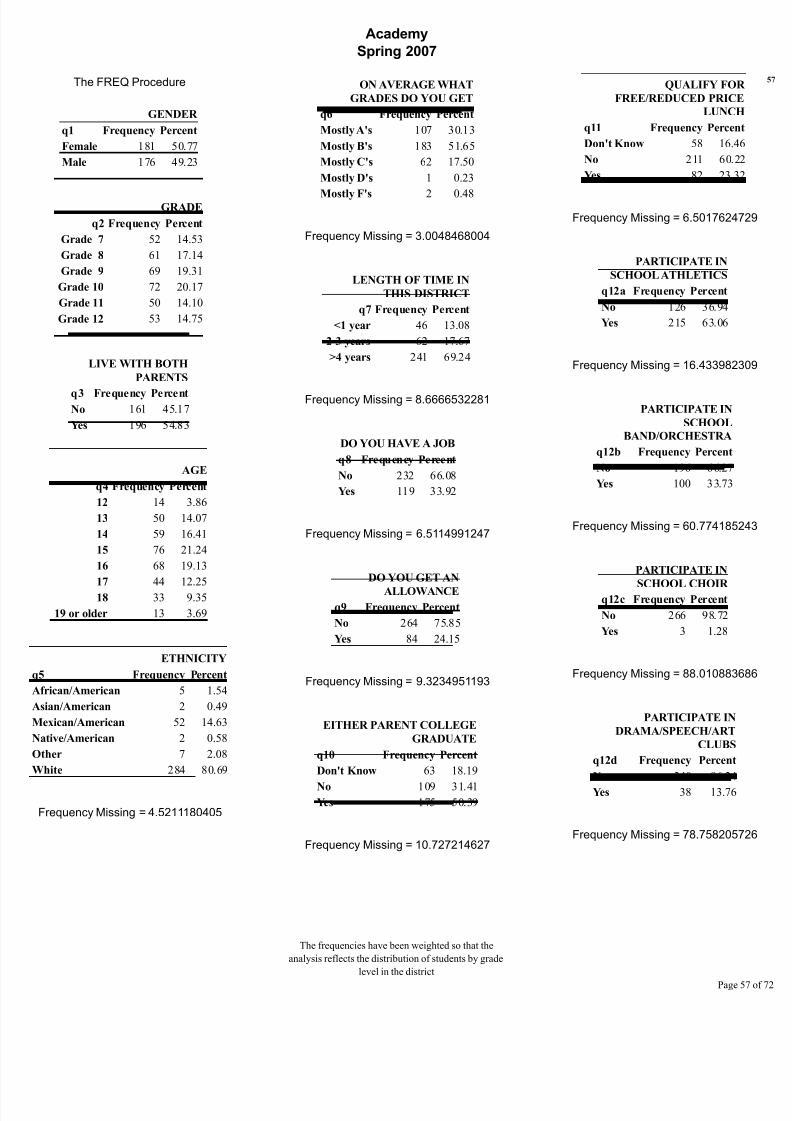
The FREQ Procedure
GENDER
q1 Frequency Percent
Female 181 50.77
Male 176 49.23
GRADE
q2 Frequency Percent
Grade 7 52 14.53
Grade 8 61 17.14
Grade 9 69 19.31
Grade 10 72 20.17
Grade 11 50 14.10
Grade 12 53 14.75
LIVE WITH BOTH
PARENTS
q3 Frequency PercentNo 161 45.17
Yes 196 54.83
AGE
q4 Frequency Percent
12 14 3.86
13 50 14.07
14 59 16.41
15 76 21.24
16 68 19.13
17 44 12.25
18 33 9.35
19 or older 13 3.69
ETHNICITY
q5 Frequency Percent
African/American 5 1.54
Asian/American 2 0.49
Mexican/American 52 14.63
Native/American 2 0.58
Other 7 2.08
White 284 80.69
Frequency Missing = 4.5211180405
ON AVERAGE WHAT
GRADES DO YOU GET
q6 Frequency Percent
Mostly A's 107 30.13
Mostly B's 183 51.65
Mostly C's 62 17.50
Mostly D's 1 0.23
Mostly F's 2 0.48
Frequency Missing = 3.0048468004
LENGTH OF TIME IN
THIS DISTRICT
q7 Frequency Percent
<1 year 46 13.08
2-3 years 62 17.67
>4 years 241 69.24
Frequency Missing = 8.6666532281
DO YOU HAVE A JOB
q8 Frequency Percent
No 232 66.08
Yes 119 33.92
Frequency Missing = 6.5114991247
DO YOU GET AN
ALLOWANCE
q9 Frequency Percent
No 264 75.85
Yes 84 24.15
Frequency Missing = 9.3234951193
EITHER PARENT COLLEGE
GRADUATE
q10 Frequency Percent
Don't Know 63 18.19
No 109 31.41Yes 175 50.39
Frequency Missing = 10.727214627
QUALIFY FOR
FREE/REDUCED PRICE
LUNCH
q11 Frequency Percen
Don't Know 58 16.46
No 211 60.22
Yes 82 23.32
Frequency Missing = 6.50176247
PARTICIPATE IN
SCHOOL ATHLETICS
q12a Frequency Percent
No 126 36.94
Yes 215 63.06
Frequency Missing = 16.4339823
PARTICIPATE IN
SCHOOL
BAND/ORCHESTRA
q12b Frequency Percent
No 196 66.27
Yes 100 33.73
Frequency Missing = 60.7741852
PARTICIPATE IN
SCHOOL CHOIR q12c Frequency Percent
No 266 98.72
Yes 3 1.28
Frequency Missing = 88.0108836
PARTICIPATE IN
DRAMA/SPEECH/ART
CLUBS
q12d Frequency Percent
No 240 86.24
Yes 38 13.76
Frequency Missing = 78.7582057
The frequencies have been weighted so that the
analysis reflects the distribution of students by grade
level in the district
Page
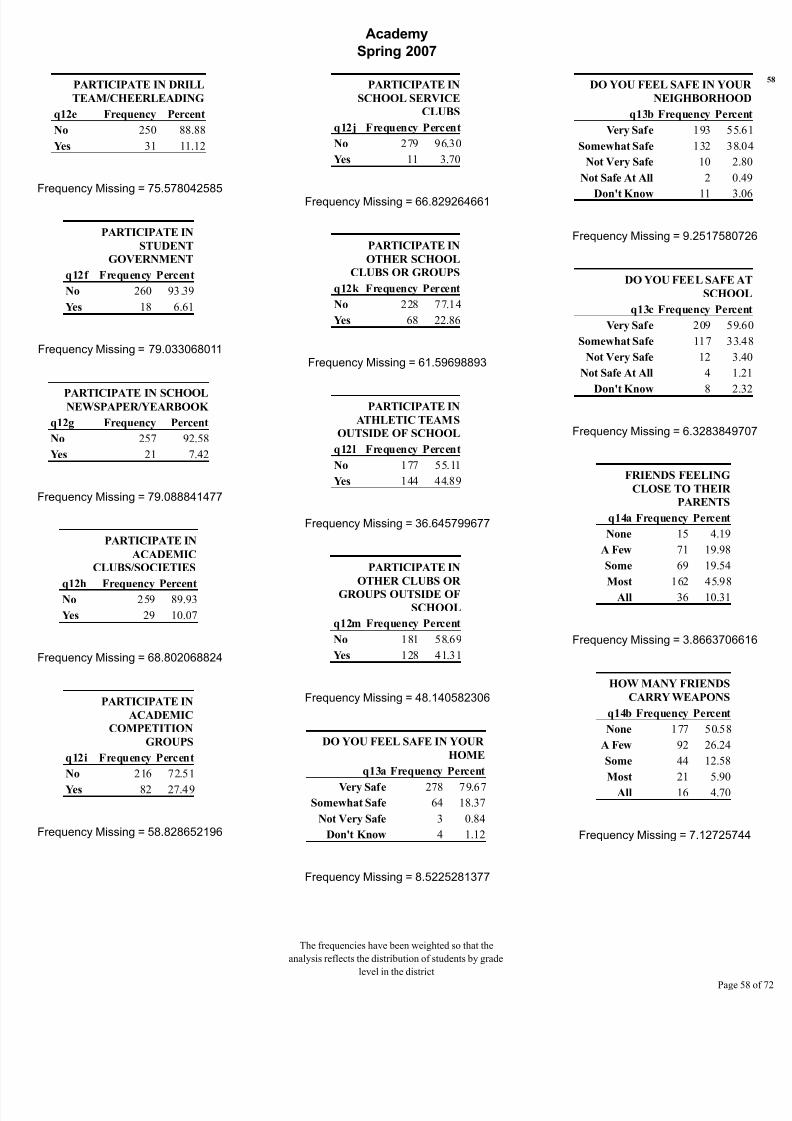
8/14/2019 BELL COUNTY - Academy ISD - 2007 Texas School Survey of Drug and Alcohol Use
http://slidepdf.com/reader/full/bell-county-academy-isd-2007-texas-school-survey-of-drug-and-alcohol-use 58/72
Academy
Spring 2007
PARTICIPATE IN DRILL
TEAM/CHEERLEADING
q12e Frequency Percent
No 250 88.88
Yes 31 11.12
Frequency Missing = 75.578042585
PARTICIPATE IN
STUDENT
GOVERNMENT
q12f Frequency Percent
No 260 93.39
Yes 18 6.61
Frequency Missing = 79.033068011
PARTICIPATE IN SCHOOLNEWSPAPER/YEARBOOK
q12g Frequency Percent
No 257 92.58
Yes 21 7.42
Frequency Missing = 79.088841477
PARTICIPATE IN
ACADEMIC
CLUBS/SOCIETIES
q12h Frequency PercentNo 259 89.93
Yes 29 10.07
Frequency Missing = 68.802068824
PARTICIPATE IN
ACADEMIC
COMPETITION
GROUPS
q12i Frequency Percent
No 216 72.51
Yes 82 27.49
Frequency Missing = 58.828652196
PARTICIPATE IN
SCHOOL SERVICE
CLUBS
q12j Frequency Percent
No 279 96.30
Yes 11 3.70
Frequency Missing = 66.829264661
PARTICIPATE IN
OTHER SCHOOL
CLUBS OR GROUPS
q12k Frequency Percent
No 228 77.14
Yes 68 22.86
Frequency Missing = 61.59698893
PARTICIPATE IN
ATHLETIC TEAMS
OUTSIDE OF SCHOOL
q12l Frequency Percent
No 177 55.11
Yes 144 44.89
Frequency Missing = 36.645799677
PARTICIPATE IN
OTHER CLUBS OR
GROUPS OUTSIDE OF
SCHOOL
q12m Frequency Percent
No 181 58.69
Yes 128 41.31
Frequency Missing = 48.140582306
DO YOU FEEL SAFE IN YOUR
HOME
q13a Frequency Percent
Very Safe 278 79.67Somewhat Safe 64 18.37
Not Very Safe 3 0.84
Don't Know 4 1.12
Frequency Missing = 8.5225281377
DO YOU FEEL SAFE IN YOU
NEIGHBORHOO
q13b Frequency Perce
Very Safe 193 55.
Somewhat Safe 132 38.
Not Very Safe 10 2.
Not Safe At All 2 0.
Don't Know 11 3.
Frequency Missing = 9.25175807
DO YOU FEEL SAFE A
SCHOO
q13c Frequency Perce
Very Safe 209 59.
Somewhat Safe 117 33.
Not Very Safe 12 3.
Not Safe At All 4 1.
Don't Know 8 2.
Frequency Missing = 6.32838497
FRIENDS FEELING
CLOSE TO THEIR
PARENTS
q14a Frequency Percent
None 15 4.19
A Few 71 19.98
Some 69 19.54
Most 162 45.98
All 36 10.31
Frequency Missing = 3.86637066
HOW MANY FRIENDS
CARRY WEAPONS
q14b Frequency Percent
None 177 50.58
A Few 92 26.24
Some 44 12.58
Most 21 5.90
All 16 4.70
Frequency Missing = 7.1272574
The frequencies have been weighted so that the
analysis reflects the distribution of students by grade
level in the district
Page
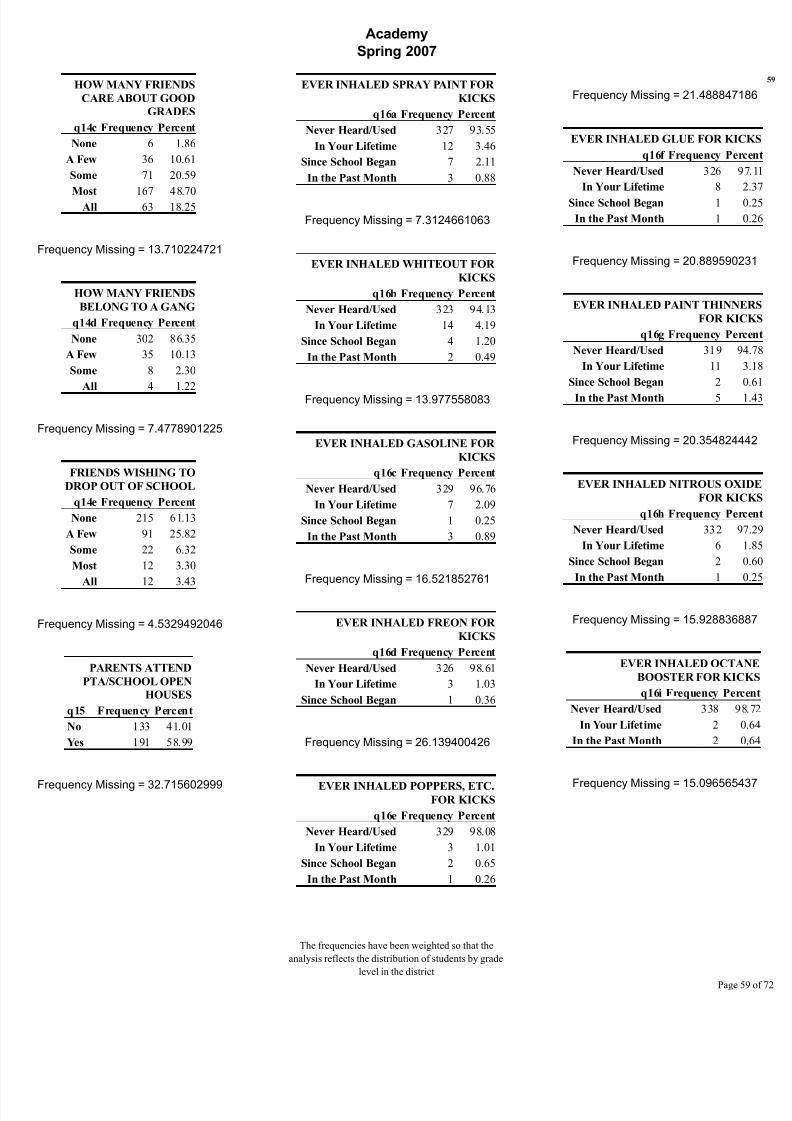
8/14/2019 BELL COUNTY - Academy ISD - 2007 Texas School Survey of Drug and Alcohol Use
http://slidepdf.com/reader/full/bell-county-academy-isd-2007-texas-school-survey-of-drug-and-alcohol-use 59/72
Academy
Spring 2007
HOW MANY FRIENDS
CARE ABOUT GOOD
GRADES
q14c Frequency Percent
None 6 1.86
A Few 36 10.61
Some 71 20.59
Most 167 48.70All 63 18.25
Frequency Missing = 13.710224721
HOW MANY FRIENDS
BELONG TO A GANG
q14d Frequency Percent
None 302 86.35
A Few 35 10.13
Some 8 2.30
All 4 1.22
Frequency Missing = 7.4778901225
FRIENDS WISHING TO
DROP OUT OF SCHOOL
q14e Frequency Percent
None 215 61.13
A Few 91 25.82
Some 22 6.32
Most 12 3.30
All 12 3.43
Frequency Missing = 4.5329492046
PARENTS ATTEND
PTA/SCHOOL OPEN
HOUSES
q15 Frequency Percent
No 133 41.01
Yes 191 58.99
Frequency Missing = 32.715602999
EVER INHALED SPRAY PAINT FOR
KICKS
q16a Frequency Percent
Never Heard/Used 327 93.55
In Your Lifetime 12 3.46
Since School Began 7 2.11
In the Past Month 3 0.88
Frequency Missing = 7.3124661063
EVER INHALED WHITEOUT FOR
KICKS
q16b Frequency Percent
Never Heard/Used 323 94.13
In Your Lifetime 14 4.19
Since School Began 4 1.20
In the Past Month 2 0.49
Frequency Missing = 13.977558083
EVER INHALED GASOLINE FOR
KICKS
q16c Frequency Percent
Never Heard/Used 329 96.76
In Your Lifetime 7 2.09
Since School Began 1 0.25
In the Past Month 3 0.89
Frequency Missing = 16.521852761
EVER INHALED FREON FOR
KICKS
q16d Frequency Percent
Never Heard/Used 326 98.61
In Your Lifetime 3 1.03
Since School Began 1 0.36
Frequency Missing = 26.139400426
EVER INHALED POPPERS, ETC.FOR KICKS
q16e Frequency Percent
Never Heard/Used 329 98.08
In Your Lifetime 3 1.01
Since School Began 2 0.65
In the Past Month 1 0.26
Frequency Missing = 21.4888471
EVER INHALED GLUE FOR KIC
q16f Frequency Per
Never Heard/Used 326 9
In Your Lifetime 8
Since School Began 1
In the Past Month 1
Frequency Missing = 20.8895902
EVER INHALED PAINT THINN
FOR KIC
q16g Frequency Per
Never Heard/Used 319 9
In Your Lifetime 11
Since School Began 2
In the Past Month 5
Frequency Missing = 20.3548244
EVER INHALED NITROUS OX
FOR KIC
q16h Frequency Per
Never Heard/Used 332 9
In Your Lifetime 6
Since School Began 2
In the Past Month 1
Frequency Missing = 15.9288368
EVER INHALED OCTA
BOOSTER FOR KIC
q16i Frequency Per
Never Heard/Used 338 9
In Your Lifetime 2
In the Past Month 2
Frequency Missing = 15.0965654
The frequencies have been weighted so that the
analysis reflects the distribution of students by grade
level in the district
Page
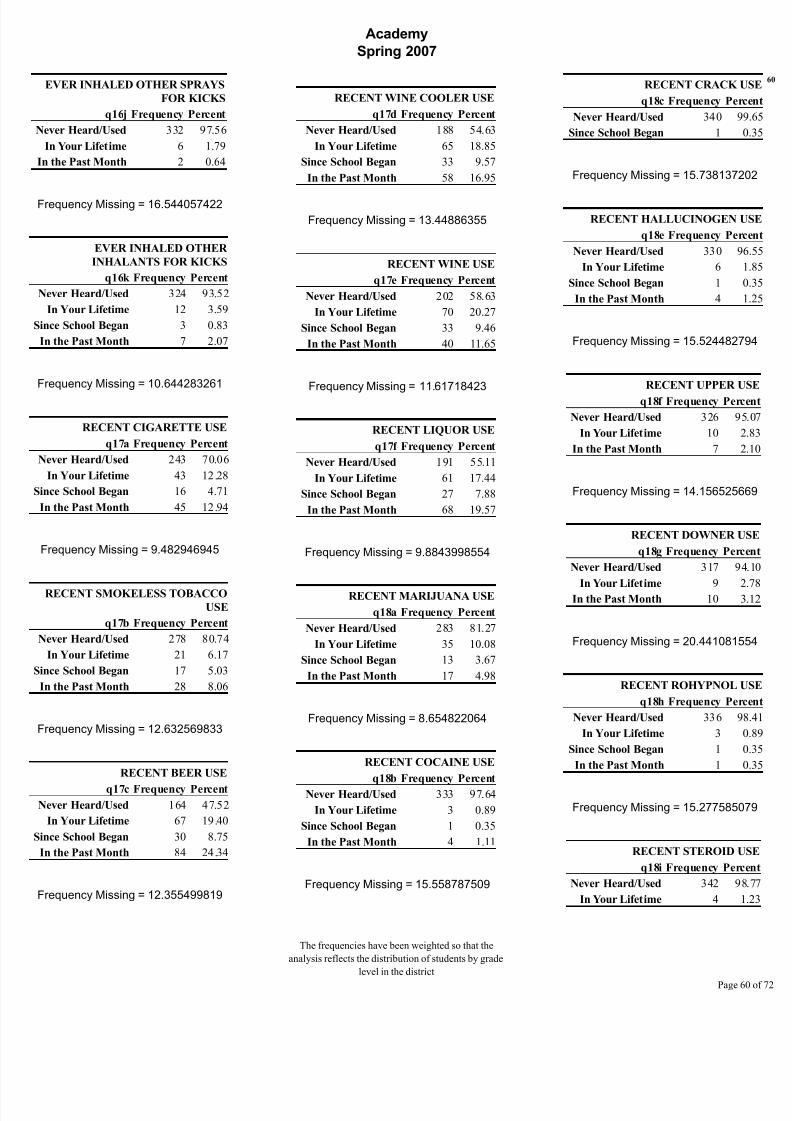
8/14/2019 BELL COUNTY - Academy ISD - 2007 Texas School Survey of Drug and Alcohol Use
http://slidepdf.com/reader/full/bell-county-academy-isd-2007-texas-school-survey-of-drug-and-alcohol-use 60/72
Academy
Spring 2007
EVER INHALED OTHER SPRAYS
FOR KICKS
q16j Frequency Percent
Never Heard/Used 332 97.56
In Your Lifetime 6 1.79
In the Past Month 2 0.64
Frequency Missing = 16.544057422
EVER INHALED OTHER
INHALANTS FOR KICKS
q16k Frequency Percent
Never Heard/Used 324 93.52
In Your Lifetime 12 3.59
Since School Began 3 0.83
In the Past Month 7 2.07
Frequency Missing = 10.644283261
RECENT CIGARETTE USE
q17a Frequency Percent
Never Heard/Used 243 70.06
In Your Lifetime 43 12.28
Since School Began 16 4.71
In the Past Month 45 12.94
Frequency Missing = 9.482946945
RECENT SMOKELESS TOBACCO
USE
q17b Frequency Percent
Never Heard/Used 278 80.74
In Your Lifetime 21 6.17
Since School Began 17 5.03
In the Past Month 28 8.06
Frequency Missing = 12.632569833
RECENT BEER USE
q17c Frequency Percent
Never Heard/Used 164 47.52
In Your Lifetime 67 19.40
Since School Began 30 8.75
In the Past Month 84 24.34
Frequency Missing = 12.355499819
RECENT WINE COOLER USE
q17d Frequency Percent
Never Heard/Used 188 54.63
In Your Lifetime 65 18.85
Since School Began 33 9.57
In the Past Month 58 16.95
Frequency Missing = 13.44886355
RECENT WINE USE
q17e Frequency Percent
Never Heard/Used 202 58.63
In Your Lifetime 70 20.27
Since School Began 33 9.46
In the Past Month 40 11.65
Frequency Missing = 11.61718423
RECENT LIQUOR USE
q17f Frequency Percent
Never Heard/Used 191 55.11
In Your Lifetime 61 17.44
Since School Began 27 7.88
In the Past Month 68 19.57
Frequency Missing = 9.8843998554
RECENT MARIJUANA USE
q18a Frequency Percent
Never Heard/Used 283 81.27
In Your Lifetime 35 10.08
Since School Began 13 3.67
In the Past Month 17 4.98
Frequency Missing = 8.654822064
RECENT COCAINE USE
q18b Frequency Percent
Never Heard/Used 333 97.64
In Your Lifetime 3 0.89
Since School Began 1 0.35
In the Past Month 4 1.11
Frequency Missing = 15.558787509
RECENT CRACK
q18c Frequency Per
Never Heard/Used 340 9
Since School Began 1
Frequency Missing = 15.7381372
RECENT HALLUCINOGEN
q18e Frequency Per
Never Heard/Used 330 9
In Your Lifetime 6
Since School Began 1
In the Past Month 4
Frequency Missing = 15.5244827
RECENT UPPER U
q18f Frequency Per
Never Heard/Used 326 9
In Your Lifetime 10
In the Past Month 7
Frequency Missing = 14.1565256
RECENT DOWNER U
q18g Frequency Per
Never Heard/Used 317 9
In Your Lifetime 9 In the Past Month 10
Frequency Missing = 20.4410815
RECENT ROHYPNOL
q18h Frequency Per
Never Heard/Used 336 9
In Your Lifetime 3
Since School Began 1
In the Past Month 1
Frequency Missing = 15.2775850
RECENT STEROID U
q18i Frequency Per
Never Heard/Used 342 9
In Your Lifetime 4
The frequencies have been weighted so that the
analysis reflects the distribution of students by grade
level in the district
Page
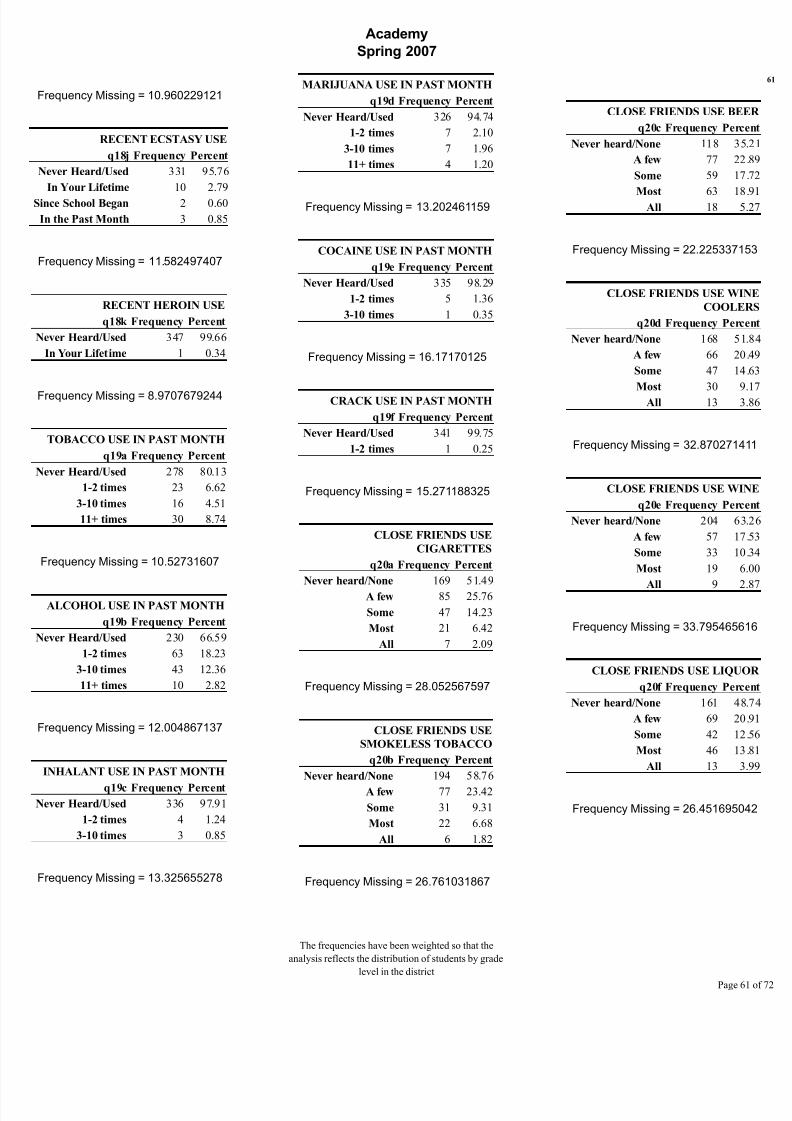
8/14/2019 BELL COUNTY - Academy ISD - 2007 Texas School Survey of Drug and Alcohol Use
http://slidepdf.com/reader/full/bell-county-academy-isd-2007-texas-school-survey-of-drug-and-alcohol-use 61/72
Academy
Spring 2007
Frequency Missing = 10.960229121
RECENT ECSTASY USE
q18j Frequency Percent
Never Heard/Used 331 95.76
In Your Lifetime 10 2.79
Since School Began 2 0.60
In the Past Month 3 0.85
Frequency Missing = 11.582497407
RECENT HEROIN USE
q18k Frequency Percent
Never Heard/Used 347 99.66
In Your Lifetime 1 0.34
Frequency Missing = 8.9707679244
TOBACCO USE IN PAST MONTH
q19a Frequency Percent
Never Heard/Used 278 80.13
1-2 times 23 6.62
3-10 times 16 4.51
11+ times 30 8.74
Frequency Missing = 10.52731607
ALCOHOL USE IN PAST MONTH
q19b Frequency Percent
Never Heard/Used 230 66.59
1-2 times 63 18.23
3-10 times 43 12.36
11+ times 10 2.82
Frequency Missing = 12.004867137
INHALANT USE IN PAST MONTH
q19c Frequency Percent
Never Heard/Used 336 97.91
1-2 times 4 1.24
3-10 times 3 0.85
Frequency Missing = 13.325655278
MARIJUANA USE IN PAST MONTH
q19d Frequency Percent
Never Heard/Used 326 94.74
1-2 times 7 2.10
3-10 times 7 1.96
11+ times 4 1.20
Frequency Missing = 13.202461159
COCAINE USE IN PAST MONTH
q19e Frequency Percent
Never Heard/Used 335 98.29
1-2 times 5 1.36
3-10 times 1 0.35
Frequency Missing = 16.17170125
CRACK USE IN PAST MONTH
q19f Frequency Percent
Never Heard/Used 341 99.75
1-2 times 1 0.25
Frequency Missing = 15.271188325
CLOSE FRIENDS USE
CIGARETTES
q20a Frequency Percent
Never heard/None 169 51.49
A few 85 25.76
Some 47 14.23
Most 21 6.42
All 7 2.09
Frequency Missing = 28.052567597
CLOSE FRIENDS USE
SMOKELESS TOBACCO
q20b Frequency Percent
Never heard/None 194 58.76
A few 77 23.42
Some 31 9.31
Most 22 6.68
All 6 1.82
Frequency Missing = 26.761031867
CLOSE FRIENDS USE BE
q20c Frequency Perc
Never heard/None 118 3
A few 77 22
Some 59 17
Most 63 1All 18
Frequency Missing = 22.2253371
CLOSE FRIENDS USE WI
COOLE
q20d Frequency Perc
Never heard/None 168 5
A few 66 20
Some 47 14
Most 30 9
All 13 3
Frequency Missing = 32.8702714
CLOSE FRIENDS USE WI
q20e Frequency Perc
Never heard/None 204 6
A few 57 17
Some 33 10
Most 19 6
All 9 2
Frequency Missing = 33.7954656
CLOSE FRIENDS USE LIQU
q20f Frequency Perc
Never heard/None 161 4
A few 69 20
Some 42 12
Most 46 13
All 13 3
Frequency Missing = 26.4516950
The frequencies have been weighted so that the
analysis reflects the distribution of students by grade
level in the district
Page
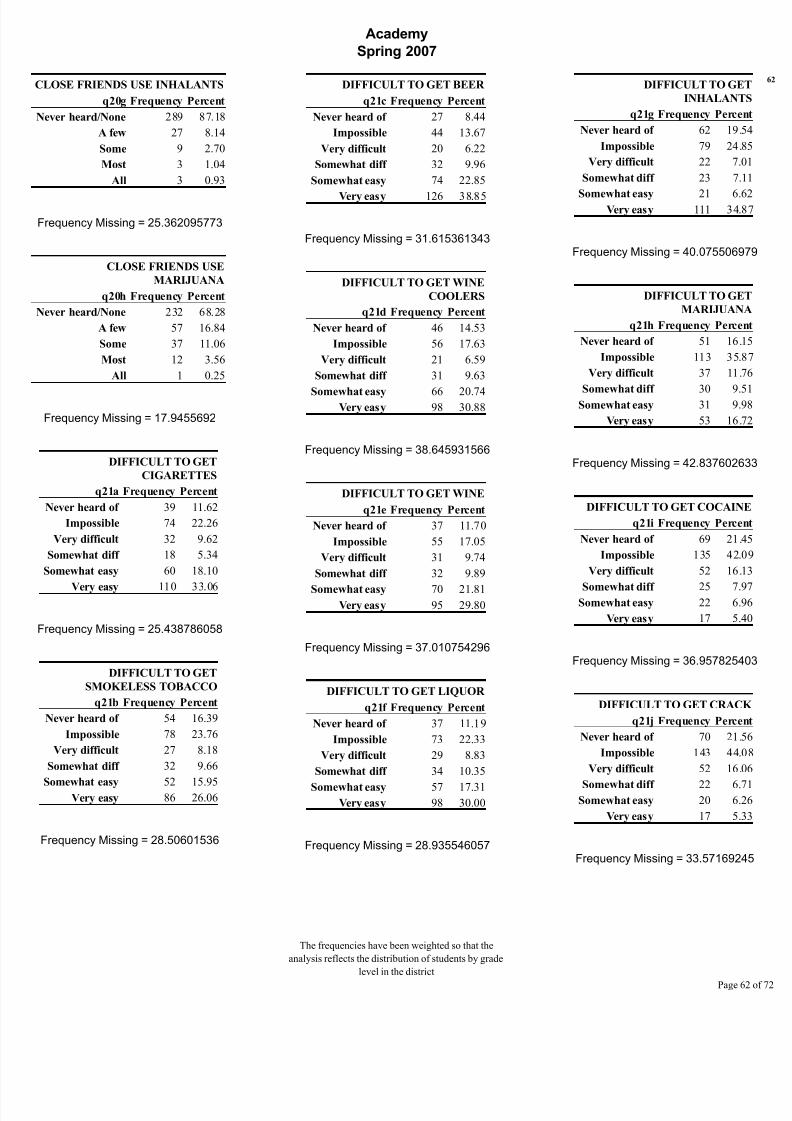
8/14/2019 BELL COUNTY - Academy ISD - 2007 Texas School Survey of Drug and Alcohol Use
http://slidepdf.com/reader/full/bell-county-academy-isd-2007-texas-school-survey-of-drug-and-alcohol-use 62/72
Academy
Spring 2007
CLOSE FRIENDS USE INHALANTS
q20g Frequency Percent
Never heard/None 289 87.18
A few 27 8.14
Some 9 2.70
Most 3 1.04
All 3 0.93
Frequency Missing = 25.362095773
CLOSE FRIENDS USE
MARIJUANA
q20h Frequency Percent
Never heard/None 232 68.28
A few 57 16.84
Some 37 11.06
Most 12 3.56
All 1 0.25
Frequency Missing = 17.9455692
DIFFICULT TO GET
CIGARETTES
q21a Frequency Percent
Never heard of 39 11.62
Impossible 74 22.26
Very difficult 32 9.62
Somewhat diff 18 5.34
Somewhat easy 60 18.10
Very easy 110 33.06
Frequency Missing = 25.438786058
DIFFICULT TO GET
SMOKELESS TOBACCO
q21b Frequency Percent
Never heard of 54 16.39
Impossible 78 23.76
Very difficult 27 8.18
Somewhat diff 32 9.66
Somewhat easy 52 15.95Very easy 86 26.06
Frequency Missing = 28.50601536
DIFFICULT TO GET BEER
q21c Frequency Percent
Never heard of 27 8.44
Impossible 44 13.67
Very difficult 20 6.22
Somewhat diff 32 9.96
Somewhat easy 74 22.85
Very easy 126 38.85
Frequency Missing = 31.615361343
DIFFICULT TO GET WINE
COOLERS
q21d Frequency Percent
Never heard of 46 14.53
Impossible 56 17.63
Very difficult 21 6.59
Somewhat diff 31 9.63
Somewhat easy 66 20.74Very easy 98 30.88
Frequency Missing = 38.645931566
DIFFICULT TO GET WINE
q21e Frequency Percent
Never heard of 37 11.70
Impossible 55 17.05
Very difficult 31 9.74
Somewhat diff 32 9.89
Somewhat easy 70 21.81Very easy 95 29.80
Frequency Missing = 37.010754296
DIFFICULT TO GET LIQUOR
q21f Frequency Percent
Never heard of 37 11.19
Impossible 73 22.33
Very difficult 29 8.83
Somewhat diff 34 10.35
Somewhat easy 57 17.31Very easy 98 30.00
Frequency Missing = 28.935546057
DIFFICULT TO GE
INHALANT
q21g Frequency Perce
Never heard of 62 19.
Impossible 79 24.
Very difficult 22 7.
Somewhat diff 23 7.
Somewhat easy 21 6.Very easy 111 34.
Frequency Missing = 40.0755069
DIFFICULT TO GE
MARIJUAN
q21h Frequency Perce
Never heard of 51 16.
Impossible 113 35.
Very difficult 37 11.
Somewhat diff 30 9.Somewhat easy 31 9.
Very easy 53 16.
Frequency Missing = 42.8376026
DIFFICULT TO GET COCAIN
q21i Frequency Perce
Never heard of 69 21.
Impossible 135 42.
Very difficult 52 16.
Somewhat diff 25 7.Somewhat easy 22 6.
Very easy 17 5.
Frequency Missing = 36.9578254
DIFFICULT TO GET CRAC
q21j Frequency Perce
Never heard of 70 21.
Impossible 143 44.
Very difficult 52 16.
Somewhat diff 22 6.Somewhat easy 20 6.
Very easy 17 5.
Frequency Missing = 33.571692
The frequencies have been weighted so that the
analysis reflects the distribution of students by grade
level in the district
Page
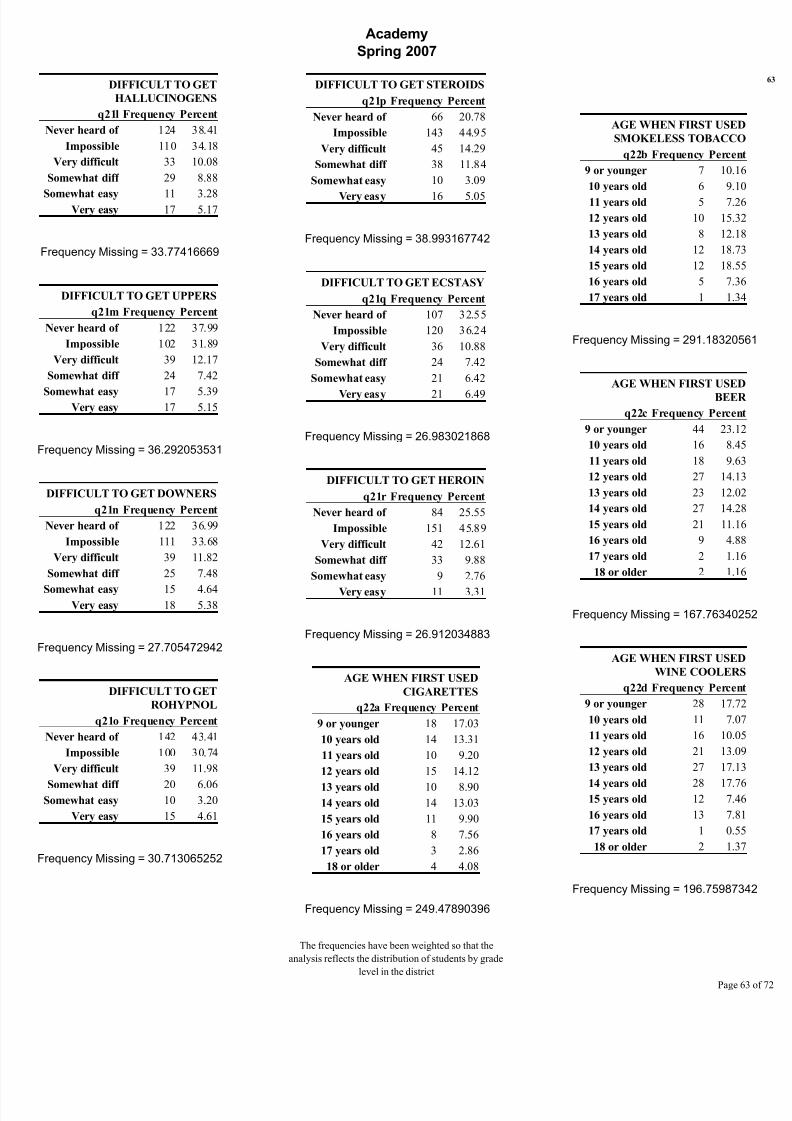
8/14/2019 BELL COUNTY - Academy ISD - 2007 Texas School Survey of Drug and Alcohol Use
http://slidepdf.com/reader/full/bell-county-academy-isd-2007-texas-school-survey-of-drug-and-alcohol-use 63/72
Academy
Spring 2007
DIFFICULT TO GET
HALLUCINOGENS
q21l Frequency Percent
Never heard of 124 38.41
Impossible 110 34.18
Very difficult 33 10.08
Somewhat diff 29 8.88
Somewhat easy 11 3.28Very easy 17 5.17
Frequency Missing = 33.77416669
DIFFICULT TO GET UPPERS
q21m Frequency Percent
Never heard of 122 37.99
Impossible 102 31.89
Very difficult 39 12.17
Somewhat diff 24 7.42
Somewhat easy 17 5.39Very easy 17 5.15
Frequency Missing = 36.292053531
DIFFICULT TO GET DOWNERS
q21n Frequency Percent
Never heard of 122 36.99
Impossible 111 33.68
Very difficult 39 11.82
Somewhat diff 25 7.48
Somewhat easy 15 4.64Very easy 18 5.38
Frequency Missing = 27.705472942
DIFFICULT TO GET
ROHYPNOL
q21o Frequency Percent
Never heard of 142 43.41
Impossible 100 30.74
Very difficult 39 11.98
Somewhat diff 20 6.06Somewhat easy 10 3.20
Very easy 15 4.61
Frequency Missing = 30.713065252
DIFFICULT TO GET STEROIDS
q21p Frequency Percent
Never heard of 66 20.78
Impossible 143 44.95
Very difficult 45 14.29
Somewhat diff 38 11.84
Somewhat easy 10 3.09
Very easy 16 5.05
Frequency Missing = 38.993167742
DIFFICULT TO GET ECSTASY
q21q Frequency Percent
Never heard of 107 32.55
Impossible 120 36.24
Very difficult 36 10.88
Somewhat diff 24 7.42
Somewhat easy 21 6.42
Very easy 21 6.49
Frequency Missing = 26.983021868
DIFFICULT TO GET HEROIN
q21r Frequency Percent
Never heard of 84 25.55
Impossible 151 45.89
Very difficult 42 12.61
Somewhat diff 33 9.88
Somewhat easy 9 2.76
Very easy 11 3.31
Frequency Missing = 26.912034883
AGE WHEN FIRST USED
CIGARETTES
q22a Frequency Percent
9 or younger 18 17.03
10 years old 14 13.31
11 years old 10 9.20
12 years old 15 14.12
13 years old 10 8.9014 years old 14 13.03
15 years old 11 9.90
16 years old 8 7.56
17 years old 3 2.86
18 or older 4 4.08
Frequency Missing = 249.47890396
AGE WHEN FIRST USED
SMOKELESS TOBACCO
q22b Frequency Percen
9 or younger 7 10.1
10 years old 6 9.1
11 years old 5 7.2
12 years old 10 15.3
13 years old 8 12.1
14 years old 12 18.7
15 years old 12 18.5
16 years old 5 7.3
17 years old 1 1.3
Frequency Missing = 291.183205
AGE WHEN FIRST USED
BEER
q22c Frequency Percen
9 or younger 44 23.1
10 years old 16 8.4
11 years old 18 9.6
12 years old 27 14.1
13 years old 23 12.0
14 years old 27 14.2
15 years old 21 11.1
16 years old 9 4.8
17 years old 2 1.1
18 or older 2 1.1
Frequency Missing = 167.763402
AGE WHEN FIRST USED
WINE COOLER
q22d Frequency Percen
9 or younger 28 17.7
10 years old 11 7.0
11 years old 16 10.0
12 years old 21 13.0
13 years old 27 17.1
14 years old 28 17.715 years old 12 7.4
16 years old 13 7.8
17 years old 1 0.5
18 or older 2 1.3
Frequency Missing = 196.759873
The frequencies have been weighted so that the
analysis reflects the distribution of students by grade
level in the district
Page
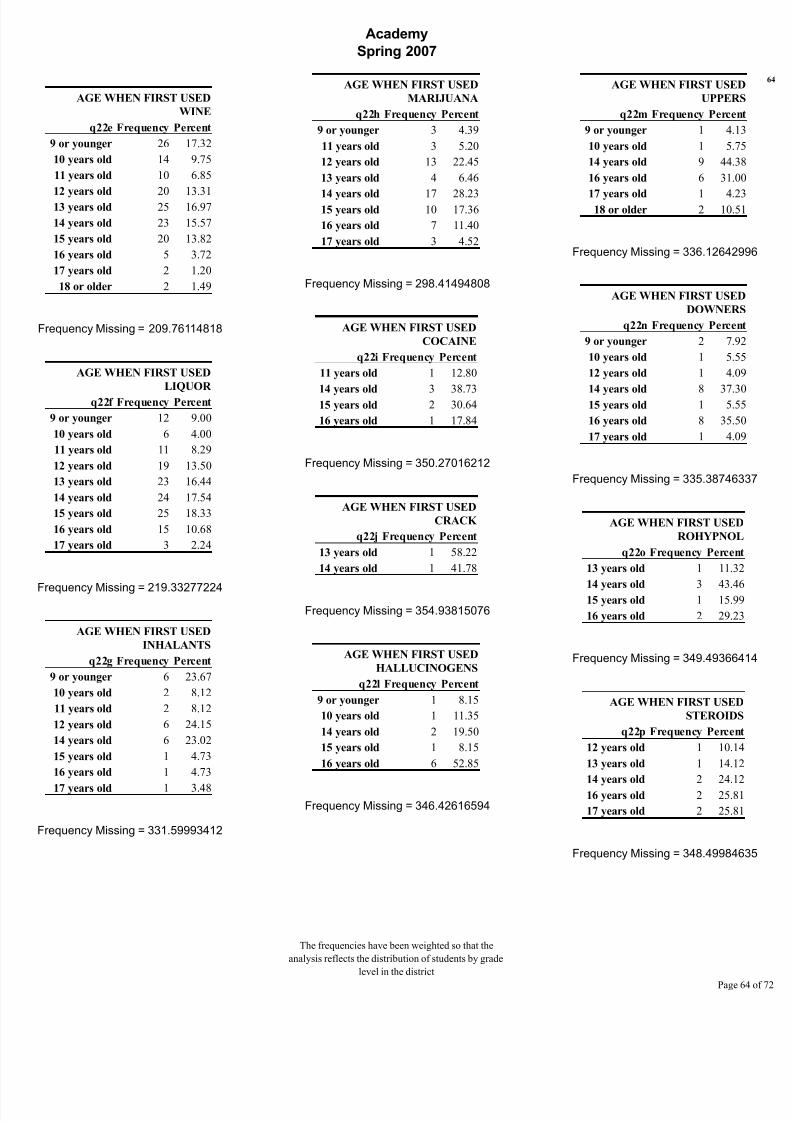
8/14/2019 BELL COUNTY - Academy ISD - 2007 Texas School Survey of Drug and Alcohol Use
http://slidepdf.com/reader/full/bell-county-academy-isd-2007-texas-school-survey-of-drug-and-alcohol-use 64/72
Academy
Spring 2007
AGE WHEN FIRST USED
WINE
q22e Frequency Percent
9 or younger 26 17.32
10 years old 14 9.75
11 years old 10 6.85
12 years old 20 13.3113 years old 25 16.97
14 years old 23 15.57
15 years old 20 13.82
16 years old 5 3.72
17 years old 2 1.20
18 or older 2 1.49
Frequency Missing = 209.76114818
AGE WHEN FIRST USED
LIQUOR
q22f Frequency Percent
9 or younger 12 9.00
10 years old 6 4.00
11 years old 11 8.29
12 years old 19 13.50
13 years old 23 16.44
14 years old 24 17.54
15 years old 25 18.33
16 years old 15 10.68
17 years old 3 2.24
Frequency Missing = 219.33277224
AGE WHEN FIRST USED
INHALANTS
q22g Frequency Percent
9 or younger 6 23.67
10 years old 2 8.12
11 years old 2 8.12
12 years old 6 24.15
14 years old 6 23.02
15 years old 1 4.73
16 years old 1 4.73
17 years old 1 3.48
Frequency Missing = 331.59993412
AGE WHEN FIRST USED
MARIJUANA
q22h Frequency Percent
9 or younger 3 4.39
11 years old 3 5.20
12 years old 13 22.45
13 years old 4 6.46
14 years old 17 28.2315 years old 10 17.36
16 years old 7 11.40
17 years old 3 4.52
Frequency Missing = 298.41494808
AGE WHEN FIRST USED
COCAINE
q22i Frequency Percent
11 years old 1 12.80
14 years old 3 38.7315 years old 2 30.64
16 years old 1 17.84
Frequency Missing = 350.27016212
AGE WHEN FIRST USED
CRACK
q22j Frequency Percent
13 years old 1 58.22
14 years old 1 41.78
Frequency Missing = 354.93815076
AGE WHEN FIRST USED
HALLUCINOGENS
q22l Frequency Percent
9 or younger 1 8.15
10 years old 1 11.35
14 years old 2 19.50
15 years old 1 8.15
16 years old 6 52.85
Frequency Missing = 346.42616594
AGE WHEN FIRST USED
UPPER
q22m Frequency Percen
9 or younger 1 4.1
10 years old 1 5.7
14 years old 9 44.3
16 years old 6 31.0
17 years old 1 4.218 or older 2 10.5
Frequency Missing = 336.126429
AGE WHEN FIRST USED
DOWNER
q22n Frequency Percen
9 or younger 2 7.9
10 years old 1 5.5
12 years old 1 4.0
14 years old 8 37.315 years old 1 5.5
16 years old 8 35.5
17 years old 1 4.0
Frequency Missing = 335.387463
AGE WHEN FIRST USED
ROHYPNOL
q22o Frequency Percen
13 years old 1 11.32
14 years old 3 43.4615 years old 1 15.99
16 years old 2 29.23
Frequency Missing = 349.493664
AGE WHEN FIRST USED
STEROIDS
q22p Frequency Percen
12 years old 1 10.14
13 years old 1 14.12
14 years old 2 24.12
16 years old 2 25.81
17 years old 2 25.81
Frequency Missing = 348.499846
The frequencies have been weighted so that the
analysis reflects the distribution of students by grade
level in the district
Page
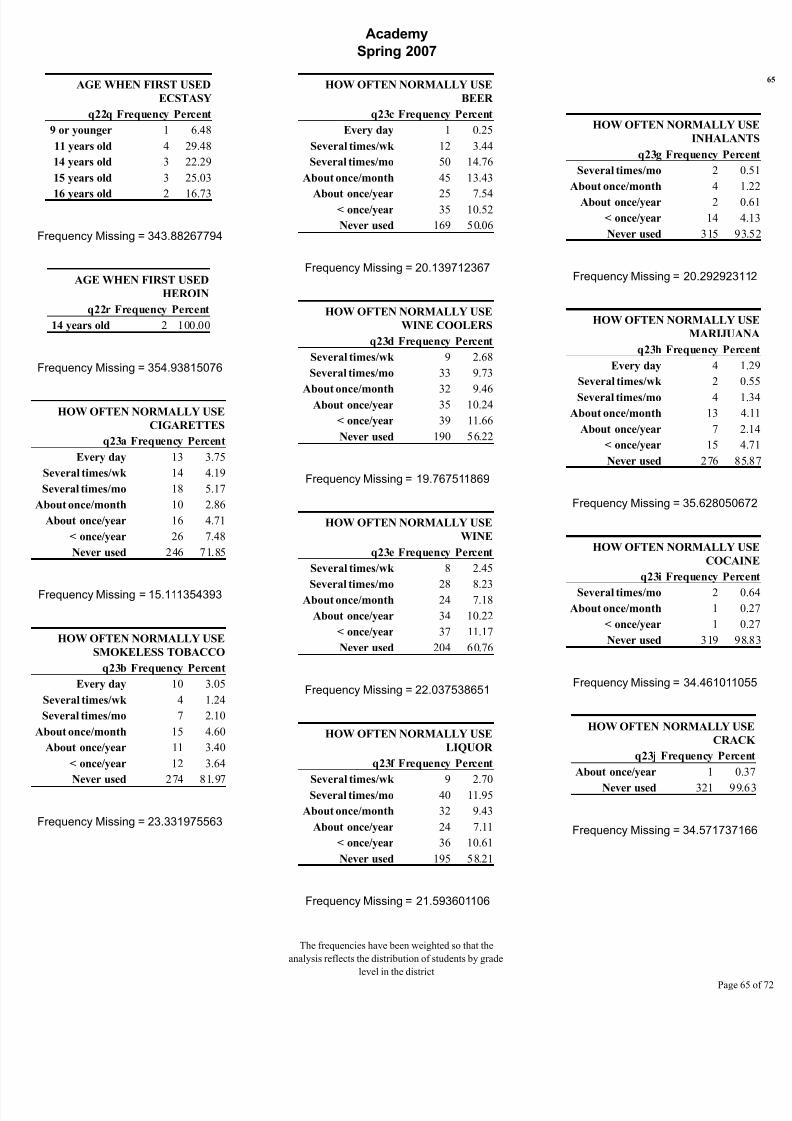
8/14/2019 BELL COUNTY - Academy ISD - 2007 Texas School Survey of Drug and Alcohol Use
http://slidepdf.com/reader/full/bell-county-academy-isd-2007-texas-school-survey-of-drug-and-alcohol-use 65/72
Academy
Spring 2007
AGE WHEN FIRST USED
ECSTASY
q22q Frequency Percent
9 or younger 1 6.48
11 years old 4 29.48
14 years old 3 22.29
15 years old 3 25.03
16 years old 2 16.73
Frequency Missing = 343.88267794
AGE WHEN FIRST USED
HEROIN
q22r Frequency Percent
14 years old 2 100.00
Frequency Missing = 354.93815076
HOW OFTEN NORMALLY USE
CIGARETTES
q23a Frequency Percent
Every day 13 3.75
Several times/wk 14 4.19
Several times/mo 18 5.17
About once/month 10 2.86
About once/year 16 4.71
< once/year 26 7.48
Never used 246 71.85
Frequency Missing = 15.111354393
HOW OFTEN NORMALLY USE
SMOKELESS TOBACCO
q23b Frequency Percent
Every day 10 3.05
Several times/wk 4 1.24
Several times/mo 7 2.10
About once/month 15 4.60
About once/year 11 3.40
< once/year 12 3.64
Never used 274 81.97
Frequency Missing = 23.331975563
HOW OFTEN NORMALLY USE
BEER
q23c Frequency Percent
Every day 1 0.25
Several times/wk 12 3.44
Several times/mo 50 14.76
About once/month 45 13.43
About once/year 25 7.54< once/year 35 10.52
Never used 169 50.06
Frequency Missing = 20.139712367
HOW OFTEN NORMALLY USE
WINE COOLERS
q23d Frequency Percent
Several times/wk 9 2.68
Several times/mo 33 9.73
About once/month 32 9.46About once/year 35 10.24
< once/year 39 11.66
Never used 190 56.22
Frequency Missing = 19.767511869
HOW OFTEN NORMALLY USE
WINE
q23e Frequency Percent
Several times/wk 8 2.45
Several times/mo 28 8.23About once/month 24 7.18
About once/year 34 10.22
< once/year 37 11.17
Never used 204 60.76
Frequency Missing = 22.037538651
HOW OFTEN NORMALLY USE
LIQUOR
q23f Frequency Percent
Several times/wk 9 2.70
Several times/mo 40 11.95
About once/month 32 9.43
About once/year 24 7.11
< once/year 36 10.61
Never used 195 58.21
Frequency Missing = 21.593601106
HOW OFTEN NORMALLY U
INHALAN
q23g Frequency Per
Several times/mo 2
About once/month 4
About once/year 2
< once/year 14
Never used 315 9
Frequency Missing = 20.2929231
HOW OFTEN NORMALLY U
MARIJUA
q23h Frequency Per
Every day 4
Several times/wk 2
Several times/mo 4
About once/month 13
About once/year 7
< once/year 15
Never used 276 8
Frequency Missing = 35.6280506
HOW OFTEN NORMALLY U
COCAI
q23i Frequency Per
Several times/mo 2
About once/month 1
< once/year 1
Never used 319 9
Frequency Missing = 34.4610110
HOW OFTEN NORMALLY U
CRAC
q23j Frequency Perc
About once/year 1 0
Never used 321 99
Frequency Missing = 34.5717371
The frequencies have been weighted so that the
analysis reflects the distribution of students by grade
level in the district
Page
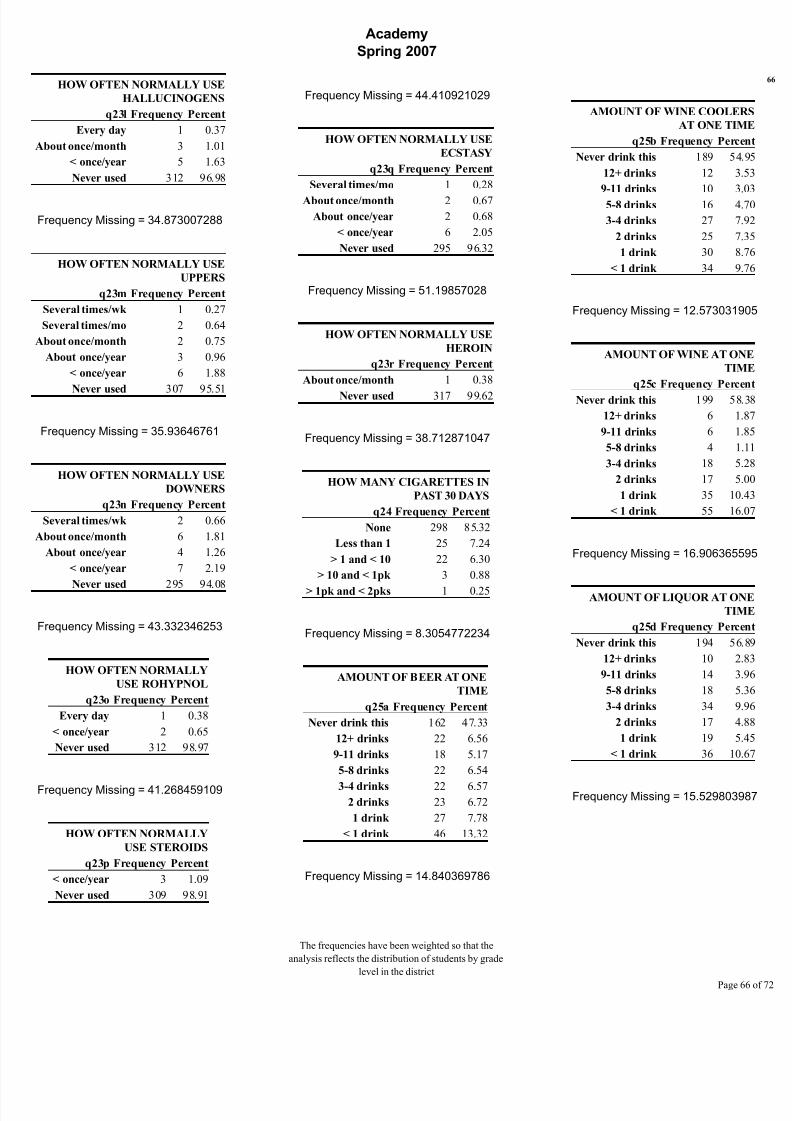
8/14/2019 BELL COUNTY - Academy ISD - 2007 Texas School Survey of Drug and Alcohol Use
http://slidepdf.com/reader/full/bell-county-academy-isd-2007-texas-school-survey-of-drug-and-alcohol-use 66/72
Academy
Spring 2007
HOW OFTEN NORMALLY USE
HALLUCINOGENS
q23l Frequency Percent
Every day 1 0.37
About once/month 3 1.01
< once/year 5 1.63
Never used 312 96.98
Frequency Missing = 34.873007288
HOW OFTEN NORMALLY USE
UPPERS
q23m Frequency Percent
Several times/wk 1 0.27
Several times/mo 2 0.64
About once/month 2 0.75
About once/year 3 0.96
< once/year 6 1.88
Never used 307 95.51
Frequency Missing = 35.93646761
HOW OFTEN NORMALLY USE
DOWNERS
q23n Frequency Percent
Several times/wk 2 0.66
About once/month 6 1.81
About once/year 4 1.26
< once/year 7 2.19
Never used 295 94.08
Frequency Missing = 43.332346253
HOW OFTEN NORMALLY
USE ROHYPNOL
q23o Frequency Percent
Every day 1 0.38
< once/year 2 0.65
Never used 312 98.97
Frequency Missing = 41.268459109
HOW OFTEN NORMALLY
USE STEROIDS
q23p Frequency Percent
< once/year 3 1.09
Never used 309 98.91
Frequency Missing = 44.410921029
HOW OFTEN NORMALLY USE
ECSTASY
q23q Frequency Percent
Several times/mo 1 0.28
About once/month 2 0.67
About once/year 2 0.68
< once/year 6 2.05
Never used 295 96.32
Frequency Missing = 51.19857028
HOW OFTEN NORMALLY USE
HEROIN
q23r Frequency Percent
About once/month 1 0.38
Never used 317 99.62
Frequency Missing = 38.712871047
HOW MANY CIGARETTES IN
PAST 30 DAYS
q24 Frequency Percent
None 298 85.32
Less than 1 25 7.24
> 1 and < 10 22 6.30
> 10 and < 1pk 3 0.88
> 1pk and < 2pks 1 0.25
Frequency Missing = 8.3054772234
AMOUNT OF BEER AT ONE
TIME
q25a Frequency Percent
Never drink this 162 47.33
12+ drinks 22 6.56
9-11 drinks 18 5.17
5-8 drinks 22 6.54
3-4 drinks 22 6.572 drinks 23 6.72
1 drink 27 7.78
< 1 drink 46 13.32
Frequency Missing = 14.840369786
AMOUNT OF WINE COOLE
AT ONE TIM
q25b Frequency Perc
Never drink this 189 54
12+ drinks 12 3
9-11 drinks 10 3
5-8 drinks 16 4
3-4 drinks 27 7
2 drinks 25 7
1 drink 30 8
< 1 drink 34 9
Frequency Missing = 12.5730319
AMOUNT OF WINE AT ON
TIM
q25c Frequency Perc
Never drink this 199 58
12+ drinks 6 1
9-11 drinks 6 1
5-8 drinks 4 1
3-4 drinks 18 5
2 drinks 17 5
1 drink 35 10
< 1 drink 55 16
Frequency Missing = 16.9063655
AMOUNT OF LIQUOR AT ON
TIM
q25d Frequency Perc
Never drink this 194 56
12+ drinks 10 2
9-11 drinks 14 3
5-8 drinks 18 5
3-4 drinks 34 9
2 drinks 17 4
1 drink 19 5
< 1 drink 36 10
Frequency Missing = 15.5298039
The frequencies have been weighted so that the
analysis reflects the distribution of students by grade
level in the district
Page
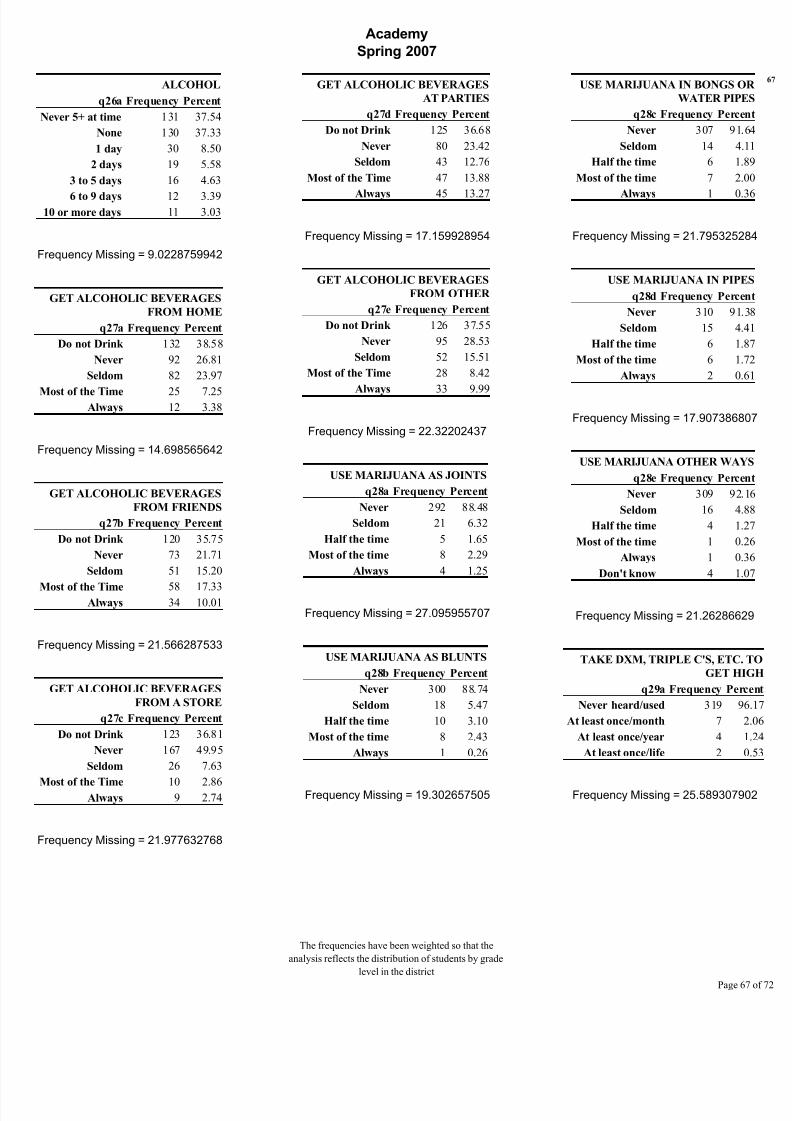
8/14/2019 BELL COUNTY - Academy ISD - 2007 Texas School Survey of Drug and Alcohol Use
http://slidepdf.com/reader/full/bell-county-academy-isd-2007-texas-school-survey-of-drug-and-alcohol-use 67/72
Academy
Spring 2007
ALCOHOL
q26a Frequency Percent
Never 5+ at time 131 37.54
None 130 37.33
1 day 30 8.50
2 days 19 5.58
3 to 5 days 16 4.63
6 to 9 days 12 3.3910 or more days 11 3.03
Frequency Missing = 9.0228759942
GET ALCOHOLIC BEVERAGES
FROM HOME
q27a Frequency Percent
Do not Drink 132 38.58
Never 92 26.81
Seldom 82 23.97
Most of the Time 25 7.25Always 12 3.38
Frequency Missing = 14.698565642
GET ALCOHOLIC BEVERAGES
FROM FRIENDS
q27b Frequency Percent
Do not Drink 120 35.75
Never 73 21.71
Seldom 51 15.20
Most of the Time 58 17.33Always 34 10.01
Frequency Missing = 21.566287533
GET ALCOHOLIC BEVERAGES
FROM A STORE
q27c Frequency Percent
Do not Drink 123 36.81
Never 167 49.95
Seldom 26 7.63
Most of the Time 10 2.86Always 9 2.74
Frequency Missing = 21.977632768
GET ALCOHOLIC BEVERAGES
AT PARTIES
q27d Frequency Percent
Do not Drink 125 36.68
Never 80 23.42
Seldom 43 12.76
Most of the Time 47 13.88
Always 45 13.27
Frequency Missing = 17.159928954
GET ALCOHOLIC BEVERAGES
FROM OTHER
q27e Frequency Percent
Do not Drink 126 37.55
Never 95 28.53
Seldom 52 15.51
Most of the Time 28 8.42
Always 33 9.99
Frequency Missing = 22.32202437
USE MARIJUANA AS JOINTS
q28a Frequency Percent
Never 292 88.48
Seldom 21 6.32
Half the time 5 1.65
Most of the time 8 2.29
Always 4 1.25
Frequency Missing = 27.095955707
USE MARIJUANA AS BLUNTS
q28b Frequency Percent
Never 300 88.74
Seldom 18 5.47
Half the time 10 3.10
Most of the time 8 2.43
Always 1 0.26
Frequency Missing = 19.302657505
USE MARIJUANA IN BONGS O
WATER PIP
q28c Frequency Perc
Never 307 91
Seldom 14 4
Half the time 6 1
Most of the time 7 2
Always 1 0
Frequency Missing = 21.7953252
USE MARIJUANA IN PIP
q28d Frequency Perc
Never 310 91
Seldom 15 4
Half the time 6 1
Most of the time 6 1
Always 2 0
Frequency Missing = 17.9073868
USE MARIJUANA OTHER WA
q28e Frequency Perc
Never 309 92
Seldom 16 4
Half the time 4 1
Most of the time 1 0
Always 1 0
Don't know 4 1
Frequency Missing = 21.262866
TAKE DXM, TRIPLE C'S, ETC
GET H
q29a Frequency Per
Never heard/used 319 9
At least once/month 7
At least once/year 4
At least once/life 2
Frequency Missing = 25.5893079
The frequencies have been weighted so that the
analysis reflects the distribution of students by grade
level in the district
Page
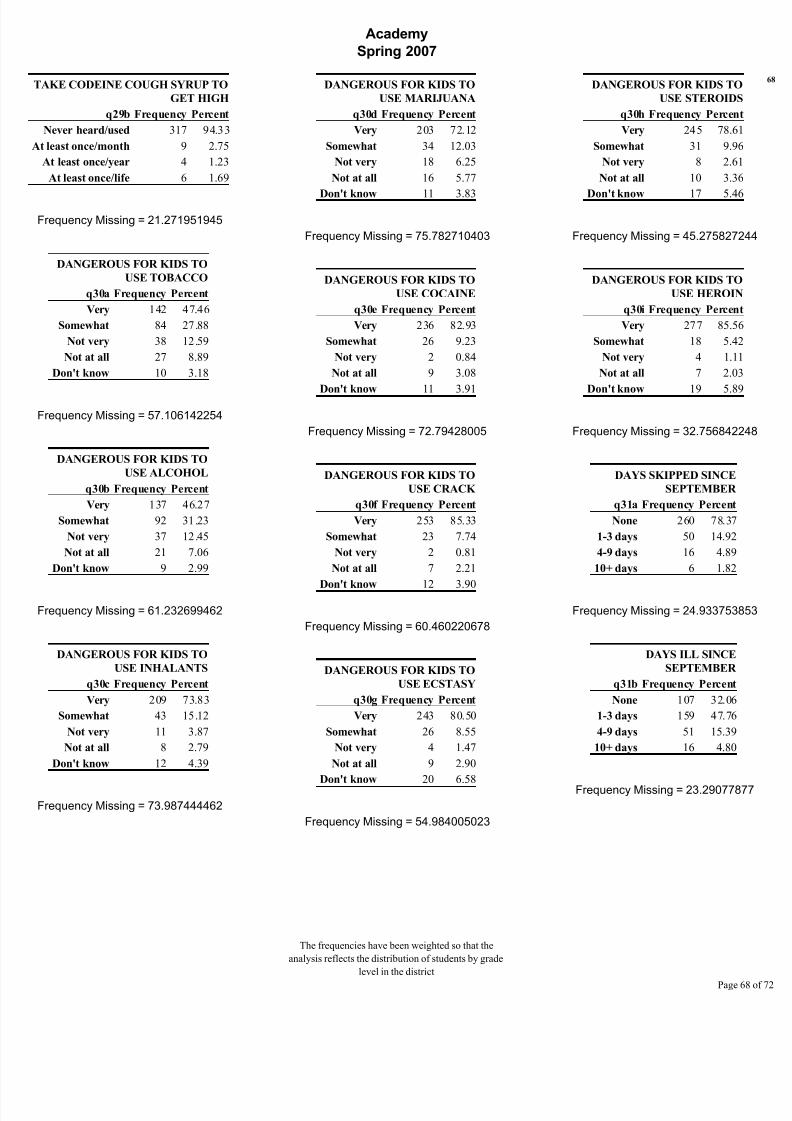
8/14/2019 BELL COUNTY - Academy ISD - 2007 Texas School Survey of Drug and Alcohol Use
http://slidepdf.com/reader/full/bell-county-academy-isd-2007-texas-school-survey-of-drug-and-alcohol-use 68/72
Academy
Spring 2007
TAKE CODEINE COUGH SYRUP TO
GET HIGH
q29b Frequency Percent
Never heard/used 317 94.33
At least once/month 9 2.75
At least once/year 4 1.23
At least once/life 6 1.69
Frequency Missing = 21.271951945
DANGEROUS FOR KIDS TO
USE TOBACCO
q30a Frequency Percent
Very 142 47.46
Somewhat 84 27.88
Not very 38 12.59
Not at all 27 8.89
Don't know 10 3.18
Frequency Missing = 57.106142254
DANGEROUS FOR KIDS TO
USE ALCOHOL
q30b Frequency Percent
Very 137 46.27
Somewhat 92 31.23
Not very 37 12.45
Not at all 21 7.06
Don't know 9 2.99
Frequency Missing = 61.232699462
DANGEROUS FOR KIDS TO
USE INHALANTS
q30c Frequency Percent
Very 209 73.83
Somewhat 43 15.12
Not very 11 3.87
Not at all 8 2.79
Don't know 12 4.39
Frequency Missing = 73.987444462
DANGEROUS FOR KIDS TO
USE MARIJUANA
q30d Frequency Percent
Very 203 72.12
Somewhat 34 12.03
Not very 18 6.25
Not at all 16 5.77
Don't know 11 3.83
Frequency Missing = 75.782710403
DANGEROUS FOR KIDS TO
USE COCAINE
q30e Frequency Percent
Very 236 82.93
Somewhat 26 9.23
Not very 2 0.84
Not at all 9 3.08
Don't know 11 3.91
Frequency Missing = 72.79428005
DANGEROUS FOR KIDS TO
USE CRACK
q30f Frequency Percent
Very 253 85.33
Somewhat 23 7.74
Not very 2 0.81
Not at all 7 2.21
Don't know 12 3.90
Frequency Missing = 60.460220678
DANGEROUS FOR KIDS TO
USE ECSTASY
q30g Frequency Percent
Very 243 80.50
Somewhat 26 8.55
Not very 4 1.47
Not at all 9 2.90
Don't know 20 6.58
Frequency Missing = 54.984005023
DANGEROUS FOR KIDS TO
USE STEROIDS
q30h Frequency Percen
Very 245 78.61
Somewhat 31 9.96
Not very 8 2.61
Not at all 10 3.36
Don't know 17 5.46
Frequency Missing = 45.2758272
DANGEROUS FOR KIDS TO
USE HEROIN
q30i Frequency Percen
Very 277 85.56
Somewhat 18 5.42
Not very 4 1.11
Not at all 7 2.03
Don't know 19 5.89
Frequency Missing = 32.7568422
DAYS SKIPPED SINCE
SEPTEMBER
q31a Frequency Percent
None 260 78.37
1-3 days 50 14.92
4-9 days 16 4.89
10+ days 6 1.82
Frequency Missing = 24.9337538
DAYS ILL SINCE
SEPTEMBER
q31b Frequency Percent
None 107 32.06
1-3 days 159 47.76
4-9 days 51 15.39
10+ days 16 4.80
Frequency Missing = 23.290778
The frequencies have been weighted so that the
analysis reflects the distribution of students by grade
level in the district
Page
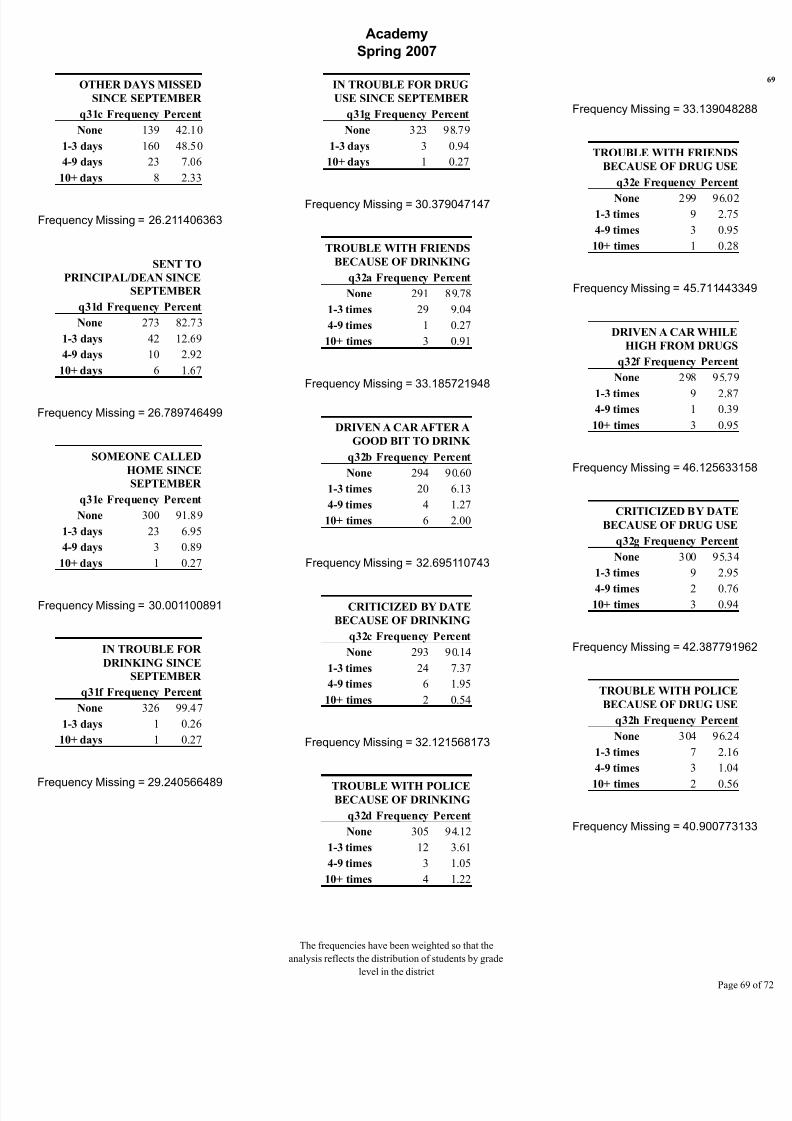
8/14/2019 BELL COUNTY - Academy ISD - 2007 Texas School Survey of Drug and Alcohol Use
http://slidepdf.com/reader/full/bell-county-academy-isd-2007-texas-school-survey-of-drug-and-alcohol-use 69/72
Academy
Spring 2007
OTHER DAYS MISSED
SINCE SEPTEMBER
q31c Frequency Percent
None 139 42.10
1-3 days 160 48.50
4-9 days 23 7.06
10+ days 8 2.33
Frequency Missing = 26.211406363
SENT TO
PRINCIPAL/DEAN SINCE
SEPTEMBER
q31d Frequency Percent
None 273 82.73
1-3 days 42 12.69
4-9 days 10 2.92
10+ days 6 1.67
Frequency Missing = 26.789746499
SOMEONE CALLED
HOME SINCE
SEPTEMBER
q31e Frequency Percent
None 300 91.89
1-3 days 23 6.95
4-9 days 3 0.89
10+ days 1 0.27
Frequency Missing = 30.001100891
IN TROUBLE FOR
DRINKING SINCE
SEPTEMBER
q31f Frequency Percent
None 326 99.47
1-3 days 1 0.26
10+ days 1 0.27
Frequency Missing = 29.240566489
IN TROUBLE FOR DRUG
USE SINCE SEPTEMBER
q31g Frequency Percent
None 323 98.79
1-3 days 3 0.94
10+ days 1 0.27
Frequency Missing = 30.379047147
TROUBLE WITH FRIENDS
BECAUSE OF DRINKING
q32a Frequency Percent
None 291 89.78
1-3 times 29 9.04
4-9 times 1 0.27
10+ times 3 0.91
Frequency Missing = 33.185721948
DRIVEN A CAR AFTER A
GOOD BIT TO DRINK
q32b Frequency Percent
None 294 90.60
1-3 times 20 6.13
4-9 times 4 1.27
10+ times 6 2.00
Frequency Missing = 32.695110743
CRITICIZED BY DATE
BECAUSE OF DRINKING
q32c Frequency Percent
None 293 90.14
1-3 times 24 7.37
4-9 times 6 1.95
10+ times 2 0.54
Frequency Missing = 32.121568173
TROUBLE WITH POLICEBECAUSE OF DRINKING
q32d Frequency Percent
None 305 94.12
1-3 times 12 3.61
4-9 times 3 1.05
10+ times 4 1.22
Frequency Missing = 33.1390482
TROUBLE WITH FRIENDS
BECAUSE OF DRUG USE
q32e Frequency Percent
None 299 96.021-3 times 9 2.75
4-9 times 3 0.95
10+ times 1 0.28
Frequency Missing = 45.7114433
DRIVEN A CAR WHILE
HIGH FROM DRUGS
q32f Frequency Percent
None 298 95.79
1-3 times 9 2.874-9 times 1 0.39
10+ times 3 0.95
Frequency Missing = 46.1256331
CRITICIZED BY DATE
BECAUSE OF DRUG USE
q32g Frequency Percent
None 300 95.34
1-3 times 9 2.95
4-9 times 2 0.7610+ times 3 0.94
Frequency Missing = 42.3877919
TROUBLE WITH POLICE
BECAUSE OF DRUG USE
q32h Frequency Percent
None 304 96.24
1-3 times 7 2.16
4-9 times 3 1.04
10+ times 2 0.56
Frequency Missing = 40.9007731
The frequencies have been weighted so that the
analysis reflects the distribution of students by grade
level in the district
Page
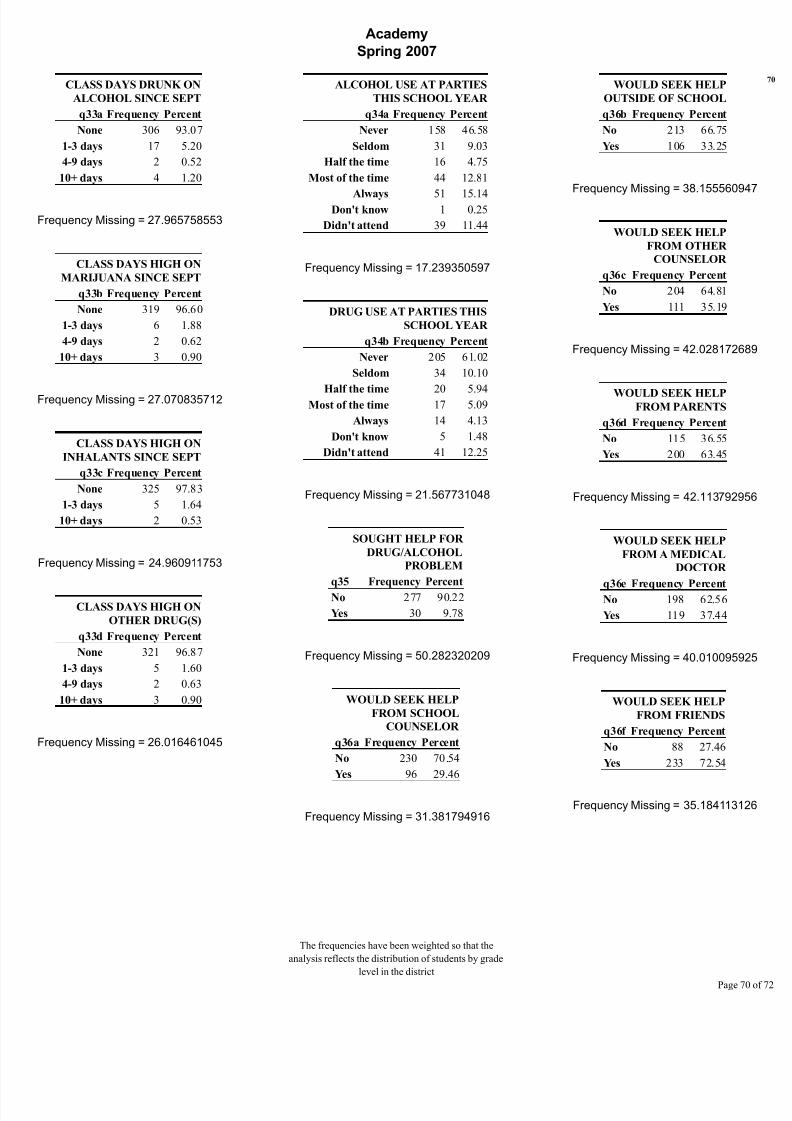
8/14/2019 BELL COUNTY - Academy ISD - 2007 Texas School Survey of Drug and Alcohol Use
http://slidepdf.com/reader/full/bell-county-academy-isd-2007-texas-school-survey-of-drug-and-alcohol-use 70/72
Academy
Spring 2007
CLASS DAYS DRUNK ON
ALCOHOL SINCE SEPT
q33a Frequency Percent
None 306 93.07
1-3 days 17 5.20
4-9 days 2 0.52
10+ days 4 1.20
Frequency Missing = 27.965758553
CLASS DAYS HIGH ON
MARIJUANA SINCE SEPT
q33b Frequency Percent
None 319 96.60
1-3 days 6 1.88
4-9 days 2 0.62
10+ days 3 0.90
Frequency Missing = 27.070835712
CLASS DAYS HIGH ON
INHALANTS SINCE SEPT
q33c Frequency Percent
None 325 97.83
1-3 days 5 1.64
10+ days 2 0.53
Frequency Missing = 24.960911753
CLASS DAYS HIGH ON
OTHER DRUG(S)
q33d Frequency Percent
None 321 96.87
1-3 days 5 1.60
4-9 days 2 0.63
10+ days 3 0.90
Frequency Missing = 26.016461045
ALCOHOL USE AT PARTIES
THIS SCHOOL YEAR
q34a Frequency Percent
Never 158 46.58
Seldom 31 9.03
Half the time 16 4.75
Most of the time 44 12.81
Always 51 15.14Don't know 1 0.25
Didn't attend 39 11.44
Frequency Missing = 17.239350597
DRUG USE AT PARTIES THIS
SCHOOL YEAR
q34b Frequency Percent
Never 205 61.02
Seldom 34 10.10
Half the time 20 5.94Most of the time 17 5.09
Always 14 4.13
Don't know 5 1.48
Didn't attend 41 12.25
Frequency Missing = 21.567731048
SOUGHT HELP FOR
DRUG/ALCOHOL
PROBLEM
q35 Frequency Percent
No 277 90.22
Yes 30 9.78
Frequency Missing = 50.282320209
WOULD SEEK HELP
FROM SCHOOL
COUNSELOR
q36a Frequency Percent
No 230 70.54
Yes 96 29.46
Frequency Missing = 31.381794916
WOULD SEEK HELP
OUTSIDE OF SCHOOL
q36b Frequency Percent
No 213 66.75
Yes 106 33.25
Frequency Missing = 38.1555609
WOULD SEEK HELP
FROM OTHER
COUNSELOR
q36c Frequency Percent
No 204 64.81
Yes 111 35.19
Frequency Missing = 42.0281726
WOULD SEEK HELPFROM PARENTS
q36d Frequency Percent
No 115 36.55
Yes 200 63.45
Frequency Missing = 42.1137929
WOULD SEEK HELP
FROM A MEDICAL
DOCTOR
q36e Frequency PercentNo 198 62.56
Yes 119 37.44
Frequency Missing = 40.0100959
WOULD SEEK HELP
FROM FRIENDS
q36f Frequency Percent
No 88 27.46
Yes 233 72.54
Frequency Missing = 35.1841131
The frequencies have been weighted so that the
analysis reflects the distribution of students by grade
level in the district
Page
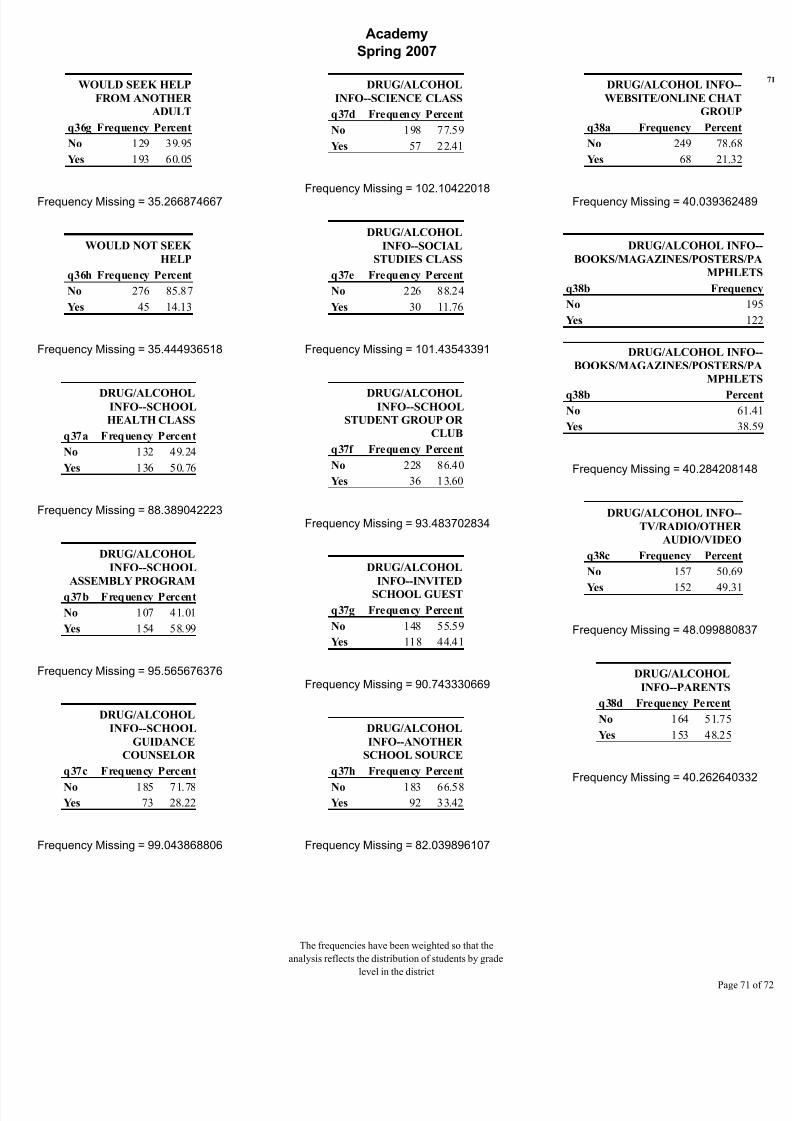
8/14/2019 BELL COUNTY - Academy ISD - 2007 Texas School Survey of Drug and Alcohol Use
http://slidepdf.com/reader/full/bell-county-academy-isd-2007-texas-school-survey-of-drug-and-alcohol-use 71/72
Academy
Spring 2007
WOULD SEEK HELP
FROM ANOTHER
ADULT
q36g Frequency Percent
No 129 39.95
Yes 193 60.05
Frequency Missing = 35.266874667
WOULD NOT SEEK
HELP
q36h Frequency Percent
No 276 85.87
Yes 45 14.13
Frequency Missing = 35.444936518
DRUG/ALCOHOLINFO--SCHOOL
HEALTH CLASS
q37a Frequency Percent
No 132 49.24
Yes 136 50.76
Frequency Missing = 88.389042223
DRUG/ALCOHOL
INFO--SCHOOL
ASSEMBLY PROGRAM
q37b Frequency Percent
No 107 41.01
Yes 154 58.99
Frequency Missing = 95.565676376
DRUG/ALCOHOL
INFO--SCHOOL
GUIDANCE
COUNSELOR
q37c Frequency Percent
No 185 71.78Yes 73 28.22
Frequency Missing = 99.043868806
DRUG/ALCOHOL
INFO--SCIENCE CLASS
q37d Frequency Percent
No 198 77.59
Yes 57 22.41
Frequency Missing = 102.10422018
DRUG/ALCOHOL
INFO--SOCIAL
STUDIES CLASS
q37e Frequency Percent
No 226 88.24
Yes 30 11.76
Frequency Missing = 101.43543391
DRUG/ALCOHOLINFO--SCHOOL
STUDENT GROUP OR
CLUB
q37f Frequency Percent
No 228 86.40
Yes 36 13.60
Frequency Missing = 93.483702834
DRUG/ALCOHOL
INFO--INVITED
SCHOOL GUEST
q37g Frequency Percent
No 148 55.59
Yes 118 44.41
Frequency Missing = 90.743330669
DRUG/ALCOHOL
INFO--ANOTHER
SCHOOL SOURCE
q37h Frequency Percent
No 183 66.58Yes 92 33.42
Frequency Missing = 82.039896107
DRUG/ALCOHOL INFO--
WEBSITE/ONLINE CHAT
GROUP
q38a Frequency Percent
No 249 78.68
Yes 68 21.32
Frequency Missing = 40.0393624
DRUG/ALCOHOL IN
BOOKS/MAGAZINES/POSTERS
MPHL
q38b Frequ
No
Yes
DRUG/ALCOHOL IN
BOOKS/MAGAZINES/POSTERS
MPHL
q38b Per
No 6
Yes 3
Frequency Missing = 40.2842081
DRUG/ALCOHOL INFO--
TV/RADIO/OTHER
AUDIO/VIDEO
q38c Frequency Percent
No 157 50.69
Yes 152 49.31
Frequency Missing = 48.0998808
DRUG/ALCOHOL
INFO--PARENTS
q38d Frequency Percent
No 164 51.75
Yes 153 48.25
Frequency Missing = 40.2626403
The frequencies have been weighted so that the
analysis reflects the distribution of students by grade
level in the district
Page
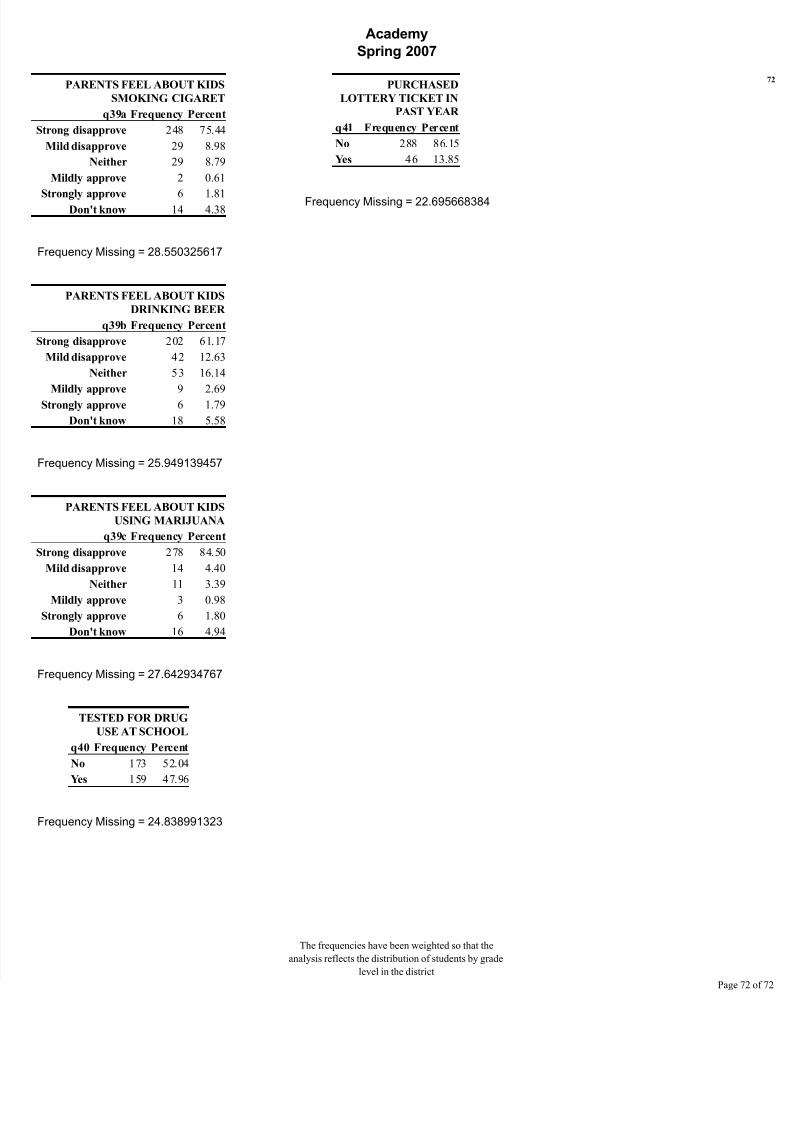
8/14/2019 BELL COUNTY - Academy ISD - 2007 Texas School Survey of Drug and Alcohol Use
http://slidepdf.com/reader/full/bell-county-academy-isd-2007-texas-school-survey-of-drug-and-alcohol-use 72/72
Academy
Spring 2007
PARENTS FEEL ABOUT KIDS
SMOKING CIGARET
q39a Frequency Percent
Strong disapprove 248 75.44
Mild disapprove 29 8.98
Neither 29 8.79
Mildly approve 2 0.61
Strongly approve 6 1.81Don't know 14 4.38
Frequency Missing = 28.550325617
PARENTS FEEL ABOUT KIDS
DRINKING BEER
q39b Frequency Percent
Strong disapprove 202 61.17
Mild disapprove 42 12.63
Neither 53 16.14
Mildly approve 9 2.69Strongly approve 6 1.79
Don't know 18 5.58
Frequency Missing = 25.949139457
PARENTS FEEL ABOUT KIDS
USING MARIJUANA
q39c Frequency Percent
Strong disapprove 278 84.50
Mild disapprove 14 4.40
Neither 11 3.39Mildly approve 3 0.98
Strongly approve 6 1.80
Don't know 16 4.94
Frequency Missing = 27.642934767
TESTED FOR DRUG
USE AT SCHOOL
q40 Frequency Percent
No 173 52.04
Yes 159 47.96
PURCHASED
LOTTERY TICKET IN
PAST YEAR
q41 Frequency Percent
No 288 86.15
Yes 46 13.85
Frequency Missing = 22.695668384