Embed Size (px)
Citation preview

1
BEN SCHOEMAN DOCK BERTH DEEPENING
Specialist Study on Sediment Toxicology
and Marine Ecology
By
Dr R A Carter
Lwandle Technologies (Pty) Ltd
Job No 06-35
November 2006

i
ABBREVIATIONS AND GLOSSARY Acute toxicity Rapid adverse effect (e.g. death) caused by a substance in
a living organism. Can be used to define either the exposure or the response to an exposure (effect)
Anoxia The absence of oxygen Ballast water Use of water in specialised ballast tanks to aid in controlling
a ship's trim and draft, especially when sailing empty or with light cargoes
Benthic Referring to organisms living in or on the sediments, including rocks and reefs of aquatic habitats (seas, oceans, lakes, rivers, ponds, etc.)
Benthos The sum total of organisms living in, or on, the sediments of aquatic habitats.
Biodiversity The variety of life forms, including the plants, animals and micro-organisms, the genes they contain and the ecosystems and ecological processes of which they are a part
Biofouling Biological organisms that colonise and inhabit man made structures in oceans and seas
Biota The sum total of the living organisms of any designated area.
Bivalve A mollusc with a hinged double shell Chronic toxicity Lingering or continuing for a long time. Can be used to
define either the exposure of an aquatic species or its response to an exposure (effect).
CMS Centre for Marine Studies, University of Cape Town Community structure All the types of taxa present in a community and their
relative abundance. Community An assemblage of organisms characterized by a distinctive
combination of species occupying a common environment and interacting with one another
Contaminant Biological (e.g. bacterial and viral pathogens) and/or chemical introductions capable of producing an adverse response (effect) in a biological system, seriously affecting structure or function or causing death.
DEAT/MCM Marine and Coastal Management Directorate, Department of Environmental Affairs and Tourism
Demersal Animals that live on or near the seabed Depauperate Impoverished in species and/or biomass Detritus Unconsolidated sediments composed of both inorganic and
dead and decaying organic material. EC50 (median effective concentration) The concentration of material in water that is estimated to
be effective in producing some chronic response in 50% of the test organisms. The EC50 is usually expressed as an exposure time-dependant value (e.g. 96-hour EC50).
EC5 (minimum effective concentration) The concentration of material in water that is estimated to
be effective in producing some chronic response in 5% of

ii
the test organisms. The EC5 is usually expressed as an exposure time-dependant value (e.g. 96-hour EC5).
Effluent A complex waste material (e.g. liquid industrial discharge or
sewage) that may be discharged into the environment EIA Environmental Impact Assessment Endemic Biological species or taxon restricted to a particular
geographic area Epifauna Organisms, which live at or on the sediment surface being
either attached (sessile) or capable of movement Epi-pelagic The upper levels of the oceans and seas Eutrophication Enrichment with plant nutrients (nitrogen, phosphorus,
silicates) that may cause excessive algal growth Guideline trigger values Concentrations (or loads) of the key performance indicators
measured for the ecosystem, below which there exists a low risk that adverse biological (ecological) effects will occur. They indicate a risk of impact if exceeded and should ‘trigger’ some action, either further ecosystem specific investigations or implementation of management/remedial actions.
Habitat The place where a population (e.g. animal, plant, micro-organism) lives and its surroundings, both living and non-living
Hopper Tank on a dredger that receives and contains dredge spoil Hopper overwash The practice of allowing low concentration sediment slurry
to flow overboard allowing the build up of more concentrated slurries in the hopper
Ichthyoplankton Fish, fish larvae and fish eggs in the plankton Infauna Animals of any size living within the sediment. They move
freely through interstitial spaces between sedimentary particles or they build burrows or tubes.
IUCN International Union for Conservation of Nature and Natural Resources
Keystone species Species that are important in structuring communities of species or in ecological processes
LC50 (median lethal concentration) The concentration of material in water that is estimated to
be lethal to 50% of the test organisms. The LC50 is usually expressed as an exposure time-dependant value (e.g. 96-hour LC50).
LC5 (minimum lethal concentration) The concentration of material in water that is estimated to
be lethal to 5% of the test organisms. The LC5 is usually expressed as an exposure time-dependant value (e.g. 96-hour LC5).
Low water neaps Neap low tide level Macrobenthos Biological organisms >1mm living on or in sediments and
rocks in aquatic environments Macrofauna Animals >1 mm Macrophyte A member of the macroscopic plant life of an area,
especially of a body of water; large aquatic plant

iii
Macroscopic Readily visible with the naked eye MDS Multi-dimensional scaling; a statistical technique showing
relationships between objects with attributes Meiofauna Animals <0.5mm MGU Marine Geoscience Unit MPA Marine protected area NPA National Ports Authority PAH Polycyclic Aromatic Hydrocarbon Philopatry Adherence/faithfulness to area of birth Phytoplankton Microscopic uni- and multicelled algae in the plankton Plankton Small and microscopic biological organisms that drift in the
pelagic zones of seas, lakes and artificial reservoirs Pollution The introduction of unwanted components into waters, air
or soil, usually as result of human activity; e.g. hot water in rivers, sewage in the sea, oil on land.
Population Population is defined as the total number of individuals of a species or taxon
Pore water The water in the interstices of sediment particles in unconsolidated sediments such as sands and mud
Recruitment The replenishment or addition of individuals of an animal or plant population through reproduction, dispersion and migration
SAMSA South African Maritime Safety Authority Sediment Unconsolidated mineral and organic particulate material
that settles to the bottom of aquatic environment Species A group of organisms that resemble each other to a greater
degree than members of other groups and that form a reproductively isolated group that will not produce viable offspring if bred with members of another group
Subtidal Below spring low tide level Substrata Surfaces and/or sea floor types Suspended material Total mass of material suspended in a given volume of
water, measured in mg/l Suspended matter Suspended material Suspended sediment Unconsolidated mineral and organic particulate material
that is suspended in a given volume of water, measured in mg/l
Surficial The surface layers of, e.g., sediments Swash zone The area where waves wash up on the sea shore Taxon (Taxa) Any group of organisms considered to be sufficiently
distinct from other such groups to be treated as a separate unit (e.g. species, genera, families).
Threshold concentration A concentration above which some effect (or response) will be produced and below which it will not
Toxicity The inherent potential or capacity of a material to cause adverse effects in a living organism
Toxicity test The means by which the toxicity of a chemical or other test material is determined. A toxicity test is used to measure the degree of response produced by exposure to a specific level of stimulus (or concentration of chemical)
TPH Total Petroleum Hydrocarbons

iv
Turbidity Measure of the light-scattering properties of a volume of water, usually measured in nephelometric turbidity units.
Upwelling The process of transporting deeper, usually colder water to or towards the sea surface
Vulnerable A taxon is vulnerable when it is not Critically Endangered or Endangered but is facing a high risk of extinction in the wild in the medium-term
Wrack Seaweed or plant material cast up on the sea shore Zooplankton Small protozoan or metazoan animals in the plankton

v
EXECUTIVE SUMMARY This specialist study assessed the potential environmental impacts of the proposed dredging and dredge spoil dumping on the marine ecology of the Table Bay region. The assessment was based on:
o A project description provided by the proponent (Transnet) o The available scientific and technical literature describing the ecology of the
region o Detailed sediment property measurements in the proposed dredge area o A detailed survey of sediment properties and benthic macrofauna distributions in
two candidate dredge spoil dump sites identified as part of this study in outer Table Bay, and
o Simulation modelling predictions of dredging induced turbidity plume behaviour provided by Van Ballegooyen et al. (2006).
The study identified 25 separate impacts and rated these according to guidelines provided by SRK Consulting, the lead consultant for the study. The significance of 21 of the 25 impacts was rated as very low or insignificant and therefore did not warrant mitigation. Of the remaining four rated at low, medium or higher significance levels two were reduced to insignificant through mitigation, the other two remaining at medium significance levels. By definition these latter two should influence the decision regarding the proposed dredging and spoil disposal activities. The impacts rated at low, medium or high significance pre-mitigation were:
o Importation of alien species to the harbour area by dredgers and associated ecological effects: rated as highly significant
o Discharge of dredge spoil to candidate dredge spoil disposal site #2 and effects on benthos: rated as medium significance,
o Discharge of dredge spoil to candidate dredge spoil disposal site #2 compromising water quality in the Table Mountain MPA and the Robben Island exclusion zone with deleterious effects on biota: rated as low significance, and
o Release of alien species at the dredge spoil disposal site(s) and their establishment in Table Bay: rated as medium significance.
The mitigation recommended for the potential impacts related to the importation of alien species into the dredge area or dredge spoil disposal site(s) cannot totally remove the risk although it can reduce these to a large degree. However, even at a low risk the consequences of the establishment of alien species are serious if they become invasive. Therefore, in these cases, mitigation reduces the probability of the risk occurring but not the magnitude of the potential consequences should the risk be realised. The mitigation recommended for the impacts of dredge spoil on the benthos of candidate dredge spoil disposal site #2 and possible effects in the Table Mountain MPA and the Robben Island exclusion zone is not to use this site for spoil dumping. This obviously reduces the significance rating of these impacts to insignificant. Dredge spoil dumping at dump site #1 from Cutter Suction dredger operations in winter may also generate adverse effects in the Table Mountain MPA, but these were rated as being insignificant, due to the small area that may be impacted. It is apparent that these effects may be mitigated by ensuring that the Cutter Suction phase of the dredging is conducted in the summer months.

vi
Another important issue is the possible effects of the proposed project on African penguins foraging in Table Bay. The evaluation of the predicted effects yielded a low significance rating but public perceptions merit serious attention being given to efforts to ameliorate any possible impacts. The need for these should be assessed from further simulation modelling analyses of the life cycles and distributions of dredge spoil dump site surface layer turbidity plumes throughout the various phases of the dredging programme. This may lead to mitigation solutions based on timing of the various phases of dredging and spoil dumping. These refinements could not be identified in the current assessments due to the robust but coarse approach of using 'worst case' scenarios and the unavailability of plume dissipation rate estimates at the time of compilation. This assessment was founded on known and predicted behaviour of dredging induced plumes, proven toxicity concentration limits, applicable water and sediment quality guidelines and measured distributions of key elements of the environment in the dredge and candidate dredge spoil dump sites. Basic to the conclusions reached on potential toxicity effects were measurements of potential remobilisation of trace metal contaminants in the sediments targeted for dredging. The remobilisation factors determined here compare with those inferable from international studies on contaminated sediments. However, surety would be improved with further elutriation tests on the targeted sediments to bolster the information available on this issue. The model simulations predicted that the dredging induced turbidity plumes would be contained within Ben Schoeman Dock and not impinge on the beneficial use areas of the V&A waterfront, or escape into the wider Table Bay. The former should be monitored through filter performance levels at the Two Oceans Aquarium and the latter through real time monitoring (instrumented buoy and telecommunication system) located near the entrance to the harbour. The buoy system would also allow real time control of the dredging operations in terms of limiting exceedances of suspended sediment concentrations above levels identified as being possibly deleterious to marine life. DEAT/MCM operate a mussel watch programme that incorporates sampling points around the Port of Cape Town. Sampling intervals in this programme have been and should be six months. During the dredging period requests should be made for monthly coverage to show short term effects, if any, of remobilised contaminants in filter feeders. This monitoring can be augmented by suspension of mussels adjacent to the selected dredge spoil dump site to confirm that released or remobilised contaminants are below any level of concern. Finally, the survey data gained on the candidate dump sites in this study needs to be utilised in tracking changes associated with dredge spoil dumping over a realistic time span to show rates of benthos recovery and provide information on dumped dredge spoil behaviour. Opportunities for this have not been created in the past and the baseline data set gained in this study will be an invaluable tool in understanding the effects and implications of the marine disposal of dredge spoil on South Africa's inner continental shelf.

vii
Table of Contents 1 Introduction ................................................................................................................1 2 Methodology ..............................................................................................................2 3 Project Description.....................................................................................................3 4 Sources of risks to the marine environment...............................................................5
4.1 Dredging............................................................................................................5 4.2 Dredge spoil receiving environment ..................................................................5 4.3 Cumulative effects.............................................................................................6
5 Description of the affected environment ....................................................................7 5.1 Regional Overview ............................................................................................7
5.1.1 Physical features ...........................................................................................7 5.1.2 Oceanography...............................................................................................7 5.1.3 Biological communities ................................................................................ 10
5.1.3.1 Habitats ...............................................................................................10 5.1.3.2 Table Bay Benthos ..............................................................................11 5.1.3.3 Pelagic Communities in Table Bay......................................................17 5.1.3.4 Port of Cape Town harbour communities ............................................18 5.1.3.5 Seabirds .............................................................................................. 19 5.1.3.6 Marine mammals .................................................................................21
5.1.4 Resources, and commercial and recreational fisheries in Table Bay..........22 5.1.4.1 Abalone ............................................................................................... 22 5.1.4.2 Rock lobster.........................................................................................23 5.1.4.3 White mussel .......................................................................................24 5.1.4.4 Commercial linefisheries .....................................................................25
5.1.5 Biogeography and Unique Biodiversity Resources. ....................................26 5.1.6 Beneficial uses of the natural environment..................................................27
5.1.6.1 Table Bay ............................................................................................27 5.1.6.2 The Port of Cape Town harbour ..........................................................28
5.2 Location Specific Descriptions for the Proposed Dredge and Candidate Dredge Spoil Dump Sites in Table Bay .......................................................................28
5.2.1 The Ben Schoeman dredge area ................................................................28 5.2.1.1 Particle size distributions .....................................................................28 5.2.1.2 Surficial sediment contaminant distributions........................................30 5.2.1.3 Trace metal distributions in subsurface sediments..............................33
5.2.2 Water column characteristics in the port .....................................................34 5.2.2.1 Turbidity/suspended sediment concentrations ....................................34 5.2.2.2 Nutrients and eutrophication................................................................36 5.2.2.3 Dissolved trace metal concentrations..................................................37 5.2.2.4 Biological indicators of pollution ..........................................................38
5.2.3 The proposed dredge spoil dump sites in Table Bay ..................................39 5.2.3.1 Sediment particle size distributions .....................................................41 5.2.3.2 Sediment contaminant distributions.....................................................42 5.2.3.3 Benthos distributions ...........................................................................45
6 Impact identification and assessment ......................................................................54 6.1 Impact evaluation criteria ................................................................................54 6.2 Assessment of potential environmental Impacts .............................................55
6.2.1 Harbour dredge area: dredging ...................................................................55 6.2.1.1 Removal of biological communities in the dredge target areas ...........55 6.2.1.2 Effects of turbid plumes generated by dredging on organisms inhabiting harbour sediments and structures........................................................................56

viii
6.2.1.3 Settlement of material suspended during dredging and alteration of sediment characteristics and effects on sediment biota and ecological processes 58 6.2.1.4 Remobilisation and/or redistribution of contaminants in dredged sediments disrupting ecological processes and/or compromising biological communities .........................................................................................................59 6.2.1.5 Reductions in dissolved oxygen concentrations due to introduction of organic matter previously held in the sediments and/or anoxic sediments to the water column and effects on biota........................................................................63 6.2.1.6 Release of nutrients held in the target dredge area sediments to the water column and eutrophication of the harbour water body ...............................63 6.2.1.7 Altered seawater quality through turbidity plumes and/or contaminants remobilised by dredging compromising other beneficial uses of the harbour marine environment..............................................................................................64 6.2.1.8 Importation of alien species by dredgers and associated ecological effects 67 6.2.1.9 The effect of noise from the dredging activities on biological organisms in the harbour .......................................................................................................69 6.2.1.10 Effects of dredging in the Ben Schoeman Dock Basin on endangered seabirds 69
6.2.2 Harbour dredge area: Blasting ....................................................................70 6.2.3 Dredge spoil disposal site............................................................................ 73
6.2.3.1 Alteration of seafloor sediment characteristics affecting biological communities .........................................................................................................73 6.2.3.2 Alteration of benthic biological communities through toxins associated with dredge spoil ..................................................................................................78 6.2.3.3 Effects of turbidity generated by the dredge spoil dumping on habitats adjacent to the dredge spoil dump area(s)...........................................................80 6.2.3.4 Reductions in dissolved oxygen concentrations due to introduction of organic matter previously held in the sediments and/or anoxic sediments to the water column and effects on biota........................................................................87 6.2.3.5 Turbid plumes generated by dredge spoil dumping compromise water quality in the Table Mountain marine protected area (MPA) with possible effects on biota 87 6.2.3.6 Elevated water column turbidity affecting inter- and shallow sub-tidal biological communities in adjacent conservation areas .......................................92 6.2.3.7 Inundation of intertidal shores in adjacent conservation areas by sediment deposition altering substrates and modifying communities ..................92 6.2.3.8 Introduction of alien species ................................................................93 6.2.3.9 Effects of turbidity generated during dredge spoil dumping on endangered coastal seabirds, specifically the African penguin Spheniscus demersus 94
6.3 Cumulative Impacts.........................................................................................98 7 CONCLUSIONS AND RECOMMENDATIONS......................................................103 8 REFERENCES ......................................................................................................105

1
BEN SCHOEMAN DOCK DREDGING
Specialist Study on Sediment Toxicology
And Marine Ecology
1 INTRODUCTION Ben Schoeman Dock in the Port of Cape Town is scheduled to be deepened from its current depth range of 10.4 – 14m below chart datum (CD) to -15.5m CD to accommodate the new generation of larger container ships. The deepening will entail the removal by dredging of ~ 1 230 000m3 of material. A small fraction of this (~10%) will be rock that may have to be fractured by multiple small parcel blasting prior to excavation. Dredging in coastal environments is a listed activity under South African environmental law (National Environmental Management Act (NEMA) 107 of 1998 Chapter 5) and as such requires detailed assessment before regulatory approval can be given. Therefore the proposed dredging programme required evaluation in terms of its likely effects on the natural environment. This specialist report was commissioned for this purpose. The specific brief for the assessment was:
o Provide an assessment of the target dredge sediment properties in terms of particle size distributions, contaminant concentrations and toxicity to marine organisms
o Identify the areas that may be at risk from the proposed activities o Identify the biological communities that may be at risk in these areas o Qualify the risks that the proposed operations may pose in terms of accepted
water and sediment quality guidelines o If water and/or sediment quality guidelines are exceeded, quantify the risks in
terms of the proportions of biological populations under threat and qualify these in terms of ecological consequences, and
o Devise a practical monitoring programme that will, firstly, allow real time control of project activities to reduce environmental risks and, secondly, facilitate a quantitative determination of actual versus predicted project impacts.

2
2 METHODOLOGY For the assessment two major sources of information were accessed. The first of these comprises the peer reviewed scientific literature and various contract research and survey reports available for the Port of Cape Town and Table Bay. The second is data and information from site specific surveys in the Ben Schoeman Dock Basin and at two candidate dredge spoil dump sites in outer Table Bay conducted as part of this study. Information from these sources was synthesized in a desk top evaluation of the potential impacts of the proposed project.

3
3 PROJECT DESCRIPTION As part of a programme for improving the efficiency of the Port of Cape Town, the National Ports Authority of South Africa (NPA), a division of Transnet Limited (“Transnet”), proposes to undertake the following activities:
• Deepening of the Ben Schoeman dock; and
• Conduct alterations to berths 601, 602, 603 and 604.
These alterations are necessary to accommodate larger container vessels that have a greater draught (i.e. require a greater basin depth) and beam (i.e. width). In terms of the Environmental Impact Assessment (EIA) Regulations promulgated under section 21 of the Environment Conservation Act (Act No. 73 of 1989), the proposed activities are listed and therefore require environmental authorization from the relevant authority prior to commencement (SRK, 2006). The proposed activity requiring authorization will include the following aspects:
• Deepening of the Ben Schoeman Dock within the Port of Cape Town to accommodate larger vessels; and
• Conducting alterations to berths 601, 602, 603 and 604 of the Ben Schoeman Dock.
Location of the Ben Schoeman Dock and berths in the Port of Cape Town (after
SRK, 2006).

4
The proposed deepening of the Ben Schoeman Dock would include:
• Deepening the basin from ~14m below Chart Datum (CD) to a maximum depth of ~ 15.5m below CD. The berths would be deepened in a sequential manner to immobilise only one berth at the time. Approximately 1,230,000 m3 of material will be dredged;
• Removal of “hard material”, constituting less than 10% of the total volume to be dredged, by means of multiple small parcel blasting; and
• Disposal of the dredged material at a suitable marine disposal site. The proposed alteration to berths 601 to 604 would include:
• Constructing a concrete suspended deck quay structure supported on tubular steel piles extending approximately 10m beyond the existing quay face (into the basin) at each of the four berths; and
• Constructing a single crane rail at a distance of 30m from the existing landside crane rail on the existing quay to enable the use of new super post panamax container gantry cranes.
The CSIR has been contracted to assess the potential environmental impacts in the marine environment associated with the above project.
5
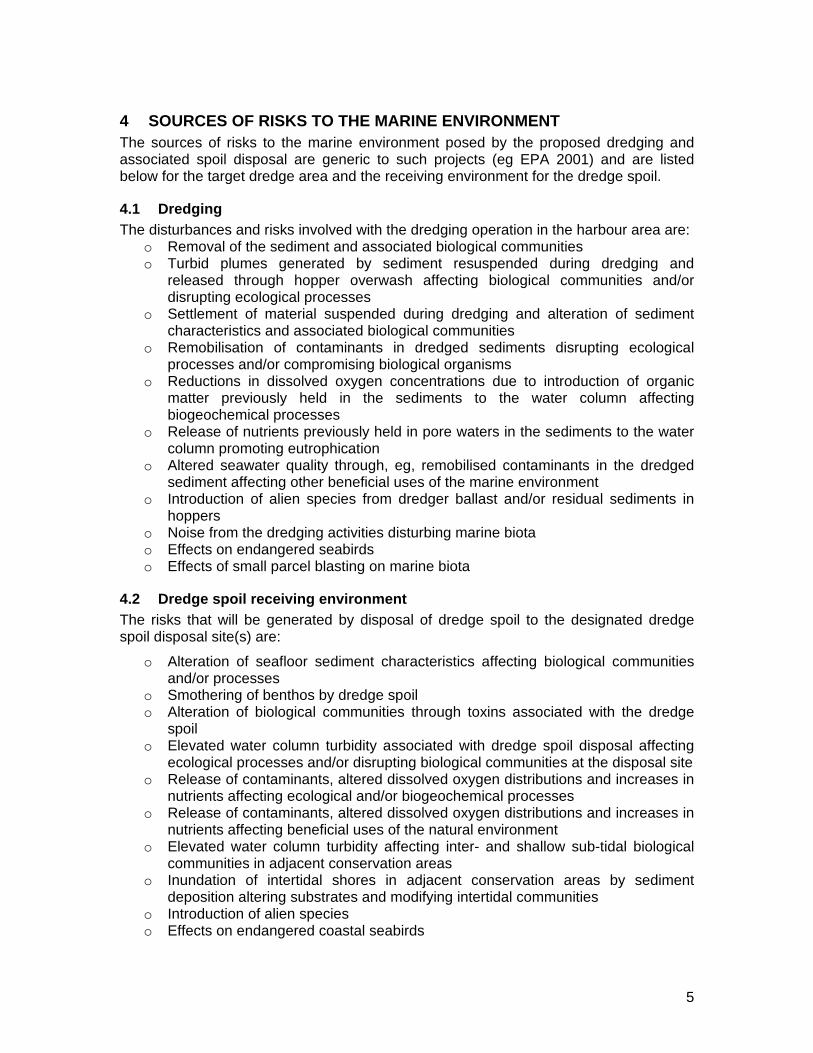
4 SOURCES OF RISKS TO THE MARINE ENVIRONMENT The sources of risks to the marine environment posed by the proposed dredging and associated spoil disposal are generic to such projects (eg EPA 2001) and are listed below for the target dredge area and the receiving environment for the dredge spoil.
4.1 Dredging The disturbances and risks involved with the dredging operation in the harbour area are:
o Removal of the sediment and associated biological communities o Turbid plumes generated by sediment resuspended during dredging and
released through hopper overwash affecting biological communities and/or disrupting ecological processes
o Settlement of material suspended during dredging and alteration of sediment characteristics and associated biological communities
o Remobilisation of contaminants in dredged sediments disrupting ecological processes and/or compromising biological organisms
o Reductions in dissolved oxygen concentrations due to introduction of organic matter previously held in the sediments to the water column affecting biogeochemical processes
o Release of nutrients previously held in pore waters in the sediments to the water column promoting eutrophication
o Altered seawater quality through, eg, remobilised contaminants in the dredged sediment affecting other beneficial uses of the marine environment
o Introduction of alien species from dredger ballast and/or residual sediments in hoppers
o Noise from the dredging activities disturbing marine biota o Effects on endangered seabirds o Effects of small parcel blasting on marine biota
4.2 Dredge spoil receiving environment The risks that will be generated by disposal of dredge spoil to the designated dredge spoil disposal site(s) are:
o Alteration of seafloor sediment characteristics affecting biological communities and/or processes
o Smothering of benthos by dredge spoil o Alteration of biological communities through toxins associated with the dredge
spoil o Elevated water column turbidity associated with dredge spoil disposal affecting
ecological processes and/or disrupting biological communities at the disposal site o Release of contaminants, altered dissolved oxygen distributions and increases in
nutrients affecting ecological and/or biogeochemical processes o Release of contaminants, altered dissolved oxygen distributions and increases in
nutrients affecting beneficial uses of the natural environment o Elevated water column turbidity affecting inter- and shallow sub-tidal biological
communities in adjacent conservation areas o Inundation of intertidal shores in adjacent conservation areas by sediment
deposition altering substrates and modifying intertidal communities o Introduction of alien species o Effects on endangered coastal seabirds

6
4.3 Cumulative effects Table Bay receives contaminants from stormwater and discharges from marine outfalls at Mouille Point and Milnerton amongst other sources and disposal of possibly contaminated dredge spoil into the bay may compromise its assimilative capacity and, consequently, its ecological sustainability.

7
5 DESCRIPTION OF THE AFFECTED ENVIRONMENT Carter et al. (2003) and Steffani et al. (2003) have provided environmental descriptions for Table Bay and the Port of Cape Town based on the available information for the region. The descriptions provided below are taken from these authors supplemented by survey data obtained subsequent to these syntheses. The environmental description is partitioned into a regional overview and site specific information on the proposed dredge areas in the Ben Schoeman Dock Basin and two candidate dredge spoil dump sites in outer Table Bay.
5.1 Regional Overview
5.1.1 Physical features Table Bay is a log spiral bay anchored by rocky headlands at Mouille Point in the south and Blouberg in the north and contains Robben Island and the important Port of Cape Town. Maximum water depth in the centre of the bay attains 35m, increasing to 70–80m outside of a line between Mouille Point and the western shores of Robben Island (Figure 1). The seabed is mainly covered by thin layers of sand but has areas of partly exposed bed rock. Fine sand is generally confined to the eastern nearshore region between Blouberg and the harbour. However, a tongue of fine sediments extends from the nearshore zone seaward to a depth of approximately 25 m between Table View and Rietvlei. Smaller pockets of fine sand are found at the bay entrance and on the eastern shore of Robben Island. Medium sand covers the remaining areas of Table Bay (Figure 2; Woodborne 1983; CSIR 1997). The major sources of the sand in Table Bay are seasonal (mainly winter) inputs from the Diep and Salt rivers and local erosion of Malmesbury shales (Quick and Roberts 1993). There is no substantial sediment supply to the bay from longshore transport from the south. Sediment is transported out of Table Bay by local wave and storm driven transport and the overall residence time for surficial sediments is estimated at 2-3 years (CSIR 1997). The shoreline of Table Bay (Figure 3) from Blouberg to Mouille Point consists of 3 km of rocky shore (at Blouberg and at Mouille Point), 13 km sandy beach (between Blouberg and Table Bay harbour) and 4 km of artificial shore protection and breakwaters comprising the Port of Cape Town (CMS 1998). Robben Island has a total shoreline of 9km, of which 91% is rocky (CMS 1998).
5.1.2 Oceanography Table Bay is located within the southern Benguela upwelling system and its circulation and water properties are characteristic of this region. Surface currents are mainly wind driven with velocity generally decreasing with depth. Quick and Roberts (1993) quote typical velocities as being 20 – 30 cm/s at the surface and near bottom flows being generally less than 5cm/s. Summer circulation in Table Bay is mainly clockwise. Nearshore currents are wave driven; waves approach the coast obliquely (200° - 260° predominantly) generating northward flow. Due to generally low current velocities water volume periods in Table Bay are generally long with an average period of 4 days (96 hours) (Quick and Roberts 1993). This particularly applies to the bottom waters where van Ieperen (1971, cited in Quick and Roberts 1993) noted that currents were

8
3760000
3755000
3750000
3745000
3740000
3735000
65000 60000
-45-50
55000 50000 45000
RobbenIsland
Blouberg-strand
Blouberg Rocks
DiepRiver
SaltRiver
Camps Bay
Clifton Beach
Milnerton
Table View
Sea Point
Green Point
Cape TownHarbour
MouillePoint
Stormwater Outfall
Small Stormwater Outfalls
Industrial & Sewage Outfalls
0 km 2.5 km 5 km
undetectable in 80% of the measurements made over an annual cycle. This contrasts with recent estimates of comparatively short residence times for surficial sediments in Table Bay (above). It would therefore appear that the main drivers for sediment turnover are episodic winter storms (cf Hill et al. 1994), which probably also completely flush the water body of the bay. Figure 1: Table Bay bathymetry, outfall pipelines and storm water discharges.

9
Figure 2: Sediment and bedrock distribution in Table Bay (after Woodborne 1983) During summer upwelling cold water (9 - 13°C) invades Table Bay from the Oudekraal upwelling centre, south of Table Bay. Temperatures can increase rapidly to >20°C during relaxation phases of the upwelling cycle as water flows into Table Bay from the north and north west (CSIR 1997). Winter temperatures are more uniform than those of summer and fall in the narrow range of 14 - 16°C. This is a result of no upwelling and strong mixing driven by storms.
3760000
3755000
3750000
3745000
3740000
3735000
65000 60000 55000 50000 45000
Very Fine Sand (0.063-0.125mm)
Fine Sand (0.125-0.250mm)
Medium Sand (0.250-0.500mm)
Coarse Sand (0.500-1.0mm)
Very Coarse Sand (1.0-2.0mm)
Bedrock
RobbenIsland
Blouberg Rocks
DiepRiver
SaltRiver
Camps Bay
Clifton Beach
Milnerton
Table View
Sea Point
Green Point Cape TownHarbour
MouillePoint
0 km 2.5 km 5 km
no d
ata
o n b
edr o
ckno
dat
ao n
bed
r ock
no d
ata
o n b
edr o
ck

10
5.1.3 Biological communities The major force driving the ecology of the region containing Table Bay is coastal upwelling. This is forced by equatorward winds which, at the latitude of Table Bay, predominantly occur in the spring/summer period (e.g. Shannon 1985). The upwelling process supplies inorganic nutrients to the euphotic zone and results in rich blooms of phytoplankton and dense stands of macroscopic algae such as kelps and associated understorey algae. These directly and indirectly provide food sources for the well-developed biological resources on the west coast including pelagic (pilchards, anchovy) and demersal (hakes, kingklip) fish stocks, near shore fisheries (linefish, rock lobster, abalone), mammals (seals and whales) and seabirds (penguins, gannets, cormorants etc). This review on the biological communities in Table Bay and their ecology draws on various published scientific studies and general reviews, non-published reports from several institutions, and discussions with specialists in relevant fields. It has to be noted, though, that there is a general paucity of information regarding the biota specific to Table Bay, and thus some of the descriptions of the different biological communities are based on information drawn from the wider West Coast.
5.1.3.1 Habitats Marine ecosystems comprise a range of habitats each supporting a characteristic biological community. Figure 3 shows that Table Bay habitats include:
o Sandy beaches extending from the Salt River mouth north past Blouberg o Rocky shores extending south of the harbour past Sea Point, at Blouberg Rocks
and at Robben Island o Artificial surfaces of the harbour itself plus the shore protection extending
towards Salt River o Subtidal sand substrata and o Subtidal rock substrata in the bay itself o The water body in Table Bay, and o The water body in the port.
The descriptions of the biological communities in each of these habitats is focused mainly on the benthic macrofauna (benthos), mammals and resident seabirds as these would probably face the largest risks from the proposed port development activities. For completeness, however, short descriptions on pelagic communities are also provided.

11
Figure 3: Distribution of rocky shores, sandy beaches, kelp beds, seabird colonies and seal populations in Table Bay.
5.1.3.2 Table Bay Benthos The intertidal rocky shore community - Intertidal rocky shores on the West Coast can be divided into four zones (Figure 4a): uppermost is the supralittoral fringe, also called the Littorina zone, followed by the upper midlittoral zone (or ‘upper balanoid’ zone), the lower midlittoral zone (or ‘lower balanoid’ zone), and lowermost the sublittoral fringe or Cochlear/Argenvillei zone. These four zones and the actual biomass of species present in them can be modified by a number of factors, the most important being wave action (McQuaid & Branch 1984, Branch & Griffiths 1988). The following description of the ‘typical’ inhabitants of these zones is based on the review by Lane & Carter (1999), with supplements from other reviews (Branch & Branch 1981, Branch & Griffiths 1988, McQuaid et al. 1985).
3760000
3755000
3750000
3745000
3740000
3735000
65000 60000 55000 50000 45000
Bank Cormorant Colony
African Penguin Breeding Colony
Kelpbeds
Intertidal Sandy Shores
White Mussel Beds
Intertidal Rocky Shores
Non-breeding Seal Colony
RobbenIsland
Bloubergstrand
Blouberg Rocks
DiepRiver
SaltRiver
Camps Bay
Clifton Beach
Milnerton
Table View
Sea Point
Green Point Cape TownHarbour
MouillePoint
0 km 2.5 km 5 km

12
Supralittoral fringe (Littorina zone) - Highest on the shore, in the Littorina zone, species diversity is low, and macroscopic life is almost entirely constituted by high densities of the tiny snail Littorina africana and variable cover of the red alga Porphyra spp. Upper midlittoral (‘upper balanoid’) – The upper midlittoral is dominated by animals, with the limpet Scutellastra (=Patella) granularis being the most characteristic species. Other grazers such as the trochid gastropod Oxystele variegata and the limpets Helcion pectunculus and Cymbula (=Patella) granatina, and the thaid gastropod Nucella dubia occur in variable densities. Barnacle cover (Chthalamus dentatus, Tetraclita serrata and Octomeris angulosa) is low. The green alga Ulva spp. is usually present. Lower midlittoral (‘lower balanoid’) – Towards the lower shore, the biota is determined by the degree of wave exposure. On sheltered and moderately exposed shores, algae become more important, particularly the red algae Champia lumbricalis, Gigartina radula, G. stiriata, Aeodes orbitosa, Iridea capensis, the green algae Codium spp. and the brown algae Splachnidium rugosum and Bifurcaria brassicaeformis. The limpet Cymbula granatina and the whelks Burnupena spp. and Nucella cingulata are also common, as is the reef building tube-worm (polychaete) Gunnarea capensis. Shores experiencing greater wave action are almost completely covered by the alien invasive mussel Mytilus galloprovincialis or at more sand inundated shores by the indigenous black mussel Choromytilus meridionalis (Robinson et al. 2005). Sublittoral fringe (Cochlear/Argenvillei zone) – Lowermost on the shore is the unique Cochlear/Argenvillei zone, which has no counterpart anywhere else in the world. At shores with moderate to strong wave action, this zone is dominated by dense populations of the limpet Scutellastra (=Patella) cochlear, which can exceed densities of 450/m2. At such densities it excludes most other species from this zone. When limpet densities are lower, the flora and fauna composition resembles that of the lower midlittoral zone accompanied by the anemone Bunodactis reynaudi, other patellid limpets and numerous whelks. Shores with very high exposure are again dominated by the mussels M. galloprovincialis and C. meridionalis and/or the tunicate Pyura stolonifera. The Cochlear/Argenvillei zone is then absent. However, at shores covered by mussel beds, all the species usually occurring on the rock surface can be found living on the shells using the mussel bed as substratum. These animals are, however, often smaller than those found on rock (Hockey & Van Erkom Schurink 1992, Steffani & Branch 2002). On very sheltered shores, both limpets and mussels are absent and the shore is dominated by the limpet C. granatina and the polychaete G. capensis, which can build reefs more than 30 cm thick, thereby excluding most other species from the shore. Rocky shore communities are strongly influenced by physical factors of which wave action is one of the most important. Generally, biomass is greater on exposed shores, which are dominated by filter-feeders. Sheltered shores support lower biomass and algae form a large portion of this biomass (McQuaid & Branch 1984, McQuaid et al.. 1985, Bustamante et al.. 1995, Bustamante & Branch 1996a, b). Most of the Cape west coast shores, including Table Bay, are exposed to moderate to heavy wave action and are thus dominated by filter-feeders. Important filter-feeder species in the intertidal are the mussels Mytilus galloprovincialis and Choromytilus meridionalis (McQuaid & Branch 1984, Bustamante et al.. 1995).

13
The subtidal rock substratum community - Along the West Coast of South Africa, kelp beds are the dominant communities on subtidal rocky reefs (= Sublittoral zone, Figure 4a). The main species in these beds are the kelps Ecklonia maxima and Laminaria pallida. The more delicate rope-like Macrocystis angustifolia can be found at more sheltered localities (Branch & Griffiths 1988).
Below the sublittoral fringe, the inshore zone is generally dominated by small E. maxima plants and supports few animals. At intermediate depths, algal biomass is maximal with large E. maxima plants forming a canopy, beneath which L. pallida and understorey algae grow. Animal species diversity and biomass are, however, still low. Further offshore the kelp plants thin out and give way to a dense faunal community dominated by sea urchins, filter-feeding mussels, sponges and sea cucumbers (Velimirov et al.. 1977, Field et al.. 1980, Branch & Griffiths 1988).
Figure 4a: Typical species zonation patterns on a South African west coast rocky shore (modified after Lane & Carter 1999).
Upper Midlittoral Lower Midlittoral Sublittoral Fring e SublittoralSupralittoral
Porphyra capensisScutellastra granularis
Ulva spp.Cymbula granatina
Aeodes orbitosaGigartina . spp
Splachnidium rugosumGunnarea capensis
Mytilus galloprovincialisChoromytilus meridonalis
Scutellastra cochlearBunodactis reynaudi
Parechinus angulosus
Ecklonia maximaLaminaria pallidaEpymenia obtusa
Jasus lalandii
Burnupena . spp
Plagusia chabrus
Nucella spp.
Found on more exposed shores
Typically found on shores
2m
0m
ROCKY SUBSTRATA
Oxystele variegata
Pyura stolonifera
-10m
-40m
Aulacomya ater
Haliotis midae
Pachmetopon blochii
Pentacta doliolum
Porifera

14
Figure 4b: Typical species zonation patterns on a South African west coast sandy beach (modified after Lane & Carter 1999). In the Table Bay area, kelp beds can be found off the rocky shores at Blouberg and from Mouille Point southwards and around Robben Island. On the eastern side of Robben Island there is a dense Macrocystis bed extending down to a depth of about 10 m (Dr R Anderson, Seaweed Research Unit, MCM, pers. comm.). Field et al. (1980) have surveyed transects across kelp beds at Sea Point (south of Mouille Point) and Melkbosstrand (north of Blouberg), which due to their close proximity are likely to be similar to those found in Table Bay. At both sites, the inshore is dominated by E. maxima, giving way to L. pallida with increasing depth. Kelp densities decline rapidly at a depth of 5-6 and 10 m for Melkbosstrand and Sea Point respectively, which is attributed to relatively high turbidities at these sites. Representative understorey algae in the kelp beds include Bifurcariopsis capensis, Botryoglossum platycarpum, Desmarestia firma, Epymenia obtusa, Gigartina radula, Neuroglossum binderianum, Plocamium corallorhiza, P. maxillosum and Trematocarpus fragilis. Kelp epiphytes include Carpoblepharis flaccida, Carradoria virgata and Suhria vittata. At both sites, but especially at Sea Point, filter-feeders form the largest trophic group, notably the ribbed mussel Aulacomya ater, the holothurians (sea cucumbers) Pentacta doliolum and Thyone aurea, Porifera (sponges) and to a lesser degree the tunicate Pyura stolonifera and barnacles. Carnivores, particularly the rock lobster Jasus lalandii and anemones, are fairly abundant. Rock lobster prey almost exclusively upon the abundant mussels. This is probably again attributable to the turbid waters, providing more food for mussels, which grow faster and provide more food for rock lobsters. Grazers and debris feeders are less common and include the sea urchin Parechinus angulosus, some patellid limpets, the giant periwinkle Turbo cidaris, the abalone Haliotis midae and some isopods and
Eulittoral Inner Turbulent Zone Transition Zone Outer Turbulent Zone
ColeopteraNiambia sp.
DipteraTylos granulatus
Eurydice kensleyi
Scololepis squamata
Excirolana natalensis
Donax serra
Bullia digitalisGastrosaccus spp.
Nephtys spp.
Cerebratulus fuscus
INTERTIDAL SURF ZONE BREAK POINT
2m
0m
-2-4m
-5-12m
-20-40m
Lumbrineris tetraura
Orbinia angrapequensis
Cumopsis robusta
Cunicus profundus
Pontegeloides latipes
Cirriformia tentaculataVirgularia schultzi
Bullia laevissimaOvalipes punctatus
SANDY SUBSTRATA
Pectinaria capensis

15
amphipods. Other faunal members include the whelks Burnupena papyracea and Argobuccinum argus, the starfish Marthasterias glacialis, the crab Plagusia chabrus and polychaetes. The fish fauna is dominated by the endemic hottentot Pachymetopon blochii, but also includes twotone fingerfin Chirodactylus brachydactylus, redfinger Cheilodactylus fasciatus, blacktail Diplodus sargus capensis, galjoen Dichistius capensis, maned blennies Scartella emarginata, and various klipfish. The kelps E. maxima and L. pallida are the main primary producers in this system. Sea urchins Parechinus angulosus feed directly on young kelp (sporelings) but the main energy conversion pathway is by means of detritus- and particularly filter-feeders feeding on the detritus derived from the kelp plants. This detritus is also an important food source for filter-feeders in the rocky and sandy intertidal (Bustamante & Branch 1996b, Soares et al. 1997). The main filter-feeders in the kelp beds are the mussels and the top predator on this species is the West Coast rock lobster. The kelps, sea urchins, mussels and rock lobsters are thus the keystone species in this system. Intertidal sandy beach communities - The West Coast of South Africa is almost linear, and virtually all beaches are exposed to strong wave action, and are thus of the intermediate or reflective type (McLachlan et al.. 1993). Typical of exposed beaches, they are usually relatively steep and narrow with well-sorted fine to medium-sized sediments, although some of the steepest beaches can have coarse sands (Branch & Griffiths 1988).
The entire Benguela region from the Cape Peninsula right up the West Coast to northern Namibia has a remarkably consistent sandy beach fauna (Field & Griffiths 1991). Although very few data exist on the species compositions of the Table Bay sandy beaches (Bloubergstrand and Milnerton Beach), data from other beaches are very likely to be applicable to them. Lane & Carter (1999) reviewed the composition of the soft-bottomed benthic macrofauna (invertebrate animals >1mm in body size) communities of the West Coast, and the following description of the beach zones and their invertebrate beach macrofauna is based on their document, supplemented by data from other studies and reviews (Christie 1976, Bally 1983, 1987, Branch & Griffiths 1988, Jaramillo et al.. 1995). The sandy beach intertidal is divided into the following zones (Figure 4b): Supralittoral zone - The supralittoral zone is situated above the high water spring mark (HWS), and receives water input only from large waves at spring high tides or through sea spray. This zone is characterised by air-breathing crustaceans, particularly the amphipods Talorchestia capensis and T. quadrispinosa, the giant isopod Tylos granulatus and the terrestrial isopod Niambia sp. The giant isopod T. granulatus, however, is very sensitive to disturbance (e.g. driving and walking on the beach) and has almost completely disappeared from Table Bay beaches (P. Nel, Marine Biological Research Unit, UCT, pers. comm.) A diverse array of insect species (Coleoptera and Diptera) can also be found, which are almost all associated with, and feeding on, wrack or other debris deposited along the drift-line. Oligochaetes can also be abundant, again particularly under seaweed debris. Community composition depends on the nature and extent of wrack, in addition to the physical factors structuring beach communities, as described above.

16
Midlittoral zone - The intertidal or midlittoral zone has a vertical range of about 2m. This mid-shore region is characterised by the isopods Pontogeloides latipes, Eurydice longicornis and Excirolana natalensis and the polychaete Scololepis squamata. In some areas, e.g. Bloubergstrand, the white mussel Donax serra is also present in considerable numbers. In the Table Bay area, the shoreline is characterised by strong coastal erosion. The construction of the docks at Table Bay harbour caused the wave energy to be reflected from the hard vertical harbour structure, which in turn resulted in the regression (erosion) of the shore to the north and east, particularly at Milnerton Beach (Quick & Roberts 1993, Smith et al. 2000). At the most common swell direction (west-south-west) waves approach the coastline at an angle close to normal with wave heights ranging from 1.0 to 2.0m (Smith et al. 2000). The headland at Mouille Point and the harbour are the only structures having a wave sheltering effect, but only on the lee (Salt River mouth side) of these structures. The erosion and the strong impact of wave action are likely to result in relatively coarse sand at Milnerton Beach, which in turn would suggest a relatively low macrofaunal diversity and abundance there. Orren et al. (1981a) recorded a general northward increase in mean particle size from 200-250µm near the Salt River mouth to around 350µm 4km north of the mouth, reflecting the increase in wave energy. These authors also recorded a very low species diversity and density, comprising mainly of the ribbon worm Cerebratulus fuscus and the polychaetes Lumbrineris tetraura and Nephtys homburgi. The white mussel D. serra was not found. Pollution and/or fresh water effects from the Salt River discharge might also be responsible for the low diversity. However, Orren et al. (1981b) working on unpolluted beaches noted a general paucity of macrofauna along this stretch of coastline which they attributed to the general high wave energy. Subtidal sand substratum community - Subtidally, three zones are defined in the turbulent depths zone, each with a defined macrofaunal grouping:
Inner turbulent zone - The inner turbulent zone extends from the low water spring mark (LWS) to a depth of about 2m. The mysid Gastrosaccus spp., the ribbon worm Cerebratulus fuscus and the cumacean Cumopsis robusta are typical of this zone, although they generally also extend partially into the intertidal zone. In areas where a suitable swash climate exists (both Milnerton Beach and Bloubergstrand), the scavenging gastropod Bullia digitalis is present in considerable numbers, ‘surfing’ up and down the beach in search of carrion. Adults of the white mussel D. serra can also be present in this zone (e.g. at Bloubergstrand, above). Transition zone - The transition zone spans the approximate depth range 2-5m. Extreme turbulence is experienced in this zone, and as a consequence it typically harbours the lowest diversity. Typical fauna of this zone include amphipods such as Cunicus profundus and deep burrowing polychaetes such as Cirriformia tentaculata and Lumbrineris tetraura. Outer turbulent zone – The outer turbulent zone extends from a depth of 5m to approximately 30m, the extent of the normal wave base, where turbulence is significantly decreased and species diversity is again much higher. Next to the polychaetes of the transition zone, other polychaetes in this zone include Pectinaria capensis, Sabellides luderitzi, Nephtys capensis and Orbinia angrapequensis. The sea pen Virgularia schultzei is also common as is the whelk Bullia laevissima and a host of amphipod

17
species. Relatively large numbers of the three spotted swimming crab Ovalipes punctatus have been noted off Melkbosstrand (north of Bloubergstrand), and they are likely to occur further south as well (DEAT/MCM information). Similar to the intertidal portion of the sandy beaches, the most important factors regulating the distribution of species are the degree of turbulence and the sediment texture (Christie 1976). Christie (1974) compared the distributions of the major benthic macrofauna taxa and sediment structures at selected depths on a cross-shelf transect off Lamberts Bay. He found that the outer turbulent zone up to a depth of 30m was dominated by fine sands, and harboured mainly molluscs, polychaetes and cnidarians. The important cnidarian species was the filter-feeding sea pen Virgularia schultzei. In Table Bay, fine sands with presumably similar faunal composition to that described by Christie (1974), are distributed along the eastern nearshore region between Blouberg and the harbour, and between Table View and Rietvlei, where a tongue of fine sediments extends seawards to a depth of ~ 25m. Smaller pockets of fine sand occur at the bay entrance and on the eastern shore of Robben Island (Figure 2).
5.1.3.3 Pelagic Communities in Table Bay The pelagic communities are typically divided into plankton and ichthyoplankton and fish. Table Bay forms part of the southern Benguela ecosystem and, as there are few barriers to water exchange, pelagic communities are typical of those of the region. Brief descriptions are given below, again with emphasis on communities, or components of communities that may be affected by port development and operation. Plankton and ichthyoplankton - The phytoplankton is generally dominated by large celled organisms. The most common diatom genera are Chaetoceros, Nitschia, Thalassiosira, Skeletonema, Rhizoselenia, Coscinodiscus and Asterionella whilst common dinoflagellates are Prorocentrum, Ceratium and Peridinium (Shannon and Pillar 1985). Harmful algal bloom (HAB) species (e.g. Ceratium furca, C. lineatum, Prorocentrum micans, Dinophysis sp, Noctiluca scintillans, Gonyaulax tamarensis, G polygramma, Alexandrium catanella, Mesodinium rubrum) also occur episodically and dense HABs have been observed in Table Bay (Pitcher and Calder 2000). Mean phytoplankton biomass ranges between 3 and 4µg chlorophyll a/litre but varies considerably with phases in the upwelling cycle and in HABs (Brown et al. 1991).
Zooplankton comprises predominantly crustacean copepods of the genera Centropages, Calanoides, Metridia, Nannocalanus, Paracalanus, Ctenocalanus and Oithona (Shannon and Pillar 1985). Larger zooplankton commonly occurring in the nearshore area (e.g. Table Bay) are the two Euphausiid species Euphausia lucens and Nyctiphanes capensis (Hutchings et al. 1991, Shannon and Pillar 1985). The zooplankton generally graze phytoplankton and therefore biomass and biomass distributions depend upon this component of the plankton. Ichthyoplankton in the southern Benguela area comprises mainly fish eggs and larvae. The most significant contributors to this are the epi-pelagic shoaling species anchovy Engraulis capensis and pilchard Sardinops sagax (Shannon and Pillar 1985). Other species including hakes and mackerel are also represented but generally to a far lesser extent. Table Bay has historically fallen within the main recruitment areas for these commercially and ecologically important species and therefore it is likely that relatively high densities of fish eggs and larvae can be present in the plankton (Crawford et al. 1989).

18
Fish - Nearshore and in the sandy beach surf zones of the southern Benguela region the structure of fish communities varies greatly with the degree of wave exposure. Species richness and abundance is generally high in sheltered and semi-exposed areas but typically very low off the more exposed beaches (Clark 1997a, b). Beach seine net catches from the shore have resulted in a total of 29 species. Dominant species include harders Liza richardsonii, silverside Atherina breviceps, white stumpnose Rhabdosargus globiceps, False Bay klipfish Clinus latipennis and two species of goby Psammogobius knysnaensis and Caffrogobius nudiceps (Clark 1997a, b).
In the offshore environs of Table Bay all of the commercially important fish species occur, some of which are fished (below). As pointed out above Table Bay falls in an important recruitment area for the epi-pelagic species and is also in the seasonal migration pathway of these fish to spawning grounds south of Cape Point and on the western Agulhas Bank (Crawford et al. 1991). However, the absolute or relative importance of Table Bay to these fish is not known but is probably not significant due to the relatively small area encompassed within Table Bay compared to that of the overall recruitment and foraging habitat of these species.
5.1.3.4 Port of Cape Town harbour communities Benthos - Biofouling communities on the hard structures of the harbour near the harbour entrance in the Victoria Basin and on the inner Duncan Dock walls appear to be relatively diverse. The community includes barnacles Octomeris angulosa, Austromegabalanus cylindricus and Notomegabalanus algicola, sea squirts Ciona intestinalis (invasive alien, Robinson et al. 2005), large polychaetes Syllis spp., Pseudonereis variegata, Nephtys spp. and Platynereis dumerilii, the tunicate Pyura stolonifera, spiral fanworm Spirorbis spp., anemones,mainly Bunodosoma capensis, but also Anthothoe stimpsoni, Actinia equina and Cerianthus spp., bryozoans, sponges, feather stars Comanthus wahlbergi, chitons, nudibranchs, some amphipods and the algae Porphyra capensis, Aeodes orbitosa, Laurenica flexuosa and in some places E. maxima. Klipfish may be common and a crab Plagusia chabrus and small lobsters Jasus lalandii have also been reported. The biofouling community may be well developed with vertical surfaces 100% covered with a 7.5-35cm thick fouling community (CMS 1995a, b). Interestingly, no bivalves (mussels) have been reported as occurring on any of the walls. The reason for this is not known. Despite the absence of bivalves, the community structure was found to be reasonably healthy for this type of environment with an acceptable level of species diversity.
Further into the harbour, however, species diversity has been shown to decline drastically (CMS 1995a, b). In addition to a few barnacles, sea squirts and green algae (Ulva spp. and Enteromorpha spp.) the alien anemone Metridium senile (Griffiths et al.. 1996) has been found near the bottom and in the bottom sediments. Also the crab Plagusia may be replaced by the alien European shore crab Carcinus maenas (Robinson et al. 2005), which can be abundant. The sites with the lowest diversity and sparsest cover are near the dry dock and the synchro-lift in the Alfred Basin. Here only some green algae, very few barnacles, the low growing hydroid Tubularia warreni and some C. maenas have been found to be present. Benthos inhabiting the sediments within the harbour appears to be depauperate if not completely absent in the interior of the Victoria and Alfred Basins (CMS 1995a, b). This was attributed to a high level of anoxia within the sediments and pollution in these Basins. This is borne out to an extent by acid volatile sulphide (AVS) measurements made by CSIR (2004) who recorded consistently high values in these regions of the

19
harbour. No benthos sampling results have been reported for the Ben Schoeman Dock Basin or the outer areas of the harbour that would allow a determination of the extent of the apparent pollution effect on benthos distributions. AVS values do tend to decline in these areas and may be zero indicating that the sediments are oxic. If, as is likely, anoxia is the controlling variable it is probable that there will be benthos in the sediments with low to zero AVS levels. Distortion levels in community composition due to pollution effects or other stressors such as frequent surficial sediment suspension are, however, unknown. Outside the harbour, large numbers of juvenile rock lobsters can be found on the vertical faces of the outer harbour wall (Hazell et al. 2002). Other major components of the wall community are encrusting corallines, the barnacle Notomegabalanus algicola, the sea urchin Parechinus angulosus, the ribbed mussel Aulacomya ater, and sponges (Mayfield 1998). The relatively low coverage and biomass of mussels and the high cover of encrusting corallines at the wall contrast with nearby natural subtidal rocky shores, for example at Mouille Point, where mussels cover approx. 80% of the rocks and encrusting coralline cover is low (Mayfield 1998, Table 1). Harbours are a typical location for the introduction of alien species through ships calling at the port which may transport organisms on their hulls or in their ballast waters. Examples in the Port of Cape Town are the European shore crab Carcinus maenas, the anemone Metridium senile, which grows on loose, silt-laden boulders or other objects, and on the soft sediments on the floor of the Victoria and Alfred Basins, the red algae Schimmelmannia elegans, and the ascidian Ciona intestinalis (Robinson et al. 2005). Table 1: Average percentage cover and wet biomass (± standard error) of benthic organisms at the outer harbour wall and at Mouille Point. Percentage cover includes secondary cover (e.g. barnacle cover) and can thus exceed 100% (after Mayfield 1998).
Benthos Harbour Wall %cover / g wet mass/m2 ± SE
Mouille Point %cover / g wet mass/m2 ± SE
Coralline algae 75 / 2235 ± 289 20 / 506 ± 192 Foliar algae <1 / <1 ±0.29 <1 / 1 ± 0.21 Sponges 10 / 36 ± 7 3 / 16 ± 8 Parechinus angulosus 70 / 334 ± 75 5 / 259 ± 51 Aulacomya ater 50 / 826 ± 391 80 / 3303 ± 279 Notomegabalanus algicola 40 / 81 ± 34 2 / 10 ± 7
Port of Cape Town harbour pelagic communities - There is apparently no published information on communities inhabiting the water column in the harbour. It is known that euphausiids do occasionally occur in the port reaching densities sufficiently high to clog the Two Oceans Aquarium seawater intakes (Two Oceans Aquarium Curatorial Staff observations). Small shoals of mullet (Mugil sp.) can be common in the outer harbour area, particularly along the seawalls between the entrance to Duncan Dock and the western breakwater (own observations). As pointed out above there is also a resident or semi-resident fur seal population that utilises the port apparently as a foraging area.
5.1.3.5 Seabirds Important seabirds in the Table Bay area include the endemic African penguin Spheniscus demersus and Bank cormorant Phalacrocorax neglectus. In 1983, African penguins recolonised Robben Island starting with a breeding population of nine pairs. By 1996, the colony had grown to about 3100 breeding pairs. Counts from April to June

20
2000 at Robben Island revealed further growth to a breeding population of 5705 pairs (Crawford et al. 2000), which, assuming a ratio of 3.2 adults per breeding pair (Crawford & Boonstra 1994), amounts to an estimated population of 18 000 adult penguins. This was approximately equivalent to 12% of the global population at this time (data from Crawford 2006). Robben Island is therefore a critically important breeding site for the African penguin population. Figure 5 provides another view of fluctuations in penguin numbers utilising Robben Island via counts of birds coming ashore to moult. The main feature of this figure is the approximately monotonic increase in bird numbers to 2004 and then a sharp decline to the present (2006). This may be linked to food availability (primarily sardine Sardinops sagax), as the centre of abundance of this species appears to have moved east of Cape Point in the recent past (van der Lingen et al. 2005.).
02000400060008000
100001200014000160001800020000
1988
/89
1990
/91
1992
/93
1994
/95
1996
/97
1998
/99
2000
/01
2002
/03
2004
/05
Year
Mou
lters
Figure 5: Recent trends in the numbers of penguins (adult and immature) that come ashore to moult on Robben Island (from Crawford 2006) Overall the African penguin population has decreased throughout the 20th century, at a rate that has led to its classification as Vulnerable under IUCN criteria (Crawford 1998, Barnes 2000). More recently apparent declines in nesting populations on specifically St Croix Island in Algoa Bay (Crawford 2006) indicates that this classification should be changed to Endangered. Satellite tracking data indicate that penguins forage mainly north and offshore of Robben Island generally within 20km of the island shores (DEAT/MCM unpublished data). It is therefore apparent that the larger Table Bay area comprises critical habitat for this species. Next to the large penguin colony, Robben Island supports the 3rd largest colony of Bank cormorants (120 breeding pairs in June 2000), which are also endemic to southern Africa. The 2nd largest colony is at Clifton Rocks, just south of Table Bay (Crawford et al. 2000, Figure 3). The global population of Bank cormorants have decreased drastically in the last three decades, from 8 672 breeding pairs to 4 888 pairs in 1995/97, and they are also considered Vulnerable (Barnes 2000).

21
Other seabirds, which might breed at Robben Island, are the Cape, crowned and great cormorant (Phalacrocorax capensis, P. coronatus and P. carbo, respectively), kelp and Hartlaub’s gull (Larus dominicanus and L. hartlaubii, respectively), and swift tern Sterna bergii. Cape and crowned cormorants and Hartlaub’s gull are endemic to southern Africa, and the races of kelp gull and swift tern in this region occur nowhere else (Crawford et al. 2000). However, none of these birds had nested at Robben Island in 2000 (Crawford et al. 2000). Another endemic seabird, the African black oystercatcher Haematopus moquini, classified as Near-threatened (Barnes 2000), had in 2000 a breeding population of about 35 pairs on Robben Island (Crawford et al. 2000). This species appears to have a resurgence possibly related to increased availability of mussels through colonization of higher shore levels by the invasive Mytilus galloprovincialis (Robinson et al. 2005).
5.1.3.6 Marine mammals A number of resident, semi-resident and migrant cetaceans (dolphins and whales) occur in the waters of the southern African West Coast (Table 2), and have been sighted in Table Bay (Best 1981, Findlay et al. 1992). The most common is the Southern right whale which undergoes a seasonal (May – October/November) migration into South African coastal embayments where females bear and raise calves and may mate with males (Best and Ross 1989). Highest densities occur between Cape Point and Mossel Bay but the whales also extend onto the west coast and are regularly reported in the Table Bay to St Helena Bay region (Best 2000). Southern right whales are classified as Vulnerable under the IUCN criteria due to precipitous population declines attributable to industrial whaling. This reduced the population in the southern African region from ~20 000 to ~400 individuals by 1935, completely eradicating the Namibian and Mozambican components (Richards and Du Pasquier 1989). Following the cessation of 'legal' whaling off South Africa in 1960's and 1970's the Southern right whale population migrating to South African coastal waters began recovering and now stands at about 3000 whales (~15% of the 'pristine' population; Dr P Best, South African Museum, pers comm.). With the cessation of whaling the main threat to Southern right whales during their presence in South African waters is considered to be disturbance by vessel traffic and ship strikes and Table Bay with its port related shipping obviously represents a potentially high risk area for this. Some protection is afforded to these whales under South African Law which prohibits any vessel from approaching closer than 300m from all whales. Unfortunately this is not always enforceable (resources for surveillance are limited) or achievable (ships navigating at night or in fog conditions). However, adequate controls on ship speeds can significantly reduce risks here. Also, any such disturbance should only affect a minor proportion of the Southern right whales that visit the South African coast due to most whales being located east of Cape Point. Further, although philopatry to the South African coast must be quite strong, fidelity to specific coastal embayments is apparently not as well developed (Best 2000) and thus disturbance at one site should not have strong negative affects on the whales that occur here.

22
Table 2: Common whales and dolphins found in inshore waters of the southern African West Coast (from Lane & Carter 1999) Common Name Scientific Name Notes
RESIDENT Heaviside’s Dolphin Cephalorhynchus heavisidii Endemic to the West Coast of South
Africa. Form small schools. Dusky Dolphin Lagenorhynchus obscurus Often accompanies ships. Form schools
of up to 300 individuals. Common Dolphin Delphinus delphis Resident, forming schools of up to 5000
animals. Killer whale Orcinus orca Cosmopolitan along entire South African
Coast, hunting in packs of up to 30 individuals.
SEMI-RESIDENT Humpback whale Megaptera novaeangliae Migrate past coast during midwinter and
spring. MIGRANT Southern Right Whale Eubalaena australis Most common between June and
December whilst breeding in southern African waters. Occurs in Table Bay.
Four species of seals are found in South African waters of which the Cape fur seal (Arctocephalus pusillus pusillus) is the most common, and can often be seen in Table Bay. There is a non-breeding population in the harbour itself, mainly occurring in the Victoria Basin. The size of this population fluctuates greatly depending on food availability in and around Table Bay, and because they leave the harbour during the breeding season (DEAT/MCM observations). The nearest breeding colonies are at Seal Island in False Bay and at Robbensteen between Koeberg and Bok Punt on the West Coast (Wickens 1994). The survival of seal pups at Seal Island is, however, low due to the flat topography of the island. Big waves often wash pups out to sea (DEAT/MCM observations). Historically, there was also a seal colony at Robben Island, but along with many other colonies it was destroyed due to disturbance and sealing by the early 20th century, and seals have not returned (Shaughnessy 1984). Far less common on the West Coast are the subantarctic fur seal (Arctocephalus tropicalisa), the leopard seal (Hydrurga leptonyx) and the southern elephant seal (Mirounga leonia). Vagrant individuals may occur in Table Bay.
5.1.4 Resources, and commercial and recreational fisheries in Table Bay Several vertebrate and invertebrate fisheries operate either in Table Bay or in adjacent waters. These are described briefly below.
5.1.4.1 Abalone The abalone (perlemoen) Haliotis midae is an important resource in South African waters, having supported a commercial fishery for > 50 years. Although the fishery is small-scale, with small Total Allowable Catch (TAC) of currently ~120 tonnes per annum, it is economically important. Abalone is also fished recreationally and this sector having increased in recent years. The greatest current threat, however, to the abalone stocks is the increase in illegal catches (Dichmont et al. 2000, Tarr 2000), overfishing having seen the TAC decline from around 600 tonnes in the 1990's to the present level.
23
Three commercial fishing zones exist on the West Coast: one from Cape Point to Mouille Point (zone E), one from Blouberg to Cape Columbine (zone G) and one at Robben Island (zone F) (Tarr 2000). Current (2006/2007) quotas are 12, 20 and 18 tons for E, F, and G respectively (http://www.mcm-deat.gov.za). No recreational fishing will be allowed for the 2006/2007 period due to the parlous state of the overall abalone resource. Most abalone are found on rocky reefs shallower than 10 m and are closely associated with kelp beds.
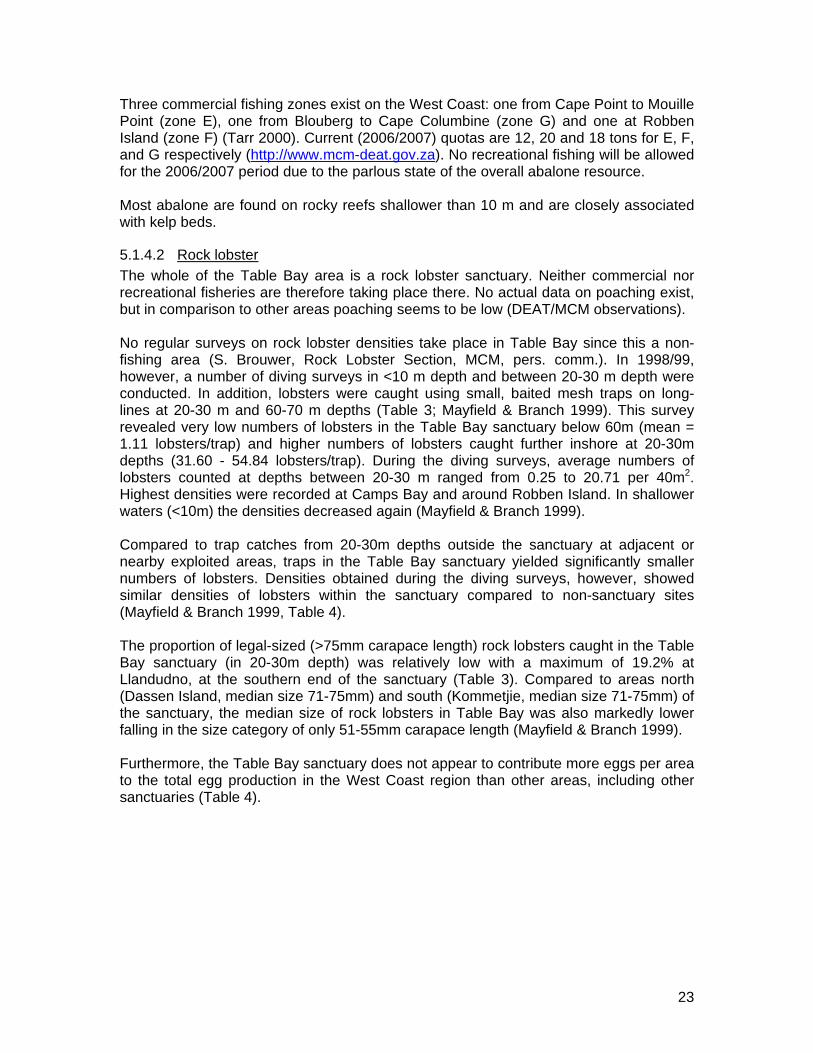
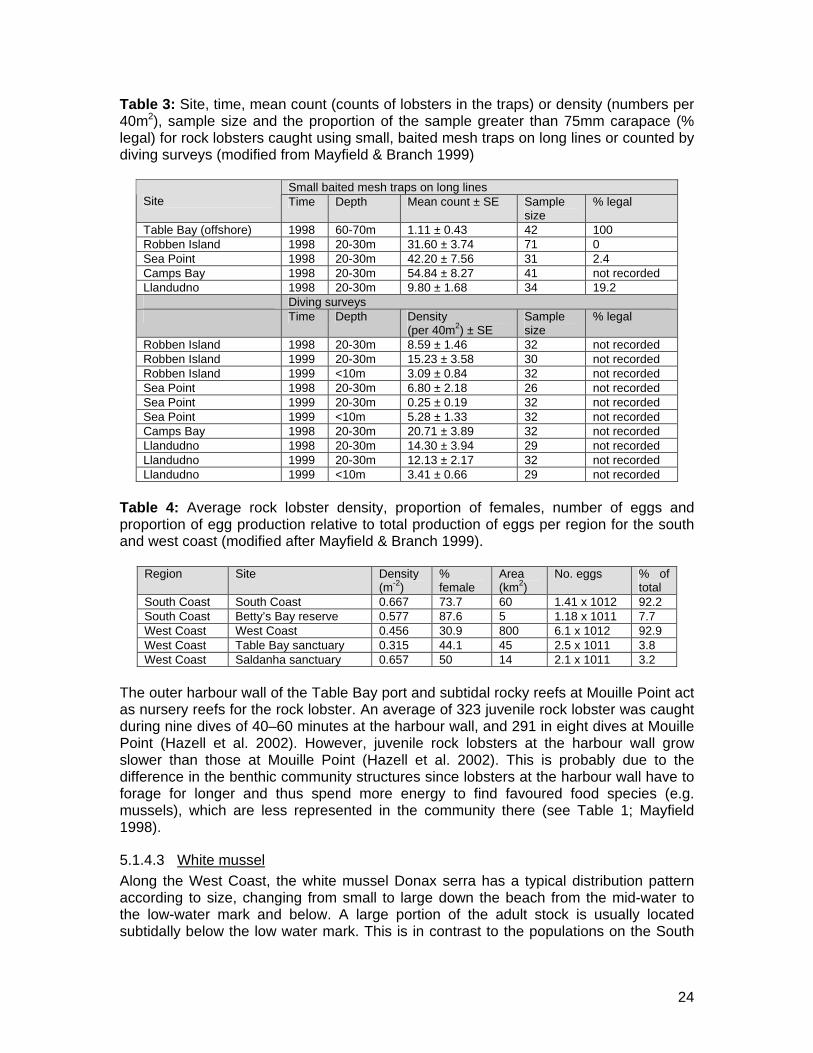
5.1.4.2 Rock lobster The whole of the Table Bay area is a rock lobster sanctuary. Neither commercial nor recreational fisheries are therefore taking place there. No actual data on poaching exist, but in comparison to other areas poaching seems to be low (DEAT/MCM observations). No regular surveys on rock lobster densities take place in Table Bay since this a non-fishing area (S. Brouwer, Rock Lobster Section, MCM, pers. comm.). In 1998/99, however, a number of diving surveys in <10 m depth and between 20-30 m depth were conducted. In addition, lobsters were caught using small, baited mesh traps on long-lines at 20-30 m and 60-70 m depths (Table 3; Mayfield & Branch 1999). This survey revealed very low numbers of lobsters in the Table Bay sanctuary below 60m (mean = 1.11 lobsters/trap) and higher numbers of lobsters caught further inshore at 20-30m depths (31.60 - 54.84 lobsters/trap). During the diving surveys, average numbers of lobsters counted at depths between 20-30 m ranged from 0.25 to 20.71 per 40m2. Highest densities were recorded at Camps Bay and around Robben Island. In shallower waters (<10m) the densities decreased again (Mayfield & Branch 1999). Compared to trap catches from 20-30m depths outside the sanctuary at adjacent or nearby exploited areas, traps in the Table Bay sanctuary yielded significantly smaller numbers of lobsters. Densities obtained during the diving surveys, however, showed similar densities of lobsters within the sanctuary compared to non-sanctuary sites (Mayfield & Branch 1999, Table 4). The proportion of legal-sized (>75mm carapace length) rock lobsters caught in the Table Bay sanctuary (in 20-30m depth) was relatively low with a maximum of 19.2% at Llandudno, at the southern end of the sanctuary (Table 3). Compared to areas north (Dassen Island, median size 71-75mm) and south (Kommetjie, median size 71-75mm) of the sanctuary, the median size of rock lobsters in Table Bay was also markedly lower falling in the size category of only 51-55mm carapace length (Mayfield & Branch 1999). Furthermore, the Table Bay sanctuary does not appear to contribute more eggs per area to the total egg production in the West Coast region than other areas, including other sanctuaries (Table 4).
24
Table 3: Site, time, mean count (counts of lobsters in the traps) or density (numbers per 40m2), sample size and the proportion of the sample greater than 75mm carapace (% legal) for rock lobsters caught using small, baited mesh traps on long lines or counted by diving surveys (modified from Mayfield & Branch 1999)
Small baited mesh traps on long lines Site Time Depth Mean count ± SE Sample
size % legal
Table Bay (offshore) 1998 60-70m 1.11 ± 0.43 42 100 Robben Island 1998 20-30m 31.60 ± 3.74 71 0 Sea Point 1998 20-30m 42.20 ± 7.56 31 2.4 Camps Bay 1998 20-30m 54.84 ± 8.27 41 not recorded Llandudno 1998 20-30m 9.80 ± 1.68 34 19.2 Diving surveys Time Depth Density
(per 40m2) ± SE Sample size
% legal
Robben Island 1998 20-30m 8.59 ± 1.46 32 not recorded Robben Island 1999 20-30m 15.23 ± 3.58 30 not recorded Robben Island 1999 <10m 3.09 ± 0.84 32 not recorded Sea Point 1998 20-30m 6.80 ± 2.18 26 not recorded Sea Point 1999 20-30m 0.25 ± 0.19 32 not recorded Sea Point 1999 <10m 5.28 ± 1.33 32 not recorded Camps Bay 1998 20-30m 20.71 ± 3.89 32 not recorded Llandudno 1998 20-30m 14.30 ± 3.94 29 not recorded Llandudno 1999 20-30m 12.13 ± 2.17 32 not recorded Llandudno 1999 <10m 3.41 ± 0.66 29 not recorded
Table 4: Average rock lobster density, proportion of females, number of eggs and proportion of egg production relative to total production of eggs per region for the south and west coast (modified after Mayfield & Branch 1999).
Region Site Density (m-2)
% female
Area (km2)
No. eggs % of total
South Coast South Coast 0.667 73.7 60 1.41 x 10¹² 92.2 South Coast Betty’s Bay reserve 0.577 87.6 5 1.18 x 10¹¹ 7.7 West Coast West Coast 0.456 30.9 800 6.1 x 10¹² 92.9 West Coast Table Bay sanctuary 0.315 44.1 45 2.5 x 10¹¹ 3.8 West Coast Saldanha sanctuary 0.657 50 14 2.1 x 10¹¹ 3.2
The outer harbour wall of the Table Bay port and subtidal rocky reefs at Mouille Point act as nursery reefs for the rock lobster. An average of 323 juvenile rock lobster was caught during nine dives of 40–60 minutes at the harbour wall, and 291 in eight dives at Mouille Point (Hazell et al. 2002). However, juvenile rock lobsters at the harbour wall grow slower than those at Mouille Point (Hazell et al. 2002). This is probably due to the difference in the benthic community structures since lobsters at the harbour wall have to forage for longer and thus spend more energy to find favoured food species (e.g. mussels), which are less represented in the community there (see Table 1; Mayfield 1998).
5.1.4.3 White mussel Along the West Coast, the white mussel Donax serra has a typical distribution pattern according to size, changing from small to large down the beach from the mid-water to the low-water mark and below. A large portion of the adult stock is usually located subtidally below the low water mark. This is in contrast to the populations on the South

25
Coast, where the entire population occupies the mid to upper intertidal (De Villiers 1975, Donn 1990, Farquhar 1995). A large population of D. serra occurs at Bloubergstrand (Big Bay) just north of the rocky shores at Blouberg. A survey in 1994/1995 revealed average densities of adult mussels (>50mm) of 68 animals/m2 or 2.0 x 10⁶/km of shoreline. This was considerably lower than for example at Yzerfontein (97/m2 or 2.9 x 10⁶/km) or at Elands Bay (156/m2 or 4.7 x 10⁶/km) (Farquhar 1995). Including recruits (<15mm) and juveniles (15-50mm), densities of D. serra at these beaches could reach up to 400/m2. More recent sampling at Bloubergstrand, however, suggests that the D. serra population has increased significantly to the point where it currently supports one of the highest densities of adults along the South African West Coast (Information from P. Nel, Marine Biology Research Unit, UCT1). D. serra also occurs at the northern end of Milnerton Beach. A survey in 1994 revealed densities of approx. 400 animals/m2 (all size classes) (P. Nel, unpublished data). D. serra is harvested recreationally for bait and consumption and is thus an important resource species in the area. In 1995, it was estimated that on a stretch of 900m along Bloubergstrand 15.8 tonnes of white mussel were collected annually, which was much higher than at Yzerfontein (11.3 tonnes) or at Elands Bay (2.7 tonnes) (Farquhar 1995). No data exist for white mussel populations along the southern stretch of Milnerton Beach, but it is likely that this species does not occur there or only in very low numbers, since the grain size at this beach is too coarse (P. Nel, Marine Biology research Unit, UCT, pers. comm.). D. serra prefers particle sizes between 200 to 300 µm (Nel 1995).
5.1.4.4 Commercial linefisheries The Table Bay region supports commercial linefisheries for hottentot (Pachymetopon blochii) snoek (Thyrsites atun) and other species including long fin tuna (Thunnus alalunga), chub mackerel (Scomber japonicus) and chokka (Loligo vulgaris reynaudii). Catches are dominated by snoek and, to a lesser extent, long fin tuna with hottentot being a minor contributor by mass. Snoek and long fin tuna are seasonal migrants to the region whereas hottentot, with relatively high site fidelity, provide regular catches throughout the year (Figure 6). It is not known, however, what proportion of the landings are from Table Bay itself.
1 Current address: Department of Zoology, Nelson Mandela Metropolitan University, Port Elizabeth.

26
0
25000
50000
75000
100000
125000
150000
Jan
Feb Mar
April
May
June Ju
lyAug
Sept
OctNov Dec
Month
Kg
Hottentot Snoek Other
Figure 6: Average monthly landings of line fish caught between Llandudno and Koeberg for the period 2000 – 2005. Long fin tuna dominate the 'other' category, comprising 70% - 80% by mass. Data provided by Line Fish Section, DEAT/MCM) The number of boats involved in the fishery is relatively large with up to 100 boats on the water at any one time during snoek 'runs'. The area around Robben Island is important for this species. Hottentot are most regularly fished in deeper reefs 3.5 – 5.5km offshore located south of Mouille Point.
5.1.5 Biogeography and Unique Biodiversity Resources. The South African coastline can be divided into three biogeographic provinces, the cold temperate West Coast, the warm temperate South Coast and the subtropical East Coast. Table Bay falls within the cold temperate West Coast province. A study by Bolton and Stegenga (2002) on the diversity of seaweeds along the South African coast (divided into contiguous 50km coastal sections) has shown that the number of species occurring in the Table Bay area is typical for the West Coast, thus not separating this area from the rest of the West Coast. Another survey done by Emanuel et al. (1992) on the zoogeographic patterns of intertidal marine invertebrates around the South African coast also groups Table Bay within the West Coast province, not showing significant differences between rocky shore communities along the West Coast other than related to physical factors such as wave action for example. Their survey, however, was done on a relatively broad scale (coast divided into 100km stretches), but comparisons of data from various studies on rocky shore communities (or specific organisms within these communities) in the Table Bay area show similar species compositions as is found on other west coast areas (McQuaid & Branch 1984, McQuaid et al. 1985, Van Erkom Schurink & Griffiths 1990, Bustamante & Branch 1996a, Kruger & Griffiths 1998, Harris et al. 1998). Similarly, the sandy beach fauna is remarkably consistent in the entire Benguela region from the Cape Peninsula all the way up the West Coast to northern Namibia (Field & Griffiths 1991), which also includes the Table Bay area. This suggests that the communities in Table Bay are typical for the West Coast and not unique to Table Bay. The only exception to this - though not in terms of species uniqueness but rather in terms of high density and thus importance - is the white mussel (D. serra) population at

27
Bloubergstrand (Big Bay), which is the densest population of this species at the West Coast (P. Nel, Marine Biology Research Unit, UCT, pers. comm.). The above indicates that the benthic communities in Table Bay are typical for the West Coast, are not unique to Table Bay and cannot be classified as locally, regionally or internationally important biodiversity resources. This rationale also applies to the pelagic fish and marine mammals occurring in Table Bay as these are widespread on the South African west (and south) coast. Further Table Bay itself does not appear to be critically important either as a foraging or breeding area for these fauna. The resident seabird community is a strong exception to this, especially the endemic African penguin and Bank cormorant. It is estimated that in 2005 >60% of the global population of penguins were foraging in continental shelf waters in and adjacent to Table Bay; these birds coming from the breeding sites at Dassen and Robben Islands (data from Crawford 2006). Robben Island is also an important breeding site for Bank cormorants as it represents the third largest breeding colony currently in existence. Both of these species have undergone severe declines in population size over the last century and are currently classified as Vulnerable under the IUCN criteria (Crawford et al. 1998). However, as pointed out above there is justification to reclassify penguins to Endangered. Due to their population size, endemism and conservation classification these seabirds represent internationally significant biodiversity resources.
5.1.6 Beneficial uses of the natural environment
5.1.6.1 Table Bay Aside from shipping five categories of beneficial use of the natural environment in Table Bay are dominant: o Commercial fishing, boat based linefishery for snoek, hottentot and predominantly
tunas in and adjacent to Table Bay, and abalone (diver) in the shallow rocky subtidal zone south of Mouille Point and around Robben Island
o Collection of white mussel (Donax serra) for consumption on beaches extending north from Milnerton to Blouberg
o Recreation, comprising mainly water sports such as yachting, kayaking, wind and kite surfing, surfing, diving, swimming and whale watching as well as general beach and coastal recreation,
o Industrial (cooling) water use at the Koeberg Power Station, and o Nature conservation. Table Mountain National Park has an associated 'multi-use'
marine protected area (MPA) the northern boundary of which extends from Mouille Point 14km offshore and then southwards to Cape Point. Commercial and recreational fishing is allowed within the boundaries of the MPA but there are 'no take' sanctuaries where any form of fishing is prohibited. The furthest north of these in the Table Mountain MPA is the Karbonkelberg Marine Reserve. The area encompassed within this reserve stretches from Oudekraal in the north to the base of the Sentinel at Hout Bay in the south and extends westwards out to sea to longitude 18° 17.797'E ( http://www.sanparks.org/parks/table_mountain/library/mpa). The northern boundary of the Karbonkel Marine Reserve is 8.7km south of the northern boundary of the Table Mountain MPA. Robben Island is a provincial nature reserve but has no formal MPA associated with it. There are, however, restrictions on fishing (abalone) and the island falls within the Table Bay rock lobster reserve. For practical purposes the sea area encompassed within a radius of 1.83km around the Island can be considered to be environmentally

28
sensitive because of its conservation importance to African penguins and bank cormorants.
5.1.6.2 The Port of Cape Town harbour By definition the Port of Cape Town is a working shipping harbour handling cargoes and supplying ship repair facilities. It also hosts extensive small craft, mainly yachts, used for cruising and racing in Table Bay and has the retailing, leisure and entertainment complex of the V&A waterfront development. These non-shipping uses do not absolutely require pristine seawater quality but may be compromised to an extent by serious water quality degradation. The Two Oceans Aquarium, within the waterfront development, is an exception to this as it holds and displays marine fauna and flora. It is therefore dependant on the seawater that it withdraws from the Victoria Basin being of sufficient quality to not compromise the organisms and biological processes within the aquarium. The water quality requirements for this are defined in BCLME (2004).
5.2 Location Specific Descriptions for the Proposed Dredge and Candidate Dredge Spoil Dump Sites in Table Bay
5.2.1 The Ben Schoeman dredge area CSIR (2000, 2004, 2005 and 2006a) have provided information on the particle size distributions and contaminant concentrations for the Ben Schoeman Dock sediments. These surveys focused on surficial sediments, additional data on particle size distributions in the subsurface layers of the sediment are available from a set of vibrocore samples reported on by Protekon (2006). For the surficial sediments this description uses the most recent of the CSIR surveys (2005 and 2006) data to ensure topicality. The positions of sampling stations within the proposed dredge area for both of these surveys are shown on Figure 7.
5.2.1.1 Particle size distributions Surficial sediments in the Ben Schoeman Dock comprise mainly sand (equivalent spherical diameter (ESD) particle size range <2000µm->63µm) and mud (<63µm) with a small component of gravels (>2.00mm) by weight. Distributions vary throughout the dock Basin but the average composition is 43–50% sand, 21–44% mud, and 5–19% gravel. Subsurface sediments appear to be largely similar with ~54% sand, 42% mud, and generally ~4% gravel (Table 5). Vibrocore boreholes down the centre of the proposed dredge area showed surficial layer horizons at sediment depths ranging between 0.20m to 2.30m with a mean depth of 0.90m (sd = 0.70, n = 8, Protekon 2006). Sediment textures in these surficial layers ranged from black, soft silty clay to silty sand (4µm–125µm, Protekon 2006). The surficial sediments generally overlay denser, coarser sands, soft to hard bedrock (Graywacke) or gravels. These appear to be variable across the Ben Schoeman Dock Basin (Borehole Logs, Protekon 2006).

29
Figure 7: Chartlet of the Ben Schoeman Dock in the Port of Cape Town. The proposed dredge area is demarcated by the purple line (from Protekon drawing # BDC009V). Grey circles indicate the positions of sediment samples taken in 2005 and black squares those taken in 2006. The green nav marker shows the position of sediment sample BS1B. Table 5: Gross distribution of sediment particle sizes in the soft sediments in the proposed dredge area (from Schoonees 2006)
Particle size fraction (µm)
Classification % Approximate volume to be dredged*
(m3) >2000 Gravel 4 37 980
>63 - <2000 Sand 54 493 700 <63 Mud 42 417 750
*assumes total unconsolidated sediment dredge volume of 949 430m3
The presence of mud, silt and clay sized particles in the surficial sediments indicates that areas within the Ben Schoeman Dock Basin are depositional in nature. This is expected as harbours are designed to be quiet water areas and consequently shear stresses at the sea bed would be low, allowing fine material to settle out of the water column. However, the apparent thickness of the surficial layer varies across the dock Basin as evident in the borehole logs (Protekon 2006). This may be attributable to previous dredging and construction activities that altered the depth distributions of the coarser material underlying the surficial sediments. Protekon (2006) provide circumstantial evidence for this in 'anomalous' distributions of gravel layers as well as chipped rock fragments apparently resulting from dredging. Initial construction activities for the Ben

30
Schoeman Dock occurred in 1971 (Protekon 2006) and therefore the muds, silts and clays in the surficial sediments in the Basin have probably been accumulating since this period.
5.2.1.2 Surficial sediment contaminant distributions Contaminant concentrations in the surficial sediment (top ~20cm) in the Port of Cape Town have been routinely measured since 1999 (CSIR data). In 1999, 2000, 2001 and 2004 coverage in the Ben Schoeman Dock Basin was limited to three stations (eg CSIR 2004). In 2005 this was extended to 10 stations (CSIR, 2005). This series of measurements identified high levels of contamination at the head (south eastern side) of the dock Basin which was further investigated in 2006 through 11 sampling stations distributed mainly in this area. Figure 7 shows the distribution of the 2005 and 2006 sampling stations that were located within the proposed dredge area. The trace metal concentrations measured in 2005 and 2006 are listed in Table 6. London Convention 'special care' concentration ranges and 'prohibition' thresholds (DEA&T 1998) are listed to show sites and trace metals non-compliant with these, and the BCLME (2004) sediment quality guideline values are listed to show the probability of in situ adverse biological effects. Table 7 lists hydrocarbon concentrations measured in the Ben Schoeman Dock Basin surficial sediments in 2005 (no measurements were made in 2006). Table 7 includes screening level thresholds to show whether the measured levels constitute any appreciable risks of generating adverse environmental impacts. Table 6 shows that individual and combined LC Annex 2 trace metal concentrations were in the special care range at all sampling locations except that of BS5 in 2005. Further, cadmium (Cd) and mercury (Hg), LC Annex 1 contaminants, exceeded the special care (action level) threshold at three and seven of the 18 sites sampled respectively. Most of the exceedances were close to the lower end of the defined ranges except for combined Annex 2 trace metals at sampling location BS1B which was slightly above the prohibition threshold. This sampling point is actually located ~11m outside of the specified dredge area (Figure 7) and is thus technically also outside of this evaluation. However, it is possible that sediments at this site could be disturbed during the proposed dredging which merits its inclusion in this assessment. All of the sampling locations had trace metal concentrations that exceeded TEL thresholds while at two of them mercury exceeded the PEL threshold. This indicates that modifications to the soft sediment benthic community in the harbour Basin was possible at most sample sites and probable at BS5 and BS1M. However, other extrinsic factors such as water exchange and food availability would probably also play roles in structuring the benthic community as would the in situ effects of anoxia etc. There are essentially two possible sources that could explain the observed trace metal concentrations in Port of Cape Town surficial sediments:
o Erosion of (terrestrial) clay minerals and deposition in the harbour, ie a lithogenic source, and
o Anthropogenic sources.

31
Sample Sample Al As Cd Cr Cu Hg Fe Mn Ni Pb Zn ΣAnnex II Metals
Date ID 2005 BS1 11918 8.2 2.2 60 79 0.7 26948 164 23 74 179 426 2005 BS2 21318 3.3 1.2 33 58 0.5 15092 120 14 33 85 228 2005 BS3 22317 5.6 1.2 37 41 0.7 15599 103 14 46 97 242 2005 BS4 28950 3.0 1.4 38 28 0.6 22847 177 23 27 92 213 2005 BS5 14124 0.5 0.6 23 2 0.9 10380 72 9 4 23 63 2005 BS6 33947 9.0 2.3 69 69 0.6 25413 155 27 83 150 410 2005 BS7 39354 9.0 2.0 66 73 0.7 25389 150 23 77 176 427 2006 BS1 B 28252 10.1 1.4 74 94 <0.5 29689 172 26 87 264 557 2006 BS1 D 22036 8.7 1.1 50 63 <0.5 23296 137 18 62 144 347 2006 BS1 E 23352 9.3 1.2 53 66 <0.5 24736 149 20 63 141 354 2006 BS1 G 21397 8.3 1.1 48 62 <0.5 22289 134 18 57 137 331 2006 BS1 H 16975 6.6 0.9 36 41 <0.5 17225 111 14 43 92 234 2006 BS1 I 24143 5.6 1.3 45 28 <0.5 24792 173 23 28 91 221 2006 BS1 J 16875 4.3 0.9 28 23 <0.5 16938 126 15 25 68 164 2006 BS1 K 16897 6.6 0.9 35 40 <0.5 17409 114 16 46 105 250 2006 BS1 L 16747 6.7 1.0 34 44 <0.5 16868 114 14 43 90 232 2006 BS1 M 24048 10.0 1.0 51 70 1.2 24885 147 20 65 145 363 2006 BS1 N 22510 10.0 1.2 48 64 <0.5 23325 138 19 61 130 332
LC SPECIAL CARE Range - 30-150 1.5-10.0 50-500 50-500 0.5-5.0 - - 50-500 100-500 150-750 50-500 LC PROHIBITION THRESHOLD - >150 >10 >500 >500 >5.0 - - >500 >500 >750 >500 LC Annex - 2 1 2 2 1 - - 2 2 2 2 TEL - 7.24 0.68 52.3 18.7 0.13 - - 15.9 30.2 124 - PEL - 41.6 4.21 160 108 0.7 - - 42.8 112 271 -
Table 6: Ben Schoeman Dock dredge area surficial sediment trace metal concentrations measured by the CSIR in 2005 and 2006 and comparisons against the London Convention special care and prohibition level concentrations and the threshold (TEL) and probable (PEL) concentrations2 (BCLME 2004). Blue indicates exceedance of the special care range lower threshold and red indicates exceedance of the prohibition limit. The sample position for BS1B is denoted by the green nav marker in Figure 7. 2 The terminology of TEL and PEL is taken from MacDonald et al. 1996. TEL and PEL are calculated from effect and no effect data: TEL represents a threshold value below which in situ adverse biological effects are considered unlikely; PEL represents a threshold above which in situ adverse biological effects are probable.

32
Table 7: Hydrocarbon distributions in Ben Schoeman Dock Basin surficial sediments in 2005 (modified from CSIR 2005). Screening and maximum level thresholds are from DEA&T (1998) and BCLME (2004). The sample locations are shown on Figure 7, the LF samples were taken from outside of the harbour and indicate local background concentrations.
Sample Hydrocarbon (µg/kg)
Screening Level
Maximum Level BS1 BS2 BS3 BS4 BS5 BS6 BS7 LF1 LF2 LF3
Napthalene 34.6 391 <5 <5 17.57 <5 <5 <5 25.2 <5 <5 8.94 Acenaphthylene 44 640 <5 <5 <5 <5 <5 <5 <5 <5 <5 <5 Acenaphthene 6.71 88.9 <5 <5 <5 <5 <5 <5 <5 5.94 <5 17.7 Fluorene 21.2 144 <5 <5 <5 <5 <5 <5 <5 6.19 <5 12.7 Phenanthrene 86.7 544 33.5 7.65 26.2 <5 <5 41.0 53.3 47.9 8.33 54.11 Anthracene 46.9 245 10.6 <5 20.9 <5 <5 6.89 <5 8.31 <5 7.71 Fluoranthene 600 5 100 61.1 19.6 48.4 10.0 <5 76.9 <5 67.7 15.9 62.8 Pyrene 153 1 398 69.0 25.6 55.3 <5 <5 86.6 88.3 59.6 <5 44.6 Benz[a]anth-racene
74.8 693 19.9 <5 42.2 <5 <5 37.3 <5 18.2 <5 <5
Chrysene 108 846 <5 9.92 <5 <5 <5 <5 <5 <5 <5 <5 Benzo[a]pyrene 89 763 37.1 7.11 <5 6.05 5.41 <5 131 <5 <5 27.1 Dibenz[a,h]anth-racene
6.22 135 <5 <5 <5 <5 <5 <5 <5 <5 <5 <5
Total PAH 4 000 45 000 295 81 336 16 5 354 339 230 30 236 TPH 1 000 000 1 500 000 19 631 20 642 40 154 14 301 13 377 30 932 46 308 17 108 12 909 13 056 TOC % - - 3.1 1.1 1.4 0.5 0.9 2.3 3.4 1.7 0.4 0.4 PAH:TOC 4 000 45 000 94 75 244 30 6 153 99 138 71 670 TPH:TOC Ratios 1 000 000 1 500 000 6 262 19 025 29 358 26 582 14 636 13 390 13 497 10 214 30 809 37 091
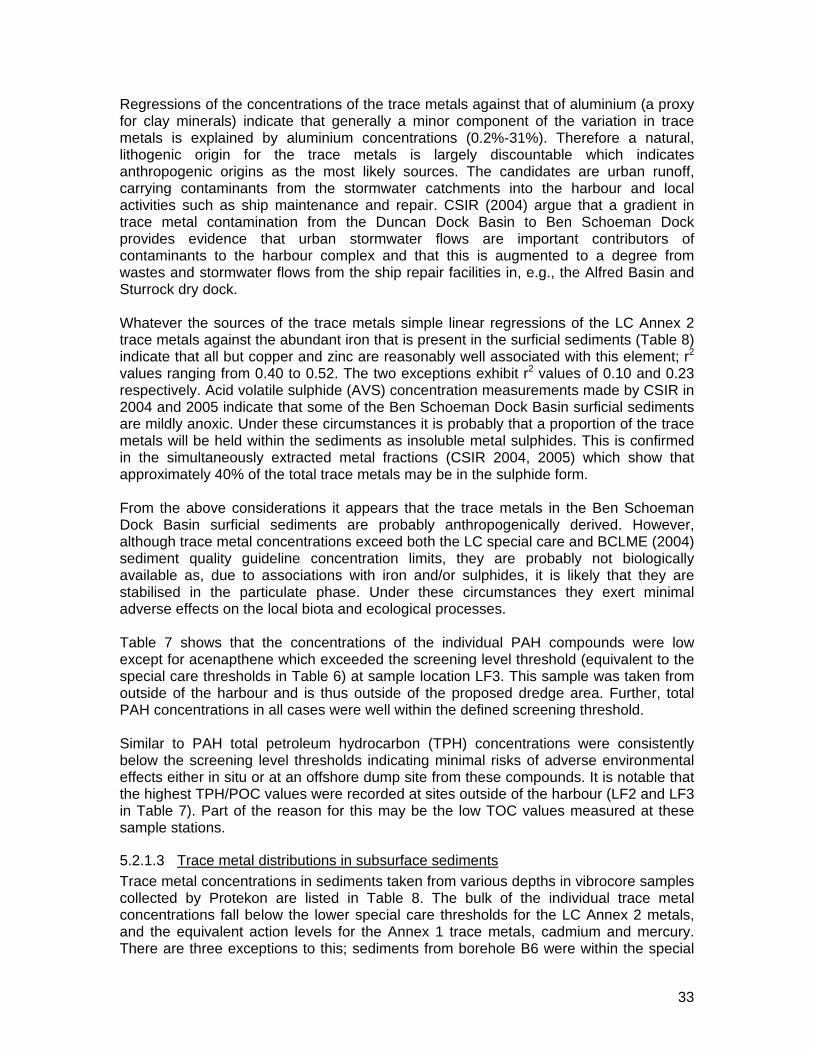
33
Regressions of the concentrations of the trace metals against that of aluminium (a proxy for clay minerals) indicate that generally a minor component of the variation in trace metals is explained by aluminium concentrations (0.2%-31%). Therefore a natural, lithogenic origin for the trace metals is largely discountable which indicates anthropogenic origins as the most likely sources. The candidates are urban runoff, carrying contaminants from the stormwater catchments into the harbour and local activities such as ship maintenance and repair. CSIR (2004) argue that a gradient in trace metal contamination from the Duncan Dock Basin to Ben Schoeman Dock provides evidence that urban stormwater flows are important contributors of contaminants to the harbour complex and that this is augmented to a degree from wastes and stormwater flows from the ship repair facilities in, e.g., the Alfred Basin and Sturrock dry dock. Whatever the sources of the trace metals simple linear regressions of the LC Annex 2 trace metals against the abundant iron that is present in the surficial sediments (Table 8) indicate that all but copper and zinc are reasonably well associated with this element; r2 values ranging from 0.40 to 0.52. The two exceptions exhibit r2 values of 0.10 and 0.23 respectively. Acid volatile sulphide (AVS) concentration measurements made by CSIR in 2004 and 2005 indicate that some of the Ben Schoeman Dock Basin surficial sediments are mildly anoxic. Under these circumstances it is probably that a proportion of the trace metals will be held within the sediments as insoluble metal sulphides. This is confirmed in the simultaneously extracted metal fractions (CSIR 2004, 2005) which show that approximately 40% of the total trace metals may be in the sulphide form. From the above considerations it appears that the trace metals in the Ben Schoeman Dock Basin surficial sediments are probably anthropogenically derived. However, although trace metal concentrations exceed both the LC special care and BCLME (2004) sediment quality guideline concentration limits, they are probably not biologically available as, due to associations with iron and/or sulphides, it is likely that they are stabilised in the particulate phase. Under these circumstances they exert minimal adverse effects on the local biota and ecological processes. Table 7 shows that the concentrations of the individual PAH compounds were low except for acenapthene which exceeded the screening level threshold (equivalent to the special care thresholds in Table 6) at sample location LF3. This sample was taken from outside of the harbour and is thus outside of the proposed dredge area. Further, total PAH concentrations in all cases were well within the defined screening threshold. Similar to PAH total petroleum hydrocarbon (TPH) concentrations were consistently below the screening level thresholds indicating minimal risks of adverse environmental effects either in situ or at an offshore dump site from these compounds. It is notable that the highest TPH/POC values were recorded at sites outside of the harbour (LF2 and LF3 in Table 7). Part of the reason for this may be the low TOC values measured at these sample stations.
5.2.1.3 Trace metal distributions in subsurface sediments Trace metal concentrations in sediments taken from various depths in vibrocore samples collected by Protekon are listed in Table 8. The bulk of the individual trace metal concentrations fall below the lower special care thresholds for the LC Annex 2 metals, and the equivalent action levels for the Annex 1 trace metals, cadmium and mercury. There are three exceptions to this; sediments from borehole B6 were within the special

34
care concentration ranges for cadmium, chromium, nickel and zinc, borehole B28 for zinc and borehole Q4 for nickel. All of these boreholes were located at the head of the Ben Schoeman Dock Basin (Protekon 2006). Two of the sampled sediments were at the top of the cores, essentially confirming the distributions reported for the surficial sediments above. The relatively high nickel concentration in the Q4 borehole is an exception to this as the sample was drawn from 1.0 – 1.7m beneath the sediment surface. Nickel concentrations in sediments lying above this (0.0 – 1.0m) were lower and below the lower threshold of the special care range. Despite the apparent anomaly in borehole Q4 and although there are limited data it is apparent that the trace metal concentrations in the deeper sediments are lower than those of the surficial sediments. This is consistent with a modern anthropogenic source for the observed contamination in that layer.
5.2.2 Water column characteristics in the port
5.2.2.1 Turbidity/suspended sediment concentrations Two sources of information on turbidity and suspended sediment concentration levels were located; the secchi disc estimates in CMS (1995a) and a series of measurements on suspended sediment concentrations made by the CSIR in 2005/2006 (CSIR, unpublished data). The CMS (1995a) secchi disc measurements, conducted in winter, 1994, indicated generally highly turbid waters in the Cape Town harbour with secchi disc depths (SDD) ranging between 1.5 and 2.5m. These are approximately equivalent to total suspended sediment concentrations of 50mg/l (CSIR 1998). CMS (1995) notes that this is comparable to measurements in areas strongly influenced by anthropogenic nutrient flows and consequent eutrophication. Water colour during these measurements varied from dark brown to light green suggesting that both inorganic and organic (e.g. phytoplankton) substances caused the low visibility. The CSIR data comprise surface and bottom measurements of suspended sediment concentrations made routinely at four locations in the harbour at approximately four monthly intervals. The measurements are summarised in Figure 8. Suspended sediment concentrations within the harbour are high compared to the admittedly sparse measurements made in west coast waters (harbour mean = 30mg/l, west coast mean range = 1-14mg/l; CSIR 1992, 1995). Further, there are no apparent gradients in the CSIR data either between the sites (ANOVA, p=0.569) or between sample depths (paired sample t test, p=0.431). It therefore appears that the particulate material is more or less uniformly distributed throughout the harbour system.

35
Table 8: London Convention (LC) Annex 1 and Annex 2 trace metal concentrations in sediments drawn from vibrocore borehole cores taken from the Ben Schoeman Dock Basin. Blue indicates exceedance of special care range lower threshold.
Al As Cd Cr Cu Hg Ni Pb Zn Sample
Id Sample
Depth in m in
mg/kg in
mg/kg in
mg/kg in
mg/kg in
mg/kg in
mg/kg in
mg/kg in
mg/kg in
mg/kg
B1 0.4 - 0.55 21087 7.4 0.8 36.2 28.4 <0.5 16.9 34.2 83.4 B6 0.00 – 5.35 56094 22.0 2.3 59.9 67.8 <0.5 66.0 71.3 158.0 B7 0.70 - 1.15 11176 4.8 0.5 22.2 16.5 <0.5 9.3 22.5 50.9 B7 2.7 - 3.15 9527 3.4 <0.5 15.1 5.8 <0.5 6.9 10.9 25.6 B8 0.50 - 0.72 18154 1.4 0.6 24.5 10.6 <0.5 18.7 12.6 91.7 B8 0.72 - 1.4 17780 1.9 0.5 24.0 14.0 <0.5 17.1 11.6 95.3 B9 0.3 - 0.67 31694 2.5 1.1 32.5 23.9 <0.5 27.5 22.3 87.1
B25 0.85 - 1.5 26694 5.1 0.9 24.3 17.3 <0.5 25.8 16.1 50.4 B28 0.0 - 0.6 18151 8.5 0.9 34.5 37.5 <0.5 16.0 48.1 185.0 B29 0.0 - 0.4 14714 7.1 0.7 31.7 42.2 <0.5 13.3 48.4 120.0 B30 0.5 - 0.95 35099 3.8 1.3 40.5 37.0 <0.5 44.9 40.7 96.7 B31 0.9 - 1.35 7159 4.0 <0.5 14.3 12.2 <0.5 5.6 15.0 35.4 B31 1.9 - 2.35 17775 5.7 0.7 30.0 4.9 <0.5 13.3 13.4 35.2 B31 2.9 - 3.35 18088 6.5 0.7 28.7 4.4 <0.5 13.5 14.1 29.7 B32 0.0 - 0.90 25599 10.8 1.0 42.6 39.2 <0.5 22.3 49.1 121.0 B32 1.2 - 2.3 40510 13.7 1.5 39.0 17.7 <0.5 39.7 18.8 81.7 Q4 0.0 – 1.0 27469 1.3 0.9 35.4 7.3 <0.5 20.6 12.7 59.5 Q4 1.0 – 1.7 30394 14.3 1.1 7.3 45.8 <0.5 89.4 14.0 33.5 Q7 0.0 - 1.9 31911 5.5 1.1 38.6 19.8 <0.5 29.0 16.3 69.0
Q9 0.0 - 6.5 22704 6.4 0.7 28.6 6.7 <0.5 23.1 13.5 59.6
LC Special Care Range N/A 30-150 1.5-10.0 50-500 50-500 0.5-5.0 50-500 100-500 150-750
LC Prohibition Level N/A >150 >10.0 >500 >500 >5.0 >500 >500 >750
TEL 7.24 0.68 52.3 18.7 0.13 15.9 30.2 124
PEL 41.6 4.21 160 108 0.7 42.8 112 271

36
Boxplot for TSS
60
20
YCTYCBVASVABDDT
40
DDBBST
0
80
BSB
Sample
SS
mg/
l
Figure 8: Suspended sediment (SS) concentrations measured in the Port of Cape Town at ~4 monthly intervals from September 2005 to September 2006. The measurement sites were Ben Schoeman Dock (BS), Duncan Dock (DD), the synchro-lift area of the Victoria/Alfred Basin (VA) and the entrance to the Royal cape Yacht Club (YC), Samples were taken from the surface (T) and bottom (B) of the water column. The data were provided by CSIR, Stellenbosch.
5.2.2.2 Nutrients and eutrophication Inorganic nutrient concentrations within the Port of Cape Town are mediated by water volume exchanges with the greater Table Bay area and stormwater supplies (CMS 1995b). Median concentration values (Table 9) are largely similar to those expected for Table Bay (e.g. Chapman and Shannon 1985) but, as pointed out by CMS (1995b) mask point sources of nitrate- and ammonium-nitrogen within the harbour. The former includes stormwater flows into Duncan Dock, the repository of all city bowl stormwater, and the latter this source, and various operations in the Alfred Basin including the synchro-lift, fish factories and previous oil storage sites (CMS 1995b). Table 9: Median concentrations (µM/l) of inorganic nutrients in Cape Town harbour in July and August 1994 (from CMS 1995b)
Entrance Alfred Basin Victoria Basin Duncan Dock Ben Schoeman
Dock July
NH4+NH3 7.00 10.78 7.45 7.20 6.58 PO4 1.80 1.86 1.99 1.60 1.78 NO3 19.19 17.56 19.33 16.87 18.33
August NH4+NH3 1.52 6.64 4.58 4.06 3.65 PO4 0.93 1.20 1.30 1.08 1.30 NO3 8.79 13.11 12.00 11.74 12.28
Table 9 shows that higher ammonium-nitrogen concentrations occur in the Alfred Basin but that phosphate-phosphorus and nitrate-nitrogen are more equally spread throughout

37
the harbour water body. This mirrors the suspended sediment concentration distributions. CMS (1995b) point out that the measured nitrogen concentrations (ammonium plus nitrates) in the Port of Cape Town water body do not depart much from those measured in Cape West coast nearshore waters and eutrophication of the overall water body cannot be considered to have occurred yet. This is borne out by dissolved oxygen levels that appear to be mostly near saturation levels with only isolated instances of super saturation or hypoxia (CMS 1995b). The flow of water from Duncan Dock into the Alfred Basin may assist in keeping the system oxic by preventing or lessening the development of stagnant water bodies.
5.2.2.3 Dissolved trace metal concentrations CSIR (unpublished data) measured dissolved trace metal concentrations in surface water samples taken from locations in the harbour at approximately 3 month intervals in 2005 and 2006. Trace metals such as cadmium, cobalt and lead were consistently below the detection limit. The measurements of those trace metals that were consistently above detection limits are summarised in Table 10. Table 10: Mean dissolved trace metal concentrations (µg/l) in surface water samples taken from the entrance to Ben Schoeman Dock (BSE), the Ben Schoeman lay up Basin (BSL), the entrance to Duncan Dock (DDE), the Duncan Dock intake (DDI), the Victoria and Alfred Basin synchro-lift (VAS) and the Royal Cape Yacht Club (RYC) at four occasions at approximately 3 monthly intervals in 2005 and 2006.
Site Statistic BSE BSL DDE DDI VAS RYC
Trace metal (µg/l) n 10 5 11 5 11 5
Mean 4.08 1.10 4.67 1.16 17.09 0.73 Chromium Std Dev 3.49 0.50 3.77 0.42 158.2 0.23 Mean 1.24 1.72 1.97 1.38 5.51 1.02 Copper Std Dev 1.02 1.28 1.44 2.17 2.94 0.22 Mean 1.10 - 2.12 0.71 7.59 - Nickel Std Dev 0.84 - 1.67 0.17 18.14 - Mean 7.87 7.07 6.75 5.26 18.23 7.80 Zinc Std Dev 5.01 5.34 3.92 3.80 14.99 7.71
Statistical comparisons between the sites (one way ANOVA and Tukey's multiple comparison test; Sokal and Rohlf 1995) show that copper and zinc were elevated (p<0,05) at the Victoria & Alfred synchro-lift site but chromium and nickel were statistically similar (p>0.05) throughout the harbour. Mean concentrations for these trace metals were higher in the Victoria & Alfred site but were also highly variable (standard deviation>mean). The high trace metal concentrations are probably attributable to ship repair activities at the synchro-lift. This is a semi-enclosed area and probably weakly flushed leading to low dilution of dissolved material washing out of the repair facility. Given the configuration of the Port of Cape Town it is arguable whether trace metals released from this area have any influence on the wider areas of the harbour. If the Victoria & Alfred site values are excluded the mean dissolved trace metal concentrations in the harbour are: chromium 2.98 (+/- 3.19)µg/l, copper (1.52 (+/- 1.12)µg/l, nickel 1.33 (+/- 1.13)µg/l and zinc 7.05 (+/- 4.83)µg/l; n = 36 in all cases. Cadmium, cobalt and lead are below detection limits, there are apparently no recent data available for arsenic or mercury.

38
The mean values calculated above are all well within the RSA water quality guideline concentrations for the maintenance of marine ecosystems (DWAF 1995). This is despite the fact that the harbour receives contaminants from a range of sources such as stormwater, ship cargo handling and shipping itself.
5.2.2.4 Biological indicators of pollution Biological indicators of pollution in the harbour area comprise the harbour wall biofouling and sediment benthos community surveys of CMS (1995a), mussel watch measurements of trace metal concentrations at sites in the outer harbour (CSIR unpublished data) and harbour water toxicity tests (CMS 1995b). The CMS (1995a) benthos surveys have been discussed above and showed that the harbour wall biofouling community declined into the harbour and was depauperate at the head of the Victoria and Alfred Basins. CMS (1995a) note that this was consistent with gross indicators of hydrocarbon pollution. However, it is also consistent with reducing water exchange rates and so the observed biological distributions cannot be unequivocally linked to pollution with the data at hand. Similar to the biofouling community soft sediment benthos was generally depauperate and completely absent from sediments in the inner harbour areas. CMS (1995a) recorded that sediments in these areas were black and anoxic and that there was also a degree of hydrocarbon contamination. This is stronger circumstantial evidence of pollution effects on the harbour biological communities. Mean trace metal body burdens in mussels (Mytilus galloprovincialis) from sites on the seaward side of the eastern breakwater and the outer extremities of Duncan and Victoria Docks are listed in Table 11. There are no clear gradients evident in the data; cadmium is elevated on the outer harbour breakwater compared to the two sites in the harbour and copper is elevated on the Duncan Dock. Further, the mean values for all of the trace metals measured are approximately similar to those measured at Llandudno, on the Atlantic coast south of Cape Town, over the period 1985-1995 (Brown and Warrington, 1995). As this site is remote from any industrial activity it can be considered to be unpolluted. The observed concentrations are also well within the published limits for human consumption (Staatskoerant 1994). From this it is concluded that the mussel trace metal body burdens presented here do not signal significant pollution by trace metals. Table 11: Mean trace metal body burdens (µg/g dry weight) in mussels collected from three locations in the Port of Cape Town over the period October 2000 to April 2006. The collection sites were the seawall of the eastern breakwater (BSC) and the outer ends of Duncan Dock (DD) and Victoria Dock (VD). The data were supplied by CSIR, Stellenbosch.
Site BSC DD VD
Trace metal
Mean Std Dev Mean Std Dev Mean Std Dev Cadmium 3.11 0.66 2.28 0.36 1.70 0.54 Chromium 1.11 0.33 1.12 0.66 0.90 0.27 Copper 5.38 1.35 7.09 1.43 5.84 0.55 Mercury 0.13 0.12 0.28 0.14 0.17 0.07 Lead 3.04 0.78 3.03 1.23 2.99 1.59 Zinc 302.8 93.3 347.7 125.3 257.3 38.8

39
CMS (1995b) employed bioassays to determine the toxicity of harbour water collected from seven locations including sites in Victoria Basin, Duncan Dock and the entrance to the Victoria Basin. These tests showed that water quality was highly variable, having appreciable toxicity at some points but being 'biologically acceptable' at others, even when these sites were close by. The toxicity arose from a number of pollution sources including hydrocarbons leaking out of quay walls (ruptured or leaking fuel supply pipes), fish factory effluents and sewage contamination. CMS (1995b) concluded that neither the harbour water body as a whole or the wider Table Bay system was at serious risk from pollution within the harbour. The authors noted, however, that this conclusion needed to be checked by repeat surveys at regular intervals. Aside from the CSIR sediment quality surveys discussed above this does not appear to have been done.
5.2.3 The proposed dredge spoil dump sites in Table Bay The 'official' dumping site for the Port of Cape Town is located 150 nautical miles offshore in 3 500m water depth (CSIR 1991) and is designated 'Dumping Ground (Ammunition)' (SAN Chart Za55). Although defined as an official site for harbour dredge spoil by CSIR (1991) the only reference given in support of this is a 'pers comm' by a (then) DEA&T official; i.e. no formal documentary evidence was produced. For the purposes of this assessment this specific site is deemed to be unsuitable for the following reasons:
o Sailing distances are too long to make it an economically viable option for the proposed dredging programme
o There is no available information on seafloor characteristics in the region of the designated dump site that would allow any reliable prediction of the ecological consequences of dumping dredge spoil there. Obtaining such information through field surveys would be prohibitively expensive and logistically complex as it would require sophisticated sampling gear and a large ship to deploy this. Therefore, despite its designation, given the present state of knowledge on the area and the low probability of radically improving this dumping dredge spoil at the site would be counter to the precautionary principle
o The behaviour of sinking dredge spoil through the depth range at the designated site is unknown therefore ecological effects in the water column or on the sea floor can only be guessed at, and
o The (19)96 Protocol of the London Convention requires that dump sites be monitored post-dumping to determine the behaviour of dredge spoil. For the reasons advanced above this would not be easily achieved and may lead to RSA being in contravention of its obligations under the protocol.
Therefore alternative sites were considered to be necessary and part of the research in this assessment was identifying candidate areas and then conducting surveys to qualify their suitability for receiving harbour dredge spoil. The broad criteria that were applied in identifying the candidate sites included:
o The sites should be within 'economical' sailing distance of the dredge area o The sea floor at the candidate sites should be sand or fine sand to allow
incorporation of the predominantly sand/silty sand dredge spoil into local ecological processes
o The sites should be sufficiently distant from environmentally sensitive areas, such as the Tafelsig-Blouberg shoreline, the Diep River estuary, Robben Island and the coastline of the Table Mountain marine protected area, to limit the

40
possibility of the dredge spoil discharge and/or the dredge spoil discharge activities exerting deleterious environmental affects at these sites, and
o Water depths in the candidate sites should be sufficient to allow a large degree of containment of discharged dredge spoil within the site boundaries, and
o There should be minimal constraint to environmental monitoring. Matching the above criteria against seafloor types that could be inferred from detailed 1m interval bathymetric maps (Woodborne 1983) led to the selection of the two candidate sites (Block #1 and #2) shown in Figure 9. Side scan sonar and single beam bathymetric surveys were conducted on these sites on 31 August 2006. The results are reported in MGU (2006). The analogue side scan record from these surveys was used to select suitable grab sampling sites to determine sediment properties and benthic macrofaunal community structure. Sample sites were selected according to gross sediment types, i.e. visible on the side scan record and, in the shallower site at least, the absence of rock. The geographic positions of the sample sites are shown on Figure 9 and Figure 10 shows the approximate site locations on the side scan record. Data from this survey was to be used to identify the respective suitability of the candidate sites for harbour dredge spoil disposal and to provide a pre-impact quantitative baseline against which future changes associated with dredge spoil disposal could be compared. Figure 9: Candidate dredge spoil dump sites in 60-70m (Block #1) and ~40m (Block #2) depths off Mouille Point and the sediment properties and benthos sampling sites (denoted by green and red circles respectively).
#1
#2
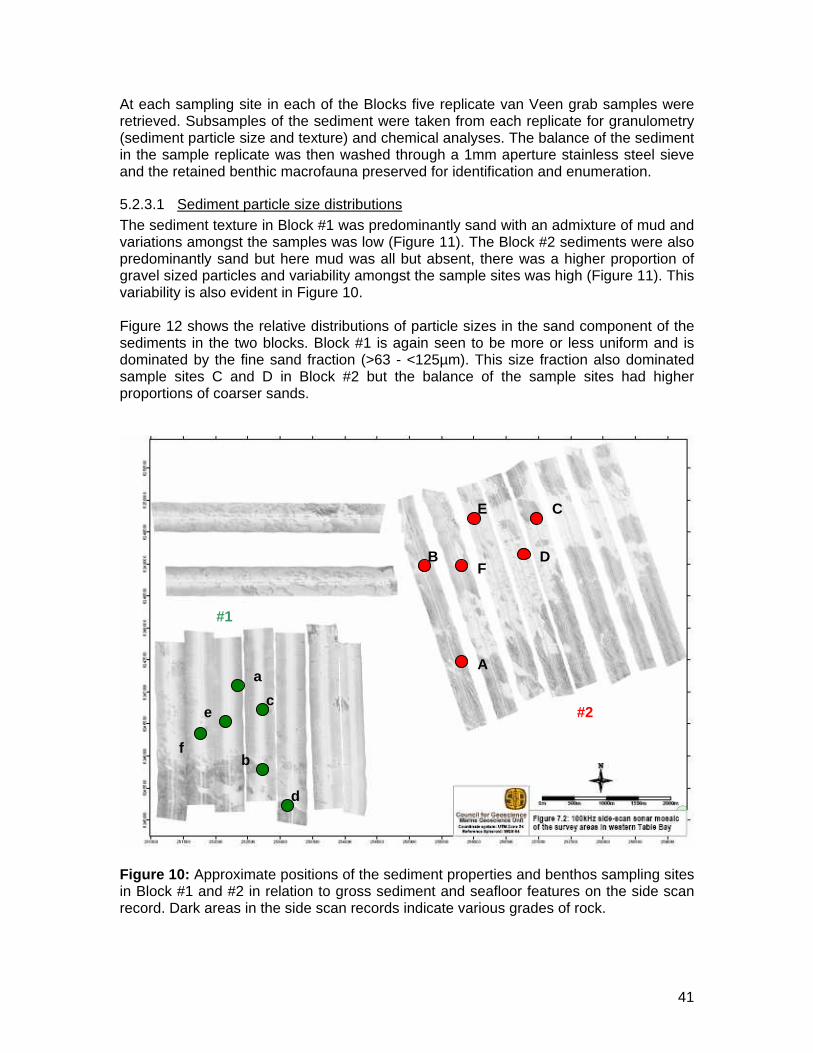
41
At each sampling site in each of the Blocks five replicate van Veen grab samples were retrieved. Subsamples of the sediment were taken from each replicate for granulometry (sediment particle size and texture) and chemical analyses. The balance of the sediment in the sample replicate was then washed through a 1mm aperture stainless steel sieve and the retained benthic macrofauna preserved for identification and enumeration.
5.2.3.1 Sediment particle size distributions The sediment texture in Block #1 was predominantly sand with an admixture of mud and variations amongst the samples was low (Figure 11). The Block #2 sediments were also predominantly sand but here mud was all but absent, there was a higher proportion of gravel sized particles and variability amongst the sample sites was high (Figure 11). This variability is also evident in Figure 10. Figure 12 shows the relative distributions of particle sizes in the sand component of the sediments in the two blocks. Block #1 is again seen to be more or less uniform and is dominated by the fine sand fraction (>63 - <125µm). This size fraction also dominated sample sites C and D in Block #2 but the balance of the sample sites had higher proportions of coarser sands.
Figure 10: Approximate positions of the sediment properties and benthos sampling sites in Block #1 and #2 in relation to gross sediment and seafloor features on the side scan record. Dark areas in the side scan records indicate various grades of rock.
#1
#2
A
B
C
D
E
F
a
b
c
d
e
f

42
The gravel sized component of the sediments sampled at the Block #2 sample sites B and F predominantly comprised coarse shell fragments. The sediment texture and granulometry indicate that Block #1 is a more or less uniform sedimentary environment whereas Block #2 is heterogeneous. Further, Block #2 also has rock outcrops, evident from Figure 10 and failed grab samples at sample site A, that adds variability to the location.
Block 1
0
25
50
75
100
A B C D E F
Sample Site
%
Gravel Sand Mud
Block 2
0
25
50
75
100
A B C D E F
Sample Site
%
Gravel Sand Mud
Figure 11: Sediment texture distributions at the two candidate dredge spoil dump sites3.
5.2.3.2 Sediment contaminant distributions London Convention Annex 1 and Annex 2 trace metal concentrations measured in Block 1 and 2 are listed in Table 12a and b along with the respective London Convention special care ranges and prohibition thresholds and BCLME (2004) sediment quality guidelines. All of the measured trace metal concentrations were low and well within the listed thresholds. This is an unsurprising result given the location of the respective blocks in outer Table Bay which is remote from anthropogenic sources of contaminants. Comparisons of Tables 12a and b indicates that Block #1 samples had higher trace metal concentrations than those of Block #2 (single factor ANOVA comparing total Annex 2 trace metals between blocks, p <0.001). Linear regression between the total
3 No sediments were retrieved from sample site A in Block #2 as the seafloor at this site was rock.

43
Annex 2 trace metals and aluminium concentrations indicate a strong relationship (r2 = 0.85) and the observed difference is attributed to the presence of clay minerals in the relatively larger mud fraction on Block #1 versus Block #2. The trace metals measured in the two blocks therefore appear to be lithogenic in origin and are probably representative of uncontaminated background concentrations in the geological setting of Table Bay.
Block 1
0
25
50
75
100
A B C D E F
Sample Site
%
2000-1000 1000-500 500-250 250-125 125-63
Block 2
0
25
50
75
100
A B C D E F
Sample Site
%
2000-1000 1000-500 500-250 250-125 125-63
Figure 12: Particle size distributions in the sand fraction of the sediments sampled in Blocks #1 and #2. Equivalent sediment textures are 1000-2000µm = very coarse sand, 500-1000µm = coarse sand, 250-500µm = medium sand, 125-250µm = fine sand and 63-125µm = very fine sand.

44
Table 12a: London Convention Annex 1 and 2 trace metal concentrations (mg/kg) in samples drawn from Block #1
Sample Al As Cd Cr Cu Hg Ni Pb Zn Total Ann 2
Trace Metals
1A-1 1632.9 1.8 <0.5 9.0 3.0 <0.5 2.1 <5.0 7.1 23.0 1A-2 1032.6 <1.0 <0.5 5.7 3.4 <0.5 4.5 <5.0 5.5 19.1 1A-3 2057.8 1.7 <0.5 10.3 5.5 <0.5 3.0 <5.0 9.6 30.2 1A-4 1883.2 1.4 <0.5 9.2 4.9 <0.5 2.4 <5.0 8.9 26.7 1A-5 2070.6 1.7 <0.5 9.5 5.4 <0.5 2.8 <5.0 10.1 29.5 1B-1 2477.6 2.3 <0.5 10.3 5.4 <0.5 3.1 <5.0 10.2 31.3 1B-2 1729.0 1.6 <0.5 8.1 3.9 <0.5 1.9 <5.0 6.0 21.4 1B-3 2196.8 2.3 <0.5 9.5 5.0 <0.5 2.4 <5.0 8.5 27.7 1B-4 2306.2 1.2 <0.5 9.5 4.9 <0.5 2.6 <5.0 8.5 26.6 1B-5 2265.9 1.9 <0.5 10.9 5.1 <0.5 2.9 <5.0 9.2 30.1 1C-1 2162.7 1.9 <0.5 10.2 5.4 <0.5 3.0 <5.0 9.5 30.0 1C-2 2257.8 2.0 <0.5 10.2 5.4 <0.5 3.0 <5.0 9.5 30.2 1C-3 2585.1 1.9 <0.5 11.5 5.6 <0.5 3.5 <5.0 9.5 32.1 1C-4 2364.5 1.9 <0.5 10.9 5.7 <0.5 3.3 <5.0 11.1 33.0 1C-5 2141.5 2.0 <0.5 10.4 5.3 <0.5 3.1 <5.0 9.0 29.7 1D-1 2326.5 2.2 <0.5 10.9 5.3 <0.5 2.9 <5.0 8.3 29.7 1D-2 1576.2 1.4 <0.5 9.0 4.2 <0.5 1.9 <5.0 7.0 23.5 1D-3 3168.4 2.4 <0.5 14.4 6.6 <0.5 4.7 5.2 13.0 46.2 1D-4 1358.7 1.2 <0.5 8.5 3.8 <0.5 1.7 <5.0 5.5 20.8 1D-5 1504.8 1.3 <0.5 9.9 4.4 <0.5 2.0 <5.0 6.6 24.1 1E-1 3056.4 2.4 <0.5 14.1 6.4 <0.5 4.5 <5.0 12.6 40.0 1E-2 2754.9 2.0 <0.5 12.6 5.6 <0.5 3.6 <5.0 10.1 33.9 1E-3 2532.4 2.4 <0.5 12.5 5.8 <0.5 3.6 <5.0 10.6 34.9 1E-4 2806.3 2.5 <0.5 13.2 5.9 <0.5 3.8 <5.0 12.0 37.4 1E-5 2413.9 2.1 <0.5 12.5 5.4 <0.5 4.4 <5.0 9.3 33.7 1F-1 2577.7 2.2 <0.5 12.9 5.7 <0.5 3.6 <5.0 9.8 34.1 1F-2 3002.5 2.7 <0.5 13.8 6.2 <0.5 4.4 <5.0 13.1 40.2 1F-3 2734.0 2.7 <0.5 13.5 6.0 <0.5 3.8 <5.0 10.8 36.8
1F-4 2295.5 2.2 <0.5 12.2 5.4 <0.5 3.4 <5.0 9.5 32.7
Means 2251 2.0 <0.5 10.9 5.2 <0.5 3.2 <5.0 9.3 30.6
SD 515 0.4 - 2.0 0.8 - 0.8 - 2.0 6.2 LC Special care range
30-150
1.5-10.0
30-500
50-500
0.5-5.0
50-500
100-500
150-750 50-500
LC Prohibition threshold >150 >10.0 >500 >500 >5.0 >500 >500 >750 >500
LC Annex 2 1 2 2 1 2 2 2 -
TEL 7.24 0.68 52.3 18.7 0.13 15.9 30.2 124 -
PEL 41.6 4.21 160 108 0.7 42.8 112 271 -

45
Table 12b: London Convention Annex 1 and 2 trace metal concentrations (mg/kg) in samples drawn from Block #2
Sample Al As Cd Cr Cu Hg Ni Pb Zn Total Ann 2
Trace Metals
2B-1 1792.0 1.4 <0.5 6.2 3.9 <0.5 1.6 <5.0 5.7 18.7 2B-2 2496.4 1.3 <0.5 6.0 4.2 <0.5 2.0 7.7 7.9 29.2 2B-3 1379.1 <1.0 <0.5 4.0 2.2 <0.5 1.3 <5.0 4.8 12.2 2B-4 3140.0 2.3 <0.5 11.5 10.1 <0.5 3.9 5.2 12.6 45.6 2B-5 2622.9 1.7 <0.5 10.0 5.2 <0.5 2.8 <5.0 9.0 28.8 2C-1 1942.1 2.4 <0.5 9.3 3.6 <0.5 2.1 <5.0 8.4 25.7 2C-2 1947.9 2.4 <0.5 9.4 3.2 <0.5 1.8 <5.0 5.5 22.3 2C-3 1957.5 2.0 <0.5 8.5 3.0 <0.5 1.4 <5.0 5.6 20.4 2C-4 1837.1 2.1 <0.5 8.8 3.5 <0.5 1.7 <5.0 5.0 21.1 2C-5 1933.7 2.4 <0.5 8.3 3.6 <0.5 2.2 6.7 6.0 29.2 2D-1 2200.0 1.9 <0.5 9.8 3.4 <0.5 1.9 <5.0 5.5 22.5 2D-2 1281.0 1.9 <0.5 6.2 1.9 <0.5 1.1 <5.0 4.6 15.7 2D-3 1372.2 2.5 <0.5 6.5 1.9 <0.5 1.1 <5.0 6.4 18.3 2D-4 1290.4 1.9 <0.5 6.8 1.7 <0.5 <1.0 <5.0 5.8 16.1 2D-5 1271.2 2.0 <0.5 6.4 1.6 <0.5 <1.0 <5.0 5.5 15.5 2E-1 1074.2 <1.0 <0.5 4.3 <1.0 <0.5 <1.0 <5.0 3.4 7.7 2E-2 1261.7 1.6 <0.5 6.4 1.1 <0.5 <1.0 <5.0 4.2 13.4 2E-3 1021.1 <1.0 <0.5 4.8 <1.0 <0.5 <1.0 <5.0 3.1 7.8 2E-4 1031.3 <1.0 <0.5 4.3 <1.0 <0.5 <1.0 <5.0 2.3 6.6 2E-5 1268.1 <1.0 <0.5 4.0 <1.0 <0.5 <1.0 <5.0 3.6 7.6 2F-1 1426.5 <1.0 <0.5 3.0 <1.0 <0.5 <1.0 <5.0 4.7 7.7 2F-3 1005.2 <1.0 <0.5 2.5 <1.0 <0.5 <1.0 6.2 2.6 11.3 2F-4 2111.3 1.3 <0.5 3.6 <1.0 <0.5 1.1 5.8 4.5 16.3
2F-5 1811.3 1.1 <0.5 3.9 <1.0 <0.5 1.0 7.0 5.3 18.3
Means 1686 1.9 <0.5 6.4 3.4 <0.5 1.8 6.4 5.5 18.3
SD 561 0.4 - 2.5 2.1 - 0.8 0.8 2.2 9.1 LC Special care range
30-150
1.5-10.0
30-500
50-500
0.5-5.0
50-500
100-500
150-750 50-500
LC Prohibition threshold >150 >10.0 >500 >500 >5.0 >500 >500 >750 >500
LC Annex 2 1 2 2 1 2 2 2 -
TEL 7.24 0.68 52.3 18.7 0.13 15.9 30.2 124 -
PEL 41.6 4.21 160 108 0.7 42.8 112 271 -
5.2.3.3 Benthos distributions The benthos sample processing, counting and weighing procedures and sample data manipulation procedures are set out in Lwandle Technologies (2006) along with the sample raw data for the taxonomic counts and biomass estimates. This report therefore encapsulates the quantitative benthic macrofauna baseline data for the two blocks surveyed in this assessment. The focus in the discussion below is on broad distributions within the two candidate dredge spoil dump sites (i.e. Blocks #1 and #2 in Figures 10 and 11), their current pollution status as indicated by taxon/abundance relationships, and their relationships with other areas in Table Bay.

46
Benthos distributions in Block #1 – The broad abundance and biomass distributions of the dominant phyla recorded in the Block #1 sample sites are illustrated in Figure 13.
Figure 13: Macrobenthos phylum level % abundance and biomass distributions in Block #1 Macrobenthos faunal abundance in Block #1 was dominated by annelids, most of which were polychaete worms. Crustaceans and molluscs were well represented and were approximately numerically equal to fauna in the 'other' category which included peanut worms (Sipunculida) etc. Despite being relatively minor contributors in terms of abundance molluscs and fauna in the 'other' category dominated the biomass with the generally relatively small polychaetes in the Annelida comprising the bulk of the balance of the overall biomass. The biomass distributions indicate that the crustacea were also mainly small forms. Abundance distributions based on taxonomic analyses to species level within Block #1 (Figure 14) indicate that there was a high similarity across the sample replicates which is borne out by the MDS plot. Here all but a replicate from sample site 1B are gathered together on the left hand side of the plot. The moderate stress coefficient indicates that the MDS is a reliable indicator of the sample groupings (Clarke and Warwick 1994). The similarity analyses indicate that there are no systematic spatial gradients in benthic macrofauna community structure in the Block #1. However, this does not necessarily show that there are no, or minimal, large scale pollution effects operating in the area. Plots of the distributions of species abundance in x2 geometric classes (Gray and Pearson 1982) have been shown to be useful in identifying effects of pollution in
Block #1: Abundance
Crustacea Mollusca Annelida Other
Block 1: Biomass
Crustacea Mollusca Annelida Other
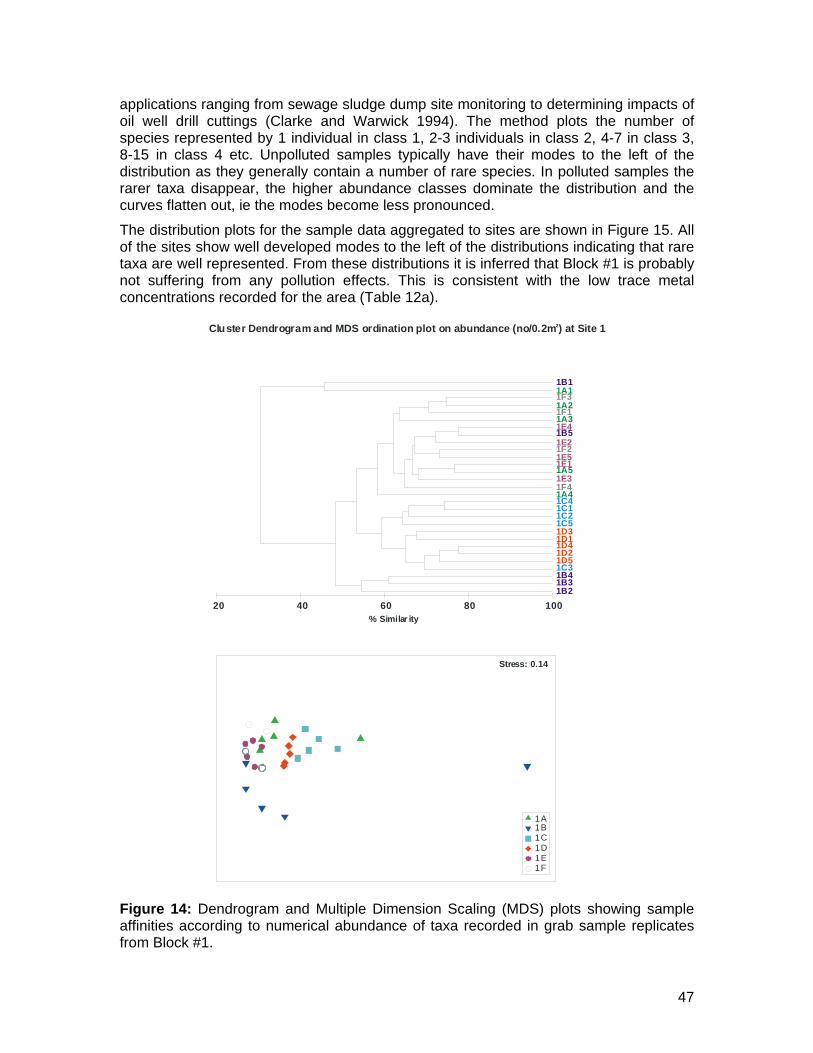
47
applications ranging from sewage sludge dump site monitoring to determining impacts of oil well drill cuttings (Clarke and Warwick 1994). The method plots the number of species represented by 1 individual in class 1, 2-3 individuals in class 2, 4-7 in class 3, 8-15 in class 4 etc. Unpolluted samples typically have their modes to the left of the distribution as they generally contain a number of rare species. In polluted samples the rarer taxa disappear, the higher abundance classes dominate the distribution and the curves flatten out, ie the modes become less pronounced.
The distribution plots for the sample data aggregated to sites are shown in Figure 15. All of the sites show well developed modes to the left of the distributions indicating that rare taxa are well represented. From these distributions it is inferred that Block #1 is probably not suffering from any pollution effects. This is consistent with the low trace metal concentrations recorded for the area (Table 12a).
1B21B31B41C31D51D21D41D11D31C51C21C11C41A41F41E31A51E11E51F21E21B51E41A31F11A21F31A11B1
10080604020% Similar ity
1A1B1C1D1E1F
Stress: 0.14
Cluster Dendrogram and MDS on abundance (no/0.2m ) a t Site 12ordination plot
Figure 14: Dendrogram and Multiple Dimension Scaling (MDS) plots showing sample affinities according to numerical abundance of taxa recorded in grab sample replicates from Block #1.

48
0 2 4 6 80
10
20
30
40
0 2 4 6 80
10
20
30
40
0 2 4 6 80
10
20
30
40
0 2 4 6 80
10
20
30
40
0 2 4 6 80
10
20
30
40
0 2 4 6 80
10
20
30
40
Geometric Class
% S
peci
es
% S
pecie
s%
Spe
cie
s
Geome tric Class
Site 1A Site 1B
Site 1C
Site 1E
Site 1D
Site 1F
Figure 15: Distributions of abundance of species in x2 geometric classes for each of the sites sampled in Block #1. Benthos distributions in Block #2 – Figure 16 depicts the phylum level abundance and biomass distributions for Block #2. It is evident that Annelida (polychaete worms) were far more dominant at this site than Block #1 in terms of both abundance and biomass. However, it is also apparent that molluscs and taxa in the 'other' category make comparatively large contributions to the benthic macrofauna community biomass relative to their respective abundances.

49
Figure 16: Macrobenthos phylum level % abundance and biomass distributions in Block #2 The species abundance distributions, based on taxonomic analyses to species level, within Block #2 are shown in Figure 17. In contrast to the situation in Block #1 here the samples are largely dissimilar although there is a comparatively large group (sample replicates 2C1, 2C3, 2C4, 2D4, 2D2, 2D3, 2C5, 2D5) and a smaller group (sample replicates 2B1, 2B4, 2B5) showing affinities at the 60% similarity level. This is also evident in the MDS plot; the low stress coefficient indicates that the plot is a good representation of the sample relationships (Clarke and Warwick 1995). The high apparent dissimilarity amongst the sample replicates as evidenced by the high number of outliers in the dendrogram and widely separated samples on the MDS plot is consistent with the variable sediment texture and granulometry recorded on Block #2 (above). It is notable that the sample replicates that do cluster together are those from the predominantly fine sand areas (sample sites D and C, Figure 12). The other group showing sample affinity is that containing replicates from site B. These specific replicates were also from fine sand areas. The more widely distributed sample replicates in terms of sample taxon abundances are those from coarse sand and gravel (actually large shell fragments) sites.
Block #2: Abundance
Crustacea Mollusca Annelida Other
Block 2: Biomass
Crustacea Mollusca Annelida Other

50
Cluster Dendrogram and MDS on abundance (no/0.2m ) a t Site 22ordination plot
2B2C2D2E2F
Stress: 0.07
2C22D12B52B12B42C12C32C42D42D22D32C52D52E22E32F22B32E12F32B22F42F12F5
1 00806040200
% Similarity
Figure 17: Dendrogram and Multiple Dimension Scaling (MDS) plots showing sample affinities according to numerical abundance of taxa recorded in grab sample replicates from Block #2. Although there are apparent marked gradients in the variations in abundance between the sample replicates in Block #2 there does not appear to be any evidence of pollution effects as shown by the plots of the X2 geometric class abundances in Figure 18. It is thus concluded that the observed distributions are a response to varying sediment properties as opposed to anthropogenic effects. The absence of the latter is borne out by the overall low trace metal contents of the Block #2 sediments (above).

51
Geo metric Class
% S
pec
ies
0 2 4 6 8 10 12
0
10
20
30
40
Site 2B Site 2C
Site 2D Site 2E
Site 2F
% S
pec
ies
% S
peci
es
Geometric Class
0 2 4 6 8 10 12
0
10
20
30
40
0 2 4 6 8 10 120
10
20
30
40
0 2 4 6 8 10 120
10
20
30
40
0 2 4 6 8 10 120
10
20
30
40
Figure 18: Distributions of abundance of species in x2 geometric classes for each of the sites Sampled in Block #2 Comparisons between Blocks #1 and #2 – Mean values of the univariate indices of number of species (taxa), number of organisms (abundance), biomass and the derived indices of richness, evenness and diversity for Blocks #1 and #2 are listed in Table 13 along with probability values from ANOVA tests for differences based on the sample site values. The number of taxa and abundances were not statistically different (p>0.05) between the blocks but the balance of the univariate indices were (p<0.05). Biomass, richness, evenness, and diversity were higher in Block #1 than Block #2. The higher biomass in Block #1 is counter to the mean abundance estimates implying the presence of relatively larger organisms. The relatively lower derived indices in Block #2 indicate that the distribution of abundance amongst the taxa was more skewed there than in Block #1. This is consistent with a wider range of sedimentary habitats in Block #2 and that they may be more unstable than in those in the deeper site. Evidence for the latter is

52
the well developed ripples in the coarser sediments that were evident on the side scan sonar record. Table 13: Mean univariate indices for the benthic macrofauna communities in Block #1 and Block #2.
Univariate Index
Block #1 Block #2 ANOVA p value
Number of taxa 40.2 34.6 0.289 Abundance 108 190 0.155 Biomass 7.3 2.0 0.002 Margalef's Richness 4.4 2.9 <0.001 Pielou's Evenness 0.84 0.67 0.005 Shannon Diversity 2.51 1.70 <0.001 n 28 22 -
Comparisons between Blocks #1 and #2 and an inner Table Bay site - In general comparisons between surveys on benthos community distributions are bedeviled by methodological differences at sampling or sample processing as well as time intervals between surveys. By chance the team that conducted the benthos surveys discussed above conducted a similar survey around the Chevron/Caltex marine outfall in May/June 2006. This outfall discharges into ~10m depth at a site with fine-medium sands and low mud contents (CSIR 2006b). This survey used similar analytical approaches to those described above and did not detect pollution effects. This allows a comparison between the sites which is depicted on the MDS plot in Figure 19. Figure 19 confirms the high variability between the Block #2 sample sites. The separation between the three areas surveyed appears to reflect depth distributions as, even though the Block #2 samples are widely separated, those from predominantly fine sand substrates are still clearly apart from the Block #1 and Chevron/Caltex samples but located intermediately between the shallowest and deepest samples. The taxa contributing more than 5% of the abundance within each of the three main clusters of samples on the MDS are listed in Table 14. The distributions for Blocks #1 and #2 mirror that shown by the univariate indices (Table 13) in that the Block #1 cluster is strongly dominated by the polychaete Jasmineira elegans with lesser contributions from the polychaetes Magelona capensis and Prionospio saldanha whilst the Block #1 cluster has a fairly equal spread of contributions of the polychaetes Mediomastus capensis, Lumbrineris meteroana and Prionospio pinnata and sub-dominant Actinophilum molle (cnidarian octocorrallia), Nassarius vinctus (molluscan gastropod) and Urothoe grimaldi (crustacean amphipod). The inner Table Bay cluster of samples is extremely strongly dominated by P. saldanha with U grimaldi, Centrathura caeca (crustacean isopod) and Nepthys hombergi (crustacean amphipod) sub-dominant. Thus although some of the species are common across the groups the dominant species differ to a large degree. From this it is concluded that each of the sampled sites contains distinct communities of macrobenthos taxa with a relatively low level of similarity between them.

53
1A
1A1A1A1A
1B
1B
1B
1B
1B
1C
1C
1C1C1C
1D1D1D 1D1D1E1E1E1E1E
1F1F1F1F
2B
2B
2B
2B2B
2C
2C
2C2C2C
2D
2D2D2D
2D
2E
2E2E
2E
2F
2F2F2F
111 11
222223 33 3
344
4
44
Stress: 0.11
site1A1B1C1D1E1F2B2C2D2E2F1234
Stress: 0.11
Abundance Site 1 vs Site 2 vs Calte x Site
Figure 19: MDS plot comparing macrobenthos abundance in samples from Table Bay in 2006. The upper panel shows the distributions of the sample replicates. In the lower panel Block #1 is represented by green symbols, Block #2 blue symbols and a 10m deep sand site in inner Table Bay by red symbols. Table 14: Taxa contributing 5% or more of the overall abundance in the benthic macrofauna communities in the three main clusters of samples evident in Figure 19
Block #1 Block #2 Inner Table Bay Species % Species % Species %
Mediomastus capensis 15.9 Jasmineira elegans 47.0 Prionospio saldanha 67.4 Lumbrineris metoroana 13.0 Magelona capensis 5.8 Urothoe grimaldi 8.6 Prionospio pinnata 12.4 Prionospio saldanha 6.2 Centrathura caeca 7.3 Actinotilum molle 7.0 Nepthys hombergi 7.1 Nassarius vinctus 5.2 Uruthoe grimaldi 5.1

54
6 IMPACT IDENTIFICATION AND ASSESSMENT
6.1 Impact evaluation criteria In the marine environment a disturbance can be relatively short-lived (e.g. accidental spill of toxic material which is diluted in the water column below threshold limits within days) but the effect of such a disturbance may have a much longer lifetime (e.g. the toxin affects the gills of fish and thus reduces their survival chances). The assessments and rating procedures below address the effects and consequences rather than the cause or initial disturbance alone. In this report, the word impact thus describes the disturbance and the effect(s) this disturbance may have on the environment. Van Ballegooyen et al. (2006) used a simulation modelling approach to predict the behaviour and distributions of suspended sediments, associated contaminants and discharged sediments associated with the proposed dredging of the Ben Schoeman Dock basin. The approach used in this assessment has been to select the apparent worst case scenarios and to evaluate the associated ecological impacts. The approach is thus essentially conservative. In this assessment the protocol specified by SRK Consulting which is described below has been followed.
The significance of the predicted potential impacts is described as:
Insignificant: The potential impact is negligible and will not have an influence on the decision regarding the proposed activity;
Very Low: The potential impact is very small and should not have any meaningful influence on the decision regarding the proposed activity;
Low: The potential impact may not have any meaningful influence on the decision regarding the proposed activity;
Medium: Where the impact could have an influence on the environment that should influence the decision regarding the proposed activity;
High: Where the impact is such that it will affect a decision regarding the proposed activity: or
Very High: Where the impact could have a 'no-go' implication (for example, if the predicted impact exceeded legislated limits) and would require modification of the project design or alternative mitigation to reduce the impacts to acceptable levels, if at all possible.
The assessment of impact significance is based on:
Nature of impact: This reviews the type of effect that a proposed activity may exert on the environment including the assessment of 'what would be affected and how'.
Extent: This indicates whether the impact is local and limited to the immediate area (<1km) of development, regional – limited to the greater Table Bay area, or is exerted at national or international scales.
Duration: This indicates the lifetime of the impact and is defined as being short term (0 – 2 yrs), medium term (2 – 15 yrs), or long term (>15 yrs).

55
Intensity: This predicts whether the impact is destructive or innocuous and is described as low (where environmental functions and/or processes are negligibly altered), medium (where the environment continues to function but in a modified manner), or high (where environmental functions and/or processes are severely altered).
Probability: Here the likelihood of the impact occurring is assessed as improbable (<40% chance of occurring), possible (40% - 70% chance of occurring), probable (70% - 90% chance of occurring), or definite (>90% chance that the impact will occur).
The status of the identified impacts and the degree of confidence in the predictions are also given as follows:
Status of impact: Classification of the impact as positive (a benefit), negative (a cost), or neutral.
Confidence: The degree of confidence that can be invested in the predictions based on the available information and specialist knowledge.
When impacts are identified as negative with a significance rating of medium or higher, or precaution should be applied, mitigation objectives are set (i.e. ways of reducing negative impacts), and attainable mitigation actions recommended. In the case where mitigation is not feasible or necessary, this will be stated as such. Monitoring procedures and review programmes to assess the effectiveness of mitigation are recommended.
6.2 Assessment of potential environmental Impacts In this assessment the risk factors and associated effects listed in section 4 are matched against the environmental attributes and features described in section 5. This allows identification of potential impacts and their evaluation according to the criteria set out in section 6.1. The potential impacts are partitioned by location where the effects (stressors) originate, i.e. the dredge area within Ben Schoeman Dock, the candidate dredge spoil disposal sites, and adjacent environments. The impacts are further divided by activity; i.e. dredging and blasting in the dredge area and spoil dumping at the disposal sites.
6.2.1 Harbour dredge area: dredging
6.2.1.1 Removal of biological communities in the dredge target areas During the proposed dredging approximately 1.2 million cubic metres of sediment will be dredged from the port. These sediments will have marine biota associated with them which will be removed along with the dredge spoil. There is a marked gradient within the port in biofouling organisms on harbour structures, biomass declining rapidly with distance from the harbour entrance. There are no reported surveys on spatial distributions of benthos in the sediments but spot sampling in Duncan Dock, Victoria Basin and Alfred Dock showed a complete absence of fauna (CMS 1995a). This was attributed to anoxic sediments and hydrocarbon pollution. Such a severe situation is not expected for Ben Schoeman Dock Basin sediments, as indicated by AVS and hydrocarbon concentrations, but it is likely that the soft sediment benthos is impoverished.

56
Accordingly the potential environmental impact is assessed as: Nature of impact –Sediments and their associated organisms will be physically removed from the seabed along the path of the dredge head during dredging Extent – Local, the affected area will be ~ 0.8 km2, and totally contained within the harbour. Duration – Unknown, recolonization can be rapid (1-3 years, Ellis 1996, Newell et al. 1998) but other stress agents unconnected with the proposed dredging can affect this Intensity – Medium, the majority of the benthic organisms is likely to die or be removed from the dredge areas but overall numbers should be low Probability – Definite Status of impact – Negative Degree of confidence – High Significance – Very Low, due to the local extent of the impact, the fact that it will occur in an 'artificial' habitat, that the area is probably already impoverished, and that there is no demonstrable ecological dependency of Table Bay on the port. Mitigation – Not considered to be necessary (or feasible) Impact Assessment Table Extent Intensity Duration Consequence Probability Significance Status Confidence
No Mitigation
Local 1
Medium 2
Short-term
1
Very Low 4
Definite VERY LOW -ve High
Mitigation n/a n/a n/a n/a n/a n/a n/a n/a
6.2.1.2 Effects of turbid plumes generated by dredging on organisms inhabiting harbour sediments and structures
Dredging activities characteristically generate turbid plumes of suspended sediment. High suspended solid concentrations can exert deleterious effects on organisms through light attenuation (phytoplankton and algae), interference with filter feeding (zooplankton, mussels, oysters, barnacles), damage to gills and respiratory processes (mussels, oysters, abalone, fish), reduction of visibility reducing foraging success (cormorants, penguins, predatory fish) but also assisting predator avoidance in fish (Clark 1997a), etc. EMBECOM (2004) reviewed the available scientific literature on the effects of varying suspended sediment concentrations on a range of biota and showed that total suspended sediment concentrations <100mg/l represented limited risks for biota. The limited total suspended sediment concentrations that have been made in Cape Town harbour indicate that ambient levels are relatively high (average 30mg/l, above). It is inferred that both the biofouling community on the harbour walls and benthos in the sediment have accommodated this.
The worst case in terms of exceedance of the 20mg/l suspended sediment threshold from the simulation modelling of turbidity plumes generated by the proposed dredging (Van Ballegooyen et al., 2006) is illustrated in Figure 20. This is expected to be caused by the cutter suction dredger at mid-depth. The figure shows that that the turbidity plumes should be contained within the Ben Schoeman Dock and that the 20mg/l threshold may be exceeded for 5-10 days of the period modelled (90 days). Given that ambient average suspended sediment concentrations are 30mg/l the biota within the Ben Schoeman Dock may be exposed to suspended concentrations of ~50mg/l for 5-10 days during the dredging period. This is half the critical level identified by EMBECOM (2004). Benthos in the harbour sediments should be impoverished in the majority of the

57
area to be dredged (inferred from CMS 1995a). The biofouling community should show a similar pattern.
Figure 20: Predicted worst case exceedance (days) of 20mg/l suspended sediment concentration at mid-depth in the Port of Cape Town during cutter suction dredger operations. (Winter, Cutter Suction Dredger; copied from Figure B.7.3a, Van Ballegooyen et al., 2006)
In view of the predicted turbidity plume distributions and biological features the potential environmental impacts of elevated suspended sediment concentrations for the harbour area are assessed as:
Nature of impact – Generation of suspended sediment plumes in the dredge area over the dredging period and potential sublethal or lethal impacts on biological organisms and/or communities inhabiting harbour sediments and structures Extent – Local, water quality modelling predicts that the thresholds defined by EMBECOM (2004) will not be exceeded at any point outside of the immediate dredge area. Duration – Short-term, potential effects should be limited to the duration of the dredging activity Intensity – Low, adverse effects are experienced generally at suspended sediment concentrations higher (>100mg/l) than those predicted for the dredging or for longer exposure periods (>3 days) than are expected to be generated. Probability – Possible, elevated suspended sediment concentrations are a typical by-product of dredging activities and could impact the filter feeding component (mainly barnacles) of the fauna Status of impact – Negative Degree of confidence – High Significance – Very Low, due to the small extent, short duration and low intensity of the impact Mitigation – Not considered as necessary due to the very low significance.

58
Impact Assessment Table Extent Intensity Duration Consequence Probability Significance Status Confidence
No Mitigation
Local 1
Low 1
Short-term
1
Very Low 3
Possible VERY LOW -ve High
Mitigation n/a n/a n/a n/a n/a n/a n/a n/a
6.2.1.3 Settlement of material suspended during dredging and alteration of sediment characteristics and effects on sediment biota and ecological processes
The harbour is by design a quiet water area and it is likely that the majority of the fines in dredge hopper overwash and those suspended by dredge head turbulence will resettle in the harbour. This may lead to inundation of sediment biota adjacent to the dredge areas possibly altering community structure and/or disrupting ecological processes. As stated above the harbour sediment community is relatively impoverished and may be kept that way by pollution and physical disturbance (e.g. sediment suspension) by shipping.
Hall (1994) has shown that benthic macrofauna can survive short term inundation and Maurer et al. (1980 1981, 1982) demonstrated that a bivalve mollusc (Mercenaria mercenaria) and gastropod (Nucula proxima) could migrate vertically up to 16cm when inundated with sand; the crustacean amphipod Parahaustorius longimerus and xanthid crab Neopanope sayi could migrate through 7 – 30cm and polychaetes Scoloplos fragilis and Nereis succinea could manage up to 30cm. Therefore given the generally slow sedimentation rates of fine particles (<5mm/sec, Hill et al. 1994), the probable non-unique biological community that is present and the ability of benthic macrofauna to survive relatively rapid sedimentation events, the maximum inundation depths predicted by simulation modelling for anywhere in the harbour of 5-10cm (Figure B.2.8, Van Ballegooyen et al., 2006), significant disruption of the benthos in the harbour area is not expected. Accordingly the impact assessment is:
Nature of impact – sedimentation of the resuspended sediment may smother benthos in the harbour sediments Extent – Local, the effect should be contained within the harbour Duration – Short-term, recovery can take from <1 year up to 3 years Intensity – Low, given that the inundation depths will be small it is apparent that the few organisms that may be affected should be capable of burrowing to the surface through the deposited sediment and many filter-feeders have been shown to be highly adaptable to increased sediment loads. Probability – Definite Status of impact – Negative Degree of confidence – High Significance – Very low, due to the small extent of the impact, apparent burrowing abilities of sediment fauna and the fact that the harbour is an artificial environment anyway Mitigation – Not considered to be necessary due to the very low significance Impact Assessment Table Extent Intensity Duration Consequence Probability Significance Status Confidence
No Mitigation
Local 1
Low 1
Short-term
1
Very Low 3
Definite VERY LOW -ve High
Mitigation n/a n/a n/a n/a n/a n/a n/a n/a

59
6.2.1.4 Remobilisation and/or redistribution of contaminants in dredged sediments disrupting ecological processes and/or compromising biological communities
The resuspension of sediments during dredging can result in trace metals and organic compounds associated with the dredged sediment becoming biologically available to organisms in the harbour and adjacent environment. Toxic effects on organisms and food chains may be exerted over the short term (acute toxicity), or through accumulation. The available data on organic pollutants (hydrocarbons) in the sediments listed in Table 10 indicate that the generation of toxic effects by this class of pollutant is unlikely. Table 9 shows that toxicity effects of trace metal (inorganic pollutants) is possible. The toxicity of trace metals to organisms is complex and depends on the partitioning of metals between dissolved and particulate phases and the speciation of the dissolved phase into bound (inorganic or organic complexes) or free forms. The most bio-available forms that are potentially toxic to aquatic life are free metals, as well as some weak inorganic complexes. However, trace metals weakly bound to particles may also exert toxicity effects for example through ingestion and then absorption of trace metals into body tissue (Griscom and Fisher 2004). Therefore contaminated sediments represent a 'cocktail' that may exert deleterious effects on biota through various pathways of trace metal bio-availability. Remobilization of trace metals, from primarily the metal sulphide form, should be rapidly (minutes to hours) scavenged by the other major and abundant absorption substrates, iron and manganese (Muller and Duffek 2001), in the target dredge sediments. This was examined more closely for Ben Schoeman Dock sediments through elutriation tests. The test process consisted of vigorously mixing surficial sediments with seawater of known trace metal content in a 1/1 mixture and then measuring dissolved trace metal concentrations in water samples withdrawn at various time intervals. The results are summarised in Table 13. Table 13: Proportional increases in mean dissolved trace metal concentrations due to mobilisation from sediments targeted for dredging (CSIR unpublished data).
Variable Cr Cu Ni Pb Zn Mean Initial (µg/l) 1.0 7.3 1.9 0.5 20.1 Mean Final (µg/l) 2.2 7.5 11.7 0.7 53.5 Mean Increase (µg/l) 1.2 0.2 9.7 0.2 33.4 Sediment (mg/l) 64.23 86.24 26.29 81.41 184.17 % Mobilised <<0.1 <<0.1 <0.1 <<0.1 <0.1
It is apparent that the only trace metals that exhibited any appreciable increase in the dissolved phase were nickel and zinc and that on average <0.1% of these trace metals that were present in the test sediment were remobilised. Van Ballegooyen et al. (2006) used a conservative 0.5% remobilisation factor for the compilation of the exceedance plot in Figure 21a. It is apparent that even at this inflated level any exceedance of the RSA water quality guidelines by remobilised trace metals should be restricted to the immediate dredge area. If the Port of Cape Town is classified as justifiably moderately polluted due to its function and the fact that it receives storm water flows from the city bowl, the more relaxed ANZECC (2000) water quality criteria for such systems listed in Table 14 can be applied. The increased toxicity risks of this

60
are summarised in the table and it is evident that these are small and may only be exerted on mussel larvae. The exceedances of the ANZECC (2000) water quality guideline for copper in moderately polluted systems are minimal and below the toxicity test exposure period (Table 14). Further, they are predicted to only occur quite deeply within the Ben Schoeman Dock (Figure 21b). Table 14: Water quality guideline concentrations for moderately disturbed (polluted) water bodies derived by ANZECC (2000), RSA guidelines (DWAF 1995) and implications for increased toxicity effects based on data in DWAF (1995)
Target value (µg/l) Trace metal ANZECC RSA
Toxicity effect implications
Cadmium (Cd)
36 4 Cd exerts minimum mortality effects (LC5 over 28 day exposures) on crustacean amphipods and causes depressed respiration in mussels at 25µg/l but has no effects below 50µg/l in sea urchins, 100µg/l in other crustacea and no mortality effects in mussels below 1620µg/l.
Chromium (Cr)
85 8 The minimum effect (LC5) concentration for Cr is >250µg/l for crustacean amphipods and >4 500µg/l in mussels. No effects on algae or phytoplankton are reported in DWAF (1995)
Copper (Cu)
8 5 Cu at 8µg/l has no reported toxic effects on algae or phytoplankton but may exert minimum mortality effects (LC5) on bivalve larvae in 8-10 day exposures. The level is below the reported LC50 concentration of 16.4µg/l for bivalve larvae and 60µg/l for abalone.
Lead (Pb)
12 12 No implications as guideline concentrations are similar
Nickel (Ni)
560 25 Ni at 560µg/l has no reported effects on algae or phytoplankton but at 310-1200µg/l may cause mortality in bivalve larvae (LC50).
Zinc (Zn)
43 25 Zn at 43µg/l has no reported effects on algae or phytoplankton and is less than the minimum mortality effect concentration (LC5) of 50µg/l for bivalve larvae and crustacea and the level of 100µg/l for sea urchins.
It is therefore concluded that any toxicity effects of increased dissolved trace metals due to the proposed dredging should be spatially restricted to the immediate dredge area.

61
Figure 21a: Predicted number of days during which copper concentrations (a sensitive proxy for all trace metals) in the surface layer do not comply with RSA water quality guidelines for the maintenance of ecosystems. (Winter, Cutter Suction Dredger; copied from Figure B.7.12, Van Ballegooyen et al., 2006) Particulate trace metal concentrations above the threshold effect level (TEL) may exert toxic effects on the biota of the harbour in the water column, on the hard structures or in the sediments. Tables 9 and 11 show that a large proportion of the sediments exceed the TEL level for more than one of the trace metals. Consequently over and above the possible effects of inundation the dredging may redistribute sediments that may be toxic at the TEL level and above. Direct toxicity effects of contaminated sediments on bivalve embryos have been measured by Geffard et al. (2002). The sediments tested covered a wide range from heavily contaminated (24.6mg/kg PAH, 136.8mg/kg copper, 568mg/kg zinc) to lower contamination levels at 2mg/kg PAH, 7.6mg/kg copper and 73mg/kg zinc. Note that the defined toxicity effect was chronic deformations in 20% of oyster embryos after 24 hour exposures (=24hr EC20); this can be considered to be a low toxicity effect level. For sediments comparable to those in the Ben Schoeman Dock Basin Geffard et al.'s (2002) data indicate that such toxicity effects may be generated at 2000mg/l suspended sediment. This is a high concentration and is not predicted to occur anywhere outside of the immediate dredge area (Figure 20).

62
Figure 21b: Predicted number of days during which copper concentrations (a sensitive proxy for all trace metals) in the surface layer do not comply with the ANZECC (2000) guideline concentration for moderately polluted water. (Winter, Cutter Suction Dredger; copied from Figure B.7.14, Van Ballegooyen et al., 2006) Further to the above, most of the particulates, with the absorbed trace metals, will sediment out in the immediate dredge area, as predicted by the water quality modelling, and predictable by the characteristic low bed shear stress of harbour areas. Therefore any impacts that may be generated by redistributed sediment contaminants would be limited to communities already affected physically by dredging and, if not, through previous exposure to the contaminated sediment. Therefore the probability of further deleterious effects on biota appears to be remote. The potential environmental impact of remobilised and/or redistributed trace metals in the harbour area is assessed as: Nature of impact – Remobilisation of contaminants in the dredge area over the dredging period may have toxic effects on organisms outside of the dredge area in the harbour Extent – Local, transport out of the harbour area should be minimal or, when it does occur plumes are predicted to be diluted to the point that any sedimentation from them should not markedly increase background trace metal concentrations Duration – Short-term exposure and short term effects given lifespans of the organisms that may be affected. Intensity – Low, biological communities in any of the possible impact areas are likely to have already been damaged from the physical process of dredging Probability – Improbable, biogeochemical considerations and simulation modelling of

63
dredging plume distributions indicate that ecological effects are unlikely. Status of impact – Negative Degree of confidence – High Significance – Insignificant, due to low probability and inconsequential effects Mitigation – Not considered to be necessary due to the very low significance Impact Assessment Table Extent Intensity Duration Consequence Probability Significance Status Confidence
No Mitigation
Local 1
Low 1
Short-term
1
Very Low 3
Improbable INSIGNIFICANT -ve High
Mitigation n/a n/a n/a n/a n/a n/a n/a n/a
6.2.1.5 Reductions in dissolved oxygen concentrations due to introduction of organic matter previously held in the sediments and/or anoxic sediments to the water column and effects on biota
The organic content of the sediments targeted for dredging is relatively low and only a portion of them are mildly anoxic as indicated by the AVS measurements (CSIR 2005). Therefore the amount of oxygen demand placed in the water column should be low. Significant depletion of oxygen concentrations in the water column and deleterious effects on organisms or ecological processes will therefore be unlikely. Accordingly the impact of reductions in dissolved oxygen concentrations is assessed as: Nature of impact – Potential depletion of water column oxygen concentration through bacterial decomposition of remobilised organic matter in the dredge area over the dredging period and/or exposure of anoxic sediments during dredging and deleterious effects on organisms/ecological processes Extent – Local, any effect should be limited to the harbour water body Duration – Short-term, potential effects may only extend over the duration of the dredging activity due to re-oxygenation by natural processes such as photosynthesis, and water volume exchange with the adjacent ocean Intensity – Low Probability – Improbable Status of impact - Negative Degree of confidence – High Significance – Insignificant, due to low intensity and short duration Mitigation – Not considered to be necessary due to the low significance Impact Assessment Table
6.2.1.6 Release of nutrients held in the target dredge area sediments to the water column and eutrophication of the harbour water body
Nutrients in marine sediments are generally derived from the remineralisation of organic matter. As the organic content of the sediments targeted for dredging is low (CSIR 2005), the potential for developing high nutrient concentrations in pore waters is
Extent Intensity Duration Consequence Probability Significance Status Confidence No
Mitigation Local
1 Low
1 Short-term
1
Very Low 3
Improbable INSIGNIFICANT -ve High
Mitigation n/a n/a n/a n/a n/a n/a n/a n/a

64
considered to be low. Further, the total volume of pore water relative to the volume of the harbour water body is also low and so, even if pore water nutrient concentrations were high the probability of developing nutrient concentrations sufficient for eutrophication should be negligible. Accordingly the impact of elevations in nutrient concentrations is assessed as: Nature of impact – Introductions of nutrients to the water column due to release of target dredge sediment pore water may cause eutrophication in the harbour water body Extent – Local, any effects should be limited to the harbour Duration – Short-term, only during dredging; water exchanges should constrain the persistence of high nutrient concentrations Intensity – Low Probability – Improbable, low organic matter concentration in the sediments Status of impact - Negative Degree of confidence – High Significance – Insignificant, due to low probability and short duration Mitigation – Not considered to be necessary due to the low significance Impact Assessment Table Extent Intensity Duration Consequence Probability Significance Status Confidence
No Mitigation
Local 1
Low 1
Short-term
1
Very Low 3
Improbable INSIGNIFICANT -ve High
Mitigation n/a n/a n/a n/a n/a n/a n/a n/a
6.2.1.7 Altered seawater quality through turbidity plumes and/or contaminants remobilised by dredging compromising other beneficial uses of the harbour marine environment.
There are essentially three beneficial uses of the harbour system that can be considered to be at potential risk from the proposed dredging activities: o Tourism and retailing in the V&A waterfront area which may be indirectly
compromised by visible turbid plumes emanating from the dredging o Potential toxicity effects within the Two Oceans Aquarium through trace metal
contamination of intake water, and o Compromised functioning of the natural ecology in the adjacent Table Bay (=
Maintenance of ecosystems in DWAF 1995) through export of turbidity or contaminants mobilised by dredging into the bay.
The turbid plume 'visibility' threshold for the simulation modelling has been set at 10mg/l suspended sediment as this has been shown to be the level at which increased turbidity above background levels may generally become visible on the South African West coast (Van Ballegooyen et al., 2006). Figure 22 shows the predicted 'worst case' plot of the exceedance of 10mg/l concentrations of suspended sediment in the harbour area. This figure shows that surface layer suspended sediment plumes should not impinge on the V&A water front at any time during the dredging. Consequently, the V&A 'experience' should not be compromised by the proposed activities.

65
Figure 22: Predicted worst case exceedance (days) of 10mg/l suspended sediment within the surface layer of the harbour. (Cutter Suction Dredger; copied from Figure B.1.2, Van Ballegooyen et al., 2006) None of the predicted distributions of suspended sediments generated by the dredging show that either the Two Oceans Aquarium or the waters in Table Bay immediately outside of the harbour entrance should be compromised by dredging in the Ben Schoeman Dock area in any of the dredging scenarios. Examples are Figures 20 and 21a and b. The latter figure also shows that the RSA (and ANZECC 2000) water quality guidelines for trace metals should not be exceeded for any period longer than 0.25 days outside of the Ben Schoeman Dock dredge area. However, this does not provide any indication of whether short term spikes in trace metal concentrations may occur. Figure 23a and b plot simulated time series of dissolved copper concentrations adjacent to the Two Oceans Aquarium intake and at the harbour entrance. It is clear that the predicted concentrations are well within the RSA water quality guidelines for the maintenance of ecosystems and, therefore, easily satisfy both RSA (DWAF 1995) and ANZECC (2000) guidelines for aquaculture.

66
Figure 23a and b: Predicted worst case time series of copper and zinc concentrations at (A) the harbour entrance and (B) the Two Oceans Aquarium seawater intake during dredging by Cutter Suction in winter. Simulation model layers plotted are (A) surface and bottom depths and (B) surface and mid-depth. (Winter, Cutter Suction Dredger; copied from Figure B.7.16 in Van Ballegooyen et al., 2006)
BB
AA
B

67
The risks of compromising beneficial uses in the harbour area are assessed as: Nature of impact – Dredging induced turbid plumes and/or remobilised contaminants compromises beneficial uses of the harbour water body Extent – Local, any effects should be limited to the harbour Duration – Short-term, only during dredging; water exchanges should constrain the persistence of any elevated concentrations of suspended sediments or trace metals Intensity – Low Probability – Improbable, simulation modelling predicts that critical threshold levels will not be compromised at the beneficial use sites Status of impact - Negative Degree of confidence – High Significance – Insignificant, due to low probability and short duration Mitigation – Not considered to be necessary due to the low significance Impact Assessment Table Extent Intensity Duration Consequence Probability Significance Status Confidence
No Mitigation
Local 1
Low 1
Short-term
1
Very Low 3
Improbable INSIGNIFICANT -ve High
Mitigation n/a n/a n/a n/a n/a n/a n/a n/a Note: The Two Oceans Aquarium has established emergency procedures to cope with unsuitable quality intake water. These include running the aquarium system in recirculation mode and/or obtaining seawater from an alternative location such as Granger Bay and using road tankers to transport the water to the aquarium. Discussions with aquarium staff indicated that the system can be run in recirculation mode for periods of days at most. During this time all feeding would cease and there would be a decrease in water quality but not to an extent as to cause mortalities in aquarium inventory. Renewing seawater by road tanker would allow almost indefinite isolation from the harbour but would, of course, entail sharply higher costs compared to normal operations. Therefore, although not predicted to be necessary in this assessment of risks generated by the proposed dredging operations, the Two Oceans Aquarium does have procedures in place that would protect it from compromised water quality in the region of its seawater intakes.
6.2.1.8 Importation of alien species by dredgers and associated ecological effects Dredgers may transport alien biota in ballast water, in residual sediment in their hoppers or even attached as biofouling organisms on their hulls. The release of alien species into the Port of Cape Town by dredgers carries the risks of allowing the establishment of populations and potential competitive exclusion (food, space, nutrients) of indigenous species. In the worst case such imports may lead to the development of invasive populations with the capacity to severely disrupt and modify communities and ecological processes (IUCN 2000).
Despite a long history of international shipping passing through South African ports there are only 16 confirmed cases of alien species becoming established in the country's coastal waters and/or ports (Awad et al. 2004, Robinson et al. 2005). The best known of these is the Mediterranean mussel Mytilus galloprovincialis, currently the mainstay of the local mussel farming industry, the ascidian Ciona intestinalis, a biofouling organism common in harbours, and the European shore-crab Carcinus maenas. Oher alien species that have or may exert deleterious effects on ecological processes or industries

68
dependent on these include the harmful algal bloom dinoflaggelate species Alexandrium tamarense and Gymnodinium cf. mikimotoi and the brown microalgae Aureococcus anophagefferens (Awad et al. 2004). In addition to the above 22 species are classified as 'cryptogenic', i.e. organisms with wide distributions suspected of being alien.
The Port of Cape Town is known to support established communities of Ciona intestinalis, Diplosoma listerianum, Metridium senile, Carcinus maenas, and Schimmelmannia elegans (Robinson et al. 2005). It is also known to be inhabited by a range of cryptogenic species that have become established but do not posses large populations.
These observations indicate that the probability for the import and establishment of alien organisms may be appreciable. The potential impact is assessed as:
Nature of impact – Import and release of alien species by dredgers and their establishment in habitats within the harbour area Extent – Local to regional with possible extension to national Duration – Long term to permanent; once established it is unlikely that alien species would be obliterated by natural processes of competition, predation etc Intensity – Medium Probability – Probable Status of impact – Negative Degree of confidence – Medium; Alien and invasive alien species have established populations in South African coastal waters even if these are not generally widespread Significance – High Mitigation – Essential: Apply the ballast water management protocols stipulated in the IMO International Convention for the Control and Management of Ship's Ballast Water and Sediments and NPA’s requirement for dredgers to physically wash all hoppers immediately prior to first entering South Africa’s territorial waters when travelling from foreign ports (e.g. CES 2001), with verification of application. The implementation of the above measures should reduce the probability of the impact occurring to improbable as measurements for ballast water at least have shown that the treatment reduces viable organisms by 95%. However the degree of confidence would remain 'medium' as residual sediments may not be totally removed by these processes, especially those caught up in pipelines and corners in dredger hoppers. The evaluation with mitigation is: Nature of impact – Import and release of alien species by dredgers and their establishment in habitats within the harbour area Extent – Local to regional with possible extension to national Duration – Long-term to permanent; once established it is unlikely that alien species would be obliterated by natural processes of competition, predation etc Intensity – Medium Probability – Improbable Status of impact – Negative Degree of confidence – Medium; Alien and invasive alien species have established populations in South African coastal waters and one of the routes may have been sediment; that may not be completely removed by the washing process. Significance – Low, because of low probability of the impact occurring. Note this differs from the rating in the table below which is an artefact of the prescribed generic scoring

69
system Impact Assessment Table Extent Intensity Duration Consequence Probability Significance Status Confidence
No Mitigation
Regional 2
Medium 2
Long-term
3
High 7
Probable HIGH -ve Medium
Mitigation Regional 2
Medium 2
Long-term
3
High 7
Improbable MEDIUM -ve Medium
6.2.1.9 The effect of noise from the dredging activities on biological organisms in the harbour
During dredging operations, noise may have an impact on marine organisms in the harbour such as benthic invertebrates and fish; seabirds foraging on fish may also be affected. Noises generated during dredging originate from the dredger's engines, dredging pumps and the clatter of coarse material passing through suction pipes and depositing in the dredger hoppers. Marine invertebrates have been shown to be relatively insensitive to low frequency sound whilst fish appear able to accommodate moderate sound levels (Keevin and Hempen 1997). Foraging seabirds such as cormorants may avoid the sound source should it reach levels sufficient to cause discomfort but these birds do not appear to be common in the Ben Schoeman Dock Basin although they do occur and forage around the harbour entrance.
Cape Fur Seals do occur in the harbour but seem to be habituated to ship related noises. Note that these animals are very mobile and can move out of the area if any discomfort is generated. The effects of dredger generated noise would therefore appear to be negligible. The potential impact is assessed as:
Nature of impact – Noise from the dredging activity may disturb marine invertebrates, fish, seabirds or mammals Extent – Local Duration – Short-term potential effects extend over the duration of the dredging activity Intensity – Low Probability – Improbable Status of impact – Negative Degree of confidence – High Significance – Insignificant due to low intensity and short duration Mitigation – Not considered to be necessary due to the low significance Impact Assessment Table Extent Intensity Duration Consequence Probability Significance Status Confidence
No Mitigation
Local 1
Low 1
Short-term
1
Very Low 3
Improbable INSIGNIFICANT -ve High
Mitigation n/a n/a n/a n/a n/a n/a n/a n/a
6.2.1.10 Effects of dredging in the Ben Schoeman Dock Basin on endangered seabirds The endangered or threatened seabirds that may occur in the Ben Schoeman Dock Basin are African penguins, crowned and cape cormorants. Of these only the latter has been seen in the respective area with most observations of the birds being towards the harbour entrance where they actively pursue prey as opposed to roosting on harbour

70
structures. The apparent lack of suitable prey and high disturbance levels probably keep penguins and bank cormorants away from the harbour area. Cape cormorants are extremely active and agile birds both in flight and swimming and should be able to avoid any direct interaction with a dredger. If dredger disturbance attains high discomfort levels then these birds can easily avoid the area. Consequently, negative effects on even individual birds should be rare and the probability of these being reflected even at the Table Bay population level appears to be remote. Accordingly the impacts assessment is: Nature of impact – Dredger activities displace and/or compromise local endangered seabird species Extent – Local Duration – Short-term; potential effects extend over the duration of the dredging activity Intensity – Low Probability – Improbable Status of impact – Negative Degree of confidence – High Significance – Insignificant due to low intensity and short duration Mitigation – Not considered to be necessary due to the low significance Impact Assessment Table Extent Intensity Duration Consequence Probability Significance Status Confidence
No Mitigation
Local 1
Low 1
Short-term
1
Very Low 3
Improbable INSIGNIFICANT -ve High
Mitigation n/a n/a n/a n/a n/a n/a n/a n/a
6.2.2 Harbour dredge area: Blasting There are minor amounts of rock in the Ben Schoeman Dock Basin that may need to be shattered by blasting prior to removal by excavation. It is proposed that 'small parcel' blasting will be used which minimizes environmental risks (e.g. General Cargo Quay development in Saldanha Bay, CSIR 1995b). The main features of the proposed procedure is to use buried charges, i.e. avoid surface blasting, use multiple small charges where larger explosive forces are required and, if so, fire these sequentially in the so called ripple charge procedure. The biological communities at risk will be the biofouling community on the harbour structures, the pelagic community which appears to be limited in terms of fish (small Mugil shoals at the harbour entrance), invertebrates (Euphausiids swarm occasionally), and Cape Fur Seals, some of which may be 'resident' in the harbour and sea birds such as Cape cormorants. In general marine invertebrates are relatively insensitive to underwater explosions. Keevin and Hempen (1997) review the extensive published and unpublished (grey literature) information on blast effects and conclude that even close proximity (15m) to large charges (360kg) present limited risk to these fauna. CSIR (1995a) confirmed this with field exposures of Saldanha Bay mud prawn (Upogebia capensis) to 2kg dynamite charges. Caged animals suspended within 20m of the blast showed no discernible injuries and survived a minimum of 7 days after exposure.

71
The apparent insensitivity of marine invertebrates to underwater blasting is attributable to the lack of air bladders and thus limitation of the effects of pressure waves generated by underwater explosions. This coupled with a depauperate invertebrate community on structures at the heads of dock Basins in the Port of Cape Town indicates that risks to marine invertebrates are negligible. Fish are more susceptible to underwater blasting than invertebrates because most species have swim bladders. This is a gas–containing body and is the most frequently damaged organ by underwater explosions. This is due to its rapid contraction and subsequent over-extension in response to pressure waves generated by blasting (Keevin and Hempen 1997). Sensitivity to pressure waves is high and therefore even relatively small charges such as 2kg are sufficient to rupture swim bladders in fish suspended 40m from the explosion. However, when charges are placed in shot holes in rock and appropriate stemming material is used these distances reduce to <10m (Keevin and Hempen 1997). As fish do not appear to be abundant in Ben Schoeman Dock and charges are to be placed in shot holes and stemmed, risks of high fish mortalities or even injuries due to the planned blasting are considered to be negligible. Injuries to mammals, e.g. Cape fur seals, generated by underwater explosions are, similar to fish, primarily trauma of various levels to organs containing gas, such as lungs, ears, and the intestinal tract. Empirical evidence on seals suggest that close proximity to charges can cause mortalities with Keevin and Hempen (1997) quoting observations by Hanson (1981) of seals killed by an 11.4kg dynamite charge exploded 23m away. Experimental evidence is difficult to generate with seals but a number of studies have been carried out with dogs and sheep(!) exposed to underwater blasts (cited in Keevin and Hempen, 1997). These were sufficient to allow the formulation of quantitative relationships between explosive charge size and safe distances. For instance the equation advanced for ringed seals is:
R(m) = 220 W 0.28
Where R(m) = Safe distance in metres and W = charge weight in kg. From this for an open water blast with 50kg of explosive the safe distance for seals is 660m. CSIR (1995b) indicate that for charges in rock (i.e. stemmed shot holes) the peak pressures generated are 10% - 14% of an equivalent charge in open water. From this consideration they quote an alternative quantitative relationship of
R(m) = 37.8 W 0.333 for the calculation of safe distances for swimmers. The sensitive organ here is the ear drum which may be perforated by shock waves. The safe distance for a 50kg charge from this equation is 140m and for a 200kg charge 220m. From the above it can be calculated that seals within 220m of charges as large as 200kg may be at risk of sublethal injury. Seal numbers in the harbour are mostly low and, even if a disproportionate number of seals that habituate the harbour are in the Ben Schoeman Dock during the blasting programme effects at regional seal population level would be minuscule.

72
Diving birds such as cape cormorants would also be susceptible to shock waves in a similar manner to seals. The impact assessment is: Nature of impact – Mortality and/or injury to harbour biota from shock waves generated by small parcel blasting to remove rock Extent – Local; any effects should be confined to the project area, mortalities and/or injuries should find negligible expression at regional population levels Duration – Short-term; Recruitment and/or migration should rapidly replace any fauna that may be impacted by the proposed blasting Intensity – Low Probability – Possible Status of impact – Negative Degree of confidence – High; previous observations of small parcel blasting in Saldanha Bay indicated minimal effects on biota Significance – Medium because of public perceptions on blasting effects. Note this differs from the rating in the table below which is an artefact of the prescribed generic scoring system Mitigation – Essential: Rigorously follow small blasting procedures, implement the 'Marine Mortality Prevention Programme' defined for Saldanha Bay in CSIR (1995) for any blasting programme in Ben Schoeman Dock, namely;
o Prior to blasting inspect the blast area for seals (and/or birds) and if present attempt to drive them out of the danger area.
o If multiple blasts are required conduct one blast per day to reduce the danger of seals swimming into the blast zone to forage on dead fish etc and becoming victims of subsequent blasting, and
o Monitor the blast area for 30 minutes after blasting to record and collect any dead or severely injured animals. All collected animals should be handed across to MCM or Nature Conservation officials.
The evaluation with mitigation is: Nature of impact – Mortality to harbour fauna from shock waves generated by small parcel blasting to remove rock Extent – Local Duration – Short-term Intensity – Low Probability – Possible Status of impact – Negative Degree of confidence – High; previous observations of small parcel blasting in Saldanha Bay indicated minimal effects on biota Significance – Insignificant Impact Assessment Table Extent Intensity Duration Consequence Probability Significance Status Confidence
No Mitigation
Local 1
Low 1
Short-term
1
Very Low 3
Possible INSIGNIFICANT -ve High
Mitigation Local 1
Low 1
Short-term
1
Very Low 3
Possible INSIGNIFICANT -ve High
73
6.2.3 Dredge spoil disposal site
6.2.3.1 Alteration of seafloor sediment characteristics affecting biological communities The discharge of ~1.2 million m3 of dredge spoil to the dredge spoil disposal site will inundate the resident benthos, possibly disrupting community structure and ecological processes at the site. The identified dump sites are approximately 3kmx2km which should result in an average inundation depth of 30cm-40cm. Maurer et al. (1980, 1981, 1982) and Hall (1994) have shown that most of the major faunal classes in the benthos would be able to withstand such burial depths, and, once the dumped sediment stabilised, it is likely that fauna will both migrate into the spoil dump area and recruit to it (Newell et al. 1998) with a relatively short recovery period (Ellis 1996). However, due to the spoil dumping practices followed by dredgers and/or barges carrying dredge spoil it is considered to be highly unlikely that an even distribution of dumped dredge spoil will be achieved. It is more probable that the dumping will result in multiple heaps of dredge spoil distributed across the chosen dredge spoil dump area. Under this scenario instantaneous burial depths may be 50cm–70cm which could cause higher mortality levels in the benthos. Recovery periods should be equally short though.
The two candidate dredge spoil dump sites differ in sediment properties and in benthos community structure. The deeper site (#1) is characterised by a more or less uniform fine sand sediment and a high similarity in benthos community structure across the site. The 'worst case' average deposition pattern predicted by the simulation modelling for this site is shown in Figure 24. This particular deposition distribution will be that generated by spoil discharge during the cutter suction dredger phase. The bulk of the deposition will occur on the designated dump site but the surrounding area, including the northern edge of the Table Mountain MPA is also expected to receive sediment. Average depositional thickness is predicted to be low outside of the dump site, however, ranging from 1cm-5cm. Most of the affected area within the MPA will have deposition <1cm in thickness.

74
Figure 24: The predicted worst case mean depositional thickness at dump site #1 over the duration of the simulation period for the cutter suction dredger. Copied from Figure B.1.9 in Van Ballegooyen et al., 2006)

75
Figure 25: The predicted worst case mean depositional thickness at dump site #2 over the duration of the simulation period for the Cutter Suction dredger. Copied from Figure B.2.9 in Van Ballegooyen et al., 2006)

76
Figure 25 depicts the simulation model predictions of the 'worst case' average deposition thickness for site #2. Similar to site #1 the bulk of the discharged sediment is contained within the designated dump area. However, there is an extensive area where deposition occurs, albeit in shallow layers (<1cm thick). Some of this deposition extends into the coast adjacent and south of Mouille Point, in the Table Mountain MPA.
Aside from the apparent differences in predicted deposition patterns the shallower site (#2) has a wider range of sediment properties that have a patchy distribution across the site than does site #1. There is a matching higher dissimilarity in benthos community structure. The site also has exposed rock on it with its own biological community. Coarse sediments and rock surfaces have longer recolonisation periods than fine sands (5 years, Ellis 1996). Further, although the data are limited it would appear from detailed bathymetry that the site #1 conditions have a wider distribution in Table Bay than do those of site #2. Consequently the potential impact of sediment deposition on the benthos is evaluated separately for each site.
SITE #1:
Nature of impact – Depositing discharged dredge spoil may smother benthos on the dredge spoil discharge site and adjacent areas causing benthos mortality and disrupting ecological processes Extent – Local; restricted to within an approximately 5km radius of the centre of the spoil dump site Duration – Short; research indicates recovery within 1-3 years. Intensity – Medium; some organisms may burrow to the surface but burial depths may prevent this on the dump site itself. Biomass will be reduced here and community structure altered. Deposition depths outside of the dump site are insignificant and there should be limited effects on the benthos inhabiting these areas. Probability – Probable Status of impact – Negative Degree of confidence – High Significance – Very Low; The spatial extent should be small relative to the amount of similar habitat in Table Bay and recolonisation rapid as most of the sediment being dumped is approximately similar to that already in the area. Mitigation – Optional: When discharging sediments the dredger should ensure that it is deposited in thin layers ensuring diminished mortality in the benthos. The evaluation with mitigation is: Nature of impact – Depositing discharged dredge spoil may smother benthos on the dredge spoil discharge site and adjacent areas causing benthos mortality and disrupting ecological processes Extent – Local; restricted to within an approximately 5km radius of the centre of the spoil dump site Duration – Short; research indicates recovery within 1-3 years. Intensity – Low Probability – Possible Status of impact – Negative Degree of confidence – High Significance – Insignificant

77
Impact Assessment Table Extent Intensity Duration Consequence Probability Significance Status Confidence
No Mitigation
Local 1
Medium 2
Short-term
1
Very Low 4
Probable VERY LOW -ve High
Mitigation Local 1
Low 1
Short-term
1
Very Low 3
Possible INSIGNIFICANT -ve High
SITE #2 Nature of impact – Depositing discharged dredge spoil smothers benthos on the dredge spoil discharge site and adjacent areas causing benthos mortality and disrupting ecological processes Extent – Regional; the actual effect may be restricted to the areas in and adjacent to the dump site but the habitat may not be widely distributed in Table Bay and/or the wider region. The extension of the deposition area into Table Bay may affect low relief emergent rock surfaces evident in detailed bathymetric charts of the area (e.g. Woodborne, 1983) Duration – Medium-term; research indicates recovery within 5 years. Intensity – Medium; some organisms may burrow to the surface but burial depths may prevent this on the dump site itself. Biomass will be reduced here and community structure altered. Deposition depths outside of the dump site are insignificant but the seafloor may be rock as opposed to sand. Biological structure on these surfaces may be altered. Probability – Probable Status of impact – Negative Degree of confidence – High Significance – Medium; there is a potential biodiversity 'loss' due to the possible uniqueness of the habitat in Table Bay at least and the fact that only part of the area which may be impacted has sediment similar to that proposed from dumping. Mitigation – Optional: do not use this site for dredge spoil dumping. The evaluation with mitigation is: Nature of impact – Depositing discharged dredge spoil may smother benthos on the dredge spoil discharge site and adjacent areas causing benthos mortality and disrupting ecological processes Extent – None Duration – None Intensity – None Probability – Improbable Status of impact – Negative Degree of confidence – High Significance –Insignificant Impact Assessment Table
Extent Intensity Duration Consequence Probability Significance Status Confidence No
Mitigation Regional
2 Medium
2 Medium-
term 2
Medium 6
Probable MEDIUM -ve High
Mitigation None 0
None 0
None 0
Not Significant 0
Improbable INSIGNIFICANT Neutral High

78
6.2.3.2 Alteration of benthic biological communities through toxins associated with dredge spoil
The dredge spoil is characterised by trace metal concentrations within the LC special care (action level) range and higher than threshold effect levels (TEL). It therefore has the potential to alter benthos community structure on the site used for spoil dumping and immediately adjacent areas. Because of differing benthos community structure in the two candidate sites identified for spoil discharge there are varying implications of this. Therefore, as for the effects of inundation by dredge spoil, the two sites are assessed separately. SITE #1:
Nature of impact – Trace metal contaminated dredge spoil exerts toxic effects on benthos in the dredge spoil dump area and the immediately adjacent seabed and alters benthic communities. Extent – Local; restricted to the immediate area of the spoil dump area Duration – Short: The toxicity potential of the dumped sediments depends on the bioavailability of trace metals which should be limited due to probable adsorption to iron (ferric) and manganese (manganous) hydroxides present in the now oxic sediments. Trace metals should thus remain in the particulate phase. This is borne out by simulation modelling results showing that RSA water quality guideline concentrations for copper are not transgressed at any stage for any of the spoil dumping scenarios at either of the spoil dump sites (Van Ballegooyen et al., 2006). Tests with sediments comparable to those targeted for dumping indicate generally low toxicity effects (Geffard et al. 2002). Further, if the sediment is sufficiently toxic to cause deleterious effects the toxicity should be relatively rapidly dissipated by wave generated resuspension and advection of silt and clay sized particles away from the dump site area. Re-deposition of these sediments away from the dump site should be sufficiently small to mitigate any latent toxicity (above). Therefore any toxic effects on biota in and adjacent to the dump site should be worked out of the community within a few generations. Intensity –Low; toxicity effects should be minimal due to retention of trace metals in the inorganic particulate phase. Probability – Improbable; there is only one instance of a trace metal exceeding the PEL level and this should be reduced below this threshold through dilution with less contaminated sediments in the dredging and spoil dumping process Status of impact – Negative Degree of confidence – High Significance – Insignificant; the spatial and temporal extent of any effect should be small relative to the amount of similar habitat in Table Bay. Mitigation – None Impact Assessment Table
Extent Intensity Duration Consequence Probability Significance Status Confidence No
Mitigation Local
1 Low
1 Short-term
1
Very Low 3
Improbable INSIGNIFICANT -ve High
Mitigation n/a n/a n/a n/a n/a n/a n/a n/a

79
SITE #2 Nature of impact – Depositing discharged trace metal contaminated dredge spoil exerts toxic effects on benthos in the dredge spoil dump area and its immediately adjacent area and alters benthic communities. Extent – Regional; the actual effect may be restricted to the areas in and adjacent to the dump site but the habitat may not be widely distributed in Table Bay and/or the wider region. The extension of the deposition area into Table Bay may affect low relief emergent rock surfaces evident in detailed bathymetric charts of the area (e.g. Woodborne, 1983) Duration – Short: The toxicity potential of the dumped sediments depends on the bioavailability of trace metals which should be limited due to probable adsorption to iron (ferric) and manganese (manganous) hydroxides present in the now oxic sediments. Trace metals should thus remain in the particulate phase. This is borne out by simulation modelling results showing that RSA water quality guideline concentrations for copper are not transgressed at any stage for any of the spoil dumping scenarios at either of the spoil dump sites (Van Ballegooyen et al., 2006). Tests with sediments comparable to those targeted for dumping indicate generally low toxicity effects (Geffard et al. 2002). Further, if the sediment is sufficiently toxic to cause deleterious effects the toxicity should be relatively rapidly dissipated by wave generated resuspension and advection of silt and clay sized particles away from the dump site area. Re-deposition of these sediments away from the dump site should be sufficiently small to mitigate any latent toxicity (above). Therefore any toxic effects on biota in and adjacent to the dump site should be worked out of the community within a few generations Intensity – Low; toxicity effects should be minimal due to retention of trace metals in the inorganic particulate phase. Probability – Improbable; there is only one instance of a trace metal exceeding the PEL level and this should be reduced below this threshold through dilution with less contaminated sediments in the dredging and spoil dumping process Status of impact – Negative Degree of confidence – High Significance –Low; there is a potential biodiversity 'loss' due to the possible uniqueness of the habitat in Table Bay at least and the fact that only part of the area has sediment similar to that proposed from dumping. Note this differs from the rating in the table below which is an artefact of the prescribed generic scoring system Mitigation – Optional: do not use this site for dredge spoil dumping. The evaluation with mitigation is: Nature of impact – Depositing discharged trace metal contaminated dredge spoil exerts toxic effects on benthos in the dredge spoil dump area and its immediately adjacent area and alters benthic communities. Extent – None Duration – None Intensity – None Probability – Improbable Status of impact – Negative Degree of confidence – High Significance –Insignificant

80
Impact Assessment Table Extent Intensity Duration Consequence Probability Significance Status Confidence
No Mitigation
Local 1
Low 1
Short-term
1
Very Low 3
Improbable INSIGNIFICANT -ve High
Mitigation None 0
None 0
None 0
None 0
Will not occur
INSIGNIFICANT neutral High
6.2.3.3 Effects of turbidity generated by the dredge spoil dumping on habitats adjacent to the dredge spoil dump area(s)
The suspended sediment concentrations thresholds applicable to the dredge spoil dump sites are those of EMBECOM (2004). These identify exposures to 20mg/l for continuous periods of three days or longer as the lower threshold of possible adverse ecological effects. Probable adverse effects may be generated in exposures to 80mg/l but 100mg/l concentrations have proven negative impacts. This assessment utilises 20mg/l suspended sediment as a low risk threshold and 100mg/l as the upper permissible limit.
Simulation modelling of suspended sediment distributions in the surface layers of the water column show that levels >20mg/l do not extend beyond the borders of either of the dredge spoil dump sites for any of the dredging scenarios tested (Van Ballegooyen et al., 2006). This is not the case for the bottom layer as shown in Figures 26a and b. These are the 'worst case' predictions and apply to the winter Cutter Suction dredging scenario; scenarios for trailer suction hopper dredger are slightly less severe but those for back hoe dredging are much smaller due to lower spoil dump rates (Van Ballegooyen et al., 2006).
Figure 26a indicates that turbid water near the sea floor may invade large areas of Table Bay; most of the effect is within ~5km radius of the centre of dump site #1 but there is also a patch of longer exceedances of the 20mg/l threshold in inner Table Bay, north of the harbour entrance. Days of exceedance in these areas are predicted to be >15 to >30 days indicating a strong likelihood that exposure durations may be longer than three days. There is therefore a possibility of deleterious impacts within these areas. The number of days when the threshold is exceeded outside of these areas is low (2-5 days) and durations in excess of 3 days are considered to be unlikely with a low probability of deleterious effects. Sediments dumped at spoil disposal site #2 have a far greater area of impact and higher days of exceedance than at dump site #1 (Figure 26b). The simulation modelling predicts that a large proportion of the Table Bay seabed, and associated biota, will be exposed to suspended sediment concentrations >20mg/l for >30 days. According to the adopted thresholds of possible adverse ecological effects spoil dumping at site #2 under this scenario therefore has negative implications for an appreciable proportion of the Table Bay benthos.
Whereas exceedance of the 20mg/l suspended sediment threshold for dredge spoil dumping at both dump sites is extensive in Table Bay that for the 100mg/l limit is not, being largely contained within the site boundaries. However, the area affected is larger for dump site #2 compared to dump site #1 (Figures 27a and b) which is probably a function of depth differences. Therefore the areas of probable adverse ecological effects of suspended sediments on benthos are mainly limited to the specific dump sites and may be exerted on biota already compromised by inundation (§6.2.3.1 above). However, dump site #2 has a larger area of probable effects associated with it, extending northwards towards Robben Island.

81
Due to the apparent differences in areal scales of potential impacts of suspended sediments the two dredge spoil dump sites are assessed separately.
SITE #1
Nature of impact – Turbid plumes of suspended sediment negatively affect biota in and adjacent to the dredge spoil dump site #1 Extent – Local; largely restricted to within an approximately 5km radius of the centre of the spoil dump site but with an isolated patch of longer exceedances immediately north of the harbour entrance. Durations of exceedances of concentrations above the 20mg/l threshold outside of these areas are probably <3 days and concentrations >100mg/l are predicted to be restricted to the dump site and immediately adjacent areas Duration – Short; recovery should commence on completion of the dredging programme and be largely attained within 1-3 years. Intensity – Low Probability – Possible Status of impact – Negative Degree of confidence – High Significance – Insignificant; the spatial extent should be small relative to the amount of similar habitat in Table Bay and recolonisation should be rapid as any effects are likely to be chronic as opposed to acute (Hall 1994). Mitigation – None Impact Assessment Table
Extent Intensity Duration Consequence Probability Significance Status Confidence No
Mitigation Local
1 Low
1 Short-term
1
Very Low 3
Possible INSIGNIFICANT -ve High
Mitigation n/a n/a n/a n/a n/a n/a n/a n/a SITE #2 Nature of impact – Turbid plumes of suspended sediment negatively affect biota in and adjacent to the dredge spoil dump site #2 Extent – Regional; a large proportion of the Table Bay sea floor will be exposed to suspended sediment concentrations above 20mg/l for periods exceeding the set three days of continuous exposure limit and concentrations >100mg/l are predicted to affect the seabed north of the dump site itself Duration – Short; recovery should commence on completion of the dredging programme and be largely attained within 1-3 years. Intensity – Medium; effects should be chronic in nature but may lead to temporary shifts in community structure. This may have implications for biodiversity because of the diversity of habitats that may be affected Probability – Probable Status of impact – Negative Degree of confidence – Medium Significance – Medium; the potential spatial extent of impact is large relative to the known distributions of habitat types and Table Bay itself. However, recolonisation should be rapid as any effects are likely to be chronic as opposed to acute (Hall 1994). Note this differs from the rating in the table below which is an artefact of the prescribed generic scoring system Mitigation - Optional: do not use this site for dredge spoil dumping. The evaluation with mitigation is:

82
Nature of impact – Turbid plumes of suspended sediment negatively affect biota in and adjacent to the dredge spoil dump site #2 Extent – None Duration – None Intensity – None Probability – Improbable Status of impact – Neutral Degree of confidence – High Significance –Insignificant Impact Assessment Table
Extent Intensity Duration Consequence Probability Significance Status Confidence No
Mitigation Regional
2 Medium
2 Short- term
1
Low 5
Probable LOW -ve Medium
Mitigation None 0
None 0
None 0
Not significant 0
Improbable INSIGNIFICANT Neutral High

83
Figure 26a: Predicted worst case exceedance (days) of 20mg/l of suspended sediment within the bottom layer of the greater study area for dredge spoil dumped on site #1. (Winter Cutter Suction scenario; copied from Figure B.7.5 in Van Ballegooyen et al., 2006)
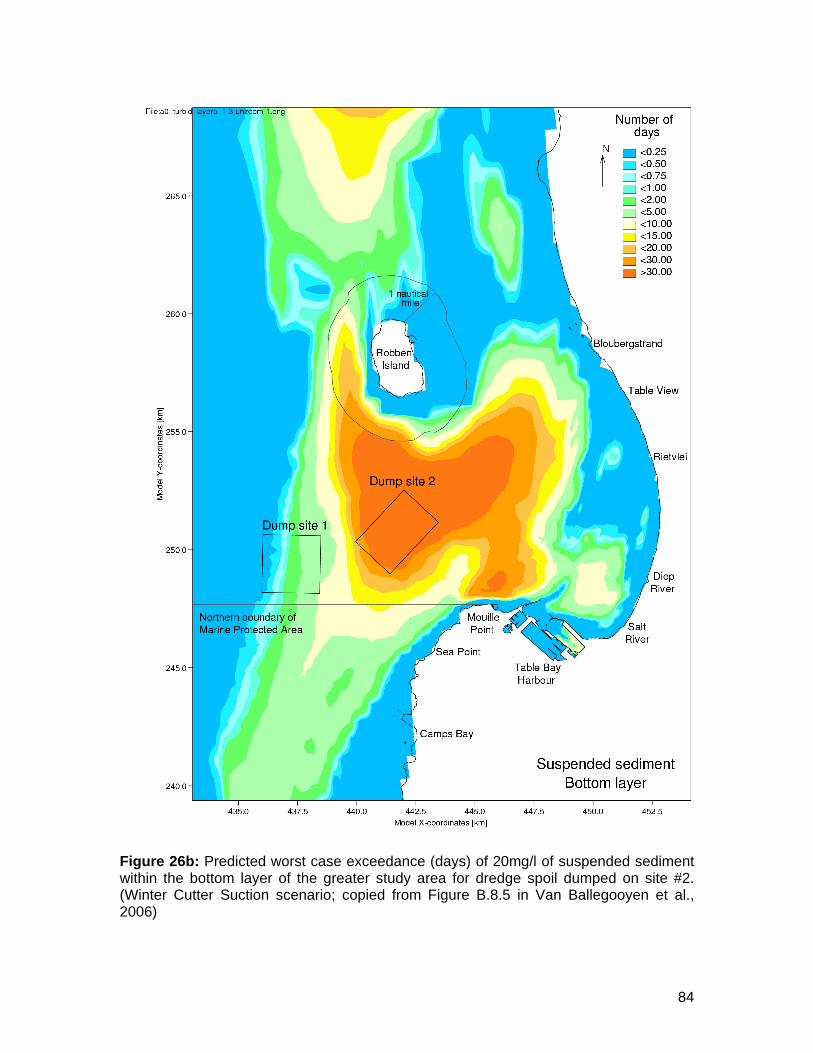
84
Figure 26b: Predicted worst case exceedance (days) of 20mg/l of suspended sediment within the bottom layer of the greater study area for dredge spoil dumped on site #2. (Winter Cutter Suction scenario; copied from Figure B.8.5 in Van Ballegooyen et al., 2006)

85
Figure 27a: Predicted worst case exceedance (days) of 100mg/l of suspended sediment within the bottom layer of the greater study area for dredge spoil dumped on site #1. (Winter Cutter Suction scenario; copied from Figure B.7.4 in Van Ballegooyen et al., 2006)

86
Figure 27b: Predicted worst case exceedance (days) of 100mg/l of suspended sediment within the bottom layer of the greater study area for dredge spoil dumped on site #2. (Winter Cutter Suction scenario; copied from Figure B.8.5 in Van Ballegooyen et al., 2006)

87
6.2.3.4 Reductions in dissolved oxygen concentrations due to introduction of organic matter previously held in the sediments and/or anoxic sediments to the water column and effects on biota
The organic content of the sediments targeted for dredging is relatively low and only a portion of them are mildly anoxic as indicated by the AVS measurements (CSIR 2005). Therefore the amount of oxygen demand placed in the water column during dredge spoil dumping should be low. Depletion of oxygen concentrations in the water column and deleterious effects on organisms or ecological processes will therefore be unlikely. Accordingly the impact of reductions in dissolved oxygen concentrations is assessed as: Nature of impact – Potential depletion of water column oxygen concentration in the dredge spoil dump site area through bacterial decomposition of remobilised organic matter and/or exposure of anoxic sediments in the dredge spoil dump area(s) during dredge spoil discharge and deleterious effects on organisms/ecological processes Extent – Local, any effect should be limited to the water body in the immediate vicinity of the spoil dump area(s) Duration – Short-term, potential effects may only extend over the duration of the spoil dump event due to re-oxygenation by natural processes such as photosynthesis, and water volume exchange with the adjacent ocean Intensity – Low Probability – Improbable Status of impact - Negative Degree of confidence – High Significance – Insignificant, due to low intensity and short duration Mitigation – None necessary (or feasible) Impact Assessment Table
Extent Intensity Duration Consequence Probability Significance Status Confidence No
Mitigation Local
1 Low
1 Short-term
1
Very Low 3
Improbable INSIGNIFICANT -ve High
Mitigation n/a n/a n/a n/a n/a n/a n/a n/a
6.2.3.5 Turbid plumes generated by dredge spoil dumping compromise water quality in the Table Mountain marine protected area (MPA) and/or within the Robben Island exclusion zone with possible effects on biota
Results from the simulation modelling indicate that, in the worst case winter scenario, suspended sediment concentrations greater than the 20mg/l possible effect threshold may invade the bottom waters of the Table Mountain MPA and the Robben Island exclusion zone (Figures 26a and b). Suspended sediment concentrations >100mg/l (the probable effect level) are predicted to not extend into this MPA for sediments discharged at dredge spoil dump site #1 (Figure 27a) but may well do so for spoil discharged at dump site #2 (Figure 27b). This is not expected to occur for Cutter Suction dredger operations in summer (Figures B.1.4 and B.2.4, Van Ballegooyen et al., 2006) or for any of the other dredging scenarios tested (Van Ballegooyen et al., 2006). The predicted 'worst case' simulated time series of bottom water suspended sediment concentrations at 500m and 1000m south of the northern boundary of the MPA for both dredge spoil disposal sites are shown in Figure 28a and b. These time series are those generated for the Cutter Suction dredger operating in winter. Figure 28a shows that, for dredge spoil disposal site #1, there are two occurrences of

88
suspended sediment concentrations in excess of 20mg/l that have durations in excess of three days immediately south of the dump site. The durations are similar at the 500m and 1000m locations but peak concentrations are higher deeper into the MPA. Exceedances south west of dump site #2 are marginal and short lived. The maximum exposure period in the simulations appears to be ~seven days. Figure 28b indicates that, for dredge spoil discharged at dump site #2 there will be less frequent occurrences of suspended sediment concentrations >20mg/l and that none of these are predicted to have durations in excess of three days. For both of the dump sites suspended sediment concentrations >20mg/l are predicted to extend into the Karbonkelberg sanctuary area within the Table Mountain MPA (Figures 26a and b). However, the number of days of exceedance is low at less than two days for dump site #1 and less than five days for dump site #2. Figure 28b indicates that the three day duration threshold will not be transgressed for the latter dump site. The potential impact of high suspended sediment concentration water invading the Table Mountain MPA and/or the Robben Island exclusion zone for the two dredge spoil disposal sites is assessed separately for the dump sites below. Site #1 Nature of impact – Turbid plumes generated by dredge spoil dumping compromise water quality in the Table Mountain marine protected area and/or the Robben Island exclusion zone with effects on biota. Extent – Regional, effects should be limited to the northern area of Table Mountain MPA water body in close proximity to the dredge spoil disposal sites but the MPA is regionally important Duration – Short-term, potential effects may only extend over the duration of the Cutter Suction dredging phase as possible effects are predicted to be chronic as opposed to acute Intensity – Low Probability – Possible Status of impact - Negative Degree of confidence – Medium Significance – Insignificant, due to low intensity and short duration Mitigation – None necessary from the impact evaluation but appears achievable through conducting the Cutter Suction dredging phase in the summer period as here the penetration of >20mg/l suspended load into the Table Mountain MPA is reduced and should not reach the Karbonkelberg sanctuary area. The evaluation with mitigation is: Nature of impact – Turbid plumes generated by dredge spoil dumping compromise water quality in the Table Mountain marine protected area and/or the Robben Island exclusion zone with effects on biota Extent – Regional Duration – Short-term Intensity – Low Probability – Improbable Status of impact – Negative Degree of confidence – High Significance –Insignificant

89
Impact Assessment Table Extent Intensity Duration Consequence Probability Significance Status Confidence
No Mitigation
Regional 2
Low 1
Short-term
1
Very Low 4
Possible INSIGNIFICANT -ve Medium
Mitigation Regional 2
Low 1
Short-term
1
Very Low 4
Improbable INSIGNIFICANT -ve High
Site #2 Nature of impact – Turbid plumes generated by dredge spoil dumping compromise water quality in the Table Mountain marine protected area and/or the Robben Island exclusion zone with effects on biota. Extent – Regional, effects may be exerted in both the Table Mountain MPA and the Robben Island exclusion zone with the latter being probable due to the penetration of suspended sediment concentrations in excess of 100mg/l into the western and southern sections. MPAs are regionally important Duration – Short-term, potential effects may only extend over the duration of the Cutter Suction dredging phase as probable effects are predicted to be chronic as opposed to acute Intensity – Medium Probability – Probable for the Robben Island exclusion zone, possible for the Table Mountain MPA Status of impact - Negative Degree of confidence – Medium Significance – Low, due to regional extent and medium intensity but short duration Mitigation – Do not use dredge spoil dump site #2 The evaluation with mitigation is: Nature of impact – Turbid plumes generated by dredge spoil dumping compromise water quality in the Table Mountain marine protected area and/or the Robben Island exclusion zone with effects on biota. Extent – None Duration – None Intensity – None Probability – Improbable Status of impact – Neutral Degree of confidence – High Significance –Insignificant Impact Assessment Table
Extent Intensity Duration Consequence Probability Significance Status Confidence No
Mitigation Regional
2 Medium
2 Short-term
1
Low 5
Probable LOW -ve Medium
Mitigation None 0
None 0
None 0
Not significant 0
Improbable INSIGNIFICANT Neutral High

90
Figure 28a: Dredge spoil dump site #1: Predicted suspended sediment concentrations near the bottom; top panel due south of dump site #1 and bottom panel southwest of dump site #2. Red indicates roughly 500m within the MPA and blue roughly 1000m. (Winter, Cutter Suction Dredger; Copied from Figure B.7.7 in Van Ballegooyen et al., 2006).

91
Figure 28b: Dredge spoil dump site #2: Predicted suspended sediment concentrations near the bottom; top panel due south of dump site #1 and bottom panel southwest of dump site #2. Red indicates roughly 500m within the MPA and blue roughly 1000m. (Winter, Cutter Suction Dredger; Copied from Figure B.8.7 in Van Ballegooyen et al., 2006).

92
6.2.3.6 Elevated water column turbidity affecting inter- and shallow sub-tidal biological communities in adjacent conservation areas
Suspended sediment concentrations in excess of 20mg/l may compromise biological communities on either the mainland or Robben Island shores. Simulation modelling predicts that no turbid plumes at or above this concentration threshold will impinge on these shores (eg Figures 26a and b). This implies negligible risk of adverse impacts.
The potential impact for either of the two dredge spoil disposal sites is assessed as:
Nature of impact – Elevated water column turbidity affects inter- and shallow sub-tidal biological communities in adjacent conservation areas in the Table Mountain MPA and at Robben Island Extent – Local Duration – Short-term, possible effects are predicted to be chronic as opposed to acute Intensity – Low Probability – Improbable Status of impact - Negative Degree of confidence – High Significance – Insignificant, due to low intensity and short duration Mitigation – None necessary for either of the dredge spoil dump sites Impact Assessment Table
Extent Intensity Duration Consequence Probability Significance Status Confidence No
Mitigation Local
1 Low
1 Short-term
1
Very Low 3
Improbable INSIGNIFICANT -ve High
Mitigation n/a n/a n/a n/a n/a n/a n/a n/a
6.2.3.7 Inundation of intertidal shores in adjacent conservation areas by sediment deposition altering substrates and modifying communities
Some of the discharged dredge spoil on the dump sites may deposit in limited areas of the Table Mountain MPA intertidal shores but model simulations of depositional patterns indicates that this will be in very shallow layers.
The potential impact for either of the two dredge spoil disposal sites is assessed as:
Nature of impact – Inundation of intertidal shores in adjacent conservation areas by sediment deposition altering substrates and modifying communities Extent – None Duration – None Intensity – Zero Probability – Improbable Status of impact - Neutral Degree of confidence – High Significance – Insignificant, due to low intensity and short duration Mitigation – None necessary for either of the dredge spoil dump sites Impact Assessment Table
Extent Intensity Duration Consequence Probability Significance Status Confidence No
Mitigation None
0 Zero
0 None
0 Not significant
0 Improbable INSIGNIFICANT Neutral High
Mitigation n/a n/a n/a n/a n/a n/a n/a n/a

93
6.2.3.8 Introduction of alien species Dredgers may transport alien biota in ballast water, in residual sediment in their hoppers or even attached as biofouling organisms on their hulls. The release of alien species into Table Bay by dredgers carries the risks of allowing the establishment of populations and potential competitive exclusion (food, space, nutrients) of indigenous species. In the worst case such imports may lead to the development of invasive populations with the capacity to severely disrupt and modify communities and ecological processes (IUCN 2000).
Despite a long history of international shipping passing through South African ports there are only 16 confirmed cases of alien species becoming established in the country's coastal waters and/or ports (Awad et al. 2004, Robinson et al. 2005). The best known of these is the Mediterranean mussel Mytilus galloprovincialis, currently the mainstay of the local mussel farming industry, the ascidian Ciona intestinalis, a biofouling organism common in harbours, and the European shore-crab Carcinus maenas. Oher alien species that have or may exert deleterious effects on ecological processes or industries dependent on these include the harmful algal bloom dinoflagellate species Alexandrium tamarense and Gymnodinium cf. mikimotoi and the brown microalgae Aureococcus anophagefferens (Awad et al. 2004). In addition to the above 22 species are classified as 'cryptogenic', i.e. organisms with wide distributions suspected of being alien.
Klages et al. (2006) is the only survey that exists in South Africa aimed at detecting 'invasive aliens' in open water areas (adjacent to the Port of Ngqura, Algoa Bay) subsequent to a dredging and dredge spoil disposal operation. These authors did not find invasive species, however, their presence cannot be entirely excluded as the sampling coverage reported by Klages et al. (2006) was not extensive. Therefore it is accepted here that there is potential for importing alien species even though for the dredge spoil dump area(s) this should be limited to the first spoil dump events. After these any alien species that may have been in the hoppers should have been released.
The potential impact for either of the two dredge spoil disposal sites is assessed as:
Nature of impact – Import and release of alien species by dredgers and their establishment at and/or adjacent to the dredge spoil disposal area Extent – Local to regional (Table Bay) and possibly national Duration – Long-term to permanent; once established it is unlikely that alien species would be obliterated by natural processes of competition, predation etc Intensity – Medium Probability – Possible Status of impact – Negative Degree of confidence – Medium; Alien and invasive alien species have established populations in South African coastal waters Significance – Medium Mitigation – Essential: Apply the ballast water management protocols stipulated in the IMO International Convention for the Control and Management of Ship's Ballast Water and Sediments and NPA’s requirement for dredgers to physically wash all hoppers immediately prior to first entering South Africa’s territorial waters when travelling from foreign ports (e.g. CES 2001), with verification of application. The implementation of the above measures should reduce the probability of the impact occurring to improbable as measurements for ballast water at least have shown that the treatment reduces viable organisms by 95%. However the degree of confidence would remain 'medium' as residual sediments may not be totally removed by these processes, especially those caught up in pipelines and corners in dredger hoppers.

94
The evaluation with mitigation is: Nature of impact – Import and release of alien species by dredgers and their establishment at and/or adjacent to the dredge spoil disposal area Extent – Local to regional (Table Bay) Duration – Long-term to permanent; once established it is unlikely that alien species would be obliterated by natural processes of competition, predation etc Intensity – Medium Probability – Improbable Status of impact – Negative Degree of confidence – Medium; Alien and invasive alien species have established populations in South African coastal waters and one of the routes may have been sediment that may not be completely removed by the washing process. Significance – Medium, but mitigation reduces probability Impact Assessment Table
Extent Intensity Duration Consequence Probability Significance Status Confidence No
Mitigation Regional
2 Medium
2 Long-term
3
High 7
Possible MEDIUM -ve Medium
Mitigation Regional 2
Medium 2
Long-term
3
High 7
Improbable MEDIUM -ve Medium
6.2.3.9 Effects of turbidity generated during dredge spoil dumping on endangered coastal seabirds, specifically the African penguin Spheniscus demersus
The red listed African penguin forages in the areas of the proposed dredge spoil dump sites and there is a breeding colony on Robben Island. Recent observations (Crawford 2006) have shown a marked decline in the global breeding population size from ~22 000 pairs in 1987 – 2001 to ~11 000 pairs in 2003 – 2006. This has placed the African penguin population in a precarious situation in terms of its survival in the wild. Potential disturbances on penguins therefore have to be strictly guarded against. Penguins are visual hunters and reduced visibility in the upper water column can reduce foraging success. It is unknown at what level turbidity begins to influence foraging. However, for the purposes of this assessment a lower concentration limit of 10mg/l total suspended solids above background in surface waters, i.e. the concentration at which the associated plume becomes visible (Van Ballegooyen et al., 2006) is considered to be the threshold which begins to interfere with penguin foraging. The predicted 'worst cases' for upper water column turbidity for the proposed dredge spoil disposal at both dump sites are shown in Figures 29a and b. These indicate that 10mg/l suspended sediment concentrations will be exceeded for <5 days in the immediate vicinity of the dump sites and an area immediately north of Mouille Point. These are small proportions of the proposed dredging period and the water surface in Table Bay. The potential impact for either of the two dredge spoil disposal sites is assessed as:
Nature of impact – Dredge spoil disposal may compromise environmental conditions in important areas for penguins foraging in Table Bay by increasing water turbidity above 10mg/l possibly leading to reduced foraging success Extent – Local; the spatial extent of turbidity elevations above 10mg/l during dredge spoil disposal is predicted to be small. Any effect on penguins however, could have

95
regional, national and international implications (national legislation and international conventions) Duration – Short to Long term to permanent. The duration of elevated turbidity may be short but possible deleterious effects at the local population level could be long term to permanent because of small population size. Intensity – Medium Probability – Improbable Status of impact – Negative Degree of confidence – Low; there are no explicit links between turbidity, foraging success and population level effects Significance – Very Low, due to small area affected and probable turbid plume dissipation rates. Mitigation – Essential under any interpretation of the application of the precautionary principle embodied in NEMA and the Biodiversity Conservation Act of 2002: Possible mitigation is to ensure that there is no chronic build up of turbidity in the area of the dredge spoil dump site(s) through allowing sufficient time for turbidity dispersal between dump events. Under this mitigation scenario the impact evaluation is: Nature of impact – Dredge spoil disposal may compromise environmental conditions in important areas for penguins foraging in Table Bay by increasing water turbidity above 10mg/l for short intervals in the vicinity of the dredge spoil dump site(s) compromising penguin foraging activities Extent – Local Duration – Short Intensity – Low Probability – Improbable Status of impact – Negative Degree of confidence – Low Significance – Insignificant, due to small area affected and rapid turbid plume dissipation rates. Impact Assessment Table
Extent Intensity Duration Consequence Probability Significance Status Confidence No
Mitigation Local
1 Medium
3 Short-term
1
Low 5
Improbable Very Low -ve Low
Mitigation Local 1
Low 1
Short-term
1
Very Low 3
Improbable INSIGNIFICANT -ve Low

96
Figure 29a: Predicted exceedance in days of surface layer 10mg/l suspended sediment concentrations associated with dredge spoil dumping at site #1. (Cutter Suction dredger; copied from Figure B.1.1 in Van Ballegooyen et al., 2006)

97
Figure 29b: Predicted exceedance in days of surface layer 10mg/l suspended sediment concentrations associated with dredge spoil dumping at site #2. (Cutter Suction dredger; copied from Figure B.1.1 in Van Ballegooyen et al., 2006)

98
6.3 Cumulative Impacts The proposed dredging operations will take place in a high shipping traffic working port that receives contaminants from the ship operations, bunkering, urban stormwater flows and ship repairs amongst other sources. The port can therefore not be considered as a 'pristine' environment in any sense and it probably does not have any functional ecological links, aside from providing rock lobster habitat on the outer port structures, with Table Bay. Therefore disturbances associated with the proposed dredging within the port are considered to be unlikely to exert any cumulative effects on the already compromised ecological functioning of the harbour, or in Table Bay. Further, possible cumulative effects on the natural environment associated with increased shipping in the Table Bay area are firstly likely to be negligible and secondly not discernible within effects already generated by the high shipping traffic. None of these possible effects are considered further here.
Table Bay receives effluents from stormwater flows and rivers draining the urban catchment of Cape Town, the Chevron/Caltex outfall at Milnerton and the Green Point and Robben Island outfalls that discharge primarily domestic effluent. Despite the pollution loads any ecological effects in the subtidal areas of Table Bay would appear to be limited as evidenced by environmental surveys conducted for the Chevron/Caltex outfall (e.g. CSIR 2006b) and the benthos community distributions determined in this assessment (above). Transferring contaminated sediment from the proposed dredge area to one of the candidate dredge spoil dump sites would add to this pollution load. Effects may be expressed at the dredge spoil dump site through long term (> 5 years) modification of benthos community structure or in the build up of contaminants in important components of the local benthic food chain such as mussels. The system wide ecological consequences of this remain unknown, however, and cannot be assessed with any degree of confidence.
The possible cumulative effects of the proposed dredge spoil disposal in Table Bay are rated as:
Nature of impact – Prolonged modification to benthos community structure and function in the dredge spoil disposal site and build up of contaminants in filter feeding mussels in the adjacent intertidal zones on Mouille Point and Robben Island. Extent – Regional Duration – Medium term Intensity – Low Probability – Possible Status of impact – Negative Degree of confidence – Low Significance – Very low Mitigation – None feasible aside from the apparently unwarranted land disposal and or non-development of Ben Schoeman Dock. Cumulative Impact Assessment Table
Extent Intensity Duration Consequence Probability Significance Status Confidence No
Mitigation Regional
2 Low
1 Medium-
term 2
Low 5
Possible Very Low -ve Low
Mitigation n/a n/a n/a n/a n/a n/a n/a n/a

99
Summary of impact assessments
Impact Extent Intensity Duration Consequence Probability Significance Status Confidence Impact #1: Removal of biological communities in the dredge target areas
Local 1
Medium 2
Short-term 1
Very Low 4
Definite VERY LOW -ve High
With Mitigation n/a n/a n/a n/a n/a n/a n/a n/a Impact #2: Effects of turbid plumes generated by dredging on organisms inhabiting harbour sediments and structures
Local 1
Low 1
Short-term 1
Very Low 3
Possible VERY LOW -ve High
With Mitigation n/a n/a n/a n/a n/a n/a n/a n/a Impact #3: Settlement of material suspended during dredging and alteration of sediment characteristics and effects on sediment biota and ecological processes
Local 1
Low 1
Short-term 1
Very Low 3
Definite VERY LOW -ve High
With Mitigation n/a n/a n/a n/a n/a n/a n/a n/a Impact #4: Remobilisation of contaminants exerts toxic effects on biota outside of the dredge area
Local 1
Low 1
Short-term 1
Very Low 3
Improbable INSIGNIFICANT -ve High
With Mitigation n/a n/a n/a n/a n/a n/a n/a n/a Impact #5: Reductions in dissolved oxygen and effects on harbour biota
Local 1
Low 1
Short-term 1
Very Low 3
Improbable INSIGNIFICANT -ve High
With Mitigation n/a n/a n/a n/a n/a n/a n/a n/a Impact #6: Nutrient release and eutrophication of the harbour water body
Local 1
Low 1
Short-term 1
Very Low 3
Improbable INSIGNIFICANT -ve High
With Mitigation n/a n/a n/a n/a n/a n/a n/a n/a Impact #7: Altered seawater quality through remobilised contaminants by dredging compromising other beneficial uses of the harbour environment
Local 1
Low 1
Short-term 1
Very Low 3
Improbable INSIGNIFICANT -ve High
With Mitigation n/a n/a n/a n/a n/a n/a n/a n/a Impact #8: Importation of alien species by dredgers and associated ecological effects in the harbour
Regional 2
Medium 2
Long-term 3
High 7
Probable HIGH -ve Medium
With Mitigation Regional 2
Medium 2
Long-term 3
High 7
Improbable MEDIUM -ve Medium
Impact #9: The effect of noise from the dredging activities on biological organisms in the harbour
Local 1
Low 1
Short-term 1
Very Low 3
Improbable INSIGNIFICANT -ve High
With Mitigation n/a n/a n/a n/a n/a n/a n/a n/a

100
Impact summary Table (cont.) Impact Extent Intensity Duration Consequence Probability Significance Status Confidence
Impact #10: Effects of dredging in the Ben Schoeman Dock Basin on endangered seabirds
Local 1
Low 1
Short-term 1
Very Low 3
Improbable INSIGNIFICANT -ve High
With Mitigation n/a n/a n/a n/a n/a n/a n/a n/a Impact #11: Mortality to harbour biota from shock waves generated by small parcel blasting to remove rock
Local 1
Low 1
Short-term 1
Very Low 3
Possible INSIGNIFICANT -ve High
With Mitigation Local 1
Low 1
Short-term 1
Very Low 3
Possible INSIGNIFICANT -ve High
Impact #12: Dredge spoil disposal site #1: Depositing discharged dredge spoil may smother benthos on the dredge spoil discharge site and adjacent areas causing benthos mortality and disrupts ecological processes
Local 1
Medium 2
Short-term 1
Very Low 4
Probable VERY LOW -ve High
With Mitigation Local 1
Low 1
Short-term 1
Very Low 3
Possible INSIGNIFICANT Neutral High
Impact #13: Dredge spoil disposal site #2: Depositing discharged dredge spoil may smother benthos on the dredge spoil discharge site and adjacent areas causing benthos mortality and disrupts ecological processes
Regional 2
Medium 2
Medium-term
2
Medium 6
Probable MEDIUM -ve High
With Mitigation None 0
None 0
None 0
Not Significant 0
Improbable INSIGNIFICANT -ve High
Impact #14: Dredge spoil disposal site #1: Trace metal contaminated dredge spoil exerts toxic effects on benthos in the dredge spoil dump area and its immediately adjacent area and disrupts ecological processes.
Local 1
Low 1
Short-term 1
Very Low 3
Improbable INSIGNIFICANT -ve High
With Mitigation n/a n/a n/a n/a n/a n/a n/a n/a

101
Impact summary Table (cont.) Impact Extent Intensity Duration Consequence Probability Significance Status Confidence
Impact #15: Dredge spoil disposal site #2: Trace metal contaminated dredge spoil exerts toxic effects on benthos in the dredge spoil dump area and its immediately adjacent area and disrupts ecological processes.
Local 1
Low 1
Short-term 1
Very Low 3
Improbable INSIGNIFICANT -ve High
With Mitigation None 0
None 0
None 0
None 0
Will not occur INSIGNIFICANT Neutral High
Impact #16: Effects of turbidity from dredge spoil on habitats adjacent to dump area(s): Site #1
Local 1
Low 1
Short-term 1
Very Low 3
Improbable INSIGNIFICANT -ve High
With Mitigation n/a n/a n/a n/a n/a n/a n/a n/a Impact #17: Effects of turbidity from dredge spoil on habitats adjacent to dump area(s): Site #2
Regional 2
Medium 2
Short-term 1
Low 5
Probable LOW -ve Medium
With Mitigation None 0
None 0
None 0
None 0
Will not occur INSIGNIFICANT Neutral High
Impact #18: Reductions in of water column oxygen concentration in spoil dump area(s) and effects on biological communities
Local 1
Low 1
Short-term 1
Very Low 3
Improbable INSIGNIFICANT -ve High
With Mitigation n/a n/a n/a n/a n/a n/a n/a n/a Impact #19: Effects of turbidity from dredge spoil on habitats in the Table Mountain MPA and/or the Robben Island exclusion zone: Site #1
Regional 2
Low 1
Short-term 1
Very Low 4
Possible INSIGNIFICANT -ve Medium
With Mitigation Regional 2
Low 1
Short-term 1
Very Low 4
Improbable INSIGNIFICANT -ve High
Impact #20: Effects of turbidity from dredge spoil on habitats in the Table Mountain MPA and/or the Robben Island exclusion zone: Site #2
Regional 2
Medium 2
Short-term 1
Low 5
Probable LOW -ve Medium
With Mitigation None 0
None 0
None 0
None 0
Will not occur INSIGNIFICANT Neutral High
Impact #21: Elevated turbidity affects inter and shallow subtidal biota in the Table Mountain MPA
Local 1
Low 1
Short-term 1
Very Low 3
Improbable INSIGNIFICANT -ve High
With Mitigation n/a n/a n/a n/a n/a n/a n/a n/a
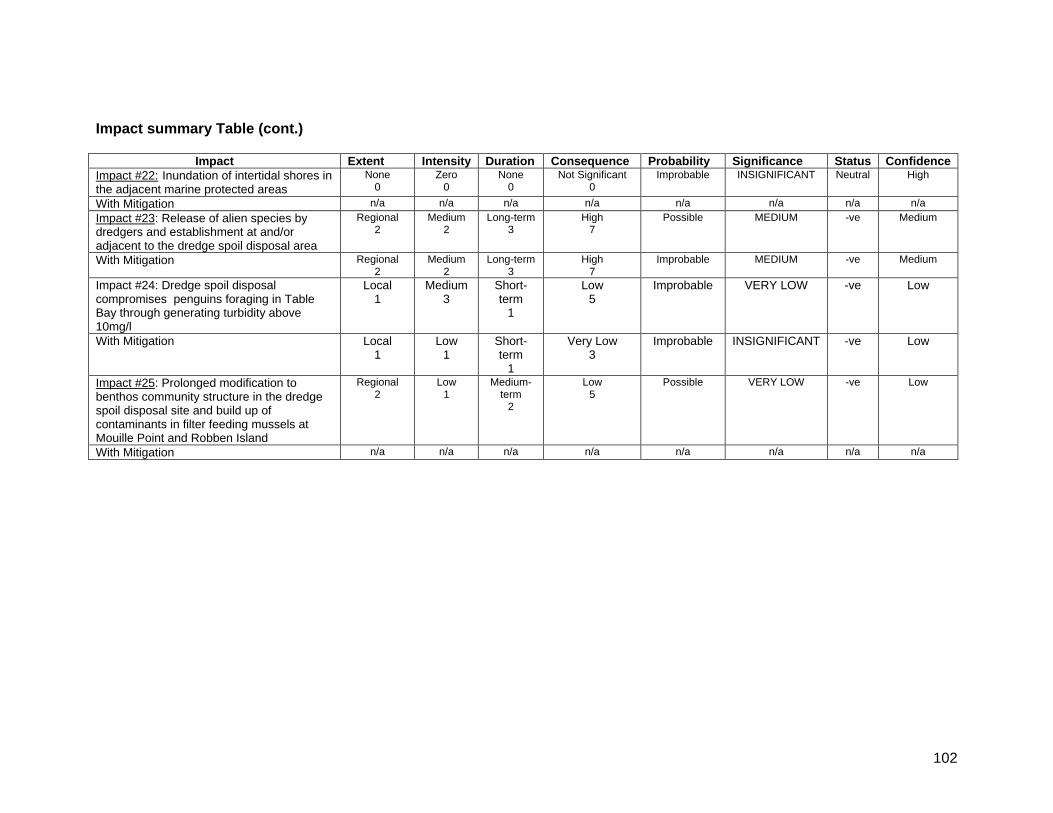
102
Impact summary Table (cont.)
Impact Extent Intensity Duration Consequence Probability Significance Status Confidence Impact #22: Inundation of intertidal shores in the adjacent marine protected areas
None 0
Zero 0
None 0
Not Significant 0
Improbable INSIGNIFICANT Neutral High
With Mitigation n/a n/a n/a n/a n/a n/a n/a n/a Impact #23: Release of alien species by dredgers and establishment at and/or adjacent to the dredge spoil disposal area
Regional 2
Medium 2
Long-term 3
High 7
Possible MEDIUM -ve Medium
With Mitigation Regional 2
Medium 2
Long-term 3
High 7
Improbable MEDIUM -ve Medium
Impact #24: Dredge spoil disposal compromises penguins foraging in Table Bay through generating turbidity above 10mg/l
Local 1
Medium 3
Short-term
1
Low 5
Improbable VERY LOW -ve Low
With Mitigation Local 1
Low 1
Short-term
1
Very Low 3
Improbable INSIGNIFICANT -ve Low
Impact #25: Prolonged modification to benthos community structure in the dredge spoil disposal site and build up of contaminants in filter feeding mussels at Mouille Point and Robben Island
Regional 2
Low 1
Medium-term
2
Low 5
Possible VERY LOW -ve Low
With Mitigation n/a n/a n/a n/a n/a n/a n/a n/a
103
7 CONCLUSIONS AND RECOMMENDATIONS This specialist study assessed the potential environmental impacts of the proposed dredging and dredge spoil dumping on the marine ecology of the Table Bay region. The assessment was based on:
o A project description provided by the proponent (Transnet) o The available scientific and technical literature describing the ecology of the
region o Detailed sediment property measurements in the proposed dredge area o A detailed survey of sediment properties and benthic macrofauna distributions in
two candidate dredge spoil dump sites identified as part of this study in outer Table Bay, and
o Simulation modelling predictions of dredging induced turbidity plume behaviour provided by Van Ballegooyen et al. (2006).
The study identified 25 separate impacts and rated these according to guidelines provided by SRK Consulting, the lead consultant for the study. The significance of 21 of the 25 impacts was rated as very low or insignificant and therefore did not warrant mitigation. Of the remaining four rated at low, medium or higher significance levels two were reduced to insignificant through mitigation, the other two remaining at medium significance levels. By definition these latter two should influence the decision regarding the proposed dredging and spoil disposal activities. The impacts rated at low, medium or high significance pre-mitigation were:
o Importation of alien species to the harbour area by dredgers and associated ecological effects: rated as highly significant
o Discharge of dredge spoil to candidate dredge spoil disposal site #2 and effects on benthos: rated as medium significance,
o Discharge of dredge spoil to candidate dredge spoil disposal site #2 compromises water quality in the Table Mountain MPA and the Robben Island exclusion zone with deleterious effects on biota, rated as low significance, and
o Release of alien species at the dredge spoil disposal site(s) and their establishment in Table Bay: rated as medium significance.
The mitigation recommended for the potential impacts related to the importation of alien species into the dredge area or dredge spoil disposal site(s) cannot totally remove the risk although it can reduce these to a large degree. However, even at a low risk the consequences of the establishment of alien species are serious if they become invasive. Therefore, in these cases, mitigation reduces the probability of the risk occurring but not the magnitude of the potential consequences should the risk be realised. The mitigation recommended for the impacts of dredge spoil on the benthos of candidate dredge spoil disposal site #2 and possible effects in the Table Mountain MPA and the Robben Island exclusion zone is not to use this site for spoil dumping. This obviously reduces the significance rating of this impact to insignificant. Dredge spoil dumping at dump site #1 from Cutter Suction dredger operations in winter may also generate adverse effects in the Table Mountain MPA, but these were rated as being insignificant, due to the small area that may be impacted. It is apparent that these effects may be

104
mitigated by ensuring that the Cutter Suction phase of the dredging is conducted in the summer months. Another important issue is the possible effects of the proposed project on African penguins foraging in Table Bay. The evaluation of the predicted effects yielded a low significance rating but public perceptions merit serious attention being given to efforts to ameliorate any possible impacts. The need for these should be assessed from further simulation modelling analyses of the life cycles and distributions of dredge spoil dump site surface layer turbidity plumes throughout the various phases of the dredging programme. This may lead to mitigation solutions based on timing of the various phases of dredging and spoil dumping. These refinements could not be identified in the current assessments due to the robust but coarse approach of using 'worst case' scenarios and the unavailability of plume dissipation rate estimates at the time of compilation. Monitoring and measurement This assessment is founded on known and predicted behaviour of dredging induced plumes, proven toxicity concentration limits, applicable water and sediment quality guidelines and measured distributions of key elements of the environment in the dredge and candidate dredge spoil dump sites. Basic to the conclusions reached on potential toxicity effects are measurements of potential remobilisation of trace metal contaminants in the sediments targeted for dredging. The remobilisation factors determined here compare with those inferable from other studies on contaminated sediments. However, surety would be improved with further elutriation tests on the targeted sediments to bolster the information available on this issue. The model simulations predicted that the dredging induced turbidity plumes would be contained within Ben Schoeman Dock and not impinge on the beneficial use areas of the V&A waterfront, or escape into the wider Table Bay. The former should be monitored through filter performance levels at the Two Oceans Aquarium and the latter through real time monitoring (instrumented buoy and telecommunication system) located near the entrance to the harbour. The buoy system would also allow real time control of the dredging operations in terms of limiting exceedances of critical suspended sediment concentrations such as those envisaged in EMBECOM (2004). DEAT/MCM operate a mussel watch programme that incorporates sampling points around the Port of Cape Town. Sampling intervals in this programme have been and should be six months. During the dredging period requests should be made for monthly coverage to show short term effects, if any, of remobilised contaminants in filter feeders. This monitoring can be augmented by suspension of mussels adjacent to the selected dredge spoil dump site to confirm that released or remobilised contaminants are below any level of concern. Finally, the survey data gained on the candidate dump sites in this study needs to be utilised in tracking changes associated with dredge spoil dumping over a realistic time span to show rates of benthos recovery and provide information on dumped dredge spoil behaviour. Opportunities for this have not been created in the past and the baseline data set will be an invaluable tool in understanding the effects and implications of the marine disposal of dredge spoil on South Africa's inner continental shelf.

105
8 REFERENCES Awad A., C. Clarke, L. Greyling, R. Hilliard, Polglaze and S. Raaymakers 2004. Ballast
Water Risk Assessment, Port of Saldanha Bay, Republic of South Africa, November 2003: Final Report. GloBallast Monograph Series No. 13. IMO London
Bally R. 1983. Intertidal zonation on sandy beaches of the West Coast of South Africa. Cahiers de Biologie Marine 24: 85-103.
Bally R. 1987. The ecology of sandy beaches of the Benguela ecosystem. S. Afr. J. Mar. Sci. 5: 759-770.
Barnes K.N. 2000 (Ed). The Eskom Red Data Book of Birds of South Africa, Lesotho and Swaziland. Johannesburg, BirdLife South Africa, 169 pp.
BCLME 2004. The development of a common set of water and sediment quality guidelines for the coastal zone of the BCLME. Project BEHP/LBMP/03/04.
Bennett B.A. and C.L. Griffiths 1984. Factors affecting the distribution, abundance and diversity of rock-pool fishes on the Cape peninsula, South Africa. S. Afr. J. Zool. 19: 97-104.
Best P.B. 1981. The status of right whales (Eubalaena glacialis) off South Africa, 1969-1979. Invest. Rep. Sea Fisheries Res. Inst. 123, 44 pp.
Best P.B. 2000. Coastal distribution, movements and site fidelity of Right Whales Eubalaena glacialis off South Africa, 1969-1998. S. Afr. J. mar. Sci. 22: 43-55.
Best P.B. and G.J.B. Ross 1989. Whales and whaling In: Payne A.I.L. and R.J.M. Crawford (eds) Oceans of Life off Southern Africa, Cape Town, Vlaeberg, pp315-338.
Bolton J.J. and H. Stegenga 2002. Seaweed species diversity in South Africa. S. Afr. J. mar. Sci. 24: 9-18.
Branch G.M. and C.L. Griffiths 1988. The Benguela ecosystem part V: the coastal zone. Oceanogr. and Mar. Biol. Ann. Rev. 26: 395-486.
Brown P.C., Painting, S.J. and K.L. Cochrane 1991. Estimates of phytoplankton and bacterial biomass and production in the northern and southern Benguela ecosystems. S. Afr. J. mar. Sci. 11: 537-564.
Brown S. and E. Warrington 1995. Cape Peninsula mussel watch presentation. Unpublished manuscript, DEAT/MCM.
Bustamante R.H. and G.M. Branch 1996a. Large scale patterns and trophic structure of southern African rocky-shores the roles of geographic variation and wave exposure. J. Biogeogr. 23: 339-351.
Bustamante R.H. and G.M. Branch 1996b. The dependence of intertidal consumers on kelp-derived organic matter on the west coast of South Africa. J. Exp. Mar. Biol. Ecol. 196: 1-28.
Bustamante R.H., Branch, G.M., Eekhout, S., Robertson, B., Zoutendyk, P., Schleyer, M., Dye, A., Hanekom, N., Keats, D., Jurd, M. and C. McQuaid 1995. Gradients of intertidal primary productivity around the coast of South Africa and their relationships with consumer biomass. Oecologia 102: 189-201.
Carter R., Steffani, N. and S. Lane 2003. Strategic Environmental Assessment for the development of the Port of Cape Town: Marine ecological aspects. Prepared for CSIR on behalf of The National Ports Authority. Specialist Consultant in Applied Marine Science, 8 Francolin St. Somerset West, 7130. 56 pp.
CES 2001. Specialist report on the environmental impacts and monitoring guidelines for the land excavation and disposal, marine dredging and marine disposal

106
operations at Coega Port. Prepared for Coega Development Corporation, Port Elizabeth, South Africa. 105pp + Appendices.
Chapman P. and L. V. Shannon 1985 The Benguela Ecosystem. Part II. Chemistry and related processes. Oceanogr. Mar. Biol. Ann. Rev., 23: 183-251.
Christie N.D. 1974. Distribution patterns of the benthic fauna along a transect across the continental shelf off Lamberts Bay, South Africa. Ph.D. Thesis, University of Cape Town, 110 pp & Appendices..
Christie N.D. 1976. A numerical analysis of the distribution of a shallow sublittoral sand macrofauna along a transect at Lambert’s Bay, South Africa. Trans. Roy. Soc. S. Afr. 42: 149-172.
Clark B.M. 1997a. Variation in surf zone fish community structure across a wave exposure gradient. Estuarine, Coastal and Shelf Science 44: 659-674.
Clark B.M. 1997b. Dynamics and Utilisation of Surf Zone Habitats by Fish in the South-Western Cape, South Africa. Unpublished PhD Thesis, University of Cape Town.
Clarke KR and RM Warwick 1994. Change in Marine Communities - An approach to statistical analysis and interpretation. Natural Environment Research Council, United Kingdom.
CMS. 1995a. Water quality assessment of Table Bay Harbour. Initial report, prepared by the Centre for Marine Studies, University of Cape Town, for Watermeyer Prestedge Retief, 70 pp.
CMS. 1995b. Water quality assessment of Table Bay Harbour. Summer survey, prepared by the Centre for Marine Studies, University of Cape Town, for Watermeyer Prestedge Retief, 33 pp.
Crawford R. J. M. and H. G. v. D. Boonstra 1994. Counts of moulting and breeding jackass penguins Spheniscus demersus – a comparison at Robben Island, 1988-1993. Mar. Ornithol. 22: 213-219.
Crawford R. J. M. 2006. Closure of areas to purse-seine fishing around St Croix and Dyer Island penguin colonies. Unpublished manuscript, DEAT/MCM, Cape Town. 8pp.
Crawford R. J. M. 1998. African penguin taxon data sheet. In: Penguin Conservation Assessment and Management Plan. Ellis, S., Croxall, J.P. & J. Cooper (Eds.) Apple Valley, USA; IUCN/SSC Conservation Breeding Specialist Group: 115-129.
Crawford R. J. M., S. A. Davis, R. T Harding, L. F. Jackson, T. M. Leshoro, R. M. Meyer, R. M. Randall, L. G. Underhill, L. Upfold, A. P. Van Dalsen, E. Van Der Merwe, P. A. Whittington, A. J. Williams and A. C. Wolfaardt 2000. Initial impact of the Treasure oil spill on seabirds off western South Africa. S. Afr. J. mar. Sci. 22: 157-176.
Crawford R. J. M., L. V. Shannon and D. Pollock 1989. The Benguela Ecosystem. Part IV. The major fish and invertebrate resources. Oceanogr. Mar. Biol. Ann. Rev. 25: 353-505.
CSIR 1992. Turbid water in the Elizabeth Bay region. A review of the relevant literature. CSIR Report EMAS-I 92004.
CSIR 1995a. Turbid water literature review: A supplement to the 1992 Elizabeth Bay study. CSIR Report EMAS-I 95008.
CSIR 1995b. Specialist study on the effects of dredging on marine ecology and mariculture in Saldanha Bay. CSIR Report EMAS-C-96005D
CSIR. 1997. Table Bay sediment study: Phase III. CSIR Report ENV/S-C97085. Prepared for Cape Metropolitan Council. 56 pp + appendices.
CSIR 1998. Assessment of sediment biogeochemical characteristics in the Espirito Santo Estuary-Maputo Bay system in order to devise a low risk dredging-disposal

107
management plan linked to the proposed MOZAL Matola Terminal. CSIR Report ENV/S-I 98047. 39pp.
CSIR 2000. Sediment assessment programme for the Port of Cape Town: 2000. CSIR Report. 12pp.
CSIR 2004. Sediment assessment programme for the Port of Cape Town: 2004. CSIR Report. 21pp + appendix.
CSIR 2005 Sediment assessment programme for the Port of Cape Town: 2005. CSIR Report ENV-S-C2005-064. 25pp + appendix.
CSIR 2006a Extension of the sediment assessment programme for Ben Schoeman Dock in the Port of Cape Town. CSIR Unpublished Data.
CSIR 2006b. Chevron Marine Outfall, Milnerton: Third follow-up chemical and biological monitoring survey of the marine environment, May/June 2006. CSIR Report No.: CSIR/NRE/ECO/ER/2006/0195A&B/C.
De Villiers G. 1975. Growth, population dynamics, a mass mortality and arrangement of white sand mussels, Donax serra, Röding, on beaches in the south-western Cape Province. Invest. Rep. Sea Fisheries Branch No. 109. 31 pp.
DEA&T 1998. Guidelines for the management of dredge spoil in South African Waters, prepared by Dr. L.F Jackson, Marine and Aquatic Pollution Control, Department of Environment Affairs & Tourism, South Africa.
Dichmont C. M., D. S. Butterworth and K.L. Cochrane 2000. Towards adaptive approaches to management of the South African abalone Haliotis midae fishery. S. Afr. J. mar. Sci. 22: 33-42.
Donn T.E. 1990. Zonation patterns of Donax serra Röding (Bivalvia: Donacidae) in Southern Africa. J. Coast. Res. 6: 903-911.
Ellis D.V. 1996. Practical mitigation of the environmental effect of offshore mining. Offshore Technology Conference, Houston Texas, 6-9 May 1996.
Emanuel B.P., R.H. Bustamante, G.M. Branch, S. Eekhout, and F.J. Odendaal 1992. A zoogeographic and functional approach to the selection of marine reserves on the West Coast of South Africa. S. Afr. J. mar. Sci. 12: 341-354.
EMBECOM 2004. Dredging-related re-suspension of sediments: Impacts and guidelines for the marine dredging project. Specialist study for the environmental impact report fro the pre-feasibility phase of the marine dredging project in Namdeb's Atlantic 1 Mining Licence Area and in nearshore areas off Chameis. 72pp.
EPA 2001. Best Practice Environmental Management: Guidelines for Dredging. Environment Protection Authority , Victoria, Australia. Publication #691.
Farquhar M. 1995. Stock assessment and population dynamics of the white mussel, Donax serra. Internal report to Sea Fisheries Research Institute, 19 pp. + 8 Figures.
Field J.G., Griffiths, C.L., Griffiths, R.J., Jarman, N., Zoutendyk, P., Velimirov, B. & A. Bowes 1980. Variation in structure and biomass of kelp communities along the south-western Cape Coast. Trans. Roy. Soc. S. Afr. 44: 145-203.
Field J.G. and C.L. Griffiths 1991. Littoral and sublittoral ecosystems of southern Africa. In: A.C. Mathieson & P.H. Nienhuis (eds). Ecosystems of the World 24. Intertidal and Littoral Ecosystems, Elsevier Science Publishers, Amsterdam.
Findlay K. P., Best P. B., Ross G. J. B. and V. C. Cockroft 1992. The distribution of small odontocete cetaceans off the coasts of South Africa and Namibia. S. Afr. J. Mar. Sci. 12: 237-270.
Geffard O., H. Budzinski, E. His, M. N. L. Seaman and P. Garrigues 2002. Relationships between contaminant levels in marine sediments and their biological effects on embryos of oysters, Crassostrea gigas. Environ. Toxicol. Chem. 21(11): 2310-2318.
108
Glassom D., K. Prochazka and G.M. Branch 1997. Short-term effects of an oil spill on the West Coast of the Cape Peninsula, South Africa. J. Coastal Cons. 3: 155-168.
Gray JS and TH Pearson 1982. Objective selection of sensitive species indicative of pollution-induced change in benthic communities. 1. Comparative methodology. Mar. Ecol. Prog. Ser., 9: 111-119.
Griffiths C. L., Kruger, L. M. and C. Ewart Smith 1996. First record of the sea anemone Metridium senile from South Africa. S. Afr. J. Zool. 31: 157-158.
Griscom S. B. and N. S. Fisher 2004 Bioavailability of sediment bound metals to marine bivalve molluscs: An overview. Estuaries 27(5): 826-838.
Hall S.J. 1994. Physical disturbance and marine communities: life in unconsolidated sediments. Oceanography and Marine Biology: an Annual Review 32: 179-239.
Harris J.M., Branch, G.M., Elliott, B.L., Currie, B., Dye, A.H., McQuaid, C.D., Tomalin, B.J. & C. Velasquez 1998. Spatial and temporal variability in recruitment of intertidal mussels around the coast of southern Africa. S. Afr. J. Zool. 33: 1-11.
Hazell R.W.A., Schoemann, D.S. & M.N. Noffke 2002. Do fluctuations in the somatic growth of rock lobster (Jasus lalandii) encompass all size classes? A re-assessment of juvenile growth. Fish. Bull. 100: 510-518.
Hill P.S., Sherwood, C.R., Sternberg, R.W. & A.R.M. Nowell 1994. In situ measurements of particle settling velocity on the northern California continental shelf. Continental Shelf Research 14(10/11): 1123-1138.
Hockey P. A. R. and C. von Erkom Schurink 1992. The invasive biology of the mussel Mytilus galloprovincialis on the southern African coast. Trans. R. Soc. S. Afr., 48: 123-139.
Huggett J. and C. L. Griffiths 1986. Some relationships between elevation, physico-chemical variables and biota of intertidal rock pools. Mar. Ecol. Prog. Ser. 29: 189-197.
Hutchings L., Pillar, S.C. & H.M. Verheye 1991. Estimates of standing stock, production and consumption of meso- and macrozooplankton in the Benguela ecosystem. S. Afr. J. mar. Sci. 11: 499-512.
IUCN 2000. IUCN Red List categories. Ver. 3.1. IUCN SSC, Gland, Switzerland Jaramillo E., McLachlan, A., & J. Dugan 1995. Total sample area and estimates of
species richness in exposed sandy beaches. Mar. Ecol. Prog. Ser. 119: 311-314. Keevin TM and GLH Hempen 1997. Underwater explosions with methods to mitigate
impacts. US Army Corps of Engineers. St Louis, Missouri. Klages N. T. W., E. E. Campbell and P-P Steyn 2006. Port of Ngqura marine
biomonitoring programme. Summer 2005/2006. Integrated Environmental & Coastal Management Report C138: 41pp
Kruger L. M. & C. L. Griffiths 1998. Sea anemones as secondary consumers on rocky shores in the south-western Cape, South Africa. J. Nat. Hist. 32: 629-644.
Lane S. B. and R.A. Carter 1999. Generic environmental management programme for marine diamond mining off the west coast of South Africa. Marine Diamond Mines Association, Cape Town, South Africa. 6 Volumes.
Lwandle Technologies (Pty) Ltd 2006. Ben Schoeman Dock Berth Deepening: Sediment and benthos field data and initial distribution analyses for candidate dredge spoil dump sites in Table Bay. Electronic Report 06-35A
Macdonald DD, RS Carr, FD Calder, ER Long and Cg Ingersoll 1996. Development and evaluation of sediment quality guidelines for Florida coastal waters. Ecotoxicology 5: 253-278.
Maurer D, RT Keck, JC Tinsman and WA Leathem 1980. Vertical migration and mortality of benthos in dredged material – Part 1: Mollusca. Marine Environmental

109
Research 4: 299-319. Maurer D, RT Keck, JC Tinsman and WA Leathem 1981. Vertical migration and mortality
of benthos in dredged material – Part 2: Crustacea. Marine Environmental Research 5: 301-317.
Maurer D, RT Keck, JC Tinsman and WA Leathem 1982. Vertical migration and mortality of benthos in dredged material – Part 3: Polychaeta. Marine Environmental Research 6: 49-68.
Mayfield S. and G.M. Branch 1999. Assessment of rock lobster (Jasus lalandii) sanctuaries and their implications for the rock-lobster resource. Internal report to MCM.
Mayfield S. 1998. Assessment of predation by the West Coast rock lobster (Jasus lalandii): relationships among growth rate, diet and benthic community composition, with implications for the survival of juvenile abalone (Haliotis midae). Unpublished PhD Thesis, Zoology Department, University of Cape Town, 213 pp.
McArdle S.B. and A. McLachlan 1991 Dynamics of the swash zone and effluent line on sandy beaches. Mar. Ecol. Prog. Ser. 76: 91-99.
McLachlan A., Jaramillo, E., Donn, T.E. and F. Wessels 1993. Sandy beach macrofauna communities and their control by the physical environment: a geographical comparison. J. coastal Res. Spec. Issue 15: 27-38.
McQuaid C.D. and G.M. Branch 1984. Influence of sea temperature, substratum and wave exposure on rocky intertidal communities: an analysis of faunal and floral biomass. Mar. Ecol. Prog. Ser. 19: 145-151
McQuaid C.D., Branch, G.M. and A.A. Crowe 1985. Biotic and abiotic influences on rocky intertidal biomass and richness in the southern Benguela region. S. Afr. J. Zool. 20: 115-122.
MGU 2006. Geophysical survey cruise and data quality report of proposed dredge spoil dumpsites off Cape Town, Council for Geoscience Report No. 2006-0311, 17pp + charts.
Muller B and A. Duffek 2001 Similar adsorption parameters for trace metals with different aquatic particles. Aquatic Geochemistry 7: 107-206.
Nel P. 1995. The effects of sand particle size on beach fauna. MSc Thesis, University of Port Elizabeth.
Newell R.C., Seiderer, L.J. and Hitchcock, D.R. 1998 The impact of dredging works in coastal waters: a review of the sensitivity to disturbance and subsequent recovery of biological resources on the seabed. Oceanography and Marine Biology: an Annual Review 36: 127-178.
Orren M.J., Eagle, G.A., Fricke, A.H., Greenwood, P.J. and H.F.-K.O Hennig & P.D. Bartlet 1981b. Preliminary pollution surveys around the south-western Cape Coast. Part 4: Salt River mouth, Table Bay. S. Afr. J. Sci. 77: 183-188.
Pitcher G.C. and D. Calder 2000. Harmful algal blooms of the southern Benguela Current: a review and appraisal of monitoring from 1989 to 1997. S. Afr. J. Mar. Sci. 22: 255-284.
Prochazka K. and C.L. Griffiths 1992. The intertidal fish fauna of the West Coast of South Africa- species, community and biogeographic patterns. S. Afr. J. of Zool. 27: 115-120.
Prochazka K. 1994. Habitat partitioning in shallow-water cryptic ichthyofaunal communities in the western and southwestern Cape, South Africa. Unpublished PhD Thesis, University of Cape Town, South Africa.

110
Protekon 2006. Port of Cape Town container terminal expansion project: Geotechnical report. August 2006. Submitted to National Ports Authority of South Africa. 28pp + appendices.
Pulfrich A. and C.L. Griffiths 1988. The fishery for hottentot Pachymetopon blochii val. in the south-western Cape. S. Afr. J. mar. Sci. 2: 227-241.
Quick A.J.R. and M.J. Roberts 1993. Table Bay, Cape Town, South Africa: synthesis of available information and management implications. S. Afr. J. Sci. 89: 276-287.
Richards R. and T. Du Pasquier 1989. Bay whaling off southern Africa, c. 1785-1805. S. Afr. J. mar. Sci. 8: 231-250.
Robinson TB, CL Griffiths, CD McQuaid and M Rius 2005. Marine alien species of south Africa – Status and impacts. Afr. J. Mar. Sci. 27(1): 297-306.
Shaughnessy P.D. 1984. Historical population levels of seals and seabirds on islands off southern Africa, with special reference to Seal Island, False Bay. Investigational Report, Sea Fisheries Research Institute 127, 61 pp.
Schoonees J.S. 2006. Dredge disposal options for the deepening of the Port of Cape Town. ENTECH Report No.: EN/CO/205506/2/April 2006.
Shannon L. V. 1985. The Benguela ecosystem Part 1. Evolution of the Benguela, physical features and processes. Oceanogr. Mar. Biol. Ann. Rev., 23: 105-182.
Shannon L.V. and S. C. Pillar. 1986. The Benguela Ecosystem Part 3. Plankton. Oceanogr. Mar. Biol. Ann. Rev. 24: 65-170
Smith G.G., Dunkley, E. and C. Soltau 2000. Shoreline response to harbour developments in Table Bay. 27th International Conference on Coastal Engineering, Conference Proceedings, Coastal Engineering 3: 2822-2835.
Soares A. G., T. A. Schlacher, and A. Mclachlan. 1997. Carbon and nitrogen exchange between sandy beach clams (Donax serra) and kelp beds in the Benguela coastal upwelling region. Mar. Biol. 127: 657-664.
Sokal R.R. and F.J. Rohlf 1995. Biometry: The Principles and Practice of Statistics in Biological Research. Third Edition. W.H. Freeman and Company, New York. 887pp.
SRK (2006) Proposed alterations to berths 601, 602, 603 and 604 and associated deepening of the Ben Schoeman Dock at the Port of Cape Town: Plan of Study for EIA, SRK Consulting Report Prepared for Transnet Limited, Report No: 367079/1, August 2006, 26 pp.
Steffani C.N. and G.M. Branch 2003. Spatial comparisons of populations of an indigenous limpet Scutellastra argenvillei and an alien mussel Mytilus galloprovincialis along a gradient of wave energy. S. Afr. J. mar. Sci. 25: 195-212.
Steffani N., A. Pulfrich, R. Carter and S Lane 2003. Environmental impact assessment for the expansion of the container terminal stacking area at the Port of Cape Town – Marine ecological aspects. Prepared for CSIR on behalf of Transnet. 64pp.
Tarr R.J.Q. 2000. The South African abalone (Haliotis midae) fishery: a decade of challenges and change. In: Workshop on Rebuilding Abalone Stocks in British Columbia. Campbell, A. (ed.) Can. Spec. Publ. Fish. Aquat. Sci. 130: 32-40.
Van Ballegooyen, R.C., G. Diedericks, N. Weitz, S. Bergman and G. Smith, 2006. Ben Schoeman Dock Berth Deepening Project: Dredging and Disposal of Dredge Spoil Modelling Specialist Study, CSIR Report No.: CSIR/NRE/ECO/ER/2006/Draft.
Van der Lingen CD, JC Coetzee, H Demarcq, L Drapeau, TP Fairweather and L Hutchings 2005. An eastward shift in the distribution of southern Benguela sardine. Globec International Newsletter 11(2): 17-22.

111
Van Erkom Schurink C. and C.L. Griffiths 1990. Marine mussels of southern Africa – their distribution patterns, standing stocks, exploitation and culture. J. Shellfish Res. 9: 75-85.
Velimirov B., Field, J.G., Griffiths, C.L. and P. Zoutnedyk 1977. The ecology of kelp bed communities in the Benguela upwelling system: analysis of biomass and spatial distribution. Helgo. Wiss. Meeresunters. 30: 495-518.
Whiteside P.G.D., Ooms, K. and G.M. Postma 1995. Generation and decay of sediment plumes from sand dredging overflow. Proceedings of the 14th World Dredging Congress. Amsterdam, The Netherlands: World Dredging Association (WDA): 877-892.
Wickens P. 1994. Interactions between South African fur seals and the purse-seine fishery. Mar. Mamm. Sci. 10: 442-457.
Woodborne M.W. 1983. Bathymetry, solid geology and Quaternary sedimentology of Table Bay. Joint GSO/UCT Mar. Geol. Prof. Tech. Rep. 14: 266-277. Geology Department, University of Cape Town.