Embed Size (px)
Citation preview
The hotel benchmark report provides a monthly performance overview of leading hotels in the Middle East. The hotel set includes international branded and operated properties across the 5 star and 4 star segment.
BenchmarkMiddle East Hotel Benchmark Survey Report April 2013
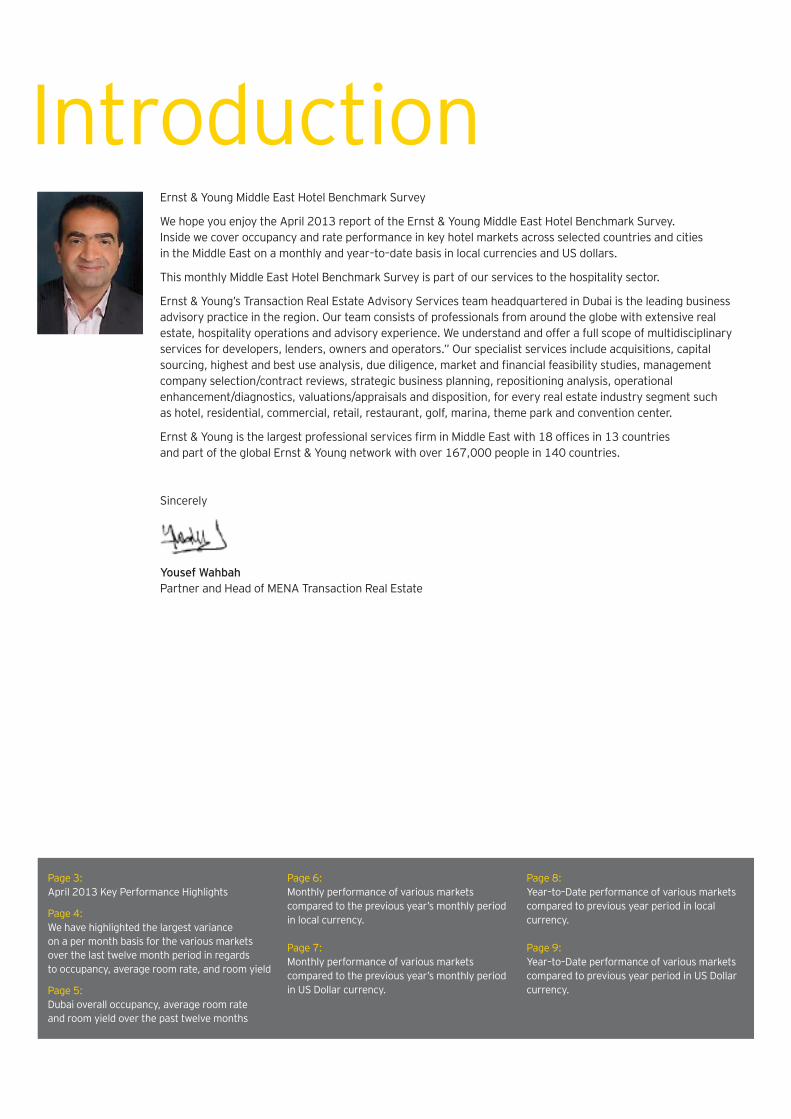
IntroductionErnst & Young Middle East Hotel Benchmark Survey
We hope you enjoy the April 2013 report of the Ernst & Young Middle East Hotel Benchmark Survey. Inside we cover occupancy and rate performance in key hotel markets across selected countries and cities in the Middle East on a monthly and year–to–date basis in local currencies and US dollars.
This monthly Middle East Hotel Benchmark Survey is part of our services to the hospitality sector.
Ernst & Young’s Transaction Real Estate Advisory Services team headquartered in Dubai is the leading business advisory practice in the region. Our team consists of professionals from around the globe with extensive real estate, hospitality operations and advisory experience. We understand and offer a full scope of multidisciplinary services for developers, lenders, owners and operators.” Our specialist services include acquisitions, capital sourcing, highest and best use analysis, due diligence, market and financial feasibility studies, management company selection/contract reviews, strategic business planning, repositioning analysis, operational enhancement/diagnostics, valuations/appraisals and disposition, for every real estate industry segment such as hotel, residential, commercial, retail, restaurant, golf, marina, theme park and convention center.
Ernst & Young is the largest professional services firm in Middle East with 18 offices in 13 countries and part of the global Ernst & Young network with over 167,000 people in 140 countries.
Sincerely
Yousef Wahbah Partner and Head of MENA Transaction Real Estate
Page 3:April 2013 Key Performance Highlights
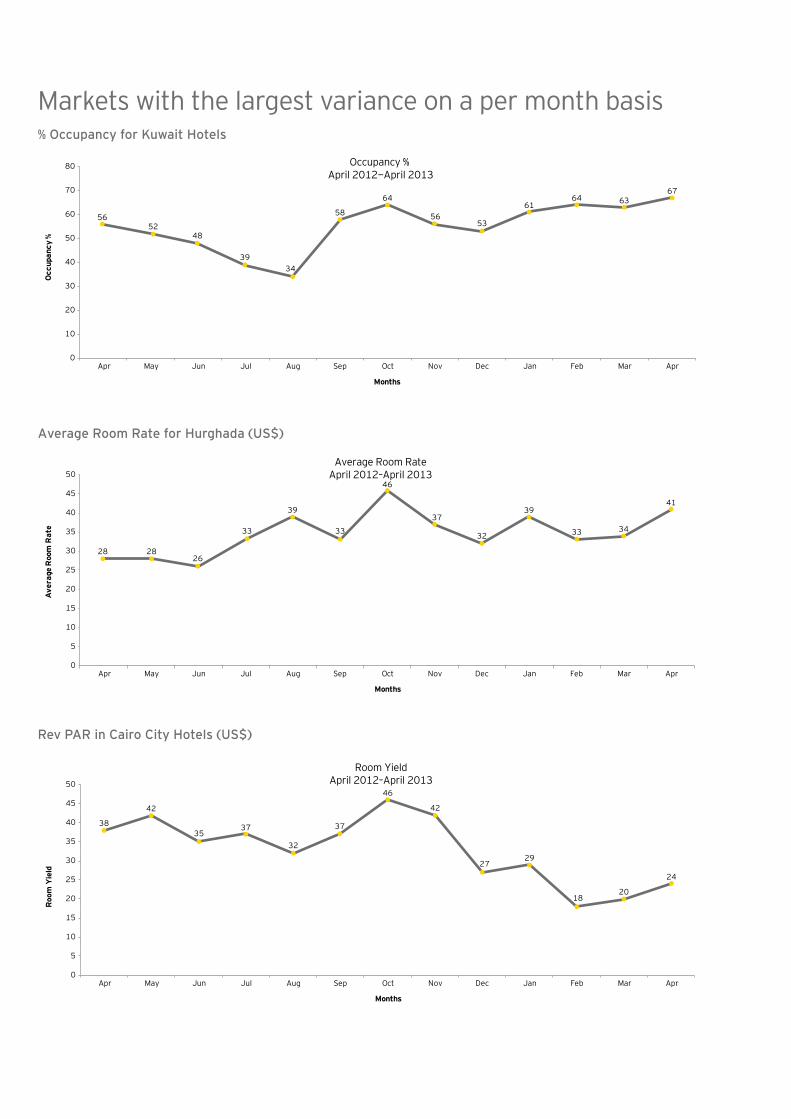
Page 4:We have highlighted the largest variance on a per month basis for the various markets over the last twelve month period in regards to occupancy, average room rate, and room yield
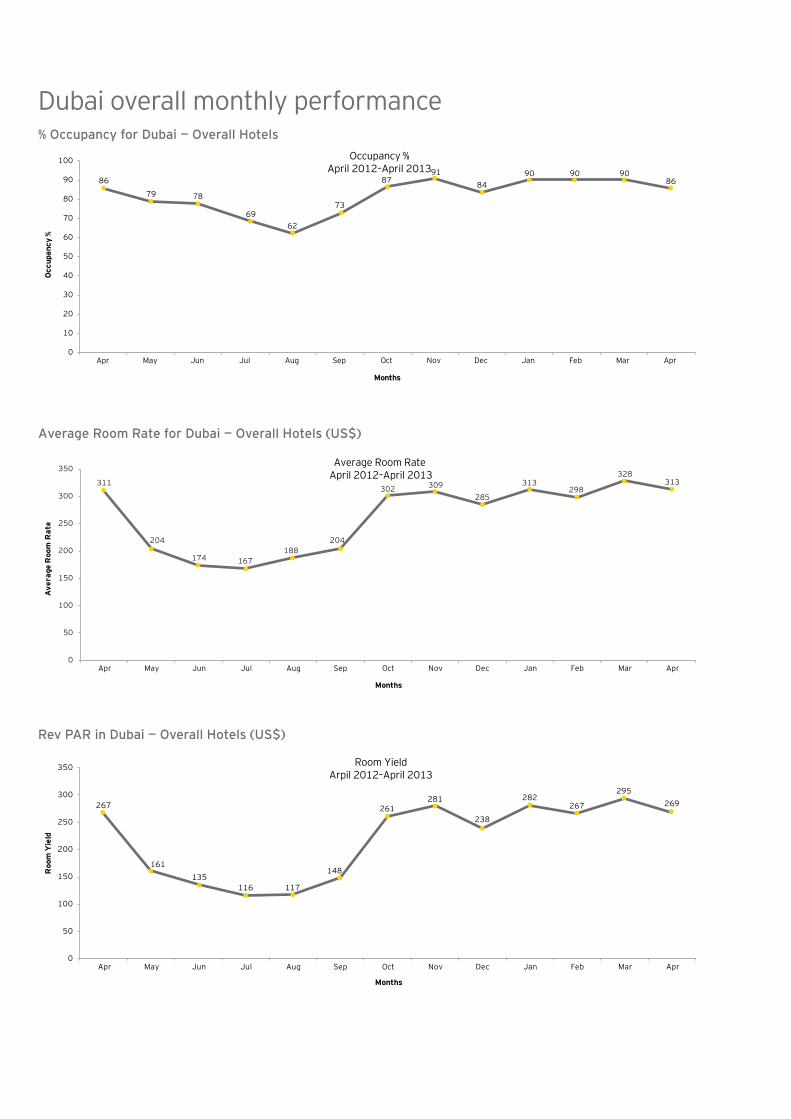
Page 5:Dubai overall occupancy, average room rate and room yield over the past twelve months
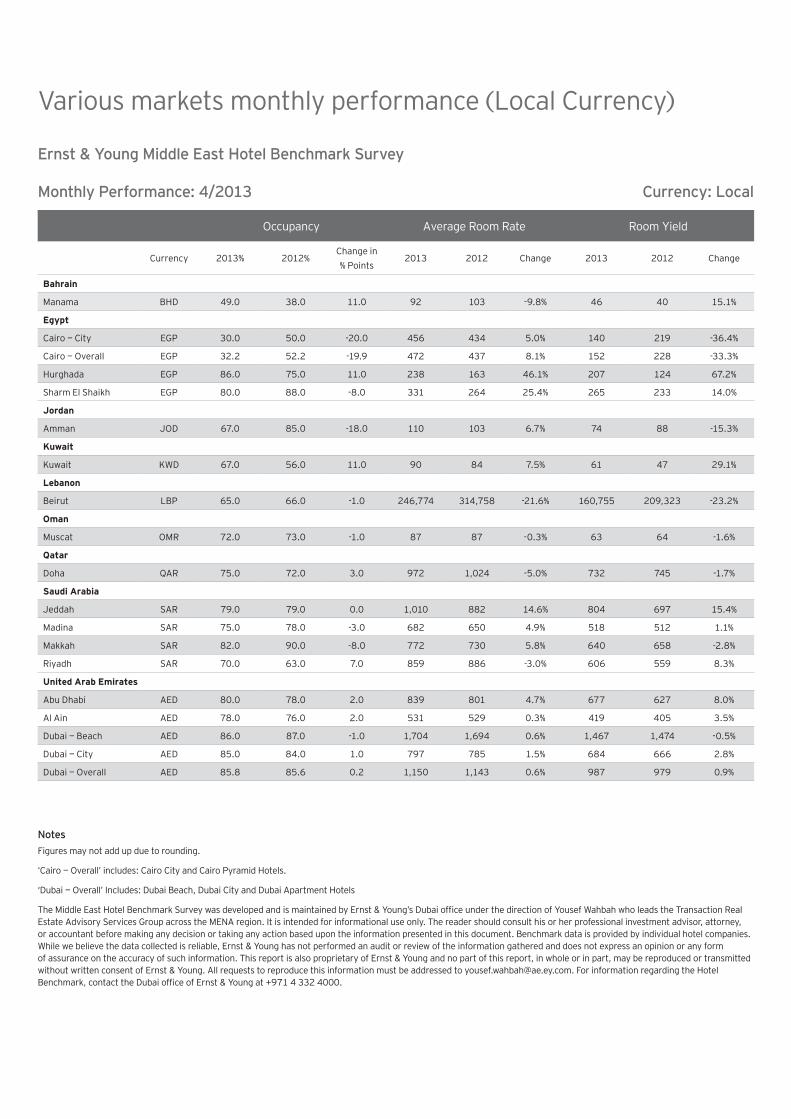
Page 6:Monthly performance of various markets compared to the previous year’s monthly period in local currency.
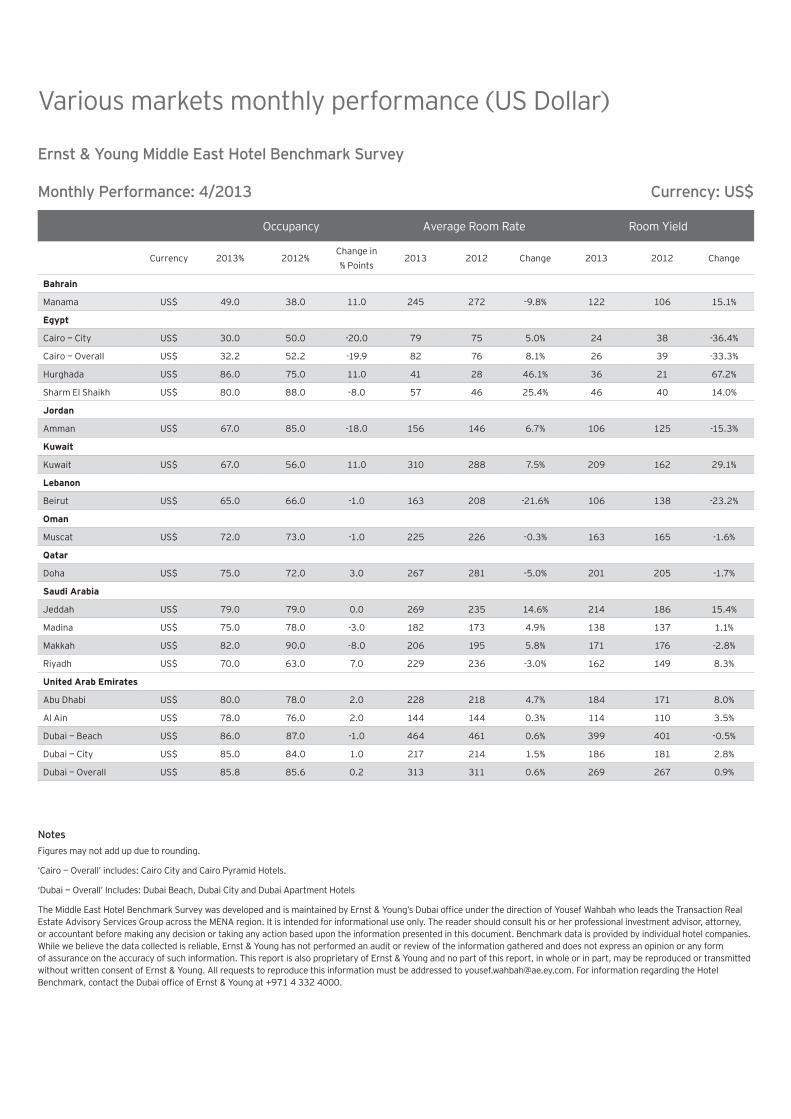
Page 7:Monthly performance of various markets compared to the previous year’s monthly period in US Dollar currency.
Page 8:Year–to–Date performance of various markets compared to previous year period in local currency.
Page 9:Year–to–Date performance of various markets compared to previous year period in US Dollar currency.
Q1 2013 & April 2013 Key Performance Highlights
Hurghada’s hospitality market has registered the strongest growth in RevPAR through Q1 2013, as compared to Q1 2012 of the countries surveyed within MENA• During Q1 2013, the Hurghada hospitality market witnessed a considerable increase in RevPAR when compared to last year.
Q1 2013 was a positive period for both Hurghada and Sharm El Shaikh as they both achieved REVPAR growth of 60% and 33% respectively over the same period last year.
• The Hurghada hotel market has continued its upward trend on last year’s performance with occupancy growing 11% in April 2013 compared to April 2012, coupled with a substantial increase in average room rate of 46.1% over last year.
• Kuwait City’s hospitality market witnessed an increase in both occupancy and average room rate during the month of April 2013 compared to previous year, due to a number of events and exhibitions drawing visitors to the city (e.g. Spring Shopping Festival 2013, EGYTIX 2013 and the Asian Hunting & Shooting Exhibition). Average occupancy rose from 56% in April 2012 to 67% in April 2013. This was supported by a 7.5% rise in average room rates from USD 288 in April 2012 to USD 310 in April 2013, resulting in an overall increase in RevPAR of approximately 29% year on year.
Hospitality KPIs for Syria’s neighbors continued to decline throughout Q1 2013• The Syrian conflict has had a significantly negative effect on its neighboring countries’ hospitality markets with no positive outlook
anticipated in the near term.
• GCC Foreign Ministries have issued travel warnings to their citizens currently present in Lebanon to leave the country and urged others to refrain from traveling to Lebanon. GCC nationals historically have represented approximately 40% of tourist spend in Lebanon.
• During Q1 2013, average occupancy in Beirut averaged 56%, a decrease of 10% from Q1 2012, with average room rates decreasing by 23% for the same period.
• In April 2013, Beirut’s average room rate decreased approximately 22% over April last year, with RevPAR declining approximately 23%.
• Jordan’s hospitality market also witnessed a decline in Key Performance Indicators due to the Syrian conflict, with RevPAR through Q1 2013 falling 21% compared to Q1 2012, from USD 116 to USD 92, mainly due to a decrease in average occupancy through Q1 2013 of 22%.
• In April 2013 alone, Jordan witnessed a further decrease in hotel occupancy levels of approximately 18% year on year with RevPAR decreasing by 15%.
• Due to the political instability in parts of Egypt, Cairo’s hospitality market witnessed a downward trend in Q1 2013 compared to Q1 2012, with RevPAR dropping by 10%. Although average room rates increased by 5% through Q1 2013, the decrease in average occupancy of 5% was the primary factor in market’s slight year on year performance drop.
• Through April this year, Cairo’s hotels have continued to experience the same declining trend, showing a decrease in RevPAR of 36% year on year, mainly impacted by a drop in average occupancy of 20% over the same period.
Dubai’s hospitality market witnessed positive growth on all Key Performance Indicators through Q1 2013 compared to the same period last year• During 2012, approximately 3,500 new branded hotel rooms were added to Dubai’s hotel supply, including three major 5-star
hotel openings – Tower 1 JW Marriot Marquis, Rayhaan by Rotana and Fairmont The Palm. An additional 500 branded rooms were introduced during Q1 2013, including Ocean View Hotel and the Ritz Carlton extension on Jumeirah Beach, all within the 4 and 5-star hotel segment. Dubai’s hospitality market has rapidly absorbed this influx of new supply and continues to perform exceptionally well, showing a jump in average room rates from USD 292 to USD 314 and a slight increase of 2% in average occupancy from the same period last year, resulting in an overall increase in RevPAR of 9.7% in Q1 2013 compared to Q1 2012.
• April 2013 saw no change in hotels in Dubai overall, with occupancy levels holding steady at 86% compared to April 2012, even given the notable increase in room supply over the last year.
• April’s average daily rates in Dubai, while nominally lower than March’s rates, still grew by 1% from USD 311 to USD 313 over April 2012. The slight month over month decrease from March to April is in line with the market’s typical seasonality, as tourism inflows begin to slow towards the hot summer months and Ramadan in July.
% Occupancy for Kuwait Hotels
Average Room Rate for Hurghada (US$)
Rev PAR in Cairo City Hotels (US$)
Markets with the largest variance on a per month basis
Occ
upan
cy %
Occupancy % April 2012−April 2013
Months
5652
48
3934
58
64
5653
6164 63
0
10
20
30
40
50
60
70
80
67
Apr May Jun Jul Aug Sep Oct Nov Dec Jan Feb Mar Apr
Ave
rage
Roo
m R
ate
Average Room RateApril 2012–April 2013
Months
28 2826
33
39
33
46
37
32
39
33 34
41
0
5
10
15
20
25
30
35
40
45
50
Apr May Jun Jul Aug Sep Oct Nov Dec Jan Feb Mar Apr
Roo
m Y
ield
Room YieldApril 2012–April 2013
Months
38
42
3537
32
37
46
42
2729
1820
24
0
5
10
15
20
25
30
35
40
45
50
Apr May Jun Jul Aug Sep Oct Nov Dec Jan Feb Mar Apr
Dubai overall monthly performance% Occupancy for Dubai — Overall Hotels
Average Room Rate for Dubai — Overall Hotels (US$)
Rev PAR in Dubai — Overall Hotels (US$)
Months
Ave
rage
Roo
m R
ate
Average Room Rate April 2012–April 2013
311
204
174 167188
204
302 309285
313298
328313
0
50
100
150
200
250
300
350
Apr May Jun Jul Aug Sep Oct Nov Dec Jan Feb Mar Apr
Roo
m Y
ield
Room YieldArpil 2012–April 2013
Months
267
161135
116 117
148
261281
238
282267
295269
0
50
100
150
200
250
300
350
Apr May Jun Jul Aug Sep Oct Nov Dec Jan Feb Mar Apr
Occ
upan
cy %
Occupancy %April 2012–April 2013
Months
86
79 78
6962
73
8791
8490 90
86
0
10
20
30
40
50
60
70
80
90
100
Apr May Jun Jul Aug Sep Oct Nov Dec Jan Feb Mar Apr
90
Occupancy Average Room Rate Room Yield
Currency 2013% 2012%Change in % Points
2013 2012 Change 2013 2012 Change
Bahrain
Manama BHD 49.0 38.0 11.0 92 103 -9.8% 46 40 15.1%
Egypt
Cairo — City EGP 30.0 50.0 -20.0 456 434 5.0% 140 219 -36.4%
Cairo — Overall EGP 32.2 52.2 -19.9 472 437 8.1% 152 228 -33.3%
Hurghada EGP 86.0 75.0 11.0 238 163 46.1% 207 124 67.2%
Sharm El Shaikh EGP 80.0 88.0 -8.0 331 264 25.4% 265 233 14.0%
Jordan
Amman JOD 67.0 85.0 -18.0 110 103 6.7% 74 88 -15.3%
Kuwait
Kuwait KWD 67.0 56.0 11.0 90 84 7.5% 61 47 29.1%
Lebanon
Beirut LBP 65.0 66.0 -1.0 246,774 314,758 -21.6% 160,755 209,323 -23.2%
Oman
Muscat OMR 72.0 73.0 -1.0 87 87 -0.3% 63 64 -1.6%
Qatar
Doha QAR 75.0 72.0 3.0 972 1,024 -5.0% 732 745 -1.7%
Saudi Arabia
Jeddah SAR 79.0 79.0 0.0 1,010 882 14.6% 804 697 15.4%
Madina SAR 75.0 78.0 -3.0 682 650 4.9% 518 512 1.1%
Makkah SAR 82.0 90.0 -8.0 772 730 5.8% 640 658 -2.8%
Riyadh SAR 70.0 63.0 7.0 859 886 -3.0% 606 559 8.3%
United Arab Emirates
Abu Dhabi AED 80.0 78.0 2.0 839 801 4.7% 677 627 8.0%
Al Ain AED 78.0 76.0 2.0 531 529 0.3% 419 405 3.5%
Dubai — Beach AED 86.0 87.0 -1.0 1,704 1,694 0.6% 1,467 1,474 -0.5%
Dubai — City AED 85.0 84.0 1.0 797 785 1.5% 684 666 2.8%
Dubai — Overall AED 85.8 85.6 0.2 1,150 1,143 0.6% 987 979 0.9%
Ernst & Young Middle East Hotel Benchmark Survey
Monthly Performance: 4/2013 Currency: Local
Various markets monthly performance (Local Currency)
NotesFigures may not add up due to rounding.
‘Cairo — Overall’ includes: Cairo City and Cairo Pyramid Hotels.
‘Dubai — Overall’ Includes: Dubai Beach, Dubai City and Dubai Apartment Hotels
The Middle East Hotel Benchmark Survey was developed and is maintained by Ernst & Young’s Dubai office under the direction of Yousef Wahbah who leads the Transaction Real Estate Advisory Services Group across the MENA region. It is intended for informational use only. The reader should consult his or her professional investment advisor, attorney, or accountant before making any decision or taking any action based upon the information presented in this document. Benchmark data is provided by individual hotel companies. While we believe the data collected is reliable, Ernst & Young has not performed an audit or review of the information gathered and does not express an opinion or any form of assurance on the accuracy of such information. This report is also proprietary of Ernst & Young and no part of this report, in whole or in part, may be reproduced or transmitted without written consent of Ernst & Young. All requests to reproduce this information must be addressed to [email protected]. For information regarding the Hotel Benchmark, contact the Dubai office of Ernst & Young at +971 4 332 4000.
Occupancy Average Room Rate Room Yield
Currency 2013% 2012%Change in % Points
2013 2012 Change 2013 2012 Change
Bahrain
Manama US$ 49.0 38.0 11.0 245 272 -9.8% 122 106 15.1%
Egypt
Cairo — City US$ 30.0 50.0 -20.0 79 75 5.0% 24 38 -36.4%
Cairo — Overall US$ 32.2 52.2 -19.9 82 76 8.1% 26 39 -33.3%
Hurghada US$ 86.0 75.0 11.0 41 28 46.1% 36 21 67.2%
Sharm El Shaikh US$ 80.0 88.0 -8.0 57 46 25.4% 46 40 14.0%
Jordan
Amman US$ 67.0 85.0 -18.0 156 146 6.7% 106 125 -15.3%
Kuwait
Kuwait US$ 67.0 56.0 11.0 310 288 7.5% 209 162 29.1%
Lebanon
Beirut US$ 65.0 66.0 -1.0 163 208 -21.6% 106 138 -23.2%
Oman
Muscat US$ 72.0 73.0 -1.0 225 226 -0.3% 163 165 -1.6%
Qatar
Doha US$ 75.0 72.0 3.0 267 281 -5.0% 201 205 -1.7%
Saudi Arabia
Jeddah US$ 79.0 79.0 0.0 269 235 14.6% 214 186 15.4%
Madina US$ 75.0 78.0 -3.0 182 173 4.9% 138 137 1.1%
Makkah US$ 82.0 90.0 -8.0 206 195 5.8% 171 176 -2.8%
Riyadh US$ 70.0 63.0 7.0 229 236 -3.0% 162 149 8.3%
United Arab Emirates
Abu Dhabi US$ 80.0 78.0 2.0 228 218 4.7% 184 171 8.0%
Al Ain US$ 78.0 76.0 2.0 144 144 0.3% 114 110 3.5%
Dubai — Beach US$ 86.0 87.0 -1.0 464 461 0.6% 399 401 -0.5%
Dubai — City US$ 85.0 84.0 1.0 217 214 1.5% 186 181 2.8%
Dubai — Overall US$ 85.8 85.6 0.2 313 311 0.6% 269 267 0.9%
Ernst & Young Middle East Hotel Benchmark Survey
Monthly Performance: 4/2013 Currency: US$
Various markets monthly performance (US Dollar)
NotesFigures may not add up due to rounding.
‘Cairo — Overall’ includes: Cairo City and Cairo Pyramid Hotels.
‘Dubai — Overall’ Includes: Dubai Beach, Dubai City and Dubai Apartment Hotels
The Middle East Hotel Benchmark Survey was developed and is maintained by Ernst & Young’s Dubai office under the direction of Yousef Wahbah who leads the Transaction Real Estate Advisory Services Group across the MENA region. It is intended for informational use only. The reader should consult his or her professional investment advisor, attorney, or accountant before making any decision or taking any action based upon the information presented in this document. Benchmark data is provided by individual hotel companies. While we believe the data collected is reliable, Ernst & Young has not performed an audit or review of the information gathered and does not express an opinion or any form of assurance on the accuracy of such information. This report is also proprietary of Ernst & Young and no part of this report, in whole or in part, may be reproduced or transmitted without written consent of Ernst & Young. All requests to reproduce this information must be addressed to [email protected]. For information regarding the Hotel Benchmark, contact the Dubai office of Ernst & Young at +971 4 332 4000.
Occupancy Average Room Rate Room Yield
Currency 2013% 2012%Change in % Points
2013 2012 Change 2013 2012 Change
Bahrain
Manama BHD 48.0 37.0 11.0 81 89 -8.1% 40 33 21.1%
Egypt
Cairo — City EGP 27.0 35.0 -8.0 487 468 4.0% 132 167 -20.8%
Cairo — Overall EGP 29.0 37.0 -8.0 498 467 6.5% 145 176 -17.5%
Hurghada EGP 70.0 58.0 12.0 214 159 34.8% 151 93 62.5%
Sharm El Shaikh EGP 71.0 71.0 0.0 319 251 27.3% 228 180 26.6%
Jordan
Amman JOD 60.0 81.0 -21.0 111 102 8.9% 67 83 -19.1%
Kuwait
Kuwait KWD 64.0 57.0 7.0 88 84 4.6% 56 48 17.3%
Lebanon
Beirut LBP 58.0 66.0 -8.0 244,795 317,387 -22.9% 142,785 211,242 -32.4%
Oman
Muscat OMR 79.0 78.0 1.0 84 83 1.2% 67 65 3.5%
Qatar
Doha QAR 74.0 71.0 3.0 966 1,004 -3.8% 715 718 -0.5%
Saudi Arabia
Jeddah SAR 77.0 79.0 -2.0 993 888 11.8% 767 703 9.1%
Madina SAR 76.0 74.0 2.0 736 669 10.1% 562 497 13.2%
Makkah SAR 85.0 88.0 -3.0 836 786 6.4% 711 698 1.9%
Riyadh SAR 66.0 62.0 4.0 852 897 -5.0% 564 556 1.3%
United Arab Emirates
Abu Dhabi AED 82.0 80.0 2.0 875 819 6.7% 722 657 9.9%
Al Ain AED 73.0 64.0 9.0 522 550 -5.2% 385 353 8.8%
Dubai — Beach AED 87.0 84.0 3.0 1,597 1,542 3.6% 1,390 1,305 6.5%
Dubai — City AED 89.0 89.0 0.0 879 818 7.5% 791 729 8.5%
Dubai — Overall AED 88.0 87.0 1.0 1,152 1,090 5.6% 1,023 952 7.4%
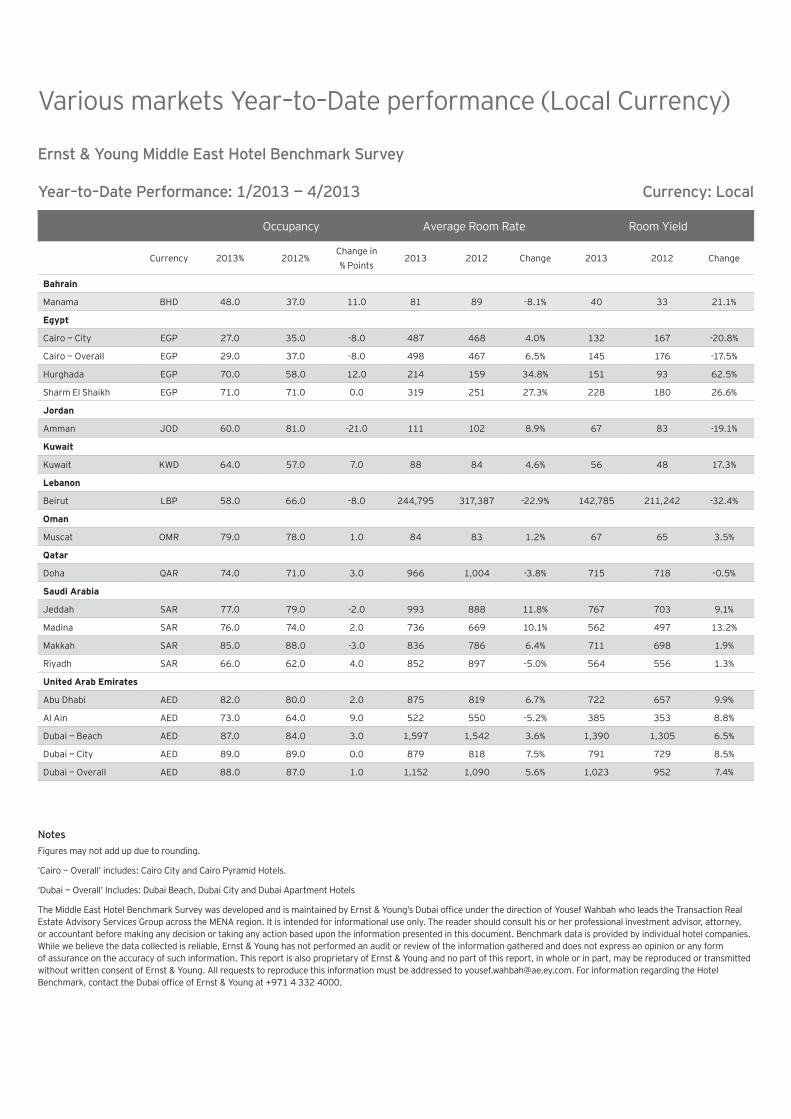
Ernst & Young Middle East Hotel Benchmark Survey
Year–to–Date Performance: 1/2013 — 4/2013 Currency: Local
Various markets Year–to–Date performance (Local Currency)
NotesFigures may not add up due to rounding.
‘Cairo — Overall’ includes: Cairo City and Cairo Pyramid Hotels.
‘Dubai — Overall’ Includes: Dubai Beach, Dubai City and Dubai Apartment Hotels
The Middle East Hotel Benchmark Survey was developed and is maintained by Ernst & Young’s Dubai office under the direction of Yousef Wahbah who leads the Transaction Real Estate Advisory Services Group across the MENA region. It is intended for informational use only. The reader should consult his or her professional investment advisor, attorney, or accountant before making any decision or taking any action based upon the information presented in this document. Benchmark data is provided by individual hotel companies. While we believe the data collected is reliable, Ernst & Young has not performed an audit or review of the information gathered and does not express an opinion or any form of assurance on the accuracy of such information. This report is also proprietary of Ernst & Young and no part of this report, in whole or in part, may be reproduced or transmitted without written consent of Ernst & Young. All requests to reproduce this information must be addressed to [email protected]. For information regarding the Hotel Benchmark, contact the Dubai office of Ernst & Young at +971 4 332 4000.
Occupancy Average Room Rate Room Yield
Currency 2013% 2012%Change in % Points
2013 2012 Change 2013 2012 Change
Bahrain
Manama US$ 48.0 37.0 11.0 216 235 -8.1% 106 87 21.1%
Egypt
Cairo — City US$ 27.0 35.0 -8.0 84 81 4.0% 23 29 -20.8%
Cairo — Overall US$ 29.0 37.0 -8.0 86 81 6.5% 25 30 -17.5%
Hurghada US$ 70.0 58.0 12.0 37 28 34.8% 26 16 62.5%
Sharm El Shaikh US$ 71.0 71.0 0.0 55 43 27.3% 40 31 26.6%
Jordan
Amman US$ 60.0 81.0 -21.0 158 145 8.9% 95 118 -19.1%
Kuwait
Kuwait US$ 64.0 57.0 7.0 300 287 4.6% 193 165 17.3%
Lebanon
Beirut US$ 58.0 66.0 -8.0 162 209 -22.9% 94 139 -32.4%
Oman
Muscat US$ 79.0 78.0 1.0 218 216 1.2% 174 168 3.5%
Qatar
Doha US$ 74.0 71.0 3.0 266 276 -3.8% 197 197 -0.5%
Saudi Arabia
Jeddah US$ 77.0 79.0 -2.0 265 237 11.8% 205 188 9.1%
Madina US$ 76.0 74.0 2.0 196 178 10.1% 150 132 13.2%
Makkah US$ 85.0 88.0 -3.0 223 210 6.4% 190 186 1.9%
Riyadh US$ 66.0 62.0 4.0 227 239 -5.0% 150 148 1.3%
United Arab Emirates
Abu Dhabi US$ 82.0 80.0 2.0 238 223 6.7% 197 179 9.9%
Al Ain US$ 73.0 64.0 9.0 142 150 -5.2% 105 96 8.8%
Dubai — Beach US$ 87.0 84.0 3.0 435 420 3.6% 379 355 6.5%
Dubai — City US$ 89.0 89.0 0.0 239 223 7.5% 215 199 8.5%
Dubai — Overall US$ 88.0 87.0 1.0 314 297 5.6% 279 259 7.4%
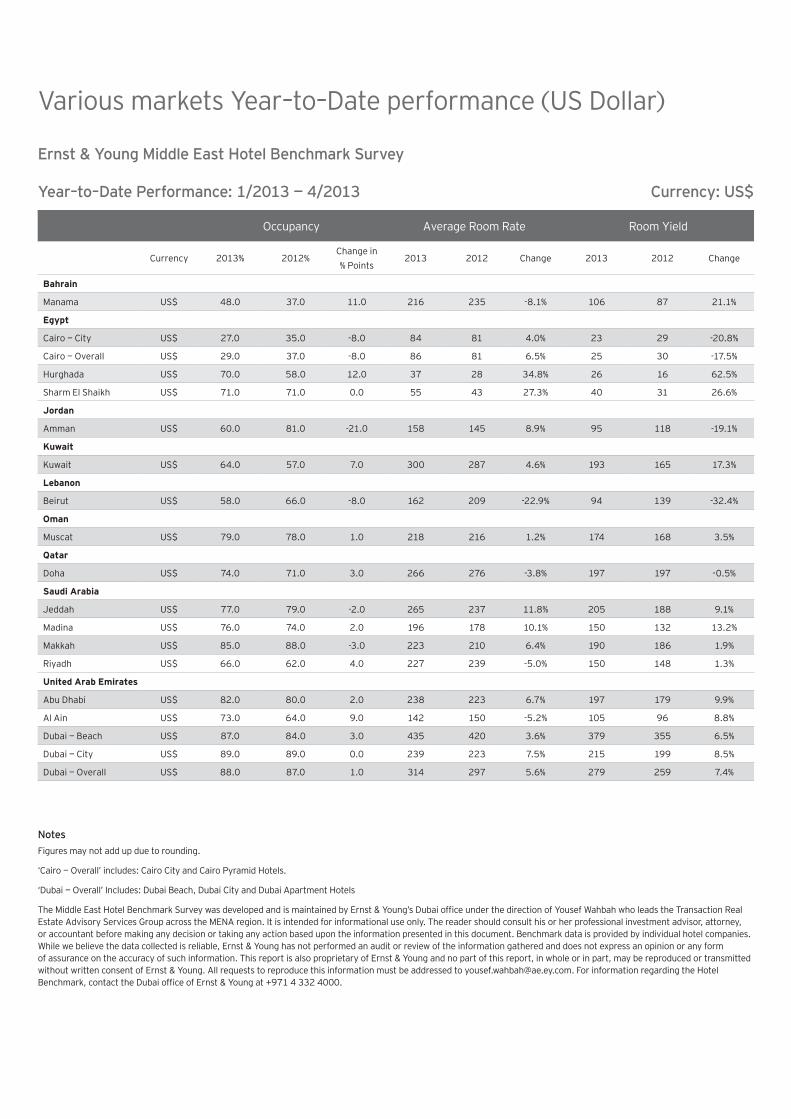
Ernst & Young Middle East Hotel Benchmark Survey
Year–to–Date Performance: 1/2013 — 4/2013 Currency: US$
Various markets Year–to–Date performance (US Dollar)
NotesFigures may not add up due to rounding.
‘Cairo — Overall’ includes: Cairo City and Cairo Pyramid Hotels.
‘Dubai — Overall’ Includes: Dubai Beach, Dubai City and Dubai Apartment Hotels
The Middle East Hotel Benchmark Survey was developed and is maintained by Ernst & Young’s Dubai office under the direction of Yousef Wahbah who leads the Transaction Real Estate Advisory Services Group across the MENA region. It is intended for informational use only. The reader should consult his or her professional investment advisor, attorney, or accountant before making any decision or taking any action based upon the information presented in this document. Benchmark data is provided by individual hotel companies. While we believe the data collected is reliable, Ernst & Young has not performed an audit or review of the information gathered and does not express an opinion or any form of assurance on the accuracy of such information. This report is also proprietary of Ernst & Young and no part of this report, in whole or in part, may be reproduced or transmitted without written consent of Ernst & Young. All requests to reproduce this information must be addressed to [email protected]. For information regarding the Hotel Benchmark, contact the Dubai office of Ernst & Young at +971 4 332 4000.
Ernst & Young
Assurance | Tax | Transactions | Advisory
About Ernst & Young
Ernst & Young is a global leader in assurance, tax, transaction and advisory services. Worldwide, our 167,000 people are united by our shared values and an unwavering commitment to quality. We make a difference by helping our people, our clients and our wider communities achieve their potential.
Ernst & Young refers to the global organization of member firms of Ernst & Young Global Limited, each of which is a separate legal entity. Ernst & Young Global Limited, a UK company limited by guarantee, does not provide services to clients. For more information about our organization, please visit www.ey.com
The MENA practice of Ernst & Young has been operating in the region since 1923. For over 90 years, we have evolved to meet the legal and commercial developments of the region. Across MENA, we have over 4,200 people united across 18 offices and 13 Arab countries, sharing the same values and an unwavering commitment to quality.
For more information, please visit www.ey.com/mena
© 2013 Ernst & Young.All Rights Reserved.
ED None