Embed Size (px)
Citation preview
Nuclear RegulationNEA/CSNI/R(2015)18February 2016www.oecd-nea.org
Benchmark Study of the Accident at the Fukushima Daiichi Nuclear Power Plant (BSAF Project)
Phase I Summary ReportMarch 2015

Unclassified NEA/CSNI/R(2015)18 Organisation de Coopération et de Développement Économiques Organisation for Economic Co-operation and Development ___________________________________________________________________________________________
English text only NUCLEAR ENERGY AGENCY COMMITTEE ON THE SAFETY OF NUCLEAR INSTALLATIONS
Benchmark Study of the Accident at the Fukushima Daiichi Nuclear Power Plant (BSAF Project)
March 2015
Complete document available on OLIS in its original format This document and any map included herein are without prejudice to the status of or sovereignty over any territory, to the delimitation of international frontiers and boundaries and to the name of any territory, city or area.
NEA
/CSN
I/R(2015)18
Unclassified
English text only
NEA/CSNI/R(2015)18
2
ORGANISATION FOR ECONOMIC CO-OPERATION AND DEVELOPMENT
The OECD is a unique forum where the governments of 34 democracies work together to address the economic, social and environmental challenges of globalisation. The OECD is also at the forefront of efforts to understand and to help governments respond to new developments and concerns, such as corporate governance, the information economy and the challenges of an ageing population. The Organisation provides a setting where governments can compare policy experiences, seek answers to common problems, identify good practice and work to co-ordinate domestic and international policies.
The OECD member countries are: Australia, Austria, Belgium, Canada, Chile, the Czech Republic, Denmark, Estonia, Finland, France, Germany, Greece, Hungary, Iceland, Ireland, Israel, Italy, Japan, Korea, Luxembourg, Mexico, the Netherlands, New Zealand, Norway, Poland, Portugal, the Slovak Republic, Slovenia, Spain, Sweden, Switzerland, Turkey, the United Kingdom and the United States. The European Commission takes part in the work of the OECD.
OECD Publishing disseminates widely the results of the Organisation’s statistics gathering and research on economic, social and environmental issues, as well as the conventions, guidelines and standards agreed by its members.
NUCLEAR ENERGY AGENCY
The OECD Nuclear Energy Agency (NEA) was established on 1 February 1958. Current NEA membership consists of 31 countries: Australia, Austria, Belgium, Canada, the Czech Republic, Denmark, Finland, France, Germany, Greece, Hungary, Iceland, Ireland, Italy, Japan, Korea, Luxembourg, Mexico, the Netherlands, Norway, Poland, Portugal, the Russian Federation, the Slovak Republic, Slovenia, Spain, Sweden, Switzerland, Turkey, the United Kingdom and the United States. The European Commission also takes part in the work of the Agency.
The mission of the NEA is: – to assist its member countries in maintaining and further developing, through international co-operation, the
scientific, technological and legal bases required for a safe, environmentally friendly and economical use of nuclear energy for peaceful purposes;
– to provide authoritative assessments and to forge common understandings on key issues, as input to government decisions on nuclear energy policy and to broader OECD policy analyses in areas such as energy and sustainable development.
Specific areas of competence of the NEA include the safety and regulation of nuclear activities, radioactive waste management, radiological protection, nuclear science, economic and technical analyses of the nuclear fuel cycle, nuclear law and liability, and public information.
The NEA Data Bank provides nuclear data and computer program services for participating countries. In these and related tasks, the NEA works in close collaboration with the International Atomic Energy Agency in Vienna, with which it has a Co-operation Agreement, as well as with other international organisations in the nuclear field. This document and any map included herein are without prejudice to the status of or sovereignty over any territory, to the delimitation of international frontiers and boundaries and to the name of any territory, city or area. Corrigenda to OECD publications may be found online at: www.oecd.org/publishing/corrigenda. © OECD 2015
You can copy, download or print OECD content for your own use, and you can include excerpts from OECD publications, databases and multimedia products in your own documents, presentations, blogs, websites and teaching materials, provided that suitable acknowledgment of the OECD as source and copyright owner is given. All requests for public or commercial use and translation rights should be submitted to [email protected]. Requests for permission to photocopy portions of this material for public or commercial use shall be addressed directly to the Copyright Clearance Center (CCC) at [email protected] or the Centre français d'exploitation du droit de copie (CFC) [email protected].

NEA/CSNI/R(2015)18
3
COMMITTEE ON THE SAFETY OF NUCLEAR INSTALLATIONS
The NEA Committee on the Safety of Nuclear Installations (CSNI) is an international committee made up of senior scientists and engineers with broad responsibilities for safety technology and research programmes, as well as representatives from regulatory authorities. It was created in 1973 to develop and co-ordinate the activities of the NEA concerning the technical aspects of the design, construction and operation of nuclear installations insofar as they affect the safety of such installations.
The committee’s purpose is to foster international co-operation in nuclear safety among NEA member countries. The main tasks of the CSNI are to exchange technical information and to promote collaboration between research, development, engineering and regulatory organisations; to review operating experience and the state of knowledge on selected topics of nuclear safety technology and safety assessment; to initiate and conduct programmes to overcome discrepancies, develop improvements and reach consensus on technical issues; and to promote the co-ordination of work that serves to maintain competence in nuclear safety matters, including the establishment of joint undertakings.
The priority of the CSNI is on the safety of nuclear installations and the design and construction of new reactors and installations. For advanced reactor designs, the committee provides a forum for improving safety-related knowledge and a vehicle for joint research.
In implementing its programme, the CSNI establishes co-operative mechanisms with the NEA Committee on Nuclear Regulatory Activities (CNRA), which is responsible for issues concerning the regulation, licensing and inspection of nuclear installations with regard to safety. It also co-operates with other NEA Standing Technical Committees, as well as with key international organisations such as the International Atomic Energy Agency (IAEA), on matters of common interest.
NEA/CSNI/R(2015)18
4
Operating Agent:
– Japan Atomic Energy Agency (JAEA), Japan Technical Supporting Organization:
– The Institute of Applied Energy (IAE), Japan Participating Organizations:
– The Institute of Applied Energy (IAE), Japan – Nuclear Safety Institute of Russian Academy of Sciences (IBRAE), Russia – Atomic Energy Corporation “ROSATOM” (ROSATOM), Russia – Centro de Investigaciones Energéticas Medioambientales Y Tecnologocas (CIEMAT), Spain – Consejo de Seguridad Nuclear (CSN), Spain – Institut de Radioprotection et de Sûreté Nucléaire (IRSN), France – Gesellschaft für Anlagen- und Reaktorsicherheit (GRS), Germany – Japan Atomic Energy Agency (JAEA), Japan – Korea Atomic Energy Research Institute (KAERI), South Korea – Nuclear Regulatory Commission (NRC), U.S.A – Department of Energy (DOE), U.S.A – Electric Power Research Institute (EPRI), U.S.A – Sandia National Laboratories (SNL), U.S.A – Paul Scherrer Institute PSI (Switzerland) – Commissariat à l’Énergie atomique et aux énergies alternatives CEA (France) – Nuclear Regulation Authority NRA(S/NRA/R) (Japan) – Central Research Institute of Electric Power Industry (CRIEPI), Japan
List of Contributors
Co-ordinator: – M. Pellegrini (IAE)
Authors:
– M. Pellegrini, H. Shirai, A. Takahashi, Y. Morita, N. Tominaga (IAE) – K. Dolganov (IBRAE) – L. E. Herranz C. López, J. Fontanet, E. Fernández (CIEMAT) – S. Aleza (CSN) – H. Bonneville (IRSN) – M. Sonnenkalb, S. Band (GRS) – F. Nagase , J. Ishikawa (JAEA) – J. H. Song, J. H. Park, T. W. Kim, S. Kim (KAERI) – R. O. Gauntt, D.A. Kalinich and J. Cardoni (SNL) – H. Esmaili, R. Lee (NRC) – D. Peko (DOE) – D. Luxat (ERIN) – L. Fernandez Moguel, J. Birchley (PSI) – F. Payot (CEA) – H. Hoshi, R. Kojo NRA(S/NRA/R) – K. Nakamura, A. Ui, Y. Nishi (CRIEPI)
NEA/CSNI/R(2015)18
5
TABLE OF CONTENTS
LIST OF ABBREVIATIONS AND ACRONYMS ........................................................................................ 7
EXECUTIVE SUMMARY ............................................................................................................................. 9
1. INTRODUCTION .................................................................................................................................. 11
1.1 Objectives and partners of the project ............................................................................................. 11
1.2 Outline and timeframe of the project .............................................................................................. 13
2. FUKUSHIMA DAIICHI ACCIDENT PROGRESSION ...................................................................... 14
3. CALCULATION RESULTS COMPARISON ...................................................................................... 18
3.1 Boundary conditions and nodalization ............................................................................................ 18
3.2 Common case results ...................................................................................................................... 19
3.2.1 Unit 1 ..................................................................................................................................... 19
3.2.2 Unit 2 ..................................................................................................................................... 20
3.2.3 Unit 3 ..................................................................................................................................... 21
3.3 Best Estimate case results ............................................................................................................... 22
3.3.1 Unit 1 ..................................................................................................................................... 23
3.3.2 Unit 2 ..................................................................................................................................... 29
3.3.3 Unit 3 ..................................................................................................................................... 34
4. IMPLICATIONS ON THE REACTOR DEFUELING AND DECOMMISSIONING ......................... 42
4.1 Predicted reactor status and debris compositions ............................................................................ 42
4.2 Possible repercussions on the decommissioning activities ............................................................. 46
4.2.1 Effect of larger zirconium inventories compared to PWR .................................................... 46
4.2.2 Effect of boride and carbide inclusions in metallic debris .................................................... 46
5. CONCLUSIONS .................................................................................................................................... 49
6. REFERENCES ....................................................................................................................................... 51

NEA/CSNI/R(2015)18
6
NEA/CSNI/R(2015)18
7
LIST OF ABBREVIATIONS AND ACRONYMS
ADS Automatic depressurization signal AO Air operated APD Active personal dosimeter BAF Bottom of active fuel BSAF Benchmark Study of the Accident at the Fukushima Daiichi Nuclear
Power Station BWR Boiling water reactor CCS Containment cooling system CST Condensate storage tank DC Direct current DDFP Diesel driven firer pump D/W Dry well HPCI High pressure core injection IC Isolation condenser LWR Light water reactor MCCI Molten core concrete interaction MSIV Main steam isolation valve MSL Main steam line NPS Nuclear power station RCIC Reactor core isolation cooling RCS Reactor cooling system RHR Reactor heat removal RPV Reactor pressure vessel PCV Primary containment vessel PWR Pressurized water reactor SA Severe accident SBO Station black-out S/C Suppression chamber (torus) SRV Safety relief valve TAF Top of active fuel W/W Wet well

NEA/CSNI/R(2015)18
8
NEA/CSNI/R(2015)18
9
EXECUTIVE SUMMARY
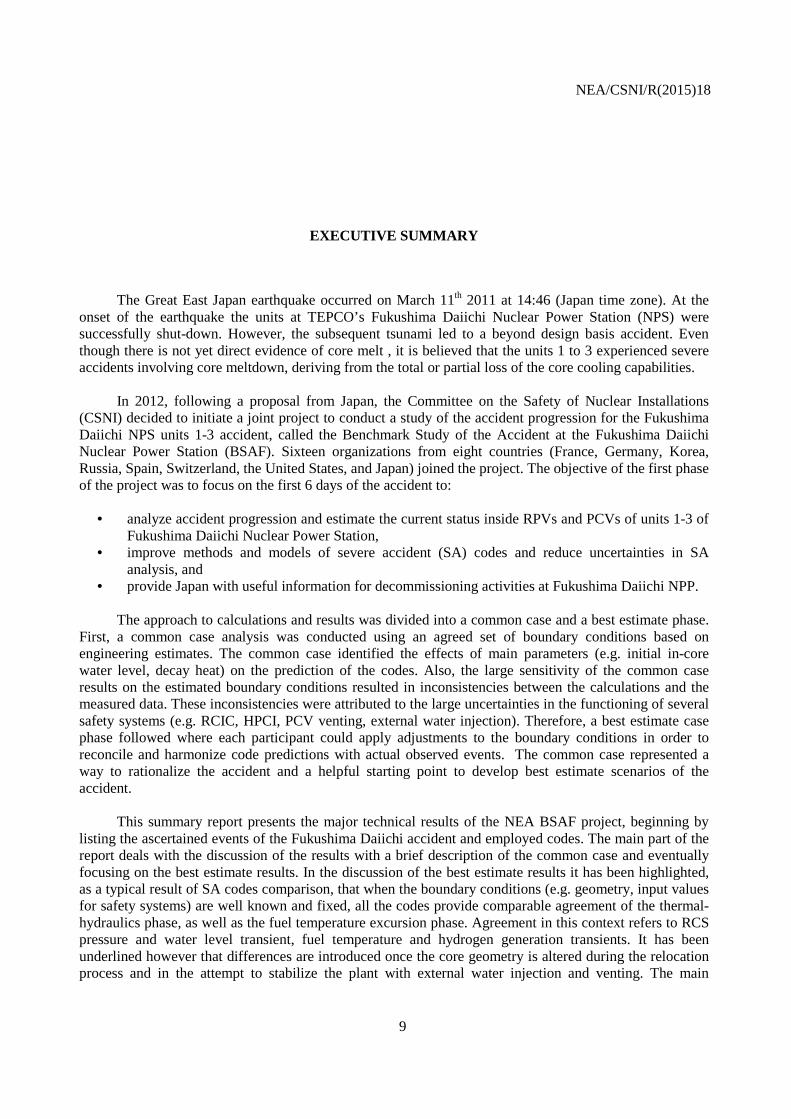
The Great East Japan earthquake occurred on March 11th 2011 at 14:46 (Japan time zone). At the onset of the earthquake the units at TEPCO’s Fukushima Daiichi Nuclear Power Station (NPS) were successfully shut-down. However, the subsequent tsunami led to a beyond design basis accident. Even though there is not yet direct evidence of core melt , it is believed that the units 1 to 3 experienced severe accidents involving core meltdown, deriving from the total or partial loss of the core cooling capabilities. In 2012, following a proposal from Japan, the Committee on the Safety of Nuclear Installations (CSNI) decided to initiate a joint project to conduct a study of the accident progression for the Fukushima Daiichi NPS units 1-3 accident, called the Benchmark Study of the Accident at the Fukushima Daiichi Nuclear Power Station (BSAF). Sixteen organizations from eight countries (France, Germany, Korea, Russia, Spain, Switzerland, the United States, and Japan) joined the project. The objective of the first phase of the project was to focus on the first 6 days of the accident to:
• analyze accident progression and estimate the current status inside RPVs and PCVs of units 1-3 of Fukushima Daiichi Nuclear Power Station,
• improve methods and models of severe accident (SA) codes and reduce uncertainties in SA analysis, and
• provide Japan with useful information for decommissioning activities at Fukushima Daiichi NPP. The approach to calculations and results was divided into a common case and a best estimate phase. First, a common case analysis was conducted using an agreed set of boundary conditions based on engineering estimates. The common case identified the effects of main parameters (e.g. initial in-core water level, decay heat) on the prediction of the codes. Also, the large sensitivity of the common case results on the estimated boundary conditions resulted in inconsistencies between the calculations and the measured data. These inconsistencies were attributed to the large uncertainties in the functioning of several safety systems (e.g. RCIC, HPCI, PCV venting, external water injection). Therefore, a best estimate case phase followed where each participant could apply adjustments to the boundary conditions in order to reconcile and harmonize code predictions with actual observed events. The common case represented a way to rationalize the accident and a helpful starting point to develop best estimate scenarios of the accident. This summary report presents the major technical results of the NEA BSAF project, beginning by listing the ascertained events of the Fukushima Daiichi accident and employed codes. The main part of the report deals with the discussion of the results with a brief description of the common case and eventually focusing on the best estimate results. In the discussion of the best estimate results it has been highlighted, as a typical result of SA codes comparison, that when the boundary conditions (e.g. geometry, input values for safety systems) are well known and fixed, all the codes provide comparable agreement of the thermal-hydraulics phase, as well as the fuel temperature excursion phase. Agreement in this context refers to RCS pressure and water level transient, fuel temperature and hydrogen generation transients. It has been underlined however that differences are introduced once the core geometry is altered during the relocation process and in the attempt to stabilize the plant with external water injection and venting. The main
NEA/CSNI/R(2015)18
10
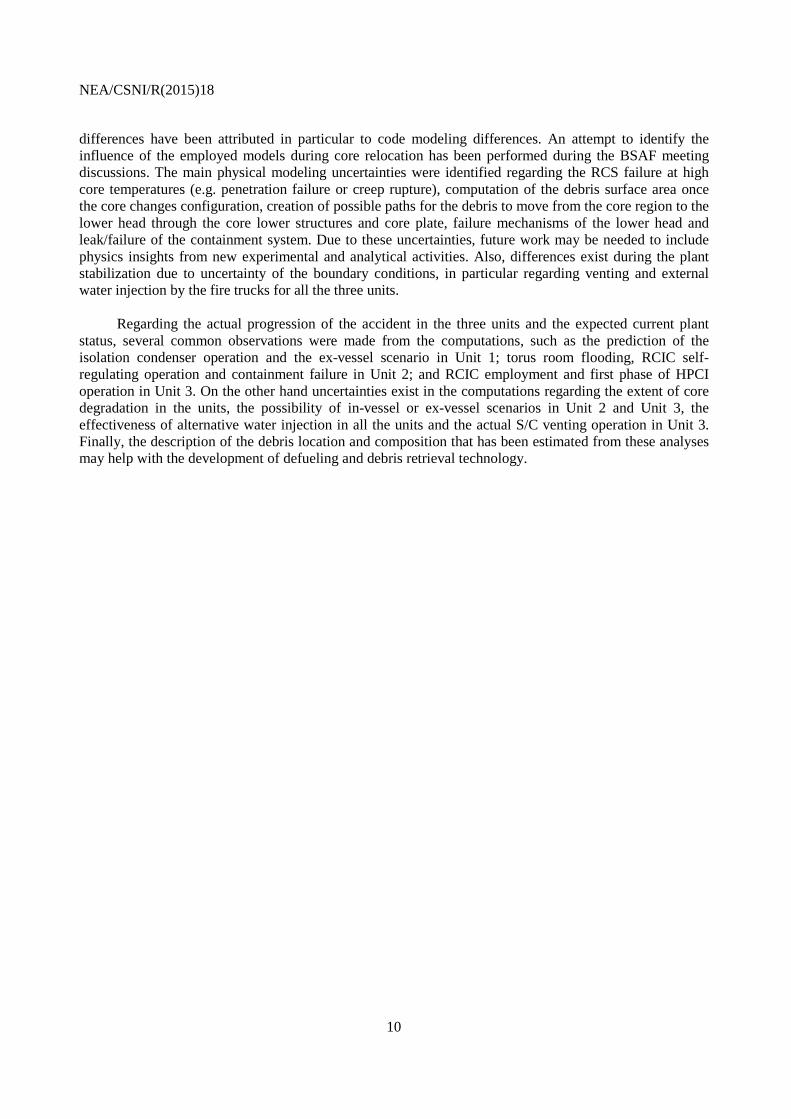
differences have been attributed in particular to code modeling differences. An attempt to identify the influence of the employed models during core relocation has been performed during the BSAF meeting discussions. The main physical modeling uncertainties were identified regarding the RCS failure at high core temperatures (e.g. penetration failure or creep rupture), computation of the debris surface area once the core changes configuration, creation of possible paths for the debris to move from the core region to the lower head through the core lower structures and core plate, failure mechanisms of the lower head and leak/failure of the containment system. Due to these uncertainties, future work may be needed to include physics insights from new experimental and analytical activities. Also, differences exist during the plant stabilization due to uncertainty of the boundary conditions, in particular regarding venting and external water injection by the fire trucks for all the three units. Regarding the actual progression of the accident in the three units and the expected current plant status, several common observations were made from the computations, such as the prediction of the isolation condenser operation and the ex-vessel scenario in Unit 1; torus room flooding, RCIC self-regulating operation and containment failure in Unit 2; and RCIC employment and first phase of HPCI operation in Unit 3. On the other hand uncertainties exist in the computations regarding the extent of core degradation in the units, the possibility of in-vessel or ex-vessel scenarios in Unit 2 and Unit 3, the effectiveness of alternative water injection in all the units and the actual S/C venting operation in Unit 3. Finally, the description of the debris location and composition that has been estimated from these analyses may help with the development of defueling and debris retrieval technology.
NEA/CSNI/R(2015)18
11
1. INTRODUCTION
1.1 Objectives and partners of the project
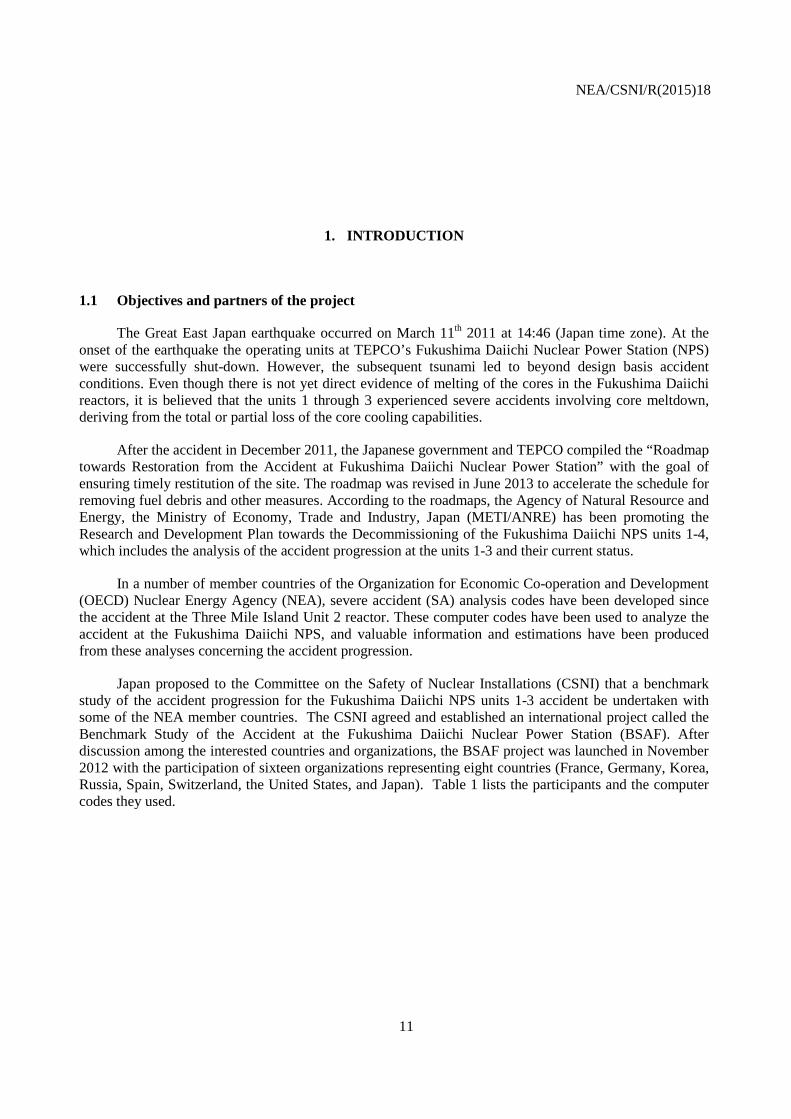
The Great East Japan earthquake occurred on March 11th 2011 at 14:46 (Japan time zone). At the onset of the earthquake the operating units at TEPCO’s Fukushima Daiichi Nuclear Power Station (NPS) were successfully shut-down. However, the subsequent tsunami led to beyond design basis accident conditions. Even though there is not yet direct evidence of melting of the cores in the Fukushima Daiichi reactors, it is believed that the units 1 through 3 experienced severe accidents involving core meltdown, deriving from the total or partial loss of the core cooling capabilities.
After the accident in December 2011, the Japanese government and TEPCO compiled the “Roadmap towards Restoration from the Accident at Fukushima Daiichi Nuclear Power Station” with the goal of ensuring timely restitution of the site. The roadmap was revised in June 2013 to accelerate the schedule for removing fuel debris and other measures. According to the roadmaps, the Agency of Natural Resource and Energy, the Ministry of Economy, Trade and Industry, Japan (METI/ANRE) has been promoting the Research and Development Plan towards the Decommissioning of the Fukushima Daiichi NPS units 1-4, which includes the analysis of the accident progression at the units 1-3 and their current status.
In a number of member countries of the Organization for Economic Co-operation and Development (OECD) Nuclear Energy Agency (NEA), severe accident (SA) analysis codes have been developed since the accident at the Three Mile Island Unit 2 reactor. These computer codes have been used to analyze the accident at the Fukushima Daiichi NPS, and valuable information and estimations have been produced from these analyses concerning the accident progression.
Japan proposed to the Committee on the Safety of Nuclear Installations (CSNI) that a benchmark study of the accident progression for the Fukushima Daiichi NPS units 1-3 accident be undertaken with some of the NEA member countries. The CSNI agreed and established an international project called the Benchmark Study of the Accident at the Fukushima Daiichi Nuclear Power Station (BSAF). After discussion among the interested countries and organizations, the BSAF project was launched in November 2012 with the participation of sixteen organizations representing eight countries (France, Germany, Korea, Russia, Spain, Switzerland, the United States, and Japan). Table 1 lists the participants and the computer codes they used.
NEA/CSNI/R(2015)18
12
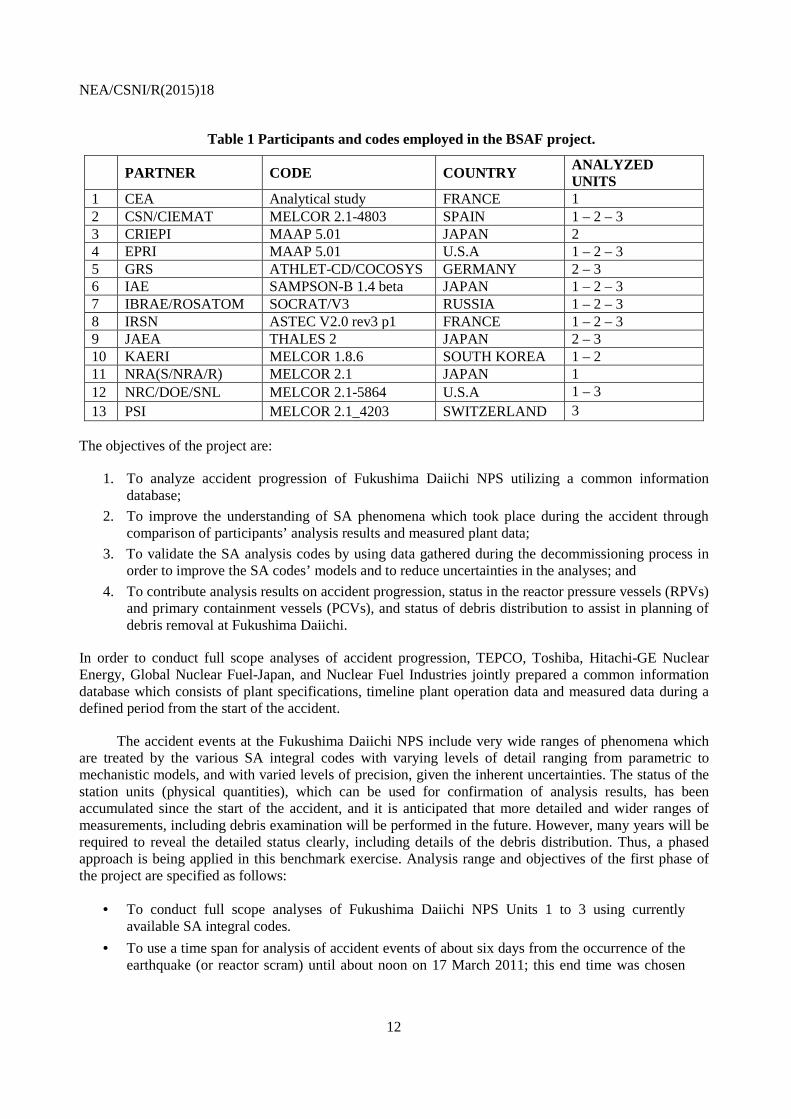
Table 1 Participants and codes employed in the BSAF project.
PARTNER CODE COUNTRY ANALYZED UNITS
1 CEA Analytical study FRANCE 1 2 CSN/CIEMAT MELCOR 2.1-4803 SPAIN 1 – 2 – 3 3 CRIEPI MAAP 5.01 JAPAN 2 4 EPRI MAAP 5.01 U.S.A 1 – 2 – 3 5 GRS ATHLET-CD/COCOSYS GERMANY 2 – 3 6 IAE SAMPSON-B 1.4 beta JAPAN 1 – 2 – 3 7 IBRAE/ROSATOM SOCRAT/V3 RUSSIA 1 – 2 – 3 8 IRSN ASTEC V2.0 rev3 p1 FRANCE 1 – 2 – 3 9 JAEA THALES 2 JAPAN 2 – 3 10 KAERI MELCOR 1.8.6 SOUTH KOREA 1 – 2 11 NRA(S/NRA/R) MELCOR 2.1 JAPAN 1 12 NRC/DOE/SNL MELCOR 2.1-5864 U.S.A 1 – 3 13 PSI MELCOR 2.1_4203 SWITZERLAND 3
The objectives of the project are:
1. To analyze accident progression of Fukushima Daiichi NPS utilizing a common information database;
2. To improve the understanding of SA phenomena which took place during the accident through comparison of participants’ analysis results and measured plant data;
3. To validate the SA analysis codes by using data gathered during the decommissioning process in order to improve the SA codes’ models and to reduce uncertainties in the analyses; and
4. To contribute analysis results on accident progression, status in the reactor pressure vessels (RPVs) and primary containment vessels (PCVs), and status of debris distribution to assist in planning of debris removal at Fukushima Daiichi.
In order to conduct full scope analyses of accident progression, TEPCO, Toshiba, Hitachi-GE Nuclear Energy, Global Nuclear Fuel-Japan, and Nuclear Fuel Industries jointly prepared a common information database which consists of plant specifications, timeline plant operation data and measured data during a defined period from the start of the accident.
The accident events at the Fukushima Daiichi NPS include very wide ranges of phenomena which are treated by the various SA integral codes with varying levels of detail ranging from parametric to mechanistic models, and with varied levels of precision, given the inherent uncertainties. The status of the station units (physical quantities), which can be used for confirmation of analysis results, has been accumulated since the start of the accident, and it is anticipated that more detailed and wider ranges of measurements, including debris examination will be performed in the future. However, many years will be required to reveal the detailed status clearly, including details of the debris distribution. Thus, a phased approach is being applied in this benchmark exercise. Analysis range and objectives of the first phase of the project are specified as follows:
· To conduct full scope analyses of Fukushima Daiichi NPS Units 1 to 3 using currently available SA integral codes.
· To use a time span for analysis of accident events of about six days from the occurrence of the earthquake (or reactor scram) until about noon on 17 March 2011; this end time was chosen
NEA/CSNI/R(2015)18
13
because stable and continuous cooling had been attained by alternative water injection by then and after that the changes in the various units were considered to be minimal.
· To analyze in full scope the following phenomena:
1) Initial transient from pre-accident condition to core heat-up, 2) Core heat-up, 3) Core melt, 4) Behavior of core internals (core shroud), 5) Core status including debris behavior, 6) Molten debris-coolant interaction in the lower plenum (if necessary), 7) RPV failure, 8) PCV thermal-hydraulics, 9) MCCI (molten core concrete interaction), and 10) Hydrogen generation (excluding the hydrogen explosions).
Phenomena associated with fission product release from fuel and transport to the containment and the building, and the evaluation of source term release to the environment and plant water will be further analyzed in future phases of the BSAF project.
The project used meetings and workshops to discuss the scope of the project, boundary conditions for the calculation, modeling of the accident progressions at the Fukushima Daiichi Units 1-3, results of the benchmark calculations, and the contents of and process for producing the final report. During this process, it was decided that the participants should conduct two rounds of calculations, a common case where common assumptions about boundary conditions were used by each participant, and a best-estimate case, where each participant could adjust boundary conditions to obtain better agreement between analyses and known data from the accident progression. It was also decided that the final report should consist of an analysis of the differences and similarities in the various modeling assumptions and result, supported by appendices with the individual reports from participants. The report should also summarize lessons learned and recommendations that can serve as input to future phases and for the defueling and decommissioning activities.
1.2 Outline and timeframe of the project
It is important to recognize that the timeframe for the first phase of BSAF was constrained. After the establishment of the BSAF project in November 2012, it was determined that certain diplomatic agreements were necessary between Japan and the participants’ countries in order to provide necessary data which included proprietary information such as plant specifications. This process delayed the initiation of the calculations. In addition, the organization of the boundary conditions was a great challenge given the intrinsic uncertainty resulting from various levels of unknown or missing information, which the present project faces. In October 2013 a complete list and possible treatment of the boundary conditions were discussed and agreed upon among the participants. The boundary conditions were intended as a starting point for the possible treatment by the computer codes. The boundary conditions were also the subject of comparison in the final results (e.g. torus room flooding, RCIC and HPCI operation). Thereafter, the common case and the best estimate calculations could officially start and were summarized in the final meeting held in Paris in November 2014. Even though the total length of the project was 2 years, given the complexity of its preparation, only around half year could be dedicated to the best estimate cases. Significant effort was required of all the BSAF participants to keep to the tight schedule.
NEA/CSNI/R(2015)18
14
2. FUKUSHIMA DAIICHI ACCIDENT PROGRESSION
The Tohoku-Chihou Taiheiyou-Oki earthquake (Great East Japan earthquake) occurred on March 11th 2011 at 14:46 (Japan time zone). The three operating reactors were safely shut down at 14:47 followed by system isolation by MSIV closure. From TEPCO’s observation of the plant’s operation status, the main equipment with important safety control functions is assumed to have been operable after the earthquake.
The earthquake was followed by a tsunami wave which, by reconstruction through videos and onsite post-measurements, is estimated to have reached the height of 14 m and which caused a large scale disaster in the Pacific Ocean coastal areas. The wave was designated with an intensity scale of 9.1, in the index used to indicate the scale of tsunami. It was the fourth largest ever observed in the world and the largest ever recorded in Japan. The tsunami waves which hit the Fukushima Daiichi NPS flooded not only the level 4 m above the Onahama Port construction level (O.P. 4 m), where seawater pumps had been installed, but also the 10-m level, where key buildings had been constructed. Consequently, motors and electrical equipment were flooded and important systems, such as emergency diesel generators and power panels, were directly or indirectly affected and disabled. The result for Units 1 to 3 was the loss of the ultimate heat sink, loss or drastic decrease of plant instrumentation and the total inability or exceeding difficulty to operate the safety systems for cooling the reactor cores.
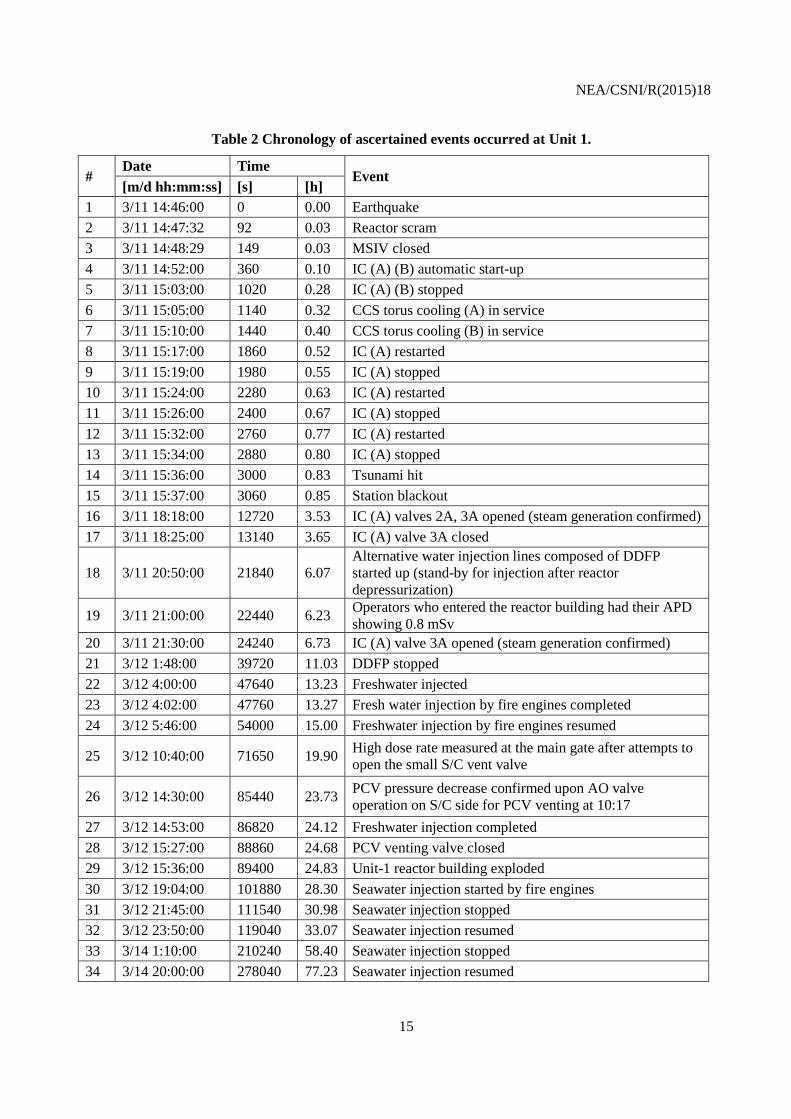
The accident events obtained from reliable observations or communication from the operators in the three units is summarized in Tables 2 to 4, below. The main source of information of the event timins and details are obtained from TEPCO Progress Report No. 2 [1] and from direct communication with the TEPCO SA group. The description is a starting point to highlight the uncertainties and the issues that are addressed in our analysis and comparison.
NEA/CSNI/R(2015)18
15
Table 2 Chronology of ascertained events occurred at Unit 1.
# Date Time
Event [m/d hh:mm:ss] [s] [h]
1 3/11 14:46:00 0 0.00 Earthquake 2 3/11 14:47:32 92 0.03 Reactor scram 3 3/11 14:48:29 149 0.03 MSIV closed 4 3/11 14:52:00 360 0.10 IC (A) (B) automatic start-up 5 3/11 15:03:00 1020 0.28 IC (A) (B) stopped 6 3/11 15:05:00 1140 0.32 CCS torus cooling (A) in service 7 3/11 15:10:00 1440 0.40 CCS torus cooling (B) in service 8 3/11 15:17:00 1860 0.52 IC (A) restarted 9 3/11 15:19:00 1980 0.55 IC (A) stopped 10 3/11 15:24:00 2280 0.63 IC (A) restarted 11 3/11 15:26:00 2400 0.67 IC (A) stopped 12 3/11 15:32:00 2760 0.77 IC (A) restarted 13 3/11 15:34:00 2880 0.80 IC (A) stopped 14 3/11 15:36:00 3000 0.83 Tsunami hit 15 3/11 15:37:00 3060 0.85 Station blackout 16 3/11 18:18:00 12720 3.53 IC (A) valves 2A, 3A opened (steam generation confirmed) 17 3/11 18:25:00 13140 3.65 IC (A) valve 3A closed
18 3/11 20:50:00 21840 6.07 Alternative water injection lines composed of DDFP started up (stand-by for injection after reactor depressurization)
19 3/11 21:00:00 22440 6.23 Operators who entered the reactor building had their APD showing 0.8 mSv
20 3/11 21:30:00 24240 6.73 IC (A) valve 3A opened (steam generation confirmed) 21 3/12 1:48:00 39720 11.03 DDFP stopped 22 3/12 4:00:00 47640 13.23 Freshwater injected 23 3/12 4:02:00 47760 13.27 Fresh water injection by fire engines completed 24 3/12 5:46:00 54000 15.00 Freshwater injection by fire engines resumed
25 3/12 10:40:00 71650 19.90 High dose rate measured at the main gate after attempts to open the small S/C vent valve
26 3/12 14:30:00 85440 23.73 PCV pressure decrease confirmed upon AO valve operation on S/C side for PCV venting at 10:17
27 3/12 14:53:00 86820 24.12 Freshwater injection completed 28 3/12 15:27:00 88860 24.68 PCV venting valve closed 29 3/12 15:36:00 89400 24.83 Unit-1 reactor building exploded 30 3/12 19:04:00 101880 28.30 Seawater injection started by fire engines 31 3/12 21:45:00 111540 30.98 Seawater injection stopped 32 3/12 23:50:00 119040 33.07 Seawater injection resumed 33 3/14 1:10:00 210240 58.40 Seawater injection stopped 34 3/14 20:00:00 278040 77.23 Seawater injection resumed

NEA/CSNI/R(2015)18
16
Table 3 Chronology of ascertained events occurred at Unit 2.
# Date Time
Event [m/d hh:mm:ss] [s] [h]
1 3/11 14:46:00 0 0.00 Earthquake 2 3/11 14:47:33 93 0.03 Reactor scram 3 3/11 14:48:03 123 0.03 MSIV closed 4 3/11 14:50:00 240 0.07 RCIC manually started 5 3/11 14:51:00 300 0.08 RCIC automatically tripped (L-8) 6 3/11 15:02:00 960 0.27 RCIC manually started 7 3/11 15:07:00 1260 0.35 S/C pool cooling by RHR
8 3/11 15:25:00 2340 0.65 S/C pool cooling by RHR terminated and S/C spray by RHR started
9 3/11 15:28:00 2520 0.70 RCIC automatically tripped (L-8) 10 3/11 15:36:00 3000 0.83 Tsunami hit 11 3/11 15:37:00 3060 0.85 S/C spray by RHR terminated 12 3/11 15:39:00 3180 0.88 RCIC manually started 13 3/11 15:41:00 3300 0.92 Station black-out
14 3/12 3:17:00 45060 12.52 CST found by the operator with low water level (30% full against 68% at the beginning of the accident)
15 3/12 4:20:00 48840 13.57 Switching water source of RCIC from CST to S/C
16 3/14 13:25:00 254340 70.65 Loss of RCIC function was judged from the decreasing reactor water level
17 3/14 16:34:00 265680 73.80 Operation to open one SRV started for reactor depressurization
18 3/14 16:34:00 265680 73.80 Working for seawater injection through fire protection line started
19 3/14 18:00:00 270840 75.23 Reactor pressure started to decrease by opening one SRV and depressurization was confirmed
20 3/14 19:20:00 275640 76.57 Fire engines were found to have halted due to depletion of fuel
21 3/14 19:54:00 277680 77.13 Restarting 1st fire engine 22 3/14 19:57:00 277860 77.18 Restarting 2nd fire engine
23 3/14 21:20:00 282840 78.57 Opening other 2 SRVs and reactor pressure decreased and reactor water level increased
24 3/15 1:10:00 296640 82.40 Opening one SRV 25 3/15 2:22:00 300960 83.60 Operation to try to open SRV started
26 3/15 6:00:00 314040 87.23 Impact sound occurred S/C pressure indicator showed 0 MPa (it has been judged that the impact sound came from Uni-4 explosion)
NEA/CSNI/R(2015)18
17
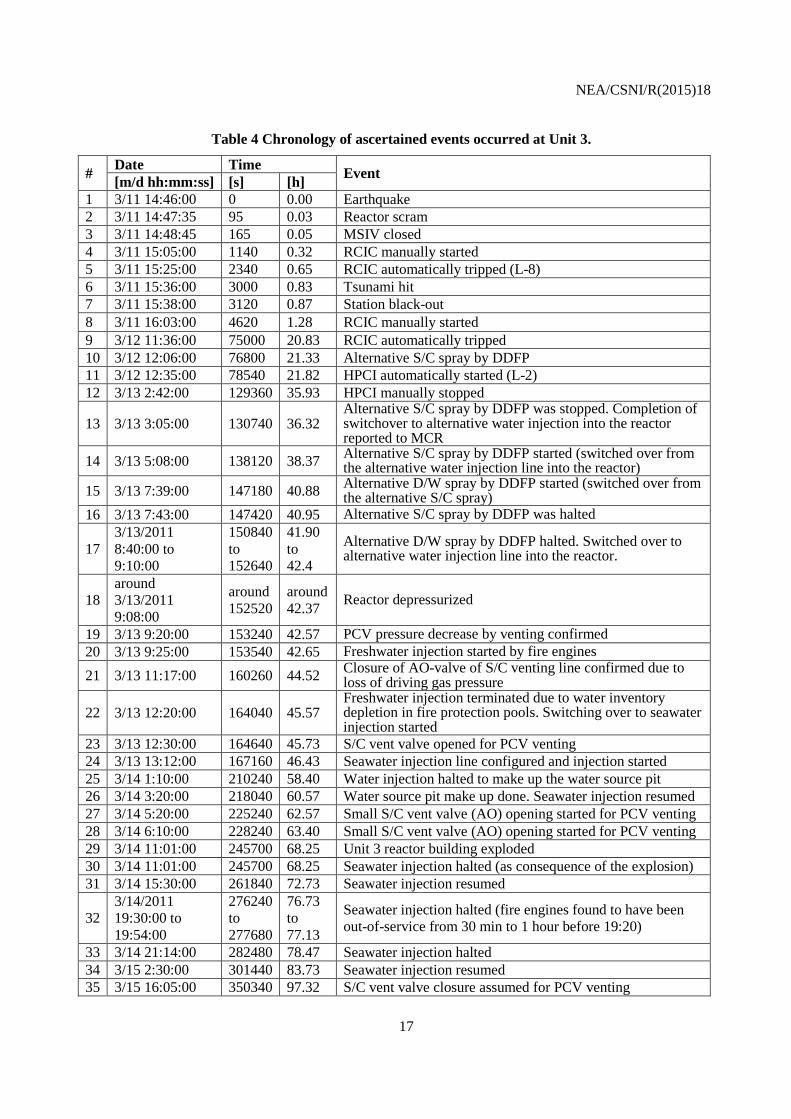
Table 4 Chronology of ascertained events occurred at Unit 3.
# Date Time Event [m/d hh:mm:ss] [s] [h] 1 3/11 14:46:00 0 0.00 Earthquake 2 3/11 14:47:35 95 0.03 Reactor scram 3 3/11 14:48:45 165 0.05 MSIV closed 4 3/11 15:05:00 1140 0.32 RCIC manually started 5 3/11 15:25:00 2340 0.65 RCIC automatically tripped (L-8) 6 3/11 15:36:00 3000 0.83 Tsunami hit 7 3/11 15:38:00 3120 0.87 Station black-out 8 3/11 16:03:00 4620 1.28 RCIC manually started 9 3/12 11:36:00 75000 20.83 RCIC automatically tripped 10 3/12 12:06:00 76800 21.33 Alternative S/C spray by DDFP 11 3/12 12:35:00 78540 21.82 HPCI automatically started (L-2) 12 3/13 2:42:00 129360 35.93 HPCI manually stopped
13 3/13 3:05:00 130740 36.32 Alternative S/C spray by DDFP was stopped. Completion of switchover to alternative water injection into the reactor reported to MCR
14 3/13 5:08:00 138120 38.37 Alternative S/C spray by DDFP started (switched over from the alternative water injection line into the reactor)
15 3/13 7:39:00 147180 40.88 Alternative D/W spray by DDFP started (switched over from the alternative S/C spray)
16 3/13 7:43:00 147420 40.95 Alternative S/C spray by DDFP was halted
17 3/13/2011 8:40:00 to 9:10:00
150840 to 152640
41.90 to 42.4
Alternative D/W spray by DDFP halted. Switched over to alternative water injection line into the reactor.
18 around 3/13/2011 9:08:00
around 152520
around 42.37 Reactor depressurized
19 3/13 9:20:00 153240 42.57 PCV pressure decrease by venting confirmed 20 3/13 9:25:00 153540 42.65 Freshwater injection started by fire engines
21 3/13 11:17:00 160260 44.52 Closure of AO-valve of S/C venting line confirmed due to loss of driving gas pressure
22 3/13 12:20:00 164040 45.57 Freshwater injection terminated due to water inventory depletion in fire protection pools. Switching over to seawater injection started
23 3/13 12:30:00 164640 45.73 S/C vent valve opened for PCV venting 24 3/13 13:12:00 167160 46.43 Seawater injection line configured and injection started 25 3/14 1:10:00 210240 58.40 Water injection halted to make up the water source pit 26 3/14 3:20:00 218040 60.57 Water source pit make up done. Seawater injection resumed 27 3/14 5:20:00 225240 62.57 Small S/C vent valve (AO) opening started for PCV venting 28 3/14 6:10:00 228240 63.40 Small S/C vent valve (AO) opening started for PCV venting 29 3/14 11:01:00 245700 68.25 Unit 3 reactor building exploded 30 3/14 11:01:00 245700 68.25 Seawater injection halted (as consequence of the explosion) 31 3/14 15:30:00 261840 72.73 Seawater injection resumed
32 3/14/2011 19:30:00 to 19:54:00
276240 to 277680
76.73 to 77.13
Seawater injection halted (fire engines found to have been out-of-service from 30 min to 1 hour before 19:20)
33 3/14 21:14:00 282480 78.47 Seawater injection halted 34 3/15 2:30:00 301440 83.73 Seawater injection resumed 35 3/15 16:05:00 350340 97.32 S/C vent valve closure assumed for PCV venting
NEA/CSNI/R(2015)18
18
3. CALCULATION RESULTS COMPARISON
3.1 Boundary conditions and nodalization
Upon completion of the diplomatic agreements, proprietary plant data were provided to participants for use in developing the input models of the plants for the simulation of the accident. Every participating organization, except IBRAE, which is using the VVER analogy, received proprietary data from HITACHI (Unit 1) and TOSHIBA (Unit 2 and Unit 3). The decay heat, axial and radial power data were estimated by TEPCO for each unit and provided to the participants. The participants were given a “common case” of boundary conditions for all the units, which were developed from simplified estimates of mass and energy balances. The common case results are reported in Section 3.2. The objectives of the common case were to minimize different assumptions among calculations which might have resulted from a more free approach to the boundary conditions, and to examine the physical modeling differences among the SA codes and analysts. The common-case analyses were not altogether successful in normalizing comparative results of the various codes because there still remained considerable uncertainty in the true boundary conditions of the accidents. Boundary conditions are highly uncertain and engineering estimates (e.g. external water injection, RCIC or HPCI operation) remain debatable. When the common boundary conditions were implemented by the different SA codes, some led to unphysical conditions causing code execution failures or other results that were inconsistent with known accident progression trends. They were however very useful in getting all codes calibrated to a common starting point. Thereafter, organizations used their judgment to come up with best estimate boundary conditions to perform the last round of analysis, as reported in Section 3.3. The common case served as a reference and starting point to develop more accurate best estimate results.
NEA/CSNI/R(2015)18
19
Table 5 Comparison of some plant nodalization details.
PARTNER CODE Number of control volume or core cells
D/W Vent lines S/C Core (Rings / Cells)
CIEMAT MELCOR 2.1-4803 9 8 8 azimuthal 4 ´ 8 CRIEPI MAAP 5.01 2 1 3 layer 5 ´ 13 EPRI MAAP 5.01 n.a. n.a. n.a. n.a.
GRS ATHLET-CD/ COCOSYS 6 8 2 layer x
8 azimuthal 6 ´ 26
IAE SAMPSON-B 1.4 beta 1 1 1 4 ´ 10 IBRAE/ ROSATOM SOCRAT/V3 8 4 7 (3 layer) 4 ´ 12
IRSN ASTEC V2.0 rev3 p1 1 1 1 6 ´ 20 JAEA THALES 2 2 1 1 4 ´ 6
KAERI MELCOR 1.8.6 Unit 1 2 1 1 4 ´ 11 Unit 2 4 1 1 5 ´ 11
NRA(S/NRA/R) MELCOR 2.1 4 8 2 layer ´
8 azimuthal + 1 for SRV
4 ´ 10
NRC/DOE/SNL MELCOR 2.1-5864 2 1 1 5 ´ 10 PSI MELCOR 4 1 2 layer 5 ´ 10
Because of the large number of uncertainties it is understandable that multiple possible accident explanations might exist, however each organization was asked to provide only one best estimate case representing the most plausible accident scenario in the view of the analyst’s experience. The different codes and their user specific plant nodalizations are summarized in Table 5. It has not been possible to assess the influence of the nodalization differences, which could be expected to affect the calculated accident progression, especially in the details of the core degradation process.
As a reminder, the time-elapsed for the analyses is about 6 days (144 h) from the earthquake (3/11 14:46:00) until March 17th, 12:00. Hereafter, 0 h will refer to the time of occurrence of the earthquake.
3.2 Common case results
3.2.1 Unit 1
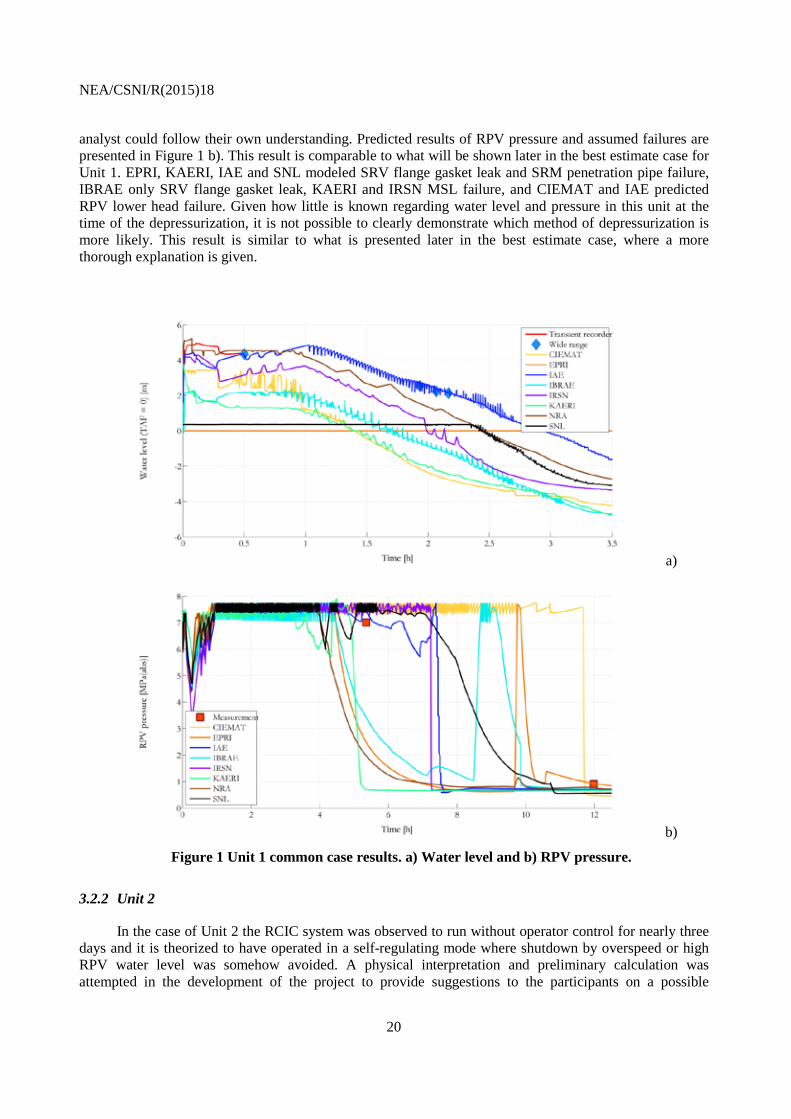
In case of Unit 1 the boundary conditions do not represent a large uncertainty at least until the alternative water injection was started from the fire trucks. The only safety systems successfully operated were the isolation condenser heat removal systems, which were functional only during the time span before the arrival of the tsunami. Even though the RPV pressure during the IC operation shows a similar trend among the analyses, the predictions of the in-shroud collapsed water level is notably different among analyses, as seen in Figure 1 a). These differences seem partly due to small variations in the assumed decay heat, but principally due to differences in the assumed initial RPV/RCS water inventory at the time of reactor trip employed by each participant. This issue is critical in Unit 1 where water addition was not started until around 14 h. In the common case, another difficult aspect that was recognized was the treatment of the boundary conditions associated with failure of particular systems. It was decided that for system failures, each
NEA/CSNI/R(2015)18
20
analyst could follow their own understanding. Predicted results of RPV pressure and assumed failures are presented in Figure 1 b). This result is comparable to what will be shown later in the best estimate case for Unit 1. EPRI, KAERI, IAE and SNL modeled SRV flange gasket leak and SRM penetration pipe failure, IBRAE only SRV flange gasket leak, KAERI and IRSN MSL failure, and CIEMAT and IAE predicted RPV lower head failure. Given how little is known regarding water level and pressure in this unit at the time of the depressurization, it is not possible to clearly demonstrate which method of depressurization is more likely. This result is similar to what is presented later in the best estimate case, where a more thorough explanation is given.
a)
b)
Figure 1 Unit 1 common case results. a) Water level and b) RPV pressure.
3.2.2 Unit 2
In the case of Unit 2 the RCIC system was observed to run without operator control for nearly three days and it is theorized to have operated in a self-regulating mode where shutdown by overspeed or high RPV water level was somehow avoided. A physical interpretation and preliminary calculation was attempted in the development of the project to provide suggestions to the participants on a possible
NEA/CSNI/R(2015)18
21
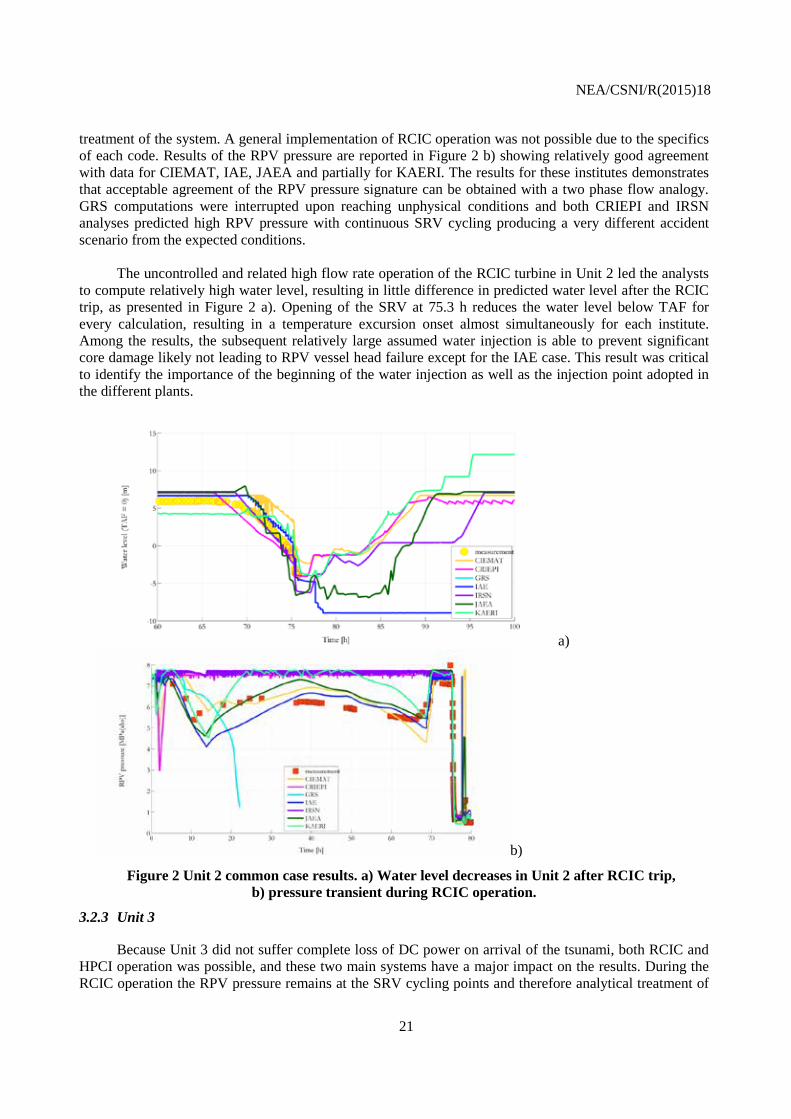
treatment of the system. A general implementation of RCIC operation was not possible due to the specifics of each code. Results of the RPV pressure are reported in Figure 2 b) showing relatively good agreement with data for CIEMAT, IAE, JAEA and partially for KAERI. The results for these institutes demonstrates that acceptable agreement of the RPV pressure signature can be obtained with a two phase flow analogy. GRS computations were interrupted upon reaching unphysical conditions and both CRIEPI and IRSN analyses predicted high RPV pressure with continuous SRV cycling producing a very different accident scenario from the expected conditions. The uncontrolled and related high flow rate operation of the RCIC turbine in Unit 2 led the analysts to compute relatively high water level, resulting in little difference in predicted water level after the RCIC trip, as presented in Figure 2 a). Opening of the SRV at 75.3 h reduces the water level below TAF for every calculation, resulting in a temperature excursion onset almost simultaneously for each institute. Among the results, the subsequent relatively large assumed water injection is able to prevent significant core damage likely not leading to RPV vessel head failure except for the IAE case. This result was critical to identify the importance of the beginning of the water injection as well as the injection point adopted in the different plants.
a)
b)
Figure 2 Unit 2 common case results. a) Water level decreases in Unit 2 after RCIC trip, b) pressure transient during RCIC operation.
3.2.3 Unit 3
Because Unit 3 did not suffer complete loss of DC power on arrival of the tsunami, both RCIC and HPCI operation was possible, and these two main systems have a major impact on the results. During the RCIC operation the RPV pressure remains at the SRV cycling points and therefore analytical treatment of
NEA/CSNI/R(2015)18
22
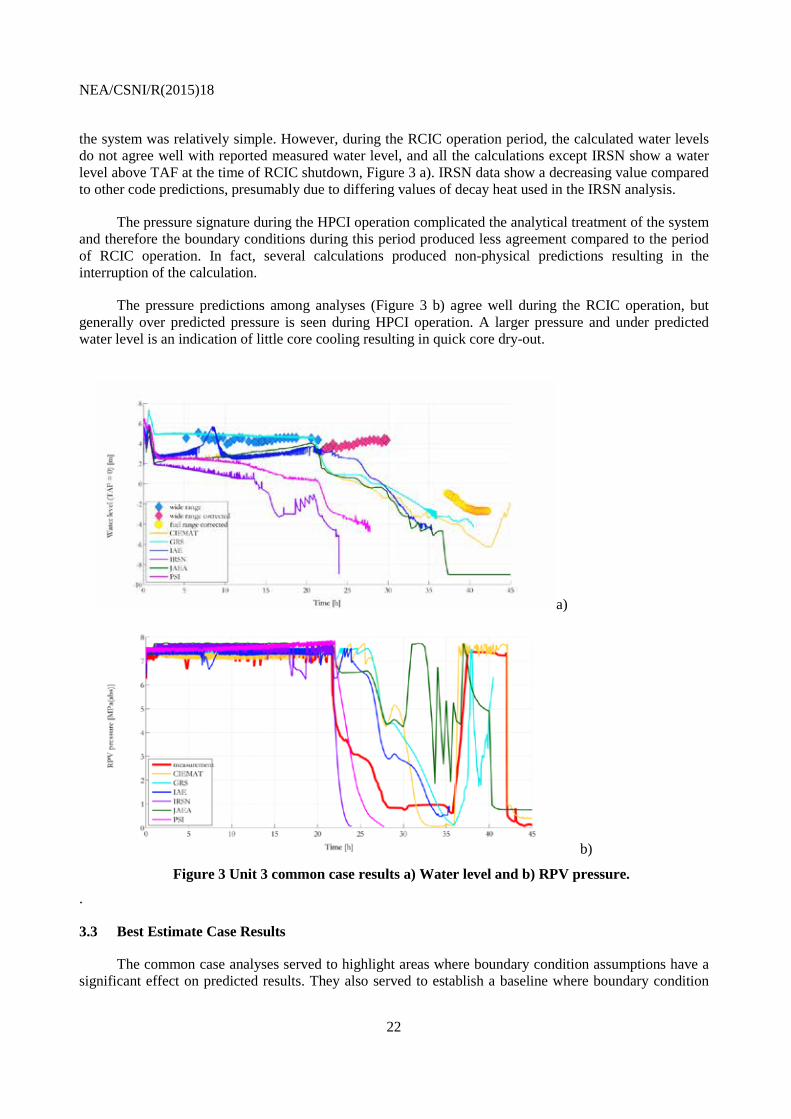
the system was relatively simple. However, during the RCIC operation period, the calculated water levels do not agree well with reported measured water level, and all the calculations except IRSN show a water level above TAF at the time of RCIC shutdown, Figure 3 a). IRSN data show a decreasing value compared to other code predictions, presumably due to differing values of decay heat used in the IRSN analysis.
The pressure signature during the HPCI operation complicated the analytical treatment of the system and therefore the boundary conditions during this period produced less agreement compared to the period of RCIC operation. In fact, several calculations produced non-physical predictions resulting in the interruption of the calculation.
The pressure predictions among analyses (Figure 3 b) agree well during the RCIC operation, but generally over predicted pressure is seen during HPCI operation. A larger pressure and under predicted water level is an indication of little core cooling resulting in quick core dry-out.
a)
b)
Figure 3 Unit 3 common case results a) Water level and b) RPV pressure.
.
3.3 Best Estimate Case Results
The common case analyses served to highlight areas where boundary condition assumptions have a significant effect on predicted results. They also served to establish a baseline where boundary condition
NEA/CSNI/R(2015)18
23
adjustments could be rationalized to produce better comparisons with the known plant responses. This section presents the “best estimate” analyses where departure from the common-case conditions were taken and which led to significant improvements in the predicted results relative to known plant responses.
3.3.1 Unit 1
The Unit 1 accident progression is relatively uncomplicated compared to Units 2 and 3. Indeed, with the exception of the activation of the isolation condensers in the first hour, the accident progressed without any intervention of the operator until the onset of core degradation, because all AC and DC power was lost after the tsunami hit the NPS. This greatly simplified the modeling assumptions used be each participating code.
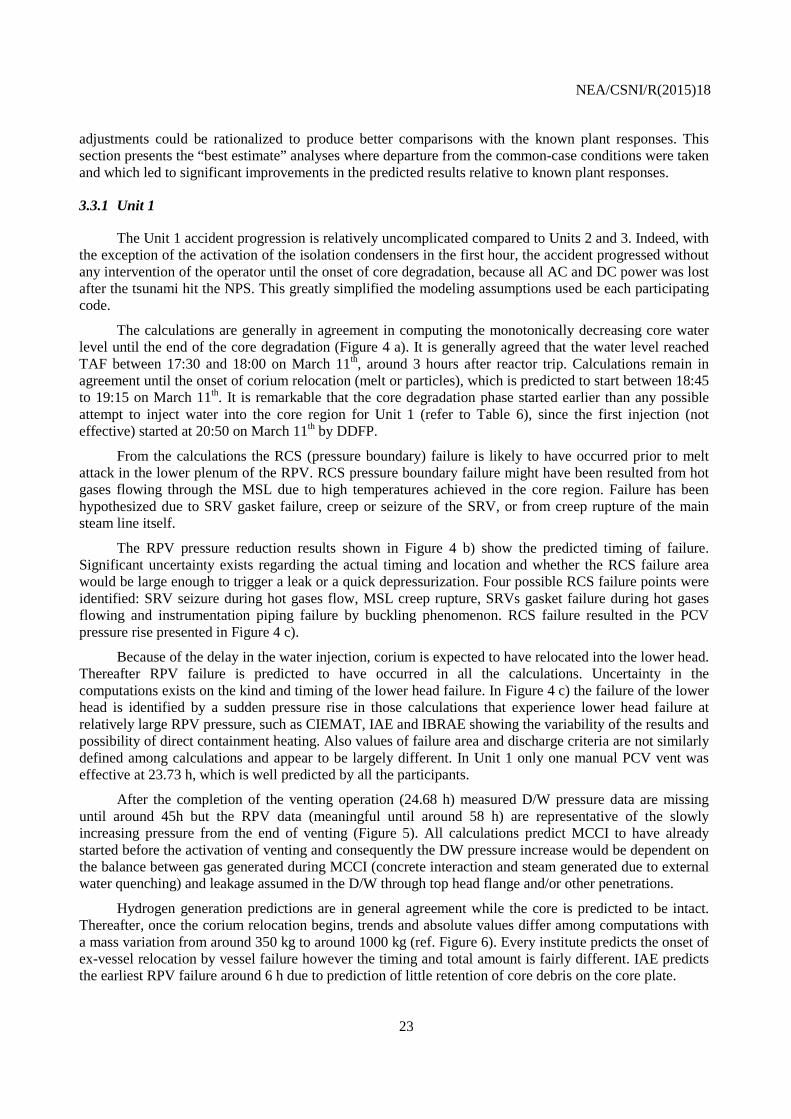
The calculations are generally in agreement in computing the monotonically decreasing core water level until the end of the core degradation (Figure 4 a). It is generally agreed that the water level reached TAF between 17:30 and 18:00 on March 11th, around 3 hours after reactor trip. Calculations remain in agreement until the onset of corium relocation (melt or particles), which is predicted to start between 18:45 to 19:15 on March 11th. It is remarkable that the core degradation phase started earlier than any possible attempt to inject water into the core region for Unit 1 (refer to Table 6), since the first injection (not effective) started at 20:50 on March 11th by DDFP.
From the calculations the RCS (pressure boundary) failure is likely to have occurred prior to melt attack in the lower plenum of the RPV. RCS pressure boundary failure might have been resulted from hot gases flowing through the MSL due to high temperatures achieved in the core region. Failure has been hypothesized due to SRV gasket failure, creep or seizure of the SRV, or from creep rupture of the main steam line itself.
The RPV pressure reduction results shown in Figure 4 b) show the predicted timing of failure. Significant uncertainty exists regarding the actual timing and location and whether the RCS failure area would be large enough to trigger a leak or a quick depressurization. Four possible RCS failure points were identified: SRV seizure during hot gases flow, MSL creep rupture, SRVs gasket failure during hot gases flowing and instrumentation piping failure by buckling phenomenon. RCS failure resulted in the PCV pressure rise presented in Figure 4 c).
Because of the delay in the water injection, corium is expected to have relocated into the lower head. Thereafter RPV failure is predicted to have occurred in all the calculations. Uncertainty in the computations exists on the kind and timing of the lower head failure. In Figure 4 c) the failure of the lower head is identified by a sudden pressure rise in those calculations that experience lower head failure at relatively large RPV pressure, such as CIEMAT, IAE and IBRAE showing the variability of the results and possibility of direct containment heating. Also values of failure area and discharge criteria are not similarly defined among calculations and appear to be largely different. In Unit 1 only one manual PCV vent was effective at 23.73 h, which is well predicted by all the participants.
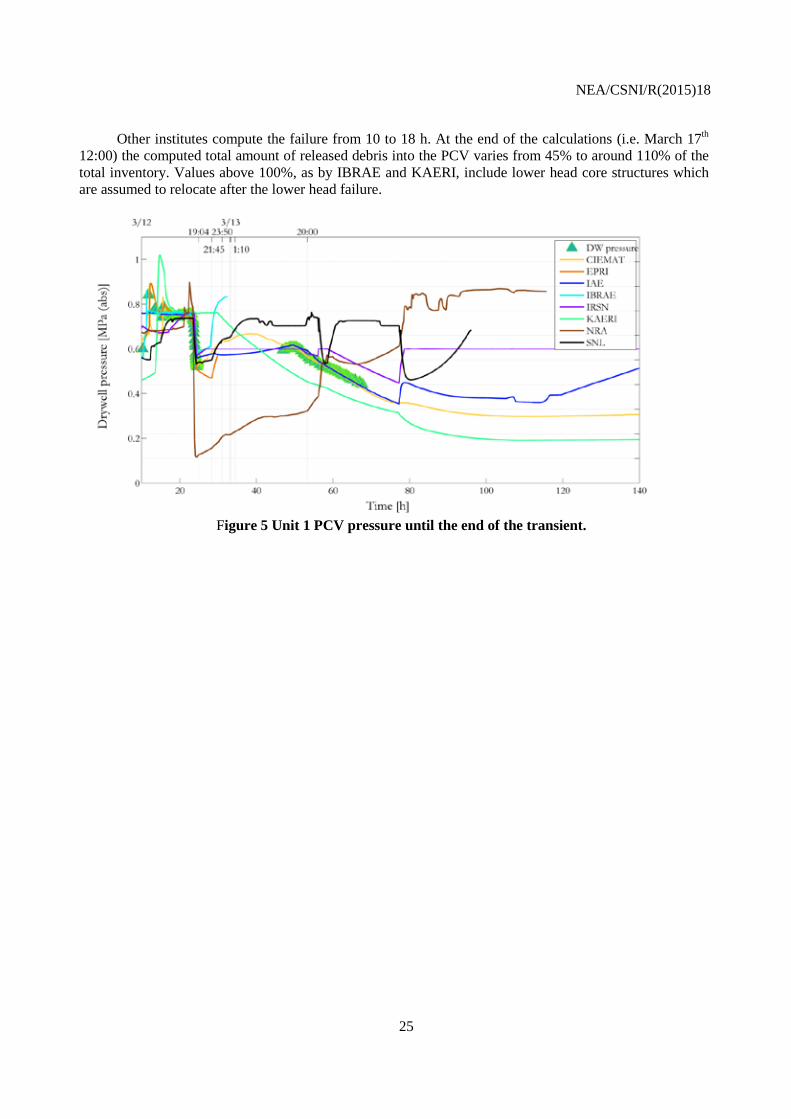
After the completion of the venting operation (24.68 h) measured D/W pressure data are missing until around 45h but the RPV data (meaningful until around 58 h) are representative of the slowly increasing pressure from the end of venting (Figure 5). All calculations predict MCCI to have already started before the activation of venting and consequently the DW pressure increase would be dependent on the balance between gas generated during MCCI (concrete interaction and steam generated due to external water quenching) and leakage assumed in the D/W through top head flange and/or other penetrations.
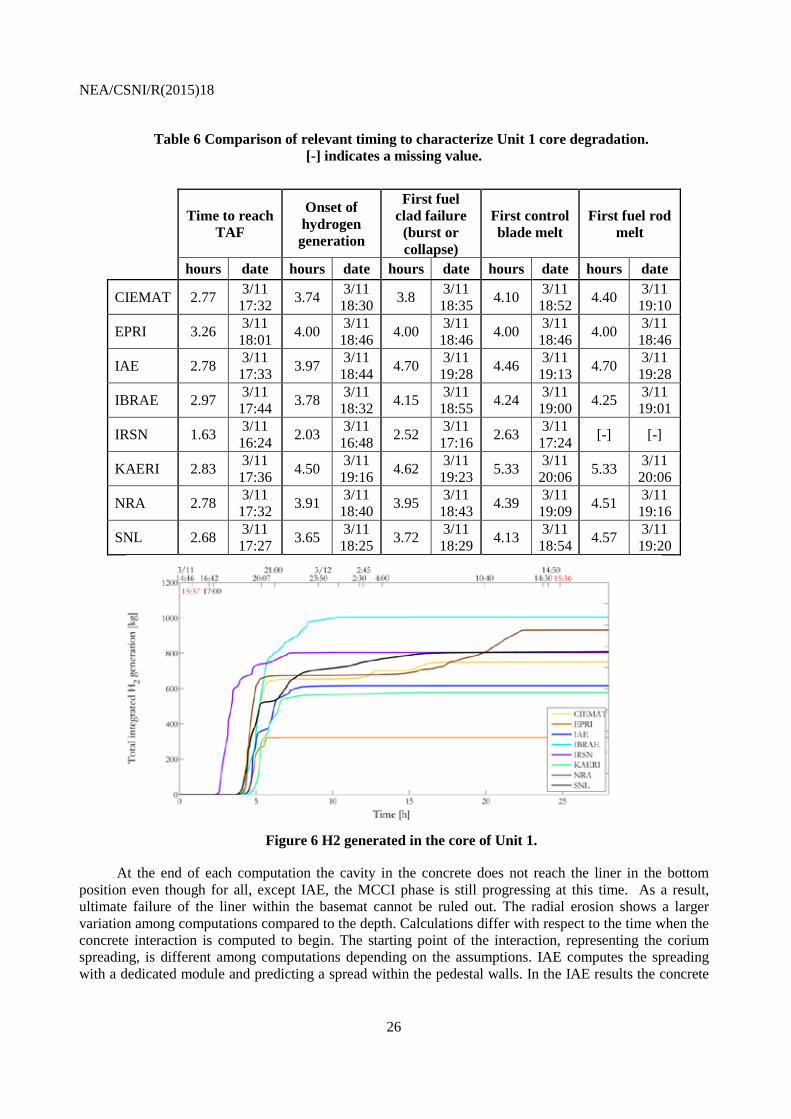
Hydrogen generation predictions are in general agreement while the core is predicted to be intact. Thereafter, once the corium relocation begins, trends and absolute values differ among computations with a mass variation from around 350 kg to around 1000 kg (ref. Figure 6). Every institute predicts the onset of ex-vessel relocation by vessel failure however the timing and total amount is fairly different. IAE predicts the earliest RPV failure around 6 h due to prediction of little retention of core debris on the core plate.
NEA/CSNI/R(2015)18
24
a)
b)
c)
Figure 4 Comparison against measurements and simulations in Unit 1. a) In-shroud water level, b) RPV pressure, c) D/W pressure.
NEA/CSNI/R(2015)18
25
Other institutes compute the failure from 10 to 18 h. At the end of the calculations (i.e. March 17th 12:00) the computed total amount of released debris into the PCV varies from 45% to around 110% of the total inventory. Values above 100%, as by IBRAE and KAERI, include lower head core structures which are assumed to relocate after the lower head failure.
Figure 5 Unit 1 PCV pressure until the end of the transient.
NEA/CSNI/R(2015)18
26
Table 6 Comparison of relevant timing to characterize Unit 1 core degradation. [-] indicates a missing value.
Time to reach
TAF
Onset of hydrogen generation
First fuel clad failure
(burst or collapse)
First control blade melt
First fuel rod melt
hours date hours date hours date hours date hours date
CIEMAT 2.77 3/11 17:32 3.74 3/11
18:30 3.8 3/11 18:35 4.10 3/11
18:52 4.40 3/11 19:10
EPRI 3.26 3/11 18:01 4.00 3/11
18:46 4.00 3/11 18:46 4.00 3/11
18:46 4.00 3/11 18:46
IAE 2.78 3/11 17:33 3.97 3/11
18:44 4.70 3/11 19:28 4.46 3/11
19:13 4.70 3/11 19:28
IBRAE 2.97 3/11 17:44 3.78 3/11
18:32 4.15 3/11 18:55 4.24 3/11
19:00 4.25 3/11 19:01
IRSN 1.63 3/11 16:24 2.03 3/11
16:48 2.52 3/11 17:16 2.63 3/11
17:24 [-] [-]
KAERI 2.83 3/11 17:36 4.50 3/11
19:16 4.62 3/11 19:23 5.33 3/11
20:06 5.33 3/11 20:06
NRA 2.78 3/11 17:32 3.91 3/11
18:40 3.95 3/11 18:43 4.39 3/11
19:09 4.51 3/11 19:16
SNL 2.68 3/11 17:27 3.65 3/11
18:25 3.72 3/11 18:29 4.13 3/11
18:54 4.57 3/11 19:20
Figure 6 H2 generated in the core of Unit 1.
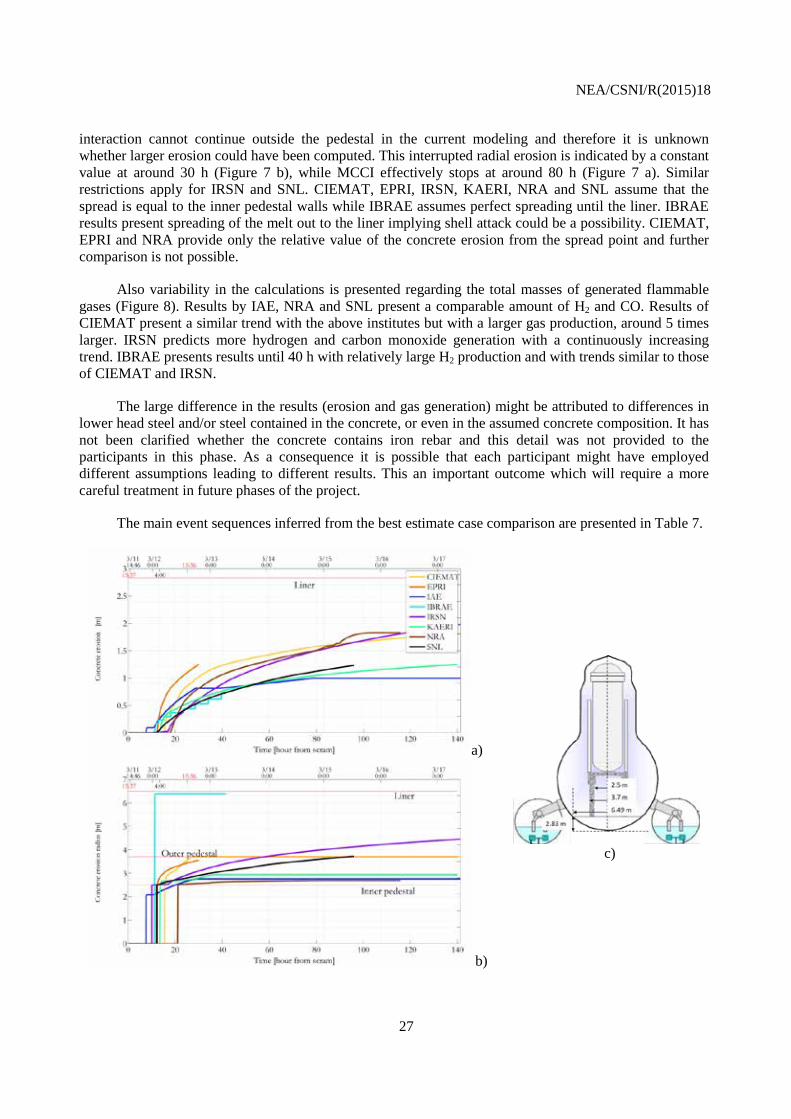
At the end of each computation the cavity in the concrete does not reach the liner in the bottom position even though for all, except IAE, the MCCI phase is still progressing at this time. As a result, ultimate failure of the liner within the basemat cannot be ruled out. The radial erosion shows a larger variation among computations compared to the depth. Calculations differ with respect to the time when the concrete interaction is computed to begin. The starting point of the interaction, representing the corium spreading, is different among computations depending on the assumptions. IAE computes the spreading with a dedicated module and predicting a spread within the pedestal walls. In the IAE results the concrete
NEA/CSNI/R(2015)18
27
interaction cannot continue outside the pedestal in the current modeling and therefore it is unknown whether larger erosion could have been computed. This interrupted radial erosion is indicated by a constant value at around 30 h (Figure 7 b), while MCCI effectively stops at around 80 h (Figure 7 a). Similar restrictions apply for IRSN and SNL. CIEMAT, EPRI, IRSN, KAERI, NRA and SNL assume that the spread is equal to the inner pedestal walls while IBRAE assumes perfect spreading until the liner. IBRAE results present spreading of the melt out to the liner implying shell attack could be a possibility. CIEMAT, EPRI and NRA provide only the relative value of the concrete erosion from the spread point and further comparison is not possible.
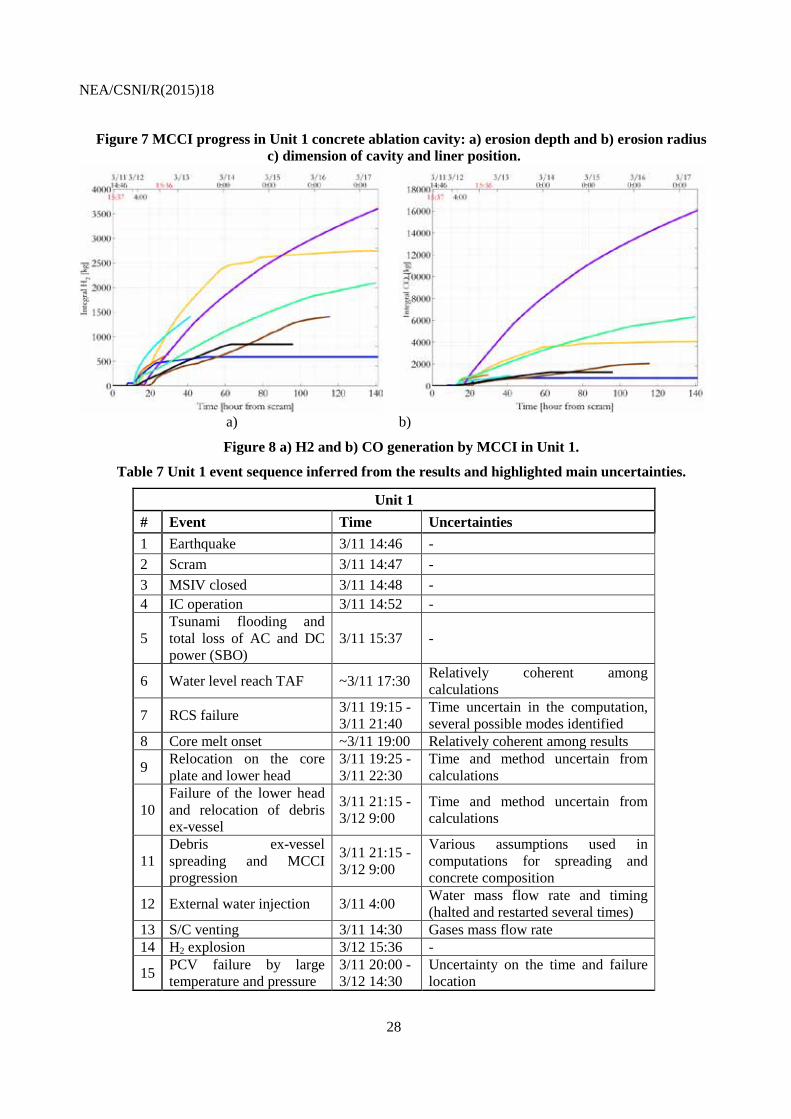
Also variability in the calculations is presented regarding the total masses of generated flammable gases (Figure 8). Results by IAE, NRA and SNL present a comparable amount of H2 and CO. Results of CIEMAT present a similar trend with the above institutes but with a larger gas production, around 5 times larger. IRSN predicts more hydrogen and carbon monoxide generation with a continuously increasing trend. IBRAE presents results until 40 h with relatively large H2 production and with trends similar to those of CIEMAT and IRSN.
The large difference in the results (erosion and gas generation) might be attributed to differences in lower head steel and/or steel contained in the concrete, or even in the assumed concrete composition. It has not been clarified whether the concrete contains iron rebar and this detail was not provided to the participants in this phase. As a consequence it is possible that each participant might have employed different assumptions leading to different results. This an important outcome which will require a more careful treatment in future phases of the project.
The main event sequences inferred from the best estimate case comparison are presented in Table 7.
a)
c)
b)
NEA/CSNI/R(2015)18
28
Figure 7 MCCI progress in Unit 1 concrete ablation cavity: a) erosion depth and b) erosion radius c) dimension of cavity and liner position.
a) b)
Figure 8 a) H2 and b) CO generation by MCCI in Unit 1.
Table 7 Unit 1 event sequence inferred from the results and highlighted main uncertainties.
Unit 1 # Event Time Uncertainties 1 Earthquake 3/11 14:46 - 2 Scram 3/11 14:47 - 3 MSIV closed 3/11 14:48 - 4 IC operation 3/11 14:52 -
5 Tsunami flooding and total loss of AC and DC power (SBO)
3/11 15:37 -
6 Water level reach TAF ~3/11 17:30 Relatively coherent among calculations
7 RCS failure 3/11 19:15 -3/11 21:40
Time uncertain in the computation, several possible modes identified
8 Core melt onset ~3/11 19:00 Relatively coherent among results
9 Relocation on the core plate and lower head
3/11 19:25 -3/11 22:30
Time and method uncertain from calculations
10 Failure of the lower head and relocation of debris ex-vessel
3/11 21:15 -3/12 9:00
Time and method uncertain from calculations
11 Debris ex-vessel spreading and MCCI progression
3/11 21:15 -3/12 9:00
Various assumptions used in computations for spreading and concrete composition
12 External water injection 3/11 4:00 Water mass flow rate and timing (halted and restarted several times)
13 S/C venting 3/11 14:30 Gases mass flow rate 14 H2 explosion 3/12 15:36 -
15 PCV failure by large temperature and pressure
3/11 20:00 -3/12 14:30
Uncertainty on the time and failure location

NEA/CSNI/R(2015)18
29
3.3.2 Unit 2
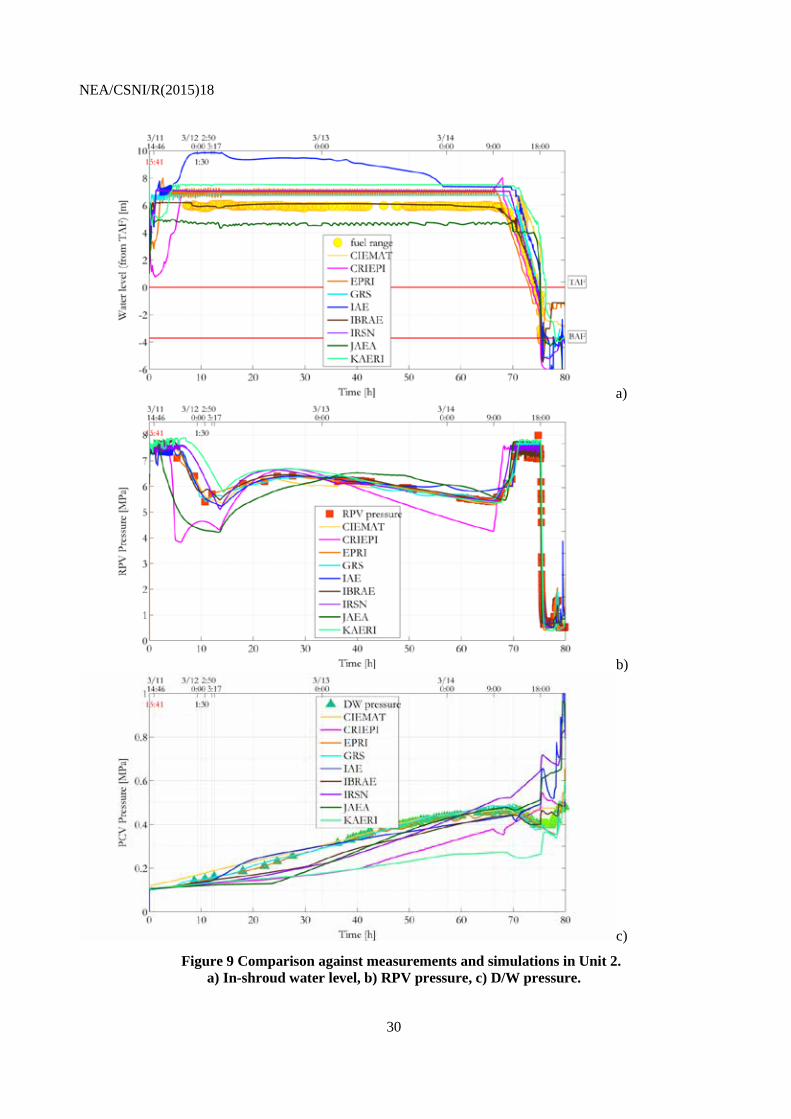
Regarding the accident progression in Unit 2, a number of unanswered questions remain. One hypothesized behavior concerns the long term operation of the RCIC turbine in Unit 2 where it is postulated that full flow injection of the RCIC pump flooded the RPV up to the steam lines. Thereafter it is theorized that two phase water carryover to the RCIC turbine resulted in reduced RCIC function and reduced water injection such that a self-regulating mode of operation was attained. Interestingly, the loss of DC during this self-regulating operation period would also disable other shutdown interlocks such as high water level and high turbine exhaust, which may also have been a key to the sustained operation of RCIC for nearly 3 days. With the above assumptions all the calculations could recreate plausible predictions of the water level (Figure 9 a) and RPV pressure until 70 h from reactor trip (Figure 9 b) when all calculations assumed the RCIC turbine to have stopped working.
The PCV pressure transient (Figure 9 c) shows a much slower pressure increase during the first 3 days of the accident progression compared to the behavior in unit 3, even though the RCIC turbine was transferring a mixture of steam and water back to the S/C for around 3 days. The water/steam mixture was injected into the S/C water pool at one point just about 1.3 m below the normal water level.
Assuming complete mixing of the injected water/steam mixture would lead to a low containment pressure prediction during the first hours, but complete mixing is not expected given the dimensions of the water pool. Furthermore the pool is not expected to receive decay heat for three days with such a relatively low measured pressure rise. Some additional factors are required to ensure the pressure increase remains low. Two possible scenarios have been discussed since the beginning of the project: a flooded torus room as a result of the tsunami or a significant S/C or D/W leakage.
In order to reproduce the measured low pressure increase, additional heat losses have been assumed from the S/C to a flooded torus room by all the institutes. JAEA assumed a heat removal value in order to predict a close agreement with the pressure, without modeling specific phenomena. Other institutes decided to model the torus room partly flooded with tsunami water. Even though there is no direct evidence of the amount of water effectively transferred to the torus room, the calculation results can give some important insights. Among the calculations there isn’t agreement on the timing of torus room flooding but, it is remarkable that there is relatively strong coherency among the codes on the total amount of water required. In general the results show that more than 2000 ton of seawater might have penetrated into the torus room and cooled the S/C externally. This means that around one quarter of the torus might have been flooded with water. The integral value is generally consistent among the calculations by CIEMAT, CRIEPI, GRS, IAE, IBRAE, IRSN and KAERI. At the end of the GRS calculation the water pool in the torus room reached saturation conditions and steam was produced.
Different nodalization has been used for the S/C water pool modelling (see Table 5) and the modelling of the heat transfer by the injected water/steam mixture to better compare with the measured PCV pressure (Figure 9 c). A vertical sub division of the S/C was used to model different mass flows from RCIC, HPCI and through SRV spargers and thermal mixing, as the injection points are located at different elevations and azimuthal locations. Finally, the assumption of a subcooled region at the bottom of the whole S/C as a minimum together with a coarse nodalization cannot well reproduce the pressure suppression on March 14th at 18:00 upon opening of the SRV valve. The use of a much more detailed S/C nodalization is a possible alternative. Further analyses are needed to substantiate the approach chosen. In summary, accounting for thermal stratification and external cooling by seawater flooding of the torus room seems to be required to capture the observed suppression pool pressure response in Unit 2.
NEA/CSNI/R(2015)18
30
a)
b)
c)
Figure 9 Comparison against measurements and simulations in Unit 2. a) In-shroud water level, b) RPV pressure, c) D/W pressure.
NEA/CSNI/R(2015)18
31
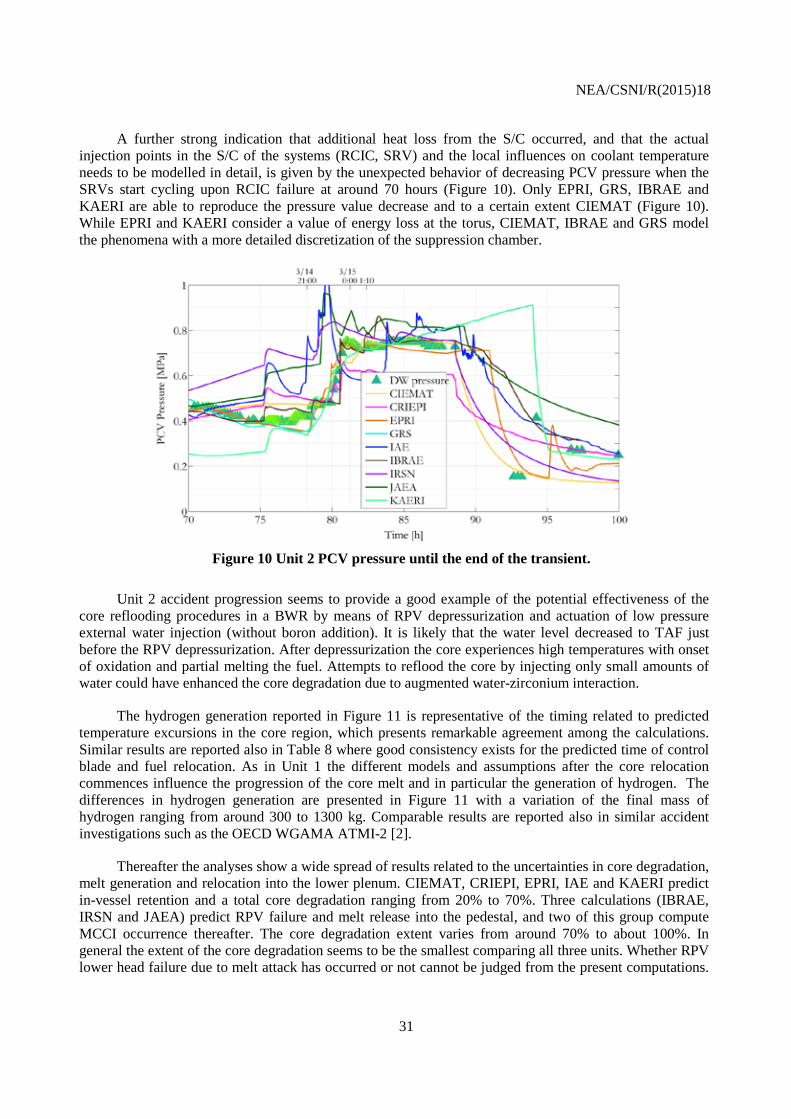
A further strong indication that additional heat loss from the S/C occurred, and that the actual injection points in the S/C of the systems (RCIC, SRV) and the local influences on coolant temperature needs to be modelled in detail, is given by the unexpected behavior of decreasing PCV pressure when the SRVs start cycling upon RCIC failure at around 70 hours (Figure 10). Only EPRI, GRS, IBRAE and KAERI are able to reproduce the pressure value decrease and to a certain extent CIEMAT (Figure 10). While EPRI and KAERI consider a value of energy loss at the torus, CIEMAT, IBRAE and GRS model the phenomena with a more detailed discretization of the suppression chamber.
Figure 10 Unit 2 PCV pressure until the end of the transient.
Unit 2 accident progression seems to provide a good example of the potential effectiveness of the core reflooding procedures in a BWR by means of RPV depressurization and actuation of low pressure external water injection (without boron addition). It is likely that the water level decreased to TAF just before the RPV depressurization. After depressurization the core experiences high temperatures with onset of oxidation and partial melting the fuel. Attempts to reflood the core by injecting only small amounts of water could have enhanced the core degradation due to augmented water-zirconium interaction.
The hydrogen generation reported in Figure 11 is representative of the timing related to predicted temperature excursions in the core region, which presents remarkable agreement among the calculations. Similar results are reported also in Table 8 where good consistency exists for the predicted time of control blade and fuel relocation. As in Unit 1 the different models and assumptions after the core relocation commences influence the progression of the core melt and in particular the generation of hydrogen. The differences in hydrogen generation are presented in Figure 11 with a variation of the final mass of hydrogen ranging from around 300 to 1300 kg. Comparable results are reported also in similar accident investigations such as the OECD WGAMA ATMI-2 [2].
Thereafter the analyses show a wide spread of results related to the uncertainties in core degradation, melt generation and relocation into the lower plenum. CIEMAT, CRIEPI, EPRI, IAE and KAERI predict in-vessel retention and a total core degradation ranging from 20% to 70%. Three calculations (IBRAE, IRSN and JAEA) predict RPV failure and melt release into the pedestal, and two of this group compute MCCI occurrence thereafter. The core degradation extent varies from around 70% to about 100%. In general the extent of the core degradation seems to be the smallest comparing all three units. Whether RPV lower head failure due to melt attack has occurred or not cannot be judged from the present computations.

NEA/CSNI/R(2015)18
32
A small failure at a pipe penetrating the RPV bottom cannot be excluded as water injected into the RPV reaches the pedestal. In general this remains an open issue.
Figure 11 H2 generated in the core region of Unit 2.
Table 8 Comparison of relevant timing to characterize Unit 2 core degradation. [-] indicates a missing value.
Time to reach
TAF
Onset of hydrogen generation
First fuel clad failure (burst or
collapse)
First control blade melt
First fuel rod melt
hours date hours date hours date hours date hours date
CIEMAT 75.77 3/14 18:32 77.06 3/14
19:49 77.13 3/14 19:55 77.88 3/14
20:38 79.21 3/14 21:58
CRIEPI 73.63 3/14 16:23 76.56 3/14
19:19 76.65 3/14 19:25 79.88 3/14
22:38 80.68 3/14 23:26
EPRI 73.47 3/14 16:14 74.48 3/14
17:15 74.48 3/14 17:15 74.48 3/14
17:15 [-] [-]
GRS 74.89 3/14 17:39 75.56 3/14
18:19 76.71 3/14 19:28 77.18 3/14
19:56 [-] [-]
IAE 75.40 3/14 18:10 76.00 3/14
18:46 76.97 3/14 19:44 77.33 3/14
20:05 77.56 3/14 20:19
IBRAE 74.67 3/14 17:26 76.22 3/14
18:59 76.59 3/14 19:21 77.76 3/14
20:31 80.11 3/14 22:52
IRSN 74.49 3/14 17:15 75.67 3/14
18:26 76.28 3/14 19:02 76.85 3/14
19:37 [-] [-]
JAEA 75.5 3/14 18:16 76.5 3/14
19:16 76.2 3/14 18:58 [-] [-] 77.3 3/14
20:04
KAERI 76.36 3/14 19:07 78.639 3/14
21:24 78.65 3/14 21:25 84.94 3/15
3:42 79.0 3/14 21:46
During the core degradation and reflood periods, large hydrogen masses have been generated, resulting in the PCV pressure increase of around 0.8 MPa (Figure 10 above). Due to the failure of manual PCV venting activation (because of the hydrogen explosion in Unit 3), the PCV is predicted by all institutes to experience leakage which is modelled as self-venting at the top head flange. Around 90 h, loss
NEA/CSNI/R(2015)18
33
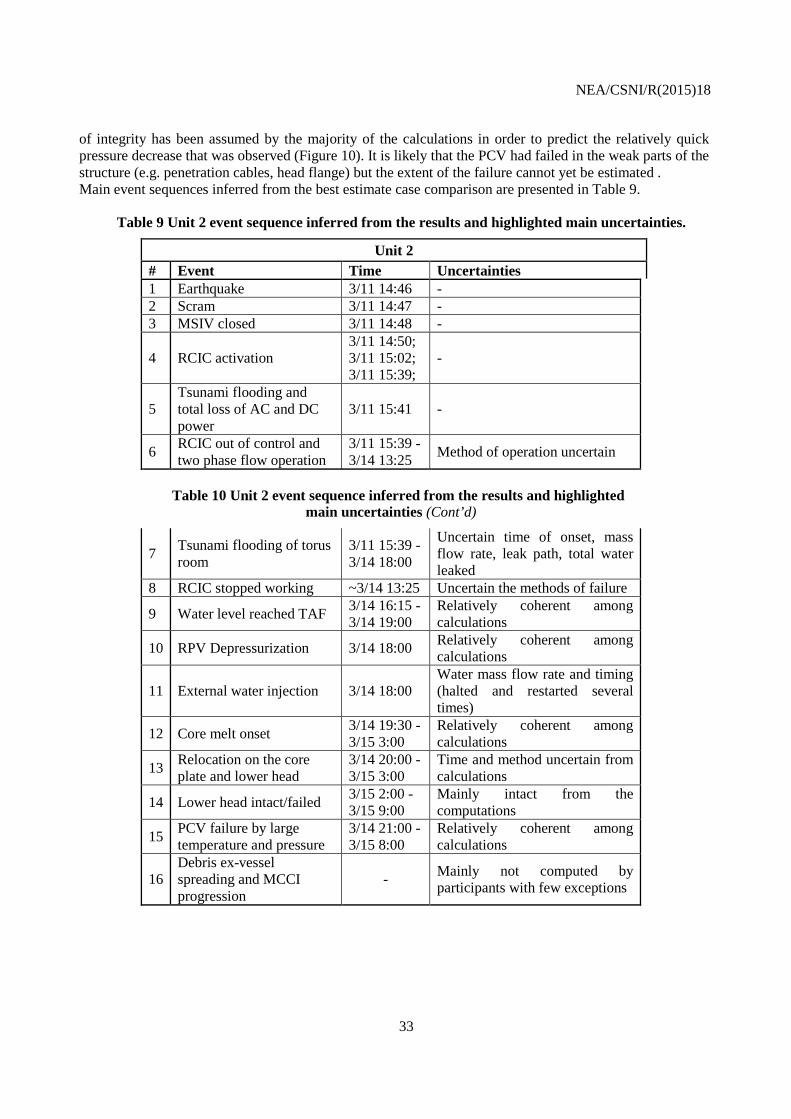
of integrity has been assumed by the majority of the calculations in order to predict the relatively quick pressure decrease that was observed (Figure 10). It is likely that the PCV had failed in the weak parts of the structure (e.g. penetration cables, head flange) but the extent of the failure cannot yet be estimated . Main event sequences inferred from the best estimate case comparison are presented in Table 9.
Table 9 Unit 2 event sequence inferred from the results and highlighted main uncertainties.
Unit 2 # Event Time Uncertainties 1 Earthquake 3/11 14:46 - 2 Scram 3/11 14:47 - 3 MSIV closed 3/11 14:48 -
4 RCIC activation 3/11 14:50; 3/11 15:02; 3/11 15:39;
-
5 Tsunami flooding and total loss of AC and DC power
3/11 15:41 -
6 RCIC out of control and two phase flow operation
3/11 15:39 -3/14 13:25 Method of operation uncertain
Table 10 Unit 2 event sequence inferred from the results and highlighted
main uncertainties (Cont’d)
7 Tsunami flooding of torus room
3/11 15:39 -3/14 18:00
Uncertain time of onset, mass flow rate, leak path, total water leaked
8 RCIC stopped working ~3/14 13:25 Uncertain the methods of failure
9 Water level reached TAF 3/14 16:15 -3/14 19:00
Relatively coherent among calculations
10 RPV Depressurization 3/14 18:00 Relatively coherent among calculations
11 External water injection 3/14 18:00 Water mass flow rate and timing (halted and restarted several times)
12 Core melt onset 3/14 19:30 -3/15 3:00
Relatively coherent among calculations
13 Relocation on the core plate and lower head
3/14 20:00 -3/15 3:00
Time and method uncertain from calculations
14 Lower head intact/failed 3/15 2:00 -3/15 9:00
Mainly intact from the computations
15 PCV failure by large temperature and pressure
3/14 21:00 -3/15 8:00
Relatively coherent among calculations
16 Debris ex-vessel spreading and MCCI progression
- Mainly not computed by participants with few exceptions
NEA/CSNI/R(2015)18
34
3.3.3 Unit 3
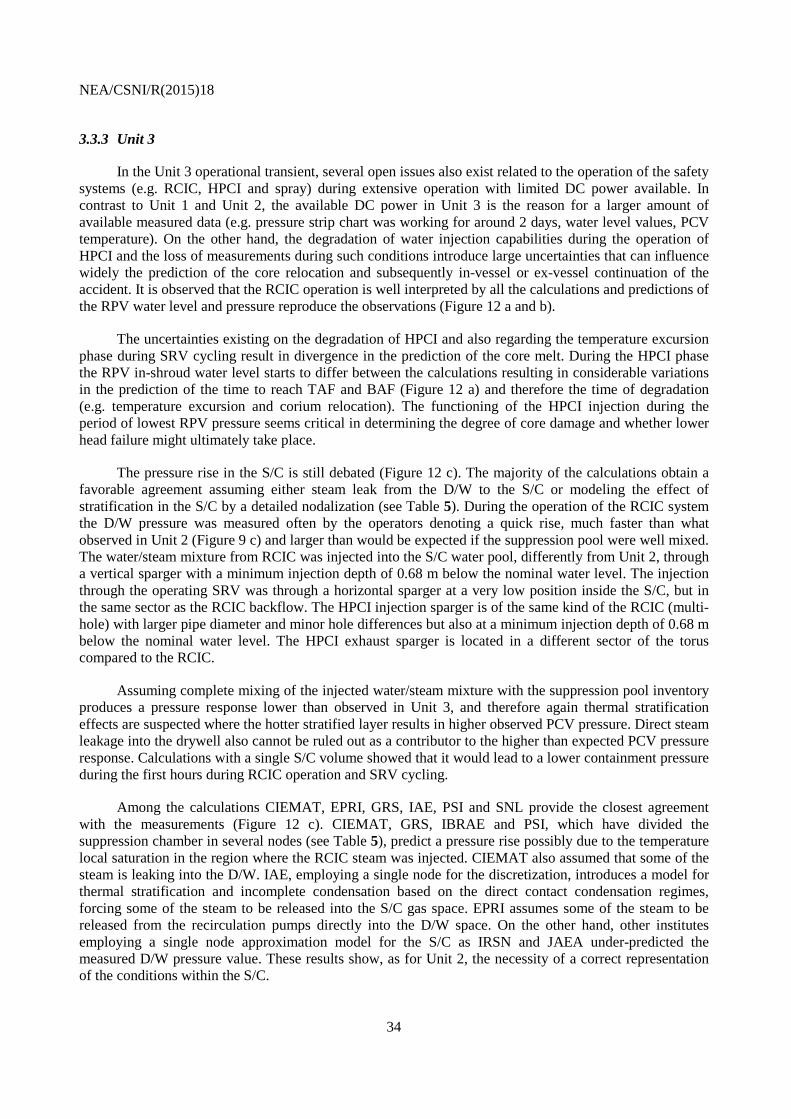
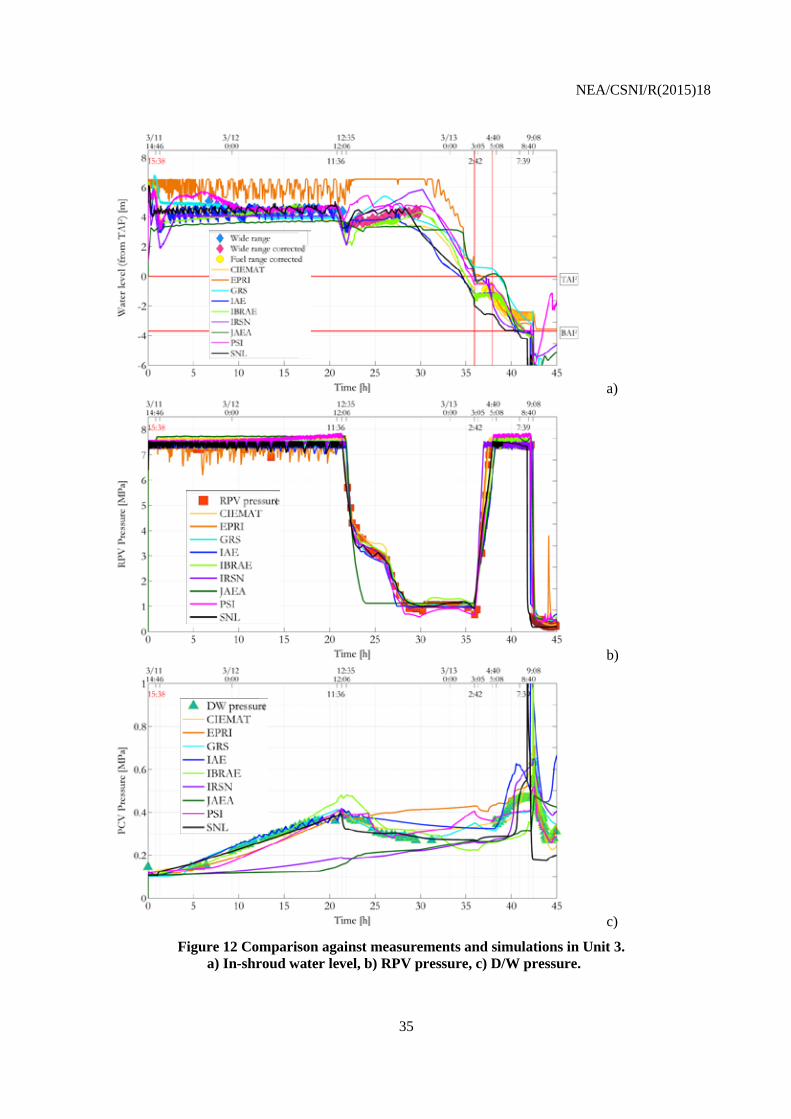
In the Unit 3 operational transient, several open issues also exist related to the operation of the safety systems (e.g. RCIC, HPCI and spray) during extensive operation with limited DC power available. In contrast to Unit 1 and Unit 2, the available DC power in Unit 3 is the reason for a larger amount of available measured data (e.g. pressure strip chart was working for around 2 days, water level values, PCV temperature). On the other hand, the degradation of water injection capabilities during the operation of HPCI and the loss of measurements during such conditions introduce large uncertainties that can influence widely the prediction of the core relocation and subsequently in-vessel or ex-vessel continuation of the accident. It is observed that the RCIC operation is well interpreted by all the calculations and predictions of the RPV water level and pressure reproduce the observations (Figure 12 a and b).
The uncertainties existing on the degradation of HPCI and also regarding the temperature excursion phase during SRV cycling result in divergence in the prediction of the core melt. During the HPCI phase the RPV in-shroud water level starts to differ between the calculations resulting in considerable variations in the prediction of the time to reach TAF and BAF (Figure 12 a) and therefore the time of degradation (e.g. temperature excursion and corium relocation). The functioning of the HPCI injection during the period of lowest RPV pressure seems critical in determining the degree of core damage and whether lower head failure might ultimately take place.
The pressure rise in the S/C is still debated (Figure 12 c). The majority of the calculations obtain a favorable agreement assuming either steam leak from the D/W to the S/C or modeling the effect of stratification in the S/C by a detailed nodalization (see Table 5). During the operation of the RCIC system the D/W pressure was measured often by the operators denoting a quick rise, much faster than what observed in Unit 2 (Figure 9 c) and larger than would be expected if the suppression pool were well mixed. The water/steam mixture from RCIC was injected into the S/C water pool, differently from Unit 2, through a vertical sparger with a minimum injection depth of 0.68 m below the nominal water level. The injection through the operating SRV was through a horizontal sparger at a very low position inside the S/C, but in the same sector as the RCIC backflow. The HPCI injection sparger is of the same kind of the RCIC (multi-hole) with larger pipe diameter and minor hole differences but also at a minimum injection depth of 0.68 m below the nominal water level. The HPCI exhaust sparger is located in a different sector of the torus compared to the RCIC.
Assuming complete mixing of the injected water/steam mixture with the suppression pool inventory produces a pressure response lower than observed in Unit 3, and therefore again thermal stratification effects are suspected where the hotter stratified layer results in higher observed PCV pressure. Direct steam leakage into the drywell also cannot be ruled out as a contributor to the higher than expected PCV pressure response. Calculations with a single S/C volume showed that it would lead to a lower containment pressure during the first hours during RCIC operation and SRV cycling.
Among the calculations CIEMAT, EPRI, GRS, IAE, PSI and SNL provide the closest agreement with the measurements (Figure 12 c). CIEMAT, GRS, IBRAE and PSI, which have divided the suppression chamber in several nodes (see Table 5), predict a pressure rise possibly due to the temperature local saturation in the region where the RCIC steam was injected. CIEMAT also assumed that some of the steam is leaking into the D/W. IAE, employing a single node for the discretization, introduces a model for thermal stratification and incomplete condensation based on the direct contact condensation regimes, forcing some of the steam to be released into the S/C gas space. EPRI assumes some of the steam to be released from the recirculation pumps directly into the D/W space. On the other hand, other institutes employing a single node approximation model for the S/C as IRSN and JAEA under-predicted the measured D/W pressure value. These results show, as for Unit 2, the necessity of a correct representation of the conditions within the S/C.
NEA/CSNI/R(2015)18
35
a)
b)
c)
Figure 12 Comparison against measurements and simulations in Unit 3. a) In-shroud water level, b) RPV pressure, c) D/W pressure.
NEA/CSNI/R(2015)18
36
Almost simultaneously with the HPCI operation, the S/C spray was started in order to decrease the PCV pressure. It should be mentioned that every institute assumed the same value of spray droplet diameter (i.e. 2 mm) but adjusted the flow rate below the maximum value (i.e. 13.8 kg/s). Most of calculations assume, in accordance with the benchmark prescriptions, that the ADS was operated at around 9:00 on March 13th. ADS opens 6 SRVs simultaneously which provide a good agreement with the depressurization time (around 2 minutes). However, the possibility was brought up by SNL that one MSL might have failed due to creep, providing also a good agreement with the quick measured pressure decrease. Details of the creep rupture model are not known but it is coherent among calculations of the same institute between Unit 1 and Unit 3.
After the RPV depressurization the external water injection started by means of a fire truck with several interruptions due to fuel or water depletion and the hydrogen explosion on March 14th at 11:01. Participants’ results indicate that a uncertainty on the amount of water effectively transferred to the RPV recirculation line. Computations assume from 50% to less than 10% of the water discharged from the pump (whose integral volume is known) to effectively reach the RCS/RPV. In general the mass flow rate of injected water is assumed as boundary conditions from the participants in a coherent way with the expected water level within the core. This value is found to be sensitive for the prediction of in-vessel or ex-vessel scenario and hydrogen generation.
For most of the calculations the PCV vents are assumed to start at the timing which was provided by the BSAF operating agent, and from TEPCO investigation [1], with some exceptions. In particular, doubts exist on the activations from the 3rd vent on. Also the mass flow rate is considerably different among calculations which might be because of differences in the assumed valve opening area. In the interest of gaining greater consistency, the valve characteristics will be provided in the next phase of this benchmark project.
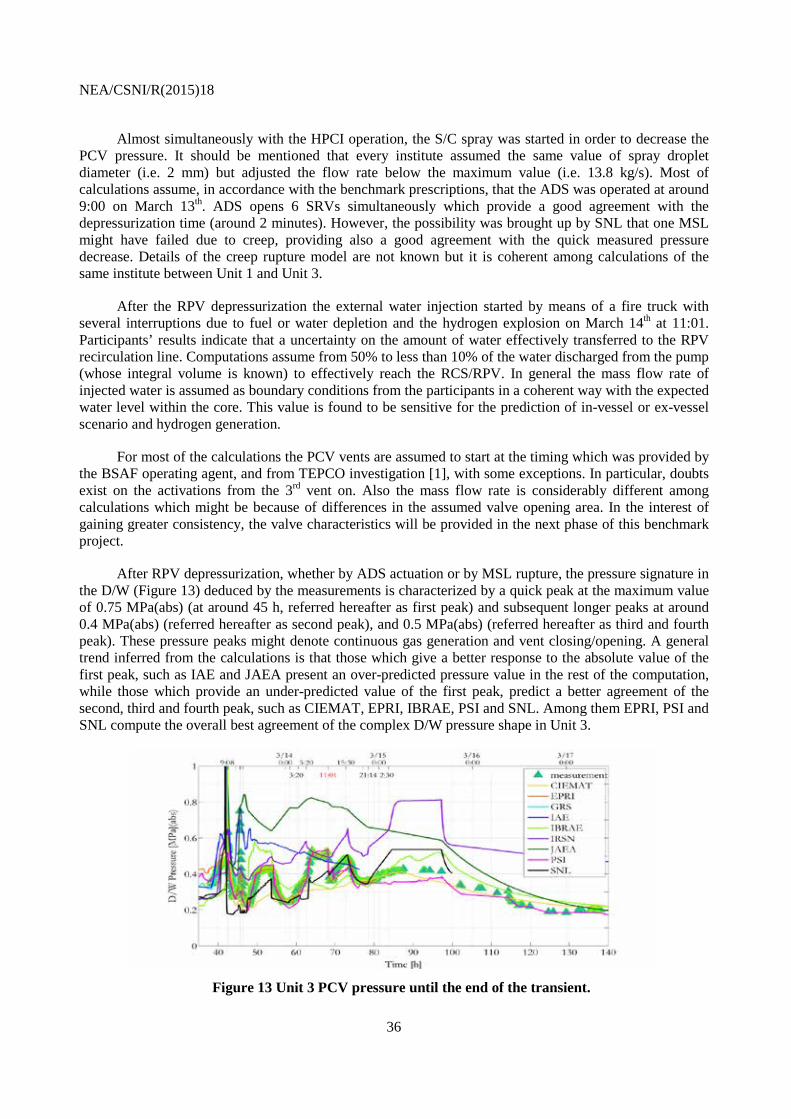
After RPV depressurization, whether by ADS actuation or by MSL rupture, the pressure signature in the D/W (Figure 13) deduced by the measurements is characterized by a quick peak at the maximum value of 0.75 MPa(abs) (at around 45 h, referred hereafter as first peak) and subsequent longer peaks at around 0.4 MPa(abs) (referred hereafter as second peak), and 0.5 MPa(abs) (referred hereafter as third and fourth peak). These pressure peaks might denote continuous gas generation and vent closing/opening. A general trend inferred from the calculations is that those which give a better response to the absolute value of the first peak, such as IAE and JAEA present an over-predicted pressure value in the rest of the computation, while those which provide an under-predicted value of the first peak, predict a better agreement of the second, third and fourth peak, such as CIEMAT, EPRI, IBRAE, PSI and SNL. Among them EPRI, PSI and SNL compute the overall best agreement of the complex D/W pressure shape in Unit 3.
Figure 13 Unit 3 PCV pressure until the end of the transient.
NEA/CSNI/R(2015)18
37
Given the large variability of the results, the conditions of the RPV and PCV are scattered among participants and a unique expected condition of the plant cannot be determined. However, in a general synthesis we could state that where vessel lower head failure is not predicted, the assumption of a reasonable vent size would be enough to qualitatively reproduce the measured PCV pressure transient, until the time before the hydrogen explosion. On the other hand, in predictions where lower head failure resulted with the accompanying MCCI, due to the much larger non condensable gas generation compared to the in-vessel case, the assumption of PCV failure is necessary to predict the containment pressure transient. Given the large variation among results regarding the core degradation phase, the boundary integrity also differs among results. As a general trend those calculations that compute failure of the RPV assume either PCV failure or a relatively long leak to maintain realistic pressure.
On the other hand in-vessel scenario cases without lower head failure do not usually require the assumption of a failure of the containment and leakage is assumed from head flange self-venting only when the pressure exceeds for a limited time period a threshold pressure. It should also be noted that in the case of in-vessel retention, as presented by two participants, the possibility of PCV failure exists. Indeed, the large temperatures produced during an in-vessel transient, might result in the PCV loss of integrity. Since there is no clear agreement between ex-vessel or in-vessel and several cases in both scenarios provide an acceptable agreement to the PCV pressure, the boundary integrity for this unit is still an open issue.
In Unit 3, the core degradation phase does not occur with the same large agreement as in the case of Unit 1 and Unit 2. The reason is the strong influence of the degradation conditions of the HPCI operation (i.e. injection flow at low RPV pressure), which affects the time for which calculations reach TAF. In addition temperature transients during the re-pressurization period increases the divergence among results. In the results computed by CIEMAT, EPRI, GRS, IAE, IBRAE, IRSN, JAEA and SNL, at the onset of the SRV cycling, the fuel temperature rises dramatically inducing high temperature close to the melting point in few minutes. It is worth noting that the beginning of the core relocation (timing reported in Table 10) is predicted by the calculations in the same order as the timing when SRV is computed to start cycling (ref. Figure 12 b). All the above calculations predict onset of core relocation before the system depressurization occurred on March 13th around 9:08. PSI reports a slower fuel temperature transient predicting the onset of the core relocation around one hour after the system depressurization. It is expected that convective and radiative heat transfer contributions play a critical role in the energy balance and thus in the temperature escalation. Additionally, the significant differences in the chosen core nodalization (see Table 5) could have a significant effect. The results have a large uncertainty in the likely time frame when core relocation might have started.
Table 11 Comparison of relevant timing to characterize Unit 3 core degradation. [-] indicates a missing value.
Time to reach
TAF
Onset of hydrogen generation
First clad failure
First control blade melt
First fuel rod melt
hours date hours date hours date hours date hours date
CIEMAT 35.94 3/13 2:42 39.22 3/13
5:59 39.33 3/13 6:06 39.78 3/13
6:32 40.11 3/13 6:52
EPRI 35.68 3/13 2:26 38.35 3/13
5:07 38.35 3/13 5:07 38.35 3/13
5:07 38.35 3/13 5:07
GRS 38.70 3/13 5:28 39.55 3/13
6:19 41.86 3/13 8:37 41.79 3/13
8:33 41.86 3/13 8:37
IAE 34.25 3/13 1:01 40.48 3/13
7:14 41.64 3/13 8:24 41.18 3/13
7:56 42.10 3/13 8:52
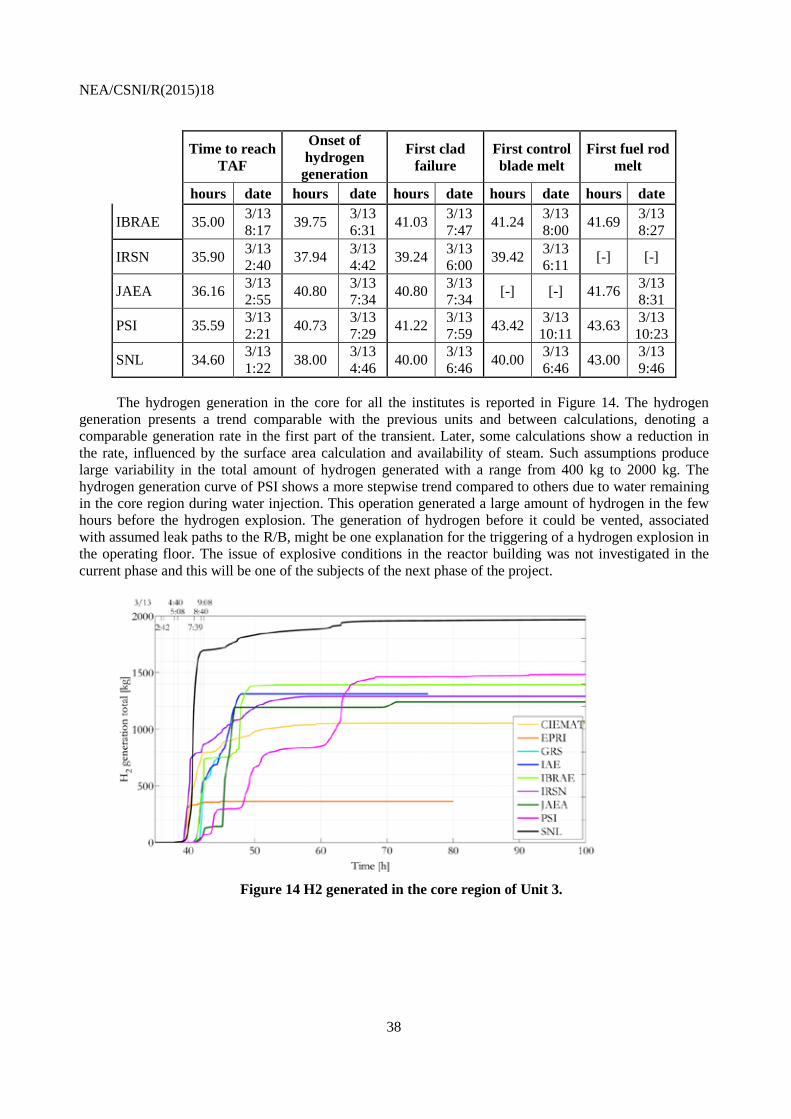
NEA/CSNI/R(2015)18
38
Time to reach
TAF
Onset of hydrogen generation
First clad failure
First control blade melt
First fuel rod melt
hours date hours date hours date hours date hours date
IBRAE 35.00 3/13 8:17 39.75 3/13
6:31 41.03 3/13 7:47 41.24 3/13
8:00 41.69 3/13 8:27
IRSN 35.90 3/13 2:40 37.94 3/13
4:42 39.24 3/13 6:00 39.42 3/13
6:11 [-] [-]
JAEA 36.16 3/13 2:55 40.80 3/13
7:34 40.80 3/13 7:34 [-] [-] 41.76 3/13
8:31
PSI 35.59 3/13 2:21 40.73 3/13
7:29 41.22 3/13 7:59 43.42 3/13
10:11 43.63 3/13 10:23
SNL 34.60 3/13 1:22 38.00 3/13
4:46 40.00 3/13 6:46 40.00 3/13
6:46 43.00 3/13 9:46
The hydrogen generation in the core for all the institutes is reported in Figure 14. The hydrogen generation presents a trend comparable with the previous units and between calculations, denoting a comparable generation rate in the first part of the transient. Later, some calculations show a reduction in the rate, influenced by the surface area calculation and availability of steam. Such assumptions produce large variability in the total amount of hydrogen generated with a range from 400 kg to 2000 kg. The hydrogen generation curve of PSI shows a more stepwise trend compared to others due to water remaining in the core region during water injection. This operation generated a large amount of hydrogen in the few hours before the hydrogen explosion. The generation of hydrogen before it could be vented, associated with assumed leak paths to the R/B, might be one explanation for the triggering of a hydrogen explosion in the operating floor. The issue of explosive conditions in the reactor building was not investigated in the current phase and this will be one of the subjects of the next phase of the project.
Figure 14 H2 generated in the core region of Unit 3.
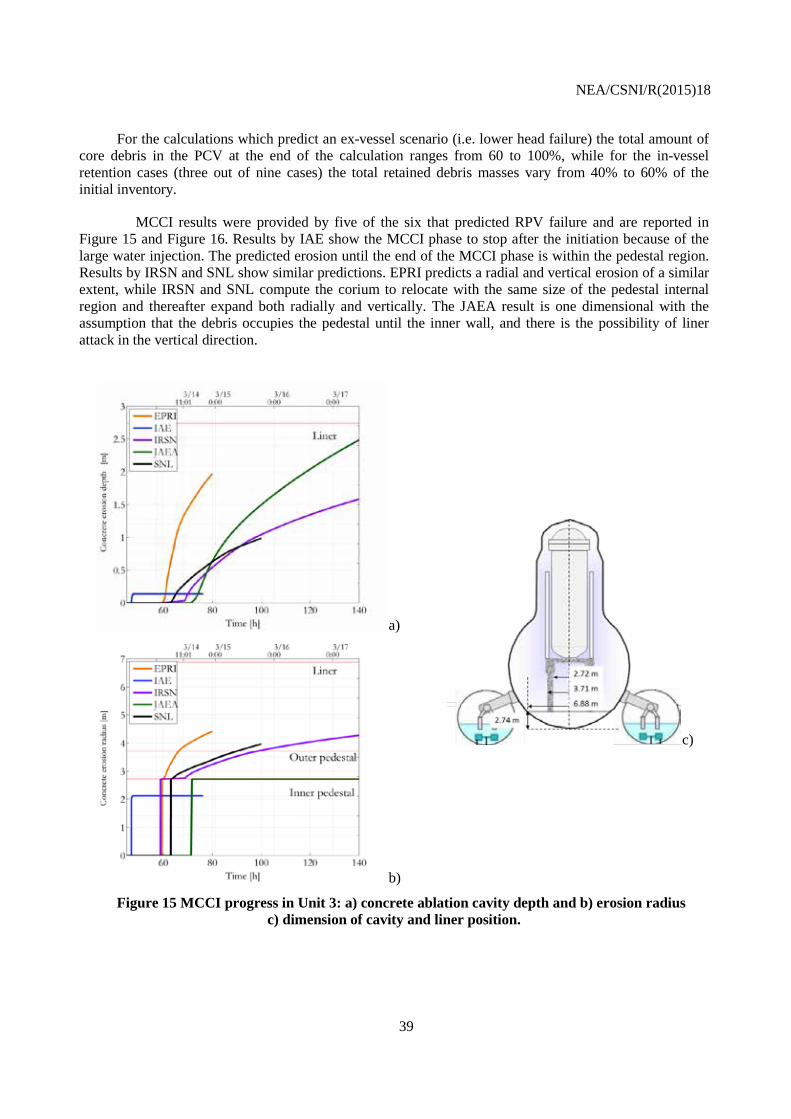
NEA/CSNI/R(2015)18
39
For the calculations which predict an ex-vessel scenario (i.e. lower head failure) the total amount of core debris in the PCV at the end of the calculation ranges from 60 to 100%, while for the in-vessel retention cases (three out of nine cases) the total retained debris masses vary from 40% to 60% of the initial inventory.
MCCI results were provided by five of the six that predicted RPV failure and are reported in Figure 15 and Figure 16. Results by IAE show the MCCI phase to stop after the initiation because of the large water injection. The predicted erosion until the end of the MCCI phase is within the pedestal region. Results by IRSN and SNL show similar predictions. EPRI predicts a radial and vertical erosion of a similar extent, while IRSN and SNL compute the corium to relocate with the same size of the pedestal internal region and thereafter expand both radially and vertically. The JAEA result is one dimensional with the assumption that the debris occupies the pedestal until the inner wall, and there is the possibility of liner attack in the vertical direction.
a)
c)
b)
Figure 15 MCCI progress in Unit 3: a) concrete ablation cavity depth and b) erosion radius c) dimension of cavity and liner position.
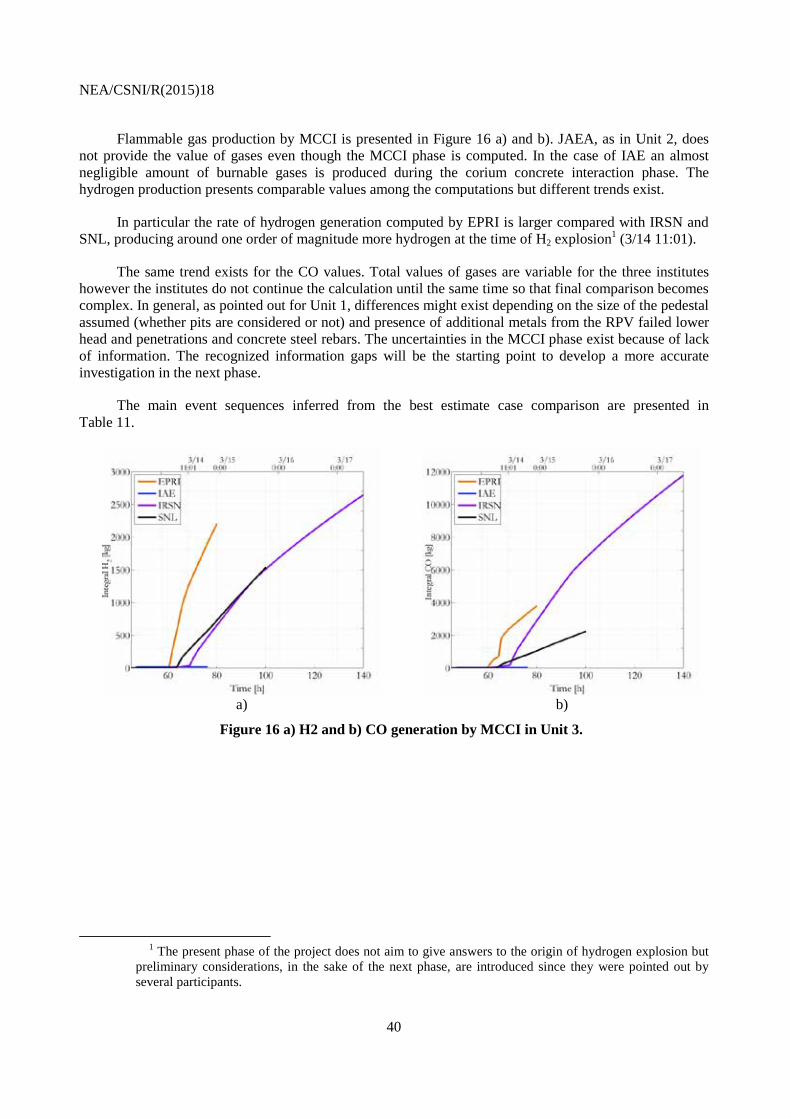
NEA/CSNI/R(2015)18
40
Flammable gas production by MCCI is presented in Figure 16 a) and b). JAEA, as in Unit 2, does not provide the value of gases even though the MCCI phase is computed. In the case of IAE an almost negligible amount of burnable gases is produced during the corium concrete interaction phase. The hydrogen production presents comparable values among the computations but different trends exist.
In particular the rate of hydrogen generation computed by EPRI is larger compared with IRSN and SNL, producing around one order of magnitude more hydrogen at the time of H2 explosion1 (3/14 11:01).
The same trend exists for the CO values. Total values of gases are variable for the three institutes however the institutes do not continue the calculation until the same time so that final comparison becomes complex. In general, as pointed out for Unit 1, differences might exist depending on the size of the pedestal assumed (whether pits are considered or not) and presence of additional metals from the RPV failed lower head and penetrations and concrete steel rebars. The uncertainties in the MCCI phase exist because of lack of information. The recognized information gaps will be the starting point to develop a more accurate investigation in the next phase.
The main event sequences inferred from the best estimate case comparison are presented in Table 11.
a) b)
Figure 16 a) H2 and b) CO generation by MCCI in Unit 3.
1 The present phase of the project does not aim to give answers to the origin of hydrogen explosion but
preliminary considerations, in the sake of the next phase, are introduced since they were pointed out by several participants.
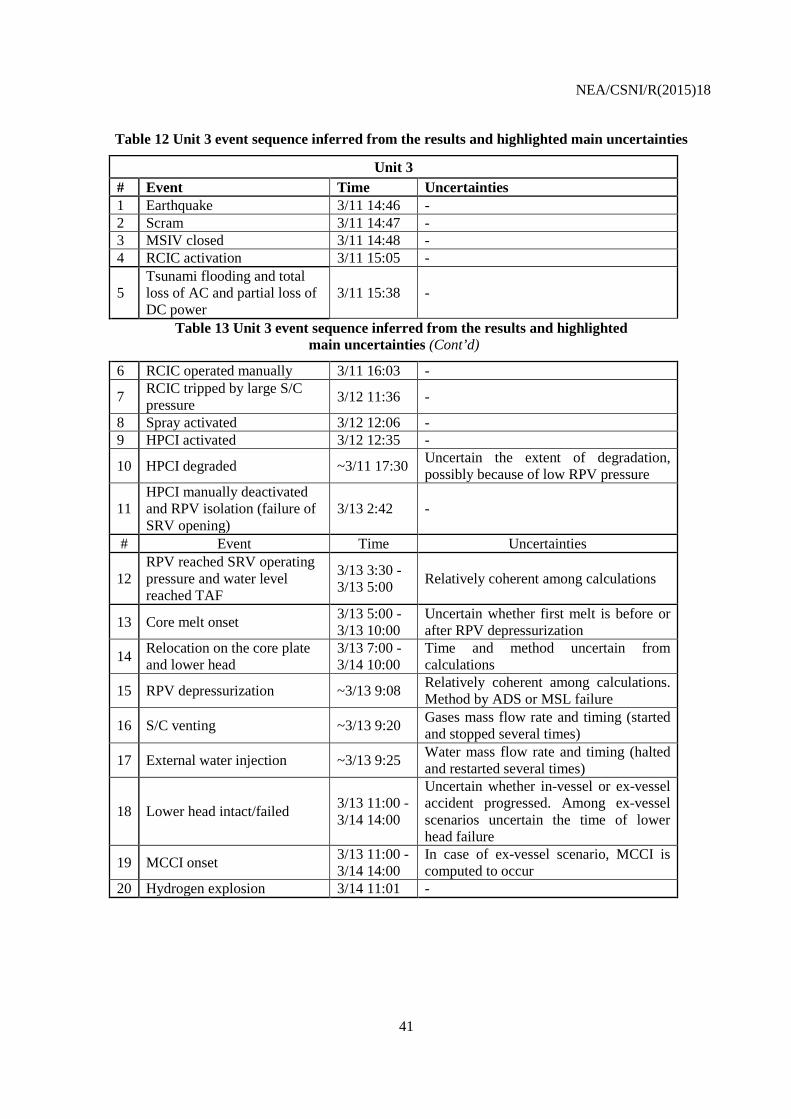
NEA/CSNI/R(2015)18
41
Table 12 Unit 3 event sequence inferred from the results and highlighted main uncertainties
Unit 3 # Event Time Uncertainties 1 Earthquake 3/11 14:46 - 2 Scram 3/11 14:47 - 3 MSIV closed 3/11 14:48 - 4 RCIC activation 3/11 15:05 -
5 Tsunami flooding and total loss of AC and partial loss of DC power
3/11 15:38 -
Table 13 Unit 3 event sequence inferred from the results and highlighted main uncertainties (Cont’d)
6 RCIC operated manually 3/11 16:03 -
7 RCIC tripped by large S/C pressure 3/12 11:36 -
8 Spray activated 3/12 12:06 - 9 HPCI activated 3/12 12:35 -
10 HPCI degraded ~3/11 17:30 Uncertain the extent of degradation, possibly because of low RPV pressure
11 HPCI manually deactivated and RPV isolation (failure of SRV opening)
3/13 2:42 -
# Event Time Uncertainties
12 RPV reached SRV operating pressure and water level reached TAF
3/13 3:30 -3/13 5:00 Relatively coherent among calculations
13 Core melt onset 3/13 5:00 -3/13 10:00
Uncertain whether first melt is before or after RPV depressurization
14 Relocation on the core plate and lower head
3/13 7:00 -3/14 10:00
Time and method uncertain from calculations
15 RPV depressurization ~3/13 9:08 Relatively coherent among calculations. Method by ADS or MSL failure
16 S/C venting ~3/13 9:20 Gases mass flow rate and timing (started and stopped several times)
17 External water injection ~3/13 9:25 Water mass flow rate and timing (halted and restarted several times)
18 Lower head intact/failed 3/13 11:00 -3/14 14:00
Uncertain whether in-vessel or ex-vessel accident progressed. Among ex-vessel scenarios uncertain the time of lower head failure
19 MCCI onset 3/13 11:00 -3/14 14:00
In case of ex-vessel scenario, MCCI is computed to occur
20 Hydrogen explosion 3/14 11:01 -

NEA/CSNI/R(2015)18
42
4. IMPLICATIONS ON THE REACTOR DEFUELING AND DECOMMISSIONING
4.1 Predicted reactor status and debris compositions
An important goal of the BSAF effort was to provide information regarding the damage state of each reactor and the likely composition of relocated core materials using best estimate predictive capabilities of severe accident codes. While morphological information is not generally predicted by the codes, the relocated material components (i.e. steel, UO2, Zr, B4C) predicted in the analyses can be used as a basis for forecasting the types of alloys or conglomerations formed, their hardness, etc. These predictions can in turn inform decommissioning activities in the development of defueling technologies and tools to remove damaged structures, components and fuel debris.
Every calculation predicted that extensive damage occurred in the Unit 1 core region (large relocation of core debris into the lower head) with lower head failure and further relocation in the pedestal region where materials may be partly frozen on lower control rod drive components below the vessel or even on the concrete cavity floor where significant MCCI may have occurred. Code results generally predict that nearly all of the vessel fuel and lower plenum structural components were relocated ex-vessel, resulting in concrete erosion to varying degrees.
Figure 17 a) illustrates a qualitative description of the expected status of the unit 1. The white shape in the core region represents the void, while the red shapes in the core, lower plenum and pedestal regions indicate core debris. The water level in the pedestal is not shown. Consensus was reached that the RPV has failed and a large amount of melt was relocated into the pedestal where MCCI started before the first water injection by fire truck on 4:00 on March 12th. In all the calculations MCCI is predicted to be ongoing at the end of the calculations 6 days after reactor trip. The cavity ablation in the axial direction indicated moderate erosion, some analyses not eroding completely to the steel liner, but other analyses indicating still ongoing erosion at the termination of the analysis.
As for unit 2, in the in-vessel scenario it is possible that from around 20% to 70% of the initial core inventory melted and relocated into the lower head where it was retained without global failure of the lower head. The majority of calculations do not predict RPV failure with a configuration close to what schematically presented in Figure 17 b).
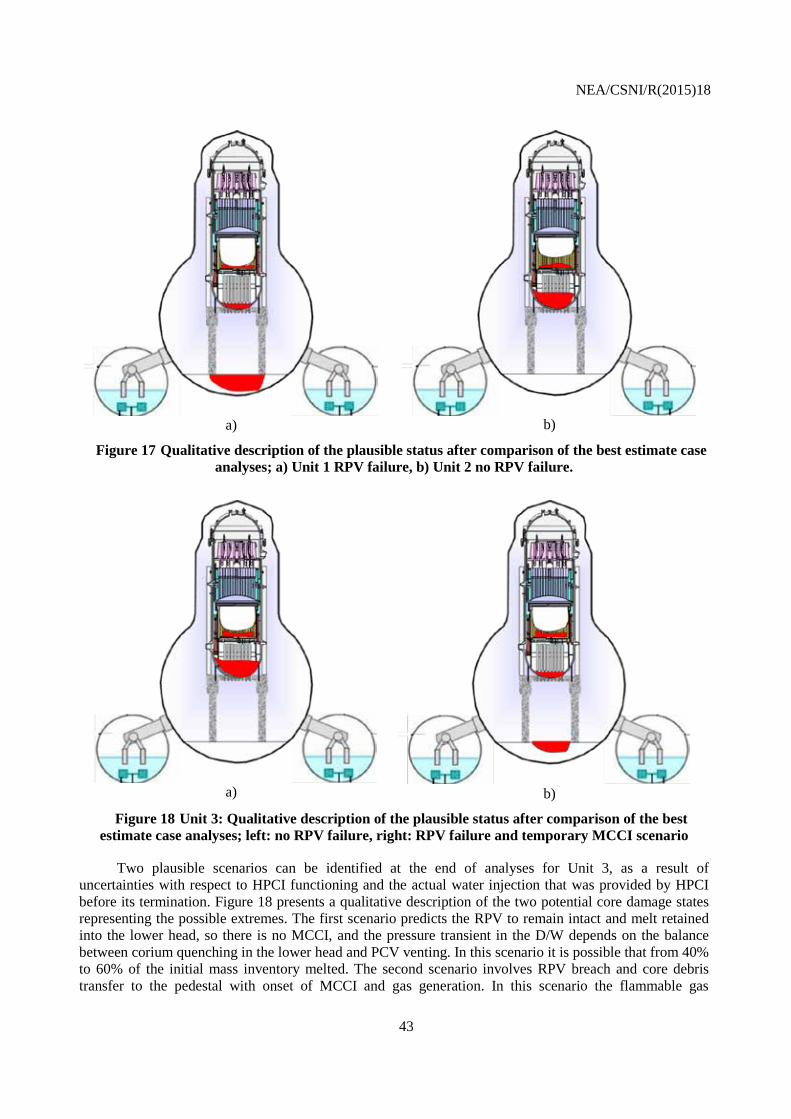
NEA/CSNI/R(2015)18
43
a) b)
Figure 17 Qualitative description of the plausible status after comparison of the best estimate case analyses; a) Unit 1 RPV failure, b) Unit 2 no RPV failure.
a)
b)
Figure 18 Unit 3: Qualitative description of the plausible status after comparison of the best estimate case analyses; left: no RPV failure, right: RPV failure and temporary MCCI scenario
Two plausible scenarios can be identified at the end of analyses for Unit 3, as a result of uncertainties with respect to HPCI functioning and the actual water injection that was provided by HPCI before its termination. Figure 18 presents a qualitative description of the two potential core damage states representing the possible extremes. The first scenario predicts the RPV to remain intact and melt retained into the lower head, so there is no MCCI, and the pressure transient in the D/W depends on the balance between corium quenching in the lower head and PCV venting. In this scenario it is possible that from 40% to 60% of the initial mass inventory melted. The second scenario involves RPV breach and core debris transfer to the pedestal with onset of MCCI and gas generation. In this scenario the flammable gas
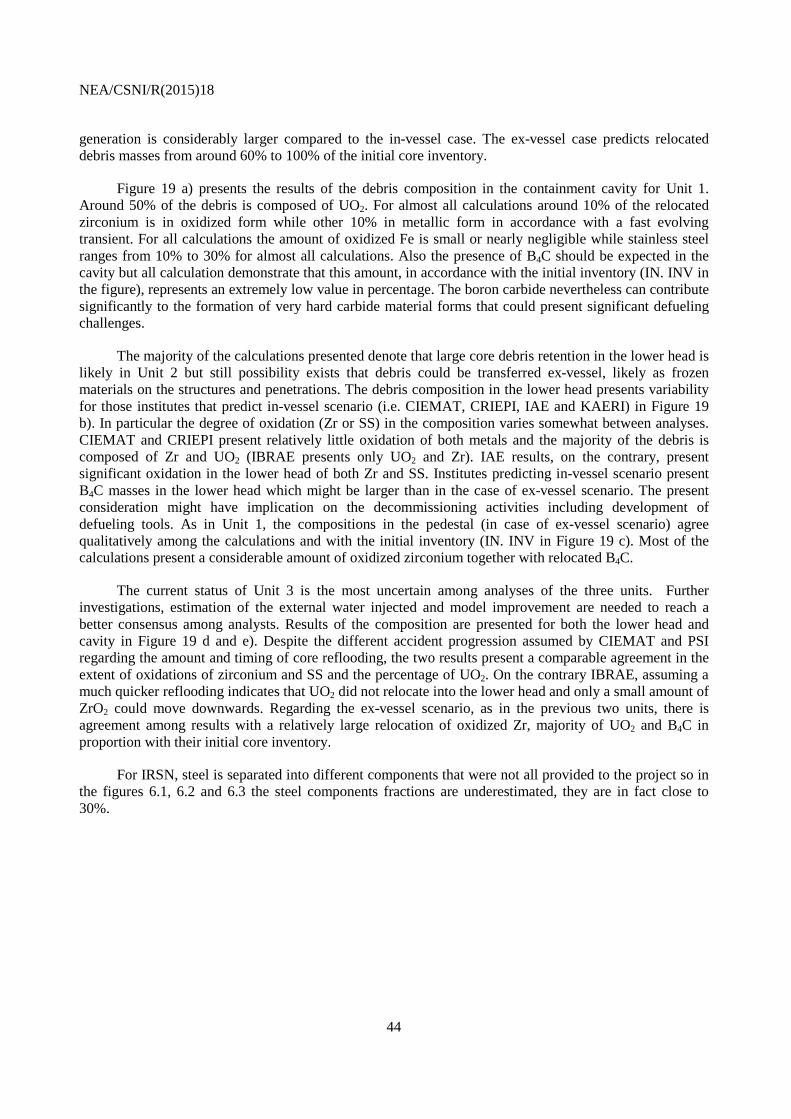
NEA/CSNI/R(2015)18
44
generation is considerably larger compared to the in-vessel case. The ex-vessel case predicts relocated debris masses from around 60% to 100% of the initial core inventory.
Figure 19 a) presents the results of the debris composition in the containment cavity for Unit 1. Around 50% of the debris is composed of UO2. For almost all calculations around 10% of the relocated zirconium is in oxidized form while other 10% in metallic form in accordance with a fast evolving transient. For all calculations the amount of oxidized Fe is small or nearly negligible while stainless steel ranges from 10% to 30% for almost all calculations. Also the presence of B4C should be expected in the cavity but all calculation demonstrate that this amount, in accordance with the initial inventory (IN. INV in the figure), represents an extremely low value in percentage. The boron carbide nevertheless can contribute significantly to the formation of very hard carbide material forms that could present significant defueling challenges.
The majority of the calculations presented denote that large core debris retention in the lower head is likely in Unit 2 but still possibility exists that debris could be transferred ex-vessel, likely as frozen materials on the structures and penetrations. The debris composition in the lower head presents variability for those institutes that predict in-vessel scenario (i.e. CIEMAT, CRIEPI, IAE and KAERI) in Figure 19 b). In particular the degree of oxidation (Zr or SS) in the composition varies somewhat between analyses. CIEMAT and CRIEPI present relatively little oxidation of both metals and the majority of the debris is composed of Zr and UO2 (IBRAE presents only UO2 and Zr). IAE results, on the contrary, present significant oxidation in the lower head of both Zr and SS. Institutes predicting in-vessel scenario present B4C masses in the lower head which might be larger than in the case of ex-vessel scenario. The present consideration might have implication on the decommissioning activities including development of defueling tools. As in Unit 1, the compositions in the pedestal (in case of ex-vessel scenario) agree qualitatively among the calculations and with the initial inventory (IN. INV in Figure 19 c). Most of the calculations present a considerable amount of oxidized zirconium together with relocated B4C.
The current status of Unit 3 is the most uncertain among analyses of the three units. Further investigations, estimation of the external water injected and model improvement are needed to reach a better consensus among analysts. Results of the composition are presented for both the lower head and cavity in Figure 19 d and e). Despite the different accident progression assumed by CIEMAT and PSI regarding the amount and timing of core reflooding, the two results present a comparable agreement in the extent of oxidations of zirconium and SS and the percentage of UO2. On the contrary IBRAE, assuming a much quicker reflooding indicates that UO2 did not relocate into the lower head and only a small amount of ZrO2 could move downwards. Regarding the ex-vessel scenario, as in the previous two units, there is agreement among results with a relatively large relocation of oxidized Zr, majority of UO2 and B4C in proportion with their initial core inventory.
For IRSN, steel is separated into different components that were not all provided to the project so in the figures 6.1, 6.2 and 6.3 the steel components fractions are underestimated, they are in fact close to 30%.
NEA/CSNI/R(2015)18
45
Figure 19 Unit 1 ex-vessel debris composition a); Unit 2 lower head b) and ex-vessel debris
composition c); Unit 3 lower head d) and ex-vessel debris composition e).
0%
20%
40%
60%
80%
100%
Deb
ris c
ompo
sitio
n [%
] UO2ZrZrO2SSSSOxB4C
0%
20%
40%
60%
80%
100%
IBRAE IRSN JAEA IN.INV.
Deb
ris c
ompo
sitio
n [%
] UO2ZrZrO2SSSSOxB4C
0%
20%
40%
60%
80%
100%
CIEMAT IBRAE PSI
Deb
ris c
ompo
sitio
n [%
]
UO2 [kg]Zr [kg]ZrO2 [kg]SS [kg]SSOx [kg]B4C [kg]
0%
20%
40%
60%
80%
100%
IAE IRSN JAEA IN. INV.
Deb
ris c
ompo
sitio
n [%
]
UO2 [kg]Zr [kg]ZrO2 [kg]SS [kg]SSOx [kg]B4C [kg]
b)
d) e)
c)
NEA/CSNI/R(2015)18
46
4.2 Possible Repercussions on the Decommissioning Activities
Defueling is an essential step in the process of decommissioning the plants, and is required to:
- Preclude the possibility of recriticality of the fissile materials - Reduce the contamination potential to the environment.
Three Mile Island Unit 2 (TMI-2) is the only example of a LWR that experienced fuel damage and then underwent an extensive defueling phase. It is a natural reference point for our purposes. In TMI-2 the real condition became known through both measurements and internal visualization while in case of Fukushima Daiichi and the present project, computational analyses presently serve as the chief means of estimating core damages until visual observations or imaging can be achieved. (It is interesting to note that at the time of the summary report preparation tentative muon imaging investigations are indicating that no identifiable materials can be seen in the core region of the damaged Unit 1 reactor – consistent with the predictions of most codes). As described in the results, important points of agreement in the development of the accident scenario and in the debris location and composition can be drawn comparing the best estimate cases.
Two examples of possible features of BWR accident core debris that may pose challenges during recovery are suggested here:
1. Effect of larger zirconium inventories; 2. Effect of boride and carbide inclusions in debris or alloying to form hard carbide forms.
It should be remembered that SA codes do not provide local information of the debris final state but averaged values of metal and oxide phases. Therefore the following discussion should be interpreted as complementary information to those directly obtained from the BSAF project.
4.2.1 Effect of larger zirconium inventories compared to PWR
BWRs have larger inventories of zirconium metal than do PWRs. Whereas nearly all the zirconium in the TMI-2 reactor core debris was probably oxidized to zirconium dioxide (ZrO2) during the course of the accident and the long period of immersion in water following the accident, this may not be the case in debris produced in the damaged Fukushima reactors owing to the larger ratio of Zr to UO2 characteristic for boiling water reactors. The debris produced in BWR accidents will be initially a molten mixture of Zr, ZrO2 and UO2, as well as some stainless steel. The metallic alloy is likely to be present as nodules embedded in the oxide matrix. Fragmentation of the debris will expose the high surface area metallic nodules. Underwater, these nodules will react to form oxide forms and hydrogen. In air, these nodules may be pyrophoric and react with air producing large amounts of aerosol containing UO2 (U3O8) contaminated with various fission products.
4.2.2 Effect of boride and carbide inclusions in metallic debris
BWRs use boron carbide (B4C) control rod material encased in stainless steel cruciform blades. It is anticipated that during core degradation the boron carbide will dissolve in stainless steel. The interaction of boron carbide with stainless steel leads to an exothermic heat of solution of boron carbide in the steel. There are low-melting eutectics between the boron and carbon and the constituents of stainless steel. Consequently, fluid melts are formed from the control blades at modest temperatures. These melts will flow from the fueled regions and solidify on lower, cooler structures in the core. The solidified material will not be a single phase material. It will be instead a multiphase mixture of stainless steel with embedded borides and carbides of iron and chromium. There will also be precipitated borides in the solidified melts. Such two-phase mixtures are notorious for being extremely hard. They pose challenges to all but the hardest cutting tools. Cutting such solidified metal will present completely different characteristics compared to ordinary stainless steel. Furthermore, the solidified metals within the damaged core may well
NEA/CSNI/R(2015)18
47
be quite porous especially if formation of melt took place while the reactor coolant system was pressurized. Molten metals have a much higher solubility for gases, such as hydrogen, than do solidified metals. Gases dissolved in the molten metals will come out of solution during solidification to produce large voids (perhaps over a centimeter in diameter). These voids will “grab” cutting tools and complicate removal of the solid materials.

NEA/CSNI/R(2015)18
48
NEA/CSNI/R(2015)18
49
5. CONCLUSIONS
This summary report presents the major technical results of the OECD/NEA BSAF Phase I project. The main part of the summary deals with the discussion of the results beginning with a brief description of the common case followed by a summary of the best estimate results. The common case was conducted with an agreed set of boundary conditions based on engineering estimates as a reasonable starting point for normalizing code comparisons. The common case identified the effects of main parameters (e.g. initial in-core water level, decay heat) on the predictions of the codes. Thereafter, the best estimate phase followed where each participant applied variations to the boundary conditions to achieve better agreement with the actual reactor transients. The common case represented a way to rationalize the accident and a helpful starting point to develop best estimate scenarios of the accident.
The best estimate results have highlighted, as is typical for SA codes comparison, that when the boundary conditions (e.g. geometry, input values for safety systems) are well known and fixed, the codes provide comparable agreement of the thermal-hydraulics phase, as well as the fuel temperature excursion phase. Agreement in this context refers to transients for RCS pressure, RCS water level, fuel temperature and hydrogen generation. It has been underlined however that differences are introduced once the geometry is altered during the relocation process and in the attempt to stabilize the plant with external water injection and venting. The differences are attributed to each code’s modeling approaches. An attempt has been made to identify the influence of the employed models during relocation. The main physical modeling uncertainties are the RCS failure mechanism at high core temperatures (e.g. penetration failure or creep rupture), computation of the debris surface area once the core changes configuration, creation of possible paths for the debris to move from the core region to the lower head through the core lower structures and core plate, failure mechanisms of the lower head and mechanisms for leak/failure of the containment system. Further work is needed to include physics insights from new experimental and analytical activities. Also uncertainties should be reduced in the plant stabilization actions, in particular regarding venting and external water injection by the fire trucks for all the three units.
Regarding the actual progression of the accident in the three units and the expected current plant status, several common understandings were reached in the computations such as the prediction of the isolation condenser operation and the ex-vessel scenario in Unit 1; torus room flooding, RCIC self-controlled operation and containment failure in Unit 2; RCIC employment and first phase of HPCI operation in Unit 3. Nevertheless, various differences and uncertainties exist in the computations regarding the extent of core degradation in the units, the possibility of in-vessel or ex-vessel scenarios in Unit 2 and Unit 3, the effectiveness of alternative water injection in all the units and the actual S/C venting operation in Unit 3.
A description of the debris location and composition has also been presented with considerations that may help the development of defueling technology.

NEA/CSNI/R(2015)18
50
NEA/CSNI/R(2015)18
51
6. REFERENCES
[1] Tokyo Electric Power Company, Inc., Evaluation of the situation of cores and containment vessels of Fukushima Daiichi Nuclear Power Station Units1 to 3 and examination into unsolved issues in the accident progression, Progress Report No. 2. (www.tepco.co.jp/en/press/corp-com/release/2014/1240140_5892.html)
[2] G. Bandini et al. “Status and Results of the OECD Benchmark Exercise on TMI-2 Plant”, 6th European Review meeting on Severe Accident Research (ERMSAR-2013).Avignon (France), Palais des Papes, 2-4 October, 2013