Embed Size (px)
Citation preview
CHAPTER 4
BENCHMARKING AND CAPACITY
PLANNING
This chapter deals with benchmarking and capacity planning of performance
evaluation for computer and telecommunication systems. We will address types
of benchmark programs and common mistakes in benchmarking. Examples of
popular benchmark programs will be surveyed. The main procedures for
capacity planning and tuning as well as the problems encountered in such a
task will be studied as well. Benchmarks are designed for particular types of
environments, and hence, we need to select the specific benchmark that suits the
system under study. Most often, benchmarks evaluate the systems only
by calculating the performance of the application services and the load by
undermining the architecture and the underlying protocols on which the
application is based. Moreover, it is difficult to estimate the performance
characteristics of a system accurately with the help of a benchmark, as it may
not address all the properties of the system. To enable the system, server, or
network to provide high performance, we must optimize the load on the
network and servers, as well as optimize the use of input/output (I/O)
resources. This can be handled with the help of capacity planning. The chapter
discusses the issues related to capacity planning along with the problems
associated with it. We dedicated a section that deals with the capacity planning
for providing efficient Web service. This section addresses the scalability,
architecture, and network capacity along with server overloading issues for
Fundamentals of Performance Evaluation of Computer and Telecommunication Systems,By Mohammad S. Obaidat and Noureddine A. BoudrigaCopyright r 2010 John Wiley & Sons, Inc.
78

improving the performance of Web servers. A summary of the main points
reviewed in this chapter will be given at the end.
4.1 INTRODUCTION
The best computer programs that should be used to evaluate the performance
and behavior of a computer system or network are the ones that are often used
by the user/application. However, this is not usually feasible or cost effective as
it often requires a substantial amount of time and effort to port the application
programs to the system under test, especially if the aim is to find the
performance of a new system when such an application is run on it. Clearly,
because of such difficulties in running the user’s application programs on the
systems being evaluated, surrogate programs called benchmark programs are
used. The hope is that such benchmark programs can characterize the behavior
of the intended applications. The results of running such benchmark programs
can be used to predict the performance and behavior of the system for the
intended application. The accuracy of these predictions when validated with
real applications can determine the quality of such benchmarks.
Benchmarking can be defined as the process of running a particular program
or workload on a specific system and measuring the resulting performance. This
process provides an accurate assessment of the performance of the system under
study for that considered workload. Benchmark programs can be either whole
applications, kernels (most executed parts of a program), or synthetic programs.
Benchmarking is an important scheme to compare the performance of two or
more systems for various purposes, including procurement, capacity planning,
and tuning. Because different application areas have different execution char-
acteristics and behavior, a spectrum of benchmark programs have been devel-
oped to address these different domains and environments. For example,
designers of processors use (at the early stages of the design) small benchmarks
that can aid in estimating performance using simulation. However, for procure-
ment, the analysts use more complex benchmarks because decisions to purchase
such expensive systems are based on such measurements. Benchmark programs
should be easy to use, port to different systems, and execute [1–47].
It is interesting to point out that there is no complete agreement within the
system performance evaluation community on what makes a good benchmark
program. The strategies that can be followed to measure a system’s perfor-
mance are as follows [1–29]:
1. Fixed computation technique. Here, the total time needed to execute the
specific computation task of the benchmark is used as a metric.
2. Fixed time. Here, we fix the amount of time the system is allowed to
execute the benchmark program and use the total amount of computa-
tion it completes in this time as a metric.
4.1 INTRODUCTION 79

3. A combination of execution time and amount of computation completed
within this time is used as a performance metric. Example on this includes
the quality of improvements per second (QUIPS) that is used in the
HINT benchmark.
Capacity planning can be defined as the process by which we ensure that
adequate system resources will be available to meet future demands in a cost-
effective way without violating performance objectives. Another process that is
related to capacity planning is called capacity management. This process deals
with making sure that present resources are used efficiently to provide the
utmost performance.
In general, benchmarking consists of a set of programs, that are used for
performance evaluation purposes. It can even be used to compare the
performance of other systems over different architectures. The performance
evaluation results obtained by benchmarking are often not easy to draw up
conclusions about the system performance. Benchmarks rarely evaluate the
system on the basis of the mixed workloads, which is a similar comparison with
that of the real workload. Also, they do not evaluate the I/O resource usage and
memory accesses in the system. With the evolution of new types of networks,
such as grids and cluster environment, some workloads that are used for
evaluation are grid friendly, whereas others are not. Most of the time bench-
marks evaluate quality of service (QoS) on the basis of the system’s raw
performance. Moreover, benchmarks evaluate the performance of the
system on the basis of application services and loads at the system and
network by ignoring the underlying architecture and the protocols used by
the system. Benchmarks are not developed on the basis of standards, but they
are developed with respect to a particular type of computer system or an
environment.
4.2 TYPES OF BENCHMARK PROGRAMS
A benchmark is a performance testing program that is meant to catch
processing and data movement characteristics of a group of applications.
Benchmark programs are used to measure and forecast the performance of
systems and reveal their behavior as well as strong and weak aspects. Also, we
define a benchmark suite as a set of benchmark programs jointly with a set of
well-defined rules governing test conditions and procedures, including platform
environment, input and output data, and performance measures.
Benchmark programs (benchmarks) can be categorized into macro and
micro benchmarks. Micro benchmarks measure a specific aspect of a system,
such as memory or I/O speed, processor speed, network throughput or latency,
and so on. However, macro benchmarks measure the performance of a system
in its entirety. The latter is important for applications that require comparing
competitive systems or designs, and that is why it is often used to compare
80 BENCHMARKING AND CAPACITY PLANNING

different systems with respect to a certain application category, especially for
procurement purposes.
Others classify benchmarks based on application types, such as network
services, business applications, interactive applications like airline reservation
and financial applications, scientific computing, multimedia and signal proces-
sing, and so on. Moreover, benchmarks can be full-fledged applications or
kernels. The latter types are usually much smaller and simpler programs taken
out from applications while upholding the main characteristics. A benchmark
can be a real program that performs a real application or a synthetic one that is
usually designed specifically to exercise certain functional units or subunits at
various working conditions.
In general, benchmarks used for comparing the system’s performance can be
broadly categorized into the following major types:
1. Addition instruction: When computers were introduced initially, the most
expensive component of the system was the processor. Hence, the system’s
performance was measured as the performance of the processor [1, 16–23].
Few instructions were supported initially, and the addition instruction
was most frequently used. The system used to compute these addition
instructions at a faster rate was supposed to perform better. Hence, the
performance metric used for measuring the systems performance was
the time used for executing the addition instruction.
2. Instruction mixes: With the advancement in the design of processors, the
number of instructions supported by the CPU also increased. Hence,
calculating the time required for executing the addition instruction was
no longer sufficient for evaluating the performance of the computer
system. Hence, the frequencies of different instructions used on the
real system were to be measured so as to use them as a weighing factor
for performance evaluation [1–4, 8–15]. Thus, an instruction mix can be
defined as the description of various instructions with their frequencies.
By using the above information, the computational time required for
executing the instructions on each of the processors can be calculated and
can be compared with the performance of the other competing proces-
sors. Several such instruction mixes exist. Among those available in the
computer industry is the Gibson mix. In the Gibson mix, the instructions
are classified into 13 different categories, which contain the execution
time for each of these instructions. The weights for these instructions
are based on the relative frequencies of the operations [1, 2]. Certainly,
some disadvantages are associated with these instruction mixes. With the
innovation in computer technology, the instructions nowadays are more
complex and these changes are not reflected in the instruction mixes.
These changes are not reflected in the mixes provided for some proces-
sors. Normally, the execution time is calculated in terms of millions
instructions per second (MIPS) and millions floating-point operations
4.2 TYPES OF BENCHMARK PROGRAMS 81

per second (MFLOPS). Moreover, the instruction mixes only calculate
the processor speed. Keep in mind that the system performance depends
not only on the processor speed but also on the other components, which
are not addressed in the instruction mixes.
3. Kernels: Because of the introduction of new mechanisms, such as various
addressing schemes, caching and pipelining, and prefetching, the execu-
tion time of the instruction is highly variable. Hence, it is more important
to find the execution time of a function or service provided by the
processor that comprises a set of instructions rather than evaluating
the execution time for single instruction [2, 16–29]. Most kernels defined
in the literature do not consider the input and output devices, and they
characterize the systems performance only on the basis of the processor
performance. Hence, these are also referred to as processing kernels.
Kernels can be defined as instruction mix generalizations. We can identify
several applications and then compare the performance of the processor
based on the kernel performance. Most disadvantages that apply to the
instruction mixes also apply to the kernels [2–10]. A major disadvantage
of using the kernels is that they do not make use of I/O devices for
calculating the system’s performance. Hence, the performance of the
kernel will not visualize the performance of the system as a whole.
4. Synthetic programs: The kernels that are used for evaluating the system’s
performance do not use the services offered by the operating system or
the input and output devices. Most applications designed these days are
not only used for processing but also cater to a lot of input/output
operations with the help of external devices. Hence, these have become an
integral part of the workload, which needs to be considered for evaluating
the system’s performance in the real world [3, 23–29]. The performance
of the input/output is measured by using the exerciser loops, which make
the input/output requests. These loops help in calculating the average
amount of time required for executing a single service call or an input/
output request. These loops are termed ‘‘synthetic programs’’ and are
usually written in high-level languages. The loops that are defined can be
controlled with the help of control parameters so as to ensure that they
make a limited number of input/output requests. Apart from calculating
the amount of time required for executing input/output requests, the
exerciser loops can also be used for measuring the services provided by
the operating system, such as creating the process, forking the child
processes, and allocating the memory requirements. A major advantage
of the exerciser loops is that they can be developed quickly. Apart from
this, they can be easily modified so that they can be executed on different
platforms [1–4]; they are also easily portable. Moreover, these loops have
measurement capabilities, which are built in. Thus, the process of
measurement is automated, which can be used to run these loops several
times on the system so as to measure the performance gain and losses of
82 BENCHMARKING AND CAPACITY PLANNING

the system. The major drawback of these exerciser loops is that they are
too small. Mechanisms such as page faults and disk cache are not
generally addressed. More precisely, these are not well suited for
multiuser environments.
5. Application benchmarks: Application benchmarks are mainly used to
evaluate the performance of systems, which are used for a particular
application, such as airline reservation, banking, sorting, weather fore-
casting, and so on [1–4, 16–23]. For such applications, benchmarks are
defined as a collective group of functions, which make use of all the
resources of the system.
4.3 BENCHMARK EXAMPLES
This section sheds some light on most known benchmark programs.
� WebTP: This benchmark is mainly used for evaluating the Web system’s
performance and in particular the order management system. This system
is basically used on the web for purchasing the services and the goods over
the Internet [2–4, 30]. It is also considered as one of the most important
electronic applications. An integrated order management system may
include modules such as product information, vendors, purchasing, and
receiving; marketing (catalogs, promotions, pricing, etc.), customers,
and prospects; order entry and customer service, including returns and
refunds; financial processing; order processing such as selection, printing,
picking, packing, shipping, data analysis, and reporting; and financial
matters, such as accounts payable and accounts receivable. The order
management system is an integral application of e-commerce, and there-
fore, WebTP has applicability to all types of e-businesses applications.
The Web application performance depends on the technology on which
it is developed, and this is supported by different versions of WebTP.
The transactions supported by such Web-based systems are specified in the
TPC-C benchmark, which is used by the WebTP [2, 3, 30]. The TPC-C
benchmark supports five types of transactions, such as new order,
payment, order status, delivery, and stock-level transactions.
The Transaction Processing Council (TPC) was established with the
goal of developing benchmark programs for systems that perform online
transaction processing (OLTP). The latter application includes airline
reservation systems, automatic teller machine (ATM) systems, credit card
verification systems, and inventory control systems. In such systems, it is
important to perform the transaction within a given response time limit,
maintain a consistent data flow, and be available essentially all the time.
The TPC devised several benchmark programs, including the TPC-A,
which was based on an early Debit-Credit benchmark that was intended to
stimulate kinds of transactions that would be likely to occur in an ATM
4.3 BENCHMARK EXAMPLES 83

system environment. In this benchmark the actual program to be executed
is not specified; instead a high-level function is specified. The main
performance requirement was that 90% of the transactions must complete
in less than 2 s. The performance metric used was transactions per minute.
There are other versions of TPC including the TPC-D, which deals with
decision-support systems, and TPC-W, which focuses on e-commerce
applications.
The benchmark programs that are used to characterize the performance
of client-server systems are typically run on the clients, which send a
stream of files-access commands or other types of requests to the server.
Common performance metrics that are often used for such an environ-
ment are the number of requests that can be completed per unit time and
the average time needed to react to the requests.
An example on such benchmark programs is the SFS/LADDIS 1.1
benchmark that was designed to measure the throughput of UNIX-based
servers, which run theNetwork File System (NFS) protocol. Others call this
program as LADDIS, which is the acronym of the companies that coop-
erated to develop it, namely, Legato, Auspex, Digital, Data General,
Interphase, and Sun. The SFS 2.0 is a new version of SFS that was released
in 1997 and is an improved version of SFS 1.1. SFS 2.0 has many
improvements including larger and more recent workloads that reflect the
mix of operations observed in more than 1,000 NFS application environ-
ment and it can support TPC and UDP network transmission protocols.
The Standard Performance Evaluation Corportion (SPEC) developed a
benchmark program in order to measure the throughput rates of Web
servers. This was called the SPECweb benchmark and it was developed on
the framework of SFS/LADDIS benchmark. The SPECweb benchmark
programs continuously sendHTTP requests to aWeb server system at a rate
that is progressively increased until the server can no longer reply within the
predefined upper limit response time. The value of the rate at which requests
can be served before the server’s response time starts to decrease is
considered the reported performance metric for the system under study
[18–20, 42].
� Probing. Probing stands for purchaser-oriented benchmarking. Most of
the benchmarks look for services, but probing mainly concentrates on the
activity [1–30]. The process of benchmarking is performed in four stages in
the case of probing, which are as listed below:
1. Planning: In this stage, we need to: (a) identify the subject for the
benchmark, (b) identify the partner for the benchmark, and (c)
identify the method for collecting the data.
2. Analysis: This stage involves identifying: (a) the competitive gap and
(b) future performance of the project.
3. Integration: This deals with communications and functional goal
establishment.
84 BENCHMARKING AND CAPACITY PLANNING
4. Action: This stage includes: (a) creating the action plans, (b) deploying
the plans and then monitoring the results obtained, and (c) recalibrat-
ing benchmarks.
Each of the single item is identified is benchmarked during the
planning phase of probing. Based on the information obtained during
the analysis phase, it can be directly used in the next steps of the
benchmarking.
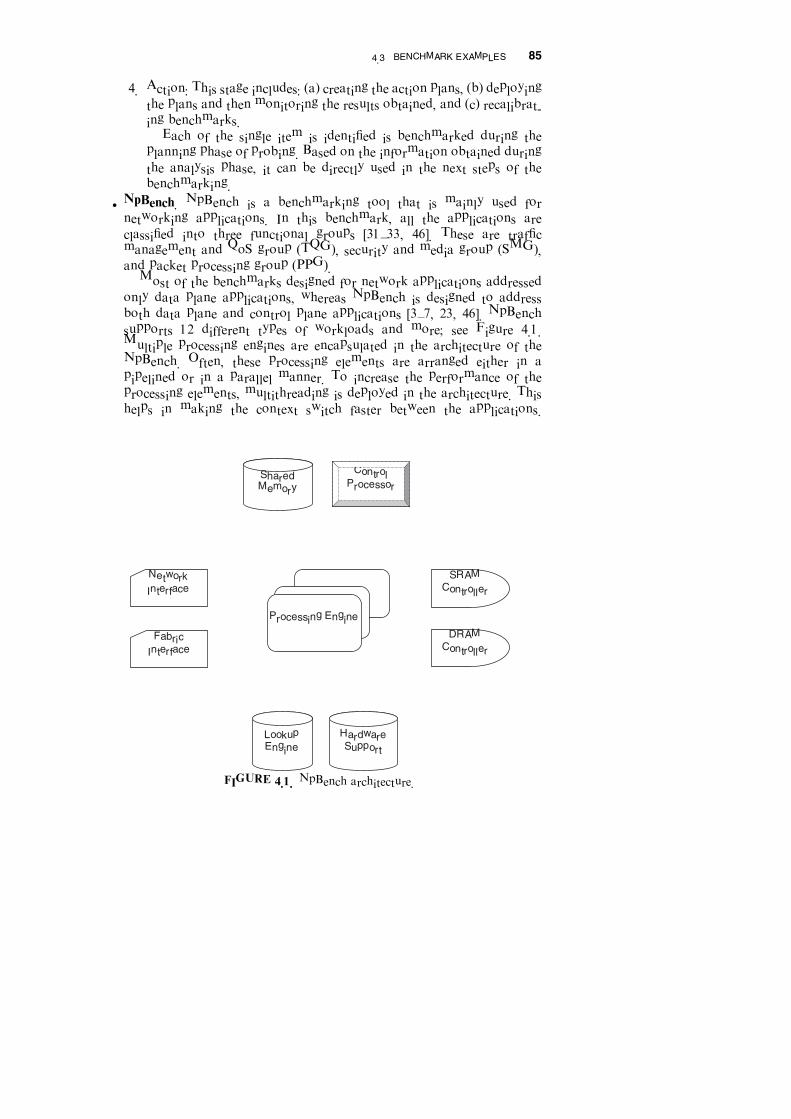
� NpBench. NpBench is a benchmarking tool that is mainly used for
networking applications. In this benchmark, all the applications are
classified into three functional groups [31–33, 46]. These are traffic
management and QoS group (TQG), security and media group (SMG),
and packet processing group (PPG).
Most of the benchmarks designed for network applications addressed
only data plane applications, whereas NpBench is designed to address
both data plane and control plane applications [3–7, 23, 46]. NpBench
supports 12 different types of workloads and more; see Figure 4.1.
Multiple processing engines are encapsulated in the architecture of the
NpBench. Often, these processing elements are arranged either in a
pipelined or in a parallel manner. To increase the performance of the
processing elements, multithreading is deployed in the architecture. This
helps in making the context switch faster between the applications.
Processing Engine
Shared
Memory
Control
Processor
SRAM
Controller
DRAM
Controller
Network
Interface
Fabric
Interface
Lookup
EngineHardware
Support
FIGURE 4.1. NpBench architecture.
4.3 BENCHMARK EXAMPLES 85

The processing of the control functions are supported by the user interface
[3–7, 46]. The workloads are categorized as data workload and control
workload. Network applications are classified as data plane and control
plane applications. The processing requirements are more complex in case
of control functions when compared with that of data functions. The
functions in the NpBench benchmark are broadly categorized as data
plane functions and control plane functions.
� Grey Relation Analysis (GRA). The performance of a system can be
evaluated with the help of performance metrics/indicators. For the process
of evaluation, if all the performance indicators are used, then the process of
collecting the data will become highly difficult [24]. Also, this leads to
wasted resources. To reduce the number of indicators used, benchmarking
is used for identifying the relevant performance indicator so as to reduce
the overall complexity. The main purpose of using the GRA is to identify
the relevant performance indicators and to reduce the overall indicators
used for evaluating the performance. The selection of these performance
indicators can be based on clustering. The performance indicators are then
selected only when the amount of data collected is large enough so as to
ensure that the data distribution is normal [24]. However, most often the
data collection is incomplete. Hence, these incomplete data are referred to
as grey elements.
� NetBench. NetBench is a benchmarking tool that is mainly used for the
performance evaluation of the network processors. There are nine applica-
tions in the NetBench benchmark, which are similar to that of the
applications supported by the network processors [25]. For these applica-
tions, packet processing is supported at all levels. The NetBench suite is
composed of benchmarking applications, which are divided into three
levels. These include the low level or the microlevel routines, Internet
Protocol(IP)-level programs, and the application level programs. The
microlevel routines are used for processing the simpler tasks, which act
as a component for the complex tasks. The applications which are
supported at the routing level are processed with the help of the IP-level
programs. Programs that need to make some wise decisions based on
the information in the data packets are processed with the help of the
application-level benchmarks. These applications are highly time consum-
ing, as the requirements consume a lot of processing time.
� Sieve kernel. The performance of microprocessors and the personal
computers can be compared and evaluated with the help of the Sieve
kernel. The design of the Sieve kernel revolves around an algorithm called
the Eratosthenes Sieve algorithm. This algorithm is mainly used for
computing the list of all of the given prime numbers that are less than
‘‘n’’. The algorithm works as follows. First, we write the list of all the
numbers up to ‘‘n’’ from 1 [26–27]. Then, we try to cancel out all the
multiples of k, where k equals 2 to square root (n). For example, if we want
86 BENCHMARKING AND CAPACITY PLANNING

to know the list of prime numbers between 1 and 20, then the steps are as
follows:
1. List all numbers between 1 and 20 and consider all the numbers as
prime.
2. From the given list of primes, try removing all multiples of 2.
3. Repeat the above step by removing multiples of 3.
4. Because the next number from the sequence is 5 and because its square
is greater than 20, the rest of the list is considered to be prime
numbers.
� Ackermann’s function. The performance evaluation of the procedure-
oriented languages such as ALGOL is done with the help of this kernel.
The kernel is a function that supports two parameters that are recursively
defined. Systems are compared based on the following criteria: (a) the
average time of execution per call, (b) the number of instructions executed
for each such call, and (c) the amount of space occupied for each of such
function calls [26, 27]. This kernel is designed by using the SIMULA
programming language. It is worth mentioning that SIMULA is consid-
ered one of the earliest object-oriented languages, and some people
consider it the earliest. It was designed in the early 1960s to facilitate
simulation analysis. It has been used in a wide range of applications, such
as simulating algorithms, protocols, graphics, and very large-scale inte-
gration (VLSI) designs. SIMULA influenced all other later widely used
object-oriented languages such as C++.
� Whetstone. The Whetstone kernel consists of 11 modules, which have been
designed to match the frequency of the operations in the ALGOL
programs. All the operations of the processor such as addressing of
arrays, arithmetic using fixed and floating point, subroutine calls, and
passing the parameters using referencing are addressed. These modules
can be translated into other programming languages such as Fortran. The
performance assessment in Whetstone is measured in KWIPS, which
stands for Kilo Whetstone Instructions Per Second [25–27]. Because
different permutations of this kernel exist, we need to make sure that
the source code is the same before evaluating it on different systems. Even
though it supports a mixture of operations, it is often considered a floating
point benchmark. This benchmark is mainly used for evaluating the
scientific and engineering applications, which are relatively small. The
design of the modules in Whetstone is such that it reduces the compiler
optimizations.
� Dhrystone. Dhrystone is a kernel whose source code consists mainly of
several function calls that are used to represent the programming environ-
ment of the system. This kernel was implemented in programming
languages known such as C, Ada, Fortran, and Pascal. Among all these
implementations, the C implementation is popular. The performance
4.3 BENCHMARK EXAMPLES 87

assessment is represented as DIPS, which stands for dhrystone instructions
per second. The function calls in Dhrystone usually have a lower depth of
nesting. For each function call defined, the number of instructions
executed is usually low [25–27]. Also, most of the execution time is spent
in copying the strings and in characters and in comparing them. This
benchmarking is famous for evaluating the integer performance and
does not support the floating point and processing of input and output.
It does not focus on issues related to compiler optimization. Dhrystone
attempts to represent the result more eloquently than MIPS, because
MIPS cannot be used across different instruction sets (i.e., CISC vs RISC)
for the same computation requirement from users. Hence, the main grade
is just Dhrystone loops per second. Others use another representation of
the Dhrystone benchmark that is called the Dhrystone MIPS, (DMIPS),
obtained by dividing the Dhrystone score by 1757, which is the number of
Dhrystones per second obtained on the VAX 11=780 computer machine.
� Lawrence Livermore loops. The workload in this benchmark consists of 24
distinct tests that are mainly focused on the scientific calculations. This
benchmark can be executed on a laptop computer as well as on a
supercomputer. It is usually difficult to interpret the results obtained
from this benchmark, as they are too complex to understand. The unit of
performance measurement in this benchmark is MFLOPS [27]. The results
display the arithmetic, geometric, and harmonic means along with the
minimum and maximum performance levels. Most often, (say about 60%
of the time) scientific applications are consumed in calculating the floating
point operations. These kernels are developed using the Fortran program-
ming language. They are used as a standard for evaluating the perfor-
mance of the computational systems. This kernel highly resists
vectorization and does evaluate the performance of single-precision and
double-precision floating-point calculations.
� Debit-Credit Benchmark. This benchmark is used as a standard for
comparing the performance of the processing systems that are based on
transactions. A banking network which is distributed is represented by this
benchmark [26, 27]. The performance is evaluated in terms of transactions
per second (TPS) such that more than 90% of the transactions have a
response time less than 1 s. The response time in these systems is measured
as the time required for sending the last bit on the communication line and
the arrival of the first bit. The comparison of the performance of different
transaction systems is based on the price-performance ratio [26, 27]. The
workload supports four record types, which are teller, account, history, and
branch. The benchmark is written in the COBOL programming language.
The Debit-Credit benchmark was devised in the 1970s to test the
performance of computer systems that run a fledgling online teller network
at the Bank of America. This benchmark represents the transaction
processing load of a supposed bank with one or more branches and
88 BENCHMARKING AND CAPACITY PLANNING

many tellers. The transactions are made of the debits and credits to
customers accounts with the system maintaining track of customers
account, the balance of each teller and branch, and a history of the banks
up to date transactions.
� NAS Parallel Benchmarks. The NAS Parallel Benchmarks (NPBs) are a set
of programs designed to assist and evaluate the performance of parallel
computers. They are derived from computational fluid dynamics (CFD)
applications. NAB benchmark programs consist of five kernels and three
pseudoapplications. They come in several types. NPB is a benchmark suite
that is mainly used for evaluating the parallel computer systems. This
benchmark comprises of eight programs, which deal with several relevant
issues of parallel systems [27]. Apart from these programs, it also has three
pseudo applications and five kernels. The output derived from the kernel
consists of the data that represent the execution time along with Mega
operation per second. NPB consists of three versions NPB1, NPB2, and
NPB3. For benchmarking the grid applications, GridNPB3 is used. These
benchmarks are implemented in FORTRAN and Java programming
languages. The source code for the programs is implemented using the
message passing interface (MPI) mechanisms. NAS seeks NPB 1 results
from all sources, especially computer vendors. Such results are assembled
in a tabular manner in periodic reports posted on the Web by NASA.
� PARKBENCH. The Parallel Kernels and Benchmarks committee (PARK-
BENCH) was established in 1992 by professionals who were interested in
benchmarking for parallel processing. The committee established a set of
performance measures and notations. The main objectives of the PARK-
BENCH group are as follows [39]:
1. To establish a comprehensive set of parallel benchmarks that is
generally accepted by both users and vendors of parallel systems
2. To provide a focus for parallel benchmark activities and avoid
duplication of effort and proliferation of benchmarks
3. To set standards for benchmarking methodology
4. To make the benchmarks and results freely available to the public.
The initial interest of the parallel benchmarks is the new generation
of scalable distributed memory message-passing architectures for
which there is a notable lack of existing benchmarks. That is why
the initial benchmark release focuses on Fortran77 message-passing
codes using the widely-available Parallel Virtual Machine (PVM) MPI
for portability. Release 2.0 of the benchmark suite adopted the MPI. It
is expected that future releases will include Fortran90 and High-
Performance Fortran (HPF) versions of the benchmark [30, 40].
The PARKBENCH committee makes a benchmarking suite used
for parallel computer systems. This suite consists of three application
sets, which are low-level benchmarks, kernel benchmarks, and com-
pact application benchmarks [4, 39]. The parameters on which the
4.3 BENCHMARK EXAMPLES 89

architecture of a parallel system is based are measured with the help of
a low-level benchmark. The kernel benchmarks are used to evaluate
the parallel systems over a wide range of applications, which are
intensively computational. Some of the source code for these bench-
marks is taken from NAS, Genesis, and so on which are also the
parallel benchmark suites. Compact application benchmarks are
mainly used for evaluating the parallel systems for research-based
applications. These applications differ from the kernel applications in
that they produce results that are scientifically useful.
� LINPACK. The LINPACK is basically a collection of Fortran subroutines,
which analyze and solve linear equations and linear least-squares problems.
The matrices involved can be general, banded, symmetric indefinite,
symmetric positive definite, triangular, and tridiagonal square. LINPACK
was created by Jack Dongarra at the University of Tennessee. In general,
this benchmark is easy to use and can give a good indication about the
numerical computing capability of the system under study. The LINPACK
benchmark is mainly designed for evaluating supercomputers. This bench-
mark is written in the Fortran programming language. It is composed of a
single application that is used to solve the linear algebraic problems. It
evaluates the performance based on Gaussian elimination [27]. The results
are represented as MFlops. It is available in three flavors: (100*100),
(1000*1000), and variable size. To measure the performance of large-scale
distributed systems, we use high-performance LINPACK (HPL). The
matrix sizes are varied and for each size the benchmark is run so as to
check as to which matrix size the benchmark performance increases.
� LMBENCH. The LMBENCH is another example on microbenchmarks
that is maintained by Larry McVoy. It was designed to measure the
overheads of operating systems and capability of data transfer among
the processor, cache, main memory, network, and disk on various UNIX
platforms. This benchmark is useful for finding bottlenecks in the design
and for design optimization. The results of LMBENCH are available for
major computer vendors, including SUN, IBM, HP, and SGI [32, 47].
� STREAM. The STREAM benchmark is synthetic. It was created by
John McCalpin while he was at the University of Delaware. The
motivation for the creation of this benchmark is to study the effect of
limited memory bandwidth on system’s performance, as these days
processors are becoming fast, and application programs are limited by
the memory bandwidth, not by processor’s speed. The main operations
performed by STREAM are copy, scale, sum (addition), and triad. The
latter is often called after the operation of the form: A(i)=B(i)+
kÂC(i). STREAM measures real-world bandwidth sustainable from
normal user programs [33].
� HINT. HINT is a benchmarking tool that stands for hierarchical integra-
tion. This tool was developed at the Scalable Computing Laboratory,
90 BENCHMARKING AND CAPACITY PLANNING

which is funded by the U.S. Department of Energy. The hierarchical
integration tool is neither used to fix the problem size nor the time required
for calculation [27]. It is used to measure the system performance using a
new measure called QUIPS. This enables the hierarchical integration tool
to present the machine speed for a given specification of the machine and
the size of the problem. The change in speed while accessing the main
memory and the disk memory is clearly displayed by the hierarchical
integration tool. This tool is highly scalable and portable. It can be scaled
down to an extent that it can be run on a calculator, and it can also be
scaled up to run on a supercomputer.
� SPLASH. The Stanford Parallel Applications for Shared Memory
(SPLASH) is a benchmark that is used for the performance evaluation
of parallel systems. The benchmark is written in the C programming
language except for one application, which is written in Fortran language.
These applications use the fork/join models for supporting the parallelism
[4, 27]. The benchmark consists of two parts known as kernels and
applications. These two components are used for performance evaluation
of the systems. The latest version of benchmark available in SPLASH is
SPLASH-2. The performance of the system is measured in MIPS.
� COMSS. COMSS is a low-level benchmark that is used for evaluating the
performance of parallel systems. The three variants of this benchmark
are known as COMMS1, COMMS2, and COMMS3. COMMS1 evaluates
the communication system performance by transmitting messages of
variable length among various nodes [27]. Another name for the COMMS1
benchmark is ping pong benchmark. COMMS2 also functions the same
way as that of COMMS1 except that the exchange of messages between the
nodes is simultaneous. COMMS3 evaluates the parallel systems perfor-
mance by incrementally varying message lengths between nodes. The total
bandwidth available to the communication link is estimated by transmit-
ting the messages. Every process in the system sends a message to all nodes
and then waits to receive all the sent messages [27–29]. The length of the
messages is incrementally increased until the saturation of the bandwidth.
At the end, the benchmark displays available total bandwidth and the
bandwidth that can be allocated to each processor.
� Bit to the User. Bit to the User (BTU) is a benchmark that is used for
evaluating the performance of the system over a network [28]. The BTU
benchmark was developed to take into consideration both concurrent
activities within a workstation and concurrent activities on the network.
The BTU benchmark can produce results at various levels of abstraction
that range from a single number that exemplifies average performance to a
report of how all the individual test suite components performed. It deals
with the specification of the source code along with the test bed for
duplicating the results. The performance is represented by calculating a
BTU number, which indicates the workstations’ communication
4.3 BENCHMARK EXAMPLES 91

performance. Along with the BTU number it also specifies the penalty
factor, which indicates the degradation of the performance. Not only are
BTU numbers used for representing workstation communication perfor-
mance, but also they can be used for assessing the performance of any
individual application along with its respective penalty factors [28]. The
performance data are compiled for independent components of the
benchmark test. If the test result is abnormal, then for such type of
results, BTU provides the results with a TCP time sequence chart, which
can be used for analyzing the results in depth.
� TinyBench. TinyBench is a benchmark which is used for evaluating the
performance of wireless-based sensor network devices [29]. TinyBench is a
single-node benchmark suite. This benchmark simplifies the process of
code development and function development across multiple platforms.
Four classes of benchmarks are related to sensor network nodes: (a) level
microlevel benchmarks for components of hardware, (b) stressmarks at
node level, (c) real applications at the node level, and (d) real applications
at the network level. TinyBench measures the performance of the
applications at the node level and the stressmarks at the node level. Based
on the class of the application, the characteristics of the hardware differ
[30]. Apart from evaluating the performance of the systems, it also shows
the amount of power consumed for each operation performed.
� Express. This is a benchmark used for evaluating the performance of
parallel systems. The type of programming model used in Express is
host-node model, where host represents the master and node the worker
[30]. It uses a host-free programming model to avoid writing programs
to the host, which is known as Cubix. The design of Express follows a
layered approach. The implementation consists of three layers as
follows:
1. The layer at the lowest level contains the utilities that are mainly used
for controlling hardware that includes processor allocation and
program loading, among others.
2. The layer at the medium level provides the support for partitioning the
problem. Apart from this it also allows the communication between
the nodes and also between the control processor and the node.
3. The layer at the highest level consists of the facilities that are used by
the programs in the node for performing the input output operations.
Also, it consists of utilities that can be used for accessing the operating
system at the host.
Because of the layered approach design, the tool is portable. The
design follows a top-down approach.
� Parellel Virtual Machine. The Parallel Virtual Machine (PVM) is used for
assessing the performance of parallel systems that consist of heterogeneous
computers. This benchmark is portable similar to that of the Express. PVM
contains the functions that can be used for starting the tasks automatically
92 BENCHMARKING AND CAPACITY PLANNING

on the virtual machine. It also allows the tasks to interact with each other
by communicating and allows them to synchronize. Tasks are basically
units of the computation. Apart from evaluating the performance of the
heterogeneous computers in the parallel systems, heterogeneous applica-
tions can also be evaluated. Routines are provided by PVM, which helps in
creating and transmitting the messages between tasks. It can evaluate both
synchronous and asynchronous transmissions. Apart from this it also
models the fault tolerance in the parallel system [30, 40]. It can even detect
the dynamic addition and removal of hosts to the parallel system.
� GENESIS. This benchmark is used for evaluating the distributed and
parallel systems [31]. The GENESIS benchmarks are written in the
FORTRAN programming language. Each GENESIS benchmark has a
sequential and a parallel version. The sequential benchmark is used for
defining the problem and also provides the algorithm that needs to be used
for solving the problem [31, 32]. The parallel version of the GENESIS
benchmark uses message passing for defining the programming model. In
all 16 codes are supported by GENESIS for measuring the machine
parameters related to synchronization and communication. The design of
the GENESIS benchmark follows a hierarchical structure approach. The
application kernels in GENESIS are used for evaluating the applications
for the distributed and parallel systems. It also performs code optimiza-
tions for improving the performance of the parallel systems [32].
� Space-Time Adaptive Processing. The Parallel Space-Time Adaptive Pro-
cessing (STAP) suite benchmark suite is basically a set of real-time, radar
signal processing programs developed at Massachusetts Institute of
Technology (MIT) Lincoln Laboratory [33]. STAP is a computationally
demanding technique for mitigating clutter as viewed by airborne radar.
Delivered processing power on-major STAP kernel computations is of
major importance because of the real-time nature of radar processing
systems. Because algorithm requirements for STAP systems are under
continuous development, the scalability of processing power both in terms
of machine and problem size is of great interest. Such an increased interest
has led us to consider Single Instruction, Multiple Data (SIMAD) streams
parallel architectures as possible candidates for a STAP processor. The
original version of STAP that was developed at Lincoln Laboratory was
sequential. STAP has been converted to a parallel STAP at the University
of Southern California to evaluate massively parallel systems (MPPs) by
Hwang and his group. The STAP benchmarks are considered computa-
tion-intensive as they require in the order of 1010 to 1014 floating point
operations over 100 to 10,000 MB of data in a fraction of a second. The
STAP consists of five programs [4, 33] as follows:
� The Adaptive Processing Testbed (APT) performs a Householder
Transform to generate a triangle learning, which is used in a later
step called beamforming to null the jammers and clutter.
4.3 BENCHMARK EXAMPLES 93

� The High-Order Post-Doppler (HO-PD) has two adaptive beamform-
ing steps that are combined into one step.
� The Beam Space PRI-Staggered Post Doppler (BM-Stag) is similar to
HO-PD; however, it uses a staggered interference training algorithm in
the beam space.
� The Element Space PRI-Staggered Post Doppler (EL-Stag) is also
similar to the HO-PD; however, it uses a staggered interference training
algorithm in the element space.
� General (GEN) consists of four independent component programs to
perform sorting (SORT), Fast Fourier Transform (FFT), Vector multi-
plication (VEC), and Linear Algebra (LA).
The first four benchmark programs start with a Doppler Processing step,
where the program performs a large number of one-dimensional FFT opera-
tions. All of these four programs end with a Target Detection step.
� PERFECT. The Performance Evaluation of Cost-Effective Transforma-
tion (PERFECT) club benchmark suite consists of a set of 13 Fortran
application programs drawn to characterize the range of applications that
need to be run using high performance computing systems. Such programs
characterize computational fluid dynamics, physical and chemical model-
ing, signal processing and engineering design applications. The main goal
of this benchmark was to evaluate the effectiveness of compiler transfor-
mations for automatically converting serial programs to parallel form so
as to execute them on parallel systems [4].
� SPEC. There is a popular benchmark family called SPEC, which has been
developed by a nonprofit organization called Standard Performance
Evaluation Corporation (SPEC). The latter stresses developing real
applications benchmarks and SPEC suites are updated every few years
in order to reflect new applications. SPEC started with benchmarks that
measure the performance of processors (CPUs), but now it has bench-
marks that evaluate client/server platforms, I/O subsystems, commercial
applications, WWW applications, and so on. For more updated informa-
tion, suites, and news, visit www.spec.org.
SPEC was founded in 1988 by Apollo/Hewlett-Packard, Digital
Equipment, MIPS, and Sun Microsystems. The goal was to provide a
standard set of application programs and standard methodology for
running the programs and reporting results to have a fair comparison.
The first SPEC benchmark program, SPEC89, had four programs
written in C and six programs written in Fortran. Every few years,
SPEC provides a new version of its benchmarks [4, 18–20, 42]. SPEC
has expanded recently to include Open System Group (OSG), High-
Performance Group (HPG), and Graphics Performance Characterization
Group (GPCG).
94 BENCHMARKING AND CAPACITY PLANNING

SPEC scheme is based on providing the benchmarker with a standar-
dized suite of source code relied on current applications that have already
been moved to a wide variety of platforms by its users. The evaluator then
takes this source code, compiles it for the system under consideration and
then can tune the system in order to obtain the best results. Using an
already accepted and ported code can greatly reduce unfair performance
comparison among systems manufacturing and avoid problems that may
occur such as the game ratio.
SPEC started with a group of workstations vendors aiming at devising
CPU metrics. Now, SPEC has grown into a big organization that includes
three main groups: OSG, HPG, and Graphics and Workstation Perfor-
mance Group (GWPG). A brief description of each is given below:
1. Open System Group. This group is basically the founding group of
SPEC. It concentrates on benchmarks for high-end workstations,
desktop systems, and servers running open systems environments.
OSG includes several subcommittees:� CPU subcommittee. This includes all persons who devised SPEC-
marks and the other CPU benchmarks such as SPECint, SPECfp,
and SPECrates.� JAVA subcommittee. This includes those who devised JVM98,
JBB2000, and JBB2005; the Java client and server-side benchmarks;
and the jAppServer Java Enterprise application server benchmarks.� MAIL subcommittee. It includes persons who devised SPEC-
mail2001, the consumer Internet Service Provider (ISP) mail server
benchmark.� POWER AND PERFORMANCE subcommittee. This sub-
committee started the development of the first-generation SPEC
benchmark for evaluating the energy efficiency for server class
computers.� SFS subcommittee. It is the subcommittee who developed the SFS93
(LADDIS), SFS97, and SFS97_R1. It is also working now on other
file server benchmarks.� SIP subcommittee. This subcommittee started the development of
the first-generation SPEC benchmark for comparing performance
for servers using the Session Initiation Protocol (SIP).� Virtualization subcommittee. This subcommittee started the first
generation SPEC benchmark for comparing virtualization perfor-
mance for data center servers.� WEB subcommittee. It is the subcommittee who developed the
WEB96, WEB99, WEB99_SSL, WEB2005, and the web server
benchmarks.
2. High Performance Group HPG. The HPG is involved in establishing,
maintaining, and endorsing a suite of benchmarks that characterize
high-performance computing applications for standardized and
4.3 BENCHMARK EXAMPLES 95

cross-platform performance evaluation. Such benchmark programs
are aimed at high-performance system architectures, including sym-
metric multiprocessor computer systems, clusters of workstations,
parallel systems with distributed memory, and conventional vector
parallel computers.
3. Graphics and Workstation Performance Group. This group includes
groups that build reliable and well-known graphics and workstation
performance benchmarks and reporting procedures. The main GWPG
project groups are the SPECapc and SPECgpc.� SPECAPC group. The Application Performance Characterization
(SPECapcSM) group was established in 1997 to provide a broad-
ranging set of standardized benchmarks for graphics and work-
station applications. Its present benchmarks cover popular CAD/
CAM, visualization, and digital content creation applications.� SPECgpc group. This group started its work in 1993. Basically, it
establishes performance benchmarks for graphics systems running
under OpenGL and other application programming interfaces
(APIs). One of its popular benchmark is SPECviewperf(r), which
is meant to be used for evaluating performance based on popular
graphics applications [42].
Other Benchmarks. Other examples of benchmark programs include:
� Winbench and WinStone from Ziff-Davis, which are used for Windows
PC applications and Windows PC graphics and disks.
� AIM benchmark from AIM Technology, which is used for UNIX work-
stations and server systems evaluation.
� NetBench from Ziff-Davis, which was developed for PC file server
applications.
� SYSmarks from BAPC0, which was developed for retail PC software
packages.
� MacBench from Ziff-Davis, which was developed for general Apple
Macintosh computer performance measurement.
� Business Benchmark, which was developed by Nelson and Associates to
benchmark Unix server throughput.
� MediaStones, which was developed by Providenza and Boekelheide for PC
file server benchmarking.
4.4 FREQUENT MISTAKES AND GAMES IN BENCHMARKING
There are frequent mistakes that many performance analysts fall in because of
inexperience or lack of awareness of fundamental concepts. Also, tricks are
96 BENCHMARKING AND CAPACITY PLANNING

played by experienced analysts to fool customers and to promote their products
unethically. Let us start with the following main frequent mistakes [1, 38]:
1. Misalignment. This deals with selecting a benchmarking area that is not
aligned with the general policy and objectives of the business. Bench-
marking has to be overseen by a leader at the strategic level to make sure
that it is in line with what is going on in the business.
2. Only mean behavior is represented in the benchmark program. In this
case, the workload ignores the variance and only average behavior is
represented in the workload.
3. The process is too large and multifaceted to be manageable. It is
recommended to avoid trying to benchmark a whole system as it will
be enormously costly and difficult to remain focused. The approach is to
select one or a few processes that form a part of the total system, work
with it in the beginning, and then move on to the next part of the system.
4. Using device utilizations for performance comparisons. Utilizations of the
devices are also used for comparing the performance measurements of the
systems. In such situations, lower utilization is considered. But in certain
environments, such measurements seem to be meaningless. For example,
if we have two systems where one of the system has a faster response time,
then in such a case the number of requests generated is higher, thereby
increasing the device use. The second system is a bit slower, and hence,
the device utilization is less in the second case compared with the first one
[1–4]. This does not mean that the second system is better. Here, the right
way to compare the performance is to measure it in terms of throughput
with respect to the requests generated per second. One more mistake here
is validating the models based on these device utilizations. The predicted
utilization of the model if matched with the model in the real time
environment does not ensure the validity of the model.
5. Inadequate buffer size. If the buffer size considered in a performance
study is insufficient, then it will affect the performance measures. Keep
in mind that the size and number of buffers are important parameters,
and their values in performance measurement and testing should
represent reasonable values similar to real-world systems.
6. Uneven distribution of I/O request. Many performance studies assume
that I/O requests are evenly distributed among all peripherals. However,
practically, this is not always the case. Such inaccurate assumption may
lead to inaccuracy in predicting the response time of computer and
network systems.
7. Ignoring the cache effect. In state-of-the art systems, such as Web systems,
caching has become a de-facto standard. However, most benchmark
programs do not represent the behavior of caching accurately, specifically
the fact that cache memory is sensitive to the order of requests. Such order
is lost in almost all workload characterization studies.
4.4 FREQUENT MISTAKES AND GAMES IN BENCHMARKING 97

8. Ignoring monitoring overhead. In almost all measurement performance
studies, hardware, software, or hybrid monitors are often used to collect
data about the system’s resources performance. Ignoring the monitor
overhead may lead to erroneous results and conclusions.
9. Ignoring validation of measurement results. Performance results obtained
through testing or measurement on real systems should be validated.
The analyst should not assume always that measurement results are
accurate, because any misplacing of a probe or a device may lead to
error in the measurement.
10. Disregarding sensitivity analysis. If the performance results are sensitive
to the initial conditions or input parameters, then more factors should
be added to the benchmark program model. Moreover, in such a case, a
more thorough sensitivity analysis should be conducted.
11. Ignoring transient performance. Some systems are most often in tran-
sient, moving from one state to another. Therefore, analyzing their
performance under steady-state conditions does not really represent the
real system’s performance. Of course, this applies to measurement and
simulation models as well as testing/measurement settings.
12. Collecting too much data, but not much data analysis. In many studies,
you will find the team collecting a huge volume of data results, but little
analysis is performed with such data. It is important to analyze the data
using statistical techniques. Hence, it is important to have the needed
expertise in the performance analysis team, especially someone who has
a good knowledge of statistical analysis and inference, in addition to a
system engineer, statistician/mathematician, programmer, and a good
technical writer.
13. Skewness of device demand is ignored. The basic assumption is that the
requests for the input/output are evenly distributed among all the
resources that accept these input/output requests [1–7]. However, this is
not the case in a real environment. All the requests for the input/output
follow to a single device that serves these requests, which leads to queuing
of these requests and higher delays. This strategy is not represented in the
test workload, and hence, ignoring this will show the bottlenecks that are
created to the devices in the real-time environments.
14. Loading level is controlled inappropriately. Several parameters are used
in the test workload for increasing the level of the load on the system.
For example, the number of users using the system could be increased,
the resource demand for each user could be increased, and also the users
think time can be decreased. The results for all the above options are not
the same. A more realistic approach of increasing the number of users is
by increasing the number of resources. To do this, the other two
alternatives can be used [1–4]. One possibility is changing the users
think time, but this is not equivalent to the first option, as this
alternative would not change the order of arrival of requests to the
98 BENCHMARKING AND CAPACITY PLANNING

various devices. Because of this reason, the number of misses in the
cache is less when compared with the system with more users. The
workload is changed significantly by the second alternative, and hence,
it could not be a correct representation of the real environment.
15. Not ensuring the same initial conditions. Whenever a benchmark is run,
the system state is changed. This change in the state of the system could
be caused by a change in disk space or change in the contents of the
records. Hence, we need to make sure that all the initial conditions are
reset [1–9]. This could be possibly done by removing the files created
while executing the benchmark and by retaining the changed contents
of the records to its original state. Another approach could be determin-
ing the results of sensitivity during the phenomena. The workload
should be added with more factors provided the sensitivity of the results
is higher with respect to the initial conditions.
16. Only mean behavior is represented in test workload. The test workload is
designed so as to represent the real workload. The resource demands
that are required during the test workload are designed by the analysts
so as to represent the resource demand similar to that of a real-time
environment. Here, only the average behavior of the environment is
represented by ignoring the variance. For example, in certain scenarios,
the average number of resource requests in the test workload may be
similar to that of the resource demand in the real environment.
However, if the arrival of requests for the resource takes an exponential,
Poisson, Weibull, or other distributions, then in such a case we may have
to represent the resource demand in the form of variance or a much
detailed representation must be used.
As for the games that are played by experienced performance analysts to
boost unethically the reputation of their systems or products, following is a list of
these games that result in a benchmarking study that is disingenuous or unfair:
1. Compilers are arranged in a way to optimize workload. In such a case, the
compiler is set up in a way to completely do away with the main loop in a
synthetic benchmark program, thus giving better performance results
than competing systems.
2. Small benchmark sizes. Using a small benchmark may mean 100% cache
hit, thus, ignoring the effect of overhead of I/O and memory units.
Undoubtedly, it is important to use several workloads in any perfor-
mance analysis study rather than relying on a small benchmark program.
3. Biased test specifications. It is important to have the test specifications
more general rather than biased to specific system or network.
4. Manual optimizing of benchmarks. In such a case, obtained performance
measures depend on the capability of translator rather than the system
under study.
4.4 FREQUENT MISTAKES AND GAMES IN BENCHMARKING 99

5. Running benchmarks on two systems with different configurations. In this
case, you will find that the benchmarks are being run in two systems with
different memory and I/O configurations.
4.5 PROCEDURES OF CAPACITY PLANNING AND RELATED
MAIN PROBLEMS
Capacity planning is considered an important process in any performance
analysis study as it ensures that sufficient computing resources are available to
meet future workload demands in a cost-effective method while meeting overall
performance goals. The term performance tuning is related to capacity
planning and is defined as the procedure to modify system parameters to
optimize performance. Another process related to capacity planning is capacity
management, which deals with current systems, while capacity planning deals
with future systems and settings [1–40].
To invoke into a capacity planning process, the analyst should follow the
following steps:
1. Implement the system under study.
2. Observer system usage.
3. Describe workload.
4. Forecast performance under different configurations and environments.
5. Select the most cost-effective alternative.
In the first phase, we should make sure that there are proper device setup for
the process, such as suitable counters, monitors, and hooks in the system to
record current usage. Accounting log facility that is usually built-in in any
operating system can be used as well. In the second phase, the usage of the
system is monitored to collect needed data about the behavior of the operation
of the system. Then, the workload is characterized and data are collected for
some time. Such data are analyzed and summarized in a way so that it can be
input to a system model to carry out performance prediction/estimation and
analysis. Different configurations and future workloads are input to a model of
the system to perform the needed model experimentation. If the goal is to
conduct a capacity management rather than a capacity planning study, then the
current configurations and workloads are input into a tuning model, usually a
simulation model that gives what changes in the system parameter settings
should be made to meet the needed objectives.
In the process of capacity planning, we usually start by predicting the
workload based on monitoring the system under test for a long period of time.
Next, various configurations and potential workloads/benchmarks are entered
to a model to forecast performance. In this context, we call the process of
choosing equipment ‘‘sizing.’’ Many performance analysts employ analytic
modeling for the sizing process [1–6, 15–30].
100 BENCHMARKING AND CAPACITY PLANNING
Performance analysts who work on capacity planning experience many
problems, including lack of unique standard for terminology, difficulty in mea-
suring model input in many cases, and difficulty to model distributed environ-
ments, among others. A brief description of these difficulties is given below.
Currently, there is no standard definition of the term ‘‘capacity’’; some define
it in terms of maximum throughput, and others define it in terms of maximum
number of users that the system can provide for while meeting a specified
performance goal. Also, it seems that each vendormakes capacity planning tools
with goals and functions in mind that are different from what the analysts need.
For example, some vendors integrate capacity planning and management and
call the technique a capacity planning tool. There are not many vendor-
independent workloads; most of the available benchmarks are vendor depen-
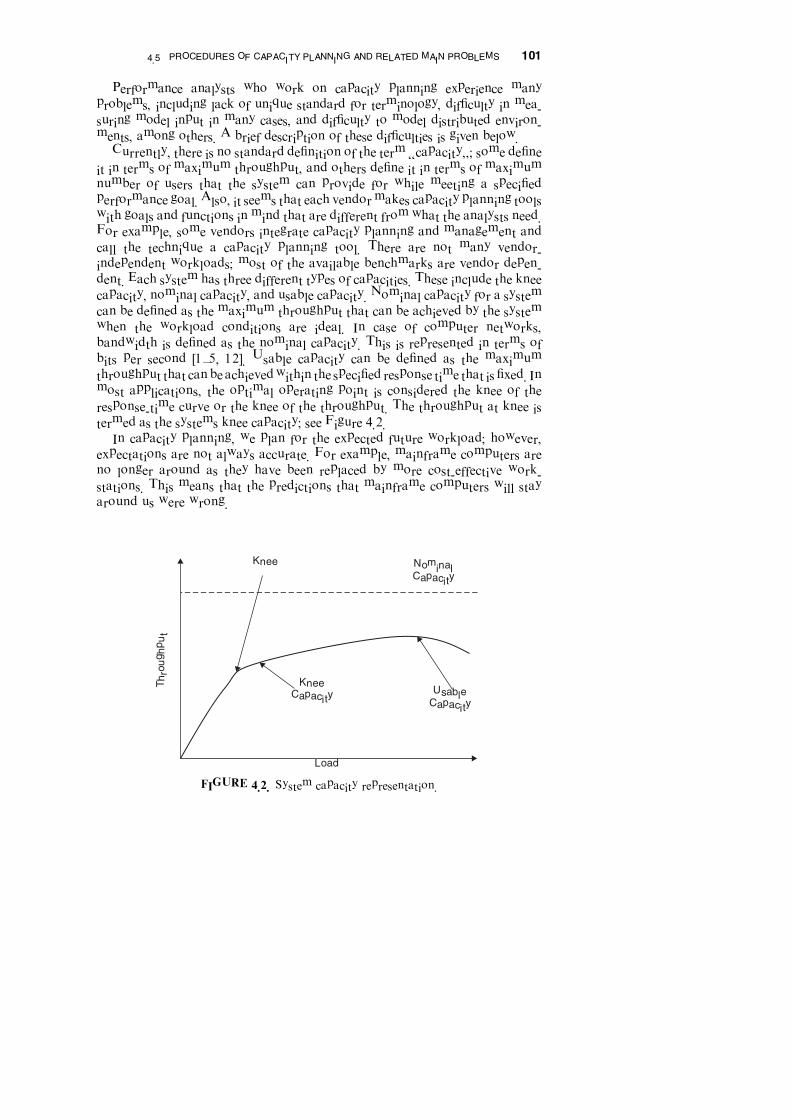
dent. Each system has three different types of capacities. These include the knee
capacity, nominal capacity, and usable capacity. Nominal capacity for a system
can be defined as the maximum throughput that can be achieved by the system
when the workload conditions are ideal. In case of computer networks,
bandwidth is defined as the nominal capacity. This is represented in terms of
bits per second [1–5, 12]. Usable capacity can be defined as the maximum
throughput that canbe achievedwithin the specified response time that is fixed. In
most applications, the optimal operating point is considered the knee of the
response-time curve or the knee of the throughput. The throughput at knee is
termed as the systems knee capacity; see Figure 4.2.
In capacity planning, we plan for the expected future workload; however,
expectations are not always accurate. For example, mainframe computers are
no longer around as they have been replaced by more cost-effective work-
stations. This means that the predictions that mainframe computers will stay
around us were wrong.
Nominal
Capacity
Load
Thro
ughput
Knee
Capacity
Knee
Usable
Capacity
FIGURE 4.2. System capacity representation.
4.5 PROCEDURES OF CAPACITY PLANNING AND RELATED MAIN PROBLEMS 101
Some inputs used in analytic and simulation models are not exactly
quantifiable, such as the think time used in analytic models. In almost all
analytic models, this does not consider interruptions caused by tea or coffee
breaks, for example.
The validation of projected operation is not an easy task; although
validation on current system configuration is not difficult, projection validation
is difficult as it requires changing workloads and configurations, as well as
confirming that the model output matches the changed real system’s perfor-
mance. It is hard to manage workload configurations on a real system.
It is important to point out here that performance is one part of capacity
planning; cost is crucial as well. When we talk about cost in this context, not
only do we mean the cost of hardware, but also we should include the cost of
software, maintenance, personnel, power, humidity control, and so on.
In today’s computing systems, distributed systems are pretty much common.
This means focusing too much on capacity planning on individual device is no
longer vital. However, such systems are not easy to model. These days, you can
find special commercial tools for capacity planning with built-in models for
specific systems as well as workload analyzers and monitors that recognize the
accounting logs of such systems.
4.6 CAPACITY PLANNING FOR WEB SERVICES
Capacity planning for Web services is considered unique because: (a) Web
servers rely on large-scale systems of computers, networks, programs, and
users; (b) they are complex; and (c) they are used by a large number of users
who request service at random. The latter aspect makes management and
planning of such systems complicated and challenging. Web systems are
characterized by being dynamic, requiring high quality of service (QoS) and
high performance, and needing to integrate with different systems, such as
databases, scheduling, planning, management, and tracking systems [34–37].
TheWorldWideWeb (WWW) is an evolving information technology system
that grows at an impressive exponential rate. It has experienced extraordinary
growth and has become the dominant application in both the public Internet
and internal corporate intranet environments. Some recent research studies
have found out that over 75% of the traffic on the Internet backbone is
Hypertext Transfer Protocol HTTP-based [4, 24–40]. Many applications such
as e-commerce, including mobile commerce (m-commerce), e-government,
e-services, digital libraries, distance learning, and video-on-demand, are all
based on the Web infrastructure. Moreover, such applications have even
become more and more widely used because of the proliferation of wireless
networks and devices. Popular websites such e-government, and digital library
sites get millions of requests per day, which increase the average response time
of such sites. Clearly, this has become an important issue for website admin-
istrators and IT managers of all kinds of organizations. Identifying the
102 BENCHMARKING AND CAPACITY PLANNING

bottlenecks, forecast future capacities, and finding out the best cost-effective
approach to upgrade the system to cope with the expected increase in the
workload are essential for any proper web service. In web services, it is
important to support the increase in load without sacrificing the response
time. Capacity planning is vital for web services as it: (a) guarantees customer
satisfaction, (b) prevents potential money losses, (c) protects the image of the
organization/company, and (d) provides proper plans for future expansion.
Most websites these days can fall in the following main categories: (a)
interaction as used for registration in conferences, booking in hotels, airline
reservation, and so on, (b) informational as used for online newspapers,
magazines, and books; (c) web portals, such as electronic shopping malls,
search engines, and webmail services; (d) shared environment as in collabora-
tive design tools; (e) transactional, as in online banking and stock trading; (f)
workflow, as in online scheduling and inventory systems; (g) news groups, as in
online discussion groups; and (h) online auction [4, 37].
A web server is basically a mixture of hardware devices, operating systems,
and application software/contents that cooperate and collaborate to provide
satisfactory service. The characteristics of these components and the way they
interact/connect with each other influence the overall performance of the Web
servers and intranets.
The major performance metrics for any web system are: (a) end-to-end
response time and site response time, (b) throughput in request/sec or/and in
Mbps, (c) visitors per day, (d) hit value, (e) errors per second, (f) startup
latency, and (g) jitter. The latter two metrics are important for streaming
services. The QoS of Web services is crucial to keep current customers and
attract new ones. The QoS metrics of Web services should represent response
time, availability, reliability, predictability, security, and cost [4, 37].
The main components of a Web system are the browser, network, and
server. The user usually clicks on a hyperlink to request a document. Then, the
client browser tries to find the needed document in the local cache; if it is found,
then we say we have a hit. Otherwise, we say that we have a miss, and in such a
case, the browser asks the Domain Name System DNS service to map the
server hostname to an IP address. Then, the client opens a Transmission
Control Protocol (TCP) connection to the server defined by the URL of the
link and sends an HTTP request to the server, which provides a response. Next,
the browser formats and displays the document and provides the needed
document. The latter is stored in the browser’s cache.
The network enforces delays to bring information from the client to the
server and back from the server to the client. Such delays are a function of
the different components located between the client and server including
modems, routers, communication links, bridges, and so on.
When the request arrives from the client, the server parses it according to the
operation of the HTTP protocol. Then, the server executes the requested
method, such as GET, HEAD, and so on. If the method, for example, is a GET,
then the server looks up the file in its document tree using the file system where
4.6 CAPACITY PLANNING FOR WEB SERVICES 103
the file can be in the cache or on disks. Then, the server reads the file and writes
it to the network port. Now, when the file is totally sent, the server closes the
connection. As the number of clients and servers increases, end user perfor-
mance is usually constrained by the performance of components such as
bridges, routers, networks, and servers along the path from client to server.
Obviously, identifying the device/component that limits the performance is
essential. Such a device/component is called the bottleneck device.
Among the techniques that can be used to improve the performance in terms
of reducing the mean access time and the bandwidth needed to transfer the
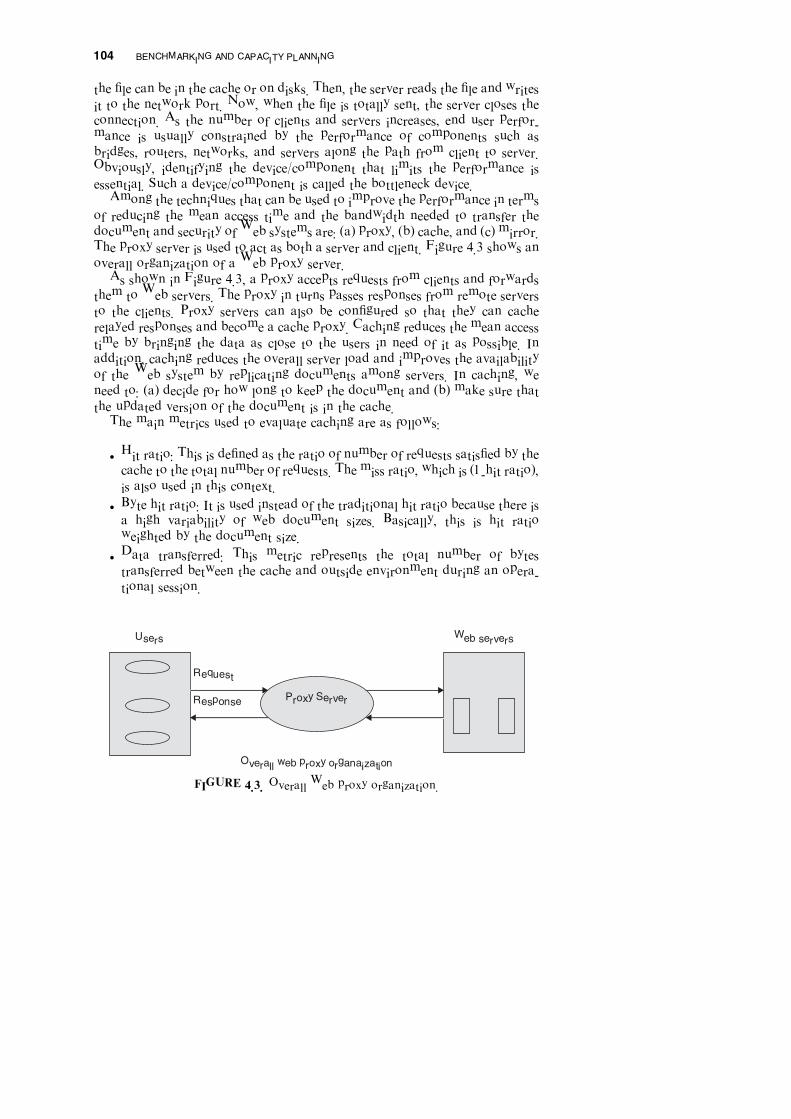
document and security of Web systems are: (a) proxy, (b) cache, and (c) mirror.
The proxy server is used to act as both a server and client. Figure 4.3 shows an
overall organization of a Web proxy server.
As shown in Figure 4.3, a proxy accepts requests from clients and forwards
them to Web servers. The proxy in turns passes responses from remote servers
to the clients. Proxy servers can also be configured so that they can cache
relayed responses and become a cache proxy. Caching reduces the mean access
time by bringing the data as close to the users in need of it as possible. In
addition, caching reduces the overall server load and improves the availability
of the Web system by replicating documents among servers. In caching, we
need to: (a) decide for how long to keep the document and (b) make sure that
the updated version of the document is in the cache.
The main metrics used to evaluate caching are as follows:
� Hit ratio: This is defined as the ratio of number of requests satisfied by the
cache to the total number of requests. The miss ratio, which is (1-hit ratio),
is also used in this context.
� Byte hit ratio: It is used instead of the traditional hit ratio because there is
a high variability of web document sizes. Basically, this is hit ratio
weighted by the document size.
� Data transferred: This metric represents the total number of bytes
transferred between the cache and outside environment during an opera-
tional session.
Proxy Server
Users
Request
Response
Web servers
Overall web proxy organaization
FIGURE 4.3. Overall Web proxy organization.
104 BENCHMARKING AND CAPACITY PLANNING

The growth of Internet usage during the last several years has increased in an
exponential manner. Different applications over the Web have different
requirements. To provide the quality of service guarantees we need to identify
and separate the services with different service characteristics. Also, we should
focus on managing the load on the Web servers to provide efficient service [34].
Hence, we need to deal with the challenges posed by the network as well as by
the Web servers. That is, we should scale up the capacity of the server by
keeping in mind the network capacity available for providing a service.
Below is a brief description of what needs to be addressed for scaling the
Web services so as to meet the needed quality of service guarantees:
1. Improving the LAN speed. To support a server throughput of 1 Gb/s, it is
not sufficient to have the Gigabit Ethernet. This is because the server
may not be able to provide the required throughput due to several
drawbacks in the protocols, chip-set, and operating system. To over-
come these issues and to support the required server throughput, we
need to have at least 10-G Ethernet [34–35]. Also, this could not be the
only possible solution; rather, we also need to look into several issues
that caused the performance bottlenecks. Moreover, to meet the
increasing performance demand, we need to have a layered server
architecture for the server that is distributed. It is important to avoid
the bottleneck caused by the operating system and should support the
user-level I/O.
2. Handling the dynamic content. Using the intercache protocols for com-
munication, push and pull proxies have reduced the latency for getting
the information and have reduced a lot of load on the server [35].
However, the major challenge that needs to be addressed is the dynamic
content of the Web, which is constantly increasing. To solve this, we need
to track the dynamic Web pages for the individual components and define
a structure for these pages. This not only allows caching but also allows
the functionality such as inserting the dynamic content at different
hierarchy levels of the Web server. The main advantage of this structure
is that it helps in pushing the content to the servers at the edge. The
proxies, which do the transformation of the content, support both
the wireless and wired applications [36]. To support this, we need to
enhance the Internet-based protocols. To reduce the overhead created by
the dynamic content, novel management techniques are used.
3. Web server scaling to store large content and increase hit rates. Scaling
the Web servers using a traditional approach performs the balancing of
the load on the server with the help of a load distributor at the front end.
Looking in depth, this solution is not a scalable one, because if the
operation of the front end takes place at the transport layer, then there
will be a problem with the scalability because of content duplication in
the cache of the servers. However, there will be a bottleneck with the
4.6 CAPACITY PLANNING FOR WEB SERVICES 105

load distributor itself if the amount of work exceeds what is expected
[35–36]. To resolve this issue, we need to address on-demand requests
with the help of service control points. We can use clustered servers
instead of independent servers for improving the scalability. Scalability
can be increased by implementing the lightweight communication
protocols for the clustered environment.
4. Internet service distribution. The Internet model that is used currently
more or less is a centralized model that stores all the information in a
single repository. Such a model is not scalable. To increase the scal-
ability, the current model needs to be shifted to a distributed environ-
ment. This has several security and access issues that need to be
addressed. To overcome this, the infrastructure for the Internet is viewed
as a collection of servers where each server holds the data. Moreover, the
efficiency of the Internet is measured not by the method used for
accessing the required data, but rather by how the services are supported
efficiently [34–37]. To implement the distributed services efficiently, there
is a need to modify the existing protocols to address the related issues.
5. Large servers engineering and management. The operation support
system and capacity planning procedures are used to support telecom-
munication systems. Web servers lack such a kind of support. With the
increase in volume and complexity of the traffic in the Web servers, there
is a need for developing efficient engineering practices that support the
characterization of the traffic at the Web servers. It becomes compli-
cated because of the bursty nature of the traffic, nonstationary nature
over small intervals, and the complexity in estimating the requirements
for the dynamic content of the web pages [35, 36]. With server pool
supporting thousands of servers, the issue of managing these servers
efficiently by considering the performance, recovery, replication and
high availability becomes difficult. The challenge here is to find a viable
solution for managing the increase in the number of the servers.
6. Issues pertaining to I/O and architecture. Usually the performance of the
Web servers are measured only in terms of application services and
the underlying protocols that support them by neglecting the influence
of the operating system and the hardware [34–36]. With the increase in the
I/O and the processing requirements, the issues relating to architecture
are important as they prevent scalability. One such example is improper
event recognition techniques, which could lead to bottlenecks. Most of
the multiprocessor systems performance degrades because of the spinning
on locks by the processor for the shared resources. Most I/O operations
require copying of data from one memory to another, which reduces the
performance. Also, most often, processing of the protocols is not cache
friendly. Because cache hits are becoming less and that the increase in
demand on the servers would increase cache misses, the server’s perfor-
mance would degrade. With the increase in audio and video streaming,
106 BENCHMARKING AND CAPACITY PLANNING

the servers must be able to support an excess of 10,000 streams or so. To
provide this, the cache hits should be high and the number of I/O should
be less. As the bandwidth for the local area network (LAN)/wide area
network (WAN) is increasing rapidly, the amount of data sent per request
is almost unrelated when compared with the I/O requests.
7. Issues pertaining to QoS. With the evolution of different networks, the
types of traffic supported by these networks are also increased [35, 36].
All these traffic types should be provided with quality service at the
server level and also at the network level. Examples of the traffic types
include discrete data traffic, continuous data traffic, variable data traffic,
real-time data traffic, non-real-time data traffic, and so on. Hence, all
these traffic types should be differentiated, and the service parameters
for each should be served. One such possibility is negotiating with the
network if the network has the necessary characteristics to support
the traffic across it. If it addresses all the quality of service (QoS)
parameters, then the service is provided. But this is addressing only QoS
at the network and not at the server, which should also be looked at. If
this issue is not addressed at the server, then it could lead to bringing the
traffic from the network and dropping at the server.
8. Issues related to performance and scaling for back-end systems. Usually,
the focus of the Internet servers has been on the front-end servers, but
because of the evolution of e-commerce and e-business applications, the
focus needs to shift to the system as a whole [35, 36]. The issues for
scaling are difficult with respect to the back-end systems at the web
server. This is because inherent dependencies exist when accessing the
data. Hence to avoid this problem it is better to use databases at
the clustered or distributed environment.
9. Controlling the overload at the Internet server. The Internet server
performance is measured by the server throughput and the response
time for serving a client request. The server throughput enhances up to a
certain level known as the threshold; thereafter, it decreases because of
overload. This threshold is termed as the overloading point. Because
of overload, the response time also increases to a larger extent. To
control the load on the Web server, we use efficient mechanisms for
overload control [34–37]. These mechanisms do not allow the load on
the Web server to exceed the overload point. To implement the overload
control efficiently, the data packets need to be classified at the lowest
level of the protocol stack. Overload control is nonexistent for the Web
servers [38]. Hence, a need exists to design schemes for overload control
and denial of service scenarios.
10. Secure transaction performance issues. Using the Secure Socket Layer
(SSL) protocol for e-commerce applications takes a high processing time
because of the overhead incurred. This leads to a slow response from the
Web server. However, SSL provides the most secure e-commerce
4.6 CAPACITY PLANNING FOR WEB SERVICES 107
transactions however it has a bottleneck because of excessive overhead.
The security feature provided by the IPSec introduces these issues at the
network stack lower level [38]. Also, we need to consider the type of
transactions the server handles (i.e., whether the transactions are secure
or nonsecure). If dedicated servers are used to handle SSL, then the
overload needs to be addressed. Also, we need to devise mechanisms
that tradeoff caching as caching conflicts with the security.
11. Data repository for server performance. The performance of the server is
logged in HTTP logs. To address the issues on performance caused by
architecture, we need more detailed information [35–38]. We should
have standard encoding schemes for HTTP, and traces obtained from
the bus should secure the information. This information is recorded
from the sites when they are extremely busy with no impact on the
performance of these sites. Even the log stored by the HTTP does not
characterize the traffic. Apart from this, the total size of the requested
web page and the time taken to process the request needs to be logged
into the logs [34–38].
It is worth mentioning that Web traffic is bursty, which means that data are
transmitted randomly with peak rates exceeding the mean rates by a high factor
that usually ranges between 9 and10.The termburtness is defined as the peak rate
divided by the mean rate. The bursty behavior of Web systems makes it difficult
to size the server’s capacity and bandwidth demand created by load spikes/
burtness. The effect of peak spikes on performance of the website is critical.
4.7 SUMMARY
Benchmarking and capacity planning are essential procedures in the perfor-
mance evaluation of most computer systems and networks ranging from single
computer systems, multiprocessor computer systems, distributed and parallel
systems, local area networks, metropolitan area networks, wide area networks,
wireless networks, client-server systems, and web systems.
Because of changes in the traffic and in the architecture of the various
systems, new techniques need to be designed for evaluating computer systems
and networks. Most benchmarks used for grid and cluster performance
assessment use the Message Passing Interface (MPI) for evaluating these
environments. Apart from these, computer system benchmarks have also
been developed for evaluating the websites’ performance. The performance
of the Web server is evaluated on the basis of the server load and the network
load. Each benchmark used has different mechanisms for representing the
performance evaluation results. To improve the performance of the websites,
we need to optimize the load on the Web server’ which requires capacity
planning strategies. Different applications over the Web have different
108 BENCHMARKING AND CAPACITY PLANNING

requirements, and to provide the required quality of service we need to identify
and separate the resources with different service characteristics and also should
focus on managing the load on the web servers so that it does not exceed the
overloading point. This helps in optimizing the load and providing efficient
service. Also, the resource use for I/O should be optimized.
Experimentation is often used instead of analytic analysis that uses approx-
imate queueing and other mathematical models. It is essential to implement the
needed experiments properly to have confidence in all performed tests under
various operating conditions and environments. Of course, such an arrange-
ment should be done in a cost-effective manner without affecting the credibility
of the obtained results and conclusions. It is expected to get some variations in
the results obtained from the experiments because of all types of errors or
noncontrolled variables; however, such errors should be taken into account
when the results are analyzed. Constructing the confidence intervals is an
important analyzing step to determine the integrity of the chosen workloads
and benchmarks. Finally, it is essential that the performance analyst avoids the
common mistakes and myths that many performance analysts fall into in order
to have a credible analysis and results.
REFERENCES
[1] R. Jain,‘‘ The Art of Computer System Performance Analysis: Techniques for
Experimental Design, Measurement, Simulation and Modeling,’’ John Wiley, New
York, 2001.
[2] D. A. Menasce, V. A. F. Almeida, and L. W. Dowdy, ‘‘Performance by Design:
Computer Capacity Planning by Example,’’ Prentice Hall, Upper Saddle River, NJ,
2004.
[3] D. A. Menasce, and V. A. F. Almeida, ‘‘Capacity Planning for Web Services:
Metrics, Models, and Methods,’’ Prentice Hall, Upper Saddle River, NJ, 2001.
[4] D. J. Lilja, ‘‘ Measuring Computer Performance: A Practitioner’s Guide,’’
Cambridge University Press, Cambridge, UK, 2000.
[5] K. Hwang, and Z. Xu, ‘‘ Scalable Parallel Computing: Technology, Architecture
and Programming,’’ MCGraw Hill, New York, 1998.
[6] J. Ward, ‘‘Space Time Adaptive Processing for Airborne Radar,’’ MIT Lincoln
Laboratory Technical Report 1015.
[7] W. L. Melvin, ‘‘Space Time Adaptive Processing and Adaptive Arrays: Special
Collection of Papers,’’ IEEE Transactions on Aerospace and Electronic Systems,
Vol. 36, No. 2, pp. 508 510 2000.
[8] A. Choudhary, W K Liao, D. Weiner, P. Varshney, R. Linderman, and R. Brown,
‘‘Design, Implementation and Evaluation of Parallel Pipelined STAP on Parallel
Computers,’’ IEEE Transactions on Aerospace and Electronic Systems, Vol. 36,
No. 2, pp. 528 548, 2000.
[9] K. Hwang, Z. Xu, and M. M. Arakawa, ‘‘Benchmark Evaluation of the IBM SP2
for Parallel Signal Processing’’, Vol. 13, No. 4, pp. 50 66, 1996.
REFERENCES 109

[10] C. J. Wang, C. L., Wang, and K. Hwang, ‘‘ STAP Benchmark Evaluation of the
T3D, SP2, and Paragon,’’ Proceedings of the 1997 Intl. Conference on Parallel and
Distributed Computing Systems, New Orleans, CA, October, 1997.
[11] J. L. Hennessy, and D. A. Patterson, ‘‘Computer Architecture: A Quantitative
Approach, 3rd Edition’’ Morgan Kaufmann, San Francisco, CA, 2003.
[12] D. A. Menasce, and V. A. F. Almeida, ‘‘Scaling for E Business: Technologies,
Models, Performance, and Capacity Planning,’’ Prentice Hall, Upper Saddle River,
NJ, 2000.
[13] D. A. Menasce, V. A. F. Almeida, and L. W. Dowdy, ‘‘Capacity Planning and
Performance Modeling: from Mainframes to Client Server Systems,’’ Prentice Hall,
Upper Saddle River, NJ, 1994.
[14] C. Milsap, ‘‘Optimizing Oracle Performance: A Practitioner’s Guide to Optimizing
Response Time’’ O’Reilly, Sebastopol, CA, 2003.
[15] B. Wong, ‘‘Configuration and Capacity Planning for Solaris Servers,’’ Prentice
Hall, Upper Saddle River, NJ, 1997.
[16] A. Cockcroft and R. Pettit,’’ Sun Performance and Tuning,’’ 2nd Edition, Prentice
Hall, Upper Saddle River, NJ, 1998.
[17] P. Nicopolitidis, M. S. Obaidat, G. Papadimitriou, and A. S. Pomportsis, ‘‘Wireless
Networks,’’ Wiley, New York, 2003.
[18] M. S. Obaidat, and G. Papadimitriou, ‘‘Applied System Simulation: Methodologies
and Applications,’’ Kluwer, Doidvecht, The Netherland, 2003.
[19] M. S. Obaidat, H. Khalid, and K. Sadiq, ‘‘A Methodology for Evaluating the
Performance of CISC Computer Systems Under Single and Two level Cache
Environments,’’ Microprocessing and Microprogramming: The Euromicro Jour
nal, Vol. 40, No. 6, pp. 411 426, 1994.
[20] M. S. Obaidat, and H. Khalid, ‘‘Estimating Neural Networks Based Algorithm for
Adaptive Cache Replacement,’’ IEEE Transactions on Systems, Man and Cyber
netics, Part B: Cybernetics, Vol. 28, No. 4, pp. 602 611, 1998.
[21] H. Khalid and M. S. Obaidat, ‘‘KORA: A New Cache Replacement Scheme,’’
Journal of Computers & EE, Vol. 26, No. 3 4, pp. 187 206, 2000.
[22] H. Khalid, and M. S. Obaidat, ‘‘Application of Neural Networks to Cache Replace
ment,’’ Neural Computing & Applications Journal, Vol. 8, pp. 246 256, 1999.
[23] K. Khalil, J. C. Hand, and M. S. Obaidat, ‘‘Methodologies for Characterizing
Traffic in Wide Area Networks: Analysis and Benchmarking,’’ International
Journal of Communication Systems, Vol. 8, No. 2, pp. 117 127, 1995.
[24] B. Lee, and L. John, ‘‘NpBench: A Benchmark Suite for Control Plane and Data
Plane Applications for Network Processors,’’ Proceedings of the 21st International
Conference on Computer Design, Vol. 3, 125 132, 2003.
[25] C. Ho, and Y S Wu, ‘‘Benchmarking Performance Indicators for Banks,’’ Bench
marking: An International Journal, Vol. 13, No. ½, pp. 147 159, 2006.
[26] G. Memik, W. H. M. Smith, and W. Hu, ‘‘NetBench: A Benchmarking Suite for
Network Processors,’’ Proceedings of the 2001 International Conference on
Computer Aided design, pp. 39 42 2001.
[27] R.W. Hockney, ‘‘The Science of Computer Benchmarking (Software, Environment
and Tools),’’ SIAM Books, Philadelphia, PA, 1995.
110 BENCHMARKING AND CAPACITY PLANNING

[28] G. Alfonsi and L. Muttoni, ‘‘Performance Evaluation of a Windows NT Based PC
Cluster for High Performance Computing,’’ Journal of Systems Architecture,
pp. 345 359 2004.
[29] K. Maly, A. Gupta, and S. Mynam, ‘‘BTU: A Host Communication Benchmark,’’
Computer, Vol. 31, No. 5, pp. 66 74, 1998.
[30] M. Hempstead, M. Welsh, and D. Brooks, ‘‘TinyBench: The Case for a Standar
dized Benchmark Suite for Tiny OS based Wireless Sensor Network Devices,’’
Proceedings of the 29th Annual IEEE International Conference on Local Area
Networks, pp. 12 13, 2004.
[31] I. Ahmad, ‘‘Express Versus PVM: A Performance Comparison,’’ Journal of
Parallel Computing, pp. 783 812, 1997.
[32] B. K. Szymanski, Y. Liu and R. Gupta, ‘‘Parallel Network Simulation under
Distributed Genesis’’, Proceedings of the 17th Workshop on Parallel and Distrib
uted Simulation, pp. 212 219, June 2003.
[33] V. S. Getov, A. J. G. Hey, R. W. Hockney, and I. C. Wolton, ‘‘The GENESIS
Benchmark Suite: Current State and Results,’’ Proceedings of Workshop on
Performance Evaluation of Parallel Systems, pp. 182 190, 1993.
[34] K. Hwang, C. Wang, C. L. Wang, and Z. Xu, ‘‘Resource Scaling Effects on MPP
Performance: The STAP Benchmark Implications,’’ IEEE Transactions on Parallel
and Distributed Systems, Vol. 10, No. 5, pp. 509 527, 1999.
[35] N. Boudriga, and M. S. Obaidat, ‘‘Intelligent Agents on the Web: A Review,’’ IEEE
Journal of Computing in Science and Engineering, pp. 35 42, 2004.
[36] K. Kant, and P. Mohapatra, ‘‘Scalable Internet Servers: Issues and Challenges,’’
ACM SIGMETRICS Performance Evaluation Review, Vol. 28, No. 2, pp. 5 8,
2000.
[37] D. Ardagna, and C. Francalanci, ‘‘A Cost Oriented Methodology for the Design of
Web Based IT Architectures,’’ Proceedings of the 2002 ACM Symposium on
Applied Computing, pp. 1127 1133, March 2002.
[38] M. Arlitt, D. Krishnamurthy, and J. Rolia, ‘‘Characterizing the Scalability of a
Large Web Based Shopping System,’’ ACM Transactions on Internet Technology,
Vol. 1, No. 1, pp. 44 69, 2001.
[39] A. Eucens, ‘‘Avoid these Ten Benchmarking mistakes.’’ Available at: http://
www.benchmarkingplus.com.au/mistakes.htm.
[40] http://www.netlib.org/parkbench/html/.
[41] ‘‘Index for PVM3 Library,’’ Available at: http://www.netlib.org/pvm3/.
[42] ‘‘The Message Passing Interface (MPI) standard,’’ Available at: http://www unix
.mcs.anl.gov/mpi/index.html.
[43] ‘‘Standard Performance Evaluation Corporation,’’ Available at: http://www.spec.org/.
[44] ‘‘BenchmarkprogramsandReports,’’Available at: http://www.netlib.org/benchmark/.
[45] ‘‘Benchmark Applications’’ Active Hardware, Available at: http://active hardwar
e.com/english/benchmarks/benchmarks.htm.
[46] ‘‘Web TP,’’ Available at: http://webtp.eecs.berkeley.edu/.
[47] ‘‘NP Bench,’’ Available at: http://projects.ece.utexas.edu/ece/lca/npbench/.
[48] ‘‘LMbench Tools forperformanceanalysis’’Available at: http://www.bitmovera.com/
lmbench/.
REFERENCES 111
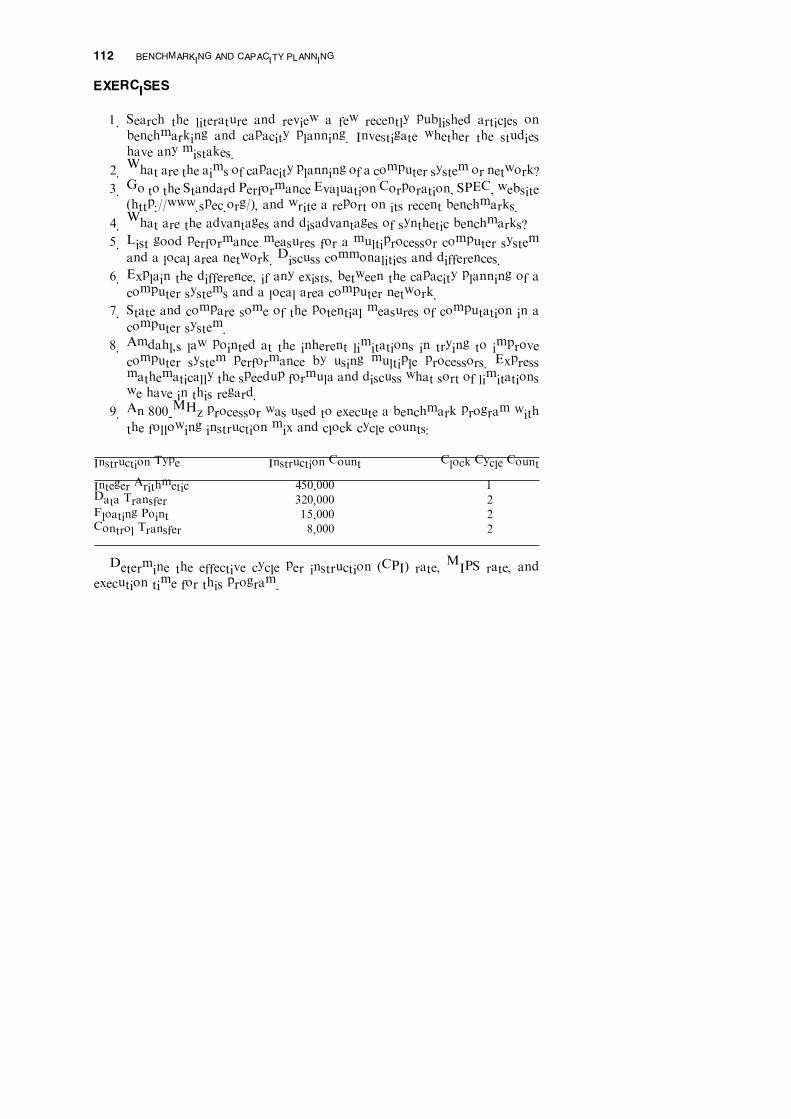
EXERCISES
1. Search the literature and review a few recently published articles on
benchmarking and capacity planning. Investigate whether the studies
have any mistakes.
2. What are the aims of capacity planning of a computer system or network?
3. Go to the Standard Performance Evaluation Corporation, SPEC, website
(http://www.spec.org/), and write a report on its recent benchmarks.
4. What are the advantages and disadvantages of synthetic benchmarks?
5. List good performance measures for a multiprocessor computer system
and a local area network. Discuss commonalities and differences.
6. Explain the difference, if any exists, between the capacity planning of a
computer systems and a local area computer network.
7. State and compare some of the potential measures of computation in a
computer system.
8. Amdahl’s law pointed at the inherent limitations in trying to improve
computer system performance by using multiple processors. Express
mathematically the speedup formula and discuss what sort of limitations
we have in this regard.
9. An 800-MHz processor was used to execute a benchmark program with
the following instruction mix and clock cycle counts:
Instruction Type Instruction Count Clock Cycle Count
Integer Arithmetic 450,000 1
Data Transfer 320,000 2
Floating Point 15,000 2
Control Transfer 8,000 2
Determine the effective cycle per instruction (CPI) rate, MIPS rate, and
execution time for this program.
112 BENCHMARKING AND CAPACITY PLANNING


![Capitulo4 bombascentrifugas[1]](https://img.pdfslide.net/doc/110x75/558a050cd8b42a4f4a8b4640/capitulo4-bombascentrifugas1.jpg)