Embed Size (px)
Citation preview
THE STATE NEW ECONOMY INDEXBenchmarking Economic Transformation in the States
Robert D. Atkinson, Randolph H. Court, and Joseph M. Ward
Progressive Policy InstituteTechnology & New Economy Project
July 1999

ACKNOWLEDGMENTS
We wish to thank our colleagues at the Progressive Policy Institute for their insights and editorial guidance, particularly ChuckAlston, Jenny Bates, Debbie Boylan, Will Marshall, and Steven Nider.
We would also like to thank those who provided data and background information for the Index, including the Center for Strategic andInternational Studies (CSIS); Charles E. Krider, the Institute for Public Policy and Business Research, University of Kansas; CraigJerald, Education Week; Jennifer Montana, Collaborative Economics; William Parsons, Corporate Demographics; Michelle Richards,National School Boards Association; and the Bureau of Labor Statistics’ Occupational Employment Statistics Program.
Finally, we want to express our gratitude and appreciation to those who served as outside reviewers: Lou Glazer, Michigan Futures; DonHicks, University of Texas; Walt Plosila, Battelle Labs; Andrew Reamer, Reamer and Associates; William Schweke, Corporation forEnterprise Development; and Roger Stough, George Mason University.
S TAT E N E W E C O N O M Y I N D E X
TABLE OF CONTENTS
I N T R O D U C T I O N . . . . . . . . . . . . . . . . . . . . . . . . . . . . . . . . . . . . . . . . . . . . . . . . . . . . . . . . . . . . . . . . . . . . 3
THE INDICAT O R S . . . . . . . . . . . . . . . . . . . . . . . . . . . . . . . . . . . . . . . . . . . . . . . . . . . . . . . . . . . . . . . . . . . . . 6O V E RVIEW AND METHODOLOGY . . . . . . . . . . . . . . . . . . . . . . . . . . . . . . . . . . . . . . . . . . . . . . . . . . . 6THE RANKINGS . . . . . . . . . . . . . . . . . . . . . . . . . . . . . . . . . . . . . . . . . . . . . . . . . . . . . . . . . . . . . . . . . . . . . . . 7S U M M A RY OF RESULT S . . . . . . . . . . . . . . . . . . . . . . . . . . . . . . . . . . . . . . . . . . . . . . . . . . . . . . . . . . . . 12KNOWLEDGE JOBS . . . . . . . . . . . . . . . . . . . . . . . . . . . . . . . . . . . . . . . . . . . . . . . . . . . . . . . . . . . . . . . . 13
Office Jobs . . . . . . . . . . . . . . . . . . . . . . . . . . . . . . . . . . . . . . . . . . . . . . . . . . . . . . . . . . . . . . . . . . . . . . . 14Managerial, Professional, and Technical Jobs . . . . . . . . . . . . . . . . . . . . . . . . . . . . . . . . . . . . . 15Workforce Education . . . . . . . . . . . . . . . . . . . . . . . . . . . . . . . . . . . . . . . . . . . . . . . . . . . . . . . . . . . . . 16
GLOBALIZATION . . . . . . . . . . . . . . . . . . . . . . . . . . . . . . . . . . . . . . . . . . . . . . . . . . . . . . . . . . . . . . . . . . . . 17Export Focus of Manufacturing . . . . . . . . . . . . . . . . . . . . . . . . . . . . . . . . . . . . . . . . . . . . . . . . . . . 18Foreign Direct Investment . . . . . . . . . . . . . . . . . . . . . . . . . . . . . . . . . . . . . . . . . . . . . . . . . . . . . . . . 19
ECONOMIC DYNAMISM . . . . . . . . . . . . . . . . . . . . . . . . . . . . . . . . . . . . . . . . . . . . . . . . . . . . . . . . . . . . 20Gazelle Jobs . . . . . . . . . . . . . . . . . . . . . . . . . . . . . . . . . . . . . . . . . . . . . . . . . . . . . . . . . . . . . . . . . . . . . . 21Job Churning . . . . . . . . . . . . . . . . . . . . . . . . . . . . . . . . . . . . . . . . . . . . . . . . . . . . . . . . . . . . . . . . . . . . . 22Initial Public Offerings . . . . . . . . . . . . . . . . . . . . . . . . . . . . . . . . . . . . . . . . . . . . . . . . . . . . . . . . . . . 23
THE DIGITAL ECONOMY . . . . . . . . . . . . . . . . . . . . . . . . . . . . . . . . . . . . . . . . . . . . . . . . . . . . . . . . . . . 24Online Population . . . . . . . . . . . . . . . . . . . . . . . . . . . . . . . . . . . . . . . . . . . . . . . . . . . . . . . . . . . . . . . . 25Commercial Internet Domain Name Registrations . . . . . . . . . . . . . . . . . . . . . . . . . . . . . . . . . 26Technology in Schools . . . . . . . . . . . . . . . . . . . . . . . . . . . . . . . . . . . . . . . . . . . . . . . . . . . . . . . . . . . . 27Digital Government . . . . . . . . . . . . . . . . . . . . . . . . . . . . . . . . . . . . . . . . . . . . . . . . . . . . . . . . . . . . . . . 28
INNOVATION CAPACITY . . . . . . . . . . . . . . . . . . . . . . . . . . . . . . . . . . . . . . . . . . . . . . . . . . . . . . . . . . . . 30High-Tech Jobs . . . . . . . . . . . . . . . . . . . . . . . . . . . . . . . . . . . . . . . . . . . . . . . . . . . . . . . . . . . . . . . . . . . 31Scientists and Engineers . . . . . . . . . . . . . . . . . . . . . . . . . . . . . . . . . . . . . . . . . . . . . . . . . . . . . . . . . . 32Patents . . . . . . . . . . . . . . . . . . . . . . . . . . . . . . . . . . . . . . . . . . . . . . . . . . . . . . . . . . . . . . . . . . . . . . . . . . . 33Industry Investment in R&D . . . . . . . . . . . . . . . . . . . . . . . . . . . . . . . . . . . . . . . . . . . . . . . . . . . . . 34Venture Capital. . . . . . . . . . . . . . . . . . . . . . . . . . . . . . . . . . . . . . . . . . . . . . . . . . . . . . . . . . . . . . . . . . . 35
ECONOMIC DEVELOPMENT STRATEGIES FOR THE NEW ECONOMY . . . . . . . 36CO-INVEST IN THE SKILLS OF THE WORKFORCE . . . . . . . . . . . . . . . . . . . . . . . . . . . . . 37CO-INVEST IN AN INFRASTRUCTURE FOR INNOVATION . . . . . . . . . . . . . . . . . . . . . . 38PROMOTE INNOVATION- AND CUSTOMER-ORIENTED GOVERNMENT . . . . . . 39FOSTER THE TRANSFORMATION TO A DIGITAL ECONOMY . . . . . . . . . . . . . . . . . . 39FOSTER CIVIC COLLABORATION . . . . . . . . . . . . . . . . . . . . . . . . . . . . . . . . . . . . . . . . . . . . . . . 40
D ATA SOURCES . . . . . . . . . . . . . . . . . . . . . . . . . . . . . . . . . . . . . . . . . . . . . . . . . . . . . . . . . . . . . . . . . . 42
A P P E N D I X : Weighting Methodology . . . . . . . . . . . . . . . . . . . . . . . . . . . . . . . . . . . . . . . . . . . . . . 43
END NOTES . . . . . . . . . . . . . . . . . . . . . . . . . . . . . . . . . . . . . . . . . . . . . . . . . . . . . . . . . . . . . . . . . . . . . . 44
ABOUT THE AUTHORS. . . . . . . . . . . . . . . . . . . . . . . . . . . . . . . . . . . . . . . . . . . . . . . . . . . . . . . . . . . 45

2 S TAT E N E W E C O N O M Y I N D E X
“It is not the strongest of the species that survive, nor the most intelligent,
but the ones most responsive to change.”
— Charles Darwin

S TAT E N E W E C O N O M Y I N D E X 3
INTRODUCTION
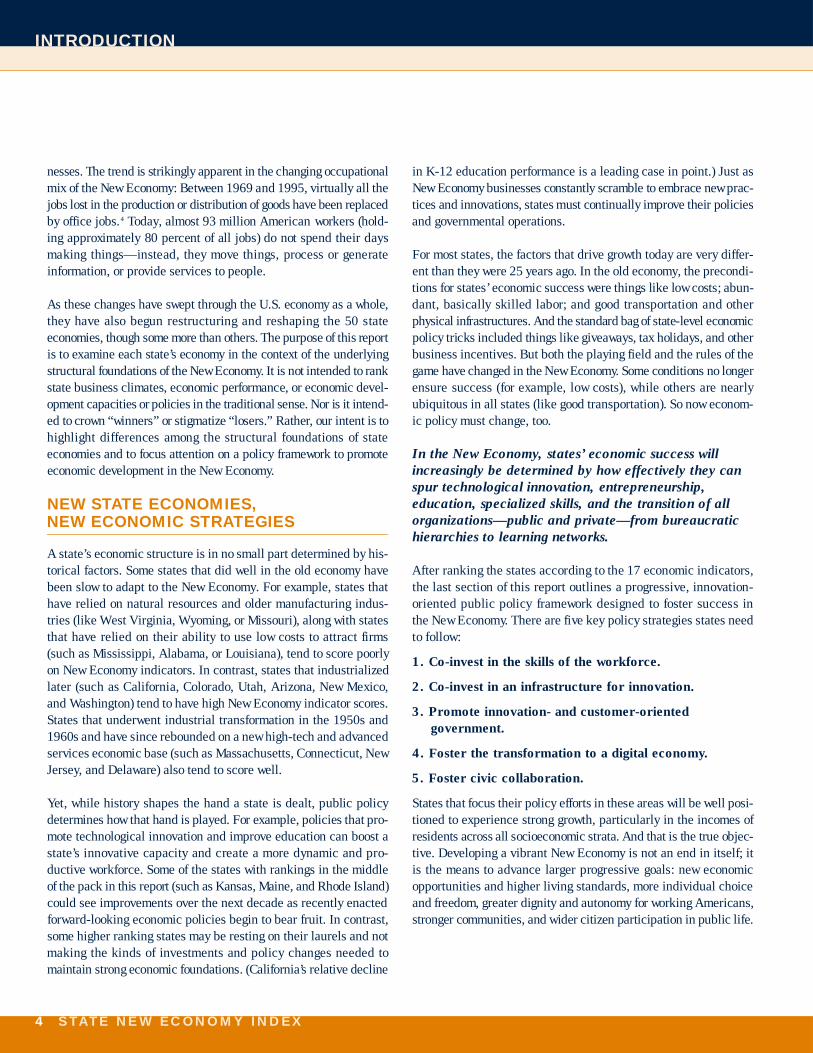
In the last 15 years, a “New Economy” has emerged in the UnitedStates. Among its defining characteristics are a fundamentally
a l t e red industrial and occupational ord e r, unprecedented levels ofe n t re p reneurial dynamism and competition, and a dramatic tre n dt o w a rd globalization—all of which have been spurred to one degre eor another by re v o l u t i o n a ry advances in information technologies(IT). As these developments have swept through our national econ-o m y, they have also been re s t ructuring and reshaping the 50 stateeconomies. States diff e r, however, in the degree to which theireconomies are stru c t u red and operate in accordance with the tenets ofthe New Economy. This re p o rt uses a set of 17 economic indicatorsto measure these diff e rences and assess states’ pro g ress as they adaptto the new economic ord e r. With these indicators as a frame of re f e rence, the re p o rt then outlines a state-level public policy frame-work aimed at promoting fast and widely shared economic gro w t h .
THE TRANSFORMATION TO THE NEW ECONOMY
The previous economic order lasted from approximately 1938 to1974. It was built on a manufacturing base that was geared towardstandardized production and run by stable, hierarchical organiza-tions that were preoccupied with incremental cost reductions andfocused primarily on a national marketplace. Those factors werethe bases for prosperity in most states.
As the foundations of that economic order broke down between themid-1970s and the early 1990s, state economies underwent a seriesof seismic shocks that shook many to their very foundations. Asindustries re s t ru c t u red, states had to react to rolling regional re c e s-sions based in large part on sectoral crises—autos and steel in theMidwest, textiles in the South, minicomputers and defense in NewEngland, farming in the Plains states, oil and gas in places likeTexas and Oklahoma, lumber and wood products in the PacificN o rthwest, and defense in California, to name a few. More o v e r,within states, some urban and rural areas were particularly hardhit with higher rates of unemployment and outward migration. Andduring this period all states faced a dramatic slowdown in produc-tivity and wage growth—from near 3 percent productivity growthnationwide in the 1950s and 1960s, to less than 1.25 percent thro u g hthe first half of the 1990s. But these crises were more than episod-ic or random. They re p resented a turbulent period of transition fro man old economic order to a new one.
To d a y, a New Economy is clearly emerging: it is a knowledge and idea-based economy where the keys to wealth and job creation are the extent to which ideas, innovation, and technology are embedded in all sectors of the economy.
Some of the most obvious signs of change in the New Economy arein fact among the root causes of it: re v o l u t i o n a ry technologicaladvances, including powerful personal computers, high-speedtelecommunications, and the Internet. But the New Economy isabout more than high technology and the Internet. Most firms, notjust those producing technology, are organizing work around it. TheNew Economy is a metal casting firm in Pittsburgh that uses com-p u t e r-aided manufacturing technology to cut costs, save energ y,and reduce waste. It is a farmer in South Dakota who sows geneti-cally altered seeds and drives a tractor with a global satellite posi-tioning system. It is an insurance company in Iowa that uses soft-ware to flatten managerial hierarchies and give its workers broad-er responsibilities and autonomy. It’s a textile firm in Georgia thatuses the Internet to take orders from customers around the world.
The New Economy is as much about new organizational models asit is about new technologies. It is the Miller Brewing Company’sb re w e ry in Trenton, Ohio, which produces 50 percent more beerper worker than the company’s next-most-productive facility, in partbecause a lean, 13-member crew has been trained to work in teamsto handle the overnight shift with no oversight.1
One of the most striking structural changes in the New Economy isthe degree to which dynamism, constant innovation, and speed havebecome the norm. Autos that took 6 years from concept to pro d u c t i o nin 1990 now take 2 years. The Minnesota Mining & ManufacturingC o m p a n y, which markets everything from pre s s u re-sensitive adhesivetapes and abrasives to medical devices, now receives 30 percent ofits revenues from products less than four years old. In the fre n e t i cI n t e rnet economy, people now talk about technological evolution in“ Web years” (which amounts to roughly one fiscal quarter) becausethe rules of the game seem to change that quickly. In this markete n v i ronment, a new generation of fast-growing firms has become thekey to economic growth. Nearly three quarters of all net new jobs arebeing created by 350,000 of these “gazelle” firms (firms that havei n c reased annual sales revenue by 20 percent for four straight years).
With entrepreneurial growth, however, comes risk. Almost a thirdof all jobs are in flux every year (meaning they have either recent-ly been added, or will soon be eliminated from the economy).2 This“ c h u rn” effect is being spurred by new technology, but also byi n c reasing competition—a trend that is, in turn, partly a product ofi n c reasing globalization. (Between 1960 and 1997, U.S. import sand exports grew one-and-a-half times faster than GDP.3)
Amid this constant economic churning, new jobs and industrieshave replaced older ones. States’ economic bases have evolvedbeyond traditional manufacturing to include high-tech manufac-turing, traded services, and increasingly globally oriented e-busi-
4 S TAT E N E W E C O N O M Y I N D E X
INTRODUCTION
nesses. The trend is strikingly apparent in the changing occupationalmix of the New Economy: Between 1969 and 1995, virtually all thejobs lost in the production or distribution of goods have been re p l a c e dby office jobs.4 Today, almost 93 million American workers (hold-ing approximately 80 percent of all jobs) do not spend their daysmaking things—instead, they move things, process or generateinformation, or provide services to people.
As these changes have swept through the U.S. economy as a whole,they have also begun re s t ructuring and reshaping the 50 stateeconomies, though some more than others. The purpose of this re p o rtis to examine each state’s economy in the context of the underlyings t ructural foundations of the New Economy. It is not intended to rankstate business climates, economic perf o rmance, or economic devel-opment capacities or policies in the traditional sense. Nor is it intend-ed to crown “winners” or stigmatize “losers.” Rather, our intent is tohighlight diff e rences among the structural foundations of stateeconomies and to focus attention on a policy framework to pro m o t eeconomic development in the New Economy.
NEW STATE ECONOMIES, NEW ECONOMIC STRATEGIES
A state’s economic structure is in no small part determined by his-torical factors. Some states that did well in the old economy havebeen slow to adapt to the New Economy. For example, states thathave relied on natural resources and older manufacturing indus-tries (like West Virginia, Wyoming, or Missouri), along with statesthat have relied on their ability to use low costs to attract firm s(such as Mississippi, Alabama, or Louisiana), tend to score poorlyon New Economy indicators. In contrast, states that industrializedlater (such as California, Colorado, Utah, Arizona, New Mexico,and Washington) tend to have high New Economy indicator score s .States that underwent industrial transformation in the 1950s and1960s and have since rebounded on a new high-tech and advanceds e rvices economic base (such as Massachusetts, Connecticut, NewJersey, and Delaware) also tend to score well.
Yet, while history shapes the hand a state is dealt, public policyd e t e rmines how that hand is played. For example, policies that pro-mote technological innovation and improve education can boost as t a t e ’s innovative capacity and create a more dynamic and pro-ductive workforce. Some of the states with rankings in the middleof the pack in this re p o rt (such as Kansas, Maine, and Rhode Island)could see improvements over the next decade as recently enactedforward-looking economic policies begin to bear fruit. In contrast,some higher ranking states may be resting on their laurels and notmaking the kinds of investments and policy changes needed tomaintain strong economic foundations. (Californ i a ’s relative decline
in K-12 education performance is a leading case in point.) Just asNew Economy businesses constantly scramble to embrace new prac-tices and innovations, states must continually improve their policiesand governmental operations.
For most states, the factors that drive growth today are very differ-ent than they were 25 years ago. In the old economy, the precondi-tions for states’ economic success were things like low costs; abun-dant, basically skilled labor; and good transportation and otherphysical infrastru c t u res. And the standard bag of state-level economicpolicy tricks included things like giveaways, tax holidays, and otherbusiness incentives. But both the playing field and the rules of thegame have changed in the New Economy. Some conditions no longere n s u re success (for example, low costs), while others are nearlyubiquitous in all states (like good transportation). So now econom-ic policy must change, too.
In the New Economy, states’ economic success will increasingly be determined by how effectively they canspur technological innovation, entrepreneurship, education, specialized skills, and the transition of allorganizations—public and private—from bureaucratichierarchies to learning networks.
After ranking the states according to the 17 economic indicators,the last section of this re p o rt outlines a pro g ressive, innovation-oriented public policy framework designed to foster success inthe New Economy. There are five key policy strategies states needto follow:
1. Co-invest in the skills of the workforce.
2. Co-invest in an infrastructure for innovation.
3. Promote innovation- and customer-oriented government.
4. Foster the transformation to a digital economy.
5. Foster civic collaboration.
States that focus their policy eff o rts in these areas will be well posi-tioned to experience strong growth, particularly in the incomes ofresidents across all socioeconomic strata. And that is the true objec-tive. Developing a vibrant New Economy is not an end in itself; itis the means to advance larger pro g ressive goals: new economicopportunities and higher living standards, more individual choiceand freedom, greater dignity and autonomy for working Americans,s t ronger communities, and wider citizen participation in public life.
S TAT E N E W E C O N O M Y I N D E X 5
INTRODUCTION
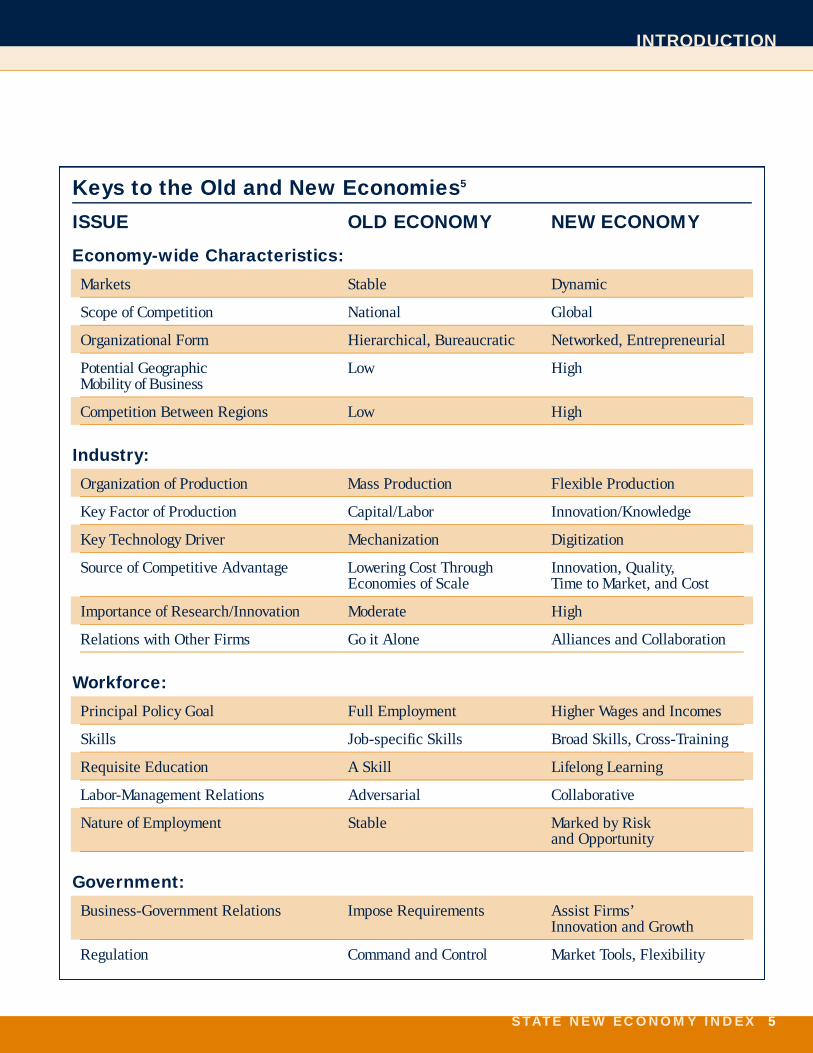
Keys to the Old and New Economies5
I S S U E OLD ECONOMY NEW ECONOMY
Economy-wide Characteristics:
Markets Stable Dynamic
Scope of Competition National Global
Organizational Form Hierarchical, Bureaucratic Networked, Entrepreneurial
Potential Geographic Low HighMobility of Business
Competition Between Regions Low High
I n d u s t ry :
Organization of Production Mass Production Flexible Production
Key Factor of Production Capital/Labor Innovation/Knowledge
Key Technology Driver Mechanization Digitization
Source of Competitive Advantage Lowering Cost Through Innovation, Quality,Economies of Scale Time to Market, and Cost
Importance of Research/Innovation Moderate High
Relations with Other Firms Go it Alone Alliances and Collaboration
Wo r k f o rc e :
Principal Policy Goal Full Employment Higher Wages and Incomes
Skills Job-specific Skills Broad Skills, Cross-Training
Requisite Education A Skill Lifelong Learning
Labor-Management Relations Adversarial Collaborative
Nature of Employment Stable Marked by Risk and Opportunity
G o v e rn m e n t :
Business-Government Relations Impose Requirements Assist Firms’Innovation and Growth
Regulation Command and Control Market Tools, Flexibility
6 S TAT E N E W E C O N O M Y I N D E X
Measuring the New Economy is not an easy task. The federal sta-tistical system, which was founded largely on the notion of astable economy with most of the output in agricultural and
manufactured goods, still tends to focus on monetary measures relat-ed to managing somewhat predictable business cycles. But the NewEconomy is neither stable nor predictable, and business cycles appearto have changed in the wake of the IT revolution.
We attempted to illustrate what is actually new about this so-calledNew Economy in The New Economy Index: UnderstandingAmerica’s Economic Transformation.6 In that report, we used indi-cators gathered from disparate public and private data sources to trackthe structural transformation of the U.S. economy along four main lines:the industrial and occupational mix, globalization, entre p re n e u r i a ldynamism and competition, and the IT revolution.
The State New Economy Index builds on this work, applying keymeasurers of the New Economy to the state economies. But measuringthe New Economy at the state level is even more difficult than it is atthe national level because many of the most useful data tend to benationally oriented. Given that regional clusters of innovation play a moreimportant role in the New Economy, this gap makes a detailed exami-nation of the New Economy all the more difficult.
Due to data limitations, there are a number of New Economy factors thatshould be included but are not. For example, while data are availableon high-tech industries, recent data are not available on the degree towhich a state’s industries are using advanced technologies.7 Similarly,while data measuring the educational attainment of a state’s workforc ea re available, there are no data measuring the degree to which a state’sindustries are training their workforce or reorganizing work to becomeh i g h - p e rf o rmance organizations. Data on exports are only available formanufacturing, not services. Similarly, accurate data are largely unavail-able to measure how advanced state telecommunications infrastru c-tures are, or the degree to which residents and businesses are using“broadband” telecommunications technologies.8
M o re o v e r, not all indicators in this re p o rt are perfect measures of NewEconomy characteristics. For example, the indicator of export orienta-tion of manufacturing favors states whose manufacturing sectors havebecome global—a basic New Economy trait—but states like Alaska,which export a large share of processed natural re s o u rces, also get highmarks based on old economy strengths. Likewise, the measure of off i c ejobs not only tracks New Economy occupations such as product design-ers, sales and marketing managers, and financial analysts, it also includesmany government jobs. However, despite these limitations, a number offactors can still be measured which, we believe, collectively paint arobust picture comparing state economies.
The 17 indicators in this report are divided into 5 categories that bestcapture what is new about the New Economy:
1) “Knowledge jobs.” Separate indicators measure jobs in offices;jobs held by managers, professionals, and technicians; and the edu-cational attainment of the workforce.
2) Globalization. Indicators measure the export orientation of man-ufacturing and foreign direct investment.
3) Economic dynamism and competition. Indicators measure thenumber of jobs in fast-growing “gazelle” companies (companieswith sales growth of 20 percent or more for four straight years); therate of economic “churn” (a product of new business start-ups andexisting business failures); and the value of initial public stockofferings (IPOs) by companies.
4 ) The transformation to a digital economy. Indicators meas-u re the percentage of adults online; the number of “.com” domainname registrations; technology in schools; and the degree to whichstate and local governments use information technologies to deliv-er serv i c e s .
5) Technological innovation capacity. Indicators measure the number of high-tech jobs; the number of scientists and engineers in the workforce; the number of patents issued; i n d u s t ry investment in re s e a rch and development; and venture cap-ital activity.
In all cases, the re p o rt relies on the most recently published data avail-able, but because of the delays in publishing federal statistics, the datamay in some cases be several years old. In addition, in all cases, dataa re re p o rted to control for the size of the state, using factors such as thenumber of workers or the gross state product as the denominator.
Scores in each indicator are calculated as follows: In order to measurethe magnitude of the diff e rences between the states instead of just theirrank from one to 50, raw scores are based on standard deviations fromthe mean. Therefore, on most indicators, approximately half the stateshave negative scores (below the national mean) and approximately halfhave positive scores. The scores are equally adjusted (six is added toevery score) to ensure that all are positive.
In three of the five indicator categories, and in the calculation of theoverall New Economy scores, the indicators are weighted so that close-ly correlated ones (for example, patents, R&D spending, and high-techworkers) don’t bias the results. (See Appendix A.)
The overall scores are calculated by adding the states’ adjusted score sin each of the five indicator categories and then dividing that total bythe sum of the highest score achieved by any state in each category.Thus, each state’s final score is a percentage of the total score a statewould have achieved if it had finished first in every category.
The maps were coded using the following methodology: The rangebetween the highest and lowest scores was calculated and divided byf o u r. That product was subtracted from the top score to calculate therange for the 100th to 76th percentile, and likewise for the other thre ep e rcentile ranges. In other words, the percentiles do not necessarilydivide into an equal number of states, but rather indicate which states’s c o res fall into a particular range.
INDICATORS OVERVIEW AND METHODOLOGY
S TAT E N E W E C O N O M Y I N D E X 7
INDICATORSTHE RANKINGS
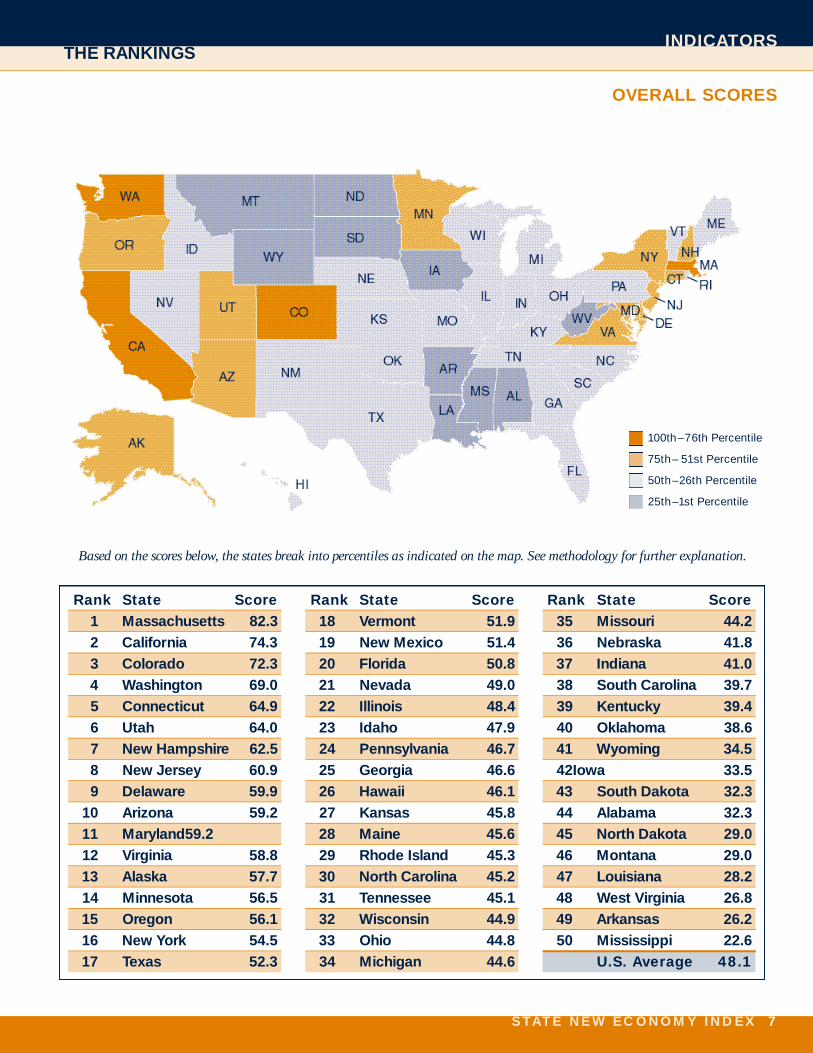
OVERALL SCORES
Rank State Score1 Massachusetts 82.32 California 74.33 Colorado 72.34 Washington 69.05 Connecticut 64.96 Utah 64.07 New Hampshire 62.58 New Jersey 60.99 Delaware 59.9
10 Arizona 59.211 Maryland 59.212 Virginia 58.813 Alaska 57.714 Minnesota 56.515 Oregon 56.116 New York 54.517 Texas 52.3
Rank State Score18 Vermont 51.919 New Mexico 51.420 Florida 50.821 Nevada 49.022 Illinois 48.423 Idaho 47.924 Pennsylvania 46.725 Georgia 46.626 Hawaii 46.127 Kansas 45.828 Maine 45.629 Rhode Island 45.330 North Carolina 45.231 Tennessee 45.132 Wisconsin 44.933 Ohio 44.834 Michigan 44.6
Rank State Score35 Missouri 44.236 Nebraska 41.837 Indiana 41.038 South Carolina 39.739 Kentucky 39.440 Oklahoma 38.641 Wyoming 34.542 Iowa 33.543 South Dakota 32.344 Alabama 32.345 North Dakota 29.046 Montana 29.047 Louisiana 28.248 West Virginia 26.849 Arkansas 26.250 Mississippi 22.6
U.S. Average 48.1
10 0 th–76th Perc e n t i l e
7 5 th– 51st Perc e n t i l e
5 0 th–26th Perc e n t i l e
2 5 th–1st Perc e n t i l e
Based on the scores below, the states break into percentiles as indicated on the map. See methodology for further explanation.

8 S TAT E N E W E C O N O M Y I N D E X
INDICATORS THE RANKINGS
R a n k S t a t e S c o re R a n k S c o re R a n k S c o re R a n k S c o re R a n k S c o re R a n k S c o re R a n k S c o re R a n k S c o re R a n k S c o re
1 M a s s a c h u s e t t s 8 2 . 2 7 2 2 6 . 4 % 1 3 4 . 9 % 6 6 9 . 1 5 2 2 . 7 % 4 5 . 4 % 9 1 5 . 5 % 1 8 2 . 6 % 2 1 0 . 2 6 %
2 C a l i f o rn i a 7 4 . 2 5 1 7 1 9 . 0 % 1 4 2 6 . 3 % 5 6 9 . 7 1 0 2 0 . 5 % 2 0 3 . 8 % 6 1 6 . 1 % 2 3 . 6 % 1 5 0 . 4 9 %
3 C o l o r a d o 7 2 . 3 2 1 5 1 9 . 1 % 4 2 7 . 9 % 1 7 5 . 9 1 7 1 8 . 2 % 2 5 3 . 5 % 2 8 1 3 . 6 % 3 3 . 5 % 4 1 . 0 5 %
4 Wa s h i n g t o n 6 8 . 9 9 3 2 1 6 . 8 % 6 2 7 . 7 % 4 7 0 . 8 2 3 1 . 2 % 3 1 3 . 2 % 4 0 1 2 . 6 % 1 2 2 . 8 % 1 3 0 . 5 4 %
5 C o n n e c t i c u t 6 4 . 8 9 4 2 4 . 3 % 2 3 0 . 3 % 8 6 8 . 8 3 2 4 . 2 % 7 5 . 1 % 3 7 1 2 . 9 % 3 8 1 . 9 % 2 1 . 2 2 %
6 U t a h 6 3 . 9 8 2 0 1 8 . 7 % 3 9 2 2 . 1 % 3 7 2 . 4 2 5 1 7 . 7 % 2 7 3 . 4 % 4 1 6 . 7 % 6 3 . 1 % 1 8 0 . 3 4 %
7 New Hampshire 6 2 . 4 5 2 9 1 7 . 6 % 1 0 2 6 . 9 % 9 6 6 . 5 7 2 1 . 2 % 9 5 . 1 % 5 1 6 . 2 % 2 2 2 . 5 % 3 5 0 . 1 1 %
8 New Jersey 6 0 . 8 6 6 2 1 . 7 % 1 5 2 5 . 7 % 1 7 6 2 . 3 2 6 1 7 . 3 % 5 5 . 3 % 3 6 1 3 . 1 % 4 3 . 4 % 1 0 0 . 6 4 %
9 D e l a w a re 5 9 . 8 7 1 2 6 . 7 % 5 2 7 . 8 % 2 7 5 9 . 4 1 4 1 9 . 9 % 1 4 4 . 3 % 3 9 1 2 . 6 % 2 0 2 . 5 % 4 7 0 . 0 0 %
1 0 A r i z o n a 5 9 . 2 3 2 6 1 8 . 5 % 2 4 2 4 . 5 % 1 2 6 6 . 2 9 2 0 . 8 % 3 9 2 . 7 % 3 1 7 . 7 % 5 3 . 3 % 2 3 0 . 2 5 %
1 1 M a r y l a n d 5 9 . 1 6 2 2 1 8 . 7 % 9 2 7 . 5 % 7 6 9 . 0 3 4 1 5 . 6 % 2 1 3 . 6 % 4 3 1 2 . 4 % 9 3 . 0 % 1 7 0 . 3 9 %
1 2 Vi rg i n i a 5 8 . 7 6 2 1 1 8 . 7 % 3 2 9 . 6 % 1 3 6 5 . 3 4 6 1 4 . 0 % 1 2 4 . 4 % 3 1 1 3 . 5 % 2 1 2 . 5 % 6 1 . 0 2 %
1 3 A l a s k a 5 7 . 7 0 4 8 1 2 . 6 % 2 0 2 5 . 3 % 2 7 3 . 3 1 4 9 . 3 % 2 4 3 . 5 % 4 9 1 1 . 3 % 4 2 1 . 8 % 3 6 0 . 1 1 %
1 4 M i n n e s o t a 5 6 . 5 3 7 2 1 . 5 % 7 2 7 . 7 % 1 4 6 3 . 6 2 0 1 8 . 0 % 2 2 3 . 6 % 3 5 1 3 . 2 % 4 5 1 . 7 % 2 2 0 . 2 5 %
1 5 O re g o n 5 6 . 1 0 3 1 1 7 . 1 % 3 7 2 2 . 3 % 1 1 6 6 . 3 8 2 0 . 9 % 3 5 3 . 0 % 2 1 7 . 8 % 2 6 2 . 3 % 2 4 0 . 2 2 %
1 6 New Yo r k 5 4 . 4 8 3 2 6 . 4 % 2 5 2 4 . 3 % 1 9 6 1 . 8 1 9 1 8 . 0 % 1 3 4 . 3 % 4 1 1 2 . 5 % 7 3 . 0 % 1 2 0 . 5 9 %
1 7 Te x a s 5 2 . 3 1 2 5 1 8 . 6 % 4 7 1 9 . 5 % 2 4 6 0 . 2 4 2 3 . 9 % 2 6 3 . 5 % 1 5 1 4 . 6 % 1 3 2 . 8 % 1 1 0 . 6 3 %
1 8 Ve r m o n t 5 1 . 8 7 4 4 1 4 . 3 % 3 2 2 3 . 5 % 1 5 6 2 . 8 1 6 1 8 . 5 % 3 2 3 . 2 % 3 0 1 3 . 6 % 4 7 1 . 5 % 7 0 . 9 5 %
1 9 New Mexico 5 1 . 4 3 3 8 1 5 . 3 % 1 3 2 6 . 4 % 2 1 6 0 . 7 4 2 1 4 . 5 % 4 4 2 . 1 % 2 4 1 3 . 9 % 2 3 2 . 5 % 1 1 . 5 5 %
2 0 F l o r i d a 5 0 . 7 5 8 2 1 . 2 % 1 6 2 5 . 6 % 3 0 5 6 . 6 5 0 7 . 9 % 2 9 3 . 2 % 7 1 5 . 8 % 1 6 2 . 8 % 1 4 0 . 5 1 %
2 1 N e v a d a 4 9 . 0 3 1 1 2 0 . 5 % 5 0 1 7 . 8 % 2 8 5 7 . 6 3 8 1 5 . 2 % 3 3 3 . 1 % 1 1 9 . 3 % 1 4 . 1 % 4 0 0 . 0 7 %
2 2 I l l i n o i s 4 8 . 3 7 5 2 2 . 9 % 8 2 7 . 7 % 2 2 6 0 . 6 1 5 1 8 . 6 % 1 9 4 . 0 % 1 7 1 4 . 4 % 2 4 2 . 4 % 1 6 0 . 3 9 %
2 3 I d a h o 4 7 . 9 3 4 7 1 3 . 3 % 4 6 1 9 . 9 % 2 0 6 0 . 9 6 2 2 . 0 % 4 6 2 . 0 % 1 1 1 5 . 4 % 1 1 2 . 9 % 3 4 0 . 1 4 %
2 4 P e n n s y l v a n i a 4 6 . 7 2 1 0 2 0 . 8 % 1 2 2 6 . 4 % 4 3 4 8 . 3 2 4 1 7 . 7 % 1 6 4 . 2 % 3 4 1 3 . 4 % 1 9 2 . 5 % 2 7 0 . 1 9 %
2 5 G e o rg i a 4 6 . 6 1 1 8 1 8 . 8 % 2 1 2 5 . 1 % 3 5 5 4 . 2 4 0 1 4 . 8 % 6 5 . 2 % 1 3 1 4 . 8 % 8 3 . 0 % 1 9 0 . 3 1 %
2 6 H a w a i i 4 6 . 1 4 1 6 1 9 . 1 % 4 0 2 2 . 0 % 1 0 6 6 . 3 4 5 1 4 . 0 % 1 8 . 8 % 5 0 9 . 2 % 1 0 2 . 9 % 4 6 0 . 0 2 %
2 7 K a n s a s 4 5 . 8 0 3 3 1 6 . 7 % 1 1 2 6 . 4 % 1 6 6 2 . 5 3 3 1 5 . 7 % 3 0 3 . 2 % 1 2 1 5 . 0 % 2 5 2 . 4 % 4 1 0 . 0 6 %
2 8 M a i n e 4 5 . 6 2 3 9 1 5 . 2 % 2 8 2 3 . 7 % 3 4 5 4 . 3 1 8 1 8 . 1 % 1 0 4 . 8 % 2 2 1 4 . 0 % 3 3 2 . 1 % 5 1 . 0 4 %
2 9 Rhode Island 4 5 . 3 1 9 2 1 . 2 % 1 9 2 5 . 3 % 2 9 5 7 . 2 2 1 1 8 . 0 % 1 8 4 . 1 % 2 5 1 3 . 8 % 4 0 1 . 9 % 4 7 0 . 0 0 %
3 0 North Caro l i n a 4 5 . 1 6 3 0 1 7 . 2 % 2 2 2 4 . 9 % 3 9 5 2 . 4 3 7 1 5 . 2 % 3 6 . 2 % 2 3 1 3 . 9 % 2 7 2 . 3 % 2 9 0 . 1 8 %
3 1 Te n n e s s e e 4 5 . 1 4 1 9 1 8 . 8 % 2 7 2 3 . 8 % 4 5 4 7 . 7 3 2 1 5 . 7 % 8 5 . 1 % 1 4 1 4 . 8 % 1 7 2 . 7 % 3 9 0 . 0 7 %
3 2 W i s c o n s i n 4 4 . 9 2 2 3 1 8 . 6 % 3 0 2 3 . 6 % 3 6 5 3 . 2 2 7 1 7 . 3 % 4 0 2 . 5 % 1 0 1 5 . 4 % 3 5 2 . 1 % 2 6 0 . 1 9 %
3 3 O h i o 4 4 . 7 7 1 4 2 0 . 0 % 2 3 2 4 . 6 % 4 0 5 0 . 8 1 3 2 0 . 0 % 1 7 4 . 2 % 2 9 1 3 . 6 % 2 8 2 . 3 % 2 0 0 . 3 1 %
3 4 M i c h i g a n 4 4 . 5 9 2 4 1 8 . 6 % 4 5 2 0 . 5 % 3 1 5 6 . 3 1 1 2 0 . 4 % 2 8 3 . 4 % 4 2 1 2 . 4 % 3 1 2 . 2 % 3 8 0 . 0 8 %
3 5 M i s s o u r i 4 4 . 2 4 1 2 2 0 . 2 % 3 1 2 3 . 5 % 3 8 5 2 . 7 3 6 1 5 . 3 % 3 6 3 . 0 % 8 1 5 . 5 % 3 6 2 . 0 % 3 2 0 . 1 5 %
3 6 N e b r a s k a 4 1 . 8 1 1 3 2 0 . 1 % 1 8 2 5 . 4 % 2 6 5 9 . 7 4 7 1 3 . 7 % 4 5 2 . 0 % 1 8 1 4 . 4 % 4 3 1 . 8 % 2 5 0 . 2 1 %
3 7 I n d i a n a 4 0 . 9 5 3 4 1 6 . 7 % 3 6 2 2 . 3 % 4 2 4 8 . 5 2 3 1 7 . 8 % 1 5 4 . 2 % 2 6 1 3 . 8 % 3 2 2 . 2 % 3 0 0 . 1 7 %
3 8 South Caro l i n a 3 9 . 6 9 3 7 1 5 . 8 % 2 9 2 3 . 6 % 4 1 4 9 . 7 2 2 1 8 . 0 % 2 6 . 7 % 4 4 1 2 . 3 % 3 4 2 . 1 % 3 7 0 . 1 0 %
3 9 K e n t u c k y 3 9 . 4 0 4 0 1 5 . 2 % 3 4 2 3 . 1 % 4 9 4 2 . 5 2 9 1 6 . 6 % 1 1 4 . 8 % 1 9 1 4 . 4 % 3 0 2 . 3 % 9 0 . 6 8 %
4 0 O k l a h o m a 3 8 . 6 3 3 5 1 6 . 4 % 2 6 2 4 . 2 % 3 2 5 6 . 0 3 1 1 6 . 0 % 4 3 2 . 3 % 2 7 1 3 . 7 % 1 5 2 . 8 % 3 1 . 0 6 %
4 1 W y o m i n g 3 4 . 4 9 5 0 1 0 . 7 % 4 1 2 1 . 8 % 1 8 6 2 . 2 4 3 1 4 . 3 % 4 1 2 . 5 % 4 7 1 1 . 9 % 3 9 1 . 9 % 4 2 0 . 0 5 %
4 2 I o w a 3 3 . 5 1 2 8 1 7 . 7 % 3 8 2 2 . 1 % 3 7 5 2 . 7 3 9 1 4 . 9 % 4 2 2 . 4 % 4 6 1 2 . 1 % 4 9 1 . 4 % 3 1 0 . 1 6 %
4 3 South Dakota 3 2 . 3 3 4 1 1 5 . 0 % 4 8 1 9 . 5 % 3 3 5 4 . 5 3 0 1 6 . 5 % 4 9 1 . 4 % 3 3 1 3 . 4 % 4 6 1 . 7 % 4 7 0 . 0 0 %
4 4 A l a b a m a 3 2 . 2 8 3 6 1 6 . 2 % 3 5 2 2 . 6 % 4 4 4 8 . 0 3 5 1 5 . 6 % 3 4 3 . 1 % 2 0 1 4 . 3 % 2 9 2 . 3 % 4 4 0 . 0 4 %
4 5 North Dakota 2 8 . 9 9 4 5 1 4 . 2 % 4 9 1 8 . 1 % 2 5 5 9 . 8 4 9 1 2 . 2 % 4 8 1 . 4 % 4 5 1 2 . 3 % 5 0 1 . 3 % 8 0 . 7 8 %
4 6 M o n t a n a 2 8 . 9 8 4 9 1 1 . 7 % 4 2 2 1 . 6 % 2 3 6 0 . 3 4 4 1 4 . 1 % 5 0 1 . 0 % 3 8 1 2 . 7 % 4 8 1 . 5 % 4 7 0 . 0 0 %
4 7 L o u i s i a n a 2 8 . 2 2 2 7 1 8 . 2 % 1 7 2 5 . 5 % 4 6 4 7 . 5 2 8 1 7 . 0 % 3 8 2 . 9 % 3 2 1 3 . 5 % 4 1 1 . 8 % 2 8 0 . 1 8 %
4 8 West Vi rg i n i a 2 6 . 7 9 4 3 1 4 . 6 % 3 3 2 3 . 1 % 5 0 3 7 . 9 1 2 2 0 . 2 % 2 3 3 . 5 % 4 8 1 1 . 6 % 3 7 2 . 0 % 4 3 0 . 0 4 %
4 9 A r k a n s a s 2 6 . 2 2 4 2 1 5 . 0 % 4 3 2 0 . 9 % 4 8 4 2 . 7 4 1 1 4 . 7 % 3 7 3 . 0 % 1 6 1 4 . 6 % 1 4 2 . 8 % 4 5 0 . 0 4 %
5 0 M i s s i s s i p p i 2 2 . 6 3 4 6 1 3 . 8 % 4 4 2 0 . 9 % 4 7 4 6 . 9 4 8 1 2 . 9 % 4 7 1 . 8 % 2 1 1 4 . 2 % 4 4 1 . 7 % 3 3 0 . 1 5 %
U.S. Av e r a g e 4 8 . 0 7 1 9 . 6 % 2 4 . 9 % 5 8 . 5 1 8 . 1 % 3 . 9 % 1 4 . 3 % 2 . 7 % 0.42%
STATE NEW ECONOMY SCORES BY OVERALL RANK
Overall Office Jobs
Managerial/Professional
JobsWorkforceEducation
Export Focusof
M a n u f a c t u r i n g
ForeignDirect
Investment“Gazelle”
Jobs Job Churning IPOs
S TAT E N E W E C O N O M Y I N D E X 9
INDICATORSTHE RANKINGS
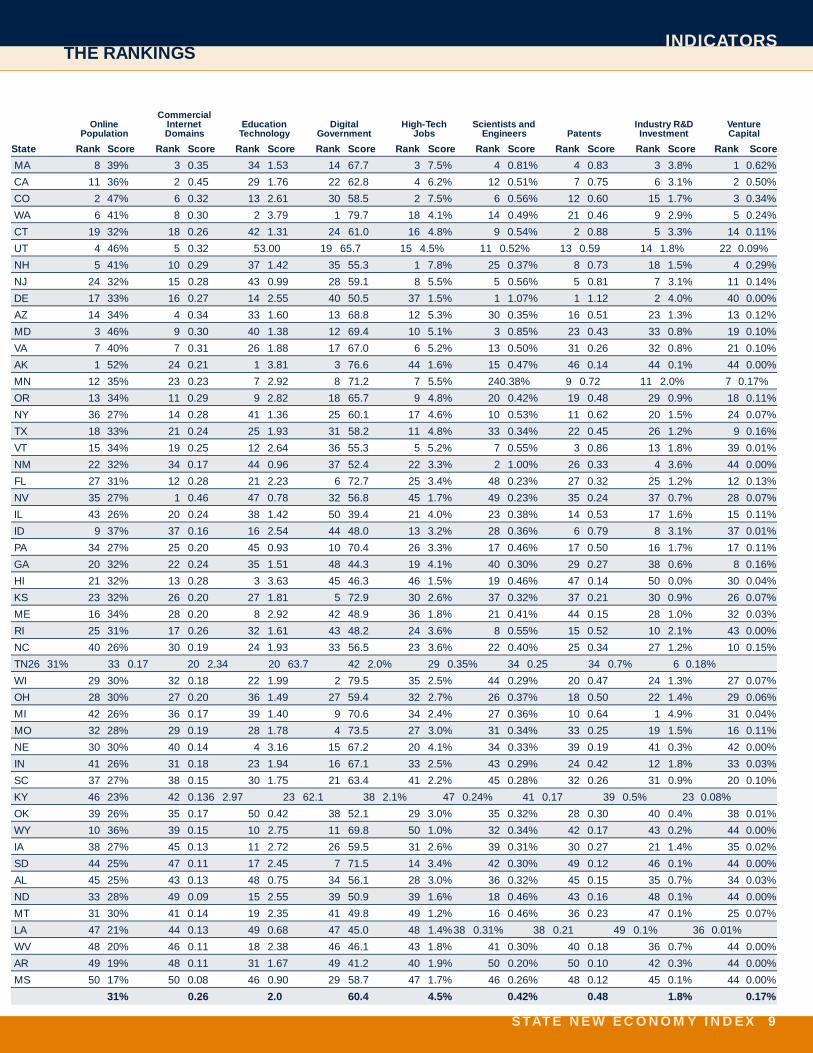
State Rank Score Rank Score Rank Score Rank Score Rank Score Rank Score Rank Score Rank Score Rank Score
MA 8 39% 3 0.35 34 1.53 14 67.7 3 7.5% 4 0.81% 4 0.83 3 3.8% 1 0.62%
CA 11 36% 2 0.45 29 1.76 22 62.8 4 6.2% 12 0.51% 7 0.75 6 3.1% 2 0.50%
CO 2 47% 6 0.32 13 2.61 30 58.5 2 7.5% 6 0.56% 12 0.60 15 1.7% 3 0.34%
WA 6 41% 8 0.30 2 3.79 1 79.7 18 4.1% 14 0.49% 21 0.46 9 2.9% 5 0.24%
CT 19 32% 18 0.26 42 1.31 24 61.0 16 4.8% 9 0.54% 2 0.88 5 3.3% 14 0.11%
UT 4 46% 5 0.32 5 3.00 19 65.7 15 4.5% 11 0.52% 13 0.59 14 1.8% 22 0.09%
NH 5 41% 10 0.29 37 1.42 35 55.3 1 7.8% 25 0.37% 8 0.73 18 1.5% 4 0.29%
NJ 24 32% 15 0.28 43 0.99 28 59.1 8 5.5% 5 0.56% 5 0.81 7 3.1% 11 0.14%
DE 17 33% 16 0.27 14 2.55 40 50.5 37 1.5% 1 1.07% 1 1.12 2 4.0% 40 0.00%
AZ 14 34% 4 0.34 33 1.60 13 68.8 12 5.3% 30 0.35% 16 0.51 23 1.3% 13 0.12%
MD 3 46% 9 0.30 40 1.38 12 69.4 10 5.1% 3 0.85% 23 0.43 33 0.8% 19 0.10%
VA 7 40% 7 0.31 26 1.88 17 67.0 6 5.2% 13 0.50% 31 0.26 32 0.8% 21 0.10%
AK 1 52% 24 0.21 1 3.81 3 76.6 44 1.6% 15 0.47% 46 0.14 44 0.1% 44 0.00%
MN 12 35% 23 0.23 7 2.92 8 71.2 7 5.5% 24 0.38% 9 0.72 11 2.0% 7 0.17%
OR 13 34% 11 0.29 9 2.82 18 65.7 9 4.8% 20 0.42% 19 0.48 29 0.9% 18 0.11%
NY 36 27% 14 0.28 41 1.36 25 60.1 17 4.6% 10 0.53% 11 0.62 20 1.5% 24 0.07%
TX 18 33% 21 0.24 25 1.93 31 58.2 11 4.8% 33 0.34% 22 0.45 26 1.2% 9 0.16%
VT 15 34% 19 0.25 12 2.64 36 55.3 5 5.2% 7 0.55% 3 0.86 13 1.8% 39 0.01%
NM 22 32% 34 0.17 44 0.96 37 52.4 22 3.3% 2 1.00% 26 0.33 4 3.6% 44 0.00%
FL 27 31% 12 0.28 21 2.23 6 72.7 25 3.4% 48 0.23% 27 0.32 25 1.2% 12 0.13%
NV 35 27% 1 0.46 47 0.78 32 56.8 45 1.7% 49 0.23% 35 0.24 37 0.7% 28 0.07%
IL 43 26% 20 0.24 38 1.42 50 39.4 21 4.0% 23 0.38% 14 0.53 17 1.6% 15 0.11%
ID 9 37% 37 0.16 16 2.54 44 48.0 13 3.2% 28 0.36% 6 0.79 8 3.1% 37 0.01%
PA 34 27% 25 0.20 45 0.93 10 70.4 26 3.3% 17 0.46% 17 0.50 16 1.7% 17 0.11%
GA 20 32% 22 0.24 35 1.51 48 44.3 19 4.1% 40 0.30% 29 0.27 38 0.6% 8 0.16%
HI 21 32% 13 0.28 3 3.63 45 46.3 46 1.5% 19 0.46% 47 0.14 50 0.0% 30 0.04%
KS 23 32% 26 0.20 27 1.81 5 72.9 30 2.6% 37 0.32% 37 0.21 30 0.9% 26 0.07%
ME 16 34% 28 0.20 8 2.92 42 48.9 36 1.8% 21 0.41% 44 0.15 28 1.0% 32 0.03%
RI 25 31% 17 0.26 32 1.61 43 48.2 24 3.6% 8 0.55% 15 0.52 10 2.1% 43 0.00%
NC 40 26% 30 0.19 24 1.93 33 56.5 23 3.6% 22 0.40% 25 0.34 27 1.2% 10 0.15%
TN 26 31% 33 0.17 20 2.34 20 63.7 42 2.0% 29 0.35% 34 0.25 34 0.7% 6 0.18%
WI 29 30% 32 0.18 22 1.99 2 79.5 35 2.5% 44 0.29% 20 0.47 24 1.3% 27 0.07%
OH 28 30% 27 0.20 36 1.49 27 59.4 32 2.7% 26 0.37% 18 0.50 22 1.4% 29 0.06%
MI 42 26% 36 0.17 39 1.40 9 70.6 34 2.4% 27 0.36% 10 0.64 1 4.9% 31 0.04%
MO 32 28% 29 0.19 28 1.78 4 73.5 27 3.0% 31 0.34% 33 0.25 19 1.5% 16 0.11%
NE 30 30% 40 0.14 4 3.16 15 67.2 20 4.1% 34 0.33% 39 0.19 41 0.3% 42 0.00%
IN 41 26% 31 0.18 23 1.94 16 67.1 33 2.5% 43 0.29% 24 0.42 12 1.8% 33 0.03%
SC 37 27% 38 0.15 30 1.75 21 63.4 41 2.2% 45 0.28% 32 0.26 31 0.9% 20 0.10%
KY 46 23% 42 0.13 6 2.97 23 62.1 38 2.1% 47 0.24% 41 0.17 39 0.5% 23 0.08%
OK 39 26% 35 0.17 50 0.42 38 52.1 29 3.0% 35 0.32% 28 0.30 40 0.4% 38 0.01%
WY 10 36% 39 0.15 10 2.75 11 69.8 50 1.0% 32 0.34% 42 0.17 43 0.2% 44 0.00%
IA 38 27% 45 0.13 11 2.72 26 59.5 31 2.6% 39 0.31% 30 0.27 21 1.4% 35 0.02%
SD 44 25% 47 0.11 17 2.45 7 71.5 14 3.4% 42 0.30% 49 0.12 46 0.1% 44 0.00%
AL 45 25% 43 0.13 48 0.75 34 56.1 28 3.0% 36 0.32% 45 0.15 35 0.7% 34 0.03%
ND 33 28% 49 0.09 15 2.55 39 50.9 39 1.6% 18 0.46% 43 0.16 48 0.1% 44 0.00%
MT 31 30% 41 0.14 19 2.35 41 49.8 49 1.2% 16 0.46% 36 0.23 47 0.1% 25 0.07%
LA 47 21% 44 0.13 49 0.68 47 45.0 48 1.4% 38 0.31% 38 0.21 49 0.1% 36 0.01%
WV 48 20% 46 0.11 18 2.38 46 46.1 43 1.8% 41 0.30% 40 0.18 36 0.7% 44 0.00%
AR 49 19% 48 0.11 31 1.67 49 41.2 40 1.9% 50 0.20% 50 0.10 42 0.3% 44 0.00%
MS 50 17% 50 0.08 46 0.90 29 58.7 47 1.7% 46 0.26% 48 0.12 45 0.1% 44 0.00%
31% 0.26 2.0 60.4 4.5% 0.42% 0.48 1.8% 0.17%
OnlinePopulation
CommercialInternetDomains
EducationTechnology
DigitalGovernment
High-TechJobs
Scientists andEngineers Patents
Industry R&DInvestment
VentureCapital

1 0 S TAT E N E W E C O N O M Y I N D E X
INDICATORSTHE RANKINGS
State Rank Score Rank Score Rank Score Rank Score Rank Score Rank Score Rank Score Rank Score Rank Score
Alabama 44 32.28 36 16.2% 35 22.6% 44 48.0 35 15.6% 34 3.1% 20 14.3% 29 2.3% 44 0.04%
Alaska 13 57.70 48 12.6% 20 25.3% 2 73.3 1 49.3% 24 3.5% 49 11.3% 42 1.8% 36 0.11%
Arizona 10 59.23 26 18.5% 24 24.5% 12 66.2 9 20.8% 39 2.7% 3 17.7% 5 3.3% 23 0.25%
Arkansas 49 26.22 42 15.0% 43 20.9% 48 42.7 41 14.7% 37 3.0% 16 14.6% 14 2.8% 45 0.04%
California 2 74.25 17 19.0% 14 26.3% 5 69.7 10 20.5% 20 3.8% 6 16.1% 2 3.6% 15 0.49%
Colorado 3 72.32 15 19.1% 4 27.9% 1 75.9 17 18.2% 25 3.5% 28 13.6% 3 3.5% 4 1.05%
Connecticut 5 64.89 4 24.3% 2 30.3% 8 68.8 3 24.2% 7 5.1% 37 12.9% 38 1.9% 2 1.22%
Delaware 9 59.87 1 26.7% 5 27.8% 27 59.4 14 19.9% 14 4.3% 39 12.6% 20 2.5% 47 0.00%
Florida 20 50.75 8 21.2% 16 25.6% 30 56.6 50 7.9% 29 3.2% 7 15.8% 16 2.8% 14 0.51%
Georgia 25 46.61 18 18.8% 21 25.1% 35 54.2 40 14.8% 6 5.2% 13 14.8% 8 3.0% 19 0.31%
Hawaii 26 46.14 16 19.1% 40 22.0% 10 66.3 45 14.0% 1 8.8% 50 9.2% 10 2.9% 46 0.02%
Idaho 23 47.93 47 13.3% 46 19.9% 20 60.9 6 22.0% 46 2.0% 11 15.4% 11 2.9% 34 0.14%
Illinois 22 48.37 5 22.9% 8 27.7% 22 60.6 15 18.6% 19 4.0% 17 14.4% 24 2.4% 16 0.39%
Indiana 37 40.95 34 16.7% 36 22.3% 42 48.5 23 17.8% 15 4.2% 26 13.8% 32 2.2% 30 0.17%
Iowa 42 33.51 28 17.7% 38 22.1% 37 52.7 39 14.9% 42 2.4% 46 12.1% 49 1.4% 31 0.16%
Kansas 27 45.80 33 16.7% 11 26.4% 16 62.5 33 15.7% 30 3.2% 12 15.0% 25 2.4% 41 0.06%
Kentucky 39 39.40 40 15.2% 34 23.1% 49 42.5 29 16.6% 11 4.8% 19 14.4% 30 2.3% 9 0.68%
Louisiana 47 28.22 27 18.2% 17 25.5% 46 47.5 28 17.0% 38 2.9% 32 13.5% 41 1.8% 28 0.18%
Maine 28 45.62 39 15.2% 28 23.7% 34 54.3 18 18.1% 10 4.8% 22 14.0% 33 2.1% 5 1.04%
Maryland 11 59.16 22 18.7% 9 27.5% 7 69.0 34 15.6% 21 3.6% 43 12.4% 9 3.0% 17 0.39%
M a s s a c h u s e t t s 1 82.27 2 26.4% 1 34.9% 6 69.1 5 22.7% 4 5.4% 9 15.5% 18 2.6% 21 0.26%
Michigan 34 44.59 24 18.6% 45 20.5% 31 56.3 11 20.4% 28 3.4% 42 12.4% 31 2.2% 38 0.08%
Minnesota 14 56.53 7 21.5% 7 27.7% 14 63.6 20 18.0% 22 3.6% 35 13.2% 45 1.7% 22 0.25%
Mississippi 50 22.63 46 13.8% 44 20.9% 47 46.9 48 12.9% 47 1.8% 21 14.2% 44 1.7% 33 0.15%
Missouri 35 44.24 12 20.2% 31 23.5% 38 52.7 36 15.3% 36 3.0% 8 15.5% 36 2.0% 32 0.15%
Montana 46 28.98 49 11.7% 42 21.6% 23 60.3 44 14.1% 50 1.0% 38 12.7% 48 1.5% 47 0.00%
Nebraska 36 41.81 13 20.1% 18 25.4% 26 59.7 47 13.7% 45 2.0% 18 14.4% 43 1.8% 25 0.21%
Nevada 21 49.03 11 20.5% 50 17.8% 28 57.6 38 15.2% 33 3.1% 1 19.3% 1 4.1% 40 0.07%
New Hampshire 7 62.45 29 17.6% 10 26.9% 9 66.5 7 21.2% 9 5.1% 5 16.2% 22 2.5% 35 0.11%
New Jersey 8 60.86 6 21.7% 15 25.7% 17 62.3 26 17.3% 5 5.3% 36 13.1% 4 3.4% 10 0.64%
New Mexico 19 51.43 38 15.3% 13 26.4% 21 60.7 42 14.5% 44 2.1% 24 13.9% 23 2.5% 1 1.55%
New York 16 54.48 3 26.4% 25 24.3% 19 61.8 19 18.0% 13 4.3% 41 12.5% 7 3.0% 12 0.59%
North Caro l i n a 30 45.16 30 17.2% 22 24.9% 39 52.4 37 15.2% 3 6.2% 23 13.9% 27 2.3% 29 0.18%
North Dakota 45 28.99 45 14.2% 49 18.1% 25 59.8 49 12.2% 48 1.4% 45 12.3% 50 1.3% 8 0.78%
Ohio 33 44.77 14 20.0% 23 24.6% 40 50.8 13 20.0% 17 4.2% 29 13.6% 28 2.3% 20 0.31%
Oklahoma 40 38.63 35 16.4% 26 24.2% 32 56.0 31 16.0% 43 2.3% 27 13.7% 15 2.8% 3 1.06%
Oregon 15 56.10 31 17.1% 37 22.3% 11 66.3 8 20.9% 35 3.0% 2 17.8% 26 2.3% 24 0.22%
Pennsylvania 24 46.72 10 20.8% 12 26.4% 43 48.3 24 17.7% 16 4.2% 34 13.4% 19 2.5% 27 0.19%
Rhode Island 29 45.31 9 21.2% 19 25.3% 29 57.2 21 18.0% 18 4.1% 25 13.8% 40 1.9% 47 0.00%
South Carolina 38 39.69 37 15.8% 29 23.6% 41 49.7 22 18.0% 2 6.7% 44 12.3% 34 2.1% 37 0.10%
South Dakota 43 32.33 41 15.0% 48 19.5% 33 54.5 30 16.5% 49 1.4% 33 13.4% 46 1.7% 47 0.00%
Tennessee 31 45.14 19 18.8% 27 23.8% 45 47.7 32 15.7% 8 5.1% 14 14.8% 17 2.7% 39 0.07%
Texas 17 52.31 25 18.6% 47 19.5% 24 60.2 4 23.9% 26 3.5% 15 14.6% 13 2.8% 11 0.63%
Utah 6 63.98 20 18.7% 39 22.1% 3 72.4 25 17.7% 27 3.4% 4 16.7% 6 3.1% 18 0.34%
Vermont 18 51.87 44 14.3% 32 23.5% 15 62.8 16 18.5% 32 3.2% 30 13.6% 47 1.5% 7 0.95%
Virginia 12 58.76 21 18.7% 3 29.6% 13 65.3 46 14.0% 12 4.4% 31 13.5% 21 2.5% 6 1.02%
Washington 4 68.99 32 16.8% 6 27.7% 4 70.8 2 31.2% 31 3.2% 40 12.6% 12 2.8% 13 0.54%
West Virginia 48 26.79 43 14.6% 33 23.1% 50 37.9 12 20.2% 23 3.5% 48 11.6% 37 2.0% 43 0.04%
Wisconsin 32 44.92 23 18.6% 30 23.6% 36 53.2 27 17.3% 40 2.5% 10 15.4% 35 2.1% 26 0.19%
Wyoming 41 34.49 50 10.7% 41 21.8% 18 62.2 43 14.3% 41 2.5% 47 11.9% 39 1.9% 42 0.05%
U.S. Average 48.07 19.6% 24.9% 58.5 18.1% 3.9% 14.3% 2.7% 0.42%
STATE NEW ECONOMY SCORES IN ALPHABETICAL ORDER
Overall Office Jobs
Managerial/Professional
JobsWorkforceEducation
Export Focusof
M a n u f a c t u r i n gForeign Direct
Investment“Gazelle”
Jobs Job Churning IPOs
S TAT E N E W E C O N O M Y I N D E X 1 1
INDICATORSTHE RANKINGS
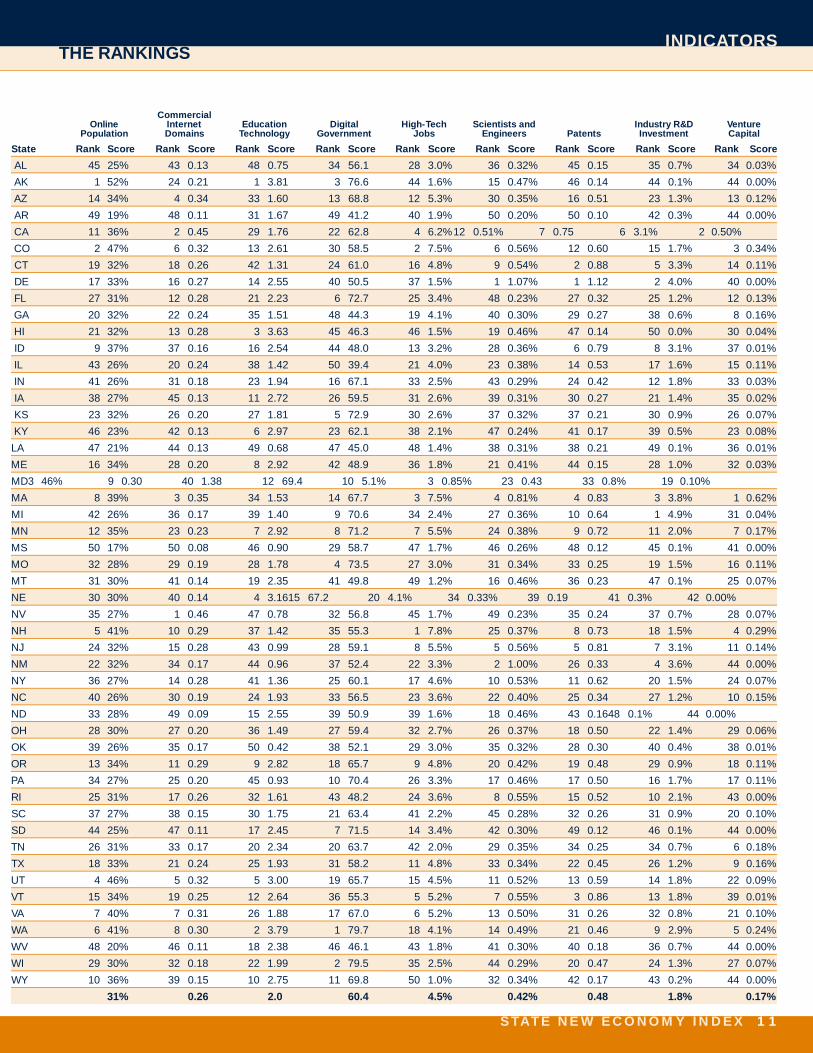
State Rank Score Rank Score Rank Score Rank Score Rank Score Rank Score Rank Score Rank Score Rank Score
AL 45 25% 43 0.13 48 0.75 34 56.1 28 3.0% 36 0.32% 45 0.15 35 0.7% 34 0.03%
AK 1 52% 24 0.21 1 3.81 3 76.6 44 1.6% 15 0.47% 46 0.14 44 0.1% 44 0.00%
AZ 14 34% 4 0.34 33 1.60 13 68.8 12 5.3% 30 0.35% 16 0.51 23 1.3% 13 0.12%
AR 49 19% 48 0.11 31 1.67 49 41.2 40 1.9% 50 0.20% 50 0.10 42 0.3% 44 0.00%
CA 11 36% 2 0.45 29 1.76 22 62.8 4 6.2% 12 0.51% 7 0.75 6 3.1% 2 0.50%
CO 2 47% 6 0.32 13 2.61 30 58.5 2 7.5% 6 0.56% 12 0.60 15 1.7% 3 0.34%
CT 19 32% 18 0.26 42 1.31 24 61.0 16 4.8% 9 0.54% 2 0.88 5 3.3% 14 0.11%
DE 17 33% 16 0.27 14 2.55 40 50.5 37 1.5% 1 1.07% 1 1.12 2 4.0% 40 0.00%
FL 27 31% 12 0.28 21 2.23 6 72.7 25 3.4% 48 0.23% 27 0.32 25 1.2% 12 0.13%
GA 20 32% 22 0.24 35 1.51 48 44.3 19 4.1% 40 0.30% 29 0.27 38 0.6% 8 0.16%
HI 21 32% 13 0.28 3 3.63 45 46.3 46 1.5% 19 0.46% 47 0.14 50 0.0% 30 0.04%
ID 9 37% 37 0.16 16 2.54 44 48.0 13 3.2% 28 0.36% 6 0.79 8 3.1% 37 0.01%
IL 43 26% 20 0.24 38 1.42 50 39.4 21 4.0% 23 0.38% 14 0.53 17 1.6% 15 0.11%
IN 41 26% 31 0.18 23 1.94 16 67.1 33 2.5% 43 0.29% 24 0.42 12 1.8% 33 0.03%
IA 38 27% 45 0.13 11 2.72 26 59.5 31 2.6% 39 0.31% 30 0.27 21 1.4% 35 0.02%
KS 23 32% 26 0.20 27 1.81 5 72.9 30 2.6% 37 0.32% 37 0.21 30 0.9% 26 0.07%
KY 46 23% 42 0.13 6 2.97 23 62.1 38 2.1% 47 0.24% 41 0.17 39 0.5% 23 0.08%
LA 47 21% 44 0.13 49 0.68 47 45.0 48 1.4% 38 0.31% 38 0.21 49 0.1% 36 0.01%
ME 16 34% 28 0.20 8 2.92 42 48.9 36 1.8% 21 0.41% 44 0.15 28 1.0% 32 0.03%
MD 3 46% 9 0.30 40 1.38 12 69.4 10 5.1% 3 0.85% 23 0.43 33 0.8% 19 0.10%
MA 8 39% 3 0.35 34 1.53 14 67.7 3 7.5% 4 0.81% 4 0.83 3 3.8% 1 0.62%
MI 42 26% 36 0.17 39 1.40 9 70.6 34 2.4% 27 0.36% 10 0.64 1 4.9% 31 0.04%
MN 12 35% 23 0.23 7 2.92 8 71.2 7 5.5% 24 0.38% 9 0.72 11 2.0% 7 0.17%
MS 50 17% 50 0.08 46 0.90 29 58.7 47 1.7% 46 0.26% 48 0.12 45 0.1% 41 0.00%
MO 32 28% 29 0.19 28 1.78 4 73.5 27 3.0% 31 0.34% 33 0.25 19 1.5% 16 0.11%
MT 31 30% 41 0.14 19 2.35 41 49.8 49 1.2% 16 0.46% 36 0.23 47 0.1% 25 0.07%
NE 30 30% 40 0.14 4 3.16 15 67.2 20 4.1% 34 0.33% 39 0.19 41 0.3% 42 0.00%
NV 35 27% 1 0.46 47 0.78 32 56.8 45 1.7% 49 0.23% 35 0.24 37 0.7% 28 0.07%
NH 5 41% 10 0.29 37 1.42 35 55.3 1 7.8% 25 0.37% 8 0.73 18 1.5% 4 0.29%
NJ 24 32% 15 0.28 43 0.99 28 59.1 8 5.5% 5 0.56% 5 0.81 7 3.1% 11 0.14%
NM 22 32% 34 0.17 44 0.96 37 52.4 22 3.3% 2 1.00% 26 0.33 4 3.6% 44 0.00%
NY 36 27% 14 0.28 41 1.36 25 60.1 17 4.6% 10 0.53% 11 0.62 20 1.5% 24 0.07%
NC 40 26% 30 0.19 24 1.93 33 56.5 23 3.6% 22 0.40% 25 0.34 27 1.2% 10 0.15%
ND 33 28% 49 0.09 15 2.55 39 50.9 39 1.6% 18 0.46% 43 0.16 48 0.1% 44 0.00%
OH 28 30% 27 0.20 36 1.49 27 59.4 32 2.7% 26 0.37% 18 0.50 22 1.4% 29 0.06%
OK 39 26% 35 0.17 50 0.42 38 52.1 29 3.0% 35 0.32% 28 0.30 40 0.4% 38 0.01%
OR 13 34% 11 0.29 9 2.82 18 65.7 9 4.8% 20 0.42% 19 0.48 29 0.9% 18 0.11%
PA 34 27% 25 0.20 45 0.93 10 70.4 26 3.3% 17 0.46% 17 0.50 16 1.7% 17 0.11%
RI 25 31% 17 0.26 32 1.61 43 48.2 24 3.6% 8 0.55% 15 0.52 10 2.1% 43 0.00%
SC 37 27% 38 0.15 30 1.75 21 63.4 41 2.2% 45 0.28% 32 0.26 31 0.9% 20 0.10%
SD 44 25% 47 0.11 17 2.45 7 71.5 14 3.4% 42 0.30% 49 0.12 46 0.1% 44 0.00%
TN 26 31% 33 0.17 20 2.34 20 63.7 42 2.0% 29 0.35% 34 0.25 34 0.7% 6 0.18%
TX 18 33% 21 0.24 25 1.93 31 58.2 11 4.8% 33 0.34% 22 0.45 26 1.2% 9 0.16%
UT 4 46% 5 0.32 5 3.00 19 65.7 15 4.5% 11 0.52% 13 0.59 14 1.8% 22 0.09%
VT 15 34% 19 0.25 12 2.64 36 55.3 5 5.2% 7 0.55% 3 0.86 13 1.8% 39 0.01%
VA 7 40% 7 0.31 26 1.88 17 67.0 6 5.2% 13 0.50% 31 0.26 32 0.8% 21 0.10%
WA 6 41% 8 0.30 2 3.79 1 79.7 18 4.1% 14 0.49% 21 0.46 9 2.9% 5 0.24%
WV 48 20% 46 0.11 18 2.38 46 46.1 43 1.8% 41 0.30% 40 0.18 36 0.7% 44 0.00%
WI 29 30% 32 0.18 22 1.99 2 79.5 35 2.5% 44 0.29% 20 0.47 24 1.3% 27 0.07%
WY 10 36% 39 0.15 10 2.75 11 69.8 50 1.0% 32 0.34% 42 0.17 43 0.2% 44 0.00%
31% 0.26 2.0 60.4 4.5% 0.42% 0.48 1.8% 0.17%
OnlinePopulation
CommercialInternetDomains
EducationTechnology
DigitalGovernment
High-TechJobs
Scientists andEngineers Patents
Industry R&DInvestment
VentureCapital
1 2 S TAT E N E W E C O N O M Y I N D E X
INDICATORSSUMMARY OF RESULTS
The two states that are farthest along the path to the New Economya re Massachusetts and California. Both are quintessential high-
tech states. Massachusetts boasts a concentration of software, hard w a re ,and biotech firms supported by world class universities such as MITand Harv a rd in the Route 128 region around Boston. Californ i a ’sSilicon Valley has become synonymous with innovation and technol-o g y, while for sheer number of technology companies, SouthernC a l i f o rnia is a force to be reckoned with. But they and the other topten New Economy states (Colorado, Washington, Connecticut, Utah,New Hampshire, New Jersey, Delaware, and Arizona) have more in com-mon than just high-tech firms. They tend to have a high concentrationof managers, professionals, and college-educated residents working in“knowledge jobs” (jobs that re q u i re at least a two-year degree). Wi t hone or two exceptions, their manufacturers tend to be more geare dt o w a rd global markets, both in terms of export orientation and theamount of foreign direct investment. Most are at the fore f ront of the ITand Internet revolutions, with a large share of their institutions and re s-idents embracing the digital economy. Most have a solid “innovationi n f r a s t ru c t u re” that fosters and supports technological innovation.Many have experienced high levels of domestic in-migration of high-ly mobile, highly skilled knowledge workers seeking good employ-ment opportunities coupled with a good quality of life. More o v e r, whilethey tend to be richer states (there is a positive correlation of 0.71between their rankings and their per capita income), wealth is not asimple proxy for advancement toward the New Economy. Some stateswith higher incomes lag behind in their scores (for example, New Yo r k ,Illinois, Michigan), while other states with lower incomes do re l a t i v e-ly well (such as New Mexico, Utah, and Arizona).
Finally, the top-ranked economies don’t score well simply becausethey have found ways to get the right mix of companies, individu-als, and institutions. They also score well because they tend toadapt quickly. A high rate of “creative destruction”—the sheddingof old practices while embracing the new—is the key to economict r a n s f o rmation in the private, public, and non-profit sectors. In fact,the degree to which businesses close in a state is positively corre-lated with total New Economy scores and employment growth from1986 to 1996 (0.35 and 0.30, respectively).
The two states that are still most firmly rooted in the old economya re Mississippi and Arkansas. Other states with low scores includeWest Vi rginia, Louisiana, Montana, North Dakota, Alabama, SouthDakota, Iowa, and Wyoming. Historically, these and other Southernand Plains states lagged behind in industrialization, and many havemade limited investments in education and R&D. Their economieshave often depended on natural re s o u rces or on mass pro d u c t i o nmanufacturing, and have tended to rely on low costs rather thaninnovative capacity to gain advantage. But innovative capacity(derived through universities, R&D investments, scientists and engi-neers, and entre p reneurial drive) is increasingly what drives com-petitive success in the New Economy.
While lower-ranking states face challenges, they can also take advan-tage of new opportunities. The IT revolution gives companies andindividuals more geographical freedom, making it easier for busi-nesses to relocate, or start up and gro w, in less densely populatedstates, farther away from existing agglomerations of industry and com-m e rce. But a key policy challenge will be to find a way to extendadvanced telecommunications infrastru c t u re to these places.
R e g i o n a l l y, the New Economy has taken hold most strongly in theN o rtheast, the mid-Atlantic, the Mountain West, and the Pacific re g i o n s ;17 of the top 20 states are in these four regions. (The three exceptions areMinnesota, Texas, and Florida.) In contrast, 17 of the 20 lowest-rankingstates are in the Midwest, Great Plains, and the South.
Given some states’ reputations as technology-based, New Economystates, their scores seem surprising at first. For example, Georgiaand North Carolina rank 25th and 30th, re s p e c t i v e l y, in spite of thefact that the regions around Research Triangle Park and Atlantaboast top universities, a highly educated workforce, cutting-edgetechnology companies, and global connections. In both cases, how-e v e r, the parts of the state outside these metropolitan regions are morerooted in the old economy—with more jobs in traditional manu-facturing, agriculture, and lower-skilled services; a less educatedw o r k f o rce; and a less developed innovation infrastru c t u re. As theseexamples reveal, most state economies are in fact a composite of manyregional economies that differ in the degree to which they haveadapted to the New Economy.
How closely do high scores correlate with economic growth? Statesthat score higher appear to create jobs no faster than states thats c o re lower. Between 1991 and 1996, there was in fact a slightly neg-ative correlation (-0.04) between employment growth and NewEconomy score.
H o w e v e r, its not clear that job growth is the true measure of a state’seconomic well-being. (Rapidly growing states are likely to experi-ence rising home prices, traffic congestion, declining open space,and increasing environmental pollution, among other negative impacts.)Change in per-capita income is a more accurate measure of the eco-nomic well-being of the residents of a state. Higher New Economys c o res were positively (though weakly) correlated with growth in statep e r-capita incomes between 1992 and 1997 (0.13). It is possible thatthis relationship would be even stronger if inflation-adjusted per-capita income growth data were available, since nominal measure smay overstate income growth in some faster growing states with loweroverall scores, particularly those in the South. In addition, many highscoring states, such as California, Massachusetts, Wa s h i n g t o n ,Colorado, and Connecticut, suff e red economic slowdowns in the early1990s due to defense downsizing. As the New Economy continues totake hold over the next decade, higher scoring states can be expect-ed to experience faster per-capita economic income growth than lowerscoring states.
S TAT E N E W E C O N O M Y I N D E X 1 3
10 0 th–76th Perc e n t i l e 7 5 th– 51st Perc e n t i l e 5 0 th–26th Perc e n t i l e 2 5 th–1st Perc e n t i l e
INDICATORSKNOWLEDGE JOBS
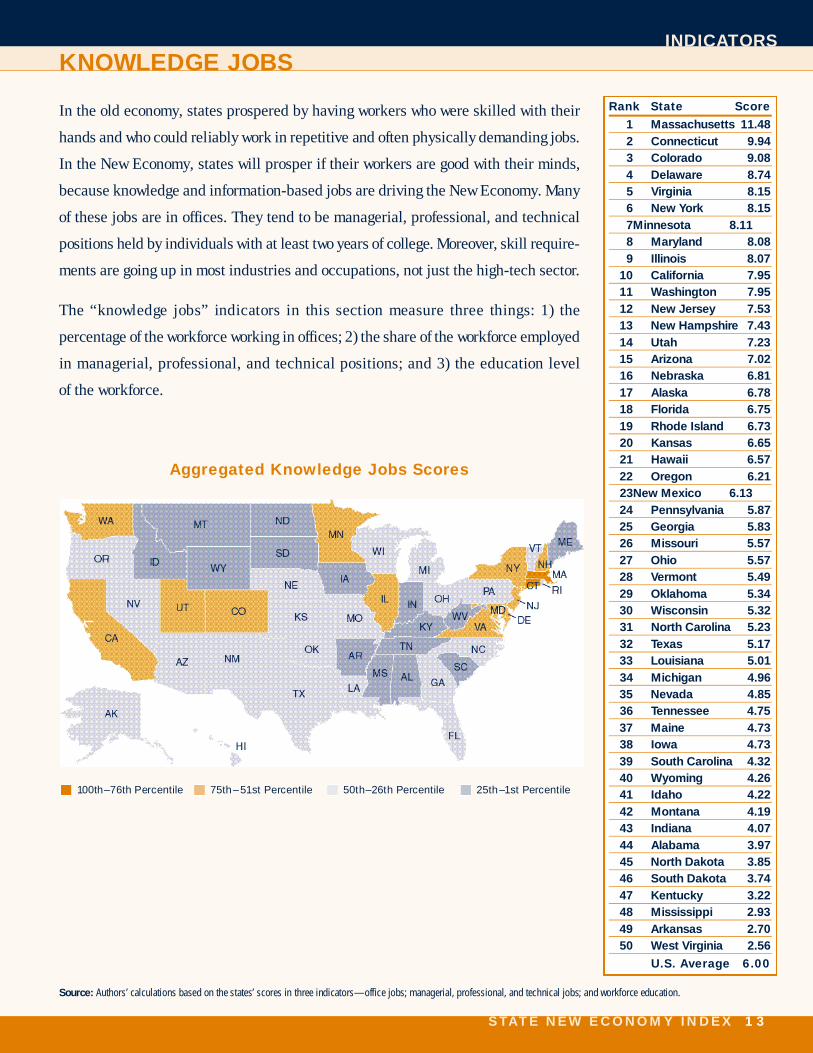
S o u r c e : Authors’ calculations based on the states’ scores in three indicators—office jobs; managerial, professional, and technical jobs; and workforce education.
Rank State Score
1 Massachusetts 11.482 Connecticut 9.943 Colorado 9.084 Delaware 8.745 Virginia 8.156 New York 8.157 Minnesota 8.118 Maryland 8.089 Illinois 8.07
10 California 7.9511 Washington 7.9512 New Jersey 7.5313 New Hampshire 7.4314 Utah 7.2315 Arizona 7.0216 Nebraska 6.8117 Alaska 6.7818 Florida 6.7519 Rhode Island 6.7320 Kansas 6.6521 Hawaii 6.5722 Oregon 6.2123 New Mexico 6.1324 Pennsylvania 5.8725 Georgia 5.8326 Missouri 5.5727 Ohio 5.5728 Vermont 5.4929 Oklahoma 5.3430 Wisconsin 5.3231 North Carolina 5.2332 Texas 5.1733 Louisiana 5.0134 Michigan 4.9635 Nevada 4.8536 Tennessee 4.7537 Maine 4.7338 Iowa 4.7339 South Carolina 4.3240 Wyoming 4.2641 Idaho 4.2242 Montana 4.1943 Indiana 4.0744 Alabama 3.9745 North Dakota 3.8546 South Dakota 3.7447 Kentucky 3.2248 Mississippi 2.9349 Arkansas 2.7050 West Virginia 2.56
U.S. Average 6.00
In the old economy, states prospered by having workers who were skilled with their
hands and who could reliably work in repetitive and often physically demanding jobs.
In the New Economy, states will prosper if their workers are good with their minds,
because knowledge and information-based jobs are driving the New Economy. Many
of these jobs are in offices. They tend to be managerial, professional, and technical
positions held by individuals with at least two years of college. More o v e r, skill re q u i re-
ments are going up in most industries and occupations, not just the high-tech sector.
The “knowledge jobs” indicators in this section measure three things: 1) the
p e rcentage of the workforce working in offices; 2) the share of the workforce employed
in managerial, professional, and technical positions; and 3) the education level
of the workforce.
Aggregated Knowledge Jobs Scores
1 4 S TAT E N E W E C O N O M Y I N D E X
INDICATORSKNOWLEDGE JOBS
10 0 th–76th Perc e n t i l e
7 5 th– 51st Perc e n t i l e
5 0 th–26th Perc e n t i l e
2 5 th –1st Perc e n t i l e
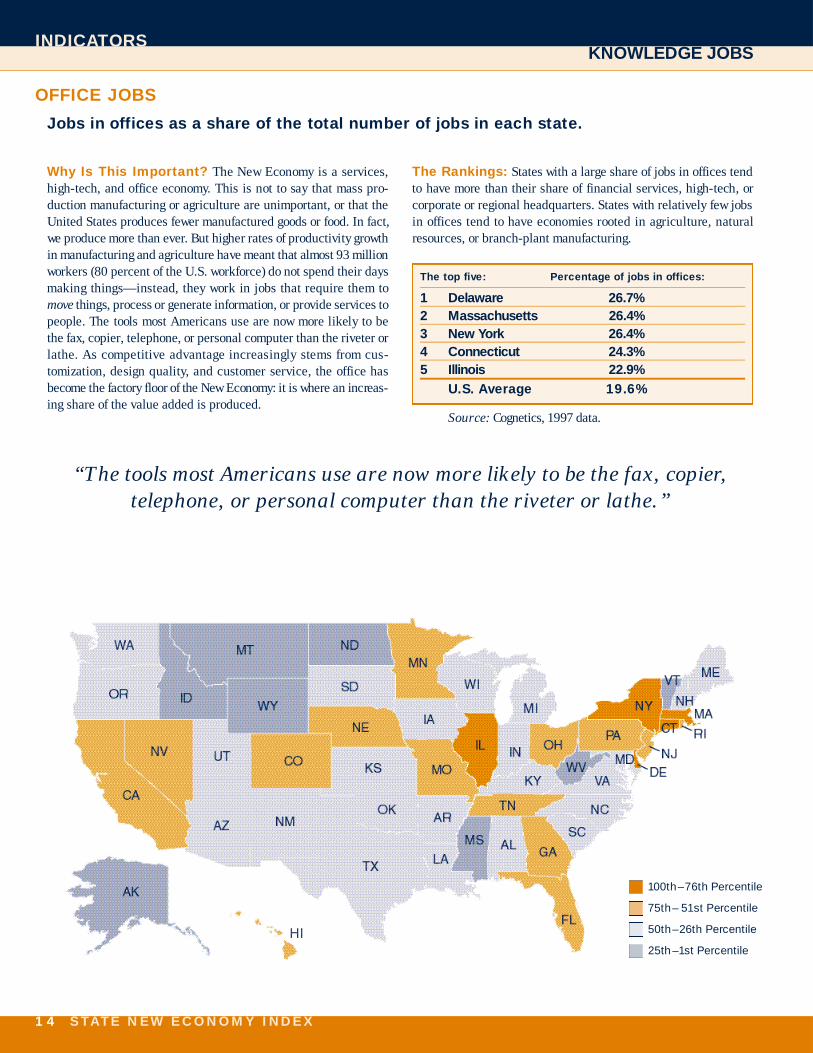
Why Is This Important? The New Economy is a serv i c e s ,high-tech, and office economy. This is not to say that mass pro-duction manufacturing or agriculture are unimportant, or that theUnited States produces fewer manufactured goods or food. In fact,we produce more than ever. But higher rates of productivity gro w t hin manufacturing and agriculture have meant that almost 93 millionworkers (80 percent of the U.S. workforce) do not spend their daysmaking things—instead, they work in jobs that re q u i re them tom o v e things, process or generate information, or provide services topeople. The tools most Americans use are now more likely to bethe fax, copier, telephone, or personal computer than the riveter orlathe. As competitive advantage increasingly stems from cus-tomization, design quality, and customer service, the office hasbecome the factory floor of the New Economy: it is where an incre a s-ing share of the value added is produced.
The Rankings: States with a large share of jobs in offices tendto have more than their share of financial services, high-tech, orcorporate or regional headquarters. States with relatively few jobsin offices tend to have economies rooted in agriculture, naturalresources, or branch-plant manufacturing.
The top five: P e rcentage of jobs in off i c e s :
1 D e l a w a re 2 6 . 7 %2 M a s s a c h u s e t t s 2 6 . 4 %3 New Yo r k 2 6 . 4 %4 C o n n e c t i c u t 2 4 . 3 %5 I l l i n o i s 2 2 . 9 %
U.S. Av e r a g e 1 9 . 6 %
S o u r c e : Cognetics, 1997 data.
OFFICE JOBS
Jobs in offices as a share of the total number of jobs in each state.
“The tools most Americans use are now more likely to be the fax, copier, telephone, or personal computer than the riveter or lathe.”
10 0 th–76th Perc e n t i l e
7 5 th– 51st Perc e n t i l e
5 0 th –26th Perc e n t i l e
2 5 th–1st Perc e n t i l e
S TAT E N E W E C O N O M Y I N D E X 1 5
INDICATORSKNOWLEDGE JOBS
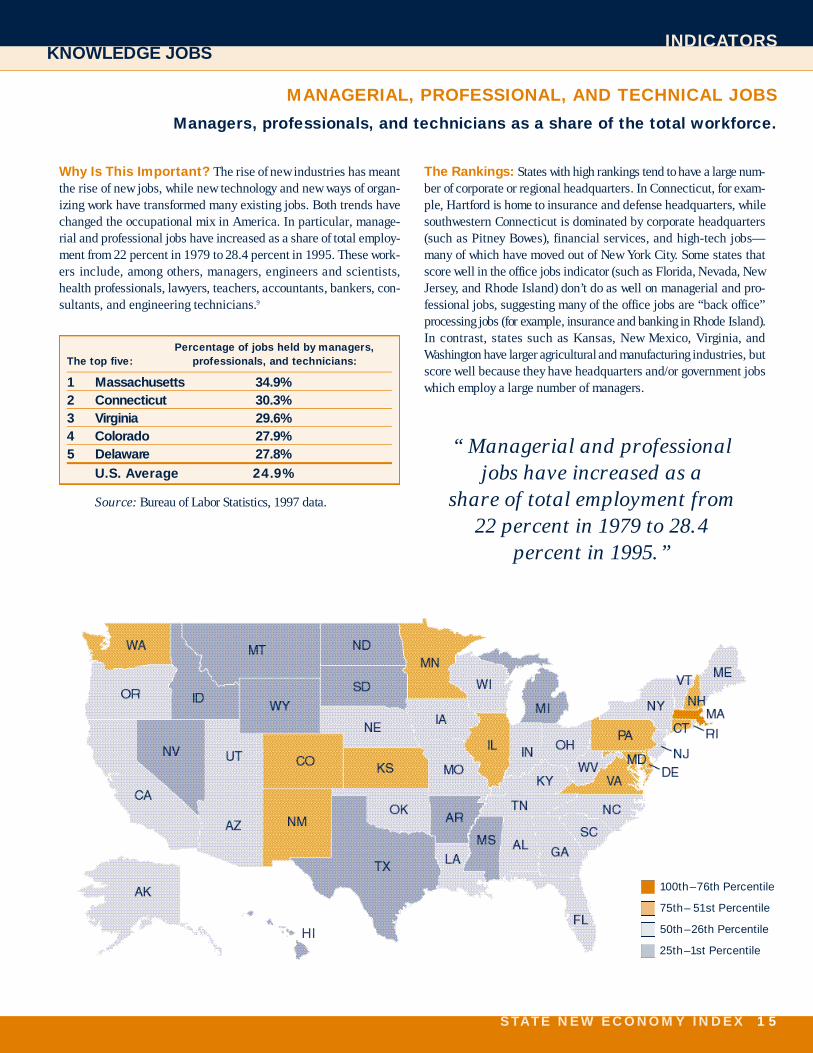
MANAGERIAL, PROFESSIONAL, AND TECHNICAL JOBS
Managers, professionals, and technicians as a share of the total workforce.
Why Is This Important? The rise of new industries has meantthe rise of new jobs, while new technology and new ways of organ-izing work have transformed many existing jobs. Both trends havechanged the occupational mix in America. In particular, manage-rial and professional jobs have increased as a share of total employ-ment from 22 percent in 1979 to 28.4 percent in 1995. These work-ers include, among others, managers, engineers and scientists,health professionals, lawyers, teachers, accountants, bankers, con-sultants, and engineering technicians.9
P e rcentage of jobs held by managers,The top five: p rofessionals, and technicians:
1 M a s s a c h u s e t t s 3 4 . 9 %2 C o n n e c t i c u t 3 0 . 3 %3 Vi r g i n i a 2 9 . 6 %4 C o l o r a d o 2 7 . 9 %5 D e l a w a re 2 7 . 8 %
U.S. Av e r a g e 2 4 . 9 %
S o u r c e : B u reau of Labor Statistics, 1997 data.
The Rankings: States with high rankings tend to have a large num-ber of corporate or regional headquarters. In Connecticut, for exam-ple, Hart f o rd is home to insurance and defense headquarters, whiles o u t h w e s t e rn Connecticut is dominated by corporate headquart e r s(such as Pitney Bowes), financial services, and high-tech jobs—many of which have moved out of New York City. Some states thats c o re well in the office jobs indicator (such as Florida, Nevada, NewJ e r s e y, and Rhode Island) don’t do as well on managerial and pro-fessional jobs, suggesting many of the office jobs are “back off i c e ”p rocessing jobs (for example, insurance and banking in Rhode Island).In contrast, states such as Kansas, New Mexico, Vi rginia, andWashington have larger agricultural and manufacturing industries, buts c o re well because they have headquarters and/or government jobswhich employ a large number of managers.
“ Managerial and professionaljobs have increased as a
share of total employment from22 percent in 1979 to 28.4
percent in 1995.”
1 6 S TAT E N E W E C O N O M Y I N D E X
INDICATORSKNOWLEDGE JOBS
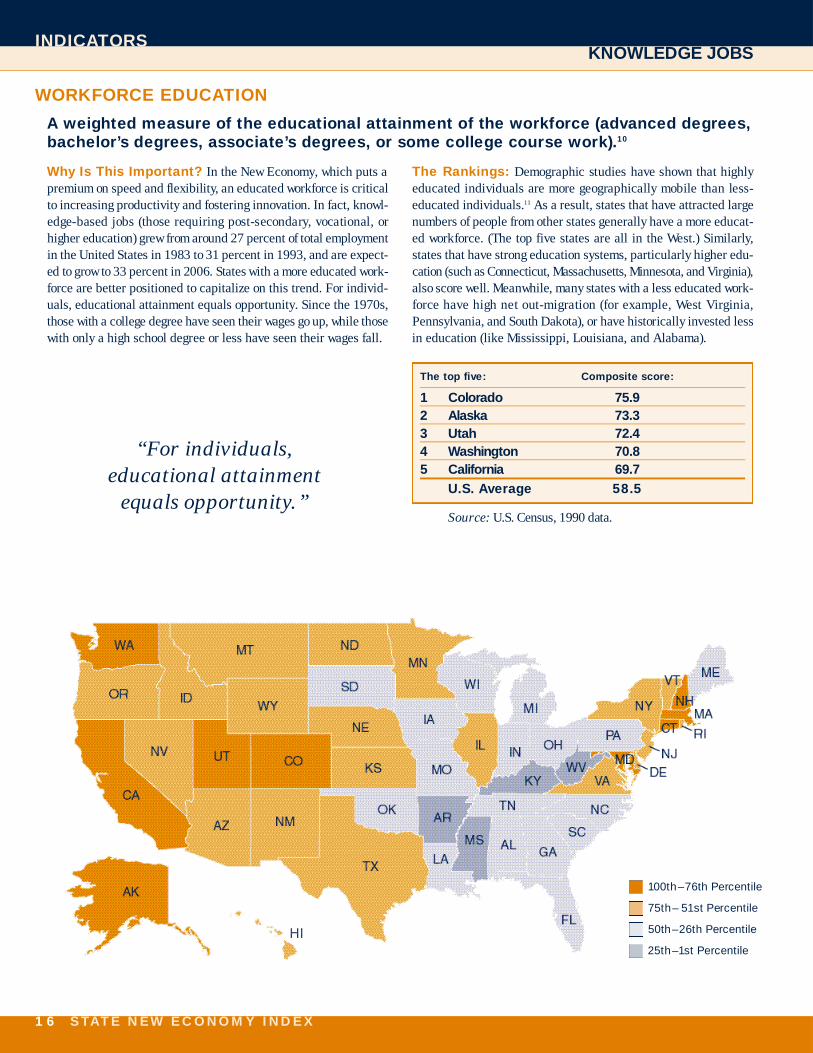
Why Is This Important? In the New Economy, which puts ap remium on speed and flexibility, an educated workforce is criticalto increasing productivity and fostering innovation. In fact, knowl-edge-based jobs (those requiring post-secondary, vocational, orhigher education) grew from around 27 percent of total employmentin the United States in 1983 to 31 percent in 1993, and are expect-ed to grow to 33 percent in 2006. States with a more educated work-force are better positioned to capitalize on this trend. For individ-uals, educational attainment equals opportunity. Since the 1970s,those with a college degree have seen their wages go up, while thosewith only a high school degree or less have seen their wages fall.
The Rankings: Demographic studies have shown that highlyeducated individuals are more geographically mobile than less-educated individuals.11 As a result, states that have attracted largenumbers of people from other states generally have a more educat-ed workforce. (The top five states are all in the West.) Similarly,states that have strong education systems, particularly higher edu-cation (such as Connecticut, Massachusetts, Minnesota, and Vi rg i n i a ) ,also score well. Meanwhile, many states with a less educated work-f o rce have high net out-migration (for example, West Vi rg i n i a ,Pennsylvania, and South Dakota), or have historically invested lessin education (like Mississippi, Louisiana, and Alabama).
The top five: Composite score :
1 C o l o r a d o 7 5 . 92 A l a s k a 7 3 . 33 U t a h 7 2 . 44 Wa s h i n g t o n 7 0 . 85 C a l i f o rn i a 6 9 . 7
U.S. Av e r a g e 5 8 . 5
S o u r c e : U.S. Census, 1990 data.
WORKFORCE EDUCATION
A weighted measure of the educational attainment of the workforce (advanced degre e s ,b a c h e l o r ’s degrees, associate’s degrees, or some college course work).1 0
“For individuals,educational attainment
equals opportunity.”
10 0 th–76th Perc e n t i l e
7 5 th– 51st Perc e n t i l e
5 0 th–26th Perc e n t i l e
2 5 th–1st Perc e n t i l e
S TAT E N E W E C O N O M Y I N D E X 1 7
INDICATORSG L O B A L I Z AT I O N
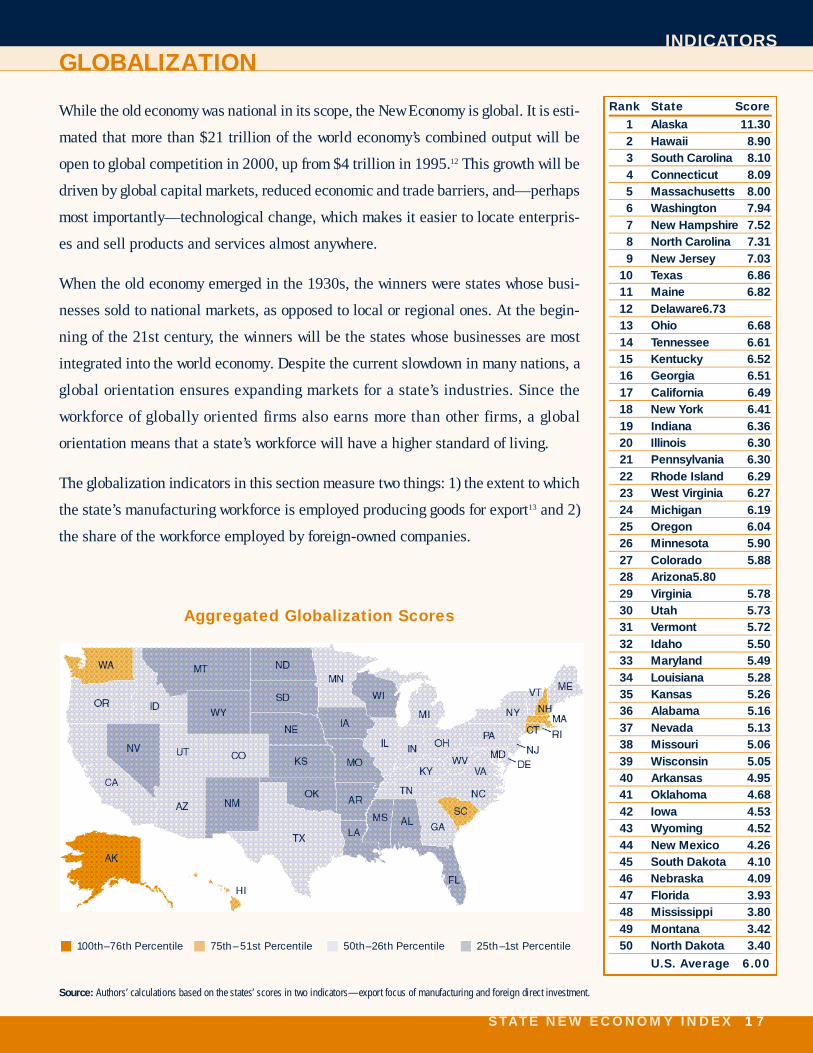
While the old economy was national in its scope, the New Economy is global. It is esti-
mated that more than $21 trillion of the world economy’s combined output will be
open to global competition in 2000, up from $4 trillion in 1995.12 This growth will be
driven by global capital markets, reduced economic and trade barriers, and—perh a p s
most importantly—technological change, which makes it easier to locate enterpris-
es and sell products and services almost anywhere.
When the old economy emerged in the 1930s, the winners were states whose busi-
nesses sold to national markets, as opposed to local or regional ones. At the begin-
ning of the 21st century, the winners will be the states whose businesses are most
integrated into the world economy. Despite the current slowdown in many nations, a
global orientation ensures expanding markets for a state’s industries. Since the
w o r k f o rce of globally oriented firms also earns more than other firms, a global
orientation means that a state’s workforce will have a higher standard of living.
The globalization indicators in this section measure two things: 1) the extent to which
the state’s manufacturing workforce is employed producing goods for export13 and 2)
the share of the workforce employed by foreign-owned companies.
Aggregated Globalization Scores
S o u r c e : Authors’ calculations based on the states’ scores in two indicators—export focus of manufacturing and foreign direct investment.
Rank State Score
1 Alaska 11.302 Hawaii 8.903 South Carolina 8.104 Connecticut 8.095 Massachusetts 8.006 Washington 7.947 New Hampshire 7.528 North Carolina 7.319 New Jersey 7.03
10 Texas 6.8611 Maine 6.8212 Delaware 6.7313 Ohio 6.6814 Tennessee 6.6115 Kentucky 6.5216 Georgia 6.5117 California 6.4918 New York 6.4119 Indiana 6.3620 Illinois 6.3021 Pennsylvania 6.3022 Rhode Island 6.2923 West Virginia 6.2724 Michigan 6.1925 Oregon 6.0426 Minnesota 5.9027 Colorado 5.8828 Arizona 5.8029 Virginia 5.7830 Utah 5.7331 Vermont 5.7232 Idaho 5.5033 Maryland 5.4934 Louisiana 5.2835 Kansas 5.2636 Alabama 5.1637 Nevada 5.1338 Missouri 5.0639 Wisconsin 5.0540 Arkansas 4.9541 Oklahoma 4.6842 Iowa 4.5343 Wyoming 4.5244 New Mexico 4.2645 South Dakota 4.1046 Nebraska 4.0947 Florida 3.9348 Mississippi 3.8049 Montana 3.4250 North Dakota 3.40
U.S. Average 6.00
10 0 th–76th Perc e n t i l e 7 5 th– 51st Perc e n t i l e 5 0 th–26th Perc e n t i l e 2 5 th–1st Perc e n t i l e
1 8 S TAT E N E W E C O N O M Y I N D E X
INDICATORSGLOBALIZATION
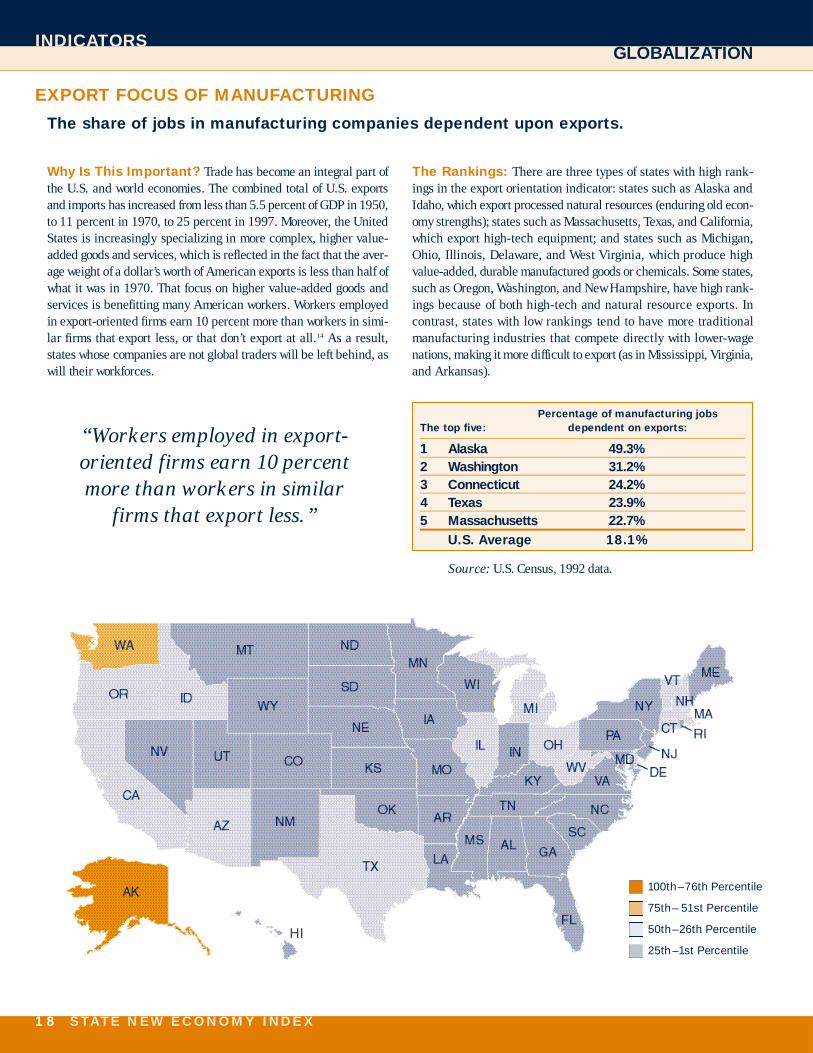
Why Is This Important? Trade has become an integral part ofthe U.S. and world economies. The combined total of U.S. export sand imports has increased from less than 5.5 percent of GDP in 1950,to 11 percent in 1970, to 25 percent in 1997. More o v e r, the UnitedStates is increasingly specializing in more complex, higher value-added goods and services, which is reflected in the fact that the aver-age weight of a dollar’s worth of American exports is less than half ofwhat it was in 1970. That focus on higher value-added goods ands e rvices is benefitting many American workers. Workers employedin export-oriented firms earn 10 percent more than workers in simi-lar firms that export less, or that don’t export at all.1 4 As a re s u l t ,states whose companies are not global traders will be left behind, aswill their workforc e s .
The Rankings: There are three types of states with high rank-ings in the export orientation indicator: states such as Alaska andIdaho, which export processed natural re s o u rces (enduring old econ-omy strengths); states such as Massachusetts, Texas, and Californ i a ,which export high-tech equipment; and states such as Michigan,Ohio, Illinois, Delaware, and West Vi rginia, which produce highvalue-added, durable manufactured goods or chemicals. Some states,such as Oregon, Washington, and New Hampshire, have high rank-ings because of both high-tech and natural re s o u rce exports. Incontrast, states with low rankings tend to have more traditionalmanufacturing industries that compete directly with lower- w a g enations, making it more difficult to export (as in Mississippi, Vi rg i n i a ,and Arkansas).
P e rcentage of manufacturing jobsThe top five: dependent on exports:
1 A l a s k a 4 9 . 3 %2 Wa s h i n g t o n 3 1 . 2 %3 C o n n e c t i c u t 2 4 . 2 %4 Te x a s 2 3 . 9 %5 M a s s a c h u s e t t s 2 2 . 7 %
U.S. Av e r a g e 1 8 . 1 %
S o u r c e : U.S. Census, 1992 data.
EXPORT FOCUS OF MANUFACTURING
The share of jobs in manufacturing companies dependent upon exports.
“Workers employed in export-oriented firms earn 10 percentmore than workers in similar
firms that export less.”
10 0 th–76th Perc e n t i l e
7 5 th– 51st Perc e n t i l e
5 0 th–26th Perc e n t i l e
2 5 th –1st Perc e n t i l e

S TAT E N E W E C O N O M Y I N D E X 1 9
INDICATORSGLOBALIZATION
FOREIGN DIRECT INVESTMENT
The percentage of each state’s workforce employed by foreign companies.
Why Is This Important? F o reign direct investment (FDI)includes significant investments by foreign companies, such as con-struction of production facilities or ownership stakes taken in U.S.companies. FDI not only creates new jobs, it can also lead to aninfusion of innovative technologies, management strategies, andw o r k f o rce practices. For example, some have argued that Japaneseautomobile plants in the Midwest spurred American companies toadopt more modernized manufacturing practices.15 Foreign directinvestment has been on the rise in the United States and around theworld since the 1970s. In the United States, incoming FDI hasgrown from $134 billion for all of the 1970s to $312 billion in justthe first half of the 1990s (in constant 1992 dollars), and from .32percent of GDP to .69 percent.
The Rankings: With the exception of Hawaii, which has the tops c o re because of its proximity to Asia, most states that score wella re on the East Coast. This is in large part because most FDIcomes from Europe and Canada. In 1996, Europe accounted fort w o - t h i rds of all FDI in the United States, with Asia accountingfor less than 15 percent. European companies have invested in EastCoast states in part because of their proximity to their corporateh e a d q u a rters, and because of the access to densely populatedm a r k e t s .
P e rcentage of workforce employedThe top five: by foreign companies:
1 H a w a i i 8 . 8 %2 South Caro l i n a 6 . 7 %3 North Caro l i n a 6 . 2 %4 M a s s a c h u s e t t s 5 . 4 %5 New Jersey 5 . 3 %
U.S. Av e r a g e 3 . 9 %
S o u r c e : B u reau of Economic Analysis, 1996-1997 data.
“Incoming FDI has grown from$134 billion for all of the 1970s to $312 billion in just the firsthalf of the 1990s (in constant
1992 dollars).”
10 0 th–76th Perc e n t i l e
7 5 th– 51st Perc e n t i l e
5 0 th–26th Perc e n t i l e
2 5 th–1st Perc e n t i l e
2 0 S TAT E N E W E C O N O M Y I N D E X
INDICATORSECONOMIC DYNAMISM
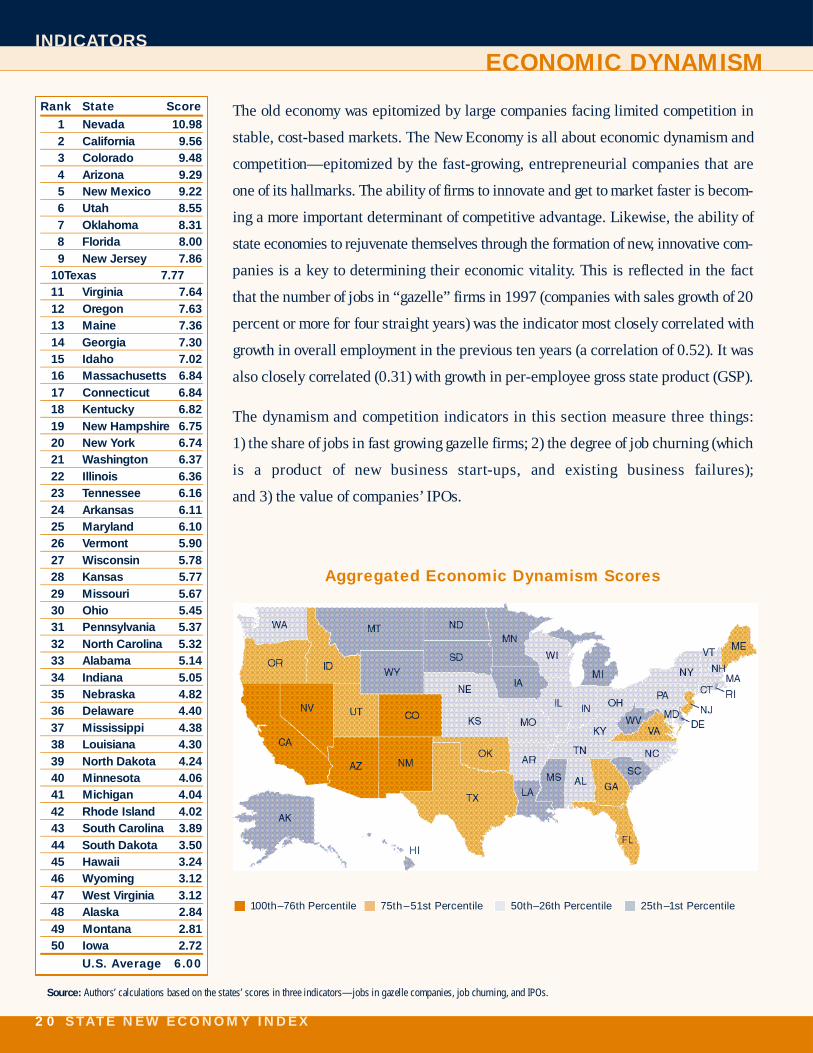
The old economy was epitomized by large companies facing limited competition in
stable, cost-based markets. The New Economy is all about economic dynamism and
competition—epitomized by the fast-growing, entre p reneurial companies that are
one of its hallmarks. The ability of firms to innovate and get to market faster is becom-
ing a more important determinant of competitive advantage. Likewise, the ability of
state economies to rejuvenate themselves through the formation of new, innovative com-
panies is a key to determining their economic vitality. This is reflected in the fact
that the number of jobs in “gazelle” firms in 1997 (companies with sales growth of 20
p e rcent or more for four straight years) was the indicator most closely correlated with
growth in overall employment in the previous ten years (a correlation of 0.52). It was
also closely correlated (0.31) with growth in per-employee gross state product (GSP).
The dynamism and competition indicators in this section measure three things:
1) the share of jobs in fast growing gazelle firms; 2) the degree of job churning (which
is a product of new business start-ups, and existing business failures);
and 3) the value of companies’ IPOs.
Aggregated Economic Dynamism Scores
S o u r c e : Authors’ calculations based on the states’ scores in three indicators—jobs in gazelle companies, job churning, and IPOs.
Rank State Score
1 Nevada 10.982 California 9.563 Colorado 9.484 Arizona 9.295 New Mexico 9.226 Utah 8.557 Oklahoma 8.318 Florida 8.009 New Jersey 7.86
10 Texas 7.7711 Virginia 7.6412 Oregon 7.6313 Maine 7.3614 Georgia 7.3015 Idaho 7.0216 Massachusetts 6.8417 Connecticut 6.8418 Kentucky 6.8219 New Hampshire 6.7520 New York 6.7421 Washington 6.3722 Illinois 6.3623 Tennessee 6.1624 Arkansas 6.1125 Maryland 6.1026 Vermont 5.9027 Wisconsin 5.7828 Kansas 5.7729 Missouri 5.6730 Ohio 5.4531 Pennsylvania 5.3732 North Carolina 5.3233 Alabama 5.1434 Indiana 5.0535 Nebraska 4.8236 Delaware 4.4037 Mississippi 4.3838 Louisiana 4.3039 North Dakota 4.2440 Minnesota 4.0641 Michigan 4.0442 Rhode Island 4.0243 South Carolina 3.8944 South Dakota 3.5045 Hawaii 3.2446 Wyoming 3.1247 West Virginia 3.1248 Alaska 2.8449 Montana 2.8150 Iowa 2.72
U.S. Average 6.00
10 0 th–76th Perc e n t i l e 7 5 th– 51st Perc e n t i l e 5 0 th–26th Perc e n t i l e 2 5 th–1st Perc e n t i l e
10 0 th–76th Perc e n t i l e
7 5 th– 51st Perc e n t i l e
5 0 th–26th Perc e n t i l e
2 5 th–1st Perc e n t i l e
S TAT E N E W E C O N O M Y I N D E X 2 1
INDICATORSECONOMIC DYNAMISM
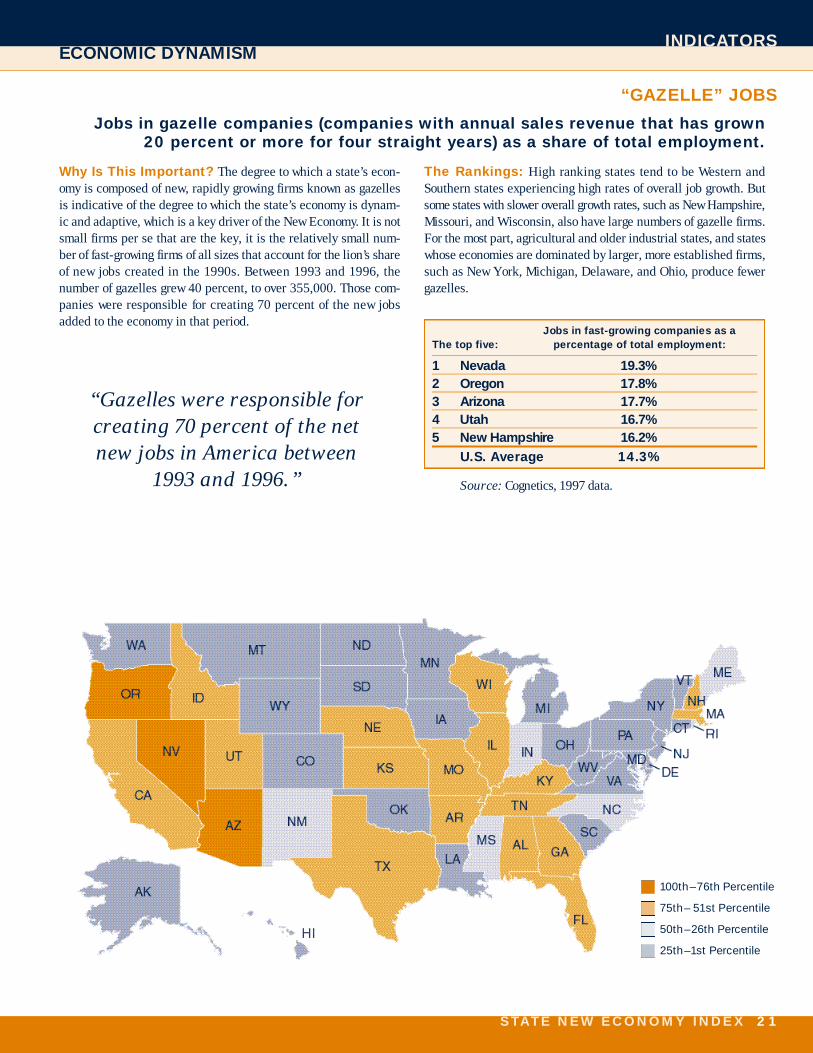
Why Is This Important? The degree to which a state’s econ-omy is composed of new, rapidly growing firms known as gazellesis indicative of the degree to which the state’s economy is dynam-ic and adaptive, which is a key driver of the New Economy. It is notsmall firms per se that are the key, it is the relatively small num-ber of fast-growing firms of all sizes that account for the lion’s shareof new jobs created in the 1990s. Between 1993 and 1996, thenumber of gazelles grew 40 percent, to over 355,000. Those com-panies were responsible for creating 70 percent of the new jobsadded to the economy in that period.
The Rankings: High ranking states tend to be We s t e rn andSouthern states experiencing high rates of overall job growth. Butsome states with slower overall growth rates, such as New Hampshire ,Missouri, and Wisconsin, also have large numbers of gazelle firm s .For the most part, agricultural and older industrial states, and stateswhose economies are dominated by larger, more established firms,such as New York, Michigan, Delaware, and Ohio, produce fewergazelles.
Jobs in fast-growing companies as aThe top five: p e rcentage of total employment:
1 N e v a d a 1 9 . 3 %2 O re g o n 1 7 . 8 %3 A r i z o n a 1 7 . 7 %4 U t a h 1 6 . 7 %5 New Hampshire 1 6 . 2 %
U.S. Av e r a g e 1 4 . 3 %
S o u r c e : Cognetics, 1997 data.
“GAZELLE” JOBS
Jobs in gazelle companies (companies with annual sales revenue that has grown 20 percent or more for four straight years) as a share of total employment.
“Gazelles were responsible forcreating 70 percent of the net new jobs in America between
1993 and 1996.”

2 2 S TAT E N E W E C O N O M Y I N D E X
INDICATORSECONOMIC DYNAMISM
JOB CHURNING
The number of new start-ups and business failure s ,combined, as a share of all companies in each state.
Why Is This Important? Steady growth in employment masksthe constant churning of job creation and destruction, as less inno-vative and efficient companies downsize or go out of business andm o re innovative and efficient companies grow and take their place.A total of 3.5 million private-sector jobs were added to the U.S.economy between 1994 and 1995, but that was after new firms hadc reated 5.7 million jobs, failing firms had eliminated 4.5 millionjobs, expanding firms had added 10.5 million jobs, and contractingf i rms had eliminated 8.2 million others. This churning has acceler-ated as the number of new start-ups and existing business failure sper year has grown. While such turbulence increases the economicrisk faced by workers, companies, and even regions, it is also a majordriver of economic innovation and gro w t h .
The Rankings: Some fast-growing states (like Nevada, Colorado,Arizona, and Utah) have seen a great deal of churning. In part ,this is because fast-growing economies produce more start - u p s ,especially in locally focused industries (such as restaurants, drycleaning, or accounting). But a high churn rate also reflects adynamism that leads to the death of old, outmoded firms and thec reation of innovative new companies that sell outside the state.States with slower overall growth rates, but with dynamic businesssectors, such as New Jersey, Maryland, and California, also seehigh rates of churn .
Business start-ups and failures as aThe top five: p e rcentage of total companies:
1 N e v a d a 4 . 1 %2 C a l i f o rn i a 3 . 6 %3 C o l o r a d o 3 . 5 %4 New Jersey 3 . 4 %5 A r i z o n a 3 . 3 %
U.S. Av e r a g e1 6 2 . 7 %
S o u r c e : Dun & Bradstreet, 1995-1996 data.
“While [churn] increases t h eeconomic risk faced by workers,companies, and even regions, it isalso a major driver of economic
innovation and growth.”
10 0 th–76th Perc e n t i l e
7 5 th– 51st Perc e n t i l e
5 0 th–26th Perc e n t i l e
2 5 th–1st Perc e n t i l e
10 0 th–76th Perc e n t i l e
7 5 th– 51st Perc e n t i l e
5 0 th–26th Perc e n t i l e
2 5 th–1st Perc e n t i l e
S TAT E N E W E C O N O M Y I N D E X 2 3
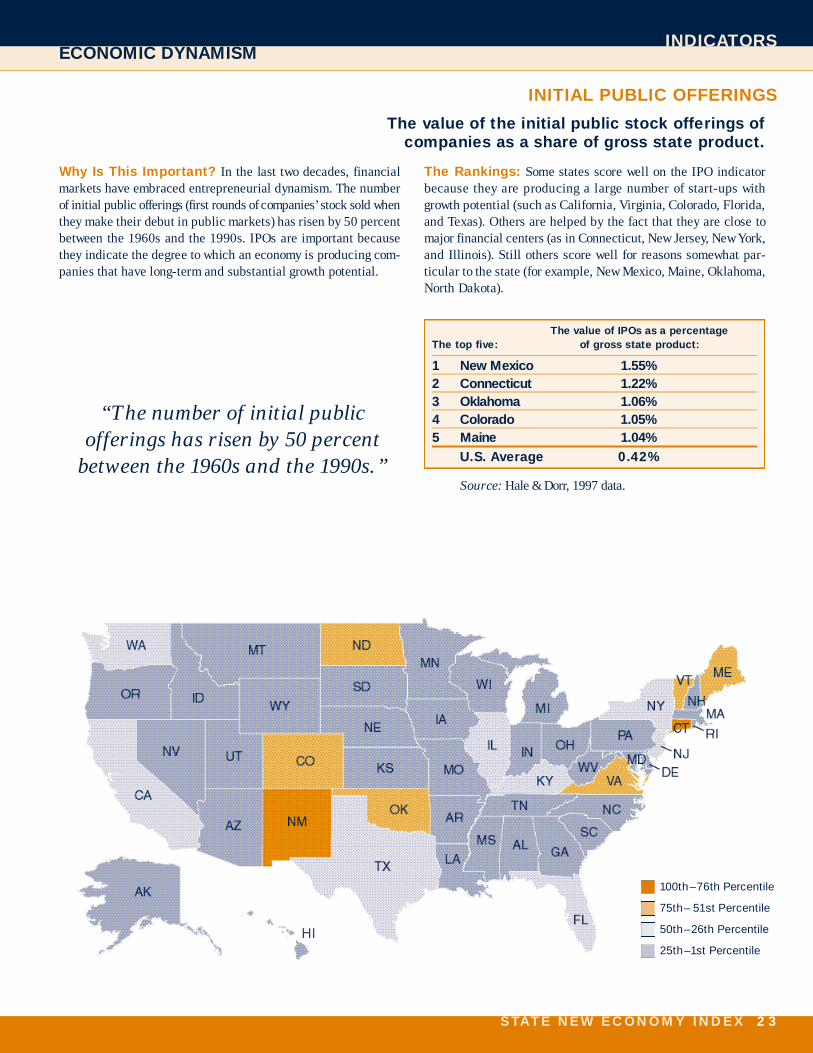
Why Is This Important? In the last two decades, financial markets have embraced entre p reneurial dynamism. The numberof initial public offerings (first rounds of companies’ stock sold whenthey make their debut in public markets) has risen by 50 perc e n tbetween the 1960s and the 1990s. IPOs are important becausethey indicate the degree to which an economy is producing com-panies that have long-term and substantial growth potential.
The Rankings: Some states score well on the IPO indicatorbecause they are producing a large number of start-ups withg rowth potential (such as California, Vi rginia, Colorado, Florida,and Texas). Others are helped by the fact that they are close tomajor financial centers (as in Connecticut, New Jersey, New Yo r k ,and Illinois). Still others score well for reasons somewhat par-ticular to the state (for example, New Mexico, Maine, Oklahoma,N o rth Dakota).
The value of IPOs as a perc e n t a g eThe top five: of gross state pro d u c t :
1 New Mexico 1 . 5 5 %2 C o n n e c t i c u t 1 . 2 2 %3 O k l a h o m a 1 . 0 6 %4 C o l o r a d o 1 . 0 5 %5 M a i n e 1 . 0 4 %
U.S. Av e r a g e 0 . 4 2 %
S o u r c e : Hale & Dorr, 1997 data.
INITIAL PUBLIC OFFERINGS
The value of the initial public stock offerings of companies as a share of gross state product.
INDICATORSECONOMIC DYNAMISM
“The number of initial publicofferings has risen by 50 percent
between the 1960s and the 1990s.”
2 4 S TAT E N E W E C O N O M Y I N D E X
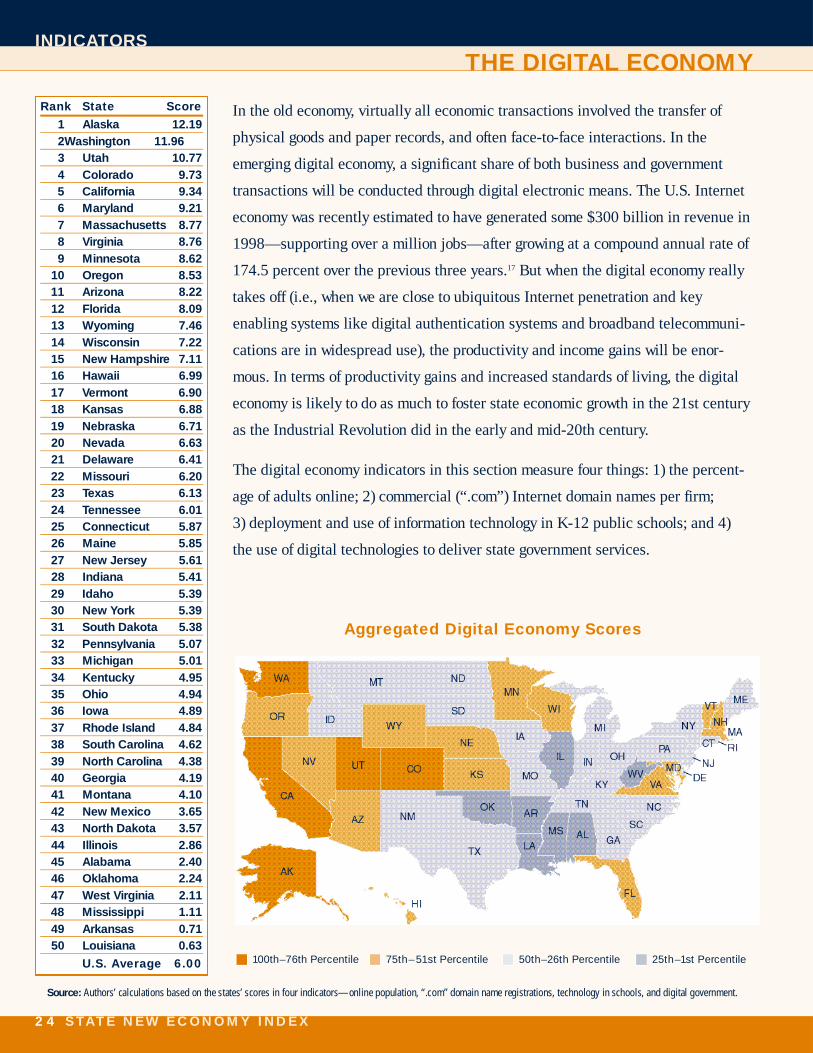
In the old economy, virtually all economic transactions involved the transfer of
physical goods and paper records, and often face-to-face interactions. In the
emerging digital economy, a significant share of both business and government
transactions will be conducted through digital electronic means. The U.S. Internet
economy was recently estimated to have generated some $300 billion in revenue in
1998—supporting over a million jobs—after growing at a compound annual rate of
174.5 percent over the previous three years.17 But when the digital economy really
takes off (i.e., when we are close to ubiquitous Internet penetration and key
enabling systems like digital authentication systems and broadband telecommuni-
cations are in widespread use), the productivity and income gains will be enor-
mous. In terms of productivity gains and increased standards of living, the digital
economy is likely to do as much to foster state economic growth in the 21st century
as the Industrial Revolution did in the early and mid-20th century.
The digital economy indicators in this section measure four things: 1) the percent-
age of adults online; 2) commercial (“.com”) Internet domain names per firm;
3) deployment and use of information technology in K-12 public schools; and 4)
the use of digital technologies to deliver state government services.
Aggregated Digital Economy Scores
Rank State Score
1 Alaska 12.192 Washington 11.963 Utah 10.774 Colorado 9.735 California 9.346 Maryland 9.217 Massachusetts 8.778 Virginia 8.769 Minnesota 8.62
10 Oregon 8.5311 Arizona 8.2212 Florida 8.0913 Wyoming 7.4614 Wisconsin 7.2215 New Hampshire 7.1116 Hawaii 6.9917 Vermont 6.9018 Kansas 6.8819 Nebraska 6.7120 Nevada 6.6321 Delaware 6.4122 Missouri 6.2023 Texas 6.1324 Tennessee 6.0125 Connecticut 5.8726 Maine 5.8527 New Jersey 5.6128 Indiana 5.4129 Idaho 5.3930 New York 5.3931 South Dakota 5.3832 Pennsylvania 5.0733 Michigan 5.0134 Kentucky 4.9535 Ohio 4.9436 Iowa 4.8937 Rhode Island 4.8438 South Carolina 4.6239 North Carolina 4.3840 Georgia 4.1941 Montana 4.1042 New Mexico 3.6543 North Dakota 3.5744 Illinois 2.8645 Alabama 2.4046 Oklahoma 2.2447 West Virginia 2.1148 Mississippi 1.1149 Arkansas 0.7150 Louisiana 0.63
U.S. Average 6.00 10 0 th–76th Perc e n t i l e 7 5 th– 51st Perc e n t i l e 5 0 th–26th Perc e n t i l e 2 5 th–1st Perc e n t i l e
INDICATORSTHE DIGITAL ECONOMY
S o u r c e : Authors’ calculations based on the states’ scores in four indicators—online population, “.com” domain name registrations, technology in schools, and digital government.
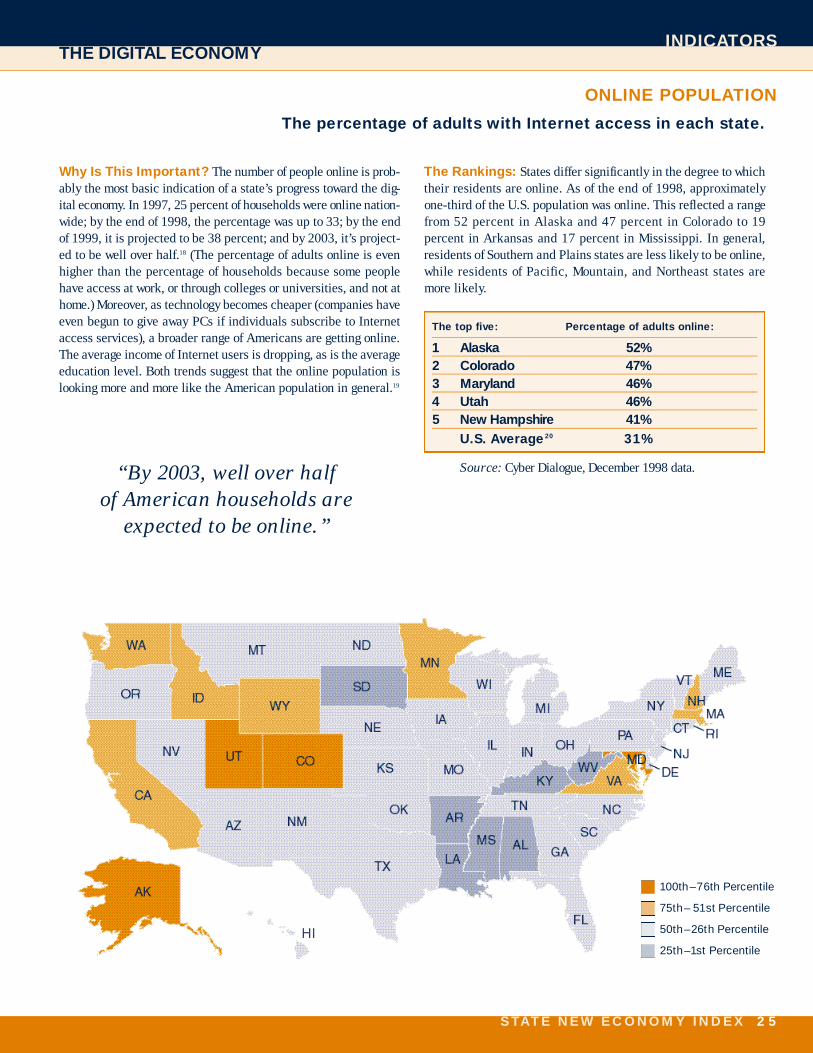
10 0 th–76th Perc e n t i l e
7 5 th– 51st Perc e n t i l e
5 0 th–26th Perc e n t i l e
2 5 th–1st Perc e n t i l e
S TAT E N E W E C O N O M Y I N D E X 2 5
Why Is This Important? The number of people online is pro b-ably the most basic indication of a state’s progress toward the dig-ital economy. In 1997, 25 percent of households were online nation-wide; by the end of 1998, the percentage was up to 33; by the endof 1999, it is projected to be 38 percent; and by 2003, it’s project-ed to be well over half.18 (The percentage of adults online is evenhigher than the percentage of households because some peoplehave access at work, or through colleges or universities, and not athome.) More o v e r, as technology becomes cheaper (companies haveeven begun to give away PCs if individuals subscribe to Internetaccess services), a broader range of Americans are getting online.The average income of Internet users is dropping, as is the averageeducation level. Both trends suggest that the online population islooking more and more like the American population in general.19
The Rankings: States differ significantly in the degree to whichtheir residents are online. As of the end of 1998, appro x i m a t e l yo n e - t h i rd of the U.S. population was online. This reflected a rangef rom 52 percent in Alaska and 47 percent in Colorado to 19 p e rcent in Arkansas and 17 percent in Mississippi. In general,residents of Southern and Plains states are less likely to be online,while residents of Pacific, Mountain, and Northeast states arem o re likely.
The top five: P e rcentage of adults online:
1 A l a s k a 5 2 %2 C o l o r a d o 4 7 %3 M a r y l a n d 4 6 %4 U t a h 4 6 %5 New Hampshire 4 1 %
U.S. Av e r a ge2 0 3 1 %
S o u r c e : Cyber Dialogue, December 1998 data.
ONLINE POPULATION
The percentage of adults with Internet access in each state.
“By 2003, well over half of American households are
expected to be online.”
INDICATORSTHE DIGITAL ECONOMY

2 6 S TAT E N E W E C O N O M Y I N D E X
INDICATORSTHE DIGITAL ECONOMY
COMMERCIAL INTERNET DOMAIN NAMES
The number of commercial Internet domain names (“.com”) per firm.
Why Is This Important? The New Economy is not just aboutthe hippest, high-flying Internet firms in Silicon Va l l e y. It’s alsoabout all of the ways companies everywhere are putting computersand information technology to work. One way to quantify that is tolook at the number of companies that have created a presence forthemselves on the World Wide Web. Probably the most eff e c t i v emeasure is the number of “.com” domain names registered in eachstate.21 An Internet domain is an organization’s unique name com-bined with a “top level” domain designation such as “.com,” “.org , ”or “.edu,” denoting commercial sites, non-profit organizations, oreducational or re s e a rch organizations, re s p e c t i v e l y. According tothe most recent data, there are some 2,228,000 “.com” domainnames registered in the United States.
The Rankings: The number of “.com” domains re g i s t e red perf i rm varies significantly from state to state. The highest-ranking state,Nevada, has almost six times more than the lowest-ranking state,Mississippi. Nevada’s first place finish could well be a dubiousdistinction: it may be attributable to a large number of gamblingand pornographic sites. But most of the other top finishers, includ-ing California, Massachusetts, Utah, Colorado, Vi rginia, andWashington, are among the most high-tech states by almost anym e a s u re .
The top five: “.com” domains per firm:
1 N e v a d a . 4 62 C a l i f o rn i a . 4 53 M a s s a c h u s e t t s . 3 54 A r i z o n a . 3 45 U t a h . 3 2
U.S. Av e r a g e . 2 6
S o u r c e : Anthony Townsend, Department of Urban Studiesand Planning, Massachusetts Institute of Te c h n o l o g y. 1999 data.
“The New Economy is about theways companies everywhere areputting computers and information
technology to work.”
10 0 th–76th Perc e n t i l e
7 5 th – 51st Perc e n t i l e
5 0 th–26th Perc e n t i l e
2 5 th–1st Perc e n t i l e
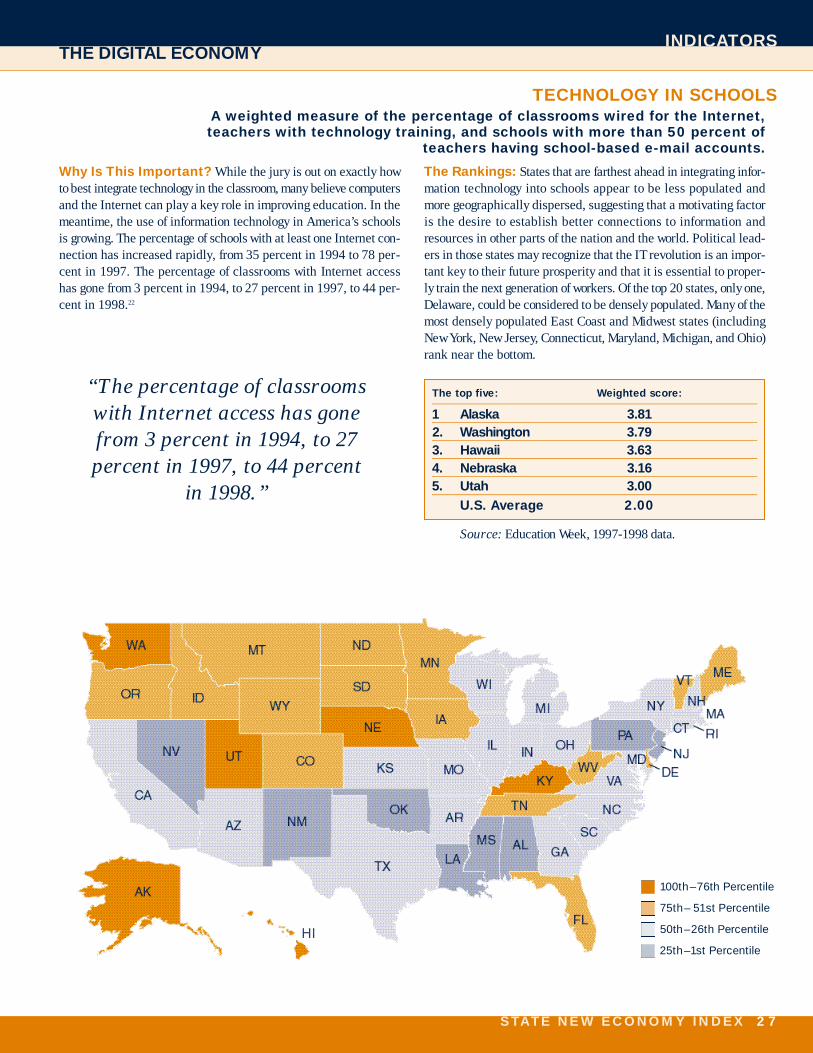
10 0 th–76th Perc e n t i l e
7 5 th– 51st Perc e n t i l e
5 0 th–26th Perc e n t i l e
2 5 th–1st Perc e n t i l e
S TAT E N E W E C O N O M Y I N D E X 2 7
Why Is This Important? While the jury is out on exactly howto best integrate technology in the classroom, many believe computersand the Internet can play a key role in improving education. In themeantime, the use of information technology in America’s schoolsis growing. The percentage of schools with at least one Internet con-nection has increased rapidly, from 35 percent in 1994 to 78 per-cent in 1997. The percentage of classrooms with Internet accesshas gone from 3 percent in 1994, to 27 percent in 1997, to 44 per-cent in 1998.22
The Rankings: States that are farthest ahead in integrating infor-mation technology into schools appear to be less populated andmore geographically dispersed, suggesting that a motivating factoris the desire to establish better connections to information andresources in other parts of the nation and the world. Political lead-ers in those states may recognize that the IT revolution is an impor-tant key to their future prosperity and that it is essential to proper-ly train the next generation of workers. Of the top 20 states, only one,D e l a w a re, could be considered to be densely populated. Many of themost densely populated East Coast and Midwest states (includingNew York, New Jersey, Connecticut, Maryland, Michigan, and Ohio)rank near the bottom.
The top five: Weighted score :
1 A l a s k a 3 . 8 12 . Wa s h i n g t o n 3 . 7 93 . H a w a i i 3 . 6 34 . N e b r a s k a 3 . 1 65 . U t a h 3 . 0 0
U.S. Av e r a g e 2 . 0 0
S o u r c e : Education Week, 1997-1998 data.
TECHNOLOGY IN SCHOOLSA weighted measure of the percentage of classrooms wired for the Internet,teachers with technology training, and schools with more than 50 percent of
teachers having school-based e-mail accounts.
INDICATORSTHE DIGITAL ECONOMY
“The percentage of classroomswith Internet access has gonefrom 3 percent in 1994, to 27 percent in 1997, to 44 percent
in 1998.”
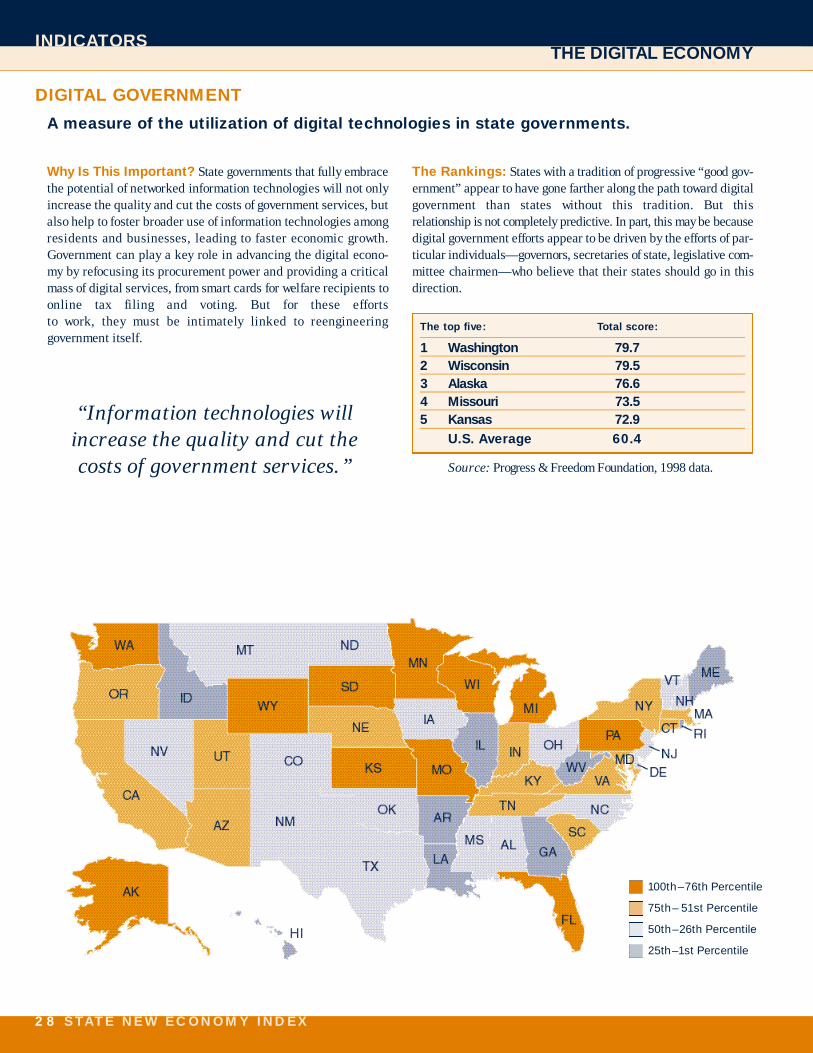
2 8 S TAT E N E W E C O N O M Y I N D E X
INDICATORSTHE DIGITAL ECONOMY
DIGITAL GOVERNMENT
A measure of the utilization of digital technologies in state govern m e n t s .
Why Is This Important? State governments that fully embracethe potential of networked information technologies will not onlyi n c rease the quality and cut the costs of government services, butalso help to foster broader use of information technologies amongresidents and businesses, leading to faster economic gro w t h .G o v e rnment can play a key role in advancing the digital econo-my by refocusing its pro c u rement power and providing a criticalmass of digital services, from smart cards for welfare recipients toonline tax filing and voting. But for these eff o rts to work, they must be intimately linked to reengineering g o v e rnment itself.
The Rankings: States with a tradition of pro g ressive “good gov-ernment” appear to have gone farther along the path toward digitalg o v e rnment than states without this tradition. But this relationship is not completely predictive. In part, this may be becausedigital government efforts appear to be driven by the efforts of par-ticular individuals—governors, secretaries of state, legislative com-mittee chairmen—who believe that their states should go in thisdirection.
The top five: Total score :
1 Wa s h i n g t o n 7 9 . 72 W i s c o n s i n 7 9 . 53 A l a s k a 7 6 . 64 M i s s o u r i 7 3 . 55 K a n s a s 7 2 . 9
U.S. Av e r a g e 6 0 . 4
S o u r c e : P ro g ress & Freedom Foundation, 1998 data.
“Information technologies willincrease the quality and cut thecosts of government services.”
10 0 th–76th Perc e n t i l e
7 5 th– 51st Perc e n t i l e
5 0 th–26th Perc e n t i l e
2 5 th–1st Perc e n t i l e
S TAT E N E W E C O N O M Y I N D E X 2 9
INDICATORSSECTION NAME
INDICATORSTHE DIGITAL ECONOMY
The U.S. economy is in the midst of the transformation from an indus-trial to a digital economy, in which an increasing share of econom-ic functions will be conducted electronically and traditional paperand face-to-face transactions will become less frequent. This trans-f o rmation is leading to significantly increased economic eff i c i e n-cies, which in turn are reversing the nearly three-decades-old slow-down in productivity and wage growth.
This revolution is not only transforming many industries — partic-ularly those focused on information processing or consumer trans-actions — it is also transforming governments. Many states andlocalities provide information online for everything from zoning andbuilding permit regulations to the times that government offices areopen. But an increasing share have taken the next step: providing gov-e rnment services electro n i c a l l y. The state of Washington allows indi-viduals to renew professional licenses online. Utah is about to allowall court documents to be filed over the Internet. Massachusetts letscitizens renew their drivers’ licenses online. Georgia residents canapply for boating, fishing, or hunting licenses over the Net.
But the potential for digital government has only begun to be explore d .Within a few years, citizens in many states will be able to pay taxes,file re g u l a t o ry documents, pay parking tickets, conduct title searc h-es, communicate with their childre n ’s teachers and check home-work assignments, take courses, and even vote online. Businesseswill be able to file all taxes electro n i c a l l y, submit permit and re g-u l a t o ry information in an integrated way online, and even start anew business by filling out only one electronic form. Govern m e n tworkers will be able to use technology to enable them to do their jobsb e t t e r, faster, and cheaper. For example, police will be able to secure-ly log into court sites to find out when they must appear in court, whilesocial workers will be able to file reports and access files remotely.
State and local governments need to embrace digital govern-ment for several reasons. First, digital government will give cit-izens and businesses more reasons to get online and use digi-tal technologies, thus broadening and deepening the IT re v o l u-tion. Second, governments can use digital technologies to dra-matically cut their costs, while increasing the quality of theirs e rvices. Online ordering and filing can cut the costs to gov-e rnment by over 90 percent compared to in-person methods.For example, filing court documents electronically eliminates thetime and money spent by court clerks entering and coding doc-uments. It also cuts storage costs, as evidenced by the fact thatone Utah court alone spends over $1 million per year just tos t o re paper documents.
Most import a n t l y, citizens will benefit by access to higher qualitys e rvices and greater accessability (24 /7 government services). Studieshave found that citizens prefer filing applications online than doingit in person or by mail. Just as consumers now expect "on-my-sched-ule" service from business, they will expect the same performancef rom government. Instead of creating one-stop government, the ITrevolution enables n o n-stop government, where people can access gov-ernment from anywhere, at anytime.
In addition, digital governments would be able to pass the savingsalong to citizens in the form of lower taxes, rebates, and discounts.F i n a l l y, digital government initiatives can improve access and trans-p a rency of government, giving citizens greater sense of ownership andp a rt i c i p a t i o n .
The technology exists today to fundamentally transform much of thebusiness of state and local government. It is really only a matter ofgovernments rising to the challenge. Transforming bricks-and-mor-tar government into digital government re q u i res a vision of what gov-ernment can be, and a willingness to innovate and take risks.
To really promote digital government, state and local governmentsneed to embrace to the following principles:
1) Think customer, not government agency. Digital govern m e n tis all about being customer-focused. Too often, public agencieso rganize services and programs according a political or b u reaucratic logic. In contrast, the Internet enables the seamlessintegration of government services organized around what citizens need.
2) Focus on digital transactions between citizens and govern-m e n t . Net-enabled government services should be a key driverin government reengineering efforts.
3) Pass savings on to citizens by offering rebates or discountsfor interacting with government electronically. Digital g o v e rnment can generate significant savings for government, and in order to encourage citizens to use these low-cost systems, government should pass some of the savings back to them.
4 ) Invest money now to save money tomorrow. Elected o ff i-cials and agency heads often view spending on digital govern m e n tas simply one more item competing with others for limited funds.In fact, because they cut costs, expenditures on digital govern m e n tusually pay for themselves in relatively short periods of time.
Digital Government: Driving the Next Generation of Reinventing Govern m e n t
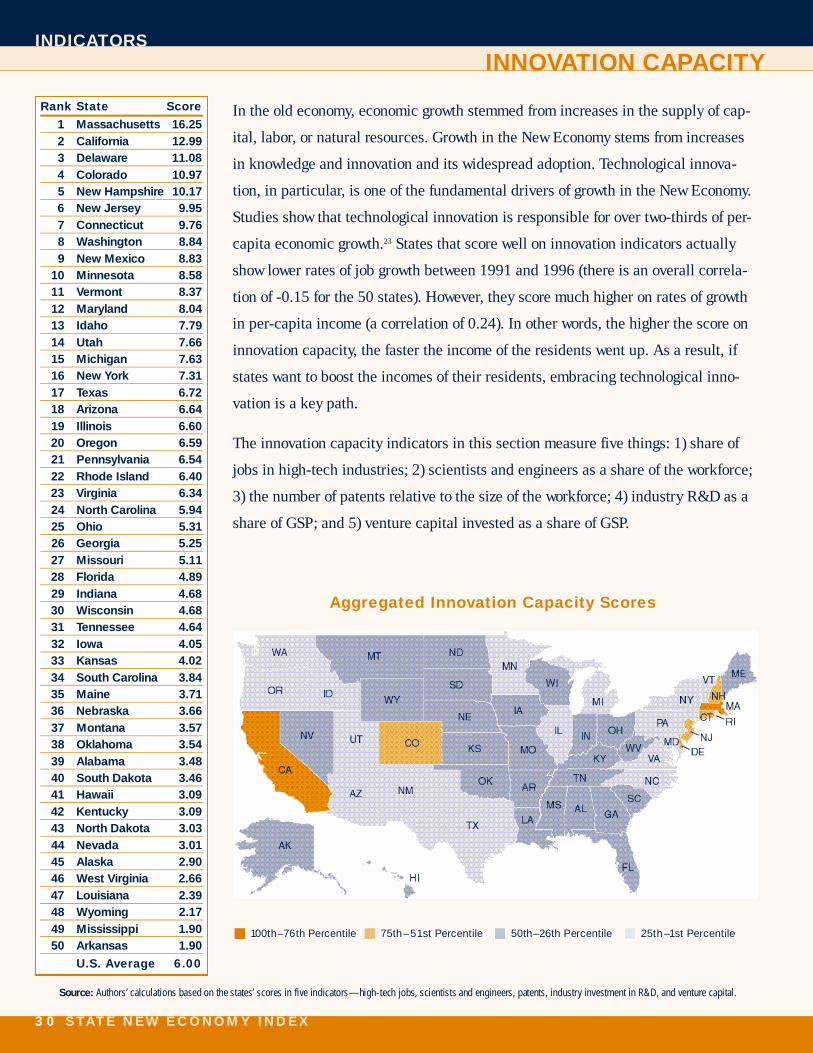
3 0 S TAT E N E W E C O N O M Y I N D E X
INDICATORSI N N O VATION CAPACITY
In the old economy, economic growth stemmed from increases in the supply of cap-
ital, labor, or natural resources. Growth in the New Economy stems from increases
in knowledge and innovation and its widespread adoption. Technological innova-
tion, in particular, is one of the fundamental drivers of growth in the New Economy.
Studies show that technological innovation is responsible for over two-thirds of per-
capita economic growth.23 States that score well on innovation indicators actually
show lower rates of job growth between 1991 and 1996 (there is an overall correla-
tion of -0.15 for the 50 states). However, they score much higher on rates of growth
in per-capita income (a correlation of 0.24). In other words, the higher the score on
innovation capacity, the faster the income of the residents went up. As a result, if
states want to boost the incomes of their residents, embracing technological inno-
vation is a key path.
The innovation capacity indicators in this section measure five things: 1) share of
jobs in high-tech industries; 2) scientists and engineers as a share of the workforce;
3) the number of patents relative to the size of the workforce; 4) industry R&D as a
share of GSP; and 5) venture capital invested as a share of GSP.
Aggregated Innovation Capacity Scores
Rank State Score
1 Massachusetts 16.252 California 12.993 Delaware 11.084 Colorado 10.975 New Hampshire 10.176 New Jersey 9.957 Connecticut 9.768 Washington 8.849 New Mexico 8.83
10 Minnesota 8.5811 Vermont 8.3712 Maryland 8.0413 Idaho 7.7914 Utah 7.6615 Michigan 7.6316 New York 7.3117 Texas 6.7218 Arizona 6.6419 Illinois 6.6020 Oregon 6.5921 Pennsylvania 6.5422 Rhode Island 6.4023 Virginia 6.3424 North Carolina 5.9425 Ohio 5.3126 Georgia 5.2527 Missouri 5.1128 Florida 4.8929 Indiana 4.6830 Wisconsin 4.6831 Tennessee 4.6432 Iowa 4.0533 Kansas 4.0234 South Carolina 3.8435 Maine 3.7136 Nebraska 3.6637 Montana 3.5738 Oklahoma 3.5439 Alabama 3.4840 South Dakota 3.4641 Hawaii 3.0942 Kentucky 3.0943 North Dakota 3.0344 Nevada 3.0145 Alaska 2.9046 West Virginia 2.6647 Louisiana 2.3948 Wyoming 2.1749 Mississippi 1.9050 Arkansas 1.90
U.S. Average 6.00
10 0 th–76th Perc e n t i l e 7 5 th– 51st Perc e n t i l e 5 0 th–26th Perc e n t i l e 2 5 th–1st Perc e n t i l e
S o u r c e : Authors’ calculations based on the states’ scores in five indicators—high-tech jobs, scientists and engineers, patents, industry investment in R&D, and venture capital.
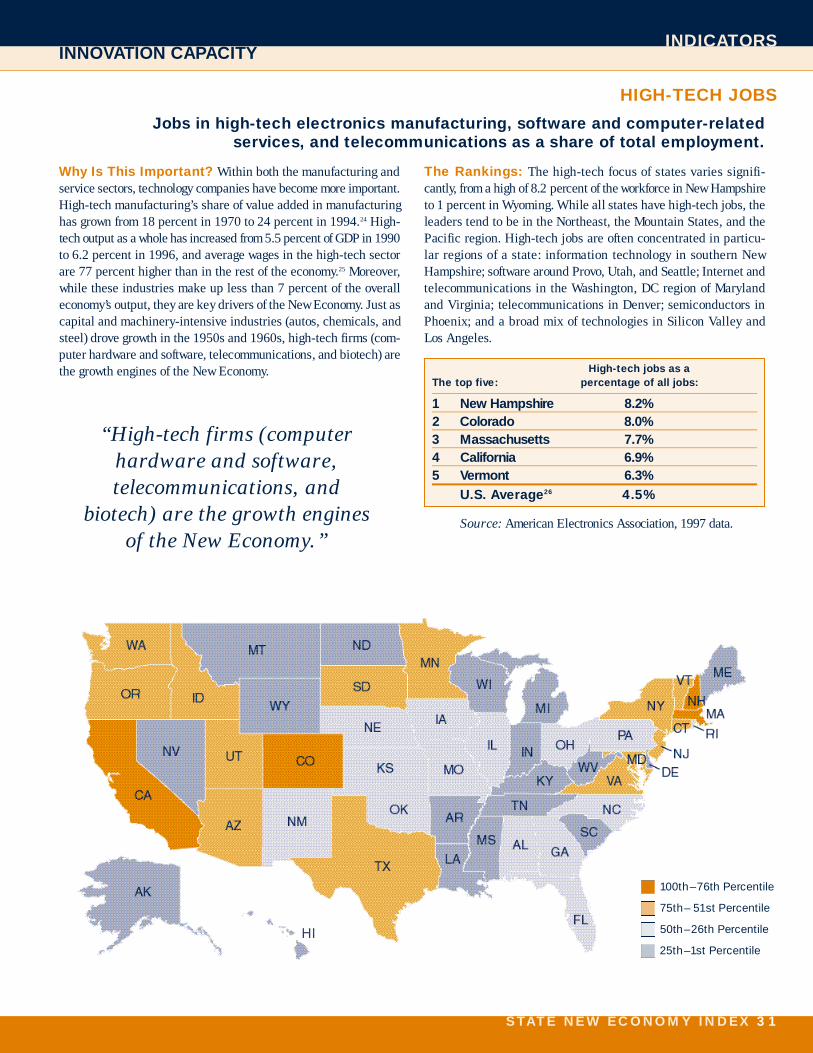
S TAT E N E W E C O N O M Y I N D E X 3 1
INDICATORSINNOVATION CAPACITY
HIGH-TECH JOBS
Jobs in high-tech electronics manufacturing, software and computer- related s e rvices, and telecommunications as a share of total employment.
Why Is This Important? Within both the manufacturing ands e rvice sectors, technology companies have become more import a n t .High-tech manufacturing’s share of value added in manufacturinghas grown from 18 percent in 1970 to 24 percent in 1994.24 High-tech output as a whole has increased from 5.5 percent of GDP in 1990to 6.2 percent in 1996, and average wages in the high-tech sectorare 77 percent higher than in the rest of the economy.25 Moreover,while these industries make up less than 7 percent of the overalle c o n o m y ’s output, they are key drivers of the New Economy. Just ascapital and machinery-intensive industries (autos, chemicals, andsteel) drove growth in the 1950s and 1960s, high-tech firms (com-puter hard w a re and software, telecommunications, and biotech) arethe growth engines of the New Economy.
The Rankings: The high-tech focus of states varies signifi-c a n t l y, from a high of 8.2 percent of the workforce in New Hampshireto 1 percent in Wyoming. While all states have high-tech jobs, theleaders tend to be in the Northeast, the Mountain States, and thePacific region. High-tech jobs are often concentrated in part i c u-lar regions of a state: information technology in southern NewH a m p s h i re; software around Provo, Utah, and Seattle; Internet andtelecommunications in the Washington, DC region of Mary l a n dand Vi rginia; telecommunications in Denver; semiconductors inPhoenix; and a broad mix of technologies in Silicon Valley andLos Angeles.
High-tech jobs as aThe top five: p e rcentage of all jobs:
1 New Hampshire 8 . 2 %2 C o l o r a d o 8 . 0 %3 M a s s a c h u s e t t s 7 . 7 %4 C a l i f o rn i a 6 . 9 %5 Ve r m o n t 6 . 3 %
U.S. Av e r a g e2 6 4 . 5 %
S o u r c e : American Electronics Association, 1997 data.
10 0 th–76th Perc e n t i l e
7 5 th– 51st Perc e n t i l e
5 0 th–26th Perc e n t i l e
2 5 th–1st Perc e n t i l e
“High-tech firms (computerhardware and software, telecommunications, and
biotech) are the growth enginesof the New Economy.”
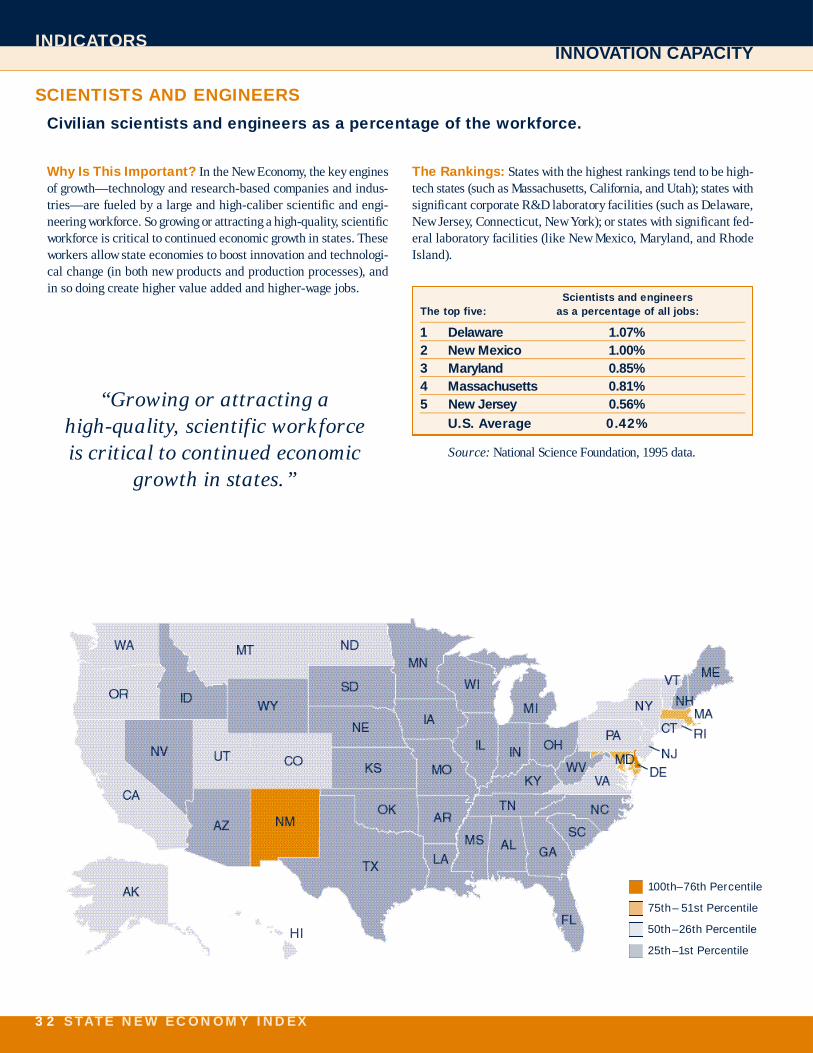
3 2 S TAT E N E W E C O N O M Y I N D E X
INDICATORSINNOVATION CAPACITY
SCIENTISTS AND ENGINEERS
Civilian scientists and engineers as a percentage of the workforce.
Why Is This Important? In the New Economy, the key enginesof growth—technology and research-based companies and indus-tries—are fueled by a large and high-caliber scientific and engi-neering workforce. So growing or attracting a high-quality, scientificw o r k f o rce is critical to continued economic growth in states. Theseworkers allow state economies to boost innovation and technologi-cal change (in both new products and production processes), andin so doing create higher value added and higher-wage jobs.
The Rankings: States with the highest rankings tend to be high-tech states (such as Massachusetts, California, and Utah); states withsignificant corporate R&D laboratory facilities (such as Delaware ,New Jersey, Connecticut, New York); or states with significant fed-eral laboratory facilities (like New Mexico, Maryland, and RhodeI s l a n d ) .
Scientists and engineers The top five: as a percentage of all jobs:
1 D e l a w a re 1 . 0 7 %2 New Mexico 1 . 0 0 %3 M a r y l a n d 0 . 8 5 %4 M a s s a c h u s e t t s 0 . 8 1 %5 New Jersey 0 . 5 6 %
U.S. Av e r a g e 0 . 4 2 %
S o u r c e : National Science Foundation, 1995 data.
“Growing or attracting a high-quality, scientific workforceis critical to continued economic
growth in states.”
10 0 th–76th Perc e n t i l e
7 5 th– 51st Perc e n t i l e
5 0 th–26th Perc e n t i l e
2 5 th–1st Perc e n t i l e

10 0 th–76th Perc e n t i l e
7 5 th– 51st Perc e n t i l e
5 0 th–26th Perc e n t i l e
2 5 th–1st Perc e n t i l e
S TAT E N E W E C O N O M Y I N D E X 3 3
INDICATORSINNOVATION CAPACITY
PATENTS
The number of patents issued to companies or individuals per 1,000 workers.
Why Is This Important? The capacity of firms to develop newp roducts will determine their competitive advantage and abilityto pay higher wages. One indicator of the rate of new product inno-vation is the number of patents issued. As technological innova-tion has become more important, the number of patents issued peryear in the United States has grown from 58,000 in 1984 to over110,000 in 1995.
The Rankings: States with an above-average share of high-tech jobs—and states where these jobs are in either corporate headquarters or R&D labs, as opposed to pro d u c t i o nfacilities—tend to use the highest numbers of patents. TheN o rt h e a s t e rn states lead the nation, partly because of DuPont,in Delaware .
The top five: Patents per 1,000 workers:
1 D e l a w a re 1 . 1 22 C o n n e c t i c u t 0 . 8 83 Ve r m o n t 0 . 8 64 M a s s a c h u s e t t s 0 . 8 35 New Jersey 0 . 8 1
U.S. Av e r a g e 0 . 4 8
S o u r c e : U.S. Patent and Trademark Office, 1996-1997 data.
“Patents issued per year in theUnited States have increasedfrom 58,000 in 1984 to over
110,000 in 1995.”

3 4 S TAT E N E W E C ON O M Y I N D E X
INDICATORSINNOVATION CAPACITY
INDUSTRY INVESTMENT IN R&D
Private sector investment in re s e a rch and development as a share of Gross State Product.
10 0 th–76th Perc e n t i l e
7 5 th– 51st Perc e n t i l e
5 0 th–26th Perc e n t i l e
2 5 th–1st Perc e n t i l e
Why Is This Important? Research and development (R&D),which yields new product innovations and adds to the knowledgebase of industry and the marketplace as a whole, is a key driver ofeconomic growth. Business provides more than two-thirds of allR&D funding. After steadily rising in the 1980s, and falling in theearly 1990s, business-funded R&D as a share of GDP has recent-ly resumed its upward climb, reaching its highest levels ever in1997. However, most of that growth is in funding for development,with basic and applied research increasing little.
The Rankings: Michigan leads the nation in corporate R&D—with well over twice the national average—much of which isa u t o m o b i l e - related. In general, the states that are ranked the high-est tend to be either high-tech states (such as Massachusetts,C a l i f o rnia, or Washington); states with significant corporate R&Dl a b o r a t o ry facilities (like Michigan, Delaware, New Jersey, andConnecticut); or states with significant federal laboratory facili-ties (as in New Mexico, Idaho, and Rhode Island), which may fur-ther stimulate corporate R&D.
The top five: R&D as a percentage of GSP:
1 M i c h i g a n 4 . 9 %2 D e l a w a re 4 . 0 %3 M a s s a c h u s e t t s 3 . 8 %4 New Mexico 3 . 6 %5 C o n n e c t i c u t 3 . 3 %
U.S. Av e r a g e 1 . 8 %
S o u r c e : National Science Foundation, 1995 data.
“Research and development is a key driver of economic
and income growth.”

S TAT E N E W E C O N O M Y I N D E X 3 5
INDICATORS INNOVATION CAPACITY
VENTURE CAPITAL
Ve n t u re capital invested as a percentage of Gross State Product.
10 0 th–76th Perc e n t i l e
7 5 th– 51st Perc e n t i l e
5 0 th–26th Perc e n t i l e
2 5 th–1st Perc e n t i l e
Why Is This Important? In relative terms, venture capital(funds invested in new and unproven businesses) amounts to a smalls h a re of the overall capital markets, but its value goes beyond asimple dollar figure. Ve n t u re capital spurs growth at the criticalearly stages of growing companies’ development. More o v e r, ven-ture capitalists don’t just throw their money at startup companieshoping to get lucky and pick a winner. They become involved asb o a rd members and management advisors, suggesting strategicpartnerships, and helping to refine business plans. And venture-based companies are a key source of job growth—employment inv e n t u re-backed companies increased 34 percent annually between1991 and 1995, while employment in Fortune 500 companiesdeclined 3.6 percent. In the nation as a whole, venture capitalinvestments have increased from an average of $6 billion in theearly 1980s to $12 billion in 1997 (in constant 1992 dollars), andf rom 0.10 percent to 0.16 percent of GDP. In 1997, it was disbursedto some 2,485 companies, five times more than in 1980.27
The Rankings: Venture capital investments are highly concen-trated in a few states, particularly states with strong university engi-neering and science programs and an existing base of high-techcompanies, both of which can be the source of many entre p re n e u r i a ls t a rt-ups or spinoffs. But as venture capital investments haveincreased, even middle-ranking states obtain significant amountsof venture capital.
The top five: Ve n t u re capital as percentage of GSP:
1 M a s s a c h u s e t t s 0 . 6 2 %2 C a l i f o rn i a 0 . 5 0 %3 C o l o r a d o 0 . 3 4 %4 New Hampshire 0 . 2 9 %5 Wa s h i n g t o n 0 . 2 4 %
U.S. Av e r a g e 0 . 1 7 %
S o u r c e : P r i c e w a t e rhouse Coopers LLP, 1997 data.
“Employment in venture-backed companies increased 34 percent annually between 1991 and 1995, while employment
in Fortune 500 companies declined 3.6 percent.”
3 6 S TAT E N E W E C O N O M Y I N D E X
ECONOMIC DEVELOPMENT STRATEGIES FOR THE NEW ECONOMY
In the New Economy, the ticket to faster and broader incomeg rowth is innovation. The New Economy puts a premium onwhat Nobel Laureate economist Douglas North calls “adap-
tive eff i c i e n c y,” which refers to the ability of institutions to inno-vate, continuously learn, and productively change. As marketsfragment, technology accelerates, and competition comes fro munexpected places, learning, cre a t i v i t y, and adaptation havebecome the principal sources of competitive advantage in manyindustries. Enabling constant innovation needs to become the goalof all organizations committed to prospering. Similarly, the goal forstates must be to foster innovation and adaptation—in infra-s t ru c t u re, in institutions, and on the part of individuals.
These efforts need to be proactive and designed for the long-term.States need to challenge all economic sectors and institutions,including their own institutions of government, to become culturesof innovation. The consequences for any state that does not re s p o n dto this challenge are low pro d u c t i v i t y, stagnant living standard s ,and reduced opportunity for its citizens.
Innovation and change mean uncertainty and disruption. But it isbecoming increasingly clear that dynamism is critical to gro w t h .( You can’t have upward mobility if no one is on the move.) The morec h u rning in a state, in terms of new business start-ups and existingbusiness failures, the faster the state’s rate of economic growth. Infact, of all of the indicators in this re p o rt, churn is the second-most-strongly correlated with state employment growth (behind jobs ingazelle companies). This means that states need to promote changeand innovation, not retard it.
In this New Economy, traditional rationales and goals for eco-nomic development need to give way to new ones. With thenational unemployment rate at a 30-year low of around 4 perc e n t ,and the highest unemployment rate of any individual state at6.6 percent (West Vi rginia), job creation is at least temporarilyno longer job one.
The challenge now is to create a pro g ressive economic policy frame-work that will encourage a new era of higher per-capita incomeg rowth, while promoting and enabling a broad-based prosperity thatproduces the widest possible winners’ circle.
Despite recent strong gains (over 2 percent per year for the last twoyears), productivity and per-capita income growth have each bare-ly exceeded 1 percent per year over the last 25 years—their lowestlevels in a half century.2 8 M o re o v e r, income growth has been unequal:while well-paying jobs increased by 20 percent in the last 10 years,moderate wage jobs did not gro w, and low-wage jobs grew 10 perc e n t .In addition, growth has been geographically uneven in many states,
with innovation-oriented, knowledge jobs concentrating in a fewm e t ropolitan areas, while other areas often languish. The re c e n ts t rong productivity gains and wage growth across all income gro u p sa re welcome news, but states need to ensure that the trend contin-ues well into the 21st century.
To achieve these new goals, states will need to overhaul their famil-iar approaches to economic development. In the old economy, fixedassets, financing, and labor were the principle sources of compet-itive advantage for firms. That’s why states focused on physicali n f r a s t ru c t u re for factories, gap financing for big industrial pro j-ects, and marketing and incentives to attract industry. But follow-ing a low cost, industrial recruitment strategy—cutting taxes andservices in hopes of making a state attractive to companies—is nolonger the path to raising wages and quality of life.
In the New Economy, states need to shift their focus from “huntingand gathering” (industrial recruitment) to “gardening” (promotinggrowth from within).
To m o rro w ’s jobs will come from fast-growing entre p reneurial firm s ,and not from the small number of business relocations. States thati g n o re entre p reneurial growth in favor of expensive zero - s u mindustrial re c ruitment will do so at their own peril. A case in pointis Iowa, which in the early 1980s chose not to provide a loan andbusiness assistance to Ted Waitt, a twenty-something fledglinge n t re p reneur seeking to start a new firm, since his was not a larg ef i rm nor a big industrial re c ruitment prospect. Waitt, who had anidea of selling computers by mail ord e r, stayed in the same met-ropolitan area, but went just across the state border to SouthDakota, which was more than happy to help him grow his company.To d a y, that company, Gateway, is one of the largest employers inSouth Dakota.
U n f o rt u n a t e l y, many states continue to pursue Industrial Ageeconomic development strategies that seek to attract out-of-stateinvestments through corporate tax subsidies, abatements, andassurances of low labor costs. To make matters even worse, manystates subsidize companies that pay very low wages. These strate-gies are increasingly out of touch with the factors that constitutesuccess in the New Economy: good public education, an R&Di n f r a s t ru c t u re, availability of job-specific skills training, qual-ity of life, quality government, and innovative economic devel-opment eff o rts. This is not to say that fiscal discipline should notbe a cornerstone of government in the New Economy. But lowcosts with a poor quality of life are not the tickets to success.
Rather than simply trying to cut costs, pass out incentives, or re a c tto each new economic gyration, states should instead invest in the
3 6 S TAT E N E W E C O N O M Y I N D E X

ECONOMIC DEVELOPMENT STRATEGIES FOR THE NEW ECONOMY
S TAT E N E W E C O N O M Y I N D E X 3 7
foundation areas for growth in the New Economy. A pro g re s s i v e ,innovation-oriented state policy framework for this New Economyshould rest on five pillars: 1) Co-investment in the skills of thew o r k f o r c e ; 2) Co-investment in an infrastructure for innova-tion; 3) Reinvention—and digitization—state and local gov-ernments; 4) Foster the growth of the digital economy, and 5)Foster civic collaboration.
CO-INVEST IN THE SKILLSOF THE WORKFORCE
Lack of pro g ress in education is cause for concern. Nationwide,K-12 perf o rmance has simply failed to keep up with the pre s s-ing need for a skilled workforce—in spite of continued incre a s-es in spending.2 9 And industry has cut back its expenditures ont r a i n i n g .3 0 States need to adopt policies to ensure that Americancompanies have the skilled workers they need to be pro d u c t i v e ,while simultaneously ensuring that American workers have theskills they need to navigate, adapt, and prosper in the NewE c o n o m y. States can do several things to improve K-12 per-f o rmance and foster skills of the workforc e :
Hold all students to high standards. S t a n d a rd s - b a s e dK-12 re f o rm is already bearing fruit in many states. States thathave adopted rigorous standards and are assessing pro g re s sagainst them have seen significant increases in school perf o rm-ance, especially among underprivileged students. Part i c u l a r l yn o t e w o rthy are Kentucky, North Carolina, and Texas, which haveall made considerable pro g ress as a result of standard s - b a s e dre f o rm. High standards and meaningful assessments mean re a laccountability for school systems, administrators, teachers, ands t u d e n t s .
Adopt sensible public school choice policies. C h a rt e rschools, inter-district public school choice, and open enro l l m e n ta re all tools that states are using to stimulate competition, givep a rents options, and raise the quality of public schools. Therea re charter school laws on the books in 34 states and the Districtof Columbia, and more than 1,100 charter schools are in opera-tion nationwide. Public school choice—with real and meaning-ful choices for parents—is critical to improving schools.
Overhaul antiquated K-12 public school fundingsystems. Public school choice and high standards will be mean-ingless if re s o u rce allocation isn’t modernized. The reliance onthe pro p e rty tax to fund schools results in gross inequities betweena ffluent and impoverished communities, and is part i c u l a r l yinequitable to rural areas. Curre n t l y, 17 states have school financelitigation in their courts and are wrestling with changing their
finance stru c t u res. In addition, eight states, including Te x a s ,Arizona, and Arkansas, have overhauled their systems in the pastt h ree years. Money alone will not solve educational pro b l e m s ;h o w e v e r, neither will a lack of re s o u rces. In addition, outmodedfunding systems hamstring charter schools and eff o rts to incre a s epublic school choice.
Provide incentives for the creation of math and sciencecharter high schools specifically focused on serving disadvantaged students. K-12 education needs to give studentsthe math and science skills they need to succeed in the NewEconomy. In the last 15 years, states such as North Carolina andIllinois have established math and science magnet high schools, butthese schools have generally not focused on disadvantaged stu-dents. If states are to encourage students—including minority stu-dents—that have not traditionally gone into science and engineer-ing fields, they need to target their efforts.
Co-invest in industry-led regional skills alliances. Anumber of states, including Pennsylvania, Rhode Island, andWisconsin, are shifting the focus of workforce training eff o rts tos u p p o rt industry-led skills alliances. For example, as part of theWisconsin Regional Training Partnership, a number of metal-working firms, in conjunction with the AFL-CIO, used an aban-doned mill building to set up a teaching factory to train workerswith needed skills. In order to jump start and add to the scale ofthese eff o rts, the Pro g ressive Policy Institute has proposed thatthe federal government provide matching funds for industry - l e dregional skills alliances (RSAs). Bipartisan legislation has beeni n t roduced in Congress, and as part of the Administration’s “Life-Long Learning” agenda, Vice President Gore recently announceda proposal to commit up to $60 million in the FY 2000 budget top romote RSAs.3 1 States should play active roles in the creation andco-funding of these alliances.
Rationalize programs funded under the 1998 Wo r k f o r c eInvestment Partnership Act to create one-stop shopsfor all employment and training services. The Act givesstates significant authority to craft comprehensive workforc edevelopment systems. But states must make these programs asu s e r-friendly as possible. States should consolidate the welfare -to-work systems now being created so they do not end up with twoseparate bureaucracies focused on training disadvantaged work-ers. States should also take advantage of the authority grantedin the Act to provide training and re-employment vouchers toindividuals in need of services, and the vouchers should be cou-pled with “consumer re p o rt cards” to track the perf o rmance oftraining pro v i d e r s .

3 8 S TAT E N E W E C O N O M Y I N D E X
ECONOMIC DEVELOPMENT STRATEGIES FOR THE NEW ECONOMY
Increase scholarships for students attending public orprivate technical schools. A number of states have intro-duced legislation to address businesses’ needs for more techni-cally skilled workers by having the state pick up the students’ tabfor community college tuition and technical training. Govern o r sin at least 16 states have proposed establishing, increasing, orexpanding scholarship programs this year. For example, a billi n t roduced in the Michigan Senate would provide a $300 state taxc redit to cover the balance of a student’s Michigan community col-lege tuition that is not covered by the federal Hope Scholarshiptax credit. The state tax credit would be available to all studentsf rom two-parent households with incomes under $100,000 and sin-g l e - p a rent families with less than $50,000 in annual income. InD e l a w a re, the House Education Committee unanimously appro v e da bill that would allow any Delaware student who graduates fro ma public or private high school with at least a 3.0 grade pointaverage to attend the Delaware Technical and Community Collegef ree for two years. Students must be accepted and enrolled as atechnology student.
CO-INVEST IN AN INFRASTRUCTUREFOR INNOVATION
Innovation drives growth in the New Economy. Tw o - t h i rds of per-capita economic growth stems from technological innovation.While states that score well on innovation indicators actuallyshowed lower rates of job growth between 1991 and 1996 (thereis an overall correlation of -0.15 for the 50 states), they score dmuch higher on rates of growth in per-capita income (a corre l a-tion of 0.24). In other words, the higher the score on innovationc a p a c i t y, the faster the incomes of the residents went up. As aresult, if states want to boost the incomes of their residents, embrac-ing technological innovation is a key path. And technology jobsa re not just in Silicon Va l l e y. In fact, the fastest growing high-tech areas of the country are places like Lancaster, Pennsylvania,and Boise, Idaho.
States can do several things to foster innovation, including:
Invest in higher education, particularly in scienceand engineering. The United States is not educating enoughscientists and engineers, particularly computer scientists andtechnical engineers. The number of students receiving bachelorof science degrees in engineering has fallen to a 17-year low.Between 1986 and 1998, they declined by 19.8 percent, while theoverall number of students receiving bachelor’s degrees incre a s e dby nearly 20 percent. Not only do investments in engineeringand science programs produce the type of knowledge-based work-f o rce that states need in order to pro s p e r, but strong science and
engineering departments are critical to fostering industry /university partnerships and commercializing technology.
Boost efforts to link industry, universities, and gov-ernment laboratories. All 50 states invest in initiatives to fos-ter collaborative R&D (through re s e a rch “centers of excellence,” for example). But state investments in these initiatives have increased little in the last 10 years as states have pursued more expensive—and often dubious—industrialrecruitment incentives.
Boost R&D tax credits, or create them if they don’texist. In 1996, 35 states off e red an R&D tax credit, but most weremodest, averaging less than 5 percent. At 22.5 percent, RhodeIsland has the highest rate in the nation. Studies show that the R&D tax credit is an effective way of stimulating private-sector R&D.32
Support the commercialization of innovation.I n c re a s i n g l y, states are focusing not just on fostering the devel-opment of new technologies, but on helping businesses to gro wby commercializing the technologies (developing, producing, andmarketing new products). States such as Oklahoma, Kansas,Florida, and North Dakota have all recently developed initiativessuch as commercialization centers or technology business assis-tance programs to help entre p reneurs commercialize technology.
Encourage “co-opetition.” Competition for market positionhas been increasing, but so has the frequency of collaborationamong competitors. In fact, management expert Peter Dru c k e rand others have suggested that the organizational dynamic of net-works, partnerships, and collaborative ventures is a main org a n-izing principle in the New Economy. This kind of coopetition, asH a rv a rd business professor Michael Porter and others have shown,is often regional (for example, optics in Rochester, Minnesota;f u rn i t u re in Tupelo, Mississippi; hosiery in western North Caro l i n a ;and information technology in Silicon Valley). As Berkeley pro-fessor AnnaLee Saxenian notes in Regional Advantage: A Studyof Boston’s Route 128 and Silicon Va l l e y, “Innovation is a collec-tive process as well as an individual one.”3 3 States should sup-p o rt all kinds of collaborative partnerships and networks by re o r i-enting their economic development and training programs to sup-p o rt regional industrial clusters. For example, Rhode Island’sSamuel Slater Innovation Fund provides matching funds to indus-t ry clusters focused on improving their competitive position.
S TAT E N E W E C O N O M Y I N D E X 3 9
ECONOMIC DEVELOPMENT STRATEGIES FOR THE NEW ECONOMY
PROMOTE INNOVATION- AND CUSTOMER-ORIENTED GOVERNMENT
States with the most innovative, customer-oriented institutions (busi-nesses, non-profits, and governments alike) will be the winners inthe New Economy. But current government organization in moststates has been borrowed from the mass production, hierarchicalmodel, tending to produce many (if not more) of the same rigidities,inefficiencies, quality problems, and customer dissatisfaction thatplague similarly stru c t u red businesses.3 4 If Industrial Age state gov-e rnments do not transform into Information Age governments, theywill impede rather than advance progress.
Old, managerial, command-and-control models don’t work anymorein business, and they don’t work in government either.3 5 D e v e l o p i n gc u s t o m e r-oriented government is important not just because it cutscosts, but also because it improves the quality of life in a state. Andboth are critical because states’ ability to retain and attract highlyeducated and skilled “knowledge workers” will help shape com-petitive success. In order to grow or attract the kinds of knowledge-based industries driving economic growth today, a state must firstbe attractive to these mobile, well-educated, knowledge workers.
States should:
Be on the forefront of providing government serviceso n l i n e. The motto “online, not in line” should guide statee ff o rts to use digital technologies. Digital government eff o rt ssimultaneously cut costs and improve services. For example,Massachusetts residents receive a $5 rebate when they re n e wtheir drivers’ licences online because of the cost savings ande fficiency gains for the Department of Motor Vehicles. But al a rge share of state government functions can be conductedonline. Every state’s Department of Administration shouldconduct a study of significant business-to-government or cit-i z e n - t o - g o v e rnment interactions and assess the potential forconducting those transactions electro n i c a l l y.
FOSTER THE TRANSFORMATIONTO A DIGITAL ECONOMY
As the Internet has mushroomed and the cost of computing andtelecommunications technologies continues to plummet, a digitaleconomy is beginning to emerge in the United States, with a sig-nificant share of business and government transactions starting tobe conducted through digital electronic means. The U.S. Interneteconomy was recently estimated to have generated some $300 bil-lion in revenue and to have supported over a million jobs in 1998.3 6
But if the digital economy is to reach its full potential, government
re g u l a t o ry, tax, and pro c u rement policies must be aimed first at nothindering and then, where possible, at proactively fostering thistransformation.
While the digital economy will be driven by the private sector, thereare a number of things states can do to foster its growth:
Work together to establish a uniform legal frameworkto encourage electronic commerce. Since the Intern e tknows no borders, it would be counterproductive for individualstates to create legislation affecting the Internet in isolation. Ofp a rticular concern are issues like spam (unsolicited commercial e-mail), business and professional licensing (for doctors, for example),and taxation. Another important issue is the use of digital signature s ,which allow individuals to authenticate themselves online. (Thereare currently more than 20 states with some kind of digital signa-ture law on the books or pending.) All of this legislation should beconsistent with model legislation created by the National Commissionon Uniform State Laws so that all states sign onto the same policyframework. Otherwise, the risk is a digital-era Tower of Babel with50 diff e rent sets of laws dictating how companies sell goods or pro-vide services over the Net. It is true that states have historicallyenjoyed a degree of autonomous authority over such matters of com-m e rce, but if they do not coordinate and establish a common frame-work for governing digital commerce, affected industries will right-ly go to Washington to press for federal preemption. One way oranother, the Internet will acquire uniform rules.
Ensure that laws and regulations do not harm thegrowth of the digital economy and the Internet. One ofthe first things states can do is examine their existing laws and re g-ulations and amend any that discriminate against electronic com-m e rce. But it will be just as important going forw a rd to avoid cre-ating new laws that will place a drag on the Internet economy. Forexample, states should not tax the use of the Internet itself—forexample, by imposing taxes on the fees consumers pay to Intern e tS e rvice Providers to access the Internet. In 1998, over 800 billsrelated to the Internet were introduced in the states, and over 500have been introduced so far in 1999. Some of these bills are care-fully crafted and well thought out, but many are not. Some Intern e t -related state legislation can be particularly counterpro d u c t i v e .For example:
• A proposed bill in New Jersey would let individuals sue theirI n t e rnet Service Providers (ISPs) for unsolicited commercial E-mail that other individuals or companies transmit over the ISP’sn e t w o r k .
4 0 S TAT E N E W E C O N O M Y I N D E X
ECONOMIC DEVELOPMENT STRATEGIES FOR THE NEW ECONOMY
• Tennessee is considering legislation that would make ISPs liablefor blocking access to specific web sites that post sexually-explic-it content not suitable for minors. The fact that most ISPs havecustomers in multiple states, and sometimes even countries, meansthat they would have to find some way to block some sites for somecustomers, and others for other customers.
The costs and confusion resulting from these types of laws can besignificant. Moreover, both measures would turn ISPs into Internetcops.
States need to resist pre s s u res from businesses and interest gro u p st h reatened by the Internet. These groups must not be allowed touse the power of government to protect themselves against eco-nomic change that benefits all consumers. Among recent examples:
• The Unauthorized Practice of Law Committee in Texas recent-ly won a ruling that could lead to a ban on the sale of QuickenFamily Lawyer, a software package that lets consumers createlegal forms such as wills and simple contracts without the helpof a lawyer.
• Wine distributors in many states have lobbied successfully forrulings making it illegal—a felony in some states—to buy wineover the Internet. In contrast, some states have made it legal tosell wine provided the buyers pay the sales tax and show proofof age when the item is delivered.
• In Washington, university faculty have protested against dis-tance learning online. More recently, the American Federationof Teachers began running ads opposing distance learning.
• State professional licensing requirements that do not recognizelicenses from other states limit the practice of tele-medicineand other kinds of online professional services.
In these and other cases, entrenched business and pro f e s s i o n a li n t e rests have raised barriers against new forms of commerce, andin so doing have effectively raised prices and reduced access forresidents in their state. States that facilitate this sort of entre n c h e dresistance are only impeding pro g ress for themselves and the nation.
Encourage faster deployment of broadband telecom-munications technologies. The lack of high bandwidth telecom-munications capacity, especially to the home, is a barrier to pro g re s sin the Information Age. State telecommunication regulations needto remove barriers to market-led investments in broadband infra-structure. One thing states can do to ensure this is avoid applyingthe existing telephone universal service regulations to the Internet
and broadband telecommunications. Applying this old economicframework would likely have the unintended effect of slowing downthe deployment of these technologies.
Support Internet access at public facilities. At least forthe next several years, most Americans will not have Internet accessat home. Yet, public access is currently limited. For example, onlyhalf of American libraries (47.9 percent) offer Internet access, whileonly 9.2 percent offer access in all their local branches. Ensuringthat places like libraries, schools, community centers, employmentcenters, and other public agencies (particularly those in lowerincome areas) provide sufficient free access to the Internet willenable all individuals to access these technologies.
Actively encourage widespread use of digital signatures.Individuals must be able to verify their identity online if there is everto be a truly robust digital economy. Digital signatures are an impor-tant part of the solution. But institutions cannot begin offering serv-ices that will require digital signatures (such as online loan appli-cations by banks) until a large number of citizens actually havedigital signatures. And yet a large number of people will not havedigital signatures until they need them for electronic transactions.States could play the critical role of solving this “chicken or egg”c o n u n d rum by enabling their Departments of Motor Vehicles tobegin issuing digital signature certificates to all citizens who chooseto apply for them. This is a similar to the function DMVs alreadyperform by issuing drivers’ licenses and state ID cards. Unlike inthose cases, however, DMVs should not monopolize the pro c e s s ;citizens should also be able to obtain digital certificates from private sector sources.37
FOSTER CIVIC COLLABORATION
In the New Economy, “an infrastructure for collaboration” is a keycomponent of success. As Harv a rd Business School Pro f e s s o rRosabeth Moss Kantor writes in her book World Class, “Politicsinvolves battles over distribution: who gets which slices of the pie.A community’s social infrastru c t u re, in contrast, offers the pro s p e c tfor expanding the pie. Yet, the social infrastructure (for collabora-tion) is too often neglected, allowing the area to remain fragment-ed and balkanized.”38
This social capital—the ability of people to work together for acommon purpose in groups and organizations—is a characteristicof successful regional economies around the world, from SiliconValley in California to the Emilia Romanga region in central Italy.These places have begun to work collectively and to see their com-petition as coming not from another part of the state, but from out-side the state or region.
S TAT E N E W E C O N O M Y I N D E X 4 1
INDICATORSECONOMIC DEVELOPMENT STRATEGIES FOR THE NEW ECONOMY
For example, Silicon Valley was so concerned that a growing “ c u l t u re of blame” was inhibiting collective problem solving that theregion created a partnership of business, government, and community-based organizations called “Joint Ve n t u re Silicon Va l l e y ”to collectively address issues standing in the way of the are a ’s futurep ro g ress. Numerous other regions and states, including San Diego,P i t t s b u rgh, Kansas, Indiana, and Rhode Island, have also devel-oped similar public-private councils to foster economic and com-munity development.
In the New Economy, the successful states and regions are the oneswith the most effective collaborative networks that craft and imple-ment innovative solutions to public policy questions, placing the pub-lic interest above a narrow interest in maintaining the status quo.
States should:
Form economic policy councils that bring together keyleaders in business, government, labor, civic groups,and higher education to provide in-depth analysis of the econ-o m y, develop creative economic strategies, and build widespread con-sensus for action.
Foster sub-state regional collaborative efforts thatbring all the parties to the table to collectively develop andimplement economic strategies for their regions.
SUMMARY
The New Economy is here to stay—there’s no going back. It bringse n o rmous potential for the growth of state economies, but also intro-duces challenges. If states do not invest in a knowledge infra-s t ru c t u re—world class education, training, and technology—com-panies will not have the skilled workers and cutting edge tools need-ed to grow and create well-paying jobs. If states erect barriers to thegrowth of the Internet and the digital economy instead of facilitat-ing it, the real incomes of their residents will ultimately suffer fro mlost growth potential. And if Industrial Age state governments do nottransform themselves into Information Age governments, they willimpede, rather than advance growth. Simply put, states that meetthe challenges of the New Economy—focusing on innovation, learn-ing, and constant adaption-will be the ones that succeed and pros-per.
4 2 S TAT E N E W E C O N O M Y I N D E X
DATA SOURCES
Page 14 Indicator: Office JobsSources: Office employees: David Birch, Anne Haggerty, and William Parsons, Corporate Demographics: America’s Office Economy: 1997-2007,
(Cambridge, MA: Cognetics, 1997), p. 26. Overall 1997 employment: Bureau of Labor Statistics.
Page 15 Indicator: Managerial, Professional, Technical JobsSources: Bureau of Labor Statistics specific occupational employment data and overall employment data, 1997 (http://www.bls.gov.oes).
Page 16 Indicator: Workforce EducationSources: U.S. Census Bureau, Statistical Abstract of the United States: 1997 (117th edition.) (Washington, DC: 1997), p. 161. Data based on 1990
U.S. Census.
Page 18 Indicator: Export Focus of ManufacturingSources: Center for Strategic & International Studies, (Data based on 1992 U.S. Census Bureau figures, Exports from Manufacturing Establishments,
(Washington, D.C.: 1992).
Page 19 Indicator: Foreign Direct InvestmentSources: Employment by non-bank U.S. affiliates by state, 1996: Mahnaz Fahim-Nader and William J. Ziele, “Foreign Direct Investment in the United
States—New Investment in 1997 and Affiliate Operations in 1996,” Survey of Current Business, Bureau of Economic Analysis (June 1998)table 13, p. 53. Overall employment: Bureau of Labor Statistics.
Page 21 Indicator: Gazelle JobsSources: David Birch, Anne Haggerty, and William Parsons, Corporate Demographics: Corporate Almanac (Cambridge, MA: Cognetics, 1998),
pp. 21 & 53. This indicator shows the number of gazelle firm employees for 1997 as a share of total establishment employment (an estab-lishment is defined as a place of work, a physical location).
Page 22 Indicator: Job ChurningSources: Business starts: The Dun & Bradstreet Corporation, 1995-1996 Business Starts Record, (New Jersey, 1997). Business failures: The Dun &
Bradstreet Corporation, 1996 Preliminary Business Failure Record, (New Jersey, 1997).
Page 23 Indicator: Initial Public OfferingsSources: State IPO totals: Timothy Gallagher, 1997 New England IPO Report, (Boston, MA: Hale & Dorr, LLP, 1998). Gross State Product:
Department of Commerce, Bureau of Economic Analysis, Regional Economic Analysis Division, Gross state product, by component andindustry, 1977-96 (Washington, D.C., June, 1998).
Page 25 Indicator: Online PopulationSources: Cyber Dialogue, Interactive Consumers, (NY: April 1999) (www.cyberdialogue.com).
Page 26 Indicator: Commercial Internet Domain NamesSources: Domain names: Anthony Townsend, Department of Urban Studies and Planning, MIT. 1999 counts are aggregated from ZIP code level
data provided by www.domainsondisc.com. Firms: David Birch, Anne Haggerty, and William Parsons, Corporate Demographics: CorporateAlmanac, (Cambridge, MA: Cognetics, 1998), p. 20. (A firm is a legal entity, while an establishment is a place of work.)
Page 27 Indicator: Technology in SchoolsSources: Classroom Internet access and teacher e-mail: Education Week, “Technology Counts ’98: Putting School Technology To the Test” (October
1998). Teacher technology training: Education Week, “Technology Counts: Schools and Reform In the Information Age” (October 1997).(http://www.edweek.org/sreports/).
Page 28 Indicator: Digital GovernmentSources: The Progress & Freedom Foundation, The Digital State 1998: How State Governments Are Using Digital Technology (Washington, DC:
September 1998), p. 88.
Page 30 Indicator: High-Tech JobsSources: American Electronics Association, Cyberstates 3.0: A State-by-State Overview of the High-Technology Industry (Washington, DC: 1999),
p. 91.
Page 31 Indicator: Scientists and EngineersSources: Scientists & Engineers: National Science Foundation, Science and Engineering State Profiles: 1998 Data Update, (NSF 99-311), (Arlington,
VA, 1998). Employment: Bureau of Labor Statistics.
Page 32 Indicator: PatentsSources: Patents: U.S. Patent and Trademark Office. Data are for utility patents. Employment: Bureau of Labor Statistics.
Page 33 Indicator: Industry Investment in R&DSources: Total Industry R&D 1995: National Science Foundation, Research and Development in Industry 1995-96, (NSF 99-312), (Arlington, VA,
1998). Gross State Product: Department of Commerce, Bureau of Economic Analysis, Regional Economic Analysis Division.
Page 34 Indicator: Venture CapitalSources: Pricewaterhouse Coopers LLP, Money Tree Report 1997 (Boston, MA: 1998). Gross State Product: U.S. Department of Commerce, Bureau
of Economic Analysis, Regional Economic Analysis Division.
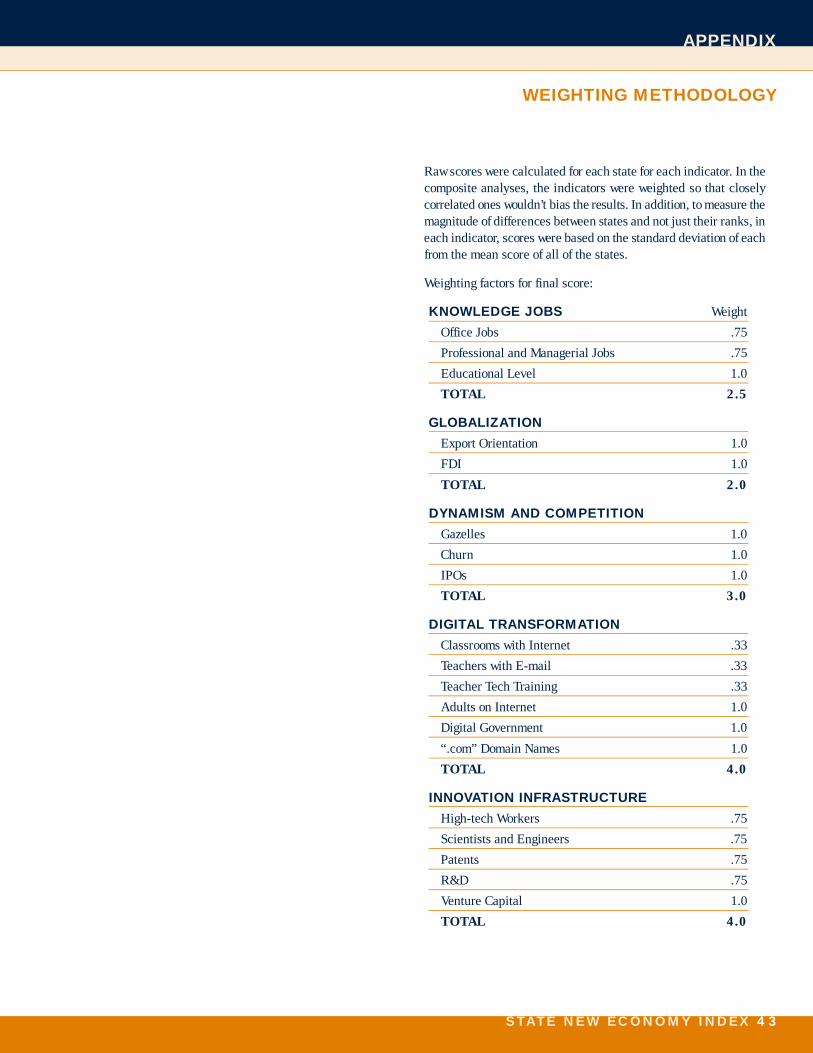
S TAT E N E W E C O N O M Y I N D E X 4 3
APPENDIX
Raw scores were calculated for each state for each indicator. In thecomposite analyses, the indicators were weighted so that closelyc o rrelated ones wouldn’t bias the results. In addition, to measure themagnitude of diff e rences between states and not just their ranks, ineach indicator, scores were based on the standard deviation of eachfrom the mean score of all of the states.
Weighting factors for final score:
KNOWLEDGE JOBS Weight
Office Jobs .75
Professional and Managerial Jobs .75
Educational Level 1.0
TOTAL 2.5
GLOBALIZATION
Export Orientation 1.0
FDI 1.0
TOTAL 2.0
DYNAMISM AND COMPETITION
Gazelles 1.0
Churn 1.0
IPOs 1.0
TOTAL 3.0
DIGITAL TRANSFORMATION
Classrooms with Internet .33
Teachers with E-mail .33
Teacher Tech Training .33
Adults on Internet 1.0
Digital Government 1.0
“.com” Domain Names 1.0
TOTAL 4.0
INNOVATION INFRASTRUCTURE
High-tech Workers .75
Scientists and Engineers .75
Patents .75
R&D .75
Venture Capital 1.0
TOTAL 4.0
WEIGHTING METHODOLOGY
4 4 S TAT E N E W E C O N O M Y I N D E X
ENDNOTES
1. Bob Davis and David Wessel, Prosperity (New York: Times Books, 1998), p. 8.2. Robert D. Atkinson and Randolph H. Court, The New Economy Index: Understanding America’s Economic Transformation (Washington, D.C.: Progressive
Policy Institute, 1998). http://www.neweconomyindex.org.3. Ibid.4. Ibid.5. A similar set of old and New Economy characteristics has also been developed by John Doer, of Kleiner, Perkins, Caulfield & Byers (Menlo Park, California).
We recognize that the factors represented in this table are generalizations that do not apply to every organization or individual. But they describe the over-all changes we believe have taken place in the economy.
6. Atkinson and Court, op. cit.7. The Census Bureau last surveyed manufacturers on their use of manufacturing technology in 1993. We have chosen not to use these data because the
information is now over 6 years old and more recent data are not available.8. Data are available on the number of Internet “backbones” per state, which are positively correlated (0.44) with overall New Economy scores. (Backbones
are connections between “network access points,” which are the junction points where major Internet service providers interconnect with each other.)However, backbone data do not work well as economic indicators because it is difficult to find suitable figures to use as denominators to control for thesize and geographic characteristics of the states. The most useful measure would be to know the average distance of citizens and businesses from thenearest backbone. But, for practical purposes, this is incalculable.
9. Managerial and professional jobs were calculated using two of the Bureau of Labor Statistics’ top-level occupational categories: “Managerial andAdministrative Occupations,” and “Professional, Paraprofessional, and Technical Occupations.”
10. Each state’s residents were classified by education level. The percentage of residents with more than a high school degree but no four-year college degreewas weighted with a multiplier of 0.5. The multiplier for the percentage of residents with a college degree was 1, and the multiplier for graduate degreeswas 2. The weighted percentages were added to find each state’s total score. In other words, a state where 10 percent of the residents had a high schooldegree and some college (earning a weighted score of 5), 20 percent with a bachelor’s degree (a weighted score of 20), and 10 percent with a graduatedegree (a weighted score of 20), would earn a total score of 45.
11. Stuart A. Rosenfeld and Robert D. Atkinson, “Engineering Regional Growth,” Growth Policy in the Age of High Technology, edited by Jurgen Schmandtand Robert Wilson (Boston: Unwin Hyman, 1990).
12. “What’s New About Globalization,” The McKinsey Quarterly, No. 2, 1997, p. 179.13. Data on exports by state are available only for manufacturing.14. Andrew B. Bernard and J. Bradford Jensen, “Exporters, Jobs, and Wages in U.S. Manufacturing: 1976-1987,” Brookings Papers in Microeconomics, 1995,
pp. 67-119.15. Richard Florida and Martin Kenney, Beyond Mass Production: The Japanese System and Its Transfer to the U.S. (New York: Oxford Univ Press, 1993).16. This U.S. average includes the District of Columbia.17. The Center for Research in Electronic Commerce, University of Texas at Austin (http://www.InternetIndicators.com).18. Forrester Research, Cambridge, Massachusetts.19. David Moschella and Robert D. Atkinson, The Internet and Society: Universal Access, Not Universal Service (Washington, D.C.: Progressive Policy Institute,
1998). http://www.dlcppi.org/adobe/tech/society.pdf.20. This U.S. average includes the District of Columbia.21. The number of “.com” domains registered in a state will not be an exact measure of the number of businesses with Web sites for a number of reasons. For
one thing, not all registered domains are actually in use. (Sometimes organizations register names they think they might use. And some domain names areheld by speculators hoping to sell them.) Further, many “.com” domain names are registered by individuals for non-commercial purposes, to create per-sonal Web pages, fan sites, and the like. And, of the domains registered to businesses, not all of them are for commercial purposes, per se. (Some compa-nies create rudimentary Web pages simply to make sure they’re on the map, just as they might place an ad in the Yellow Pages. Others invest hundreds ofthousands or millions of dollars building elaborate e-commerce systems in order to sell to markets around the world.) Nonetheless, these factors will betrue across all states, and thus should cancel each other out.
22. Education Week, “Technology Counts ’98: Putting School Technology To the Test” (October 1998).23. Kenan Patrick Jarboe and Robert D. Atkinson, The Case for Technology in the Knowledge Economy: R&D, Economic Growth, and the Role of Government
(Washington, D.C.: Progressive Policy Institute, 1998). http://www.dlcppi.org/texts/tech/casefortech.pdf.24. Organization for Economic Cooperation and Development, The Knowledge Economy (Paris: OECD, 1996), p. 9.25. American Electronics Association, Cyberstates (Washington, D.C.: AEA, 1999).26. This U.S. average includes the District of Columbia.27. Atkinson and Court, op. cit.28. Notwithstanding the fact that federal government measurements of economic output and productivity appear to undercount both, the magnitude of the
mismeasurement does not appear to be large enough to completely offset the nominal productivity slowdown that has occurred.29. Atkinson and Court, op. cit.30. Ibid.31. Senator Joe Lieberman (D-CT) was instrumental in placing language in the 1998 Workforce Investment Act that authorizes the U.S. Department of Labor to
create a regional skills alliance program. As this report goes to press, the Labor Department is crafting a request for proposals to allocate the funds.32. Robert D. Atkinson, Boosting Technological Innovation Through the Research and Experimentation Tax Credit (Washington, DC: Progressive Policy
Institute, May 1999). http://www.dlcppi.org/texts/tech/boosting.htm.33. Anna-Lee Saxenian, Regional Advantage: Culture and Competition in Silicon Valley and Route 128 (Cambridge, MA: Harvard University Press, 1996).34. Joseph Cortright, “Reinventing Economic Development,” Staff Report to the State of Oregon’s Legislative Committee on Trade and Economic
Development, October, 1994.35. David Osborne and Peter Plastrik, Banishing Bureaucracy (Reading, MA: Addison-Wesley Publishing Company, Inc., 1997).36. The Center for Research in Electronic Commerce, op. cit.37. Marc Strassman and Robert D. Atkinson, Jump Starting the Digital Economy (with Department of Motor Vehicles-Issued Digital Certificates) (Washington,
D.C.: Progressive Policy Institute, June 1999).38. Rosabeth Moss Kantor, World Class: Thriving Locally in the Global Economy (New York: Simon & Schuster, 1995).
S TAT E N E W E C O N O M Y I N D E X 4 5
ABOUT THE AUTHORS
Robert D. Atkinson is the director of the Progressive Policy Institute’s Technology & NewEconomy Project. Previously, he served as executive director of the Rhode Island Economic PolicyCouncil, and as a project director and senior analyst at the former Congressional Office ofTechnology Assessment (OTA). While at OTA, he directed The Technological Reshaping ofMetropolitan America, a report examining the impact of the information technology revolution onAmerica’s urban areas. Dr. Atkinson holds a Ph.D. in city and regional planning from theUniversity of North Carolina at Chapel Hill.
Randolph H. Court is the technology policy analyst at the Progressive Policy Institute. He is a former business reporter for Wired News in San Francisco, where he covered the computer andtelecommunications industries, and Silicon Valley. He has also worked as a researcher and free-lance writer for the Red Herring, a San Francisco magazine covering the business of technology,and as a general assignment reporter for the San Diego Daily Transcript, a business and legalpaper. He holds a master’s degree in journalism from the University of California at Berkeley.
Joseph M. Ward is the research assistant for the Progressive Policy Institute’s Technology,Innovation & New Economy Project. In that capacity, he has co-authored several reports on tech-nology and the New Economy, conducted statistical analysis, and provided editorial oversight.Before joining PPI, he worked on telecommunications and technology-related law issues as a legalassistant at a Washington, DC, law firm. Mr. Ward is a graduate of Georgetown University.

NOTES

NOTES