Embed Size (px)
Citation preview

Benchmarking State Business Incentives
Prepared By:
Prepared For:
Business Oregon
A Review and Comparison of Oregon State Incentive Programs
February 15, 2010

Benchmarking Oregon State Business Incentives
February 15, 2010
Page 1
Report Outline
Project Goals and Objectives……………………………………………………………………………………………….2
Overview of Incentives as a Business Attraction Tool…………………………………………………………..2
Section 1: Program Assessment............................................................................................4
Section 2: Competitor Incentive Analysis…………………………………………………………………………..10
Section 3: Business Climate Analysis………………………………………………………………………………….19
Section 4: Findings & Recommendations…………………………………………………………………………..29
Appendix………………………………………………………………………………………………………………………….33

Benchmarking Oregon State Business Incentives
February 15, 2010
Page 2
Project Goals and Objectives
The goals and objectives of the project included the following:
1. To review Oregon state incentive programs, primarily, Strategic Investment Program (“SIP”),
Business Energy Tax Credit as available for equipment manufacturers (“BETC– manufacturing), and
Enterprise Zone property tax abatements (Standard and Long Term)
2. To analyze similar and competitor states for tax abatements, income tax credits, property tax
credits, and other recruitment based incentive programs
3. To discover how current Oregon incentive programs helped attract companies to the state
4. To identify opportunities and recommendations for current incentive programs
Overview of Incentives as a Business Attraction Tool
When it comes to attracting new business investment, incentives help states and communities to
compete in corporate location decision-making by enticing companies to locate new facilities or
encouraging existing companies to expand and not move operations elsewhere. In addition,
incentives are a way for states and communities to help “level the playing field” when variable
operating costs, such as labor and utilities, are at a penalty for a particular operation compared to
competitor locations. Types of incentives include:
Tax credits, including refundable ones, or those that can be transferred or sold; such credits may be
used against income, withholding and/or other tax liabilities
Rebates of taxes already paid returned to the company as cash or credit
Property tax abatements on real or on real & personal property, the latter of which may not be
taxed in some states at least if used in manufacturing
Because property taxes are a required, predictable expense, which becomes increasingly
substantial with more capital-intensive projects, their abatement can deliver a more bankable,
upfront return
Discretionary funds that provide jurisdictions with more incentive flexibility
Other tax reductions such as reduced rates for city property taxes, utility taxes, etc.
Low interest loans for capital investent with interest rates less than market value
Grants, like the Governor’s Strategic Reserve Fund (SRF) in Oregon
Grants can be the most attractive for business as “nothing beats cash,” although tax benefits
can also have particular advantages for some firms or situations
Grants also provide greater discretion to public bodies compared to tax break programs, which
for legal and administrative reasons typically need to operate under more automatic or
“statutory” parameters and processes

Benchmarking Oregon State Business Incentives
February 15, 2010
Page 3
Credits against income taxes
These frequently have little or problematic worth, because firms will not have sufficient near-
term tax liability to realize much benefit
BETC transferability offers one alternative to overcome this challenge and improve the credit’s
cash-like return—other ways to effect grant or cash-like equivalency with tax credits is to make
them refundable or convertible into rebates
Credits applicable against state withholding taxes
These may likewise offer strong (but payroll-based) benefit due to the size and regularity of such
tax payments, allowing the firm to more readily realize the face value of the credit
Other incentive methods may involve local programs, training assistance and other discretionary
funds

Benchmarking Oregon State Business Incentives
February 15, 2010
Page 4
Section 1 - Program Assessment:
Where are we now?
The first step in the analysis was to conduct an in-depth assessment of Oregon’s existing state
programs used to incentivize business development (notably SIP, BETC, and Enterprise Zones) and to
validate these programs. It is important that the state receive adequate return on their investments
they make in companies to ensure the return is relative to the investment. This section summarizes
Oregon’s major state incentive programs, provides general comments about each program, as well as
comments on programs from confidential interviews conducted with selected program recipients.
Oregon’s Major State Incentive Programs
Oregon’s major state incentive programs and the programs in which this study centered around
include the following:
Strategic Investment Program (SIP) - exempts a portion of large capital investments from property
taxes available for massive capital expenditures, which are very high relative to the number of
(typically high-wage) jobs
Business Energy Tax Credit (BETC) - Available to those who invest in energy conservation, recycling,
renewable energy resources and less-polluting transportation fuels, as well as for manufacturing
Standard Enterprise Zones (EZ) - 59 zones in the state can all offer eligible firms at least 3 and up to
5 years of exemption on new property
Long-term Enterprise Zones (EZ) - Most of 48 rural enterprise zones can offer 7–15 years of
exemption from property taxes
Other programs that were not the primary focus of this study, but are relative state incentive
programs include:
Strategic Reserve Fund (SRF) - Discretionary grant funds that are set up as a loan that is not paid
back if commitments are satisfied. (Interest rate is 5% if not forgiven) Funding: 2007-09 =
$7,425,000, 2009-11 = $5,914,187. SRF may yet experience reductions in the ongoing February
2010 legislative session. The SRF is relatively small compared to discretionary grant resources that
exist in some other states. Since 2007, prevailing wage rate [PWR] requirements apply if the total
public grants and loans are $750,000 or greater.
Oregon Investment Advantage (OIA) - The exemption is a 10-year waiver of all income and excise
taxes relating to qualifying business operations. The program is oriented to rural/lagging areas of
state, with increasing use for various situations. The number of eligible counties [all in rural Oregon]
shrinks drastically after 2010.

Benchmarking Oregon State Business Incentives
February 15, 2010
Page 5
SIP - General Comments
Shown to be successful in the attraction of new industry and the expansion of existing industries
involving huge capital outlays
In effect, caps the property taxes on major investment at either $25 (rural) or $100 million (urban)
Provides the local community with alternative additional funding, with statutorily defined
“community service fee”
Only has a handful of users, with eligible projects since 1995 averaging less than two a year, even as
more than half comprise relatively recent wind-energy developments
Program works as a function of county/local efforts, such that the county can negotiate any number
of conditions in their agreements with business, and the emphasis has been on the firm’s making
special payments
Often, return-on-investment analyses demonstrating favorable results have preceded projects
Business Oregon is charged with collecting data annually from businesses starting in 2011
BETC–Manufacturing - General Comments
Manufacturing projects, as allowed since 2007, comprise several facilities that produce exclusively
solar/photovoltaic (PV) components
Starting in 2007, manufacturing piece was grafted onto a program traditionally oriented toward
energy policy and the subsidization of conservation efforts and alternative sources, not necessarily
the incentivizing of business development in comparison with competitor locations
Already represents an innovative, major incentive for qualifying “Clean Tech” industries for
manufacturing equipment or materials exclusively for renewable energy use
Exceptionally useful program in successfully competing for current industry opportunities that other
states are aggressively courting, as well
The incentive focus is on investment dollars, in a way that does not generally adjust or expand with
the overall size of the capital outlay, or to the jobs or payroll created; some businesses (attempt to)
obtain multiple certificates for up to $40 million in certified project costs
Pass-through option provides critical grant-like liquidity; presently, this and other program
elements are in flux, raising uncertainties about effective salability of credits
Has taken a real “hit” in the press in terms of traditional subsidy role for conservation and
alternative sources relative to sudden growth in the size of wind-generation projects and other new
issues
Since 2008, for manufacturing, statutorily based standards are incorporated and subject to
retroactive enforcement under contracts with developers officiated through Business Oregon
Benchmarking Oregon State Business Incentives
February 15, 2010
Page 6
Program is subject to sunset by 2012 in a way that now deters major manufacturing proposals;
February 2010 legislation may address this
Standard EZ – General Comments
Is widely used and is a successful program for many types of projects, both large and small
Benefit relates direct to the size of investment, but in an upfront way by abating new property taxes
for three to five years
Driven by the local community, for which it is often their only tool available to incentivize business
to expand or locate
Because it is driven locally, program lacks consistency across the state in terms of communication,
administration, and how the incentive is marketed and presented; also, the local discretion with
some program elements creates inconsistency with the size and availability of the tax benefit
Local, de-centralized nature and administrative resources create challenges for statewide tracking
and monitoring, even as annual filing and enforcement mechanisms generate source of data
Local role provides for local ownership and cooperation among entities and with the state, and
minimizes the staffing resources needed at the state level
Serving hundreds of businesses in widely varying sizes throughout state
Size of the tax benefit varies exponentially according to the size of capital investment in property; by
law it is retroactively enforceable but only during benefit period
Sunsets in 2013
Long-term EZ – General Comments
Particularly supports rural communities in securing major opportunities with highly competitive
property tax abatement on new facility investment
Requires minimum levels for investment size, job creation and employee compensation, which are
retroactively enforceable for the entire 7–15-year period of property tax abatement
Driven by the local community in the form of city, port and county sponsors of most rural
designations
Inconsistently offered by local sponsors, and not necessarily aggressively marketed, across the state
Possesses no established mechanisms for tracking and monitoring; verification and data collection
currently handled through local, ad hoc means, which may have sufficed so far with only a mere
handful of users, but administrative efforts are called for going forward

Benchmarking Oregon State Business Incentives
February 15, 2010
Page 7
Incentive Program Assessment
In order to assess the effectiveness of the current incentive programs, confidential phone interviews
were conducted with 10 companies that recently used one or more incentive programs. The
interviews centered on discussions about experience and perceived effectiveness of incentive
programs in Oregon, as well as suggestions for improvements. The table below summarizes the types
of incentive programs, in which the interviewed companies participated.
Program Used Number of Companies
BETC–Manufacturing 3
SIP 1
EZ 4
Long-term EZ 1
SRF 4
OIA 2
Note: Some companies utilized more than one incentive program.
Characteristics of Companies Interviewed – Investment & Job Levels
Company Investment Jobs Company Investment Jobs
#1 $200-700 m 300-500 #6 $52 million 100
#2 $18 million 100 #7 $1.5 million 25
#3 Minimal Internships #8 $15 billion 7-9,000
#4 $31.8 mil. 290 #9 $13 million 48
#5 $25 million 200-400 #10 $94 million 74
Note: Company names were kept confidential; they are identified above by numbers only.
Program Assessment—SIP
Comments from the confidential interviews of selected program recipients include the following:
We would not have a major R&D in Oregon without SIP. We have the most important and highest
paying jobs in the company here, our size would be significantly smaller and we would have been hit
much more in this downturn in the economy

Benchmarking Oregon State Business Incentives
February 15, 2010
Page 8
[Unrelated to incentives:] Oregon instituted single sales factor which has been a major win for
companies and really encourages companies to grow investment in OR versus growing in other
states. From a tax policy, I think Oregon will benefit from it in the long term
Suggestions for Improvements from Interviews:
None reported
Program Assessment—BETC–Manufacturing
Comments from the confidential interviews of selected program recipients include the following:
BETC was 100% instrumental in decision to locate in Oregon
Need timely communication with DOE—very lengthy response time—nine months
Difficult to track progress of the project as to when the goals have been met
Became complicated in 2008
With so many legislative changes, I don’t even know even know what’s available today
Legislative environment is changing in regards to the program
Question the survivability of BETC
We will all have to figure out how to work through the process [of improving the BETC] rather than
castigating each other. Perhaps one solution is to push out the payment terms. Larger companies
would be OK with that but I don’t know if the smaller companies would survive. Ultimately, it will
take the citizens, legislative groups, business development groups and companies all working
together to come up with an equitable solution. Everyone has to understand what the long-term goal
is and work together to figure out how to get there.
Suggestions for improvements from Interviews:
Improve the pass-through partner process
Go to a grant of the BETC benefit [or other grant-equivalency methods] rather than having to go
through pass-through partner [“middle man”]
Establish clear goals in the beginning. Process was very loose early on which made it difficult for the
department to confirm that criteria had been met
Reduce the Review Fee that is capped at $75,000
Program Assessment – EZ
Comments from the confidential interviews of selected program recipients include the following:

Benchmarking Oregon State Business Incentives
February 15, 2010
Page 9
The partnership with the City has been very positive. The economic development staff at the City
helped us through the application process.
Didn’t know about the program until locals told them after they made the decision to locate there
(only 1 respondent said this and the company did use the program)
Application, Approval and Compliance Process was pretty straight forward
Suggestions for Improvement from Interviews:
Make sure there is a strong local partner
It was a little frustrating in the beginning trying to find out which programs to apply for

Benchmarking Oregon State Business Incentives
February 15, 2010
Page 10
Section 2 - Competitor Incentive Analysis:
What does the competition have that we don’t have?
The next step in the analysis included obtaining data regarding the effectiveness of Oregon incentive
programs compared to ten (10) other competitor states’ income tax credits, property tax abatements,
and other recruitment-based incentive programs used in the last two years. The research conducted
for this phase of analysis helped to identify gaps and opportunities for incentive programs. This
section summarizes the competitor states chosen for the analysis, highlights of competitor programs,
and compares these programs to Oregon state programs. A detailed matrix of programs for each
state can be found in the Appendix section.
Competitor States for Analysis
The following groups of states were chosen for the analysis in conjunction with Business Oregon:
Immediate neighbors, which often occur in Pacific Coast recruitments:
California, Washington
Other Western states that not only compete regionally with Oregon, but appear to have an
interesting package of incentives:
Arizona, New Mexico, Utah
Non-western states that seem for some time to have had generally robust incentive efforts, with
which Oregon might compete on occasion:
North Carolina, Oklahoma
Great Lakes group of states, with which Oregon might compete seldom, but that have engaged in
notable programs to incentivize clean energy, R&D and other industries of interest to Oregon:
Michigan, New York, Ohio
Notes on Chosen Competitor States:
In one way or another, these states were chosen largely because of their perceived exemplary
attributes. There are many other states with notable programs, as well as 10–20 that have at most
nominal incentives for business development purposes, which is arguably the case for California
Of the states included here, some only very recently embarked in the last couple years on new
initiatives to either replace or supplement older programs

Benchmarking Oregon State Business Incentives
February 15, 2010
Page 11
Map of Competitor States for Analysis
Competitor Incentive Program Highlights
The following outlines areas of competitors’ incentive programs that are exceptional models in that
they have been utilized and have been shown to be beneficial to those states. Highlights from
competitor states along with specific examples included the following:
1. Clear policy discourse
Multiple agencies, Governor’s office and legislature are all in agreement on open, explicit
incentive policy, with some states demonstrating a strong willingness to address controversy in
pursuit of cogent but effective approaches
Example: Oklahoma - saw a need to address higher paying jobs. A new incentive program was
passed in the spring of 2009 and took effect in November of 2009, expanding on other programs
Example: Ohio - started receiving complaints on their compliance process and recently changed
from a specific job criteria to total payroll-based criteria which alleviated a tremendous amount
of paperwork for the companies. [The movement from per-job to total payroll-based benefit
serves an opportunity to link the incentive more directly to quality employment, usually with
criteria for average or minimum compensation.]
2. Clear performance measures
Very specific company commitments regarding jobs, investment and timing
Example: Utah - has single incentive agreements that specify clear performance milestones that
cuts across a couple of different, but generous programs for special, more negotiated benefits.
Very strong agreements between the companies and the state [through the Governor’s Office of
Economic Development Board (GOED) which is a special board for economic development]
and/or local jurisdiction, including consequences if the performance measures are not met.

Benchmarking Oregon State Business Incentives
February 15, 2010
Page 12
Example: Ohio - Job Creation Tax Credit (JCTC) refundable program outlines specific outcomes if
the company reduces committed employment or fails to maintain operations; also requires
company to stay twice as long as the incentive term.
3. Discretionary funds
Many states have discretionary, or “deal closing” funds that can be used at the discretion of the
Governor or other appropriate top level economic development official. These funds can be used
for anything, but the preference for fund use is typically directed at infrastructure or training.
Oregon’s SRF is a discretionary program but it is not funded well. As previously mentioned, it also
triggers PWR as it reaches $750,000 in conjunction with other public funds.
Example: New Mexico – has widely used this type of incentive for major projects and has
contributed millions in those instances; funds are usually provided over two years. (Schott solar
went here, but had also equally considered an Oregon location.)
4. Credits that are refundable or transferrable or useable against taxes other than income tax
If the company does not have enough tax liability, the incentive is either refunded to the company
or can be transferred to another entity which provides for direct, positive cash flow
Example 1: Ohio – Non-refundable Commercial Activity Tax (CAT)
tax credit of up to $150,000 that can go up to 50% of a project’s allowable costs with loans
ranging from $1-5 million. Program is also partnered with the R&D tax credit and if the
company is meeting the job creation and investment commitments, the company is eligible for a
dollar for dollar credit against their Ohio CAT liability equal to the amount of the principal and
interest which equates to a refundable tax credit.
Example 2: New Mexico - Credit of up to 10% of the combined value of the salary and benefits
for each net new job greater than $40,000 in urban and greater than $28K in rural, as well as the
ability to use these and other credits against multiple tax liabilities, including withholding taxes.
Example: Utah - 30% credit on withholding taxes, and use as well as income taxes
Example: Arizona - Up to 10% refundable income tax credit on investments
5. Creativity
Unique programs that help meet the needs of business and/or target industries
Example: Oklahoma - One major target industry is Aerospace and in an effort to help attract
both companies and the needed workforce, they offer a tax credit incentive to both the
Aerospace companies and to their engineers. This program also helps the Universities improve
their curriculum to further assist the companies. The incentives are:
Company = Tax Credit of 5-10% of Engineer’s compensation
Company = Tax Credit of 50% of tuition reimbursed to new engineers
Engineers = Individual Tax Credit of $5,000 per year for 5 years for the engineers
Benchmarking Oregon State Business Incentives
February 15, 2010
Page 13
Competitor States Comparison by Region
The following tables summarize the major incentive program offerings for each competitor state,
changes coming and/or general comments. The following data was not meant to be inclusive of all
programs; only the programs substantial enough to decisively make a difference in location decisions.
The sections highlighted in yellow are available for renewable energy projects.
Neighboring Competitor States
California Washington
1/1/2011—Single sales factor option kicks in
Incentives are difficult to understand but are primarily reduction in B&O taxes [Gross
Receipts Tax]
Best incentives are local through Redevelopment Authorities which have more flexibility than the state and can
provide: low interest loans (some forgivable), fee and permit waiver or
abatement, infrastructure improvement up to and including free land using TIF funds
Sales and use tax waivers based on location (primarily rural) and for specific targeted
industries
Municipal utilities can reduce rates up to 30-40%
Extremely targeted incentives May exemplify the case of over-targeting in
trying to too closely specify specific industries with geographic overlay. Program application
becomes too narrow and too complex and uncertain.
Reduced B&O Tax Rate
California (really the only selected state) that has nominal incentives. Enterprise zone
program exists with high job tax credit, but criteria and other restriction may often
render it ineffective

Benchmarking Oregon State Business Incentives
February 15, 2010
Page 14
Other Western State Competitors
Arizona Utah New Mexico
10% refundable credit & 77% reduction in property taxes
Very strong incentive agreements covering up to three programs, mainly for
special opportunities, including grant and credit
equal to 30% of state corporate, sales and
withholding tax liabilities
Refundable High Wage Tax Credit = 10% of salary & benefits, and otherwise claimable against state
compensating, sales and withholding tax liabilities
FTZ (federal Foreign Trade Zone) = 77% reduction in
property taxes
Grant available to small existing companies in rural
Utah for creating high paying jobs
Manufacturing/Investment Tax Credit (ITC) = 5% of
equipment cost
Job Training = Cash assistance of up to $8,000
per employee (however, may be presently suspended due
to budget)
Tax credit for 100% of state corporate, sales and
withholding tax liabilities
Transferable Rural Jobs Tax Credit of up to 6.25% on 1st
$16,000 of wages paid
Discretionary Grant
Up to 75% grant for technical skills training
Clearly defined and communicated Red flags (stop proposal pending
changes) / Green flags (to continue to approval by
special Governor’s Board for Economic Development)
Special refundable ITC on another 5% (in addition to
using regular ITC), High Wage & IRB-based exemptions
from use tax and property taxes over long term
Additional notes on these competitor states include:
Arizona
Arizona’s new renewable incentive program has very close parameters to follow:
Annual state cap of $70 million
51% of new FTEs must pay wages of at least 125% of the median annual Arizona wages

Benchmarking Oregon State Business Incentives
February 15, 2010
Page 15
Taxpayer must pay 80% of health insurance premiums or 80% of the cost of alternative health
benefits providing standard comprehensive coverage
Minimum new Full Time Equivalents [FTEs] for the 10% credit = 1.5 employees per $500,000
for a manufacturing facility and 1 employee for each $200,000 in a headquarter operation
The real and personal property tax assessment is effectively 5% [down from 25%] of market value
resulting in 77% reduction in property taxes. Arizona also is one of very few states that have
additional Foreign Trade Zone incentives. Job training is not usually listed as an incentive as all states
have fairly similar training incentives but because of the larger amount ($8,000) it is listed in the case
of Arizona.
Utah
Utah’s incentive agreements are clear and reasonable and economic impact analyses are conducted
on every project.
New Mexico
New Mexico’s Refundable High Wage Credit of up to 10% has a requirement that the employees must
be hired by July 1, 2015, and they do not have to be New Mexico residents. The ITC of 5% is limited to
85% of compensating, gross receipts or withholding tax within any one reporting period.

Benchmarking Oregon State Business Incentives
February 15, 2010
Page 16
Non-Western State Competitors
Oklahoma North Carolina
Quality Jobs Program = 5% of payroll in form of cash rebate specified by NAICS codes
One NC Fund = Very Discretionary
Newer program 21st Century Jobs Program = 7% initially and then 10% after the first 10 jobs are created as specified by Basic and
Enhanced job classification
JDIG = Discretionary
Aerospace Industry = 5-10% of compensation + 50% tuition tax credit + Employee receives
individual tax credit 35% tax credit—non refundable
Investment/New Jobs Tax Credit 80% of property tax exemption
Can take advantage of first or second incentive as there are no specific incentives
for renewable energy projects Local option revolving loan fund
Additional notes on these competitor states include the following:
Oklahoma
Oklahoma’s Quality Jobs Program is extremely well laid out for specific industries that fit the program
as listed by NAICS code, the amounts are determined by a formula and provides up to 5% cash rebate
of payroll. The 21st Century Jobs program provides up to 10% after the first ten jobs as long as the
jobs average $86,637 in the highest county. This program can have as few as ten employees but the
average pay has to be 300% of the average wage in the locating county.
Oklahoma’s Investment/New Jobs Tax Credit is a five-year tax credit against corporate income tax
liability on the greater of 1% per year of investment in a qualified new depreciable property or a credit
of $500 per year per job against the corporate income tax liability. The amount doubles in an
Enterprise Zone.
North Carolina
As noted, North Carolina’s incentives are fairly discretionary in part due to their being budgetary
expenditures.

Benchmarking Oregon State Business Incentives
February 15, 2010
Page 17
Great Lakes Region Competitors
Michigan New York Ohio
MEGA Tax Credit = 100% wages & benefits (non-refundable, but might
generally negate applicable tax liabilities)
Empire Zones = Wage, investment, property tax
credits (may be transitioning to “Excelsior” program with
lower state funding
Job Creation Tax Credit—Refundable
Anchor District Tax Credit = 5%
Grants on case by case R&D Loan—Tax credit to cover principal & interest
Refundable Payroll Tax Credit (PV & Others)
Real property tax abatement Rapid Outreach/Deal closing
fund
Renewable Energy Renaissance Zones
+ Discretionary Grant Reduced rate loan
Building OH Job Stimulus Funds—Grant
Additional notes on these competitor states include the following:
Michigan Michigan has a fairly unique incentive in their Anchor District Tax Credit which is a 5% tax credit
against corporate tax for investments made by suppliers of high tech industries locating within ten
miles of the “Anchor” location. If the supplier utilizes a tax credit, the Anchor District Tax Credit is
reduced to 2.5%. The project must create at least ten jobs, have a $1 million minimum investment
and is limited to five companies per year.
Michigan’s Energy Renaissance Zones provides a 100% abatement of Michigan Business Tax, state
education tax, personal and real property taxes, and local income taxes. In conjunction with this
incentive, there is a discretionary incentive that can be utilized.
New York In effect, the Empire zones provide a ten-year tax abatement on most taxes. However, this may be
changing as recently, the Governor proposed eliminating Empire Zones and instituting the Excelsior
Zone program which would decrease the Empire Zone tax abatements. The outcome is unknown at
this time until the legislative process is completed.
Ohio Ohio’s Job Creation Tax Credit is a refundable tax credit again the Commercial Activity Tax (CAT) and is
typically 50%. As noted earlier, the reporting requirements have been eased to make compliance
easier for the participating companies. Typically there is some (can be a small amount) Rapid
Outreach/Closing fund in every project.

Benchmarking Oregon State Business Incentives
February 15, 2010
Page 18
The Building Ohio Job Stimulus Fund program is a grant supported from bonds that were sold. The
program is administered by the Air Quality Development Authority.
Renewable Energy Equipment Manufacturing Incentive Comparison
The table below summarizes all of the incentive types available from Oregon and the ten study
competitors. Some of these programs are more exclusive for renewable energy, which in some case
may be broader than Oregon’s BETC, encompassing batteries, electric vehicles and other
clean/advance technology applications, several include renewable-specific incentives and some
include non-renewable-specific incentives that can be utilized by renewable projects. Of note, is
California which has little in the way of incentives to offer outside of the Local Redevelopment Areas.
The State of California does have a property tax exemption for solar energy systems, but the term
“system” refers to installations on rooftops (not utility-grade production facilities) and not the actual
manufacturing of those systems or components.
Incentive Type OR CA WA AZ* UT* NM* OK* NC* MI* NY* OH*
Pass-through Credit X
Refundable Tax Credit X X X X
Non-refund. Tax Credit X X X X X X
Property Tax Abatement X X X X X X
Discretionary Funds X X X X X
Other Tax Reductions X X X X X
Low Interest Loan X** X X X
Other X X X
* Where Oregon was the leader in renewable incentives, these states are (increasingly) offering very
generous and sometimes very smartly designed incentives, not only for the recruitment of
manufacturers, but also for renewable energy production by wind farms, solar farms, etc.
** The Pass-through Credit combined with the low-interest loan makes an unusually strong incentive.

Benchmarking Oregon State Business Incentives
February 15, 2010
Page 19
Section 3 - Business Climate Analysis:
How do we fit into the Bigger Picture of Business Costs?
Although incentives are a critical component to business attraction, it is also necessary to consider
other factors that are important to business location decisions. This section summarizes other
important location factors and compares the business climate in a selected region in Oregon with that
in comparable areas in other competitor states.
The optimal location is one that balances competing interests and minimizes
operating costs, one time non-reoccurring costs, and risk for the company and their
new operation. This location is identified through an “apples to apples”
comparison of location alternatives.
Location drivers span a hierarchy of investigative scales including the
following:
1. Strategic Fit – How does the operation fit within the supply chain and
what is the best geographic location for the new facility?
2. Community & Property – Within the best geographic location, is there an available facility or
Greenfield site that meets the needs of the project and does the community also meet other
critical requirements?
3. Schedule & Due Diligence – Are risk factors minimized at the selected property and does the
community have the ability to meet the project timeline?
4. Incentives – What incentive programs are available to help bridge the gaps and close the deal?
Strategic Fit
The initial investigative factor is to determine the “Strategic Fit” of an operation in relation to its
broader supply chain. It is critical for a company to first consider where raw materials and suppliers
are located as well as customer markets and distribution points when considering geographic
locations for the new operation. Also during this phase, it is necessary for the company to consider
direct requirements for the operation such as labor needs, utility services and costs, state and local
taxes, and other critical factors.
Benchmarking Oregon State Business Incentives
February 15, 2010
Page 20
Community & Property
Once geographic location is determined, a company will investigate
specific communities and properties for the new
operation. As speed to market has become an
increasingly important issue, companies are looking
for locations that not only meet the requirements of
their operation, but also offers a location that is
“ready to go” for new investment. A state and
community that delivers on the fundamentals of
community preparedness can compete for new and
expanding industry. This is done by possessing the
following:
Inventory of sites and buildings
Appropriate utility infrastructure
Labor force ready to work
Training resources are in place
Community support for industry
Professional presentation
Green and sustainable mission and message
Schedule & Due Diligence
As discussed above, speed to market is a critical component of industry especially the rapidly growing
Clean Technology sector. This requires not only ready sites and labor force, but also updated zoning
and building codes to accommodate new products manufacturing, and a local permit process that is
designed to accommodate accelerated project schedules. For all project types, due diligence items
such as presented below are critical components of location decisions.
Property ownership
Cost and terms of sale or lease
Environmental testing
Boundary survey
Title search
Geo-technical Study
Archeological
Traffic Study
Zoning
Building Codes
Permitting
Utility services

Benchmarking Oregon State Business Incentives
February 15, 2010
Page 21
Incentives
As other location factors are critical to site selection, incentive programs are also very important in
attracting new business investment and expansion. Ultimately incentives serve as a deal closer
toward the end of company site-selection evaluation, but they are increasingly important at the
beginning of a decision-making process, as things that go into initial check-off lists or that can
encourage firms to consider options to expand locally. The state and local ED community must be
able to support incentive agreements that serve a broad spectrum of industry needs including
workforce training, recruitment, site infrastructure, investment credits and do this efficiently and
without delay.
For industries such as Clean Technology, companies are looking for incentives that will not only
directly affect their bottom line, but also help grow their business. Incentives offered to end users of
Renewable Energy (RE) products also help grow a local RE market, RE manufacturing, and the RE value
chain.
Comparative Cost Analysis
The objective of the comparative cost analysis is to gage Oregon’s competitive position with other
locations in competitor states by measuring estimated annual variable operating costs for two
example projects:
1) Clean Technology Manufacturing (PV module plant)
2) Advanced Manufacturing (metals manufacturing parts supplier plant)
Operating Cost Comparative Analysis
Operating costs in Oregon (Portland
MSA) were compared to trial city
regions in competitor states where
Clean Tech and/or Advanced
Manufacturing investment is now
occurring.
Costs include:
Transportation
Wages / Fringe Benefits
Electric power
Natural gas
Water and Sewer
Real Estate Costs
Property taxes
Benchmarking Oregon State Business Incentives
February 15, 2010
Page 22
Notes on the operating cost analysis:
This research focused on the cost analysis of various locations which is typical of a site selection
evaluation process. The chosen states and locations used in this analysis may not all compete for
the same type of project at the same time.
The focus for Oregon for the comparison is based on the Portland-metro area, as well as metro
areas in other competitor states. Costs may vary in other locations within each state.
The two sample projects were chosen based on current target industries and opportunities that
Oregon would like to attract, but scenarios are not indicative of all business location situations.
Costs in other parts of Oregon may differ relative to competitive sites in other states.
The comparative cost analysis was based on two example models:
Clean Technology - PV Module Plant Project
Advanced Manufacturing - Parts Supplier to the Metals Manufacturing Industry Plant Project
Project details and investment information is summarized below:
Clean Technology (PV Module) Plant – Project Description
393 employees (369 hourly and 24 salaried)
Hourly workers consist of semi-skilled and skilled workers
7 day / 8,10,12 hour shift operation / upper 60th percentile for wages
75 outbound trucks per week
Minimum 100 acre site, 500,000 SF plant
Electric: 7,000 kW / 4,800,000 kWh per month
Natural Gas: 156,000,000 ccf per year
Water: 15,000,000 GPM / Sanitary Sewer: 12,000,000 GPM
Investment: $149,000,000 (plus cost of land)
Advanced Manufacturing (Parts Supplier) Plant – Project Description
191 employees (176 hourly and 15 salaried)
Hourly workers consist of semi-skilled and skilled workers
7 day / 8,10,12 hour shift operation / upper 60th percentile for wages
50 outbound trucks per week
Minimum 50 acre site, 250,000 SF plant
Electric: 2,500 kW / 1, 200,000 kWh per month
Natural Gas: 780,000 ccf per year
Water: 7,000,000 GPM / Sanitary Sewer: 6,000,000 GPM
Investment: $81,500,000 (plus cost of land)
Benchmarking Oregon State Business Incentives
February 15, 2010
Page 23
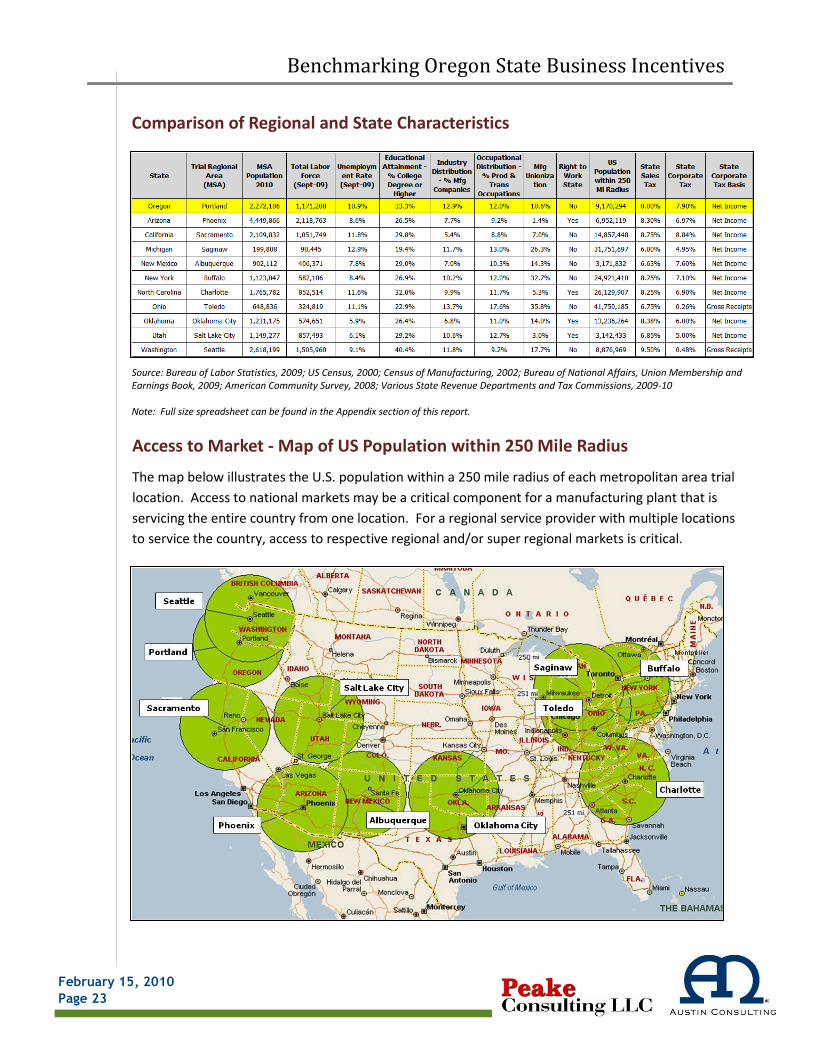
Comparison of Regional and State Characteristics Source: Bureau of Labor Statistics, 2009; US Census, 2000; Census of Manufacturing, 2002; Bureau of National Affairs, Union Membership and Earnings Book, 2009; American Community Survey, 2008; Various State Revenue Departments and Tax Commissions, 2009-10 Note: Full size spreadsheet can be found in the Appendix section of this report.
Access to Market - Map of US Population within 250 Mile Radius
The map below illustrates the U.S. population within a 250 mile radius of each metropolitan area trial
location. Access to national markets may be a critical component for a manufacturing plant that is
servicing the entire country from one location. For a regional service provider with multiple locations
to service the country, access to respective regional and/or super regional markets is critical.
Benchmarking Oregon State Business Incentives
February 15, 2010
Page 24
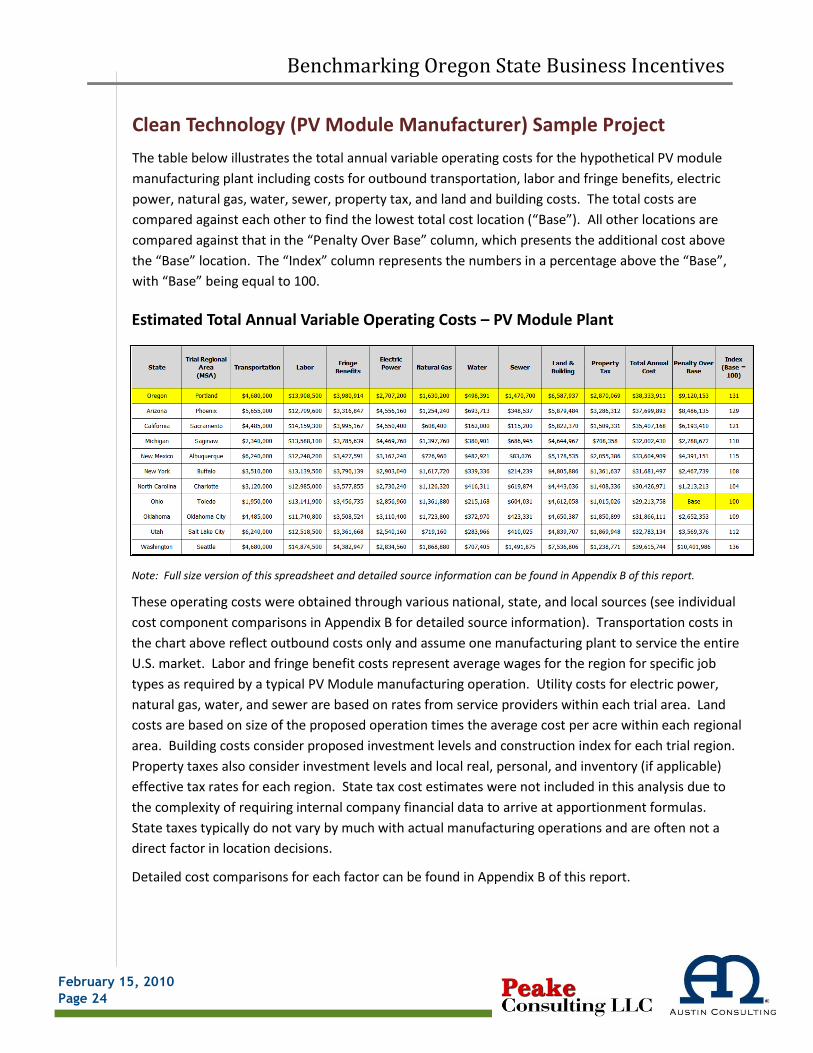
Clean Technology (PV Module Manufacturer) Sample Project
The table below illustrates the total annual variable operating costs for the hypothetical PV module
manufacturing plant including costs for outbound transportation, labor and fringe benefits, electric
power, natural gas, water, sewer, property tax, and land and building costs. The total costs are
compared against each other to find the lowest total cost location (“Base”). All other locations are
compared against that in the “Penalty Over Base” column, which presents the additional cost above
the “Base” location. The “Index” column represents the numbers in a percentage above the “Base”,
with “Base” being equal to 100.
Estimated Total Annual Variable Operating Costs – PV Module Plant
Clean Technology – Operating Costs Comparison
Note: Full size version of this spreadsheet and detailed source information can be found in Appendix B of this report.
These operating costs were obtained through various national, state, and local sources (see individual
cost component comparisons in Appendix B for detailed source information). Transportation costs in
the chart above reflect outbound costs only and assume one manufacturing plant to service the entire
U.S. market. Labor and fringe benefit costs represent average wages for the region for specific job
types as required by a typical PV Module manufacturing operation. Utility costs for electric power,
natural gas, water, and sewer are based on rates from service providers within each trial area. Land
costs are based on size of the proposed operation times the average cost per acre within each regional
area. Building costs consider proposed investment levels and construction index for each trial region.
Property taxes also consider investment levels and local real, personal, and inventory (if applicable)
effective tax rates for each region. State tax cost estimates were not included in this analysis due to
the complexity of requiring internal company financial data to arrive at apportionment formulas.
State taxes typically do not vary by much with actual manufacturing operations and are often not a
direct factor in location decisions.
Detailed cost comparisons for each factor can be found in Appendix B of this report.

Benchmarking Oregon State Business Incentives
February 15, 2010
Page 25
Comparison Chart: Estimated Total Annual Variable Operating Costs – PV Module Plant
Renewable Energy Incentives for the Sample Project – PV Module Plant
The table below presents incentive programs that Oregon and some of the low cost locations in the
sample PV operation costs analysis would have to offer the sample project. In each instance below,
some or all of the programs may be used in a particular project. The key here is that each state has
different tools to offset costs to increase their competitiveness. BETC puts Oregon in the game, makes
it competitive with power costs, but does not necessarily beat the states in the total location decision.
Oregon Ohio North Carolina New York
BETC--50 percent of eligible costs, up to a
maximum of $40 million
Building OH Job Stimulus Funds—
Grant
35% tax credit-Non Refundable
Grant, Clean Energy, and Energy Efficient
Product Manufacturing
Incentive Program
Energy Loan Program Refundable Payroll
Tax Credit 80% property tax
exemption Real property tax
abatement
Standard EZ or SIP
Refundable PV Manufacturing Tax
Credit—25% of Capital Costs
Local Option Revolving Loan Fund
Reduced rate loan
Benchmarking Oregon State Business Incentives
February 15, 2010
Page 26
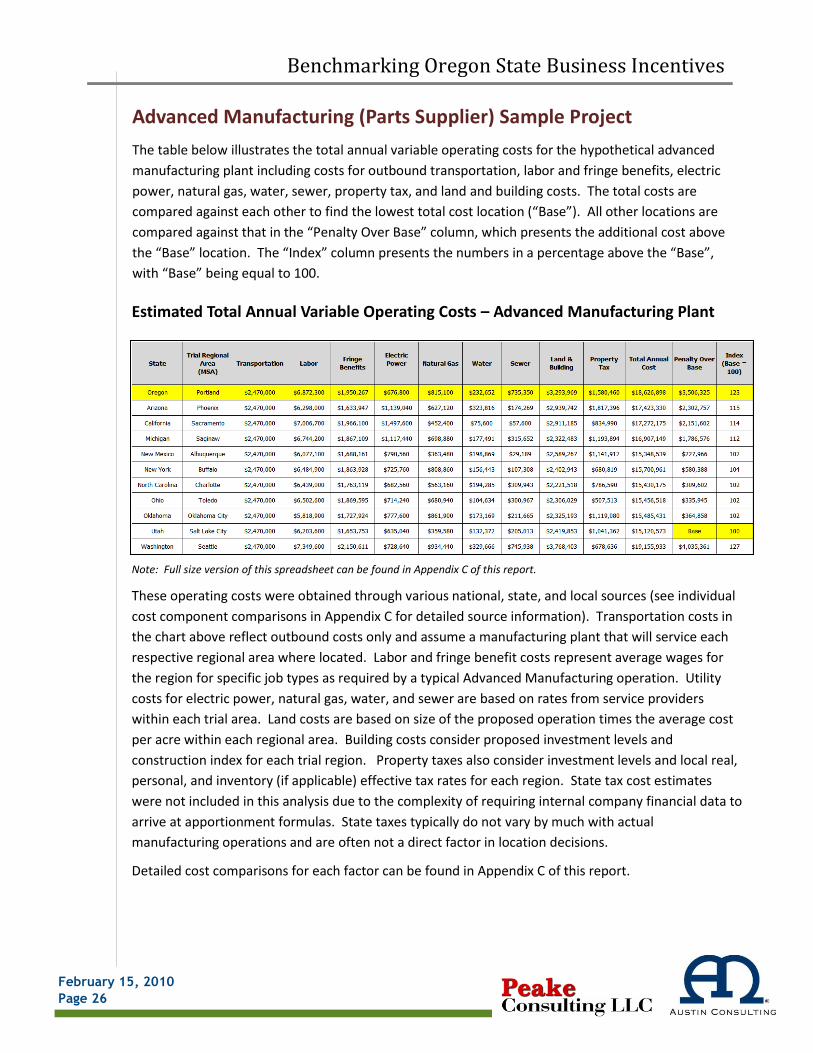
Advanced Manufacturing (Parts Supplier) Sample Project
The table below illustrates the total annual variable operating costs for the hypothetical advanced
manufacturing plant including costs for outbound transportation, labor and fringe benefits, electric
power, natural gas, water, sewer, property tax, and land and building costs. The total costs are
compared against each other to find the lowest total cost location (“Base”). All other locations are
compared against that in the “Penalty Over Base” column, which presents the additional cost above
the “Base” location. The “Index” column presents the numbers in a percentage above the “Base”,
with “Base” being equal to 100.
Estimated Total Annual Variable Operating Costs – Advanced Manufacturing Plant
Note: Full size version of this spreadsheet can be found in Appendix C of this report.
These operating costs were obtained through various national, state, and local sources (see individual
cost component comparisons in Appendix C for detailed source information). Transportation costs in
the chart above reflect outbound costs only and assume a manufacturing plant that will service each
respective regional area where located. Labor and fringe benefit costs represent average wages for
the region for specific job types as required by a typical Advanced Manufacturing operation. Utility
costs for electric power, natural gas, water, and sewer are based on rates from service providers
within each trial area. Land costs are based on size of the proposed operation times the average cost
per acre within each regional area. Building costs consider proposed investment levels and
construction index for each trial region. Property taxes also consider investment levels and local real,
personal, and inventory (if applicable) effective tax rates for each region. State tax cost estimates
were not included in this analysis due to the complexity of requiring internal company financial data to
arrive at apportionment formulas. State taxes typically do not vary by much with actual
manufacturing operations and are often not a direct factor in location decisions.
Detailed cost comparisons for each factor can be found in Appendix C of this report.

Benchmarking Oregon State Business Incentives
February 15, 2010
Page 27
Comparison Chart: Estimated Total Annual Variable Operating Costs – Advanced Manufacturing Plant
Incentives for the Sample Project – Advanced Manufacturing Plant
The table below presents incentive programs that Oregon and some of the low cost locations in the
sample advanced manufacturing plant cost analysis would have to offer the sample project. In each
instance below, some or all of the programs may be used in a particular project. In this case, some of
the competition may be offering better incentives in terms of cash-like incentives and programs that
may be more directly tied to payroll costs. Since the project is not a renewable energy manufacturing
project, BETC is not available to offer the project, therefore will not differentiate Oregon from the
competition.
Oregon Utah New Mexico Oklahoma
Strategic Investment Program
Economic Development Tax
Increment Financing
Refundable High Wage Credit
Basic or 21st Century
Quality Jobs Program
Standard Enterprise Zone
Industrial Assistance Fund
Investment Tax Credit
Investment/ New Jobs Tax
Credit Program
Long Term EZ Discretionary Grant Local Property Tax Abatement
Oregon Investment Advantage
Transferrable Rural Tax Credit

Benchmarking Oregon State Business Incentives
February 15, 2010
Page 28
Findings - Operating Costs Comparison
Based on the results of the cost analysis Oregon (Portland area) is approximately 31% higher for the
PV Module plant and 23% higher for the Advanced Manufacturing Parts Supplier plant than the lowest
(BASE) cost locations in Ohio and Utah, respectively. Although these example projects are not
indicative of all project requirements and the comparison trial locations may not be direct competitors
with Oregon for all projects, these sample projects, which are in target industries for Oregon, present
a unique perspective of areas where Oregon may fall short in competing for new investment.
Ultimately costs for transportation, sewer, natural gas, and real estate hurt Oregon in comparison to
the selected competitor locations. Incentive programs may be revised or created to combat some of
these shortcomings and level the playing field for Oregon to compete with other areas.

Benchmarking Oregon State Business Incentives
February 15, 2010
Page 29
Section 4 - Findings & Recommendations:
How can Oregon improve?
The following summarizes Oregon’s strengths and weaknesses in business attraction and/or existing
industry expansion. In addition, recommendations are presented below for BETC Manufacturing,
Overall Incentive Programs, and Claw-backs which can provide a roadmap for improvements if desired
by the State of Oregon.
Oregon Strengths & Weaknesses
Strengths:
SIP, BETC, EZ, and LTEZ are attractive to business and useful recruiting tools
Success of other incentive programs (OIA and SRF)
Low electric power costs
Competitive costs compared to CA and WA for Pacific coast market
Legacy semi-conductor industry
End user incentives and “Green” culture help drive local market for Renewable Energy products and
attract Clean Tech investment
Shovel Ready Sites - Certified Sites program helps reduce risks and delays for a site that otherwise
satisfied project needs
Weaknesses:
Perception of inadequate requirements has caused issues relative to non-manufacturing BETC
Complicated incentive process (BETC) and present uncertainty with aspects of pass-through and
sunset provision
Capital-based incentive program over jobs- and payroll-based incentives that would directly link
calculation of the benefit to the quantity and quality of new employment
Aside from large capital or renewable energy projects, incentives are not competitive
High transportation costs / poor market access to service large region or national market
Higher real estate costs compared to other regions, which may reflect overall supply of sites along
with other factors
Recommendations—BETC–Manufacturing
1. Consider changing program in accordance with clear goals:
Benchmarking Oregon State Business Incentives
February 15, 2010
Page 30
From an incentive essentially related to the capital investment by substituting computations
based more on the jobs/payroll of the facility to a somewhat broader set of applicable industries
to provide for other economic opportunities
Instead of a pass-through credit, provide the business a way it can directly receive a refund on
its tax return or rebate for some amount of its unused credits
Instead of a pass-through credit, change it to a grant
2. In light of changes like those above, consider reducing:
General size of the credit relative to project costs which might make it more scalable
Establish clearer, more explicitly standardized qualifications steps
Housing the program with Business Oregon
Put a cap on total annually certified incentives which will make the organization think more
about who/what is getting incentivized—In 2008 manufacturers only received 9% of tax credits
and manufacturers provide more jobs, therefore greater economic benefit to the state
3. Extend the manufacturing tax credits to ensure continuation of the program.
Recommendations—Overall Incentives
1. Pursue greater analysis of return-on-investment, both before and after receipt of incentives,
relative to technical resources, approval steps and program goals.
2. In terms of return-on-investment, improve and/or determine the following:
Methodology and the social/economic benefits and costs to include in the analysis
Definition of what is adequate, which will depend on type and timing of the incentive
3. Integrate ROI or economic impact analyses as a standardized part of the approval process on all
proposed major projects , respective to discretion in awarding incentives and analytical resources
4. Keep the entire incentive process (application, approval and compliance) simple, easy and user
friendly or companies will be deterred, especially smaller ones; consider linking information,
including tax forms and filing systems in claiming abatements
5. Consider a lower threshold for SIP or broader geographic access to incentives for Long-term EZ or
OIA
6. Consider incentives based on withholding taxes, other tax sources, or providing refundable tax
credits or rebates
7. Consider new incentives for projects outside of renewable or adjust existing incentives to include
other industries
8. Consider adding discretionary terms into statutory incentives— i.e., differences in percentages or
terms that can varied based on clear guidelines

Benchmarking Oregon State Business Incentives
February 15, 2010
Page 31
9. Add a “But-For” clause, whereby the business confirms that if not for the incentive it would not be
proceeding with its project to requirements
10. Consider the potential detrimental impact of Prevailing Wage Requirements (PWR) for grants and
loans as such requirements tend to seriously undermine the value of the incentive for private
developers.
Recommendations—Claw-backs
1. Utilizing and enforcing Claw-backs may be feasible for only the largest projects that warrant
special procedures and effort by both agency and the company
2. Review retroactive provisions and enforcement with incentive program enhancements, as well as
for new programs
3. Provisions might serve more than one incentive at a time, like apparently unique Utah model,
such as putting an SRF award and BETC–Manufacturing under same system
4. For negotiated situations or as a general standardized requirement, develop agreements with
clear performance measurements that include jobs, investment, timing, etc., as otherwise
provided by law
5. Consider adding clauses for some programs with major projects that says company must agree to
stay in state for a period of time (for example, twice as long as incentive lasts or some term after
the incentive expires)
6. Provide a balance between economic impact and claw-back provisions
7. Provide clear linkage to program criteria and objectives
8. Consider adding language that if a company does not fulfill a required commitment, then the
company must repay a certain percentage of incentive per year that fell short; pay back should be
pro-rated relative to how much firm falls sort of target
9. Claw-back provisions should account for force majeure, general recessionary conditions or
industry standards as the basis for some degree of flexibility or automatic relief—tough but
reasonable
10. Consider increasing administrative resources to accommodate recommendations
Benchmarking Oregon State Business Incentives
February 15, 2010
Page 32
Austin and Peake Consulting would like to acknowledge the assistance of Arthur Fish, Incentives Coordinator, Business Oregon (Oregon Business Development Department) for his expertise and assistance in this report.
Report Prepared By: Austin Consulting Michelle Comerford, Managing Director [email protected] 440.544.2682 phone Peake Consulting Margaret Grissom, Principal [email protected] 859.331.3422 phone
Benchmarking Oregon State Business Incentives
February 15, 2010
Page 33
APPENDIX
Appendix A - Matrix of Competitor State Programs
Appendix B - Business Climate Operating Cost Comparison - PV Module
Manufacturing Plant
Appendix C - Business Climate Operating Cost Comparison – Advanced
Manufacturing Parts Supplier Plant

Figure A-1: Oregon
Selective State and Local Incentive Programs Matrix
Incentive Incentive Amount Term Fees Clawback Difficulty of Process Miscellaneous
Strategic Investment Program
(SIP) exempts a portion of large
capital investments from property
taxes. The program is available
statewide for traded-sector
projects and is usually only useful
for extremely high-capital
expenditures per employee. High
wages are not a requirement but
have been typical high capital
expenditure projects.
Property tax exemption in excess first $25
million in rural area and $100 million
investment inside urban growth boundary of
metropolitan area or city with 30,000
population. Community service fee of 25%
of company's tax savings provided to local
service providers capped at $500,000 in
rural area and $2 million in urban area.
Requires local approval and can have
additional requirements added at the local
level. Threshold value increases 3% per
year for 15 years, i.e. second year $25
million + 3% = $27.75 million.
15 Years Initial fee of
$5,000/rural &
$10,000/urban and a
secondary fee of
$10,000/rural &
$50,000/urban if
project is approved.
50% of second fee
goes to OR Dept of
Revenue for
administrative
purposes.
Commission may suspend
benefits if annual report is
not received (starting in
2011).
State-level application can be
found online but is not a version
that can be completed and
submitted electronically. Local
application processes vary.
Business Energy Tax Credit
(BETC) Available to those who
invest in energy conservation,
recycling, renewable energy
resources and less-polluting
transportation fuels. Only the
heightended benefit available for
manufacturing of renewable
energy products is reviewed for
these purposes.
No job requirement. Tax credit of 50
percent of eligible costs, up to a maximum
of $40 million. Eligible costs may include
the building, equipment, machinery and
other expenses related to the
manufacturing of renewable energy
products such as solar cells and wind
turbines. (Amounts are subject to legislative
change)
10% per year over
five years
Generally equals
0.6% of the
estimated system
cost up to $75,000 for
manufacturing.
Maximum eligible
cost is determined
differently for each
technology and will
be reduced over
time.
DOE certifies eligible costs
before credits are given to
company or pass-through
partner. If not in compliance,
the prior and future tax
credits can be revoked. If
there is a pass-through
partner that has/or is taking
advantage of the credits, the
owner of the facility is
responsible for the money if
it must be revoked.
Administered by the Oregon
Department of Energy. Apply for
a preliminary certification before
company begins a project.
Preliminary certifications for PV
and Solar Thermal (ST) are only
valid for 12 months after which
time the applicant will need to re-
apply. Exemption: preliminary
certifications for public building
projects are valid for 36 months.
When the Pass-through Option is used, the
pass-through partner pays the project
owner a lump-sum payment calculated
using the pass-through rate. The pass-
through rate takes into account the value of
the money over time and other factors. The
Oregon Department of Energy reviews and
sets the pass-through rate. The pass-
through rate used is the rate in effect at the
time the Oregon Department of Energy
receives the Pass-through Agreement. Of
note: Chapter 913 creates or adjusts
sunset dates for tax credit programs. BETC
is 1/1/2012.
Prepared For:
Business Oregon
February 15, 2010
Page 1 of 4
Prepared By:
Austin Consulting / Peake Consulting
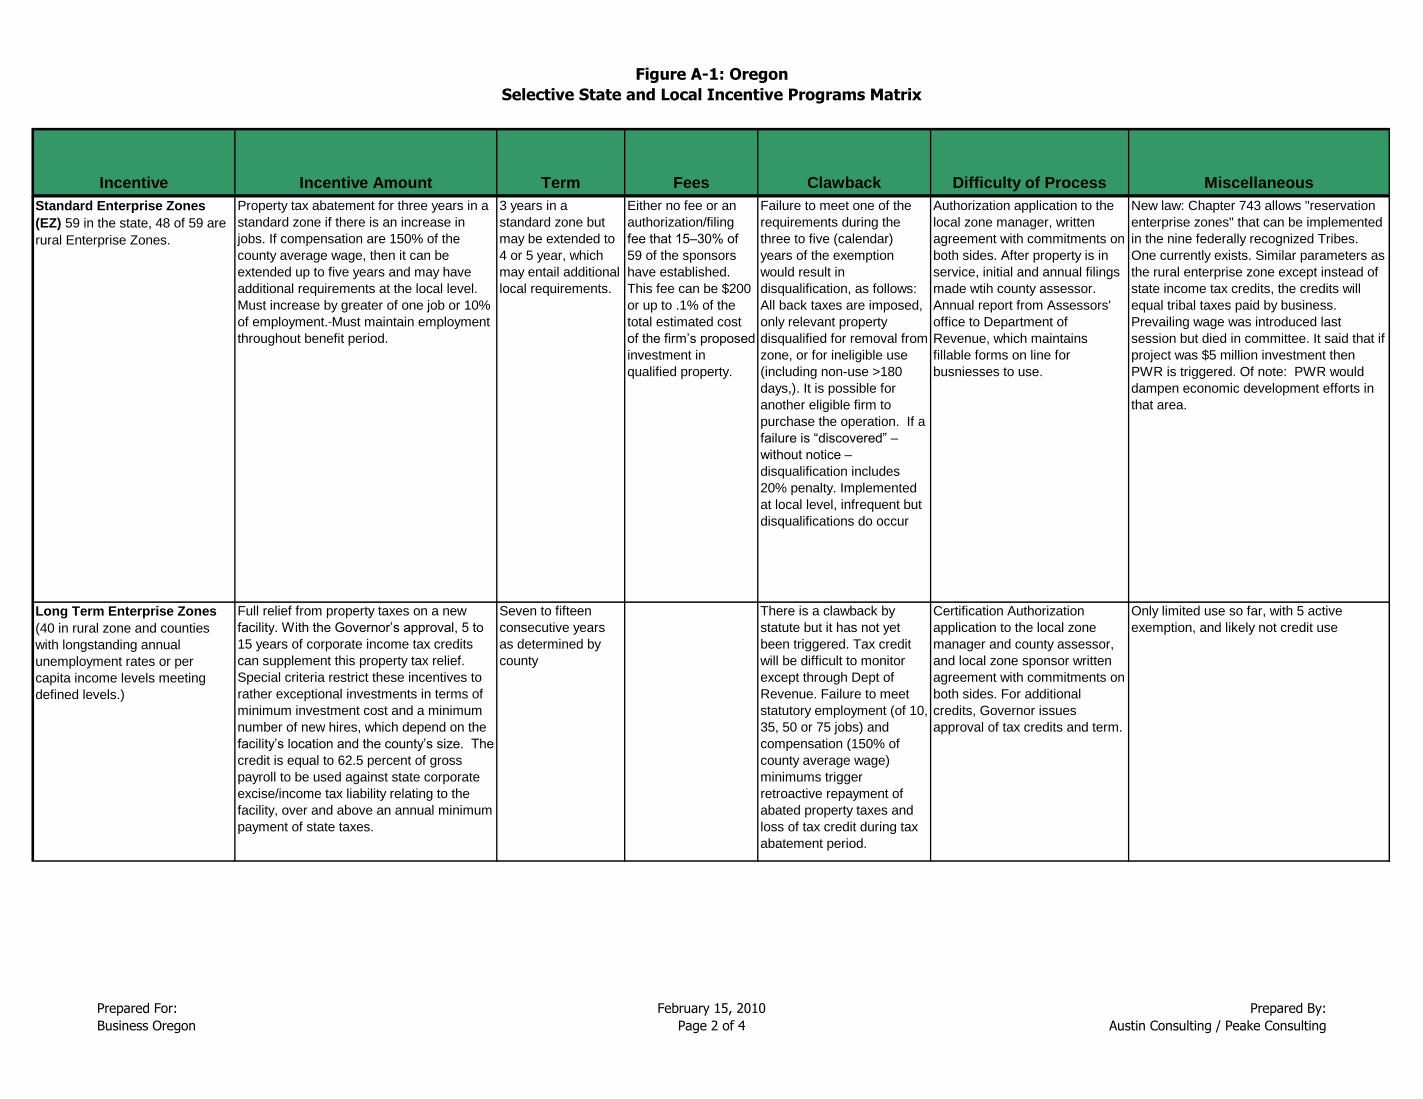
Figure A-1: Oregon
Selective State and Local Incentive Programs Matrix
Incentive Incentive Amount Term Fees Clawback Difficulty of Process Miscellaneous
Standard Enterprise Zones
(EZ) 59 in the state, 48 of 59 are
rural Enterprise Zones.
Property tax abatement for three years in a
standard zone if there is an increase in
jobs. If compensation are 150% of the
county average wage, then it can be
extended up to five years and may have
additional requirements at the local level.
Must increase by greater of one job or 10%
of employment. Must maintain employment
throughout benefit period.
3 years in a
standard zone but
may be extended to
4 or 5 year, which
may entail additional
local requirements.
Either no fee or an
authorization/filing
fee that 15–30% of
59 of the sponsors
have established.
This fee can be $200
or up to .1% of the
total estimated cost
of the firm’s proposed
investment in
qualified property.
Failure to meet one of the
requirements during the
three to five (calendar)
years of the exemption
would result in
disqualification, as follows:
All back taxes are imposed,
only relevant property
disqualified for removal from
zone, or for ineligible use
(including non-use >180
days,). It is possible for
another eligible firm to
purchase the operation. If a
failure is “discovered” –
without notice –
disqualification includes
20% penalty. Implemented
at local level, infrequent but
disqualifications do occur
Authorization application to the
local zone manager, written
agreement with commitments on
both sides. After property is in
service, initial and annual filings
made wtih county assessor.
Annual report from Assessors'
office to Department of
Revenue, which maintains
fillable forms on line for
busniesses to use.
New law: Chapter 743 allows "reservation
enterprise zones" that can be implemented
in the nine federally recognized Tribes.
One currently exists. Similar parameters as
the rural enterprise zone except instead of
state income tax credits, the credits will
equal tribal taxes paid by business.
Prevailing wage was introduced last
session but died in committee. It said that if
project was $5 million investment then
PWR is triggered. Of note: PWR would
dampen economic development efforts in
that area.
Long Term Enterprise Zones
(40 in rural zone and counties
with longstanding annual
unemployment rates or per
capita income levels meeting
defined levels.)
Full relief from property taxes on a new
facility. With the Governor’s approval, 5 to
15 years of corporate income tax credits
can supplement this property tax relief.
Special criteria restrict these incentives to
rather exceptional investments in terms of
minimum investment cost and a minimum
number of new hires, which depend on the
facility’s location and the county’s size. The
credit is equal to 62.5 percent of gross
payroll to be used against state corporate
excise/income tax liability relating to the
facility, over and above an annual minimum
payment of state taxes.
Seven to fifteen
consecutive years
as determined by
county
There is a clawback by
statute but it has not yet
been triggered. Tax credit
will be difficult to monitor
except through Dept of
Revenue. Failure to meet
statutory employment (of 10,
35, 50 or 75 jobs) and
compensation (150% of
county average wage)
minimums trigger
retroactive repayment of
abated property taxes and
loss of tax credit during tax
abatement period.
Certification Authorization
application to the local zone
manager and county assessor,
and local zone sponsor written
agreement with commitments on
both sides. For additional
credits, Governor issues
approval of tax credits and term.
Only limited use so far, with 5 active
exemption, and likely not credit use
Prepared For:
Business Oregon
February 15, 2010
Page 2 of 4
Prepared By:
Austin Consulting / Peake Consulting

Figure A-1: Oregon
Selective State and Local Incentive Programs Matrix
Incentive Incentive Amount Term Fees Clawback Difficulty of Process Miscellaneous
Oregon Investment Advantage The exemption is a 10-year waiver of all
income and excise taxes relating to
qualifying business operations. Criteria =
specific per capita income criteria,
industrial or Urban Growth Boundary (UBG)
zone in city of < 15,000. Must create at
least five new full-time, year-round jobs.
The jobs also have minimum pay
requirements. Facility operations must be
the first of their kind in Oregon for the
company and they must not compete with
existing businesses in the area.
Ten years Without five jobs in future
(and compensation
standard), then drop out of
the program. No retroactive
effect. Not required to file
every year.
There are two application forms
necessary for this program. A
preliminary certification is
completed before hiring or any
construction work is done. An
annual certification is then
completed for each of the 10
years that the income tax
exemption is claimed. Both
application are on-line and fill-
able with Business Oregon.
Number of eligible counties will shrink from
more than 20 to less than 10 after 2010.
Strategic Reserve Fund Discretionary grant funds. Usually set up as
a loan and not paid back if commitments
are made. Interest rate is 5% if not
forgiven. (Unwritten policy of $5,000/job) for
"traded-sector" business, including
manufacturing (and now also, electrical
generation) for training or other expenses.
Funding: 2007-09 = $7,425,000, 2009-11 =
$5,914,187, which may be reduced further.
Three years No fees If the jobs are not
created/retained and then
maintained, usually for 8
consecutive calendar
quarters, the loan is not
forgiven and must be
repaid. Loan agreements
usually allow for partial
forgiveness if all other
conditions have been met
except the job
creation/retention and
maintenance on which is
forgiven on a pro-rata basis.
Administered by the Oregon
Business Development
Department. A proposal is
made, staff determines if the
Department wants to fund it.
Then it goes to the Governor for
approval. There is a contract
agreement.
Prevailing wage restriction if more than
$750,000 state and local commitment.
Companies have a three year window to
meet the terms. Very few don't comply; five
were required to send a partial payment
between 1995-2005 and none since then.
Prepared For:
Business Oregon
February 15, 2010
Page 3 of 4
Prepared By:
Austin Consulting / Peake Consulting

Figure A-1: Oregon
Selective State and Local Incentive Programs Matrix
Incentive Incentive Amount Term Fees Clawback Difficulty of Process Miscellaneous
Energy Loan Program Many
commercial projects qualify for
both the Business Energy Tax
Credit (BETC) and a low-interest
loan.
http://www.oregon.gov/ENERGY/
LOANS/selphm.shtml
Loans usually range between $20,000 and
$20 million. Most energy efficiency
measures, renewable energy measures
and waste heat projects are eligible. Loans
can pay for related costs such as
engineering and design, permits, loan fees,
and project management.
Loan terms usually
range from five to 15
years, depending on
available funds and
project type. Longer
terms may be
available. The loan
term must be within
the expected life of
the project. Loans
are fixed rate. Rates
vary depending on
the type of borrower
and project and
when the Loan
Program sells sold
bonds. Commercial
renewable energy
and waste heat
projects may qualify
for lower tax-exempt
rates
The application fee is
.1 percent (up to
$2500) of the amount
requested. The
Energy Loan
Program also
charges an
underwriting fee of .5
percent, with a $500
minimum and $5,000
maximum.
Adequate collateral for
government borrowers if the
equipment is being
financed. Commercial
loans must be fully secured.
A first or second mortgage
on the project´s land,
buildings, and equipment is
usually pledged. Other
assets may be pledged, if
necessary.
An applicant that must obtain an
energy facility site certificate
under ORS 469.300 to 469.520
for a project is not eligible for a
loan except if the project is
exempted from the site
certificate requirement by ORS
469.320(2) or other exemptions
granted by the Energy Facility
Siting Council.
Contact: Art Fish, Arthur Fish, Incentives Coordinator, Oregon Business Development Department, 503-986-0140, www.oregon4biz.com, Fax: 503-581-5115, State Lands Building Suite 200, 775 Summer St NE, Salem OR
97301–1280
Note: The information contained in this report is confidential and not for disclosure outside Business Oregon except under prior written approval of Austin and Peake Consulting.
Prepared For:
Business Oregon
February 15, 2010
Page 4 of 4
Prepared By:
Austin Consulting / Peake Consulting

Figure A-2: California
State and Local Incentive Programs Matrix
Incentive Incentive Amount Term Fees Clawback Difficulty of Process Miscellaneous
Enterprise Zone Annual sales tax credit on purchases up to $20 million of
mfg equipment purchased each year for five years, 50%
tax credit per qualified employee over five years (Year
1/50%, 2/40%, 3/30%, 4/20%, 5/10%) based upon lesser
of actual wage or 150% of state minimum wage, and in
some cases. Qualified employee and other criteria can
severely restrict benefit. Up to 100% net operating loss
(NOL) deduction with a 15 years carry-forward, Net
interest deduction for lenders to Zone businesses,
Accelerated expensing of some depreciable property. 5
percent bid preference on service and commodity
contracts valued at more than $100,000 and may request
an additional 1 to 4 percent workforce preference by
certifying to hire a specified percent of their contract
workforce labor hours from a targeted employment area,
or from enterprise zone eligible employees. (Was
suspended for 2008 and 2009)
Annual sales tax credit
for five years, net
operating loss (NOL)
deduction with a 15
years carry-forward.
Term is tied to the life of
the Zone and is
customarily renewed
prior to expiration. Most
have been renewed in
the last couple of years
so the life is estimated
to be 15 years.
No fees No clawbacks Application and approval
process little more difficult than
the compliance process. For
that, a company files a specific
form with annual tax return but
even that can be considered
cumbersome and likely would
take an accountant to complete.
CA's tax structure is very unpredictable
and very volatile...more so than other
states which results in a boom or bust
cycle. A Commission was established to
address the volatility. Look for the
upcoming legislature to possibly be
presented with the findings. Possibility of
a pendulum swing back after Governor
leaves office in another year. Governor's
green initiatives have been successful
but he has been blamed for the deficit.
May see another $10-12 billion come up
early 2010. Of Note: Effective 1/1/2011,
CA current method for assessing taxes
on businesses that have operations in
CA but have significant sales outside, the
state will level the tax playing field as
companies can elect to have a single
sales factor. By establishing a permanent
elective single sales factor (allowing
companies to choose to weigh only sales
made in the state--not property or payroll-
-to determine corporate taxes owed.)
Local Revelopment Areas Most communities (386 in state) have these vehicles to
promote economic development which are locally
controlled. Incentives can range from low interest loans
(some forgivable), fee and permit deferral or abatement,
infrastructure improvements, up to and including free
land for the right project.
On-going No fees Varies by community Varies by community Based on tax increment financing (TIF) at
local level. [Urban renewal in Oregon is
base on TIF]
Reduced Utility Rates Private and public owned utilities can provide special
incentives to industrial users. In addition, in the case of
municipally owned utilities, their rates can be at much at
30-40% less than other utilities.
On-going No fees Varies by utility Varies by utility
Prepared For:
Business Oregon
February 15, 2010
Page 1 of 2
Prepared By:
Austin Consulting / Peake Consulting

Figure A-2: California
State and Local Incentive Programs Matrix
Incentive Incentive Amount Term Fees Clawback Difficulty of Process Miscellaneous
Local Agency Military Base
Recovery Area (LAMBRA),
Targeted Tax Area (TTA) and
Manufacturing Enhancement
Area (MEA) are similar to
Enterprize Zones
Hiring tax credit, sales and use tax credit, business
expense deduction and NOL carry forward. LAMBRA
was established in response various base closure acts
and to attract investment and redevelopment of former
military bases. There are currently eight LAMBRA's in
California. TTA is similar to Enterprise Zone but is
restricted to certain SIC codes. The MEA was also
established in response to base closures and there are
two in CA.
On-going and NOL for
15 years
No fees No clawbacks Application and approval
process little more difficult than
the compliance process. For
that, a company files a specific
form with annual tax return.
Sales Tax Exemption Rebates
(utilized by one city)
By working with the City, A company that establishes a
customer service office in a particular CA city, can
negotiate and approve a company's California sales
orders, they are able to receive a cash rebate equal to
between .25% and .5% of their taxable sales to their
California customers. The City also has partnered with
two sister cities in Illinois and Texas to allow the
companies to also take advantage of the same savings
opportunity for all their Illinois and Texas sales. This
program was successfully piloted with Sears, as well as
another leading Minnesota based national retailer, and a
$2 billion medical manufacturer. There are opportunities
for .com companies.
On-going No fees No clawbacks Geared toward operations with large
about sales to California customers
Contacts: Mary Jane Olhasso, 909-395-2197 cell: 909-518-9756 and Mary Ingersall, Team CA 916-791-9900. Brad Gates, Economic Development Coordinator, City of Ontario, 303 East B Street, Ontario, CA 91764, P 909-395-
2081,[email protected]
Note: The information contained in this report is confidential and not for disclosure outside Business Oregon except under prior written approval of Austin and Peake Consulting.
Prepared For:
Business Oregon
February 15, 2010
Page 2 of 2
Prepared By:
Austin Consulting / Peake Consulting
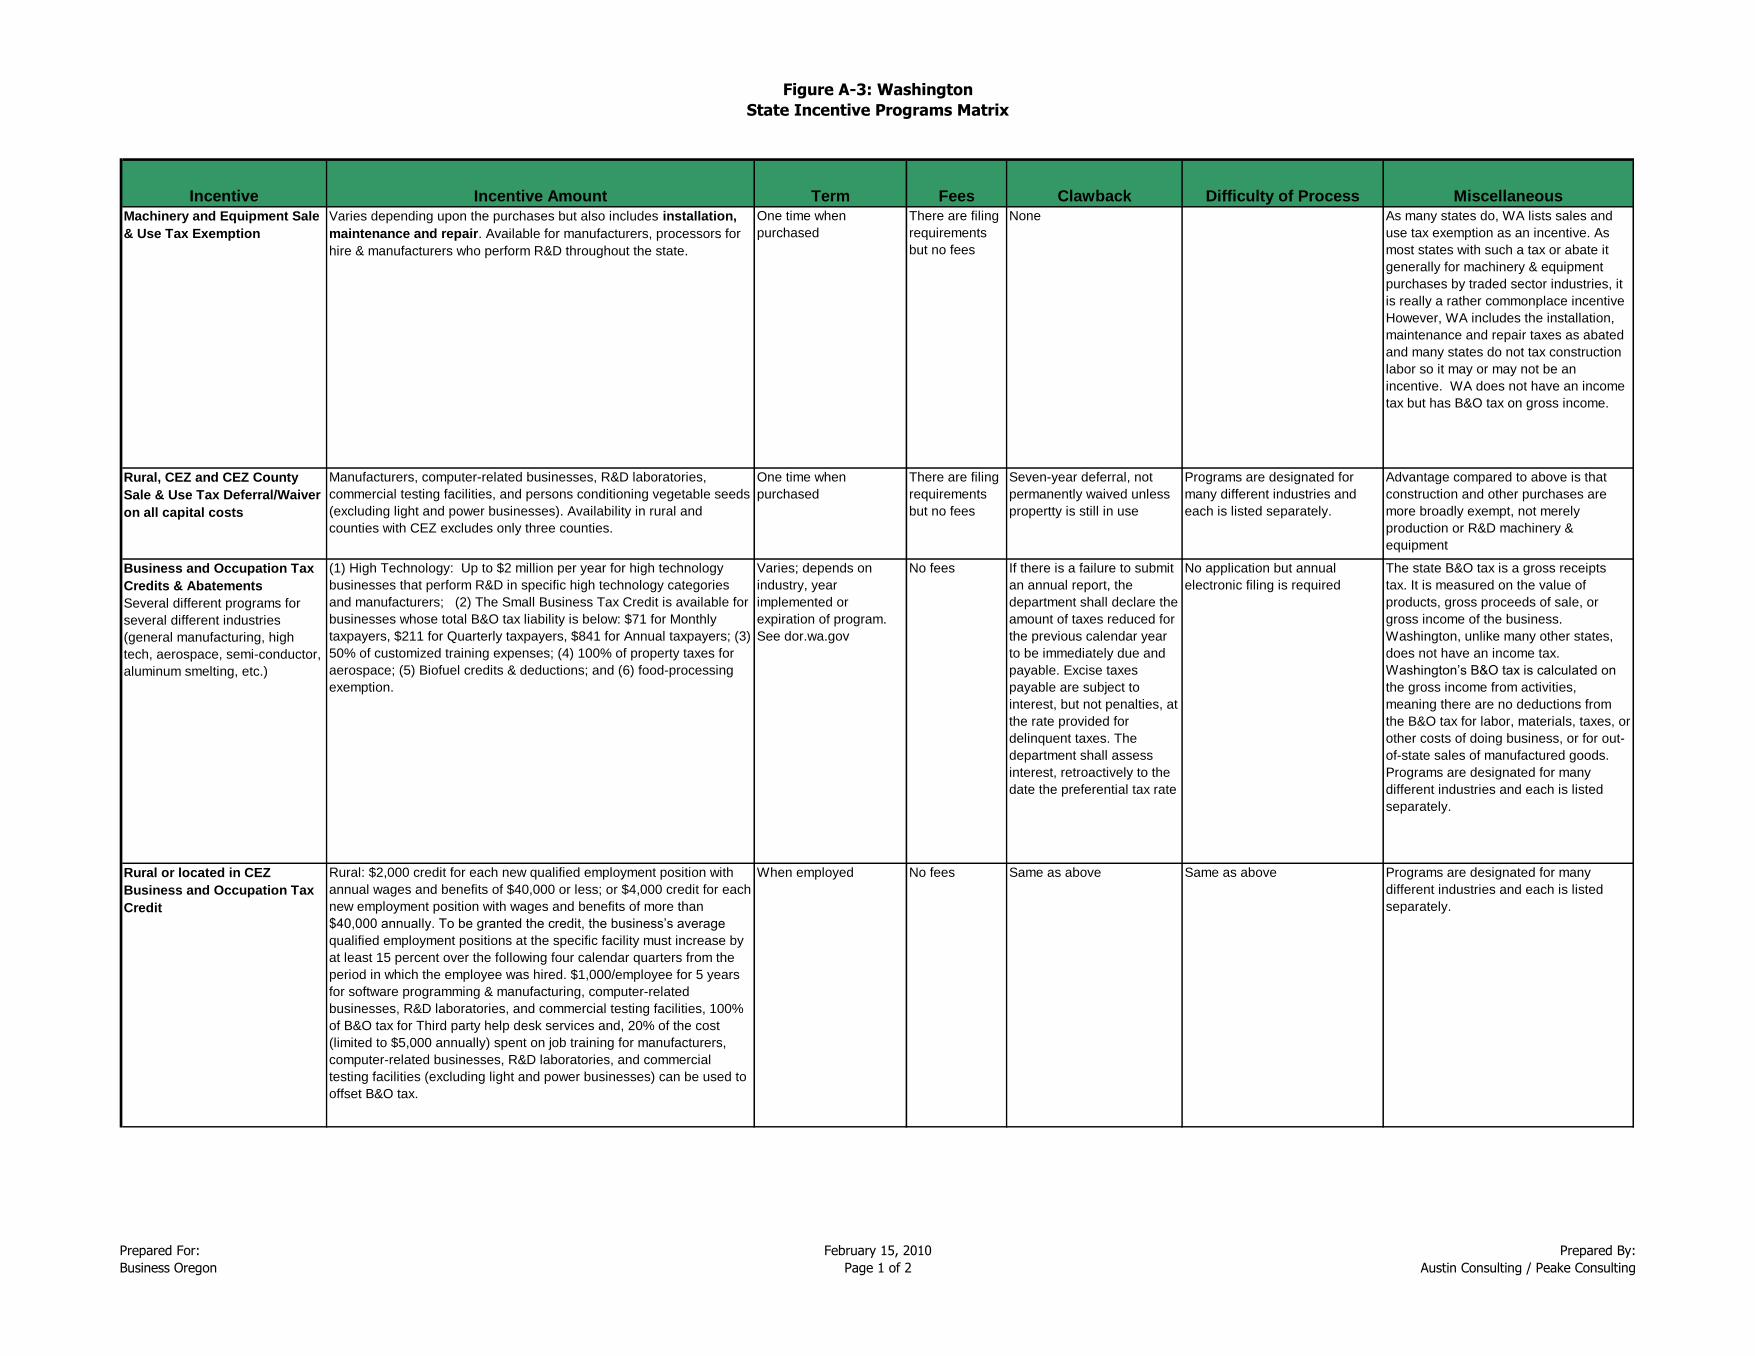
Figure A-3: Washington
State Incentive Programs Matrix
Incentive Incentive Amount Term Fees Clawback Difficulty of Process Miscellaneous
Machinery and Equipment Sale
& Use Tax Exemption
Varies depending upon the purchases but also includes installation,
maintenance and repair. Available for manufacturers, processors for
hire & manufacturers who perform R&D throughout the state.
One time when
purchased
There are filing
requirements
but no fees
None As many states do, WA lists sales and
use tax exemption as an incentive. As
most states with such a tax or abate it
generally for machinery & equipment
purchases by traded sector industries, it
is really a rather commonplace incentive
However, WA includes the installation,
maintenance and repair taxes as abated
and many states do not tax construction
labor so it may or may not be an
incentive. WA does not have an income
tax but has B&O tax on gross income.
Rural, CEZ and CEZ County
Sale & Use Tax Deferral/Waiver
on all capital costs
Manufacturers, computer-related businesses, R&D laboratories,
commercial testing facilities, and persons conditioning vegetable seeds
(excluding light and power businesses). Availability in rural and
counties with CEZ excludes only three counties.
One time when
purchased
There are filing
requirements
but no fees
Seven-year deferral, not
permanently waived unless
propertty is still in use
Programs are designated for
many different industries and
each is listed separately.
Advantage compared to above is that
construction and other purchases are
more broadly exempt, not merely
production or R&D machinery &
equipment
Business and Occupation Tax
Credits & Abatements
Several different programs for
several different industries
(general manufacturing, high
tech, aerospace, semi-conductor,
aluminum smelting, etc.)
(1) High Technology: Up to $2 million per year for high technology
businesses that perform R&D in specific high technology categories
and manufacturers; (2) The Small Business Tax Credit is available for
businesses whose total B&O tax liability is below: $71 for Monthly
taxpayers, $211 for Quarterly taxpayers, $841 for Annual taxpayers; (3)
50% of customized training expenses; (4) 100% of property taxes for
aerospace; (5) Biofuel credits & deductions; and (6) food-processing
exemption.
Varies; depends on
industry, year
implemented or
expiration of program.
See dor.wa.gov
No fees If there is a failure to submit
an annual report, the
department shall declare the
amount of taxes reduced for
the previous calendar year
to be immediately due and
payable. Excise taxes
payable are subject to
interest, but not penalties, at
the rate provided for
delinquent taxes. The
department shall assess
interest, retroactively to the
date the preferential tax rate
No application but annual
electronic filing is required
The state B&O tax is a gross receipts
tax. It is measured on the value of
products, gross proceeds of sale, or
gross income of the business.
Washington, unlike many other states,
does not have an income tax.
Washington’s B&O tax is calculated on
the gross income from activities,
meaning there are no deductions from
the B&O tax for labor, materials, taxes, or
other costs of doing business, or for out-
of-state sales of manufactured goods.
Programs are designated for many
different industries and each is listed
separately.
Rural or located in CEZ
Business and Occupation Tax
Credit
Rural: $2,000 credit for each new qualified employment position with
annual wages and benefits of $40,000 or less; or $4,000 credit for each
new employment position with wages and benefits of more than
$40,000 annually. To be granted the credit, the business’s average
qualified employment positions at the specific facility must increase by
at least 15 percent over the following four calendar quarters from the
period in which the employee was hired. $1,000/employee for 5 years
for software programming & manufacturing, computer-related
businesses, R&D laboratories, and commercial testing facilities, 100%
of B&O tax for Third party help desk services and, 20% of the cost
(limited to $5,000 annually) spent on job training for manufacturers,
computer-related businesses, R&D laboratories, and commercial
testing facilities (excluding light and power businesses) can be used to
offset B&O tax.
When employed No fees Same as above Same as above Programs are designated for many
different industries and each is listed
separately.
Prepared For:
Business Oregon
February 15, 2010
Page 1 of 2
Prepared By:
Austin Consulting / Peake Consulting

Figure A-3: Washington
State Incentive Programs Matrix
Incentive Incentive Amount Term Fees Clawback Difficulty of Process Miscellaneous
Sales Tax Deferral/Waiver Construction of cold storage & certain food manufacturing or
processing facilities, defers or waives sales and use tax associated
with construction, expansion, or renovation of qualified buildings and
acquisition of qualified machinery and equipment in research and
development and pilot scale manufacturing in the above fields and
biotechnology & Medical Device Manufacturing. Provides a sales and
use tax exemption for machinery and equipment used directly in
generating electricity using fuel cells, wind, solar or landfill gas energy,
and for the labor and services necessary to install such equipment, but
only if the purchaser develops a facility capable of generating not less
than 200 watts of electricity. Sales and use tax exemption for
purchases of computer hardware, software and peripherals, and
charges for labor and services related to the installation of such
equipment in the aerospace industry. Food wholesalers, retail
distribution centers, third-party warehouses and cold storage
warehouses machinery & equipment; plus 50% sales tax refund on the
wholesalers, retail distribution centers, third-party warehouses and cold
storage warehouses. 100% (2009-13) and 75% afterwards for
Renewable energy generators.
When purchased No fees Seven-year deferral, not
permanently waived unless
propertty is still in use
Same as above Programs are designated for many
different industries and each is listed
separately.
Two-step reduction in tax rate
or reduced B&O
Two-step reduction for companies extracting and wholesaling of timber
and manufacturing of timber or wood products. B&O tax reduced to
.138% or eliminated for biofuel manufacturers, distributors, etc .
Varies; depends on
industry, year
implemented or
expiration of program.
See dor.wa.gov
No fees Same as above
Property tax reduction Software designed for a specific need for a single person or group of
persons is exempt from property tax. Included in the definition is a
modification of canned computer software. Six year real and personal
property tax reduction for biodiesel fuel manufacturers
Six years No fees Same as above
Reduced B&O for Renewable
Manufacturers
October 1, 2009, the rate is reduced to .275% and the specified
components expanded, as compared to 0.454%..
Program expiration June
30, 2014
No fees Same as above Same as above
Contacts: Susan St. Germain, 206-256-6114,Sr. Business Development Manager, Washington State Community, Trade & Economic Development, 2001 6th Ave, Suite 2600, Seattle, WA and James Palmer 206-256-6146
Two bills were introduced the week of January 25, 2010 in the Washington Legislature (SB 6789 and HB 3147) that would allow a 15-month sales tax exemption on the purchase and installation of computers and energy for new data centers in rural
counties. The repeal of the tax benefits in November 2007 has slowed data center development in the state, which had seen a boom in mission-critical projects in 2006 and 2007. Microsoft cited the tax issue in its decision to migrate its Windows Azure
cloud computing service out of Washington State. Meanwhile, Oregon is attracting major new projects, including a $188 million Facebook data center in Prineville
Note: The information contained in this report is confidential and not for disclosure outside Business Oregon except under prior written approval of Austin and Peake Consulting.
Prepared For:
Business Oregon
February 15, 2010
Page 2 of 2
Prepared By:
Austin Consulting / Peake Consulting

Figure A-4: Arizona
Selected
Incentive Programs Matrix
Incentive Incentive Amount Term Fees Clawback Difficulty of Process Miscellaneous
Foreign Trade Zone (FTZ) Real and personal property reduction to 5% (down from
25%) resulting in 77% reduction in real and personal
property taxes. (Only state with unique FTZ incentives)
Life of zone Application fee
= $8-12,000,
Activation fee =
$2,000,and
Annual fee of
$7,000
None since they are tax
reclassifications or earned
income tax credits.
If there is no FTZ, then the local
process takes about one month
but the Federal process can take
8-12 months.
Enterprise Zone State income tax credits of $3,000 per qualified
employee and property tax reduction of 77%
Property tax reduction
for five years
None None since they are tax
reclassifications or earned
income tax credits.
Military Reuse Zones 77% reduction in real and personal property, state
income tax credits of up to $10,000 per new employee
and certain sales and use tax exemptions on certain
types of construction
Property tax reduction
for five years
None None since they are tax
reclassifications or earned
income tax credits.
R&D Tax Credit Program Income tax credit for qualified research with maximum
credit of $2.5 million, if expenses do not exceed the
maximum credit, credit is 22% of expenses. If allowable
expenses do exceed $2.5 million, credit is $600 plus
13% of expenses over $2.5 million
While research is being
conducted
None None since they are tax
reclassifications or earned
income tax credits.
Refundable Energy Incentive
Program
Up to 10% refundable tax credit AND 77% reduction in
property taxes. Annual state cap of $70 million. 51% of
new FTEs must pay wages at least 125% of median
annual Arizona wages. Taxpayer must pay 80% of
health insurance premiums or 80% of the cost of
alternative health benefits providing standard
comprehensive coverage. Minimum new FTEs for 10%
credit: 1.5 per $500,000 invested in a manufacturing
facility,1 per $200,000 invested in a headquarters.
Minimum $25 million capital investment.
Property tax reduction
for up to ten years
where 51% of new FTEs
pay wages at least
125% of median annual
Arizona wages and for
15 years at 200%.
Fee and
certification
process
depends on the
size of project.
The cap is
$10,000 per
application.
5-year clawback on
underperforming projects,
with liberal hardship clause
included in the bill language.
Pre-certification application,
application and investment must
be made during taxable years
beginning in 2010 through
2014.Credit is allowable in equal
annual installments over five
consecutive years beginning with
the year of the investment.
ADOC administers the program
and certification process. They
will assess financial health of
company, value of refundable
tax credits and ensure
compliance through the annual
tax filings. The tax filing will
ensure number of jobs and
wages.
Job Training Grants Cash assistance of up to $8,000 per qualified employee
of up to $1.5 million. Up to 75% of expenses incurred
for technical skills training
As employees are hired No fees None May be fiscally suspended in 2009
Contacts: Matthew D. Miller, Strategy Analyst, Greater Phoenix Economic Council,2 N. Central Ave., Suite 2500,Phoenix, Arizona 85004,Phone: 602.262.8628,[email protected], Chris Camacho 602-262-8619.
Note: The information contained in this report is confidential and not for disclosure outside Business Oregon except under prior written approval of Austin and Peake Consulting.
Prepared For:
Business Oregon
February 15, 2010
Page 1 of 1
Prepared By:
Austin Consulting / Peake Consulting

Figure A-5: Utah
Selected Statewide Incentive Programs Matrix
Incentive Incentive Amount Term Fees Clawback Difficulty of Process Miscellaneous
Economic Development Tax
Increment Financing (EcDIF)
Refundable tax credit for up to 30% of new state
revenues (state portion of sales (4.7), corporate
income (5% of revenue attributable to state) and
withholding taxes (5%) paid to the state over the life (5-
10 years) of the project; no more that 50% credit in
one year; must pay 125% of the county average
(100% in rural counties) and preferably be in a
targeted industry. (Excludes retail distribution projects)
At least 50 jobs in urban areas; Local community must
provide local incentive as well. New revenue over 10
years = 1 million so, 30% is $30,000. 1st year can
receive 50% of new state revenues for 3 years and
then 30% thereafter until the 30% of new state
revenues or the term is exceeded. 30% is for a rare
project. Typical is 20-25%.
Typically 5-10 years and
is determined on a case
by case basis. Legislation
authorizes up to 20 years
but 20 years is rare. Time
is based on how
comfortable the company
is extending their numbers
out 5 or 10 years.
Numbers are used to
establish a baseline for
what they can receive in
benefits
No fees. Post-performance. Enter
into an incentive agreement
with GOED that specifies
performance milestones
Local community must also
participate; must enter into a
performance contract with
specific milestones. Policy and
legislation require buy in by
community through match (loose
interpretation) that can be
infrastructure, property tax
abatement, etc.
The Board of the Governor's Office of
Economic Development (GOED Board)
consists of 15 members appointed to
four-year terms by the Governor with the
advice and consent of the Senate. No
more than eight members are from one
political party and the membership
represents all areas of the state. The
GOED Board is charged with promoting
and encouraging the economic,
commercial, financial, industrial,
agricultural, and civic welfare of the
state. The GOED Board also advises
GOED staff on the development,
attraction, retention and expansion of
businesses, industries and commerce
within the state. The state has a Request
for Protected Record Status form on line.
Economic impact analyses are
conducted.
Industrial Assistance Fund
(IAF)
Grant from Governor's Office of Economic
Development Board used for attraction and retention.
Based on # employees retained or created. Funded by
legislature but budget shortfall means likely won't be
funded this year. Typical amount is $2500 to
$5000/job. Legislation authorizes up to $15,000 but
recently highest is $5,000. Past year is 10-15% of
projects. Must create/retain 50 new jobs and pay
125%/urban and 100%/rural county average wage.
One time grant No fees. Post-performance. Enter
into an incentive agreement
with GOED that specifies
performance milestones.
There is a clawback if #s are
not met.
Must enter into a performance
contract with specific milestones
Rural Fast Track Grant available to small existing companies in rural
Utah for creating high paying jobs. Population <
30,000 w/average household income < $60k, Been in
business > 2 years, at least 2 employees; up to
$50,000. $1k for each new job paying over 110%,
$1250 for over 115% and $1500 for jobs paying over
125% of county average wage.
One time grant No fees. Post-performance. Enter
into an incentive agreement
with GOED that specifies
performance milestones.
There is a clawback if
commitments are not met.
Must enter into a performance
contract with specific milestones
Green flags: # and salary of jobs, new
state revenue, long term capital
investment, targeted industry,
competition with other locations. Red
flags: In business < 3 years, lack of
profitability for previous 3 years,
bankruptcy or negative cash flow, sales
declines, start-up company, non-profit
org or retail
Prepared For:
Business Oregon
February 15, 2010
Page 1 of 2
Prepared By:
Austin Consulting / Peake Consulting

Figure A-5: Utah
Selected Statewide Incentive Programs Matrix
Incentive Incentive Amount Term Fees Clawback Difficulty of Process Miscellaneous
Renewable energy
Development Incentive
(Hydroelectric, Solar, Biomass,
Geothermal, Wind, Waste
Gas/Heat Recovery
Refundable tax credit up to 100% of new state tax
revenues (including, state, corporate, sales and
withholding taxes) over the life of the project (typically
5-10 years). Renewable energy generation or related
manufacturing. Must create new high paying jobs at
least 125% of urban county average or 100% of rural,
demonstrate company stability sustainability, local
community incentive, compete with other locations
and enter into incentive agreement with GOED.
Generation project doesn't have minimum job
requirement.
Typically 5-10 years Post-performance. Must enter into a performance
contract with specific milestones
Green flags: # and salary of jobs, new
state revenue, long term capital
investment, targeted industry,
competition with other locations; Red
flags: start up or pre-revenue, non-profit,
bankruptcy or negative cash flow, sales
decline.
Contacts: Samantha Mary Julian, Energy and Natural Resources Cluster Director, State of Utah, Governor’s Office of Economic Development,324 South State Street, Salt Lake City 84111,801-538-8746, [email protected]. Theresa Foxley,
Renewable Energy Project Manager, Corporate Recruitment and State Incentives, 801-538-8742, Cell: 801-558-2803 ,[email protected] IAMC contact: Jeff Edwards 801-328-8824
Note: The information contained in this report is confidential and not for disclosure outside Business Oregon except under prior written approval of Austin and Peake Consulting.
Prepared For:
Business Oregon
February 15, 2010
Page 2 of 2
Prepared By:
Austin Consulting / Peake Consulting

Figure A-6: New Mexico
Selected Statewide Incentive Programs Matrix
Incentive Incentive Amount Term Fees Clawback Difficulty of Process/Criteria Miscellaneous
JTIP/Job Training Incentive
Program
Customized training for OJT. 50% of the employees
wages, up to 1040 hours. 2 factors: hourly wage rate
and Federal O'net Job Zone classification (web site).
Urban = 50%, rural = 65%. Have to be increasing
employment. Not available for skills upgrade. Only
10% of employees qualified for training can be the
G&A (sales, marketing, finance, etc.). Cash back to
the company. Submit form and receive $ back in 30
days.
Indefinite time period. No application
fee. Have to be
NM resident for
at least one
year in their
lifetime. If hire
>20 in urban
area, have to
provide health
insurance and
must pay 50%.
If a facility that received JTIP funds
closes or if layoffs of JTIP trainees occur
within 1 year of the completion of training,
the JTIP Board will require the refund of
the funds associated with any JTIP
trainee(s) which were claimed and
subsequently laid off. Layoff is defined
as a separation of an employee from an
establishment that is initiated by the
employer as a result of market forces or
other factors not related to employee
performance. The board will require a
refund of funds from companies whose
JTIP layoffs exceeded $100,000 of
reimbursement for those employees. The
board will require a refund of funds within
90 days of notification. If a JTIP eligible
trainee is laid off during the training period
and is subsequently rehired within four
months by the same employer, the
trainee can be treated as a new hire and
thus remains eligible for JTIP.
The company submits their application and
certificate of eligibility (relative to jobs, when
required) to the NM Tax and Revenue
Department. The Department approves the
application, returns the approved form or letter
of approval to the company, then the
company submits the approved application
form along with the next filing of their CRS-1
to utilize the credit.
Refundable High Wage Tax
Credit
Credit of up to 10% of combined value of the salary
and benefits for each net new job > than $40k in
urban and $28k in rural. Credit is against the gross
receipts tax (state portion only which is 5%), employee
withholding and compensating tax. Must be hired by
7/1/15. Do not have to be NM residents.
Four consecutive years.
Have to have worked for
48 weeks prior to the
company getting credit
for it.
No application
fee. Submit
CRS1 one
page form to
Tax and
Revenue
If credit exceeds liability, get refund from
Tax and Revenue. No clawback as job
was occupied in that year and claim is
after the job.
Pretty easy process, with tax forms that
coordinate across programs.
Manufacturing Tax
Credit/Investment Tax Credit
5% of value of the equipment. Limited to 85% of
compensating, gross receipts or withholding tax within
any one reporting period. Remaining credits can be
carried forward indefinitely. Purchases made prior to
2020. Employment: must hire one new full time
employee for every $500,000 up to $30 million. After
$30 million = one employee per million and one new
employee must be hired for each $500,000 in
equipment. So have to hire 60 employees up to the
$30 million and one per million after that.
Each purchase. If using
IRB for land, bldg and
equipment can use
benefits of IRB and
Investment Tax Credit.
PILOT required for IRB
depending on fiscal
impact analysis but it is
usually 3-5%.
No fees/fill out
CRS1 form
Clawback and there is a requirement that
you have to apply within one year of
purchase of equipment. No recapture
provision.
Complete CRS1 form. Tax forms coordinate
across programs.
If taking Investment Tax credit and high
wage credit. Take ITC first and then High
Wage Tax credit since that is refundable.
Discretionary NM has a history of doing this in the past. How much
Gov has or is receiving in this session is unknown.
For extraordinary project, there will be funds. Used for
infrastructure, raw land or building. Economic impact
analysis is conducted. Funds depend on budget
Secretary and Governor decide amounts. They also
look for additional money from locals and/or
developers; Gov said in past they want a 25% match
from county, city and/or developer.
Typically funds are
provided over two years
Unknown Unknown Unknown
Prepared For:
Business Oregon
February 15, 2010
Page 1 of 2
Prepared By:
Austin Consulting / Peake Consulting

Figure A-6: New Mexico
Selected Statewide Incentive Programs Matrix
Incentive Incentive Amount Term Fees Clawback Difficulty of Process/Criteria Miscellaneous
Technology Job Tax Credit Credit of 4% in urban and 8% in rural for expenses in
qualified research. If employment in either urban or
rural EZ increases, credit can be doubled. Bldg,
equipment, land, operational costs, payroll, patent,
etc. expenses are broadly defined. BUT need to be
doing research on YOUR product or service.
Technological in nature, must improve your product or
create new product. Cosmetic changes are not
included. Can take an additional 4% credit if
increasing base payroll expense by $75,000 for each
million $ of expenditure. Credit against CRS1. Not
available for expenditures with IRB. Can claim other
expenses but not the IRB related.
Can be carried forward
indefinitely
No fees/fill out
CRS1 form
Clawback: Credit cancellation and
recapture provision for unused credits in
the event facility is non operational for
180 within 2 years after approval of
credit.
If claim ITC for equipment, cannot claim
equipment cost under Technology Job Tax
Credit. Cannot be doing contract research.
Tax forms coordinate across programs.
Have to maintain an entire different
accounting for the incentives to be
obtained. So the R&D dept would have
to be monitored separately from the
other departments.
Transferrable Rural Jobs Tax
Credit
Credit of up to 6 1/4% on first $16,000 of wages paid.
Goes against CRS1. Employee has to have worked
48 of 52 weeks in reporting period being claimed. Tier
1 = 15,000 people or less = four years, Tier 2 =
30,000 people = two years. Credit is transferrable but
not refundable. If employees make over $16k =
$1,000/job. If the credits are transferred or sold the
price is determined by the market.
Eligible for a two year
credit or four year credit.
Excess Credit can be
carried forward three
years
No fees/fill out
CRS1 form
No clawback. Can go against owners personal income tax
or the companies corporate income tax in
addition to the CRS1
Alternative Energy
Manufacturing Tax Credit
Mirrors Investment Tax Credit except specific to
energy related product. Same criteria for jobs. If
manufacturing, can take ITC and Alternative energy
Tax credit AND high wage and the IRB (with tax
exemptions). Credit amount is 5% of value of
investment. Job requirements are minimal.
Carries forward for 5
years
No fees/goes
against CRS1
Clawback: Credit cancellation and
recapture provision for unused credits in
the event facility is non operational for
180 consecutive days within 2 years after
approval of credit.
Complete form. Tax forms coordinate
across programs.
Take Alternative, ITC and then high
wage tax credit.
Contacts: Angela Talbot, Senior Business Development Manager, [email protected], cell (505) 301-6560, direct (505) 338-1113 Ext. 104, Gary Tonges, Albuquerque 505-246-6200. Vice President, Business Development, Albuquerque Economic
Development,,851 University Blvd., Suite 203,,Albuquerque, NM 87106, 505-246-6212 - Direct
Note: The information contained in this report is confidential and not for disclosure outside Business Oregon except under prior written approval of Austin and Peake Consulting.
Prepared For:
Business Oregon
February 15, 2010
Page 2 of 2
Prepared By:
Austin Consulting / Peake Consulting

Figure A-7: Oklahoma
Selected Statewide Incentive Programs Matrix
Incentive Incentive Amount Term Fees Clawback Difficulty of Process Miscellaneous
Basic Quality Jobs
Program
Cash rebates of up to five percent (5%) of
gross annual taxable wages. Source of
revenue is state income tax. State has a
formula that determines what the percentage
will be. For 5%, have to have $45-50k average
salary. If down to $30k, amount would be
about 3.8%. It is an econometric model,
payroll, average wages, capital investment,
amount of project shipped out of state. Some
rural counties (66 of 77 counties) are
automatically 5%. Average. is 4.4%. If project
goes into Opportunity Zone, the wage
threshold is removed and is automatically 5%.
Ten years for
manufacturers with $2.5
million payroll, small
employers (90 or less) =
up to 7 years and the
High Impact Program
(lower threshold for
payroll) = up to 6 years.
Legislatively decided.
Based on jobs/wages
cost benefit analysis
which provides a limit
and the maximum
length can be as
mentioned above.
Origination fee is
$1,000 and is deducted
from their first payment.
No fee for small
employers
Pay for Performance/if
don't create jobs, then
don't receive the benefit. If
don't have $2.5 million
payroll, then company is
dropped from the program.
If they collect some of the
money and is dropped
form the program, the
money is not given back to
the state.
Online excel spreadsheet for
application, technical
assistance in completing
application available and
encouraged, quarterly reports
due in order to receive payroll
tax refund, Takes 2-3 weeks
for approval. For any claim
submitted prior to end of the
month, the payment is made
in the first two weeks of
following month.
Extremely well laid out for specific industries that
fit the program as listed by NIACS code. Specific
NAICS codes for Manufacturing (only 3), R&D
(2), Central Administrative Office or R&D Testing
(9), Other support service for Transportation
industry (1), Wind power generation (1), Air
Transportation (1), Flight Training (1), Service
companies IF 50% sales out of state (55),
electric services (1). $2.5 million payroll
threshold and company has 3 years to reach
amount. A lower payroll threshold can be
available for targeted areas. High Impact
Program - Lowers annualized payroll threshold to
$1 million for businesses that produce new direct
jobs to the State that are equal to or greater than
1% of the total labor force of the county in which
they locate. Payout is 2.5% of taxable wages for
up to 6 years. Small Employer Program - Allows
qualifying small businesses (90 employees or
less) to receive up to a 5% cash-back incentive
for up to 7 years to locate or expand in
Oklahoma. All companies must meet minimum
wage and health coverage requirements. $1.5
million payroll for food processing or locating on
former military base. 0% threshold for within 10
miles of Superfund site or National Priorities List.
Program is also available for Change in Control
(of companies) that includes change in >50%
ownership or value of assets. Great web site
with form to fill out about your project:
http://www.okcommerce.gov/index.php?option=c
Prepared For:
Business Oregon
February 15, 2010
Page 1 of 3
Prepared By:
Austin Consulting / Peake Consulting
Figure A-7: Oklahoma
Selected Statewide Incentive Programs Matrix
Incentive Incentive Amount Term Fees Clawback Difficulty of Process Miscellaneous
21st Century Quality Jobs Initial cash rebates of up to 7% of taxable
wages for the first three years and cash
rebates of up to 10% once they reach 10 jobs
at $86,637 average wages in the highest
county. Source of funds is payroll withholding
and $ is set aside. Can have as few as 10
employees but average pay has to be 300% of
average in that county. (i.e. Average wage is
$25,000 and goes to $75.000)
Ten years $2,500 ($10 million or
less contract) , $5000
(more than $10 million
and less than $50
million), $7,500 (any
contract over $50
million) depending on %
of benefit. All fees come
out of first payment.
Performance contract is
based on wage/jobs,
taxable payroll = final
dollar amount company
can claim over the life
of the program.
Contract outlines
performance
responsibilities, and
state responsibilities.
Pay for Performance/if
don't create jobs, then
don't receive the benefit
Online excel spreadsheet for
application, technical
assistance in completing
application available and
encouraged, quarterly reports
due in order to receive payroll
tax refund,
Passed in spring of 2009; effective November,
2009, enhanced list of job categories, must pay
at least 50% of health insurance, =/> than 300%
of lesser of average of OK state wage or
average of county wage where locating. May
make company ineligible for some other
programs but a comparative estimate of
incentive benefits is offered by Dept of
Commerce for each program. Specialty
hospitals, heavy civil engineering, motion picture
and video, financial investment companies,
insurance carriers, professional, scientific, etc.
were added to the quality job list.
Investment/New Jobs Tax
Credit Package
A five-year tax credit against corporate
income tax liability on the greater of 1% per
year of investment in qualified new
depreciable property or a credit of $500 per
year per job against the corporate income tax
liability. Amount doubles in an Enterprise
Zone. Company selects based upon their
investment and jobs. Can now be combined
with Quality Jobs depending on the
investment and jobs. Jan 1, 2010, for
manufacturing job creation and investing $40
million or more in depreciable property related
to the manufacturing they can then participate
with investment credit of 2% and the quality
jobs. If combined there is a wage threshold of
$35,131 avg. This is ONLY available to
manufacturers.
Each year for Five years
and can be carried
forward until it can be
used.
No fee. Credit is against
taxable income and is
claimed through normal
tax filing and the wage
portion submits
quarterly filing for the
Quality Jobs.
Pay for Performance/if
don't create jobs or make
the investment, then don't
receive the benefit
Online form for investment tax
credit. $40 million investment
can be made over 3 year
period. If company doesn't
invest $40 million, they would
have to return the investment
tax credit. Prior to 1/1/10 it
was either investment or
quality jobs; after it can be
both.
Plus Sales Tax Refunds on construction
materials for certain manufacturers and aircraft
maintenance repair facilities; on purchases of
computers, data processing equipment,
telecommunications equipment for certain
aircraft facilities; and for purchases of computer
services and data processing equipment for
qualified computer services or research and
development companies and Income Tax
Exemptions/Credits for hazardous waste
recycling reuse or source reduction; for CNG
conversion; and for insurance premiums.
Available for manufacturers, processing or
aircraft maintenance.
Opportunity Fund No new appropriations were given to the
Oklahoma Opportunity Fund in the 2009
legislative session. However, the program still
exists for the possibility of future
appropriations
One time grant. Undetermined All payments would cease
until those wage
thresholds and annual
payroll requirements are
met.
Undetermined Not funded in 2009 but program is available for
future funding.
Local Property Tax
Abatement
Five year ad valorem tax abatement Five years No fees. Pay for performance. If
you don't build it, you don't
get it.
File a form annually with the
local tax assessor. No
Payment in Lieu of Taxes
(PILOT) to cover schools. All
taxes are abated.
Prepared For:
Business Oregon
February 15, 2010
Page 2 of 3
Prepared By:
Austin Consulting / Peake Consulting

Figure A-7: Oklahoma
Selected Statewide Incentive Programs Matrix
Incentive Incentive Amount Term Fees Clawback Difficulty of Process Miscellaneous
OK City--Strategic
Investment Program
$2500-5000/per job cash payment depending
on the wages
One time grant but a
certain % per year for
four/five years
No fees. Source is $65-
70 million bond issue.
No clawback. If jobs are
created, then payments
are made. If jobs cease to
exist, then payments
cease.
Oversight Committee
approves before the City
Counsel gives final approval.
Economic impact analysis conducted and is
used to determine the incentive amount.
Minimum $1.75 million in payroll, 100% of local
average wage, if 120% of wages may have a
bonus rider and levels of funding are clearly
defined. Look for a return on the investment in 5
to 7 years based upon jobs, taxes paid and
location. Provision for emerging technology
companies.
Aerospace Industry Engineer
Workforce Tax Credits
This legislation enacted in 2008 provides tax
credits to both engineers who are hired by an
Oklahoma aerospace company and to those
Oklahoma aerospace companies that hire
them beginning January 1, 2009. The
Oklahoma aerospace companies hiring the
engineers will receive a tax credit equal to
10% of the compensation paid to an engineer
during the first five years of his or her
employment if the engineer graduated from an
Oklahoma college, or a tax credit equal to 5%
of the compensation paid to the engineer
during the first five years of his or her
employment if the engineer graduated from a
college outside Oklahoma up to the maximum
credit of $12,500 per qualified employee per
year. In addition, the new law grants
Oklahoma aerospace companies a tax credit
in the amount of 50% of the tuition reimbursed
to a new engineer graduate for the first four
years of his or her employment. The tax credit
is limited to 50% of the average annual tuition
paid by an engineer at a qualified program at
a public university in Oklahoma. Engineers
who are hired after January 1, 2009 by an
Oklahoma aerospace company may also
No term listed No Fees No Clawbacks There is a form 565 on the
Oklahoma Tax Commission
web site;" Credits for
Employers in the Aerospace
Sector”. This is completed by
company when filing tax
return.
Renewable No new incentives for renewable but if they fit
the other programs they can participate. Wind
power farms are allowed to take property tax
exemption. Wind maintenance service
companies were added to the Quality jobs
programs.
See above See above See above See above
Contacts: Sandy Pratt, 405-815-5104, Robin Roberts Krieger 405-297-8945. Jim Igarta, Oklahoma's Fast Forward Team, Business Location Site Location Manager, Oklahoma Department of Commerce, 900 N. Stiles Ave., Oklahoma
City, OK 73104, Phone: (405) 815-5241, E-mail: [email protected], Mobile: (405) 464-6680 and Richard Schwalbach, 405-815-5269 both at the state.
Note: The information contained in this report is confidential and not for disclosure outside Business Oregon except under prior written approval of Austin and Peake Consulting.
Prepared For:
Business Oregon
February 15, 2010
Page 3 of 3
Prepared By:
Austin Consulting / Peake Consulting
Figure A-8: North Carolina
State Incentive Programs Matrix
Incentive Incentive Amount Term Fees Clawback Difficulty of Process Miscellaneous
One NC Fund (formerly
Governor's Industrial
Recruitment Competitiveness
Fund)
NC looks at tier rankings with Tier 1 being most depressed.
Tier 1 = $12,500/job, 2 = $5,000, 3 (top 10 communities in
state) = $750-$1000/job. The amount is negotiated and paid
in cash over three years in 25% increments or as the jobs
are created. Requires 100% match from local community.
Used for equipment, building, pretty much anything.
Governor looks at all projects and is very flexible and
customized. Many companies that are not set up as cost
centers can't take advantage of job tax credits as they
would not incur any taxes.
Three years No application
fee
None as it is pay for
performance
File forms with the Employment
Security Commission (NCIU
Form 101) that goes to
Commerce with information the
company already completes for
unemployment insurance.
Program has a 50% paid health
insurance component for employee.
Job Development Investment
Grant
Company receives a discretionary amount (up to 75%) of
payroll taxes (withholding) after the jobs are created. Totally
discretionary and is determined by Commerce, Revenue
and the Budget Office (5-member committee). As an
example, may receive 50% for 6 years, 75% for 12 years
(which is the highest) with the minimum being 10% of
withholding. Can only approve up to 25 grants in any year
and the total payout cannot exceed $15 million over any 12-
month period. Usually program is reserved for major
projects ($40-50 million project and 200 jobs) unless
locating in depressed area. The job numbers can be lower
if the wages are higher. If it is a mega project-major (>100
million 1000's employees), legislature calls a special
session to approve the one-time incentive.
Over a
negotiated/discretionary
period of time, i.e., 6-12
years.
$5000 for
application
No clawback. Performance
based but if out of
compliance, the amount can
be reduced proportionately
or terminated. There can be
a recapture all or part of
grant and is at the discretion
of the committee. Also
Attorney General's office
signs off on the final
agreement.
Application must be completed
and presented to a committee
for approval. Process is a little
cumbersome as there is a pre-
application, then application,
then Gov.'s letter then contract.
There is no one application for
all programs. Every job, every
salary, description of each job,
etc. which requires the HR of
national companies to complete.
A proof of performance is
submitted. A portion of the fee
amount goes back to the
Industrial Development Fund
that goes into a utility fund that
can be used for infrastructure at
the Secretary's discretion.
Program has a 50% paid health
insurance component for employee.
Prepared For:
Business Oregon
February 15, 2010
Page 1 of 2
Prepared By:
Austin Consulting / Peake Consulting

Figure A-8: North Carolina
State Incentive Programs Matrix
Incentive Incentive Amount Term Fees Clawback Difficulty of Process Miscellaneous
Article 3J Tax Credits Statutory for (1) job creation and is based on tier system:
Tier 1 over 5 jobs = $12,500/employee, tier 2 over 10 jobs
= $5,000 per job, tier 3 over 15 = $750 /job. Sunsets in
2010. Program is a tax credit against NC income tax and
franchise tax but neither can exceed 50% of that tax liability.
(2) Project investment: Tier 1 is $0 threshold investment =
7% tax credit, Tier 2 is $1 million threshold = 5% tax credit
and Tier 3 is $2 million threshold and 3.5% tax credit. Tax
Credit for income and franchise tax for investment in (3) real
property for large project (minimum investment is $10
million over 3 years and 200 jobs over 2 years).
Job creation and project
investment is for four
years and the
investment in real
property is for 7 years
$500/per credit
for each one
that you file for.
$500 for job
creation and
$500 for
income tax
credit
Pay for performance. Get
the tax credit the following
year of the job creation.
Audited by Dept of
Revenue.
First two are fairly easy;
amendment to tax return in one
page plus the fee. Real property
requires a written determination
from the Department of
Commerce
R&D Tax Credit Based upon % of research expenditures. 0-$50 million =
1.25% of expenditures, $50-200 million = 2.25% credit, over
$200 million = 3.25%. If they contract with the university
research system, they are allowed 20% of those expenses
as a credit against income and franchise taxes.
Fifteen year carry-
forward for credit if they
are unable to make use
of it in its entirely in that
year.
No application
fee
There is no claw back
provision. It is one
"installment" taken in the
year that the expenses were
incurred. If don't meet the
requirements set forth in the
statute, they would not
create a credit.
Substantiate expenses for R&D
and submit to Dept of Revenue.
Renewable Energy/Corporate
Tax Credit
35% Corporate tax credit, maximum of $2.5 million per
installation. Credit must be taken in five equal installments;
allowable credit may not exceed 50% of a taxpayer's state
tax liability for the year, reduced by the sum of all other
state tax credits.
Credit may be carried
forward over next five
years if it can't be used
in the first year
No application
fee
File form with NC Department of
Revenue when file taxes. Install
system in one year and file for
the credit the following year.
Renewable Energy/Property
Tax Abatement
Exempts 80% of the appraised value of a "solar energy
electric system" (also known as a photovoltaic, or PV,
system) from property tax. For the purposes of this
assessment, the term "solar energy electric system" means
"all equipment used directly and exclusively for the
conversion of solar energy to electricity
Throughout life of facility No application
fee
Unknown
Local Option - Revolving Loan
Program for Renewable Energy
and Energy Efficiency
Amount undetermined. No more than 8% interest and no
longer than 15 years
Up to 15 years Unknown Unknown Funding from the Energy
Efficiency and Conservation
Block Grants from the federal
government and the city's or
county's unrestricted revenue.
Contacts: Jennifer Lantz, Wilson EDC 2252-237-1115, Donna Phillips 252-355-9048 ext. 223 (state), [email protected], Martyn Johnson, 919-733-8572 and Garrett Wyckoff Jr., Economic Development Representative, 919-733-
1437. Cell 919-600-0878, [email protected]
Note: The information contained in this report is confidential and not for disclosure outside Business Oregon except under prior written approval of Austin and Peake Consulting.
Prepared For:
Business Oregon
February 15, 2010
Page 2 of 2
Prepared By:
Austin Consulting / Peake Consulting

Figure A-9: Michigan
State Incentive Programs Matrix
Incentive Incentive Amount Term Fees Clawback
Difficulty of
Process Miscellaneous
Mega Employment Tax Credit
Program--Standard, Rural and
High Tech
Tax credit of up to 100% of wages and benefits. As an example if a
company has 25 employees X $40k wages = $1 mill payroll,
Therefore 4.35% (payroll tax) paid by employees is returned to the
company = $43,500/year. Wages must be 150% of federal
minimum wage or can't apply.
Term is negotiated;
usually 2, 5 or 10 years
with a maximum of 20
years. Typically it is for
5-7 years.
Rural = $2500,
Standard = $5000 plus
one-time 1/2 of 1%
administration fee
New clawback was put in
place in last year if the
company moves
Corporate staffing and
investment chart
completed plus
financing, wages, etc. is
submitted to packaging
team to review. If staff
likes it, they decide to
scope the project. The
2nd step is a pre-
commitment letter then
it goes to state board
MEGA strategic board.
Usually takes 60-90
Most are tax credit based. Constitution does
not allow cash grants.
No deal closing fund.
Anchor District Tax Credit 5% tax credit against corporate tax investments for made by
suppliers of high tech within 10 miles of location. If supplier utilizes
tax credit, amount is reduced to 2.5%. Must create at least 10 jobs
and have a minimum $1 million investment. Limited to five
companies per year.
Five years Info not available Info not available Corporate staffing and
investment chart
completed plus
financing, wages, etc. is
submitted to packaging
team to review. If they
like it, they decide to
scope the project. The
2nd step is a pre-
commitment letter then
it goes to state board
MEGA strategic board.
Usually takes 60-90
days.
Brownfield Tax Credits 12.5% Tax credit (20% in Urban area) to offset the MI Business
Tax. Credits can be taken by a company, syndicated or sold, or can
be refunded for $.85 on the dollar. An assignment can only be
issued after the credit is issued after the Request for Certificate of
Completion AND in the same year the credit is issued. Qualification
requirements come from the Department of Environmental Quality.
They have fairly loose requirements for sites to be designated as a
Brownfield, but have specific requirements that must be followed
on their clean up action plans.
No set time period Large = $10k + .7%
admin fee, Small =
$5k + 1.4% admin fee,
Mini = $2,500 without
admin fee. The
application fee can
later be used to offset
the admin fee.
There aren’t any claw
backs, because if the
company doesn't complete
the work they don’t receive
payment.
Pre-application,
application, letter from
state, certificate of
completion (preliminary
and final).
Signature local program. State
authorized. Public Act 198
50% abatement on new real and personal property tax at the local
level. Available for manufacturing, high tech and alternative energy.
Core communities (larger cities) have a PA 328 = 100% abatement
on personal property only.
Up to 12 years and is
decided at the local
level
Some communities
may have a small
processing fee of $50
or $75.
Depends on the community. Process is much easier
as it can be done at the
local level and usually in
30 days.
Renewable: Nonrefundable
Business Activity Tax Credit
Equal to the lesser of (1) the amount by which a business' "tax
liability attributable to qualified business activity" for the tax year
exceeds the business's "baseline tax liability attributable to qualified
business activity," or (2) 10% of the amount by which the business'
"adjusted qualified business activity" performed in Michigan, outside
of a "Renaissance Zone,"
Unknown Unknown Unknown Activity must be certified
by the Michigan Next
Energy Authority.
NextEnergy is a comprehensive economic-
development plan to position Michigan as a
world leader in the research, development,
commercialization and manufacture of
alternative-energy technologies.
Prepared For:
Business Oregon
February 15, 2010
Page 1 of 2
Prepared By:
Austin Consulting / Peake Consulting
Figure A-9: Michigan
State Incentive Programs Matrix
Renewable: Refundable
Payroll Tax Credit
Refundable credit equal to their qualified payroll amount multiplied
by their income tax rate for that year. In order for an employee's
compensation to qualify for this treatment, the employee must work
on alternative energy-related research, development or
manufacturing
Unknown Unknown Unknown Unknown
Refundable Photovoltaic
Manufacturing Tax Credit
25% of the capital costs for building a qualifying PV manufacturing
facility. Maximum incentive: Generally $15 million, but one certificate
may be for up to $25 million. Total credits issued for all years may
not exceed $75 million.
Credit generally taken
over two years in equal
installments; minimum
capital investment and
job creation
requirements apply
Unknown Unknown Unknown
Renewable Energy
Renaissance Zones
100% abatement of Michigan Business Tax, state education tax,
personal and real property taxes, and local income taxes
Tax abatements last up
to 15 years, phased out
in 25% increments over
last 3 years
Unknown Unknown Unknown Michigan enacted legislation allowing for the
creation of Renewable Energy Renaissance
Zones (RERZ). Renaissance zones --
renewable energy renaissance zones are
just one type -- offer significant tax benefits
to facilities located within their boundaries.
Facilities within a renaissance zone do not
pay the Michigan Business Tax, state
education tax, personal and real property
taxes, or local income taxes (where
applicable). The original law allowed for the
designation of up to 10 RERZs, but a 2008
amendment expanded the number to 15
Contacts: Lindsay Eister, Manager Business Attraction, Michigan Economic Development Corporation, 300 N. Washington Sq., Lansing, MI 48913, (517) 749-7785 Cell (517) 373-3786 Voicemail, [email protected]; Justin Horvath/Owasso MI 989-
723-5144
Note: The information contained in this report is confidential and not for disclosure outside Business Oregon except under prior written approval of Austin and Peake Consulting.
Prepared For:
Business Oregon
February 15, 2010
Page 2 of 2
Prepared By:
Austin Consulting / Peake Consulting
Figure A-10: New York
State Incentive Programs Matrix
Incentive Incentive Amount Term Fees Clawback Difficulty of Process Miscellaneous
Empire Zone. The next three
incentives are available for
qualified companies in the zone.
http://www.tax.state.ny.us/pdf/pu
blications/multi/pub26_201.pdf
Program is due to expire 6/2010. Likely extend it for specific # of years. If
company is in the program before then, they will be grandfathered. Possible
there will be an exception to the Investment Tax credit and it will be reduced
from 5% to 2.5%. Everything else remains the same if it is just renewed. Rule of
thumb is for every job created 25% of wages/benefits of that salary can be used
as a tax credit of income taxes.
10 years No fees If company ceases business
and there is still depreciable
assets, a portion of the
credit is required to be
recaptured
Difficult process for all incentives
as company is dealing with NY
Dept of Labor and NY Tax and
Finance. Compliance is pretty
easy.
Wage Tax Credit Credits are $1,500 per employee per year; for employees in special targeted
groups the amount is raised to $3,000 per employee per year. In investment
zones, this credit is increased by $500 for workers with wages over $40,000.
Unused state income tax credits can be forwarded indefinitely and new
businesses (those that have been taxable for five years or less) are eligible for a
50% refund of unused credits. As an example, One employee, $1500 year one,
earn $1500, yr 2 = $3000/50% refund or $750/employee per year refunded to
them. 1/2 is carried forward and other 1/2 is in a cash refund. Available to
companies hiring full-time or full-time equivalent employees in the zone.
5 year term but can be
carried forward 15 years
No fees Pay for performance/no
clawback. If don't meet
criteria, then can be
dropped from the program.
Difficult process for all incentives
as company is dealing with NY
Dept of Labor and NY Tax and
Finance. Compliance is pretty
easy.
Investment Tax Credit Businesses that create new jobs and make new investments in production
property and equipment may qualify for tax credits of up to 10% of their eligible
investment. New businesses may elect to receive a refund of certain credits, and
all unused credits can be carried forward for 15 years. As an example, a
company make $100 million investment, they earn $10 million tax credit in year
one. 1/2 (5%) they carry forward to use against future tax liability. The other 1/2
(5%) of $100 million is refunded to them in year two for sum of $5 million.
One time credit that can
be carried forward 15
years
No fees If company ceases business
and there is still depreciable
assets, a portion of the
credit is required to be
recaptured
Difficult process for all incentives
as company is dealing with NY
Dept of Labor and NY Tax and
Finance. Compliance is pretty
easy.
Employment Incentive Tax
Credit
3% of investment or 30% of the Investment Tax Credit (providing certain
employment figures are met). Non refundable credit works out to be 9% of
investment. In other words, an additional Employment Incentive Credit equal to
30% of the investment tax credit is available for each of the three years after the
Investment Tax Credit (ITC) is claimed if employment is increased when the
investment is made. Unused credits can be forwarded indefinitely and new
businesses (personal income tax only) are eligible for a 50% refund of unused
credits.
Available for each of
three years after
investment tax credit is
claimed and can be
carried forward
indefinitely.
No Fees Pay for performance/no
clawback. If don't meet
criteria, then can be
dropped from the program.
At the moment, set to expire in
June 30, 2010. The future is
unknown but there is not new
program to present so there will
likely be an extension of current
program.
Real Property Tax Credit (or
rebate)
To encourage development, expansion, and improvement of commercial
property, up to a 75% refund on property tax is available to offset increased
assessments due to improvements to business and commercial property.
Percentage is based upon wages, investment, etc. paid. Empire Zone program
= if own property, 75% refund for 10 years, Can also go through IDA and have
different schedules where they abate (up front) taxes and depends on the type of
development they are targeting and can be for as long as 15 years. If 15 years,
it would be a sliding scale upward. IDA compares to see which is better. Empire
Zone credits can be selected along with the IDA property tax abatements if
determined better.
Ten to fifteen years No fees for
Empire Zone
but there is for
the IDA. IDA
typically
charges 1%.
Empire Zone reviews
annually and if company
doesn't meet their
commitments, there can be
a clawback. But it is pay for
performance so there is little
reason for clawback. If don't
live up to commitment, then
can de-certify the company
for Empire zone benefits.
Empire Zone would be handled
locally as would the property tax
abatement. When filing their
taxes, company would file for
return of taxes.
Tax Reduction Credit Tax credit based upon a complicated formula, a company can get their taxes
owed reduced to $0.
10 years No fees No clawback Have to be in the zone, create
jobs and apply for the zone
benefits. All credits can be
applied to their income tax
returns.
Capital Tax Credit 25% of investments made in any one year and cannot exceed $100,000/year or
a $300,000 lifetime maximum. May not exceed 50% of taxable liability. Available
for companies with less than 250 employees.
Available as
investments are made
No fees Recapture required: 100% if
within first 12 months, 67%
if between 24-36 months
and 33% if between 36-48
months.
Application is made through the
state business tax return.
Prepared For:
Business Oregon
February 15, 2010
Page 1 of 3
Prepared By:
Austin Consulting / Peake Consulting

Figure A-10: New York
State Incentive Programs Matrix
Incentive Incentive Amount Term Fees Clawback Difficulty of Process Miscellaneous
R&D Tax Credit Investments in research and development facilities are eligible for a 9%
corporate tax credit. Additional credits are available to encourage the creation
and expansion of emerging technology businesses, including a three-year job
creation credit of $1,000 per employee and a capital credit for investments in
emerging technologies.
Available as
investments are made
No fees If company ceases business
and there is still depreciable
assets, a portion of the
credit is required to be
recaptured
Difficult process for all incentives
as company is dealing with NY
Dept of Labor and NY Tax and
Finance
Discretionary Cash Grant Economic impact analysis determines amount NY should invest in a project and
how much is needed to win the project.
Receive first
dispersment (50% of
grant) after submitted
documentation project is
complete investment
wise and have
employed 50% of
committed jobs. Next
25% comes when the
next 25% and last 25%
when they hit full
employment.
If hire less than
300
employees,
there is a 1%
commitment
fee.
Clawback is pro-rated. Need
to keep 85% employment
for five years. If fall below
that, legally can recapture.
For every year the jobs are
kept, 20% is vested. May
issue and extend and freeze
the grant to give some
leeway.
Get offer letter, sign, once point
of disbursement they provide
documentation of investment
and jobs. Requirements are
confirmed, board approves and
issues grant disbursement. Also
a public hearing that is held.
Annual reporting required.
Green Building/Not being
funded at this time.
Corporate tax credit of up to $2 million per building distributed over five years In definite carry forward No fees Application is made to
Department of Environmental
Conservation (DEC) annual
reporting is required but the
program is currently on hold and
is not accepting applications at
this time. The DEC or another
agency has to revise the
regulations of the program
before a second round of
projects can submit requests.
There is no timeframe for
revisions.
Renewable/Green Energy
Business Growth &
Development Grant
Grant of up to 50% of project with maximum of $200,000. Available to achieve
success, to grow, and to develop new markets through new or expanded
activities in New York but is not available for R&D
In phases No fees No clawback Develop proposal and
NYSERDA would assist in the
furtherance of the product.
Dependant on the business and
the individual need. Decided on
case by case basis.
Grant, Clean Energy, and
Energy Efficient Product
Manufacturing Incentive
Program
Only facilities located within the service territories of New York's major investor-
owned utilities (IOUs) are eligible for funding. Phase I Max: lesser of 5% of
project or $75,000; Phase II Max: lesser of 20% of project or $300,000; Phase
III Max: up to $1,125,000, paid based on 25% of New York content of product
sales over 5 years;
Total: $1.5 million per project. Terms: Phases I & II: 50% cost share; Phase III:
75% cost share. Helping to bring a product to market. Grid connected.
In phases No fees No clawback Develop proposal and
NYSERDA would assist in the
furtherance of the product.
Dependant on the business and
the individual need. Decided on
case by case basis.
Prepared For:
Business Oregon
February 15, 2010
Page 2 of 3
Prepared By:
Austin Consulting / Peake Consulting
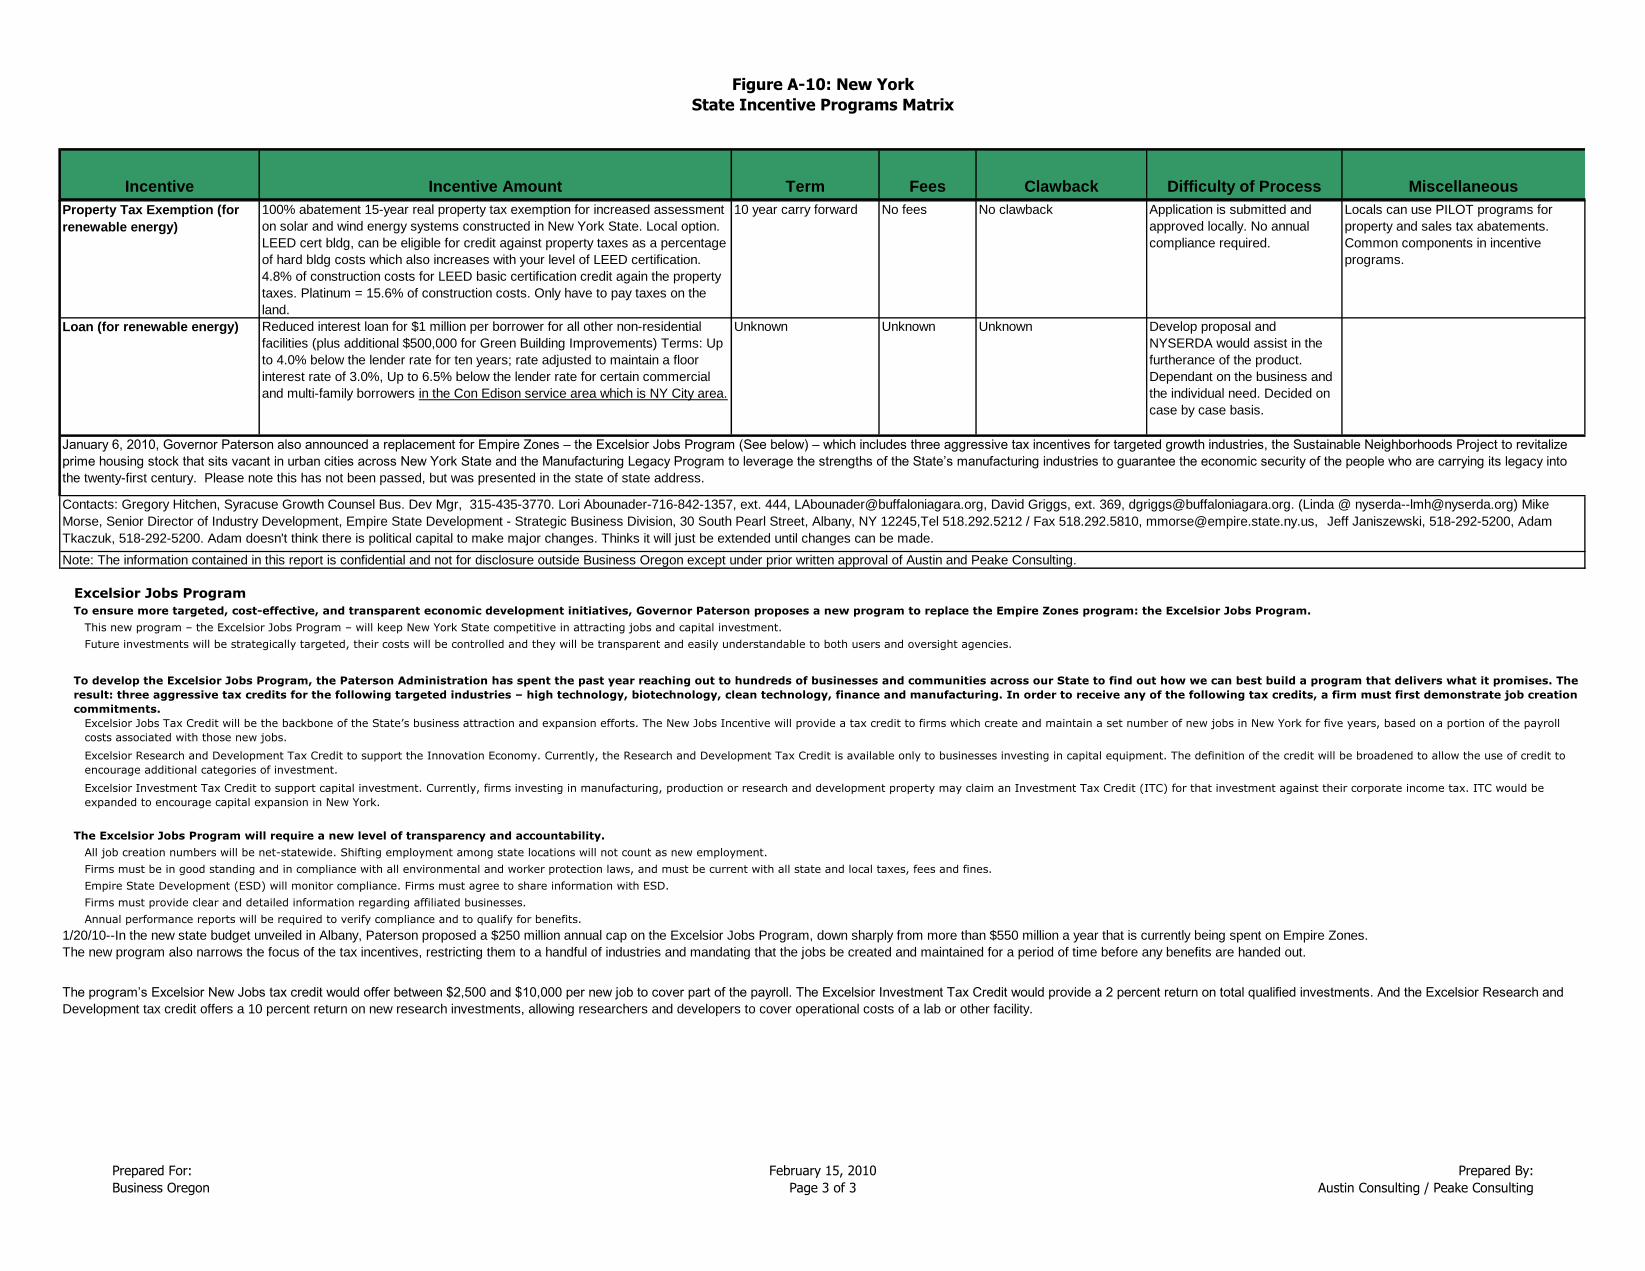
Figure A-10: New York
State Incentive Programs Matrix
Incentive Incentive Amount Term Fees Clawback Difficulty of Process Miscellaneous
Property Tax Exemption (for
renewable energy)
100% abatement 15-year real property tax exemption for increased assessment
on solar and wind energy systems constructed in New York State. Local option.
LEED cert bldg, can be eligible for credit against property taxes as a percentage
of hard bldg costs which also increases with your level of LEED certification.
4.8% of construction costs for LEED basic certification credit again the property
taxes. Platinum = 15.6% of construction costs. Only have to pay taxes on the
land.
10 year carry forward No fees No clawback Application is submitted and
approved locally. No annual
compliance required.
Locals can use PILOT programs for
property and sales tax abatements.
Common components in incentive
programs.
Loan (for renewable energy) Reduced interest loan for $1 million per borrower for all other non-residential
facilities (plus additional $500,000 for Green Building Improvements) Terms: Up
to 4.0% below the lender rate for ten years; rate adjusted to maintain a floor
interest rate of 3.0%, Up to 6.5% below the lender rate for certain commercial
and multi-family borrowers in the Con Edison service area which is NY City area.
Unknown Unknown Unknown Develop proposal and
NYSERDA would assist in the
furtherance of the product.
Dependant on the business and
the individual need. Decided on
case by case basis.
Excelsior Jobs Program
To ensure more targeted, cost-effective, and transparent economic development initiatives, Governor Paterson proposes a new program to replace the Empire Zones program: the Excelsior Jobs Program.
This new program – the Excelsior Jobs Program – will keep New York State competitive in attracting jobs and capital investment.
Future investments will be strategically targeted, their costs will be controlled and they will be transparent and easily understandable to both users and oversight agencies.
The Excelsior Jobs Program will require a new level of transparency and accountability.
All job creation numbers will be net-statewide. Shifting employment among state locations will not count as new employment.
Firms must be in good standing and in compliance with all environmental and worker protection laws, and must be current with all state and local taxes, fees and fines.
Empire State Development (ESD) will monitor compliance. Firms must agree to share information with ESD.
Firms must provide clear and detailed information regarding affiliated businesses.
Annual performance reports will be required to verify compliance and to qualify for benefits.
The new program also narrows the focus of the tax incentives, restricting them to a handful of industries and mandating that the jobs be created and maintained for a period of time before any benefits are handed out.
1/20/10--In the new state budget unveiled in Albany, Paterson proposed a $250 million annual cap on the Excelsior Jobs Program, down sharply from more than $550 million a year that is currently being spent on Empire Zones.
The program’s Excelsior New Jobs tax credit would offer between $2,500 and $10,000 per new job to cover part of the payroll. The Excelsior Investment Tax Credit would provide a 2 percent return on total qualified investments. And the Excelsior Research and
Development tax credit offers a 10 percent return on new research investments, allowing researchers and developers to cover operational costs of a lab or other facility.
To develop the Excelsior Jobs Program, the Paterson Administration has spent the past year reaching out to hundreds of businesses and communities across our State to find out how we can best build a program that delivers what it promises. The
result: three aggressive tax credits for the following targeted industries – high technology, biotechnology, clean technology, finance and manufacturing. In order to receive any of the following tax credits, a firm must first demonstrate job creation
commitments.
Excelsior Jobs Tax Credit will be the backbone of the State’s business attraction and expansion efforts. The New Jobs Incentive will provide a tax credit to firms which create and maintain a set number of new jobs in New York for five years, based on a portion of the payroll
costs associated with those new jobs.
Excelsior Research and Development Tax Credit to support the Innovation Economy. Currently, the Research and Development Tax Credit is available only to businesses investing in capital equipment. The definition of the credit will be broadened to allow the use of credit to
encourage additional categories of investment.
Excelsior Investment Tax Credit to support capital investment. Currently, firms investing in manufacturing, production or research and development property may claim an Investment Tax Credit (ITC) for that investment against their corporate income tax. ITC would be
expanded to encourage capital expansion in New York.
Contacts: Gregory Hitchen, Syracuse Growth Counsel Bus. Dev Mgr, 315-435-3770. Lori Abounader-716-842-1357, ext. 444, [email protected], David Griggs, ext. 369, [email protected]. (Linda @ [email protected]) Mike
Morse, Senior Director of Industry Development, Empire State Development - Strategic Business Division, 30 South Pearl Street, Albany, NY 12245,Tel 518.292.5212 / Fax 518.292.5810, [email protected], Jeff Janiszewski, 518-292-5200, Adam
Tkaczuk, 518-292-5200. Adam doesn't think there is political capital to make major changes. Thinks it will just be extended until changes can be made.
January 6, 2010, Governor Paterson also announced a replacement for Empire Zones – the Excelsior Jobs Program (See below) – which includes three aggressive tax incentives for targeted growth industries, the Sustainable Neighborhoods Project to revitalize
prime housing stock that sits vacant in urban cities across New York State and the Manufacturing Legacy Program to leverage the strengths of the State’s manufacturing industries to guarantee the economic security of the people who are carrying its legacy into
the twenty-first century. Please note this has not been passed, but was presented in the state of state address.
Note: The information contained in this report is confidential and not for disclosure outside Business Oregon except under prior written approval of Austin and Peake Consulting.
Prepared For:
Business Oregon
February 15, 2010
Page 3 of 3
Prepared By:
Austin Consulting / Peake Consulting

Figure A-11: Ohio
State Incentive Programs Matrix
Incentive Incentive Amount Term Fees Clawback Difficulty of Process Miscellaneous
Job Creation Tax Credit
(JCTC)
Refundable Tax credit against the Commercial Activity Tax (CAT).
Typically 50%. Reporting requirements have been eased.
Typically 50% and 5-7
years for lower wage
jobs, larger projects
would go for 8-10 years.
By statute, can go up to
75% for 15 years for
mega projects
$500
application fee
If cease operations within
term of credit, can clawback
up to 100% plus interest and
penalty (rarely); after term of
credit, can clawback up to
75% + interest. Statutorily,
OH has to take two things
into account: other
employment in state and the
impact of market conditions
on the closure. If company
fails to meet the numbers,
OH may reduce benefit
based on actuality or in
other words "right size the
credit" to what they have
accomplished.
Medium level of difficulty.
Receive a commitment letter,
make application and get
approval from tax credit
authority. Compliance
improvements provide a new
system that focuses on full time
equivalent and total payroll
which gets away from "who"
works 40 hours week and
provides the opportunity to take
info from other forms already
being submitted to the state.
Ohio had a major tax reform in 2005
along with a major incentive reform.
Ohio Job Retention Tax Credit Nonrefundable tax credit that operates similar to JCTC. 500
retained jobs minimum and $50 million investment for
manufacturing and $20 million for non manufacturing company.
Local community must also financially support the project. Amount
is up to 75% for 15 years and percentage is against CAT liability.
Amount is not as directly related to # of jobs as it is an inverse
relationship to their CAT tax. If they don't owe that much there is no
reason to go above the tax liability.
Up to 15 years .
Standard is 10 years
$500
application fee
If cease operations within
term of credit, can clawback
up to 100% plus interest and
penalty (rarely); after term of
credit, can clawback up to
75% + interest. Statutorily,
OH has to take two things
into account: other
employment in state and the
impact of market conditions
on the closure. If company
fails to meet the numbers,
OH may reduce benefit
based on actuality or in
other words "right size the
credit" to what they have
accomplished.
Medium level of difficulty.
Receive a commitment letter,
make application and get
approval from tax credit
authority. Compliance
improvements provide a new
system that focuses on full time
equivalent and total payroll
which gets away from "who"
works 40 hours week and
provides the opportunity to take
info from other forms already
being submitted to the state.
R&D lnvestment Loan Fund Non refundable (CAT) tax credit of up to $150,000 that can go up to
50% of projects allowable costs with loans ranging from $1 to 5
million fixed rate at/or below market rate and typically not > than
1/2& of current prime rate. This is partnered with the R&D tax
credit. If meeting job creation/investment commitments, eligible for
a $ for $ credit against their OH tax liability = to the amount of the
principal and interest. Typically amount is less than 45% for 125
jobs or less and will vary depending on wages up to 75% for
projects over 125 jobs.
15 year maximum.
Typical term is for
usable life of asset.
R&D equipment tends to
be in the 7-10 year
range
$1500
application fee,
processing and
commitment
fee of 1% of
loan amount
with max of
$50,000 +
annual
servicing fee of
1/4 of 1%
(.25%) of
outstanding
principal
State has the ability to raise
the interest rate if company
doesn't meet jobs
requirement and can call the
loan if they leave the state.
Medium level of difficulty.
Receive a commitment letter,
make application and get
approval from tax credit
authority.
Prepared For:
Business Oregon
February 15, 2010
Page 1 of 3
Prepared By:
Austin Consulting / Peake Consulting
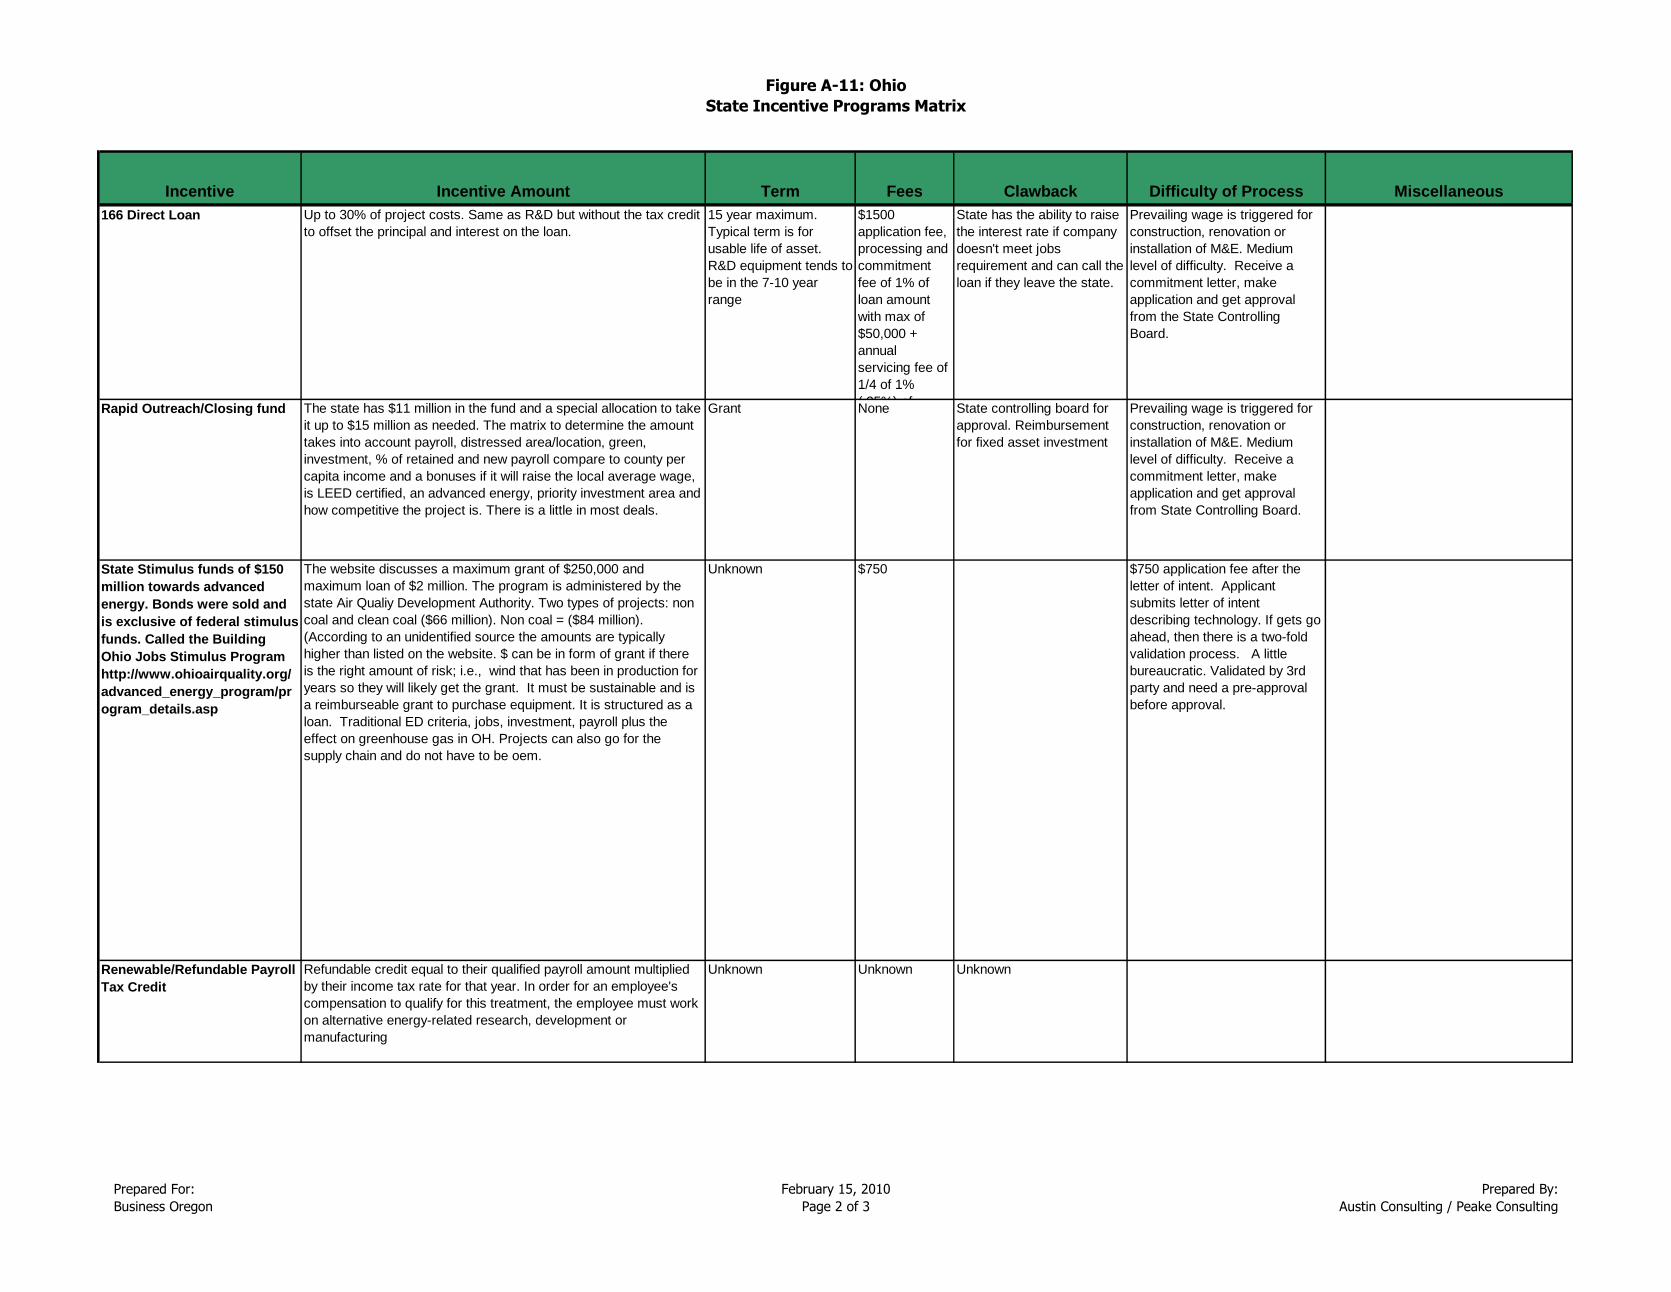
Figure A-11: Ohio
State Incentive Programs Matrix
Incentive Incentive Amount Term Fees Clawback Difficulty of Process Miscellaneous
166 Direct Loan Up to 30% of project costs. Same as R&D but without the tax credit
to offset the principal and interest on the loan.
15 year maximum.
Typical term is for
usable life of asset.
R&D equipment tends to
be in the 7-10 year
range
$1500
application fee,
processing and
commitment
fee of 1% of
loan amount
with max of
$50,000 +
annual
servicing fee of
1/4 of 1%
(.25%) of
State has the ability to raise
the interest rate if company
doesn't meet jobs
requirement and can call the
loan if they leave the state.
Prevailing wage is triggered for
construction, renovation or
installation of M&E. Medium
level of difficulty. Receive a
commitment letter, make
application and get approval
from the State Controlling
Board.
Rapid Outreach/Closing fund The state has $11 million in the fund and a special allocation to take
it up to $15 million as needed. The matrix to determine the amount
takes into account payroll, distressed area/location, green,
investment, % of retained and new payroll compare to county per
capita income and a bonuses if it will raise the local average wage,
is LEED certified, an advanced energy, priority investment area and
how competitive the project is. There is a little in most deals.
Grant None State controlling board for
approval. Reimbursement
for fixed asset investment
Prevailing wage is triggered for
construction, renovation or
installation of M&E. Medium
level of difficulty. Receive a
commitment letter, make
application and get approval
from State Controlling Board.
State Stimulus funds of $150
million towards advanced
energy. Bonds were sold and
is exclusive of federal stimulus
funds. Called the Building
Ohio Jobs Stimulus Program
http://www.ohioairquality.org/
advanced_energy_program/pr
ogram_details.asp
The website discusses a maximum grant of $250,000 and
maximum loan of $2 million. The program is administered by the
state Air Qualiy Development Authority. Two types of projects: non
coal and clean coal ($66 million). Non coal = ($84 million).
(According to an unidentified source the amounts are typically
higher than listed on the website. $ can be in form of grant if there
is the right amount of risk; i.e., wind that has been in production for
years so they will likely get the grant. It must be sustainable and is
a reimburseable grant to purchase equipment. It is structured as a
loan. Traditional ED criteria, jobs, investment, payroll plus the
effect on greenhouse gas in OH. Projects can also go for the
supply chain and do not have to be oem.
Unknown $750 $750 application fee after the
letter of intent. Applicant
submits letter of intent
describing technology. If gets go
ahead, then there is a two-fold
validation process. A little
bureaucratic. Validated by 3rd
party and need a pre-approval
before approval.
Renewable/Refundable Payroll
Tax Credit
Refundable credit equal to their qualified payroll amount multiplied
by their income tax rate for that year. In order for an employee's
compensation to qualify for this treatment, the employee must work
on alternative energy-related research, development or
manufacturing
Unknown Unknown Unknown
Prepared For:
Business Oregon
February 15, 2010
Page 2 of 3
Prepared By:
Austin Consulting / Peake Consulting

Figure A-11: Ohio
State Incentive Programs Matrix
Incentive Incentive Amount Term Fees Clawback Difficulty of Process Miscellaneous
Refundable Photovoltaic
Manufacturing Tax Credit
25% of the capital costs for building a qualifying PV manufacturing
facility. Maximum incentive: Generally $15 million, but one
certificate may be for up to $25 million. Total credits issued for all
years may not exceed $75 million.
Credit generally taken
over two years in equal
installments; minimum
capital investment and
job creation
requirements apply
Contacts: Steve Schoeny, Director, Strategic Business Investment Division, 77 S. High St., 29th Floor Columbus, OH 43215-6130, Work: 614-728-9499 Cell: 614-507-6891 and Matt McQuade 614-857-0900 ext 231.
Note: The information contained in this report is confidential and not for disclosure outside Business Oregon except under prior written approval of Austin and Peake Consulting.
Prepared For:
Business Oregon
February 15, 2010
Page 3 of 3
Prepared By:
Austin Consulting / Peake Consulting

Appendix B & C
Operating Cost Comparison for Two Sample Projects
Regional and State Characteristics for Trial Locations
Appendix B: PV Module Manufacturing Plant
Figure B-1: Estimated Total Annual Outbound Transportation Costs
Figure B-2: Estimated Annual Labor Costs
Figure B-3: Estimated Annual Labor and Fringe Benefits Costs
Figure B-4: Estimated Annual Electric Power Costs
Figure B-5: Estimated Annual Natural Gas Costs
Figure B-6: Estimated Annual Water Costs
Figure B-7: Estimated Annual Sewer Costs
Figure B-8: Estimated Annual Real Estate Costs
Figure B-9: Estimated Annual Property Tax Costs
Figure B-10: Estimated Total Annual Variable Operating Costs
Appendix C: Advanced Manufacturing Parts Supplier Manufacturing Plant
Figure C-1: Estimated Total Annual Outbound Transportation Costs
Figure C-2: Estimated Annual Labor Costs
Figure C-3: Estimated Annual Labor and Fringe Benefits Costs
Figure C-4: Estimated Annual Electric Power Costs
Figure C-5: Estimated Annual Natural Gas Costs
Figure C-6: Estimated Annual Water Costs

Figure C-7: Estimated Annual Sewer Costs
Figure C-8: Estimated Annual Real Estate Costs
Figure C-9: Estimated Annual Property Tax Costs
Figure C-10: Estimated Total Annual Variable Operating Costs
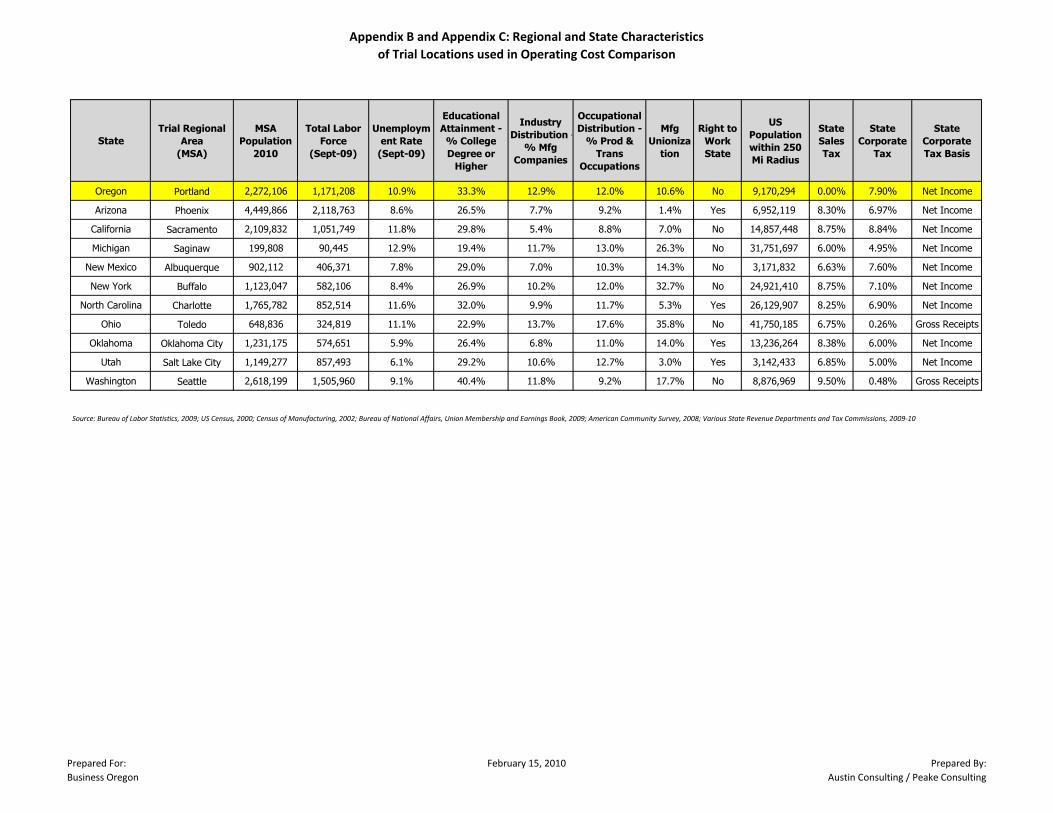
Appendix B and Appendix C: Regional and State Characteristics
of Trial Locations used in Operating Cost Comparison
State
Trial Regional
Area
(MSA)
MSA
Population
2010
Total Labor
Force
(Sept-09)
Unemploym
ent Rate
(Sept-09)
Educational
Attainment -
% College
Degree or
Higher
Industry
Distribution -
% Mfg
Companies
Occupational
Distribution -
% Prod &
Trans
Occupations
Mfg
Unioniza
tion
Right to
Work
State
US
Population
within 250
Mi Radius
State
Sales
Tax
State
Corporate
Tax
State
Corporate
Tax Basis
Oregon Portland 2,272,106 1,171,208 10.9% 33.3% 12.9% 12.0% 10.6% No 9,170,294 0.00% 7.90% Net Income
Arizona Phoenix 4,449,866 2,118,763 8.6% 26.5% 7.7% 9.2% 1.4% Yes 6,952,119 8.30% 6.97% Net Income
California Sacramento 2,109,832 1,051,749 11.8% 29.8% 5.4% 8.8% 7.0% No 14,857,448 8.75% 8.84% Net Income
Michigan Saginaw 199,808 90,445 12.9% 19.4% 11.7% 13.0% 26.3% No 31,751,697 6.00% 4.95% Net Income
New Mexico Albuquerque 902,112 406,371 7.8% 29.0% 7.0% 10.3% 14.3% No 3,171,832 6.63% 7.60% Net Income
New York Buffalo 1,123,047 582,106 8.4% 26.9% 10.2% 12.0% 32.7% No 24,921,410 8.75% 7.10% Net Income
North Carolina Charlotte 1,765,782 852,514 11.6% 32.0% 9.9% 11.7% 5.3% Yes 26,129,907 8.25% 6.90% Net Income
Ohio Toledo 648,836 324,819 11.1% 22.9% 13.7% 17.6% 35.8% No 41,750,185 6.75% 0.26% Gross Receipts
Oklahoma Oklahoma City 1,231,175 574,651 5.9% 26.4% 6.8% 11.0% 14.0% Yes 13,236,264 8.38% 6.00% Net Income
Utah Salt Lake City 1,149,277 857,493 6.1% 29.2% 10.6% 12.7% 3.0% Yes 3,142,433 6.85% 5.00% Net Income
Washington Seattle 2,618,199 1,505,960 9.1% 40.4% 11.8% 9.2% 17.7% No 8,876,969 9.50% 0.48% Gross Receipts
Source: Bureau of Labor Statistics, 2009; US Census, 2000; Census of Manufacturing, 2002; Bureau of National Affairs, Union Membership and Earnings Book, 2009; American Community Survey, 2008; Various State Revenue Departments and Tax Commissions, 2009-10
Prepared For:
Business Oregon
February 15, 2010 Prepared By:
Austin Consulting / Peake Consulting

Figure B-1: Estimated Total Annual Outbound Transportation Costs
PV Module Manufacturing Plant Sample Project
StateTrial
MSA
US Population
within 250 Mile
Radius
Annual #
of TL's
Average
Cost per TL
Total Annual
Outbound
Transportation
Cost
Penalty Over
Base
Index
(Base=100)
Oregon Portland 9,170,294 3900 $1,200 $4,680,000 $2,730,000 240
Arizona Phoenix 6,952,119 3900 $1,450 $5,655,000 $3,705,000 290
California Sacramento 14,857,448 3900 $1,150 $4,485,000 $2,535,000 230
Michigan Saginaw 31,751,697 3900 $600 $2,340,000 $390,000 120
New Mexico Albuquerque 3,171,832 3900 $1,600 $6,240,000 $4,290,000 320
New York Buffalo 24,921,410 3900 $900 $3,510,000 $1,560,000 180
North Carolina Charlotte 26,129,907 3900 $800 $3,120,000 $1,170,000 160
Ohio Toledo 41,750,185 3900 $500 $1,950,000 Base 100
Oklahoma Oklahoma City 13,236,264 3900 $1,150 $4,485,000 $2,535,000 230
Utah Salt Lake City 3,142,433 3900 $1,600 $6,240,000 $4,290,000 320
Washington Seattle 8,876,969 3900 $1,200 $4,680,000 $2,730,000 240
Source: Various national and regional transportation providers and data from recent Austin Consulting projects.
Note: Transportation costs above are based on outbound transportation only. Average cost per TL is based on access to all national
markets and population centers.
Prepared For:
Business Oregon
February 15, 2010 Prepared By:
Austin Consulting / Peake Consulting
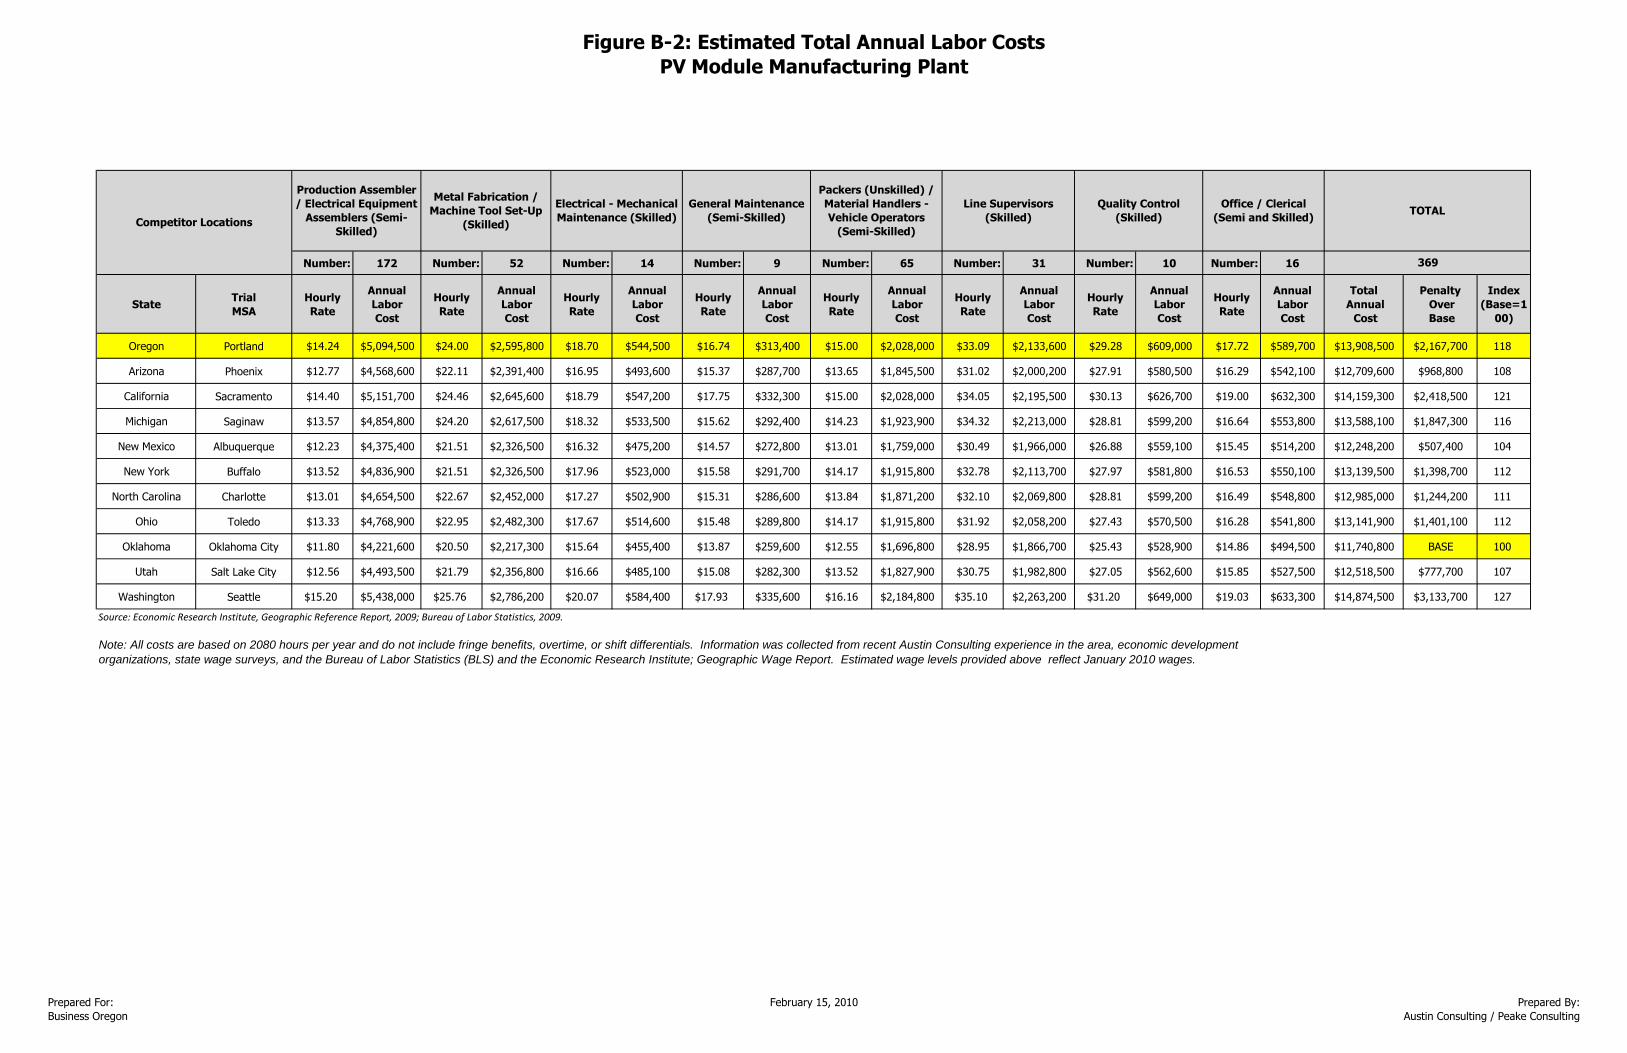
Figure B-2: Estimated Total Annual Labor Costs
PV Module Manufacturing Plant
Number: 172 Number: 52 Number: 14 Number: 9 Number: 65 Number: 31 Number: 10 Number: 16
StateTrial
MSA
Hourly
Rate
Annual
Labor
Cost
Hourly
Rate
Annual
Labor
Cost
Hourly
Rate
Annual
Labor
Cost
Hourly
Rate
Annual
Labor
Cost
Hourly
Rate
Annual
Labor
Cost
Hourly
Rate
Annual
Labor
Cost
Hourly
Rate
Annual
Labor
Cost
Hourly
Rate
Annual
Labor
Cost
Total
Annual
Cost
Penalty
Over
Base
Index
(Base=1
00)
Oregon Portland $14.24 $5,094,500 $24.00 $2,595,800 $18.70 $544,500 $16.74 $313,400 $15.00 $2,028,000 $33.09 $2,133,600 $29.28 $609,000 $17.72 $589,700 $13,908,500 $2,167,700 118
Arizona Phoenix $12.77 $4,568,600 $22.11 $2,391,400 $16.95 $493,600 $15.37 $287,700 $13.65 $1,845,500 $31.02 $2,000,200 $27.91 $580,500 $16.29 $542,100 $12,709,600 $968,800 108
California Sacramento $14.40 $5,151,700 $24.46 $2,645,600 $18.79 $547,200 $17.75 $332,300 $15.00 $2,028,000 $34.05 $2,195,500 $30.13 $626,700 $19.00 $632,300 $14,159,300 $2,418,500 121
Michigan Saginaw $13.57 $4,854,800 $24.20 $2,617,500 $18.32 $533,500 $15.62 $292,400 $14.23 $1,923,900 $34.32 $2,213,000 $28.81 $599,200 $16.64 $553,800 $13,588,100 $1,847,300 116
New Mexico Albuquerque $12.23 $4,375,400 $21.51 $2,326,500 $16.32 $475,200 $14.57 $272,800 $13.01 $1,759,000 $30.49 $1,966,000 $26.88 $559,100 $15.45 $514,200 $12,248,200 $507,400 104
New York Buffalo $13.52 $4,836,900 $21.51 $2,326,500 $17.96 $523,000 $15.58 $291,700 $14.17 $1,915,800 $32.78 $2,113,700 $27.97 $581,800 $16.53 $550,100 $13,139,500 $1,398,700 112
North Carolina Charlotte $13.01 $4,654,500 $22.67 $2,452,000 $17.27 $502,900 $15.31 $286,600 $13.84 $1,871,200 $32.10 $2,069,800 $28.81 $599,200 $16.49 $548,800 $12,985,000 $1,244,200 111
Ohio Toledo $13.33 $4,768,900 $22.95 $2,482,300 $17.67 $514,600 $15.48 $289,800 $14.17 $1,915,800 $31.92 $2,058,200 $27.43 $570,500 $16.28 $541,800 $13,141,900 $1,401,100 112
Oklahoma Oklahoma City $11.80 $4,221,600 $20.50 $2,217,300 $15.64 $455,400 $13.87 $259,600 $12.55 $1,696,800 $28.95 $1,866,700 $25.43 $528,900 $14.86 $494,500 $11,740,800 BASE 100
Utah Salt Lake City $12.56 $4,493,500 $21.79 $2,356,800 $16.66 $485,100 $15.08 $282,300 $13.52 $1,827,900 $30.75 $1,982,800 $27.05 $562,600 $15.85 $527,500 $12,518,500 $777,700 107
Washington Seattle $15.20 $5,438,000 $25.76 $2,786,200 $20.07 $584,400 $17.93 $335,600 $16.16 $2,184,800 $35.10 $2,263,200 $31.20 $649,000 $19.03 $633,300 $14,874,500 $3,133,700 127
Source: Economic Research Institute, Geographic Reference Report, 2009; Bureau of Labor Statistics, 2009.
Packers (Unskilled) /
Material Handlers -
Vehicle Operators
(Semi-Skilled)
Electrical - Mechanical
Maintenance (Skilled)
369
Line Supervisors
(Skilled)
Quality Control
(Skilled)TOTAL
Office / Clerical
(Semi and Skilled)
Note: All costs are based on 2080 hours per year and do not include fringe benefits, overtime, or shift differentials. Information was collected from recent Austin Consulting experience in the area, economic development
organizations, state wage surveys, and the Bureau of Labor Statistics (BLS) and the Economic Research Institute; Geographic Wage Report. Estimated wage levels provided above reflect January 2010 wages.
Competitor Locations
Production Assembler
/ Electrical Equipment
Assemblers (Semi-
Skilled)
Metal Fabrication /
Machine Tool Set-Up
(Skilled)
General Maintenance
(Semi-Skilled)
Prepared For:
Business Oregon
February 15, 2010 Prepared By:
Austin Consulting / Peake Consulting

Figure B-3: Estimated Total Annual Labor and Fringe Benefit Costs
PV Module Manufacturing Plant
StateTrial
MSA
Retirement &
Savings Plans
Life & Health
Insurance
Social
Security
Worker's
Compensation
Unemployment
Insurance
Total Annual
Fringe Benefit
Costs
Total Annual
Labor Costs
Total Annual
Labor and
Fringe Benefit
Costs
Penalty Over
Base
Index
(Base
=100)
Oregon Portland $688,541 $1,432,721 $1,064,108 $472,152 $323,392 $3,980,914 $13,908,500 $17,889,414 $2,640,090 117
Arizona Phoenix $629,143 $1,309,126 $972,312 $354,606 $51,660 $3,316,847 $12,709,600 $16,026,447 $777,123 105
California Sacramento $692,119 $1,440,168 $1,069,639 $705,419 $87,822 $3,995,167 $14,159,300 $18,154,467 $2,905,143 119
Michigan Saginaw $673,231 $1,400,864 $1,040,448 $581,429 $89,667 $3,785,639 $13,588,100 $17,373,739 $2,124,415 114
New Mexico Albuquerque $606,280 $1,261,551 $936,977 $468,541 $154,242 $3,427,591 $12,248,200 $15,675,791 $426,467 103
New York Buffalo $660,668 $1,374,724 $1,021,033 $627,073 $106,641 $3,790,139 $13,139,500 $16,929,639 $1,680,315 111
North Carolina Charlotte $642,648 $1,337,228 $993,184 $519,335 $85,460 $3,577,855 $12,985,000 $16,562,855 $1,313,531 109
Ohio Toledo $650,474 $1,005,279 $1,005,279 $706,036 $89,667 $3,456,735 $13,141,900 $16,598,635 $1,349,311 109
Oklahoma Oklahoma City $581,189 $1,209,343 $898,201 $744,515 $75,276 $3,508,524 $11,740,800 $15,249,324 BASE 100
Utah Salt Lake City $619,738 $1,289,555 $957,777 $330,467 $164,131 $3,361,668 $12,518,500 $15,880,168 $630,844 104
Washington Seattle $736,281 $1,532,059 $1,137,889 $663,880 $312,838 $4,382,947 $14,874,500 $19,257,447 $4,008,123 126
Source: Bureau of Labor Statistics, "Employer Costs" , 2009. OR Dept of Consumer & Business Svcs, 'Workers' Comp Premium Ranking", 2008; RIA, 'All States Handbook," 2010.
"Total Annual Labor Costs" column is the Total Annual Labor Costs from the Table in Figure B-2.
Note: Figures are based on information gathered from published sources and Austin's familiarity with regional fringe benefit costs. These costs include the employer's share of statutory requirements including pensions, F.I.C.A.,
workers' compensation, unemployment insurance, and miscellaneous items (profit sharing, savings plan, etc.). Payments for time ot worked (vacations, holidays, rest periods, sick leave, military leave, etc.) are included in annual
labor costs which are based on 2080 hours worked annually.
Prepared For:
Business Oregon
February 15, 2010 Prepared By:
Austin Consulting
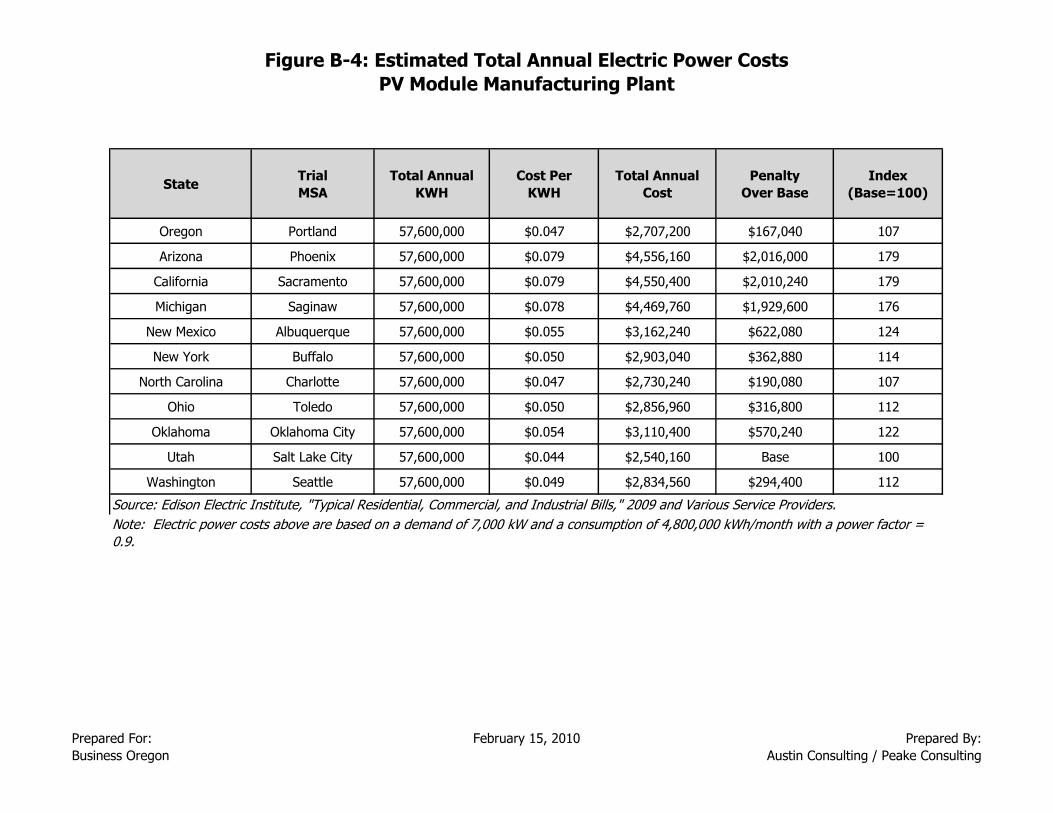
Figure B-4: Estimated Total Annual Electric Power Costs
PV Module Manufacturing Plant
StateTrial
MSA
Total Annual
KWH
Cost Per
KWH
Total Annual
Cost
Penalty
Over Base
Index
(Base=100)
Oregon Portland 57,600,000 $0.047 $2,707,200 $167,040 107
Arizona Phoenix 57,600,000 $0.079 $4,556,160 $2,016,000 179
California Sacramento 57,600,000 $0.079 $4,550,400 $2,010,240 179
Michigan Saginaw 57,600,000 $0.078 $4,469,760 $1,929,600 176
New Mexico Albuquerque 57,600,000 $0.055 $3,162,240 $622,080 124
New York Buffalo 57,600,000 $0.050 $2,903,040 $362,880 114
North Carolina Charlotte 57,600,000 $0.047 $2,730,240 $190,080 107
Ohio Toledo 57,600,000 $0.050 $2,856,960 $316,800 112
Oklahoma Oklahoma City 57,600,000 $0.054 $3,110,400 $570,240 122
Utah Salt Lake City 57,600,000 $0.044 $2,540,160 Base 100
Washington Seattle 57,600,000 $0.049 $2,834,560 $294,400 112
Source: Edison Electric Institute, "Typical Residential, Commercial, and Industrial Bills," 2009 and Various Service Providers.
Note: Electric power costs above are based on a demand of 7,000 kW and a consumption of 4,800,000 kWh/month with a power factor =
0.9.
Prepared For:
Business Oregon
February 15, 2010 Prepared By:
Austin Consulting / Peake Consulting

Figure B-5: Estimated Total Annual Natural Gas Costs
PV Module Manufacturing Plant
StateTrial
MSA
Total Annual
Consumption
(CCF)
Cost Per
CCF
Total Annual
Cost
Penalty
Over Base
Index
(Base=100)
Oregon Portland 1,560,000 $1.05 $1,630,200 $1,021,800 268
Arizona Phoenix 1,560,000 $0.80 $1,254,240 $645,840 206
California Sacramento 1,560,000 $0.39 $608,400 Base 100
Michigan Saginaw 1,560,000 $0.90 $1,397,760 $789,360 230
New Mexico Albuquerque 1,560,000 $0.47 $726,960 $118,560 119
New York Buffalo 1,560,000 $1.04 $1,617,720 $1,009,320 266
North Carolina Charlotte 1,560,000 $0.72 $1,126,320 $517,920 185
Ohio Toledo 1,560,000 $0.87 $1,361,880 $753,480 224
Oklahoma Oklahoma City 1,560,000 $1.11 $1,723,800 $1,115,400 283
Utah Salt Lake City 1,560,000 $0.46 $719,160 $110,760 118
Washington Seattle 1,560,000 $1.20 $1,868,880 $1,260,480 307
Source: Energy Information Administration, 'Natural Gas Monthly," 2009 and Various Service Providers.
Note: Natural gas costs above are based on a non-interruptible consumption of 130,000 ccf's per month.
Prepared For:
Business Oregon
February 15, 2010 Prepared By:
Austin Consulting / Peake Consulting

Figure B-6: Estimated Total Annual Water Costs
PV Module Manufacturing Plant
StateTrial
MSA
Total Annual
Gallons
Cost Per
Gallon
Total Annual
Cost
Penalty
Over Base
Index
(Base=100)
Oregon Portland 180,000,000 $0.0028 $498,391 $336,391 308
Arizona Phoenix 180,000,000 $0.0039 $693,713 $531,713 428
California Sacramento 180,000,000 $0.0009 $162,000 Base 100
Michigan Saginaw 180,000,000 $0.0021 $380,901 $218,901 235
New Mexico Albuquerque 180,000,000 $0.0027 $482,921 $320,921 298
New York Buffalo 180,000,000 $0.0019 $339,336 $177,336 209
North Carolina Charlotte 180,000,000 $0.0023 $416,311 $254,311 257
Ohio Toledo 180,000,000 $0.0012 $215,168 $53,168 133
Oklahoma Oklahoma City 180,000,000 $0.0021 $372,970 $210,970 230
Utah Salt Lake City 180,000,000 $0.0016 $283,966 $121,966 175
Washington Seattle 180,000,000 $0.0039 $707,405 $545,405 437
Source: Raftelis Financial Consulting, "Water and Wastewater Rate Survey," 2006 and Various Municipal Service Providers.
Note: Water costs above are based on municipal water provider within each metropolitan area and a monthly consumption of
15,000,000 gallons.
Prepared For:
Business Oregon
February 15, 2010 Prepared By:
Austin Consulting / Peake Consulting

Figure B-7: Estimated Total Annual Sewer Costs
PV Module Manufacturing Plant
StateTrial
MSA
Total Annual
Gallons
Discharged
Cost Per
Gallon
Total Annual
Cost
Penalty
Over Base
Index
(Base=100)
Oregon Portland 144,000,000 $0.0102 $1,470,700 $1,387,625 1770
Arizona Phoenix 144,000,000 $0.0024 $348,537 $265,462 420
California Sacramento 144,000,000 $0.0008 $115,200 $32,124 139
Michigan Saginaw 144,000,000 $0.0048 $686,945 $603,869 827
New Mexico Albuquerque 144,000,000 $0.0006 $83,076 Base 100
New York Buffalo 144,000,000 $0.0015 $214,239 $131,163 258
North Carolina Charlotte 144,000,000 $0.0043 $619,874 $536,798 746
Ohio Toledo 144,000,000 $0.0042 $604,031 $520,955 727
Oklahoma Oklahoma City 144,000,000 $0.0029 $423,331 $340,256 510
Utah Salt Lake City 144,000,000 $0.0028 $410,025 $326,949 494
Washington Seattle 144,000,000 $0.0104 $1,491,875 $1,408,800 1796
Source: Raftelis Financial Consulting, "Water and Wastewater Rate Survey," 2006 and Various Municipal Service Providers.
Note: Sewer costs above are based on municipal sewer provider within each metropolitan area and a monthly discharge of 12,000,000 gallons.
Prepared For:
Business Oregon
February 15, 2010 Prepared By:
Austin Consulting / Peake Consulting

Figure B-8: Estimated Total Annual Real Estate Costs
PV Module Manufacturing Plant
StateTrial
MSA
Land Cost per
Acre
Building &
Construction
Cost
Total Land &
Building Cost
Estimated Total
Annual Payments
Penalty
Over Base
Index
(Base=100)
Oregon Portland $196,020 $41,416,000 $61,018,000 $6,587,937 $2,144,901 148
Arizona Phoenix $174,250 $37,032,250 $54,457,250 $5,879,484 $1,436,448 132
California Sacramento $87,120 $45,215,250 $53,927,250 $5,822,370 $1,379,334 131
Michigan Saginaw $34,848 $39,537,250 $43,022,050 $4,644,967 $201,931 105
New Mexico Albuquerque $108,900 $37,074,000 $47,964,000 $5,178,535 $735,499 117
New York Buffalo $21,780 $42,334,500 $44,512,500 $4,805,886 $362,850 108
North Carolina Charlotte $87,120 $32,439,750 $41,151,750 $4,443,036 Base 100
Ohio Toledo $21,780 $40,359,250 $42,537,250 $4,612,058 $169,022 104
Oklahoma Oklahoma City $87,120 $34,360,250 $43,072,250 $4,650,387 $207,351 105
Utah Salt Lake City $87,120 $36,113,750 $44,825,750 $4,839,707 $396,671 109
Washington Seattle $261,360 $43,670,500 $69,806,500 $7,536,806 $3,093,770 170
Source: NAI Global Market Reports, 2009; Means Construction Index, 2010; Local real estate contacts, 2010.
Note: Real estate costs above assume purchase of 100 acres and construction of a 500,000 square foot building. Building and construction costs are calculated
using a base per square foot cost for standard industrial buildings multiplied by a city-specific index. The construction cost information is taken from the Means
Construction cost indexes, which is a standard guide for cost estimating in the construction industry. The annual payment for land and building is equal to 12
times the amoritized monthly payment at .75 percent monthly interest over 240 months for the sum of land, construction, and purchase costs.
Prepared For:
Business Oregon
February 15, 2010 Prepared By:
Austin Consulting / Peake Consulting
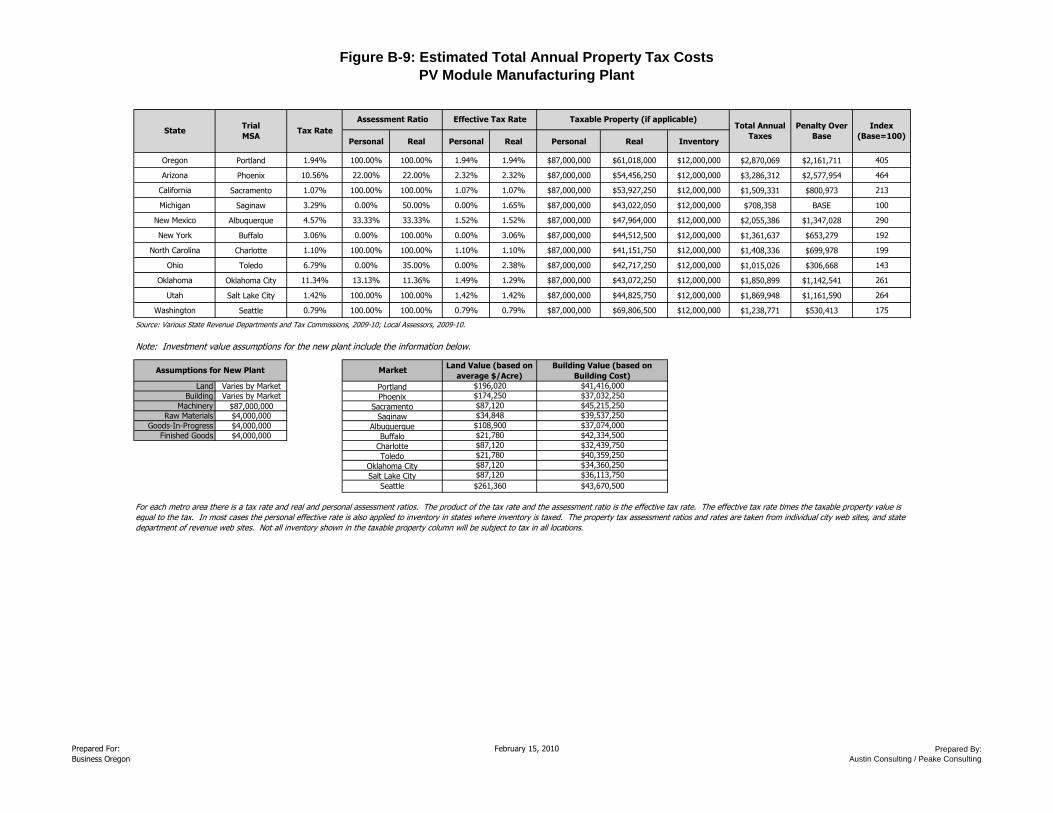
Figure B-9: Estimated Total Annual Property Tax Costs
PV Module Manufacturing Plant
Personal Real Personal Real Personal Real Inventory
Oregon Portland 1.94% 100.00% 100.00% 1.94% 1.94% $87,000,000 $61,018,000 $12,000,000 $2,870,069 $2,161,711 405
Arizona Phoenix 10.56% 22.00% 22.00% 2.32% 2.32% $87,000,000 $54,456,250 $12,000,000 $3,286,312 $2,577,954 464
California Sacramento 1.07% 100.00% 100.00% 1.07% 1.07% $87,000,000 $53,927,250 $12,000,000 $1,509,331 $800,973 213
Michigan Saginaw 3.29% 0.00% 50.00% 0.00% 1.65% $87,000,000 $43,022,050 $12,000,000 $708,358 BASE 100
New Mexico Albuquerque 4.57% 33.33% 33.33% 1.52% 1.52% $87,000,000 $47,964,000 $12,000,000 $2,055,386 $1,347,028 290
New York Buffalo 3.06% 0.00% 100.00% 0.00% 3.06% $87,000,000 $44,512,500 $12,000,000 $1,361,637 $653,279 192
North Carolina Charlotte 1.10% 100.00% 100.00% 1.10% 1.10% $87,000,000 $41,151,750 $12,000,000 $1,408,336 $699,978 199
Ohio Toledo 6.79% 0.00% 35.00% 0.00% 2.38% $87,000,000 $42,717,250 $12,000,000 $1,015,026 $306,668 143
Oklahoma Oklahoma City 11.34% 13.13% 11.36% 1.49% 1.29% $87,000,000 $43,072,250 $12,000,000 $1,850,899 $1,142,541 261
Utah Salt Lake City 1.42% 100.00% 100.00% 1.42% 1.42% $87,000,000 $44,825,750 $12,000,000 $1,869,948 $1,161,590 264
Washington Seattle 0.79% 100.00% 100.00% 0.79% 0.79% $87,000,000 $69,806,500 $12,000,000 $1,238,771 $530,413 175
Source: Various State Revenue Departments and Tax Commissions, 2009-10; Local Assessors, 2009-10.
Land Varies by Market
Building Varies by Market
Machinery $87,000,000Raw Materials $4,000,000
Goods-In-Progress $4,000,000
Finished Goods $4,000,000
$45,215,250
$196,020
$174,250
$87,120
$34,848
Land Value (based on
average $/Acre)
StateTrial
MSA
Total Annual
Taxes
$87,120
$87,120
$261,360
$36,113,750
$43,670,500
$41,416,000
$37,032,250
Index
(Base=100)
Assumptions for New Plant
Tax Rate
Assessment Ratio Effective Tax Rate Taxable Property (if applicable)
Building Value (based on
Building Cost)
Note: Investment value assumptions for the new plant include the information below.
Penalty Over
Base
$39,537,250
$37,074,000Albuquerque
Buffalo $42,334,500
$32,439,750Charlotte$40,359,250
$34,360,250
$108,900
$21,780
$87,120
$21,780
For each metro area there is a tax rate and real and personal assessment ratios. The product of the tax rate and the assessment ratio is the effective tax rate. The effective tax rate times the taxable property value is
equal to the tax. In most cases the personal effective rate is also applied to inventory in states where inventory is taxed. The property tax assessment ratios and rates are taken from individual city web sites, and state
department of revenue web sites. Not all inventory shown in the taxable property column will be subject to tax in all locations.
Toledo
Oklahoma City
Salt Lake City
Seattle
Market
Portland
Phoenix
Sacramento
Saginaw
Prepared For:
Business Oregon
February 15, 2010 Prepared By:
Austin Consulting / Peake Consulting
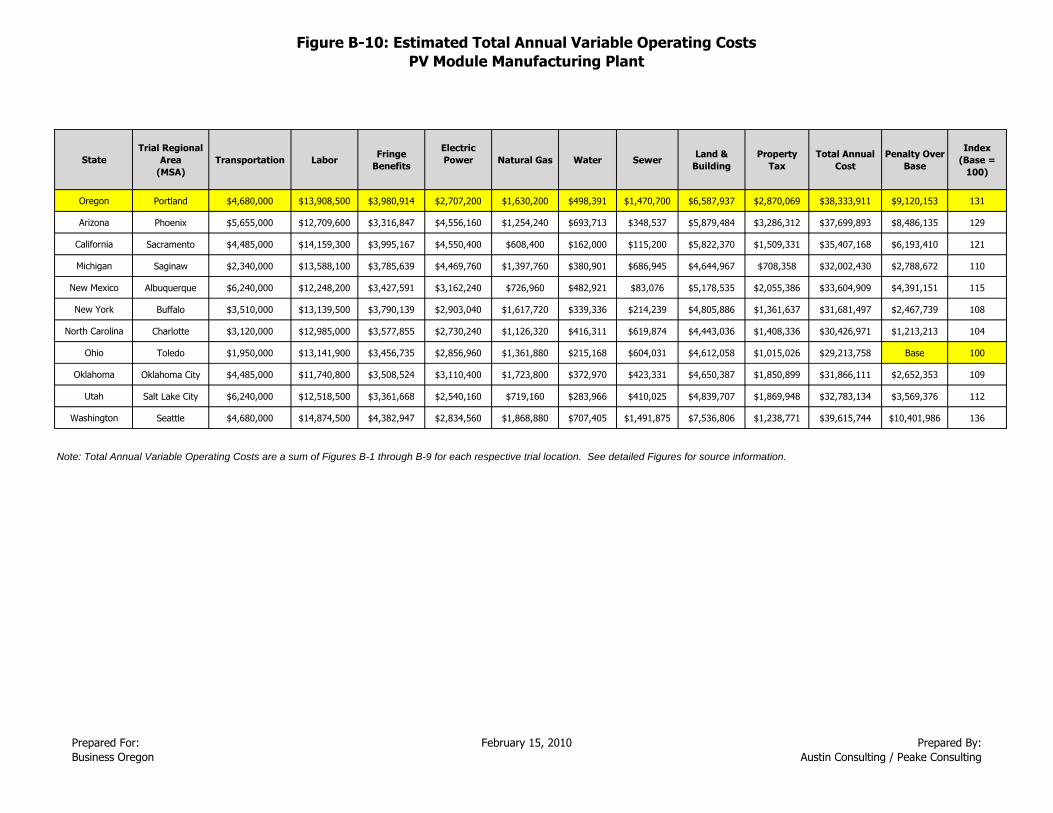
Figure B-10: Estimated Total Annual Variable Operating Costs
PV Module Manufacturing Plant
State
Trial Regional
Area
(MSA)
Transportation Labor Fringe
Benefits
Electric
Power Natural Gas Water SewerLand &
Building
Property
Tax
Total Annual
Cost
Penalty Over
Base
Index
(Base =
100)
Oregon Portland $4,680,000 $13,908,500 $3,980,914 $2,707,200 $1,630,200 $498,391 $1,470,700 $6,587,937 $2,870,069 $38,333,911 $9,120,153 131
Arizona Phoenix $5,655,000 $12,709,600 $3,316,847 $4,556,160 $1,254,240 $693,713 $348,537 $5,879,484 $3,286,312 $37,699,893 $8,486,135 129
California Sacramento $4,485,000 $14,159,300 $3,995,167 $4,550,400 $608,400 $162,000 $115,200 $5,822,370 $1,509,331 $35,407,168 $6,193,410 121
Michigan Saginaw $2,340,000 $13,588,100 $3,785,639 $4,469,760 $1,397,760 $380,901 $686,945 $4,644,967 $708,358 $32,002,430 $2,788,672 110
New Mexico Albuquerque $6,240,000 $12,248,200 $3,427,591 $3,162,240 $726,960 $482,921 $83,076 $5,178,535 $2,055,386 $33,604,909 $4,391,151 115
New York Buffalo $3,510,000 $13,139,500 $3,790,139 $2,903,040 $1,617,720 $339,336 $214,239 $4,805,886 $1,361,637 $31,681,497 $2,467,739 108
North Carolina Charlotte $3,120,000 $12,985,000 $3,577,855 $2,730,240 $1,126,320 $416,311 $619,874 $4,443,036 $1,408,336 $30,426,971 $1,213,213 104
Ohio Toledo $1,950,000 $13,141,900 $3,456,735 $2,856,960 $1,361,880 $215,168 $604,031 $4,612,058 $1,015,026 $29,213,758 Base 100
Oklahoma Oklahoma City $4,485,000 $11,740,800 $3,508,524 $3,110,400 $1,723,800 $372,970 $423,331 $4,650,387 $1,850,899 $31,866,111 $2,652,353 109
Utah Salt Lake City $6,240,000 $12,518,500 $3,361,668 $2,540,160 $719,160 $283,966 $410,025 $4,839,707 $1,869,948 $32,783,134 $3,569,376 112
Washington Seattle $4,680,000 $14,874,500 $4,382,947 $2,834,560 $1,868,880 $707,405 $1,491,875 $7,536,806 $1,238,771 $39,615,744 $10,401,986 136
Note: Total Annual Variable Operating Costs are a sum of Figures B-1 through B-9 for each respective trial location. See detailed Figures for source information.
Prepared For:
Business Oregon
February 15, 2010 Prepared By:
Austin Consulting / Peake Consulting
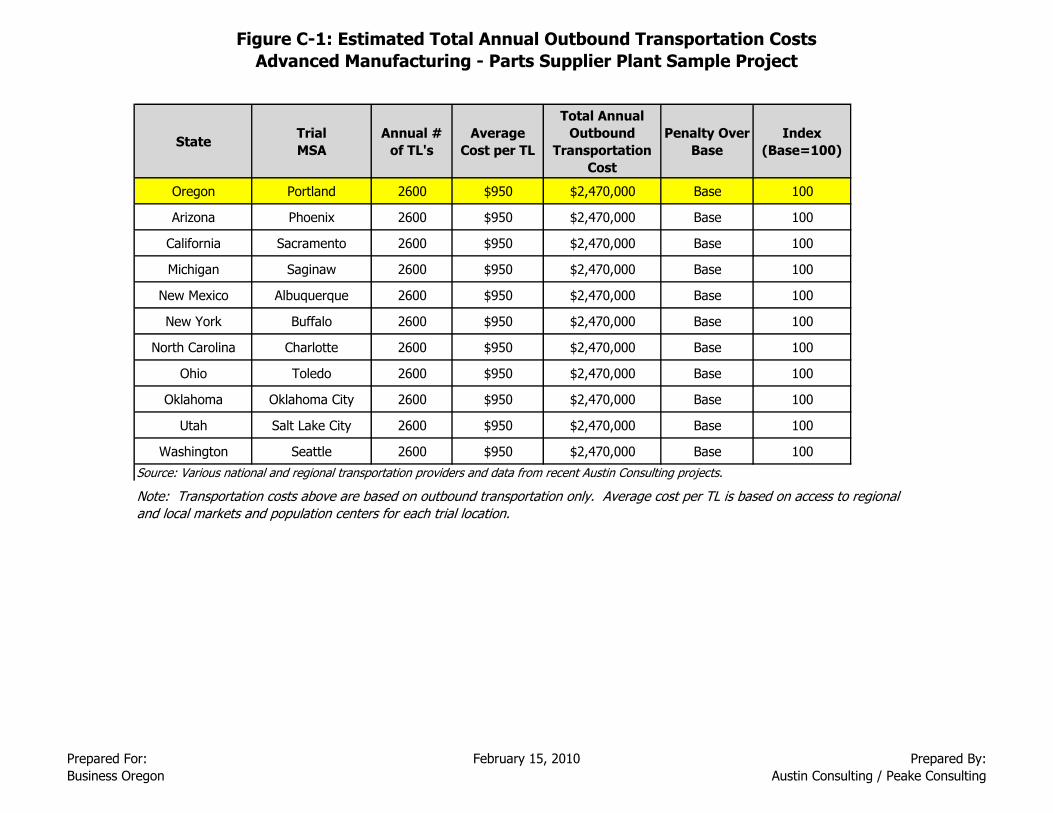
Figure C-1: Estimated Total Annual Outbound Transportation Costs
Advanced Manufacturing - Parts Supplier Plant Sample Project
StateTrial
MSA
Annual #
of TL's
Average
Cost per TL
Total Annual
Outbound
Transportation
Cost
Penalty Over
Base
Index
(Base=100)
Oregon Portland 2600 $950 $2,470,000 Base 100
Arizona Phoenix 2600 $950 $2,470,000 Base 100
California Sacramento 2600 $950 $2,470,000 Base 100
Michigan Saginaw 2600 $950 $2,470,000 Base 100
New Mexico Albuquerque 2600 $950 $2,470,000 Base 100
New York Buffalo 2600 $950 $2,470,000 Base 100
North Carolina Charlotte 2600 $950 $2,470,000 Base 100
Ohio Toledo 2600 $950 $2,470,000 Base 100
Oklahoma Oklahoma City 2600 $950 $2,470,000 Base 100
Utah Salt Lake City 2600 $950 $2,470,000 Base 100
Washington Seattle 2600 $950 $2,470,000 Base 100
Source: Various national and regional transportation providers and data from recent Austin Consulting projects.
Note: Transportation costs above are based on outbound transportation only. Average cost per TL is based on access to regional
and local markets and population centers for each trial location.
Prepared For:
Business Oregon
February 15, 2010 Prepared By:
Austin Consulting / Peake Consulting

Figure C-2: Estimated Total Annual Labor Costs
Advanced Manufacturing - Parts Supplier Plant Sample Project
Number: 68 Number: 31 Number: 6 Number: 5 Number: 31 Number: 18 Number: 6 Number: 9
StateTrial
MSA
Hourly
Rate
Annual
Labor
Cost
Hourly
Rate
Annual
Labor
Cost
Hourly
Rate
Annual
Labor
Cost
Hourly
Rate
Annual
Labor
Cost
Hourly
Rate
Annual
Labor
Cost
Hourly
Rate
Annual
Labor
Cost
Hourly
Rate
Annual
Labor
Cost
Hourly
Rate
Annual
Labor
Cost
Total
Annual
Cost
Penalty
Over
Base
Index
(Base=10
0)
Oregon Portland $14.24 $2,014,100 $24.00 $1,547,500 $18.70 $233,400 $16.74 $174,100 $15.00 $967,200 $33.09 $1,238,900 $29.28 $365,400 $17.72 $331,700 $6,872,300 $1,053,400 118
Arizona Phoenix $12.77 $1,806,200 $22.11 $1,425,700 $16.95 $211,500 $15.37 $159,800 $13.65 $880,200 $31.02 $1,161,400 $27.91 $348,300 $16.29 $304,900 $6,298,000 $479,100 108
California Sacramento $14.40 $2,036,700 $24.46 $1,577,200 $18.79 $234,500 $17.75 $184,600 $15.00 $967,200 $34.05 $1,274,800 $30.13 $376,000 $19.00 $355,700 $7,006,700 $1,187,800 120
Michigan Saginaw $13.57 $1,919,300 $24.20 $1,560,400 $18.32 $228,600 $15.62 $162,400 $14.23 $917,600 $34.32 $1,284,900 $28.81 $359,500 $16.64 $311,500 $6,744,200 $925,300 116
New Mexico Albuquerque $12.23 $1,729,800 $21.51 $1,387,000 $16.32 $203,700 $14.57 $151,500 $13.01 $838,900 $30.49 $1,141,500 $26.88 $335,500 $15.45 $289,200 $6,077,100 $258,200 104
New York Buffalo $13.52 $1,912,300 $21.51 $1,387,000 $17.96 $224,100 $15.58 $162,000 $14.17 $913,700 $32.78 $1,227,300 $27.97 $349,100 $16.53 $309,400 $6,484,900 $666,000 111
North Carolina Charlotte $13.01 $1,840,100 $22.67 $1,461,800 $17.27 $215,500 $15.31 $159,200 $13.84 $892,400 $32.10 $1,201,800 $28.81 $359,500 $16.49 $308,700 $6,439,000 $620,100 111
Ohio Toledo $13.33 $1,885,400 $22.95 $1,479,800 $17.67 $220,500 $15.48 $161,000 $14.17 $913,700 $31.92 $1,195,100 $27.43 $342,300 $16.28 $304,800 $6,502,600 $683,700 112
Oklahoma Oklahoma City $11.80 $1,669,000 $20.50 $1,321,800 $15.64 $195,200 $13.87 $144,200 $12.55 $809,200 $28.95 $1,083,900 $25.43 $317,400 $14.86 $278,200 $5,818,900 BASE 100
Utah Salt Lake City $12.56 $1,776,500 $21.79 $1,405,000 $16.66 $207,900 $15.08 $156,800 $13.52 $871,800 $30.75 $1,151,300 $27.05 $337,600 $15.85 $296,700 $6,203,600 $384,700 107
Washington Seattle $15.20 $2,149,900 $25.76 $1,661,000 $20.07 $250,500 $17.93 $186,500 $16.16 $1,042,000 $35.10 $1,314,100 $31.20 $389,400 $19.03 $356,200 $7,349,600 $1,530,700 126
Source: Economic Research Institute, Geographic Reference Report, 2009; Bureau of Labor Statistics, 2009.
Note: All costs are based on 2080 hours per year and do not include fringe benefits, overtime, or shift differentials. Information was collected from recent Austin Consulting experience in the area, economic
development organizations, state wage surveys, and the Bureau of Labor Statistics (BLS) and the Economic Research Institute; Geographic Wage Report. Estimated wage levels provided above reflect January
2010 wages.
Competitor Locations
Production Assembler /
Electrical Equipment
Assemblers (Semi-
Skilled)
Metal Fabrication /
Machine Tool Set-Up
(Skilled)
General Maintenance
(Semi-Skilled)
Packers (Unskilled) /
Material Handlers -
Vehicle Operators
(Semi-Skilled)
Electrical -
Mechanical
Maintenance (Skilled)
174
Line Supervisors
(Skilled)
Quality Control
(Skilled)TOTAL
Office / Clerical (Semi
and Skilled)
Prepared For:
Business Oregon
February 15, 2010 Prepared By:
Austin Consulting / Peake Consulting

Figure C-3: Estimated Total Annual Labor and Fringe Benefits Costs
Advanced Manufacturing - Parts Supplier Plant Sample Project
StateTrial
MSA
Retirement &
Savings Plans
Life & Health
Insurance
Social
Security
Worker's
Compensation
Unemployment
Insurance
Total Annual
Fringe Benefit
Costs
Total Annual
Labor Costs
Total Annual
Labor and Fringe
Benefit Costs
Penalty Over
Base
Index
(Base
=100)
Oregon Portland $338,787 $704,909 $523,549 $230,528 $152,494 $1,950,267 $6,872,300 $8,822,567 $1,275,743 117
Arizona Phoenix $310,401 $645,886 $479,711 $173,589 $24,360 $1,633,947 $6,298,000 $7,931,947 $385,123 105
California Sacramento $341,427 $710,444 $527,660 $345,157 $41,412 $1,966,100 $7,006,700 $8,972,800 $1,425,976 119
Michigan Saginaw $332,721 $692,329 $514,205 $285,572 $42,282 $1,867,109 $6,744,200 $8,611,309 $1,064,485 114
New Mexico Albuquerque $299,498 $623,198 $462,861 $229,872 $72,732 $1,688,161 $6,077,100 $7,765,261 $218,437 103
New York Buffalo $325,704 $677,727 $503,360 $306,851 $50,286 $1,863,928 $6,484,900 $8,348,828 $802,004 111
North Carolina Charlotte $317,317 $660,276 $490,399 $254,829 $40,298 $1,763,119 $6,439,000 $8,202,119 $655,295 109
Ohio Toledo $320,483 $666,863 $495,292 $344,675 $42,282 $1,869,595 $6,502,600 $8,372,195 $825,371 111
Oklahoma Oklahoma City $286,805 $596,786 $443,244 $365,593 $35,496 $1,727,924 $5,818,900 $7,546,824 BASE 100
Utah Salt Lake City $305,780 $636,270 $472,570 $161,738 $77,395 $1,653,753 $6,203,600 $7,857,353 $310,529 104
Washington Seattle $362,235 $753,742 $559,818 $327,299 $147,517 $2,150,611 $7,349,600 $9,500,211 $1,953,387 126
Source: Bureau of Labor Statistics, "Employer Costs" , 2009. OR Dept of Consumer & Business Svcs, 'Workers' Comp Premium Ranking", 2008; RIA, 'All States Handbook," 2010.
Note: Figures are based on information gathered from published sources and Austin's familiarity with regional fringe benefit costs. These costs include the employer's share pf statutory
requirements including pensions, F.I.C.A., workers' compensation, unemployment insurance, and miscellaneous items (profit sharing, savings plan, etc.). Payments for time
not worked (vacations, holidays, rest periods, sick leave, military leave, etc.) are included in annual labor costs which are based on 2080 hours worked annually.
"Total Annual Labor Costs" column is the Total Annual Labor Costs from the Table in Figure B-2.
Prepared For:
Business Oregon
February 15, 2010 Prepared By:
Austin Consulting / Peake Consulting

Figure C-4: Estimated Total Annual Electric Power Costs
Advanced Manufacturing - Parts Supplier Plant Sample Project
StateTrial
MSA
Total Annual
KWH
Cost Per
KWH
Total Annual
Cost
Penalty
Over Base
Index
(Base=100)
Oregon Portland 14,400,000 $0.047 $676,800 $41,760 107
Arizona Phoenix 14,400,000 $0.079 $1,139,040 $504,000 179
California Sacramento 14,400,000 $0.104 $1,497,600 $862,560 236
Michigan Saginaw 14,400,000 $0.078 $1,117,440 $482,400 176
New Mexico Albuquerque 14,400,000 $0.055 $790,560 $155,520 124
New York Buffalo 14,400,000 $0.050 $725,760 $90,720 114
North Carolina Charlotte 14,400,000 $0.047 $682,560 $47,520 107
Ohio Toledo 14,400,000 $0.050 $714,240 $79,200 112
Oklahoma Oklahoma City 14,400,000 $0.054 $777,600 $142,560 122
Utah Salt Lake City 14,400,000 $0.044 $635,040 Base 100
Washington Seattle 14,400,000 $0.051 $728,640 $93,600 115
Source: Edison Electric Institute, "Typical Residential, Commercial, and Industrial Bills," 2009 and Various Service Providers.
Note: Electric power costs above are based on a demand of 2,500 kW and a consumption of 1,200,000 kWh/month with a power
factor = 0.9.
Prepared For:
Business Oregon
February 15, 2010 Prepared By:
Austin Consulting / Peake Consulting

Figure C-5: Estimated Total Annual Natural Gas Costs
Advanced Manufacturing - Parts Supplier Plant Sample Project
StateTrial
MSA
Total Annual
Consumption
Cost Per
CCF
Total Annual
Cost
Penalty
Over Base
Index
(Base=100)
Oregon Portland 780,000 $1.05 $815,100 $455,520 227
Arizona Phoenix 780,000 $0.80 $627,120 $267,540 174
California Sacramento 780,000 $0.58 $452,400 $92,820 126
Michigan Saginaw 780,000 $0.90 $698,880 $339,300 194
New Mexico Albuquerque 780,000 $0.47 $363,480 $3,900 101
New York Buffalo 780,000 $1.04 $808,860 $449,280 225
North Carolina Charlotte 780,000 $0.72 $563,160 $203,580 157
Ohio Toledo 780,000 $0.87 $680,940 $321,360 189
Oklahoma Oklahoma City 780,000 $1.11 $861,900 $502,320 240
Utah Salt Lake City 780,000 $0.46 $359,580 Base 100
Washington Seattle 780,000 $1.20 $934,440 $574,860 260
Source: Energy Information Administration, 'Natural Gas Monthly," 2009 and Various Service Providers.
Note: Natural gas costs above are based on a non-interruptible consumption of 65,000 ccf's per month.
Prepared For:
Business Oregon
February 15, 2010 Prepared By:
Austin Consulting / Peake Consulting

Figure C-6: Estimated Total Annual Water Costs
Advanced Manufacturing - Parts Supplier Plant Sample Project
StateTrial
MSA
Total Annual
Gallons
Cost Per
Gallon
Total Annual
Cost
Penalty
Over Base
Index
(Base=100)
Oregon Portland 84,000,000 $0.0028 $232,652 $157,052 308
Arizona Phoenix 84,000,000 $0.0039 $323,816 $248,216 428
California Sacramento 84,000,000 $0.0009 $75,600 Base 100
Michigan Saginaw 84,000,000 $0.0021 $177,491 $101,891 235
New Mexico Albuquerque 84,000,000 $0.0024 $198,869 $123,269 263
New York Buffalo 84,000,000 $0.0019 $156,443 $80,843 207
North Carolina Charlotte 84,000,000 $0.0023 $194,285 $118,685 257
Ohio Toledo 84,000,000 $0.0012 $104,634 $29,034 138
Oklahoma Oklahoma City 84,000,000 $0.0021 $173,169 $97,569 229
Utah Salt Lake City 84,000,000 $0.0016 $132,372 $56,772 175
Washington Seattle 84,000,000 $0.0039 $329,666 $254,066 436
Source: Raftelis Financial Consulting, "Water and Wastewater Rate Survey," 2006 and Various Municipal Service Providers.
Note: Water costs above are based on municipal water provider within each metropolitan area and a monthly consumption of
7,000,000 gallons.
Prepared For:
Business Oregon
February 15, 2010 Prepared By:
Austin Consulting / Peake Consulting

Figure C-7: Estimated Total Annual Sewer Costs
Advanced Manufacturing - Parts Supplier Plant Sample Project
StateTrial
MSA
Total Annual
Gallons
Discharged
Cost Per
Gallon
Total Annual
Cost
Penalty
Over Base
Index
(Base=100)
Oregon Portland 72,000,000 $0.0102 $735,350 $706,161 2519
Arizona Phoenix 72,000,000 $0.0024 $174,269 $145,079 597
California Sacramento 72,000,000 $0.0008 $57,600 $28,411 197
Michigan Saginaw 72,000,000 $0.0044 $315,652 $286,462 1081
New Mexico Albuquerque 72,000,000 $0.0004 $29,189 Base 100
New York Buffalo 72,000,000 $0.0015 $107,308 $78,119 368
North Carolina Charlotte 72,000,000 $0.0043 $309,943 $280,753 1062
Ohio Toledo 72,000,000 $0.0042 $300,967 $271,777 1031
Oklahoma Oklahoma City 72,000,000 $0.0029 $211,665 $182,476 725
Utah Salt Lake City 72,000,000 $0.0028 $205,013 $175,823 702
Washington Seattle 72,000,000 $0.0104 $745,938 $716,748 2556
Source: Raftelis Financial Consulting, "Water and Wastewater Rate Survey," 2006 and Various Municipal Service Providers.
Note: Sewer costs above are based on municipal sewer provider within each metropolitan area and a monthly discharge of 6,000,000 gallons.
Prepared For:
Business Oregon
February 15, 2010 Prepared By:
Austin Consulting / Peake Consulting

Figure C-8: Estimated Total Annual Real Estate Costs
Advanced Manufacturing - Parts Supplier Plant Sample Project
StateTrial
MSA
Land Cost per
Acre
Building &
Construction
Cost
Total Land &
Building Cost
Estimated Total
Annual Payments
Penalty
Over Base
Index
(Base=100)
Oregon Portland $196,020 $20,708,000 $30,509,000 $3,293,969 $1,072,451 148
Arizona Phoenix $174,250 $18,516,125 $27,228,625 $2,939,742 $718,224 132
California Sacramento $87,120 $22,607,625 $26,963,625 $2,911,185 $689,667 131
Michigan Saginaw $34,848 $19,768,625 $21,511,025 $2,322,483 $100,965 105
New Mexico Albuquerque $108,900 $18,537,000 $23,982,000 $2,589,267 $367,749 117
New York Buffalo $21,780 $21,167,250 $22,256,250 $2,402,943 $181,425 108
North Carolina Charlotte $87,120 $16,219,825 $20,575,825 $2,221,518 Base 100
Ohio Toledo $21,780 $20,269,625 $21,358,625 $2,306,029 $84,511 104
Oklahoma Oklahoma City $87,120 $17,180,125 $21,536,125 $2,325,193 $103,675 105
Utah Salt Lake City $87,120 $18,056,875 $22,412,875 $2,419,853 $198,335 109
Washington Seattle $261,360 $21,835,250 $34,903,250 $3,768,403 $1,546,885 170
Source: NAI Global Market Reports, 2009; Means Construction Index, 2010; Local real estate contacts, 2010.
Note: Real estate costs above assume purchase of 50 acres and construction of a 250,000 square foot building. Building and construction costs are calculated
using a base per square foot cost for standard industrial buildings multiplied by a city-specific index. The construction cost information is taken from the Means
Construction cost indexes, which is a standard guide for cost estimating in the construction industry. The annual payment for land and building is equal to 12
times the amoritized monthly payment at .75 percent monthly interest over 240 months for the sum of land, construction, and purchase costs.
Prepared For:
Business Oregon
February 15, 2010 Prepared By:
Austin Consulting / Peake Consulting
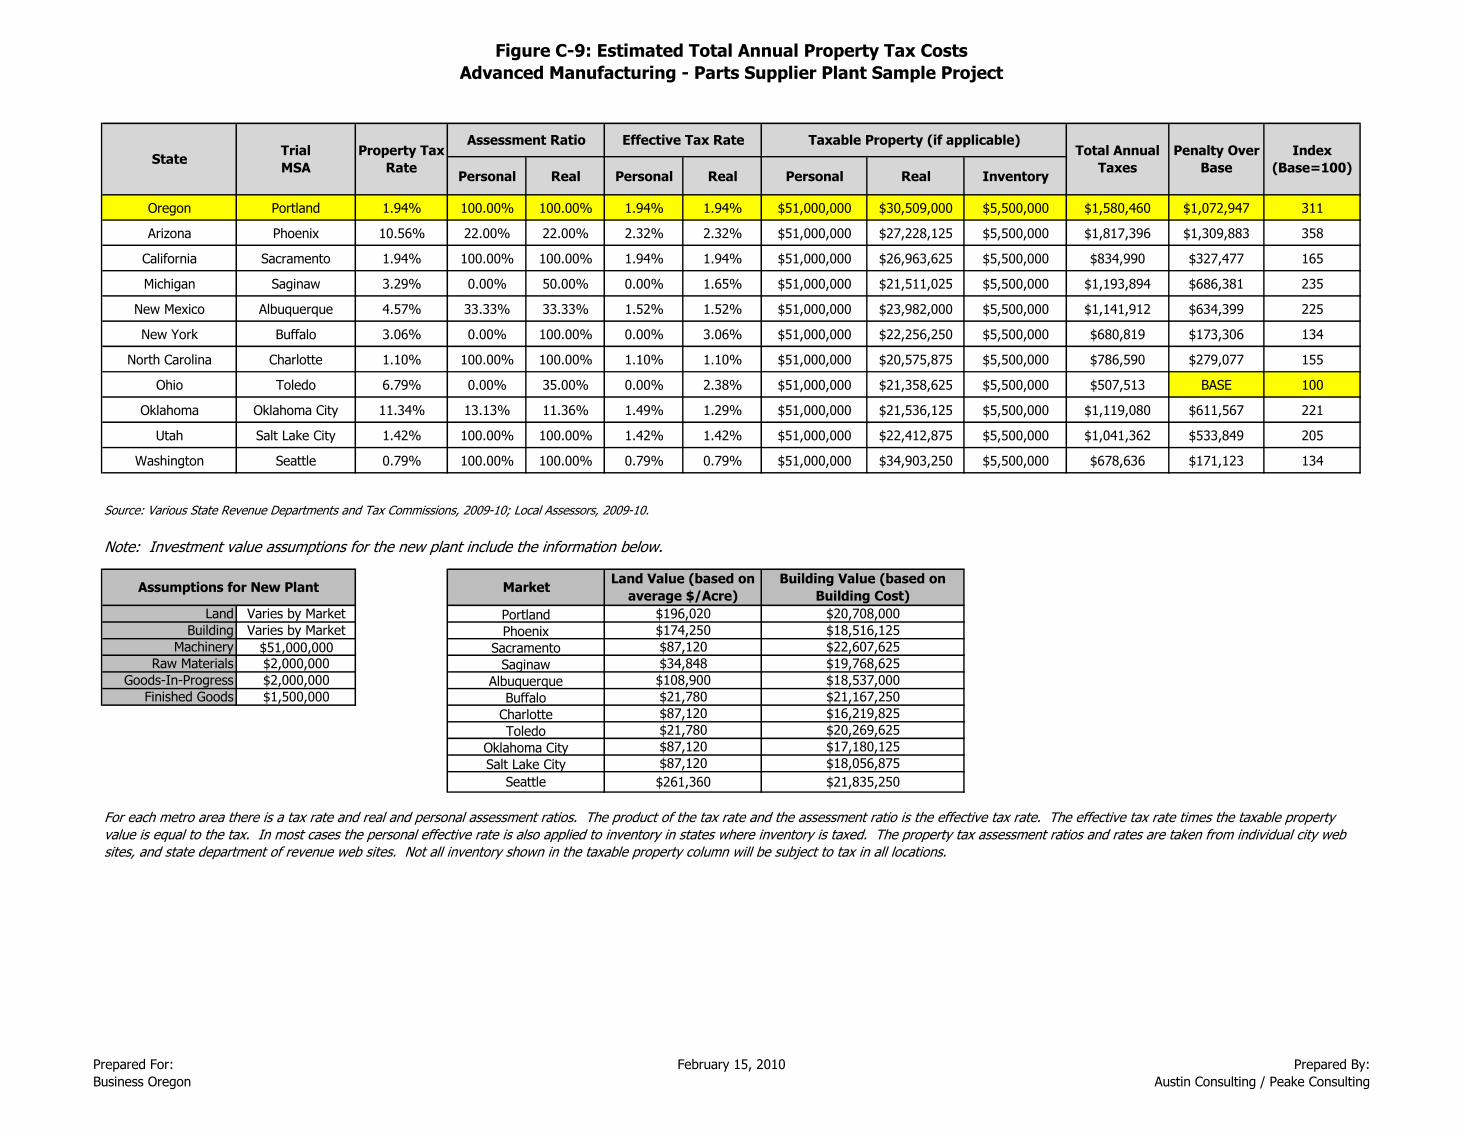
Figure C-9: Estimated Total Annual Property Tax Costs
Advanced Manufacturing - Parts Supplier Plant Sample Project
Personal Real Personal Real Personal Real Inventory
Oregon Portland 1.94% 100.00% 100.00% 1.94% 1.94% $51,000,000 $30,509,000 $5,500,000 $1,580,460 $1,072,947 311
Arizona Phoenix 10.56% 22.00% 22.00% 2.32% 2.32% $51,000,000 $27,228,125 $5,500,000 $1,817,396 $1,309,883 358
California Sacramento 1.94% 100.00% 100.00% 1.94% 1.94% $51,000,000 $26,963,625 $5,500,000 $834,990 $327,477 165
Michigan Saginaw 3.29% 0.00% 50.00% 0.00% 1.65% $51,000,000 $21,511,025 $5,500,000 $1,193,894 $686,381 235
New Mexico Albuquerque 4.57% 33.33% 33.33% 1.52% 1.52% $51,000,000 $23,982,000 $5,500,000 $1,141,912 $634,399 225
New York Buffalo 3.06% 0.00% 100.00% 0.00% 3.06% $51,000,000 $22,256,250 $5,500,000 $680,819 $173,306 134
North Carolina Charlotte 1.10% 100.00% 100.00% 1.10% 1.10% $51,000,000 $20,575,875 $5,500,000 $786,590 $279,077 155
Ohio Toledo 6.79% 0.00% 35.00% 0.00% 2.38% $51,000,000 $21,358,625 $5,500,000 $507,513 BASE 100
Oklahoma Oklahoma City 11.34% 13.13% 11.36% 1.49% 1.29% $51,000,000 $21,536,125 $5,500,000 $1,119,080 $611,567 221
Utah Salt Lake City 1.42% 100.00% 100.00% 1.42% 1.42% $51,000,000 $22,412,875 $5,500,000 $1,041,362 $533,849 205
Washington Seattle 0.79% 100.00% 100.00% 0.79% 0.79% $51,000,000 $34,903,250 $5,500,000 $678,636 $171,123 134
Source: Various State Revenue Departments and Tax Commissions, 2009-10; Local Assessors, 2009-10.
Land Varies by Market
Building Varies by Market
Machinery $51,000,000Raw Materials $2,000,000
Goods-In-Progress $2,000,000
Finished Goods $1,500,000
For each metro area there is a tax rate and real and personal assessment ratios. The product of the tax rate and the assessment ratio is the effective tax rate. The effective tax rate times the taxable property
value is equal to the tax. In most cases the personal effective rate is also applied to inventory in states where inventory is taxed. The property tax assessment ratios and rates are taken from individual city web
sites, and state department of revenue web sites. Not all inventory shown in the taxable property column will be subject to tax in all locations.
Salt Lake City $87,120 $18,056,875
Seattle $261,360 $21,835,250
Toledo $21,780 $20,269,625
Oklahoma City $87,120 $17,180,125
Buffalo $21,780 $21,167,250
Charlotte $87,120 $16,219,825
Saginaw $34,848 $19,768,625
Albuquerque $108,900 $18,537,000
$20,708,000
Phoenix $174,250 $18,516,125
Sacramento $87,120 $22,607,625
Portland $196,020
Index
(Base=100)
Property Tax
Rate
Assessment Ratio Effective Tax Rate Taxable Property (if applicable)
Note: Investment value assumptions for the new plant include the information below.
Assumptions for New Plant Market
StateTrial
MSA
Total Annual
Taxes
Penalty Over
Base
Land Value (based on
average $/Acre)
Building Value (based on
Building Cost)
Prepared For:
Business Oregon
February 15, 2010 Prepared By:
Austin Consulting / Peake Consulting
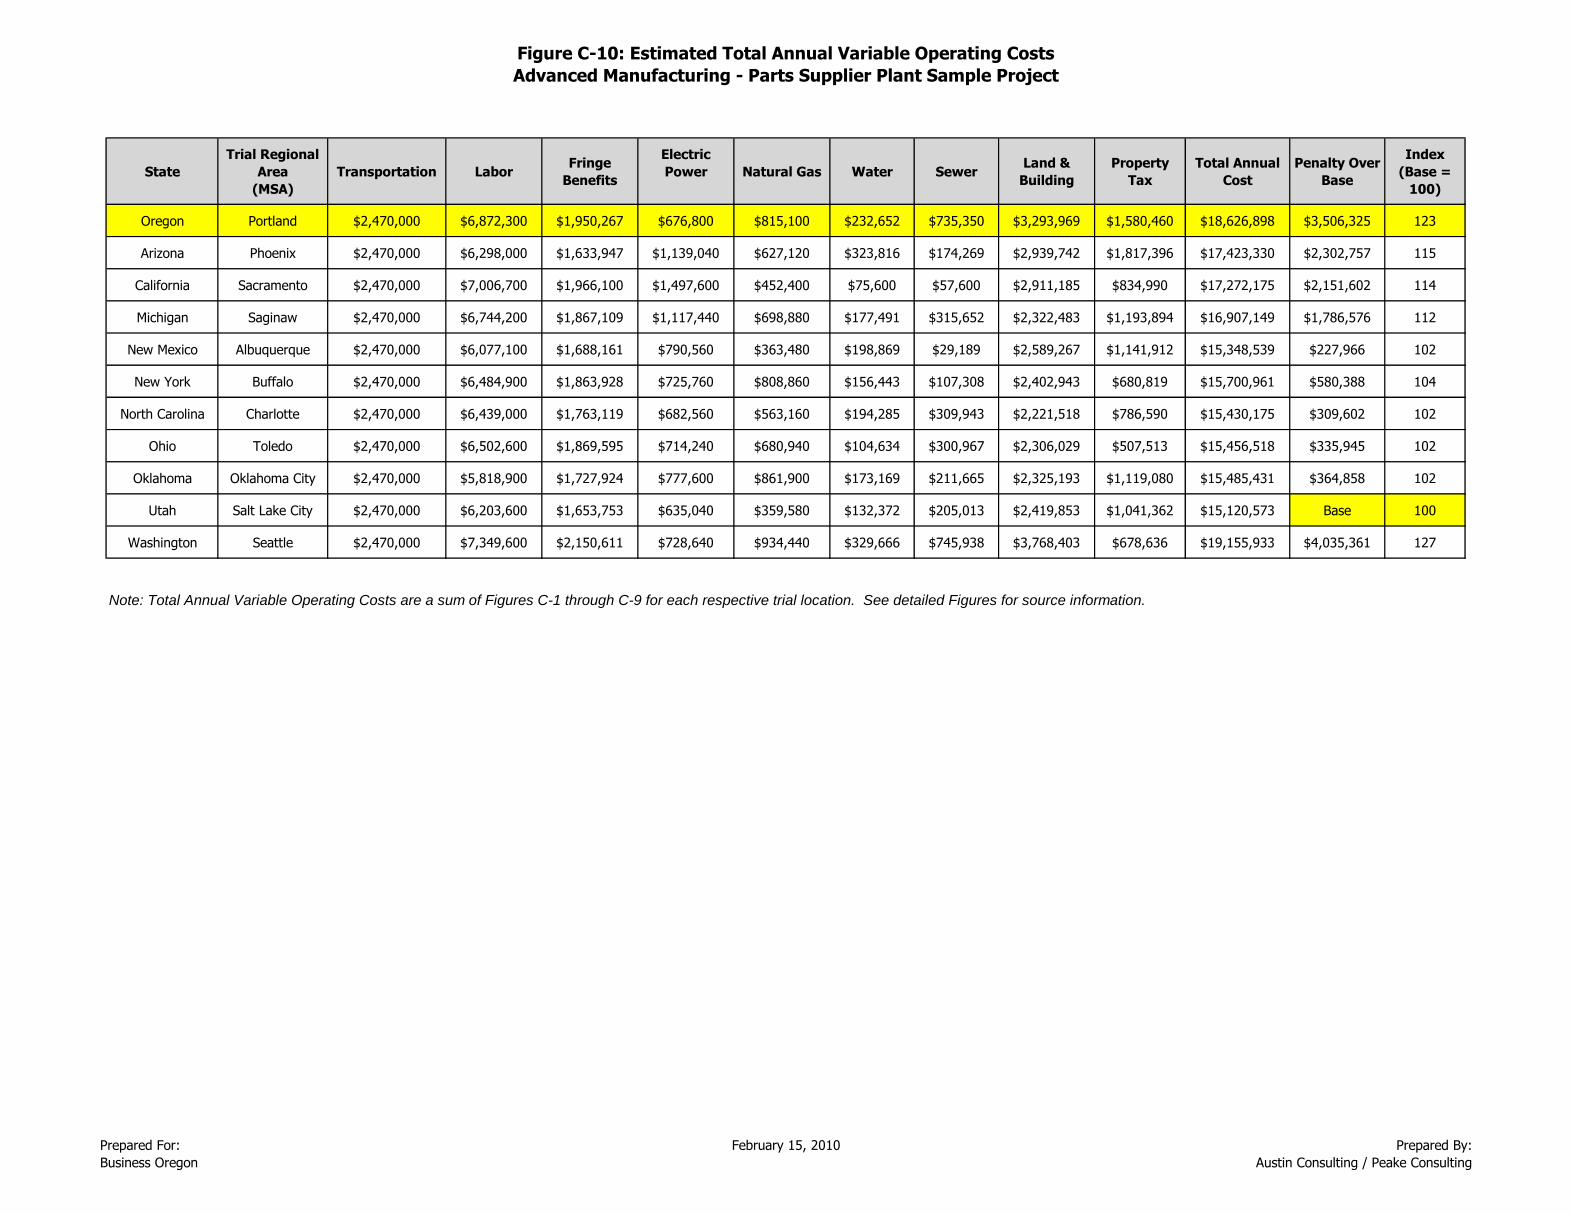
Figure C-10: Estimated Total Annual Variable Operating Costs
Advanced Manufacturing - Parts Supplier Plant Sample Project
State
Trial Regional
Area
(MSA)
Transportation Labor Fringe
Benefits
Electric
Power Natural Gas Water SewerLand &
Building
Property
Tax
Total Annual
Cost
Penalty Over
Base
Index
(Base =
100)
Oregon Portland $2,470,000 $6,872,300 $1,950,267 $676,800 $815,100 $232,652 $735,350 $3,293,969 $1,580,460 $18,626,898 $3,506,325 123
Arizona Phoenix $2,470,000 $6,298,000 $1,633,947 $1,139,040 $627,120 $323,816 $174,269 $2,939,742 $1,817,396 $17,423,330 $2,302,757 115
California Sacramento $2,470,000 $7,006,700 $1,966,100 $1,497,600 $452,400 $75,600 $57,600 $2,911,185 $834,990 $17,272,175 $2,151,602 114
Michigan Saginaw $2,470,000 $6,744,200 $1,867,109 $1,117,440 $698,880 $177,491 $315,652 $2,322,483 $1,193,894 $16,907,149 $1,786,576 112
New Mexico Albuquerque $2,470,000 $6,077,100 $1,688,161 $790,560 $363,480 $198,869 $29,189 $2,589,267 $1,141,912 $15,348,539 $227,966 102
New York Buffalo $2,470,000 $6,484,900 $1,863,928 $725,760 $808,860 $156,443 $107,308 $2,402,943 $680,819 $15,700,961 $580,388 104
North Carolina Charlotte $2,470,000 $6,439,000 $1,763,119 $682,560 $563,160 $194,285 $309,943 $2,221,518 $786,590 $15,430,175 $309,602 102
Ohio Toledo $2,470,000 $6,502,600 $1,869,595 $714,240 $680,940 $104,634 $300,967 $2,306,029 $507,513 $15,456,518 $335,945 102
Oklahoma Oklahoma City $2,470,000 $5,818,900 $1,727,924 $777,600 $861,900 $173,169 $211,665 $2,325,193 $1,119,080 $15,485,431 $364,858 102
Utah Salt Lake City $2,470,000 $6,203,600 $1,653,753 $635,040 $359,580 $132,372 $205,013 $2,419,853 $1,041,362 $15,120,573 Base 100
Washington Seattle $2,470,000 $7,349,600 $2,150,611 $728,640 $934,440 $329,666 $745,938 $3,768,403 $678,636 $19,155,933 $4,035,361 127
Note: Total Annual Variable Operating Costs are a sum of Figures C-1 through C-9 for each respective trial location. See detailed Figures for source information.
Prepared For:
Business Oregon
February 15, 2010 Prepared By:
Austin Consulting / Peake Consulting