Embed Size (px)
Citation preview
STATE OF HAWAII FACILITIES ON OAHU
ENERGY BENCHMARKING STUDY
VOLUME I
Report and Recommendations
Submitted to
The State of Hawaii Department of Business, Economic Development, & Tourism
Strategic Industries Division
By
Cedric D. O. Chong and Associates 828 Fort St. Mall, Ste. 500
Honolulu, HI 96813
July 15 2005
Disclaimer
This report was supported, in whole or in part, by U.S. Department of Energy (DOE) Grant No. DE-FG51-05R021337. This support does not constitute an endorsement by the DOE of the views expressed in the study.
i
Acknowledgments
This project was conducted with the support of the Hawaii Rebuild America Program and Partnerships. The following individuals provided information and data pertaining to this study. Their sharing of insights and knowledge of energy efficiency in State facilities are appreciated. Lane, Bill – State Account Representative, Hawaiian Electric Company, Inc., Honolulu, Hawaii Raman, Elizabeth - Energy Conservation Program Specialist, Strategic Industries Division, Department of Business, Economic Development, & Tourism, Hawaii Shon, Carolyn - Energy Branch Manager, Strategic Industries Division, Department of Business, Economic Development, & Tourism, Hawaii Wayne Nakamura - Housing and Community Development Corporation of Hawaii Hisano, James - Department of Accounting and General Service, Hawaii Dean Shimamura - Department of Accounting and General Service, Hawaii Wendy Cheuk - Department of Transportation, Hawaii Roy Ikeda - Department of Education, Hawaii Scuma Elliot - Department of Education, Hawaii
Prepared By:
Melek Yalcintas/ Joel Yuen, Cedric D. O. Chong and Associates, Honolulu, Hawaii
ii
EXECUTIVE SUMMARY
This benchmarking study evaluates the electrical energy consumption and characterizes
the distribution of electrical energy usage for the State of Hawaii facilities on Oahu by
State agency, building occupancy type, and end use. Additionally, benchmarking for
various Energy Conservation Measures (ECMs), including a projection of the cost for
their implementation, and their associated energy savings potential, are presented in the
report.
The benchmarking data for the study is based on several sources, including: 1)
previously conducted energy audits on various State buildings on Oahu, 2) electricity
billing history for the largest State facilities, 3) information on previously implemented
ECMs identified through Hawaiian Electric Company’s Demand Side Management
(DSM) rebate history, 4) building occupied square footage area information provided by
DAGS for certain State facilities on Oahu from 2001 records, 5) completed energy survey
forms from several State agencies, and 6) an energy benchmarking study for the UH
Manoa Campus conducted in 2004.
Based on the results of this study, there are approximately 2,625 buildings that are
identified as being owned and operated by the State of Hawaii. Approximately 80 % of
those buildings are located on Oahu. The total building floor space of the State of Hawaii
facilities on Oahu, excluding pavements, sidewalks, courtyards and any open spaces, is
estimated at about 26,367,927 square feet. The total yearly electrical energy
consumption for all State facilities on Oahu for 2004 was 557,654,688 kWh. This
amounted to a total cost of $71,372,318 for electricity in 2004, at an average rate of
$0.128 per kWh. This electrical energy consumption corresponded to an average of 21.1
kWh per square feet of occupied building space per year in electrical energy
consumption, and an average of $2.70 per square foot per year in electricity costs, for the
Oahu facilities in 2004. The costs reflect the total cost for electricity, and include the
costs for the demand charges, energy charges, fuel oil adjustment, and additional
customer service charges and discounts that will vary somewhat from account to account
depending on the actual rate schedules and service agreements. Other sources of energy
iii
used by the State facilities on Oahu, such as gas and fuel oil, are not evaluated in this
report.
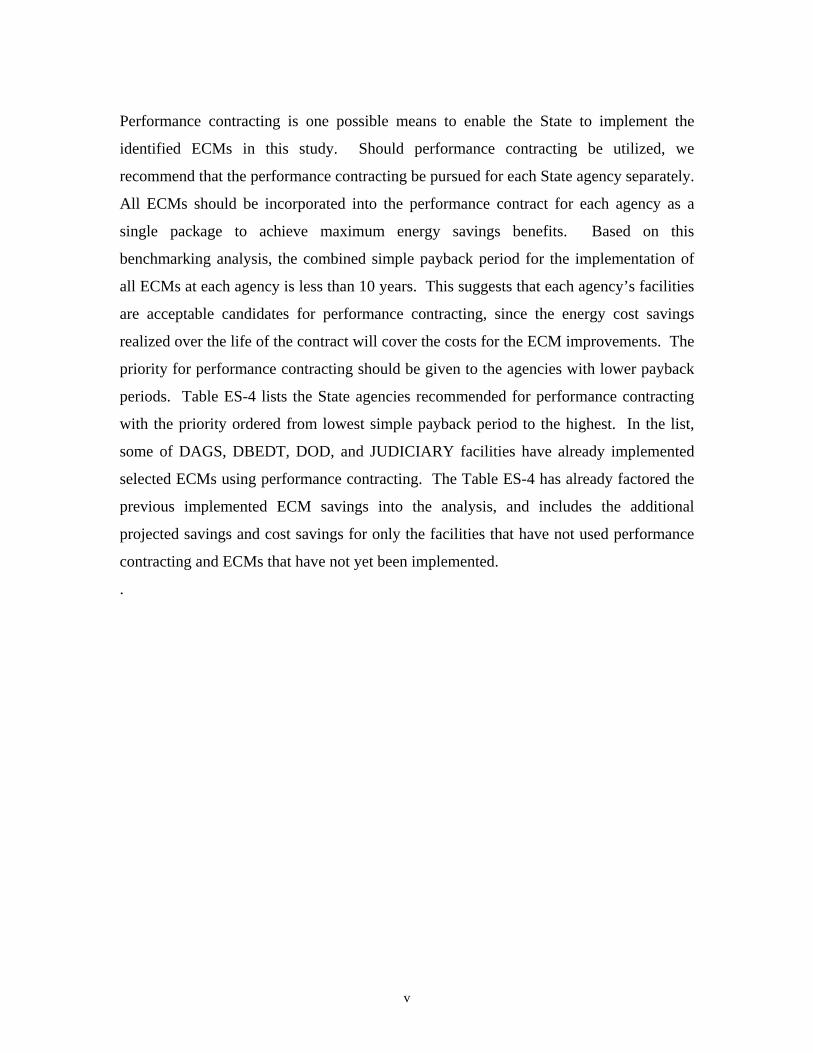
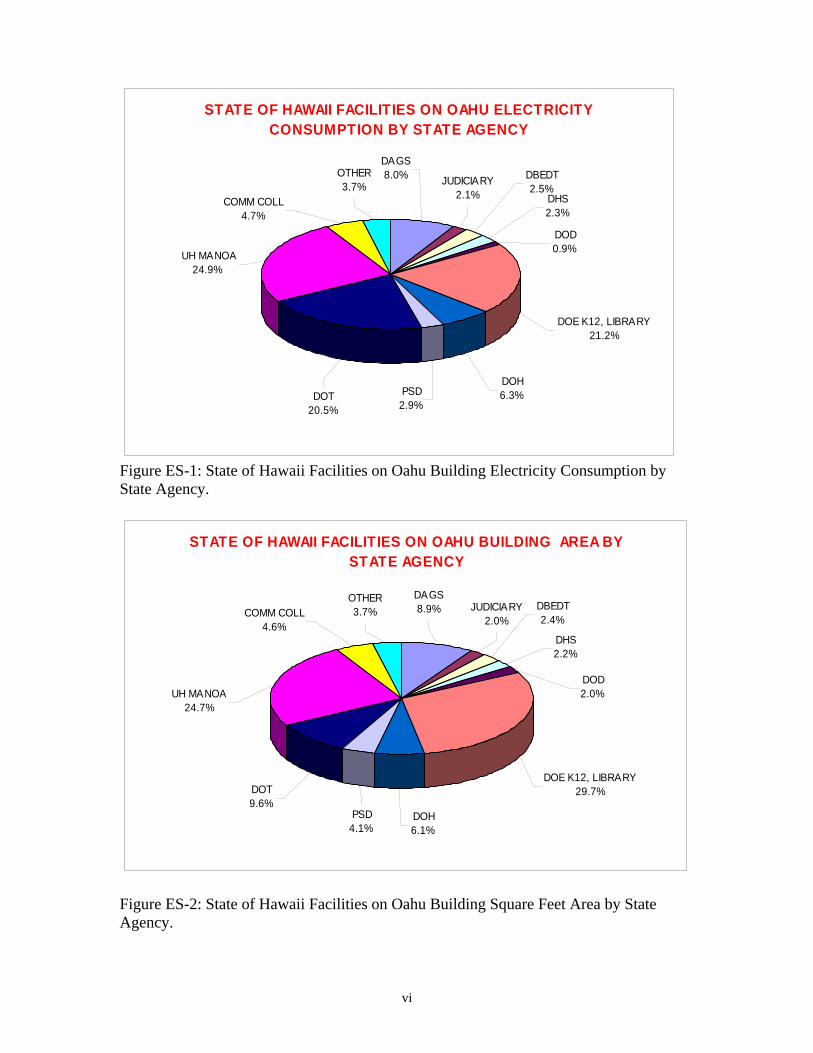
The distribution of building floor area and electrical energy usage by State agency is
illustrated in charts in Figure ES-1 and Figure ES-2. As can be followed from the charts,
UH Manoa Campus, DOE K-12 schools and DOT are the highest energy consumers that
also occupy the most floor area. The building floor area and yearly electricity usage per
square foot for each agency and State-wide percentage of electricity usage are
documented in Table ES-1. This table is ordered from the largest to the smallest in terms
of occupied area and electrical consumption.
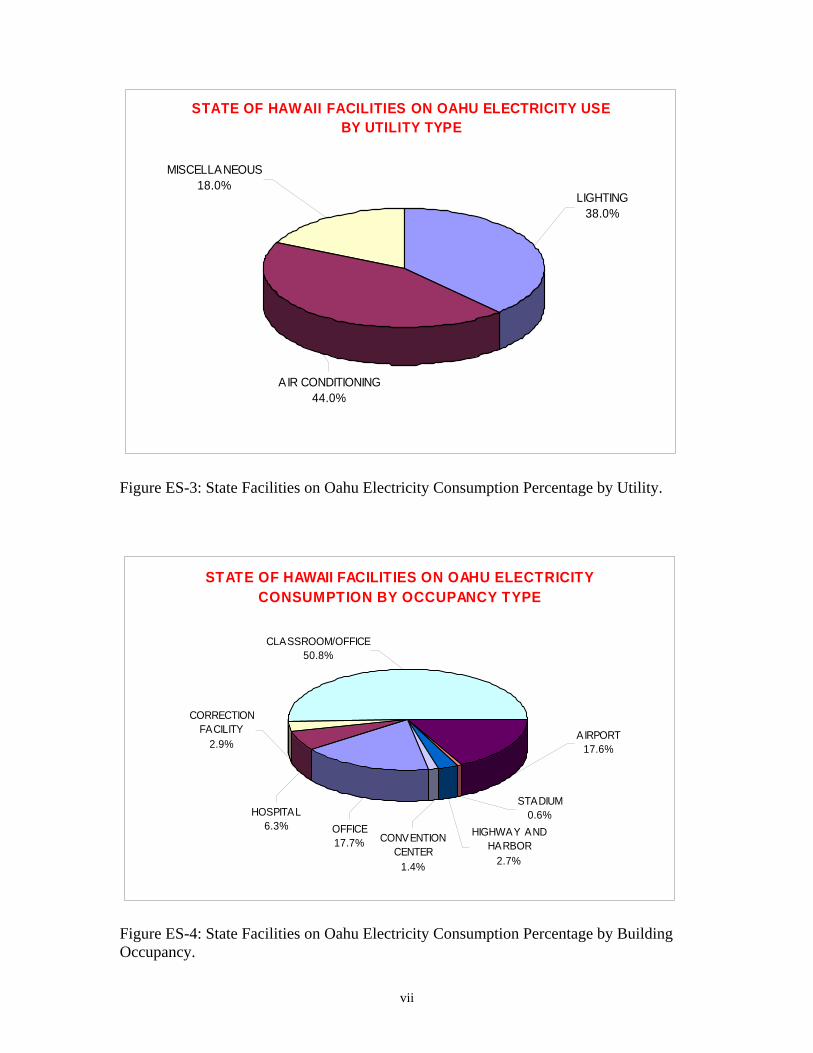
Electrical energy usage distribution by utilization category, including air conditioning,
lighting and miscellaneous equipment for all facilities on Oahu is illustrated in Figure
ES-3. Air conditioning is the highest electrical energy consuming category at 44%,
followed by lighting at 30%.
Electrical energy usage distribution by occupancy type, including educational
classroom/office, hospital, airport, office, highways and harbors, and correction facilities,
for Oahu are illustrated in Figure ES-4. This figure shows that approximately 50% of
State facilities are educational classroom/office type facilities, including the DOE’s
schools, the community colleges, and the University of Hawaii at Manoa. The other
major occupancies are general office (17.7%) and airport terminals (17.6%)
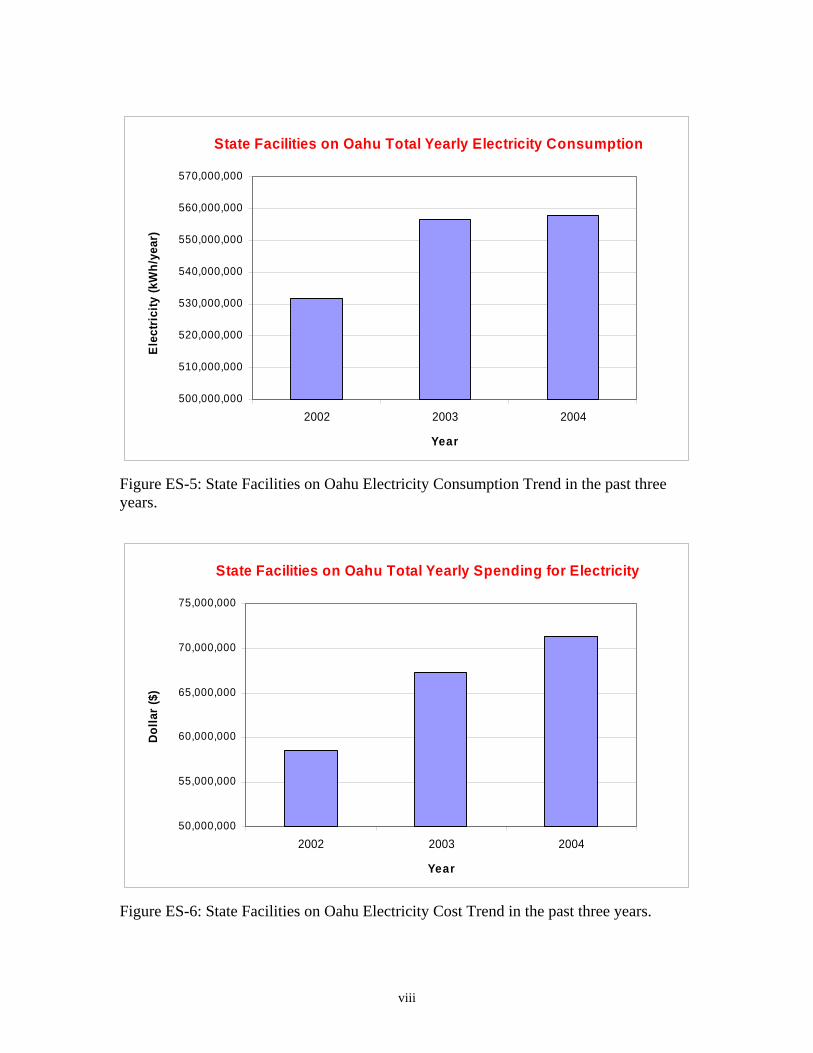
Additional useful information for State facilities on Oahu is the comparison of the total
electrical usage and cost comparison over the past few years. Figure ES-5 and Figure
ES-6 show the electrical consumption and electrical cost trends for the period from 2002
through 2004. While the annual electrical energy consumption also increased during this
period, the increase in the cost of electricity has been more significant due to the
escalation in the fuel oil adjustment charges. If the fuel oil adjustment charges continue
to escalate, the State’s electrical costs will increase further, even if the State’s electricity
usage remains steady. This Figure emphasizes the importance of energy conservation in
State facilities.
iv
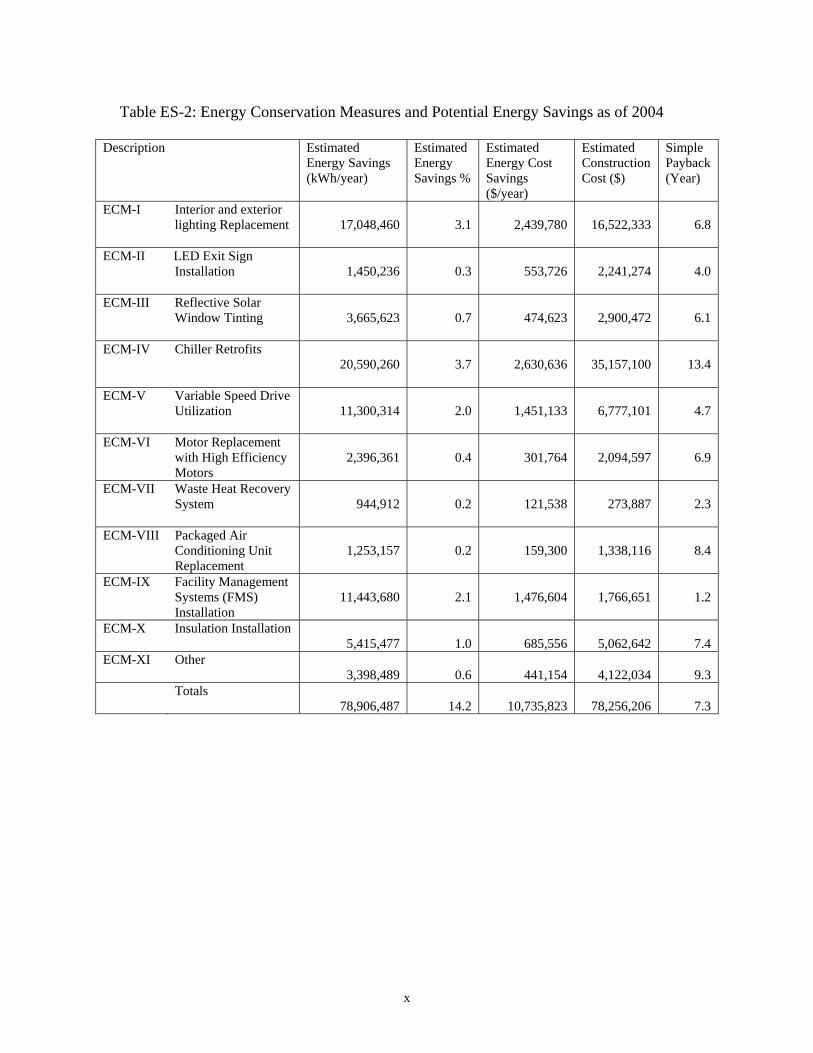
ECMs documented in the reference sources, integrated with additional engineering
assumptions, were extrapolated for all of the State facilities on Oahu where applicable.
The ECMs were then categorized by their energy savings potential and payback period.
As shown in Table ES-2, a total of eleven ECMs were identified that would produce
energy savings with a payback period of less than 15 years if they were implemented.
These identified ECMs are: 1) interior and exterior lighting replacements with less energy
consuming lighting, 2) replacement of existing ‘Exit’ signs with efficient LED ‘Exit’
signs, 3) reflective solar window tinting, 4) chiller retrofits, 5) VFD (Variable Frequency
Drive) replacement, 6) high efficiency motor replacement, 7) installation of waste heat
recovery systems, 8) packaged air conditioning unit replacement, 9) facility management
system installation, 10) roof insulation installation, 11) other (including ECMs to convert
constant volume air conditioning systems to VAV (Variable Air Volume) systems, to
repair VAV control system, and to install carbon dioxide sensors).
Based on our analysis, implementation of these Energy Conservation Measures (ECMs)
for all State buildings on Oahu will result in an estimated electrical savings of 78,906,487
kWh per year, or $10,735,823 per year. The estimated construction cost for
implementation of the evaluated ECMs is $78,256,206, which would result in a payback
of about 7.3 years. Implementation of these ECMs will result in roughly a 14%
reduction in the electrical consumption of the State facilities on Oahu. These ECMs and
the percentage of energy savings that are projected to be realized from their
implementation are listed in Table ES-2. Please note that any further increases in
electrical costs due to further fuel oil adjustments are not included in the ECM payback
projections. If these future increases in electrical costs are included in the ECM payback
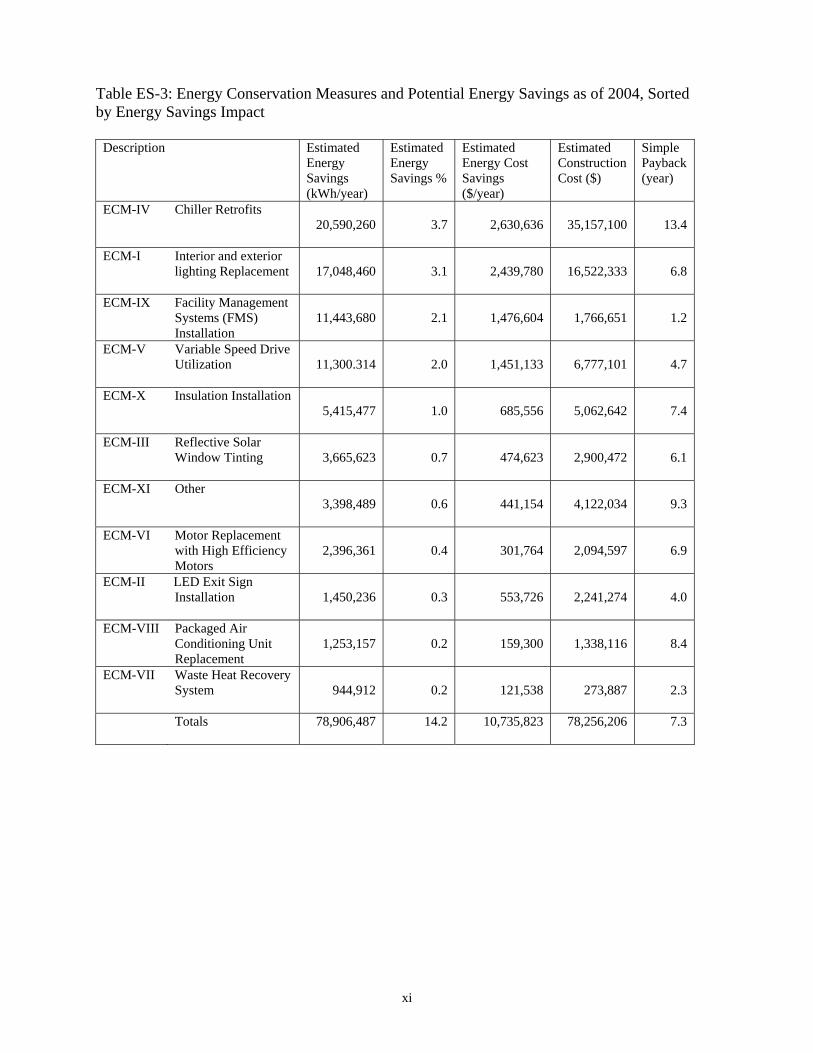
estimates, the payback period will be reduced proportionately. Table ES-3 shows the
same ECMs listed in Table ES-2 ordered by energy savings potential from highest to
lowest, including the percentage of electrical energy saving potential. According to our
analysis, ECM-IV Chiller Retrofits has the highest electrical energy savings potential of
3.7%, followed by ECM-I Interior and Exterior Lighting Replacement with a 3.1%
savings potential, ECM-IX Facility Management Systems (FMS) Installation with a 2.1%
savings potential and ECM-V Variable Drive Utilization with a 2.0% savings potential.
v
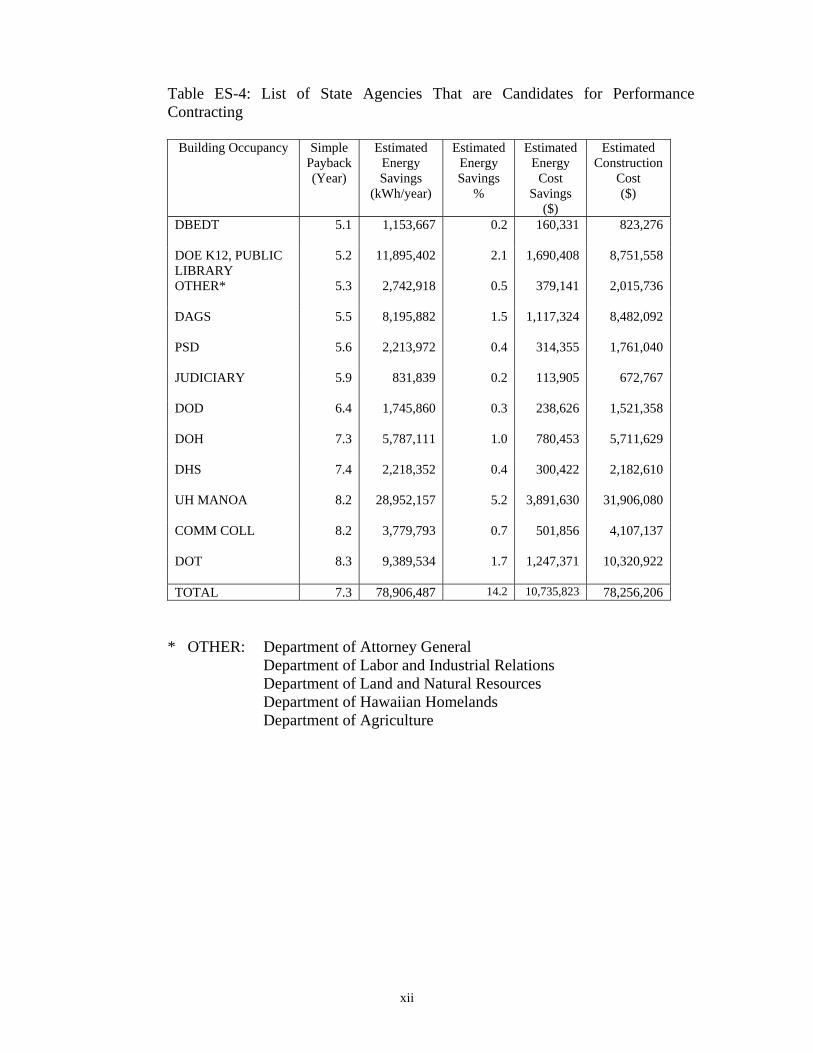
Performance contracting is one possible means to enable the State to implement the
identified ECMs in this study. Should performance contracting be utilized, we
recommend that the performance contracting be pursued for each State agency separately.
All ECMs should be incorporated into the performance contract for each agency as a
single package to achieve maximum energy savings benefits. Based on this
benchmarking analysis, the combined simple payback period for the implementation of
all ECMs at each agency is less than 10 years. This suggests that each agency’s facilities
are acceptable candidates for performance contracting, since the energy cost savings
realized over the life of the contract will cover the costs for the ECM improvements. The
priority for performance contracting should be given to the agencies with lower payback
periods. Table ES-4 lists the State agencies recommended for performance contracting
with the priority ordered from lowest simple payback period to the highest. In the list,
some of DAGS, DBEDT, DOD, and JUDICIARY facilities have already implemented
selected ECMs using performance contracting. The Table ES-4 has already factored the
previous implemented ECM savings into the analysis, and includes the additional
projected savings and cost savings for only the facilities that have not used performance
contracting and ECMs that have not yet been implemented.
.
vi
STATE OF HAWAII FACILITIES ON OAHU ELECTRICITY CONSUMPTION BY STATE AGENCY
OTHER3.7% JUDICIARY
2.1%
DBEDT2.5%
DHS2.3%
DAGS8.0%
DOD0.9%
DOE K12, LIBRARY21.2%
DOH6.3%
COMM COLL4.7%
UH MANOA24.9%
DOT20.5%
PSD2.9%
Figure ES-1: State of Hawaii Facilities on Oahu Building Electricity Consumption by State Agency.
STATE OF HAWAII FACILITIES ON OAHU BUILDING AREA BY STATE AGENCY
OTHER3.7%
PSD4.1%
DOT9.6%
UH MANOA24.7%
COMM COLL4.6%
DOH6.1%
DOE K12, LIBRARY29.7%
DOD2.0%
DAGS8.9%
DHS2.2%
DBEDT2.4%
JUDICIARY2.0%
Figure ES-2: State of Hawaii Facilities on Oahu Building Square Feet Area by State Agency.
vii
STATE OF HAWAII FACILITIES ON OAHU ELECTRICITY USE BY UTILITY TYPE
AIR CONDITIONING44.0%
MISCELLANEOUS18.0%
LIGHTING38.0%
Figure ES-3: State Facilities on Oahu Electricity Consumption Percentage by Utility.
STATE OF HAWAII FACILITIES ON OAHU ELECTRICITY CONSUMPTION BY OCCUPANCY TYPE
CONVENTION CENTER
1.4%
HIGHWAY AND HARBOR
2.7%
STADIUM0.6%
AIRPORT17.6%
OFFICE17.7%
CLASSROOM/OFFICE50.8%
CORRECTION FACILITY
2.9%
HOSPITAL6.3%
Figure ES-4: State Facilities on Oahu Electricity Consumption Percentage by Building Occupancy.
viii
State Facilities on Oahu Total Yearly Electricity Consumption
500,000,000
510,000,000
520,000,000
530,000,000
540,000,000
550,000,000
560,000,000
570,000,000
2002 2003 2004
Year
Ele
ctri
city
(kW
h/ye
ar)
Figure ES-5: State Facilities on Oahu Electricity Consumption Trend in the past three years.
State Facilities on Oahu Total Yearly Spending for Electricity
50,000,000
55,000,000
60,000,000
65,000,000
70,000,000
75,000,000
2002 2003 2004
Year
Dolla
r ($)
Figure ES-6: State Facilities on Oahu Electricity Cost Trend in the past three years.
ix
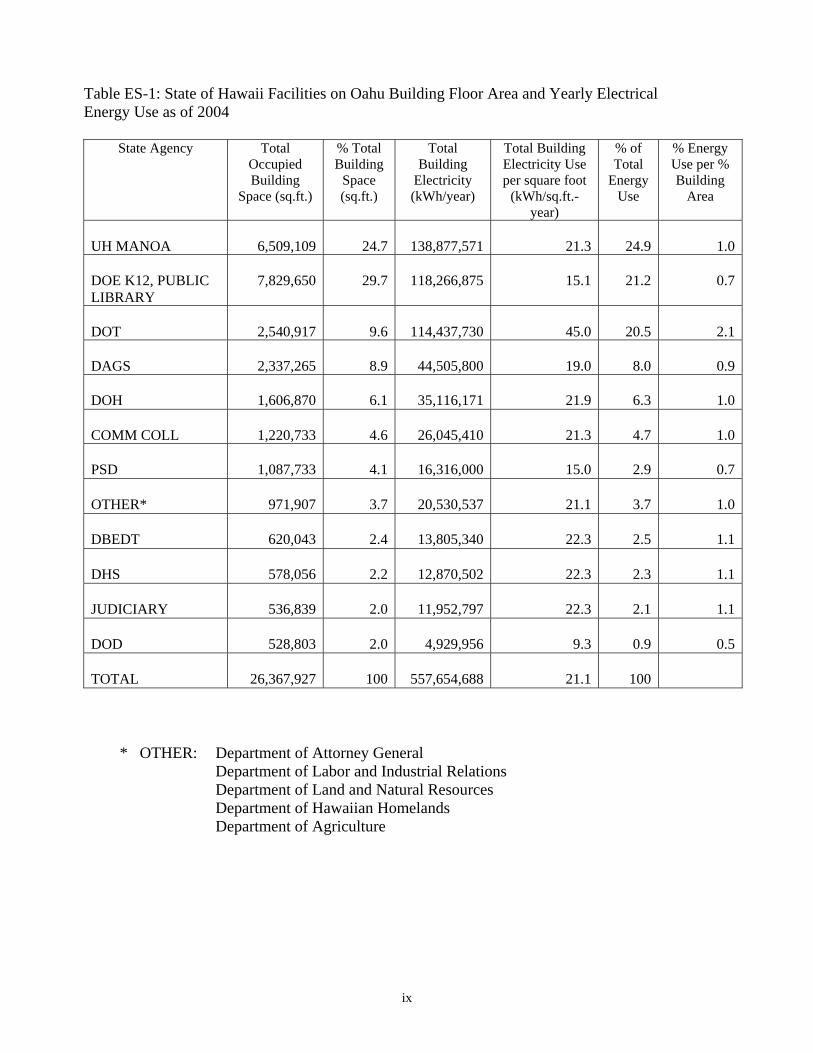
Table ES-1: State of Hawaii Facilities on Oahu Building Floor Area and Yearly Electrical Energy Use as of 2004
State Agency Total
Occupied Building
Space (sq.ft.)
% Total Building
Space (sq.ft.)
Total Building
Electricity (kWh/year)
Total Building Electricity Use per square foot
(kWh/sq.ft.-year)
% of Total
Energy Use
% Energy Use per % Building
Area
UH MANOA
6,509,109
24.7
138,877,571
21.3
24.9
1.0
DOE K12, PUBLIC LIBRARY
7,829,650
29.7
118,266,875
15.1
21.2
0.7
DOT
2,540,917
9.6
114,437,730
45.0
20.5
2.1
DAGS
2,337,265
8.9
44,505,800
19.0
8.0
0.9
DOH
1,606,870
6.1
35,116,171
21.9
6.3
1.0
COMM COLL
1,220,733
4.6
26,045,410
21.3
4.7
1.0
PSD
1,087,733
4.1
16,316,000
15.0
2.9
0.7
OTHER*
971,907
3.7
20,530,537
21.1
3.7
1.0
DBEDT
620,043
2.4
13,805,340
22.3
2.5
1.1
DHS
578,056
2.2
12,870,502
22.3
2.3
1.1
JUDICIARY
536,839
2.0
11,952,797
22.3
2.1
1.1
DOD
528,803
2.0
4,929,956
9.3
0.9
0.5
TOTAL
26,367,927
100
557,654,688
21.1
100
* OTHER: Department of Attorney General Department of Labor and Industrial Relations Department of Land and Natural Resources Department of Hawaiian Homelands Department of Agriculture
x
Table ES-2: Energy Conservation Measures and Potential Energy Savings as of 2004
Description Estimated Energy Savings (kWh/year)
Estimated Energy Savings %
Estimated Energy Cost Savings ($/year)
Estimated Construction Cost ($)
Simple Payback (Year)
ECM-I Interior and exterior lighting Replacement
17,048,460
3.1
2,439,780
16,522,333
6.8
ECM-II LED Exit Sign
Installation
1,450,236
0.3
553,726
2,241,274
4.0
ECM-III Reflective Solar Window Tinting
3,665,623
0.7
474,623
2,900,472
6.1
ECM-IV Chiller Retrofits
20,590,260
3.7
2,630,636
35,157,100
13.4
ECM-V Variable Speed Drive
Utilization
11,300,314
2.0
1,451,133
6,777,101
4.7
ECM-VI Motor Replacement with High Efficiency Motors
2,396,361
0.4
301,764
2,094,597
6.9
ECM-VII Waste Heat Recovery System
944,912
0.2
121,538
273,887
2.3
ECM-VIII Packaged Air
Conditioning Unit Replacement
1,253,157
0.2
159,300
1,338,116
8.4
ECM-IX Facility Management
Systems (FMS) Installation
11,443,680
2.1
1,476,604
1,766,651
1.2
ECM-X Insulation Installation 5,415,477
1.0
685,556
5,062,642
7.4
ECM-XI Other 3,398,489
0.6
441,154
4,122,034
9.3
Totals
78,906,487
14.2
10,735,823
78,256,206
7.3
xi
Table ES-3: Energy Conservation Measures and Potential Energy Savings as of 2004, Sorted by Energy Savings Impact
Description Estimated
Energy Savings (kWh/year)
Estimated Energy Savings %
Estimated Energy Cost Savings ($/year)
Estimated Construction Cost ($)
Simple Payback (year)
ECM-IV Chiller Retrofits 20,590,260
3.7
2,630,636
35,157,100
13.4
ECM-I Interior and exterior
lighting Replacement
17,048,460
3.1
2,439,780
16,522,333
6.8
ECM-IX Facility Management
Systems (FMS) Installation
11,443,680
2.1
1,476,604
1,766,651
1.2
ECM-V Variable Speed Drive Utilization
11,300.314
2.0
1,451,133
6,777,101
4.7
ECM-X Insulation Installation
5,415,477
1.0
685,556
5,062,642
7.4
ECM-III Reflective Solar Window Tinting
3,665,623
0.7
474,623
2,900,472
6.1
ECM-XI Other
3,398,489
0.6
441,154
4,122,034
9.3
ECM-VI Motor Replacement with High Efficiency Motors
2,396,361
0.4
301,764
2,094,597
6.9
ECM-II LED Exit Sign Installation
1,450,236
0.3
553,726
2,241,274
4.0
ECM-VIII Packaged Air Conditioning Unit Replacement
1,253,157
0.2
159,300
1,338,116
8.4
ECM-VII Waste Heat Recovery
System
944,912
0.2
121,538
273,887
2.3
Totals
78,906,487 14.2 10,735,823 78,256,206 7.3
xii
Table ES-4: List of State Agencies That are Candidates for Performance Contracting
Building Occupancy Simple
Payback (Year)
Estimated Energy Savings
(kWh/year)
Estimated Energy Savings
%
Estimated Energy
Cost Savings
($)
Estimated Construction
Cost ($)
DBEDT
5.1 1,153,667 0.2 160,331 823,276
DOE K12, PUBLIC LIBRARY
5.2 11,895,402 2.1 1,690,408 8,751,558
OTHER*
5.3 2,742,918 0.5 379,141 2,015,736
DAGS
5.5 8,195,882 1.5 1,117,324 8,482,092
PSD
5.6 2,213,972 0.4 314,355 1,761,040
JUDICIARY
5.9 831,839 0.2 113,905 672,767
DOD
6.4 1,745,860 0.3 238,626 1,521,358
DOH
7.3 5,787,111 1.0 780,453 5,711,629
DHS
7.4 2,218,352 0.4 300,422 2,182,610
UH MANOA
8.2 28,952,157 5.2 3,891,630 31,906,080
COMM COLL
8.2 3,779,793 0.7 501,856 4,107,137
DOT
8.3 9,389,534 1.7 1,247,371 10,320,922
TOTAL 7.3 78,906,487 14.2 10,735,823 78,256,206
* OTHER: Department of Attorney General Department of Labor and Industrial Relations Department of Land and Natural Resources Department of Hawaiian Homelands Department of Agriculture
xiii
TABLE OF CONTENTS PAGE
ACKNOWLEDGEMENTS.......................................................................................... i EXECUTIVE SUMMARY .........................................................................................ii TABLE OF CONTENTS..........................................................................................xiii LIST OF TABLES .................................................................................................... xv LIST OF FIGURES ................................................................................................xvii 1.0 INTRODUCTION/PURPOSE............................................................................ 1 2.0 BACKGROUND ................................................................................................ 4 3.0 BENCHMARKING DATA ............................................................................. 7 3.1 UH MANOA ENERGY BENCHMARKING STUDY ............................ 8 3.2 ELECTRICITY BILL HISTORY FOR LARGE STATE FACILITIES ON OAHU AND REBATE HISTORY FROM 1997 THROUGH 2004................................................................ 10 3.3 EXISTING ENERGY AUDIT/SURVEY RESULTS............................. 11 3.4 HAWAII STATE FACILITY ENERGY UPGRADE ANALYSIS AND PERFORMANCE CONTRACTING POTENTIAL PHASE I AND PHASE II REPORT ....................................................................... 12 3.5 STATE FACILITIES ON OAHU BUILDING AREA SQUARE FOOTAGE DATA................................................................................... 14 3.6 ENERGY SURVEY FORMS.................................................................. 14 3.7 UH MANOA ECM BENCHMARKING SPREADSHEET ANALYSIS ............................................................................................. 15 4.0 BENCHMARKING ENERGY ANALYSIS.................................................... 16 4.1 BASELINE SPREADSHEET ANALYSIS............................................. 26 4.2 BASELINE ELECTRICITY DISTRIBUTION BY END USE .............. 31 5.0 BENCHMARKING ENERGY CONSERVATION MEASURES .................. 35 5.1 STATE FACILITIES ON OAHU ENERGY CONSERVATION MEASURE BENCHMARKING RESULTS .......................................... 44 6.0 CONCLUSIONS AND RECOMMENDATIONS ........................................... 48
APPENDICES
1.0 UH MANOA CAMPUS ENERGY BENCHMARKING STUDY EXECUTIVE SUMMARY
2.0 HECO ELECTRICITY BILLING HISTORY FOR LARGE STATE FACILITIES ON OAHU FOR 2003 AND 2004
2.1 HECO REBATE HISTORY FOR ALL STATE FACILITIES ON OAHU FROM 1997 THROUGH 2004
3.0 SUMMARY OF EXISTING ENERGY AUDIT/SURVEY RESULTS PRESENTED IN “TASK 1-A-1 REPORT”
xiv
4.0 STATE OF HAWAII ELECTRICAL CONSUMPTION BY STATE AGENCIES AND PERCENTAGE ELECTRICITY CONSUMED FOR FISCAL YEAR 2002 REPORTED IN “HAWAII STATE FACILITY ENERGY UPGRADE ANALYSIS & PERFORMANCE CONTRACTING POTENTIAL PHASE I AND PHASE II REPORTS”
4.1 LARGE AND MEDIUM SIZE STATE FACILITIES ON OAHU ELECTRICITY CONSUMPTION HISTORY FOR FISCAL YEAR 2002 REPORTED IN “HAWAII STATE FACILITY ENERGY UPGRADE ANALYSIS & PERFORMANCE CONTRACTING POTENTIAL PHASE I AND PHASE II REPORTS”
4.0 STATE FACILITIES ON OAHU BUILDING AREA SQUARE FOOTAGE DATA PROVIDED BY DAGS UNDER ”INCOMPLETE” STATUS
5.0 LARGE STATE FACILITIES ON OAHU ENERGY SURVEY FORM AND RESPONSES TO THE SURVEY
6.0 UH MANOA CAMPUS BENCHMARKING STUDY ECM SPREADSHEET ANALYSIS
7.0 BASELINE BENCHMARK ANALYSIS ELECTRICITY USE 8.0 BASELINE BENCHMARK ANALYSIS BY END USE ELECTRICITY 9.0 ENERGY CONSERVATION MEASURE BENCHMARK ANALYSIS
xv
LIST OF TABLES
Table ES-1 State of Hawaii Facilities on Oahu Building Floor Area and Yearly Electrical Energy Use as of 2004..................................................................................ix Table ES-2 Energy Conservation Measures and Potential Energy Savings as of 2004 ..................x Table ES-3 Energy Conservation Measures and Potential Energy Savings as of 2004,
Sorted by Energy Savings Impact.................................................................................xi Table ES-4 List of State Agencies That are Candidates for Performance Contracting ...................xii Table 1 State of Hawaii Facilities on Oahu Building Floor Area as of 2004 ............................6 Table 2 State Large Facilities on Oahu Electricity Consumption Summary for Year
2004...............................................................................................................................17 Table 3 State of Hawaii Facilities on Oahu Electricity Consumption Summary in
Year 2002 for Large, Medium And Small Size Facility Distribution...........................22 Table 4 State of Hawaii Facilities on Oahu Electricity Consumption Summary in
Year 2004 for Large, Medium And Small Size Facility Distribution...........................23 Table 5 State Facilities on Oahu Electricity Consumption and Cost for the years
2002, 2003 and 2004.....................................................................................................24 Table 6 State Agencies with Dominating Building Occupancy Type .......................................26 Table 7 State of Hawaii Facilities on Oahu Building Floor Area and Yearly
Electricity Use as of 2004 .............................................................................................30 Table 8 List of ECMs Used for UH Manoa and List of ECMs Identified for State
Facilities........................................................................................................................36
Table 9 UH Manoa Benchmarking Energy Savings and Construction Cost Data per Square Feet for each ECM Evaluated in the Study.......................................................37
Table 10 Initial State Facilities Benchmarking Energy Savings and Construction Cost
per Square Feet for each ECM Adapted from UH Benchmarking Study.....................39 Table 11 State Facilities Already Implemented ECM Square Footage Area Ratios ...................41 Table 12 Final State Facilities Benchmarking Energy Savings and Construction Cost
per Square Feet for each ECM......................................................................................43 Table 13 Energy Conservation Measures and Potential Energy Savings as of 2004 ..................45
xvi
Table 14 Energy Conservation Measures as of 2004, Sorted by Energy Savings Impact ...........................................................................................................................46
Table 15 Energy Conservation Measures and Implementation Cost Breakdown by
State Agency, as of 2004 ..............................................................................................47 Table 16 Energy Conservation Measures as of 2004, Sorted by Estimated Energy
Savings..........................................................................................................................51 Table 17 Energy Conservation Measures as of 2004, Sorted by Simple Payback Year..............52 Table 18 Energy Conservation Measures as of 2004, Sorted by Estimated
Construction Cost..........................................................................................................53
Table 19 Energy Conservation Measures and Implementation Cost Breakdown by State Agency as of 2004, Sorted by Total Agency Building Square Footage ..............54
Table 20 Energy Conservation Measures and Implementation Cost Breakdown by
State Agency as of 2004, Sorted by Estimated Energy Savings per Year....................55 Table 21 Energy Conservation Measures and Implementation Cost Breakdown by
State Agency as of 2004, Sorted by Estimated Energy Cost Savings ..........................56
Table 22 Energy Conservation Measures and Implementation Cost Breakdown by State Agency as of 2004, Sorted by Estimated Construction Cost ...............................57
Table 23 Energy Conservation Measures and Implementation Cost Breakdown by
State Agency as of 2004, Sorted by Simple Payback Period........................................58
Table 24 List of State Agencies That are Candidates for Performance Contracting ...................59
xvii
LIST OF FIGURES
Figure ES-1 State of Hawaii Facilities on Oahu Building Square Feet Area by State
Agency ..........................................................................................................................vi Figure ES-2 State of Hawaii Facilities on Oahu Building Electricity Consumption by
State Agency .................................................................................................................vi Figure ES-3 State Facilities on Oahu Electricity Consumption Percentage by Utility .....................vii Figure ES-4 State Facilities on Oahu Electricity Consumption Percentage by Building
Occupancy.....................................................................................................................vii Figure ES-5 State Facilities on Oahu Electricity Consumption Trend in the past three
years ..............................................................................................................................viii Figure ES-6 State Facilities on Oahu Electricity Cost Trend in the past three years........................viii Figure 1 State Facilities on Oahu Electricity Consumption Trend in the past three
years ..............................................................................................................................24 Figure 2 State Facilities on Oahu Electricity Cost Trend in the past three years........................25 Figure 3 State of Hawaii Facilities on Oahu Building Square Feet Area by State
Agency ..........................................................................................................................29 Figure 4 State of Hawaii Facilities on Oahu Building Electricity Consumption by
State Agency .................................................................................................................29 Figure 5 State Facilities on Oahu Electricity Consumption Percentage by Building
Occupancy.....................................................................................................................31 Figure 6 UH Manoa Electricity Consumption Percentage by Utility .........................................32 Figure 7 State Facilities on Oahu Electricity Consumption Percentage by Utility .....................33 Figure 8 UH Manoa Electricity Consumption Percentage by Utility .........................................34
1
1.0 INTRODUCTION/PURPOSE
The purpose of this benchmarking study is to evaluate the electrical energy usage
of the State of Hawaii Facilities on the Island of Oahu and to identify possible
Energy Conservation Measures (ECMs), along with their estimated savings and
estimated construction costs that could be implemented to reduce electrical costs.
The specific scope of work for this project includes the following:
A. Data Collection Phase:
1. Obtain and review previous reports, energy audits, and spreadsheets prepared
under the State of Hawaii Energy Analysis Project, Phase I and II. Identify
which buildings were audited/ surveyed, and summarize the results of the
analysis for each audited/surveyed building; including total energy
consumption, square footage, end-use energy, and energy savings, costs and
payback for each Energy Conservation Measure (ECM) identified.
2. Verify and/or obtain electrical consumption data from Hawaiian Electric
Company, Inc. (HECO) on all HECO installed and other meters for the State
facility buildings on Oahu. Determine the total State facility energy usage
and load profiles for major accounts, and for each building that has been
metered.
3. Prepare a letter to solicit support and assistance from the various State
agencies to collect information on the various facilities on the Island of Oahu.
4. Meet with representatives from each agency to collect the following
information to support the benchmarking analysis:
2
(a) An inventory listing of each agency’s buildings, along with a description
of their operating schedule, occupancy, use, and floor area;
(b) A survey and copy of any reports for previously conducted energy
studies, audits, or pre-final contracting proposals previously (within the
last three years) conducted for their facilities;
(c) A listing of any other recent (within the last three years) upgrades or
recommendations to their facilities; and
(d) A list of any known proposed (within the next three years) upgrades.
B Analysis Phase:
1. Develop a spreadsheet for all buildings that were previously audited/surveyed
and metered that summarizes the energy consumption, square footage, electric
EUI operating costs, and the energy savings, costs, and payback for each
previously developed ECM. The deliverables may be found in Section 3.0
Benchmarking Data, Appendix 1.0 UH Manoa Campus Energy Benchmarking
Study Executive Summary, and Appendix 3.0 Summary of Existing Energy
Audit/Survey Results Presented in “Task 1-a-1 Report”.
2. Extrapolate the data for previously metered and audited/surveyed buildings to
the remaining State facilities on Oahu using engineering judgment and the
information collected during Task A Data Collection (by the State or their
State facility inventory). Only the State agencies that have cooperated and
provided the requested information will be included in the analysis. Develop
a separate spreadsheet for these buildings, including projected information on
the energy consumption, square footage, EUI, and energy savings, cost and
single payback for possible ECMs. The deliverables may be found in Section
4.0 Benchmarking Energy Analysis, Appendix 8.0 Baseline Benchmark
3
Analysis Electricity Use and Appendix 9.0 Baseline Benchmark Analysis by
End Use Electricity.
3. Develop spreadsheets, which organize the buildings by agency, EUIs, age,
square footage, operating costs, energy savings potential, ECM costs and
payback. Summarize the current energy consumption levels of each building,
and identify and prioritize the buildings that have the largest potential for
energy savings. The deliverables may be found in Section 5.0 Benchmarking
Energy Conservation Measures and Appendix 10.0 Energy Conservation
Measure Benchmark Analysis.
4. Develop a spreadsheet which lists potential candidates for energy performance
contracting. The deliverables may be found in Section 6.0 Recommendations
and Conclusions.
C Report/Presentation Phase:
1. Three (3) copies of a Pre-final technical report that summarizes the results of
the study, including an executive summary, introduction, body, spreadsheets,
EUI results, implementation plan, summary, and appendices.
2. Prepare a power point presentation to present the findings and
recommendations of the Executive Summary document to the STATE and
provide an electronic copy of the same to the STATE.
3. Five (5) copies of final report on reproducible bond as well as an electronic
copy in MS word and/or Excel as appropriate.
4
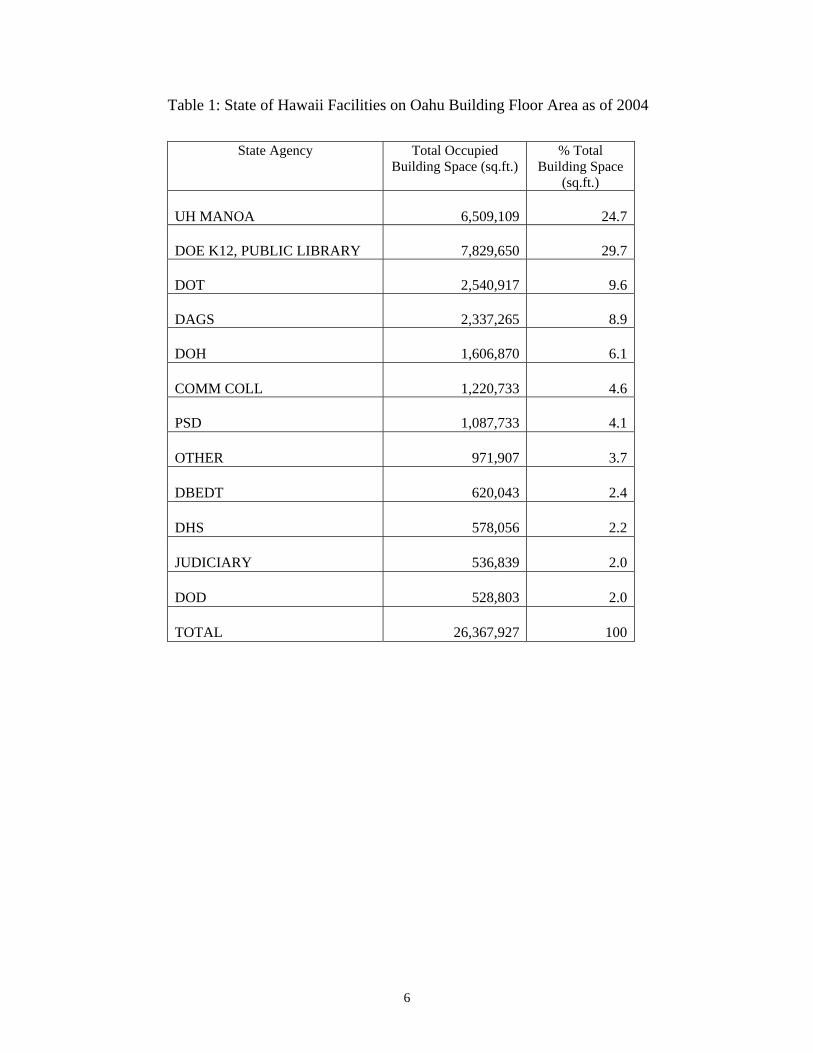
2.0 BACKGROUND
The total building occupied space for all State of Hawaii facilities on the island of
Oahu, excluding external spaces such as sidewalks, courtyards, lanais etc. is
estimated at 26,370,362 square feet. The total building square footage by State
Agency is listed in Table 1. The main State agencies with large building floor
areas are the Department of Accounting and General Service (DAGS), the
Department of Business, Economic Development and Tourism (DBEDT), the
Department of Education (DOE), the Department of Judiciary (JUDUCUARY),
the Department of Defense (DOD), the Department of Health (DOH), the
Department of Transportation (DOT), the Department of Human Service (DHS),
Housing and Community Development Corporation of Hawaii (HCDCH) under
the DHS, and the Department of Public Safety (PSD). The other departments
with relatively less occupied space include the Department of Attorney General,
the Department of Labor and Industrial Relations, the Department of Land and
Natural Resources, the Department of Hawaiian Homelands, and the Department
of Agriculture. A majority of the buildings were constructed between 1940 and
1960. Detailed information on the year of construction for most buildings was not
available during this study period.
The main building type category for State of Hawaii facilities on Oahu is mixed
use educational office/classroom type buildings. These buildings are primarily
used by DOE. Following the educational office/classroom type facilities in size
are general office type buildings operated by DAGS, airport, highway and harbor
facilities operated by DOT. Hospitals, correction facilities and libraries, by DOH,
PSD and DOE respectively, make up the smallest percentage of State facilities.
Most of the State buildings are of concrete construction. Temporary buildings in
the university and community college campuses and in the schools are primarily
modular office and portable classroom buildings that are of wooden construction.
Building exterior wall insulation in the majority of the permanent buildings is in
5
good standing. There have not been any HECO rebates issued for any of the State
of Hawaii facilities on Oahu for window tinting. An earlier benchmarking study
conducted for the UH at Manoa Campus, a state facility with over six million
square feet occupied building area, has also indicated that the windows for most
of the buildings on campus were not retrofitted with reflective solar films.
The rebate records provided by HECO for the time period between 1997 and 2004
indicate that lighting retrofits for conversion from T-12 fluorescent lighting with
magnetic ballasts to energy saving T-8 fluorescent lighting with electronic ballasts
were implemented in some of the facilities. According to HECO’s records, partial
lighting retrofits were implemented primarily in DOE buildings, with a few
installations also accomplished for DAGS, DOT, UH Campus and UH
Community Colleges buildings.
The majority of large State office type buildings, airport, hospitals, public
libraries, and the Judiciary buildings have central air conditioning. The DOE’s
K-12 classroom buildings generally do not have air conditioning. Many small
portable classroom buildings and some of the DOE K-12 school offices are
equipped with window air-conditioning or small DX split air-conditioning
systems. Rebate records provided by HECO show rebates for central air
conditioning and DX split air-conditioning systems, mainly for DAGS, DBEDT,
DOE and UH buildings. HECO does not provide rebates for window air
conditioning units.
6
Table 1: State of Hawaii Facilities on Oahu Building Floor Area as of 2004
State Agency Total Occupied Building Space (sq.ft.)
% Total Building Space
(sq.ft.) UH MANOA
6,509,109
24.7
DOE K12, PUBLIC LIBRARY
7,829,650
29.7
DOT
2,540,917
9.6
DAGS
2,337,265
8.9
DOH
1,606,870
6.1
COMM COLL
1,220,733
4.6
PSD
1,087,733
4.1
OTHER
971,907
3.7
DBEDT
620,043
2.4
DHS
578,056
2.2
JUDICIARY
536,839
2.0
DOD
528,803
2.0
TOTAL
26,367,927
100
7
3.0 BENCHMARKING DATA
Benchmarking data for State of Hawaii Facilities on Oahu used to develop this
study were based on the following sources:
1- An energy benchmarking study conducted for the University of Hawaii at
Manoa Campus in 2004. The UH Manoa Campus contributes approximately
25% of State electricity consumption on Oahu.
2- Electrical billing history for 2003 and 2004 for the 76 largest State buildings
on Oahu, provided by HECO. Rebate history for all State facilities on Oahu
from 1997 through 2004 provided by HECO.
3- Energy survey results from the following reports: a) an energy survey
walkthrough for four DAGS facilities; b) a detailed energy audit report on
DBEDT Foreign Trade Zone Office and Warehouse Building; c) a lighting
energy audit report on three Judiciary buildings on Oahu; and d) an Energy
Conservation Measure (ECM) evaluation for 12 Department of Defense
Hawaii Army National Guard (DOD HIARNG) Buildings.
4- A draft two-phase report entitled “Hawaii State Facility Energy Upgrade
Analysis and Performance Contracting Potential Phase I and Phase II
Reports”, prepared by Washington State Department of General
Administration, Division of Engineering and Architectural Services, and
submitted to DBEDT, Strategic Industries Division.
5- State facilities on Oahu, building square footage data provided by DAGS
based on a 2001 survey. This data was marked incomplete, but did cover
most of the DAGS, DOH, DOD, DOT, Judiciary, Agriculture, Public
Libraries, and DNLR facilities here on Oahu.
6- Energy survey forms, developed as part of this benchmarking project, to
collect general information on the building structure, operation, occupancy,
and specific information on lighting and air conditioning equipment and
conditions. However, only partial completed survey forms from the DAGS
8
and DOT were received during this benchmarking analysis and report
development.
3.1 UH Manoa Energy Benchmarking Study
The electrical consumption of the UH Manoa campus comprises approximately
25% of the total electricity consumption by the State of Hawaii Facilities on
Oahu. Likewise, approximately 24% of the occupied building square footage
belongs to the UH Manoa campus. Therefore, the recently prepared UH Manoa
Energy Benchmarking Study provides valuable data that was utilized to assist in
the benchmarking analysis for this study. The UH Manoa energy benchmarking
study is summarized as follows:
For the UH Manoa benchmarking study, a database was developed based on the
campus electricity utility history, organized by the campus building occupancy
type and building age. The developed database was evaluated against the
building classification in order to identify the benchmarking trends. In the study,
an Energy Utilization Index (EUI) was used to determine the relative energy
usage of a given facility. EUI is defined as the ratio of a building’s total energy
usage for a year over the building’s total square footage area:
EUI = kWh per year / sq.ft.
According to this study, the buildings on campus consumed an average of 22.8
kWh per year per square foot of occupied space in 2003, (EUI-22.8
kWh/sq.ft./year). However, large variations existed between the Energy
Utilization Index (EUI) of buildings when evaluated by occupancy type (EUI
ranges between 5.1 and 64.3 kWh/sq.ft.-year) and by building age (EUI ranges
between 15.3 and 37.0 kWh/sq.ft.-year). Additionally, a detailed benchmarking
analysis was conducted to identify the Energy Conservation Measures (ECMs)
that were applicable to the majority of the campus buildings. Reports from earlier
9
energy audits for a total of 44 buildings, representing approximately 40% of the
campus buildings square footage area, were evaluated. Campus walkthrough
surveys were conducted for the buildings that had no prior energy audits. ECMs
documented in the audit reports, integrated with additional engineering
assumptions, were generalized for the entire campus when applicable. The ECMs
were categorized by their energy savings potentials and payback periods. Three
ECMs were identified that were applicable to the majority of the buildings
through the campus. These ECMs are: 1) interior and exterior lighting
replacements with efficient lighting, 2) replacement of existing exit signs with
efficient LED exit signs, and 3), reflective solar window tinting. When
extrapolated for the entire campus, it was determined that implementing these
ECMs would reduce the UH Manoa Campus’ electrical consumption by
approximately 4.3 %. Eleven other ECMs were identified that were common to a
sizable number of the buildings in the campus. When the savings for these ECMs
were extrapolated for the entire campus, it was estimated that implementing these
additional ECMs would reduce the campus electricity by another 11 percent, with
payback periods ranging from 3 to 13 years. Several other ECMs were found to
be applicable only to specific buildings in the campus. Therefore, they were not
included in the generalized benchmarking analysis. Based on the benchmarking
analysis, it was determined that the campus would be able to save up to
approximately 20% in its current electrical use if all of the evaluated ECMs were
applied throughout the campus. However, further detailed design and engineering
analysis was recommended for a more precise estimate. The executive summary
of the UH Manoa Benchmarking Study is included in Appendix 1.0.
The ECM analysis developed for the current State benchmarking report was
mainly based on the extrapolation of the ECM’s considered in the UH Manoa
benchmarking study. Additional information used in the State Facilities ECM
estimates were obtained from the HECO provided rebate history from 1997
throughout 2004, which is discussed in the next section.
10
3.2 Electrical Billing History for Large State Facilities on Oahu and Rebate
History from 1997 through 2004
The electrical billing history for all large State Facilities that consume at least
1,000,000 kWh per year consists of a total of 76 meters. Based on the
information provided by Hawaiian Electric (HECO), these 76 meters consumed
approximately 396,611,900 kWh per year and accounted for 71 % of the State
Facilities electricity usage on Oahu in 2004. The remaining 29 % of the
electricity consumption was utilized by the medium size and small size facilities.
The total electrical consumption of all State facilities on Oahu was 557,654,688
kWh in 2004, which amounted to a total electrical energy cost of $ 71,372,318.
In most cases, a single electrical meter measures electricity consumption from one
single building or a group of buildings. For example the entire UH Manoa
Campus electricity is measured by several meters with one meter accounting for
more than 90 % of the campus electricity usage. On the other hand, in some
cases, although a facility may be small, it may have several electricity meters.
The HECO electrical billing history for large State facilities on Oahu with
1,000,000 kWh per year or higher consumption for calendar year 2003 and 2004
are listed in Appendix 2.0.
Additionally, HECO has also provided rebate histories from 1997 through 2004
for all State Facilities on Oahu. A copy of the rebate histories sorted by State
Departments and by rebate type is shown in Appendix 2.1. It is worthwhile to
mention here how HECO rebates are issued and documented: HECO awards
rebates under two main categories: prescriptive rebates and customized rebates.
The prescriptive rebates in Appendix 2.1 include lighting rebates, motor rebates
and space cooling rebates. Lighting rebates are usually for the replacement of T-
12 fluorescent lights with magnetic ballasts with less energy consuming T-8
fluorescent lights with electronic ballasts. Motor rebates include any existing
11
standard motor replacement with premium efficiency motors. The premium
motor efficiency requirements by motor size is specified by HECO. Space
cooling rebates include replacement of DX type split air conditioning equipment,
and packaged rooftop air conditioners with high efficiency units. Additional
chiller plant improvements are not included in the space cooling category.
Instead they are evaluated under the customized rebate category. The customized
rebate is calculated by energy savings due to any type of equipment replacement
in a building that is not covered by a prescriptive rebate. In some cases, a
prescriptive rebate element may be included as a customized rebate if more than
one equipment replacement has taken place at a time and the majority of the
rebates are considered as customized. However, most of the time, as reflected in
this study, the customized rebate format is used for chiller variable frequency
drive (VFD) retrofits, conversion to DDC controls, or any other air-conditioning
related equipment retrofits that do not qualify under the prescriptive rebate
program.
As can be followed from the above summary, except lighting, most of the
equipment retrofits in a building are related to the building’s air conditioning
system. Therefore, in the ECM benchmarking analysis presented in Section 5, all
HECO rebates in Appendix 2.1 except lighting were categorized under air
conditioning retrofits. This caused a slight error in the ECM evaluation, since it
was possible that sometimes a customized rebate would include lighting retrofits
as well. However, since it was not possible to quantify the content of a
customized rebate, and it was less likely that energy savings in a customized
rebate was dominated by savings from lighting retrofits, it was concluded that the
slight error was tolerable.
3.3 Existing Energy Audit/Survey Results
A walkthrough energy survey was previously conducted on four DAGS buildings,
namely Kinau Hale, Queen Liliuokalani, Kekuanaoa, and Keelikolani & Auhau,
12
as part of the “State Facility Energy Upgrade Analysis and Performance
Contracting Potential Phase II Report.” A detailed energy audit report was also
previously developed for one DBEDT building, Foreign Trade Zone. A lighting
energy audit report was previously prepared on five SOH Judiciary buildings
Statewide, three being on Oahu. An Energy Conservation Measure (ECM)
summary for 16 Department of Defense Hawaii Army National Guard (DOD
HIARNG) Buildings Statewide, 12 being on Oahu, was also available for use in
this benchmarking study.
As part of this study, a “Task 1-a-1” report was developed that summarized the
“Existing Energy Audit/Survey Results.” The information in the task report
included data on the surveyed buildings’ total square footage, yearly electricity
consumption, typical building usage, operation schedule, building-renovation
equipment retrofit history, and potential Energy Conservation Measures (ECM).
Surveyed building indoor air quality related findings and future scheduled
improvements (if any) were also included in the report. Additionally, reviews
from earlier conducted Energy Performance Contract evaluations were included
in the report to provide insight into potential benchmarking ECMs. Appendix 3.0
provides a copy of the “Task 1-a-1” report.
3.4 Hawaii State Facility Energy Upgrade Analysis and Performance
Contracting Potential Phase I and Phase II Reports
This study which was completed in April 2004, covered all State facilities in
Hawaii. The energy data was based on the Fiscal Year 2002 electricity billing
history obtained from the utility companies in Hawaii; including Hawaiian
Electric Company (HECO) on Oahu, Maui Electric Company (MECO) on Maui,
Hawaii Electric and Lighting Company (HELCO) on Big Island and Kauai Island
Utility Company (KIUC) on Kauai. Appendix 4.0 lists a summary of the State of
Hawaii electrical consumption by State Agencies and percentage electricity
consumed.
13
In the study approximately 2,625 buildings were identified as being owned and
operated by the State of Hawaii. Out of the 2,625 buildings, 108 were classified
as large size buildings that consumed 1,000,000 kWh or more electricity in a year.
These buildings accounted for over 75 % of the electricity used by all of the State
facilities. 152 buildings were classified as medium size buildings that consumed
less than 1,000,000 kWh per year electricity but paid more than $50,000 per year
for the electricity used. These medium size State facilities accounted for
approximately 10 % of the electricity used by the State. The remaining buildings
with yearly electricity bills less than or equal to $50,000 were classified as small
size buildings. These 2325 buildings accounted for 15% of the State electricity
consumption in 2004.
The electrical billings history for 2002 covering all large and medium size
buildings on Oahu and the rebate history covering the time period from 1997
through 2003 were extracted from the referenced report and are presented in
Appendix 4.1.
The building classification by large, medium and small size buildings based on
their electricity consumption in the referenced study was also used in the current
study. However, the main difference was that the current study was developed for
the State facilities on Oahu only. Also, some of the buildings that consumed
about 1,000,000 kWh per year in 2002 have consumed less in 2004 records.
Therefore they were removed from the original large State facilities for Oahu list.
Section 4 “Benchmarking Energy Analysis” provides more detailed information
on the grouping of the State facilities on Oahu, and the methodology for the data
processing for the benchmarking study.
14
3.5. State Facilities on Oahu Building Area Square Footage Data
The data for building area was provided by DBEDT from their historical records.
They were originally collected by DAGS in 2001. This data was marked
incomplete, but covers most of the DAGS, DOH, DOD, DOT, Judiciary,
Agriculture, Public Libraries, and DNLR facilities. For the mentioned State
departments, unless any response to the “Energy Survey Form” inquiry was
obtained, the DAGS 2001 building square footage data was used in the
benchmarking analysis. The “Energy Survey Form” inquiry is described in
Section 3.6. The DAGS 2001 State facility square footage area is listed in
Appendix 5.0.
3.6. Energy Survey Forms
An “Energy Survey Form” was developed as part of this benchmarking study to
collect specific information on the Large State Facilities on Oahu that would
particularly aid in developing the ECM Benchmarking analysis. The type of
information sought in this “Energy Survey Form” included building occupied
square footage area, attached parking area square footage (if applicable), building
operation hours, occupancy rate, number of personal computers, information on
building lighting, information on building air conditioning, building envelope,
renovations history and future energy retrofit plans. A copy of the “Energy
Survey Form” is presented in Appendix 6.0.
The developed survey form was distributed to the State departments in Oahu that
occupied or operated any of the identified Large State Facilities. These State
Departments that were asked to participate in the survey included DAGS,
DBEDT, DOE K12, UH Manoa, Community Colleges, DOD, DOH, DOT, PSD,
and JUDICIARY. During the development of this report and benchmarking
analysis, we have received responses only from DAGS on several of their large
facilities.
15
3.7. UH Manoa ECM Benchmarking Spreadsheet Analysis
An ECM benchmarking analysis was conducted for the UH Manoa Campus in
2004. The ECM benchmarking spreadsheets were developed based on detailed
energy audit reports for one third of the total building space area on the campus
for various energy conservation opportunities. The detailed analysis of the
feasible ECMs that were evaluated in approximately 44 of the buildings were
extrapolated campus-wide. Other less frequently occurring ECMs were simply
added up to represent the entire campus. The electricity cost savings and
construction cost indexes for each ECM were used as the base criteria in
developing the projections for the ECM benchmarking for all of the State
facilities.
16
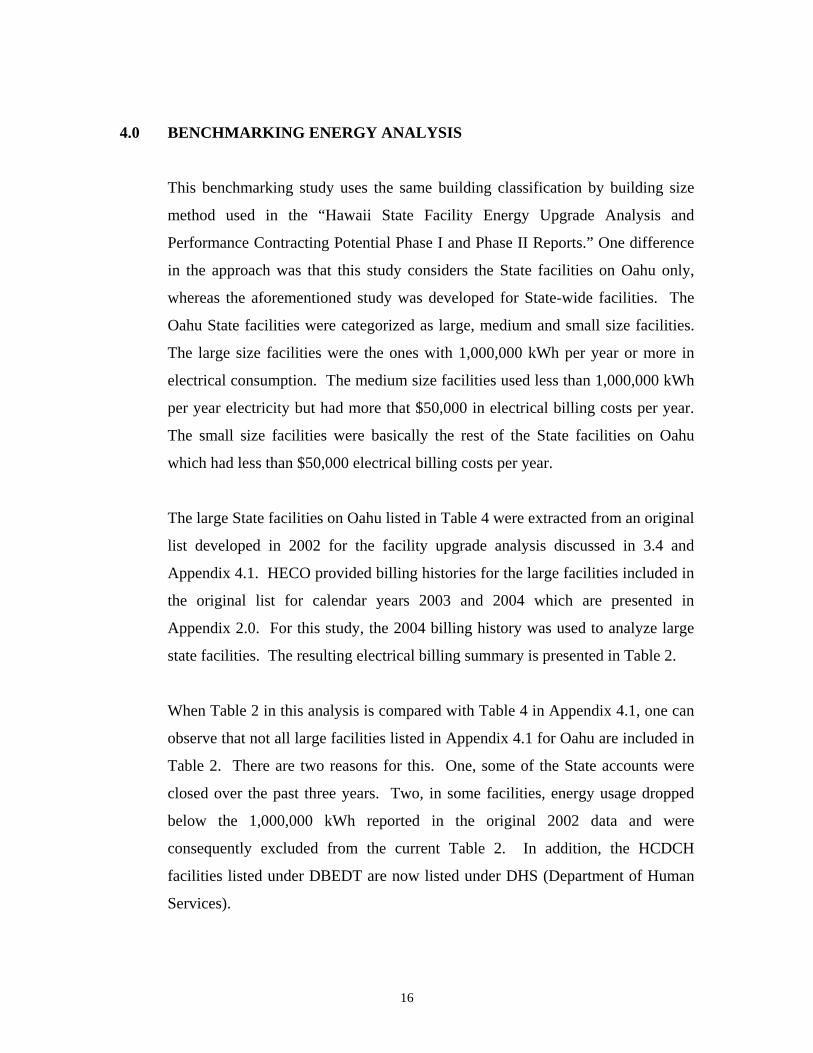
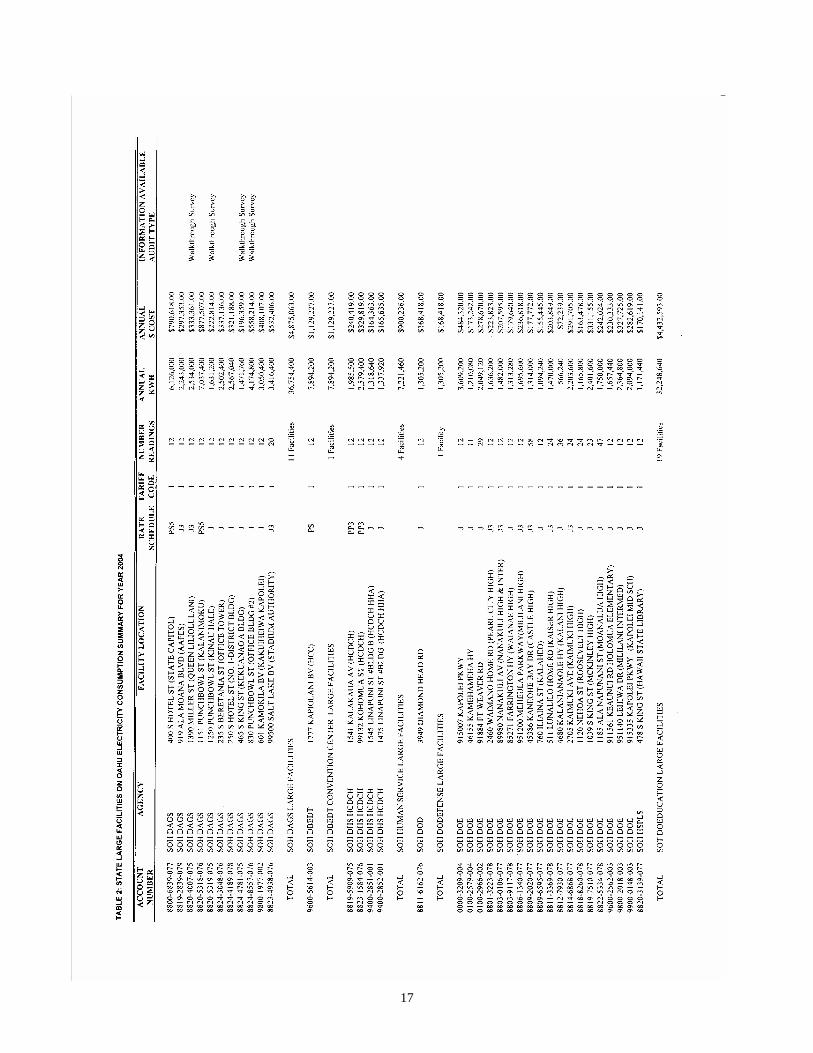
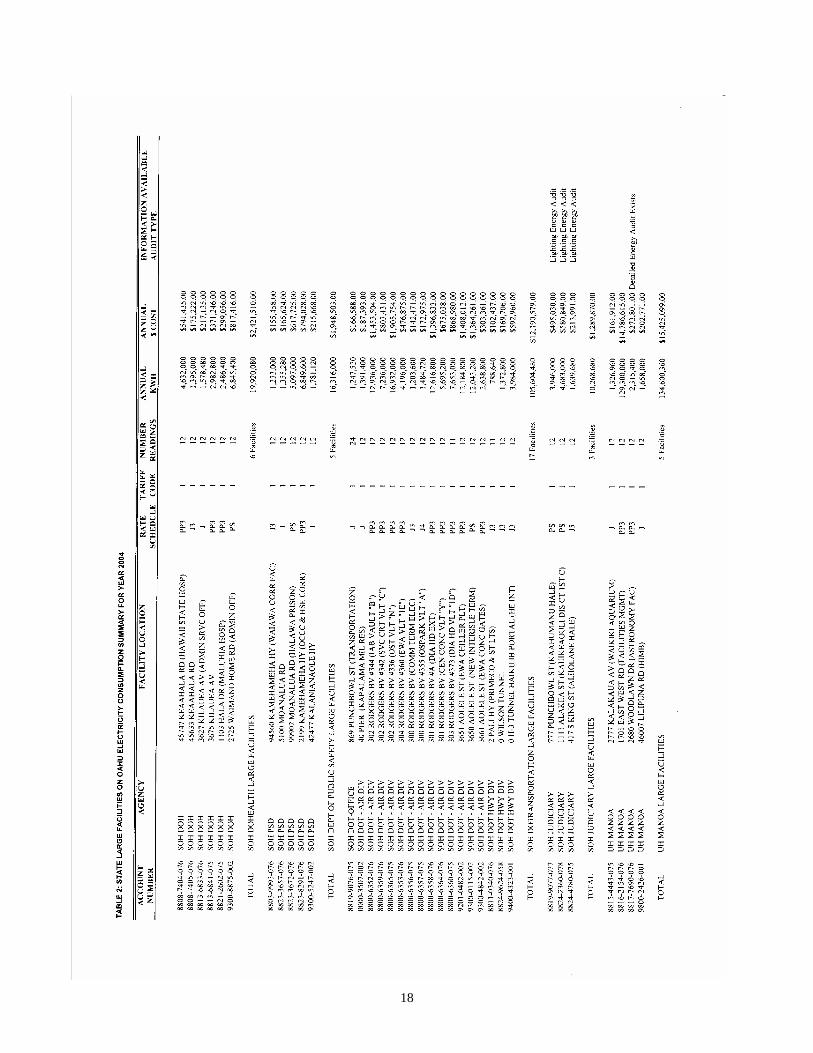
4.0 BENCHMARKING ENERGY ANALYSIS
This benchmarking study uses the same building classification by building size
method used in the “Hawaii State Facility Energy Upgrade Analysis and
Performance Contracting Potential Phase I and Phase II Reports.” One difference
in the approach was that this study considers the State facilities on Oahu only,
whereas the aforementioned study was developed for State-wide facilities. The
Oahu State facilities were categorized as large, medium and small size facilities.
The large size facilities were the ones with 1,000,000 kWh per year or more in
electrical consumption. The medium size facilities used less than 1,000,000 kWh
per year electricity but had more that $50,000 in electrical billing costs per year.
The small size facilities were basically the rest of the State facilities on Oahu
which had less than $50,000 electrical billing costs per year.
The large State facilities on Oahu listed in Table 4 were extracted from an original
list developed in 2002 for the facility upgrade analysis discussed in 3.4 and
Appendix 4.1. HECO provided billing histories for the large facilities included in
the original list for calendar years 2003 and 2004 which are presented in
Appendix 2.0. For this study, the 2004 billing history was used to analyze large
state facilities. The resulting electrical billing summary is presented in Table 2.
When Table 2 in this analysis is compared with Table 4 in Appendix 4.1, one can
observe that not all large facilities listed in Appendix 4.1 for Oahu are included in
Table 2. There are two reasons for this. One, some of the State accounts were
closed over the past three years. Two, in some facilities, energy usage dropped
below the 1,000,000 kWh reported in the original 2002 data and were
consequently excluded from the current Table 2. In addition, the HCDCH
facilities listed under DBEDT are now listed under DHS (Department of Human
Services).
17
18
19
20
The benchmarking data used in this study did not include the electrical
consumption history for medium and small size buildings. Instead, the medium
size State facilities electrical consumption for year 2004 was estimated in
proportion to the medium size facility electrical consumption table in Appendix
4.1 and State of Hawaii electrical consumption by State Agencies and percentage
electricity consumed listed in Appendix 4.0. The small size facilities energy use
was prorated and adjusted to maintain a consistent tally between the large facility
and total facility electrical energy use for each year. Table 3 is a summary of the
electrical use history for large, medium and small size facilities on Oahu in 2002
by State Agency, composed from the data in Appendix 4.0 and Appendix 4.1. By
using the electricity percentages listed in Table 2 and engineering assumptions to
account for the changes in electrical usage from 2002 to 2004, Table 4 was
developed. The large facilities electrical use summary in the Table 4 is a
summary of Table 2 for each State agency. The electrical use summary for the
medium and small facilities in the estimates is developed by the procedure
described above.
Additional useful information derived from the comparison of Table 4 with the
2004 trend and the Table 3 with the 2002 trend is the total electrical use
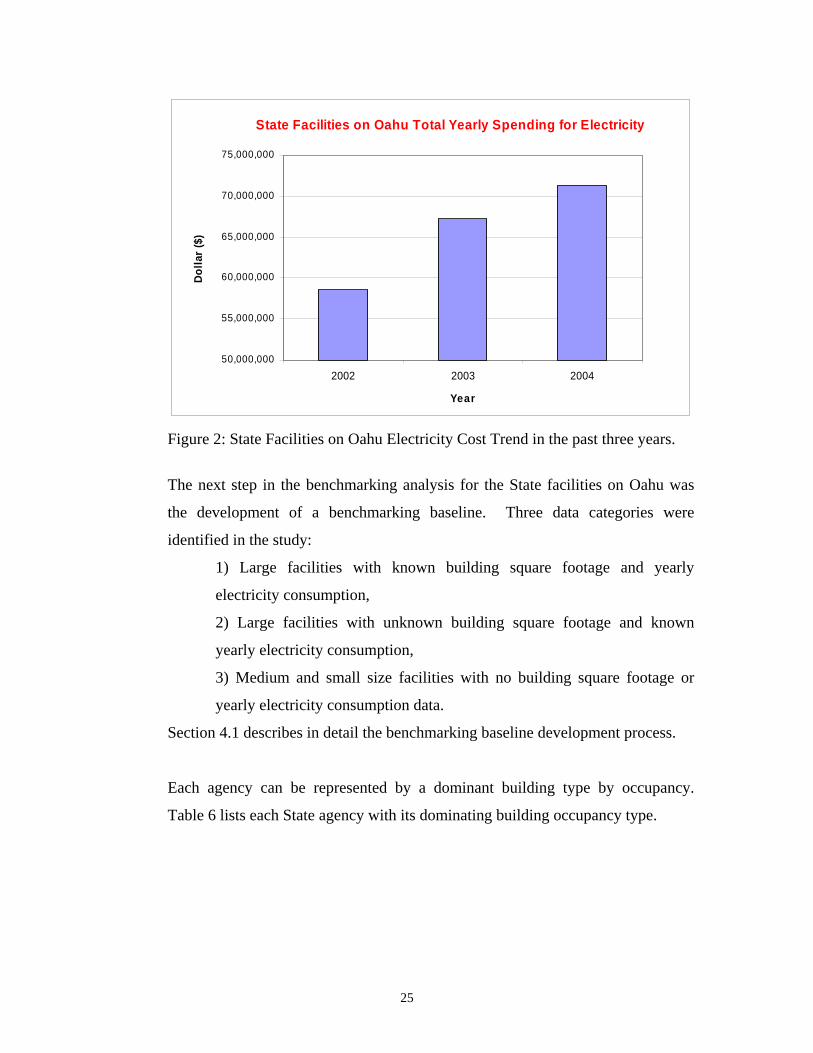
comparison and electricity cost variation from 2002 to 2004. In 2002, the State
facilities used 531,823,960 kWh of electricity and paid $58,540,841 in electrical
costs, which corresponded to roughly 11.0 cents per kWh. In 2003, the State
facilities used 556,768,580 kWh of electricity and paid $67,245,821 in electrical
costs, which corresponds to roughly 12.1 cents per kWh. In 2004, the State
facilities used 557,654,688 kWh of electricity and paid $71,372,318 in electricity,
which corresponds to roughly 12.8 cents per kWh. This increase in the electrical
energy cost was due primarily to the escalation in the fuel charge adjustment due
to the rising cost for oil. The fuel charge adjustment from 2002 to 2004 has
increased electrical energy cost per kWh by approximately 16%. Table 5
summarizes the electrical consumption trend and associated electrical costs for
2002, 2003 and 2004. Additionally Figure 1 and Figure 2 represent the electrical
21
energy use and cost trends graphically. Both the table and the graphics
demonstrate that if the fuel charge adjustment continues to increase, dramatic
energy savings will need to be achieved in order to keep the electrical costs under
control.
22
23
24
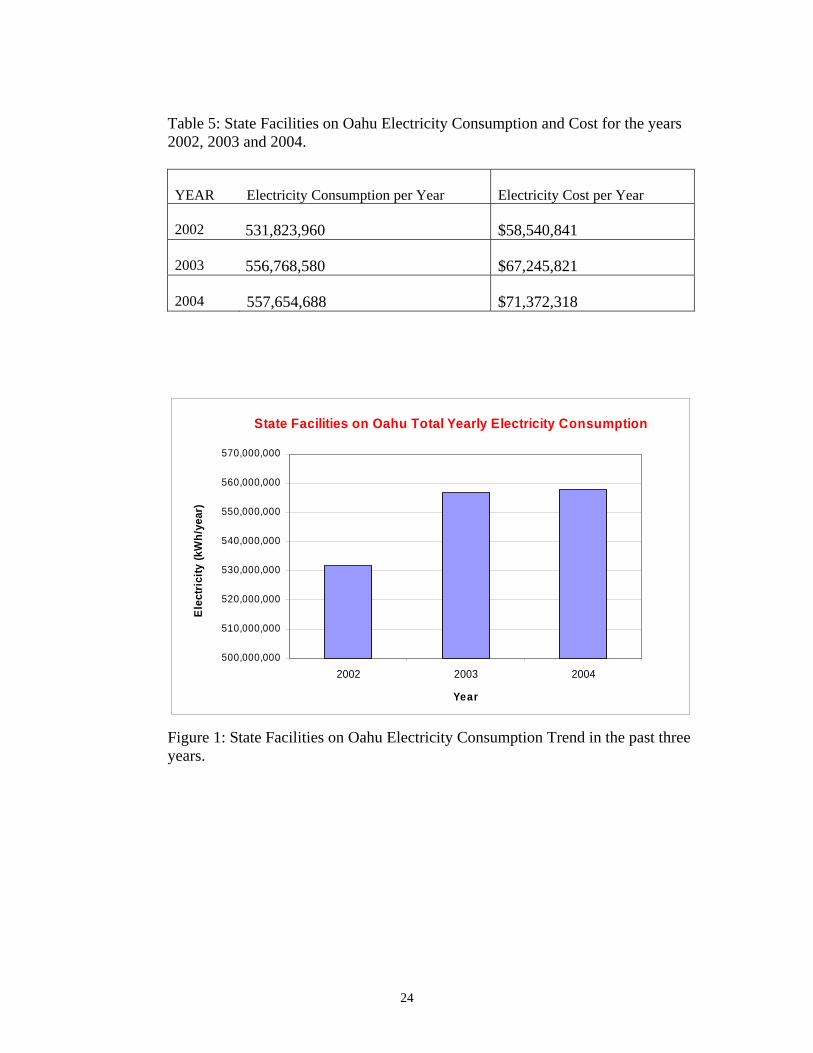
Table 5: State Facilities on Oahu Electricity Consumption and Cost for the years 2002, 2003 and 2004.
YEAR
Electricity Consumption per Year
Electricity Cost per Year
2002
531,823,960
$58,540,841
2003
556,768,580
$67,245,821
2004
557,654,688
$71,372,318
State Facilities on Oahu Total Yearly Electricity Consumption
500,000,000
510,000,000
520,000,000
530,000,000
540,000,000
550,000,000
560,000,000
570,000,000
2002 2003 2004
Year
Ele
ctri
city
(kW
h/ye
ar)
Figure 1: State Facilities on Oahu Electricity Consumption Trend in the past three years.
25
State Facilities on Oahu Total Yearly Spending for Electricity
50,000,000
55,000,000
60,000,000
65,000,000
70,000,000
75,000,000
2002 2003 2004
Year
Dolla
r ($
)
Figure 2: State Facilities on Oahu Electricity Cost Trend in the past three years.
The next step in the benchmarking analysis for the State facilities on Oahu was
the development of a benchmarking baseline. Three data categories were
identified in the study:
1) Large facilities with known building square footage and yearly
electricity consumption,
2) Large facilities with unknown building square footage and known
yearly electricity consumption,
3) Medium and small size facilities with no building square footage or
yearly electricity consumption data.
Section 4.1 describes in detail the benchmarking baseline development process.
Each agency can be represented by a dominant building type by occupancy.
Table 6 lists each State agency with its dominating building occupancy type.
26
Table 6: State Agencies with Dominating Building Occupancy Type
Description Building Occupancy Type
DAGS
Department of Accounting and General Service
Office
JUDICIARY
Department of Judiciary
Office
DBEDT
Department of Business Economic Development and Tourism
Convention Center DHS
Department of Human Service
Office
DOD
Department of Defense
Office
OTHER
Other Departments
Office
DOE K-12
Department of Education
Office/Classroom
UH MANOA
Department of Education University of Hawaii at Manoa
Office/Classroom
COMM COLL
Department of Education Community Colleges
Office/Classroom
DOH
Department of Health
Hospital
PSD
Department of Public Safety
Correction Facility
DOT
Department of Transportation
Airport, Highway
The benchmarking energy analysis was then developed in two stages: a baseline
spreadsheet analysis and an estimated electrical use distribution by type of
building equipment (air conditioning, lighting and miscellaneous equipment).
The methodology followed in both analyses is described in the following sections.
4.1 Baseline Spreadsheet Analysis
A baseline spreadsheet analysis was developed based on the available
benchmarking data (mainly for large facilities) and may be found in Appendix
8.0. The spreadsheet information included the basic building data including,
Building Name, Building Type, Operating Schedule, Year Built, Area (sq.ft.),
Energy Use, Energy Savings projects in the Past Eight Years. Under Energy Use,
kWh/year, kWh/sq.ft/year, $year, and $sq.ft./year are listed. Under Energy
Savings Projects in the Past Eight Years, Lighting, Water Heating, Motor
Replacement, Space Cooling Retrofits, Custom Rebate are listed. The rebate
27
information was especially useful to predict the age of the existing building
lighting and air conditioning equipment and to account for already implemented
energy conservation measures. This information is also used in the ECM
Benchmarking analysis in Section 5.
The baseline spreadsheet was grouped by each State agency, under three
categories of benchmarking data. The first category data were for large buildings
with known yearly electricity use and known building occupied area in square
feet. The second category data was for large buildings with known yearly
electricity use and unknown building occupied area in square feet. The square
feet area was estimated by the ratio between the yearly electricity consumption
and the average kWh per square feet per year calculated for the large buildings in
the first category. The third category data was for the medium and small size
facilities. The only available data for this category was the percentage of
electricity use estimated in Table 4 (the Table 4 was discusses in Section 4). By
using the average kWh per square feet year calculated for the large buildings in
the first category and the percentage electricity from Table 4, the facility square
feet area was also similarly calculated for the medium and small size buildings.
Appendix 8.0 documents this baseline spreadsheet analysis. The “Energy Savings
Projects in the Past Eight Years” columns are the rebate summary for each rebate
type applied to all facilities for an agency.
Few agencies, including DBEDT, DHS, DOE K-12, PSD, Community College,
had no facility square footage, or first category data, as described above. For
those agencies, the baseline spreadsheet was developed by using the average kWh
per square feet per year data from another agency that was closest in the type of
building use. The DBEDT and DHS kWh per square feet per year was considered
to be the same as JUDICIARY. The ratio of the HECO reported yearly electricity
consumption over the assumed kWh per square feet per year data produced the
DBEDT and DHS buildings square footage area estimates. Similarly, the
Community Colleges kWh per square feet per year was considered to be same as
28
that for UH Manoa. For DOE K-12, an assumed value of 15 kWh per square feet
per year was used, since this agency has less air conditioning consumption when
compared to fully air conditioned facilities. A similar analysis was carried for the
DOPublic Safety that used the 15 kWh per square feet per year criteria due to its
lower quantity of air conditioned space. The “OTHER” State facility category in
Appendix 8.0 used the overall average kWh per square feet per year criteria in
estimating the facility square footage area.
Building operational hours is another important factor in the benchmarking
analysis. However, the available building operational data consisted of only the
six large DAGS buildings, which was not sufficient for benchmarking. Therefore,
in the study no detailed analysis was made that would account for the effect of
building operational hours on a building’s energy consumption.
The building floor area and electrical energy use distribution by State agencies are
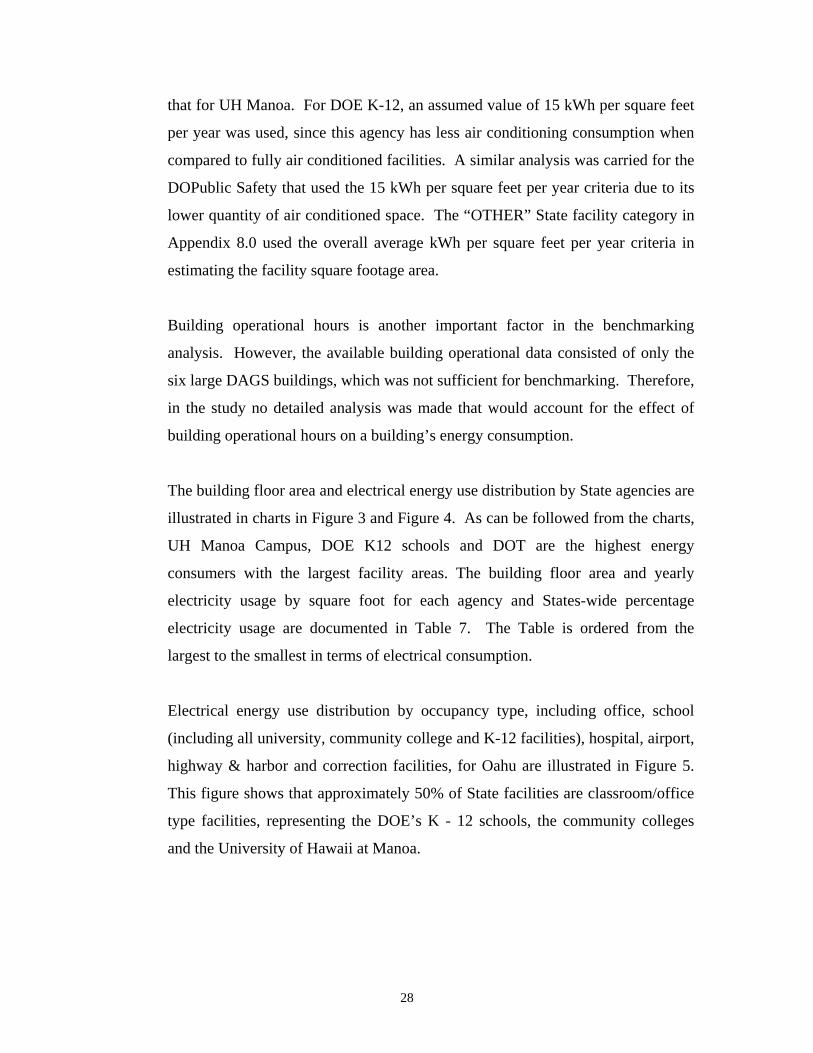
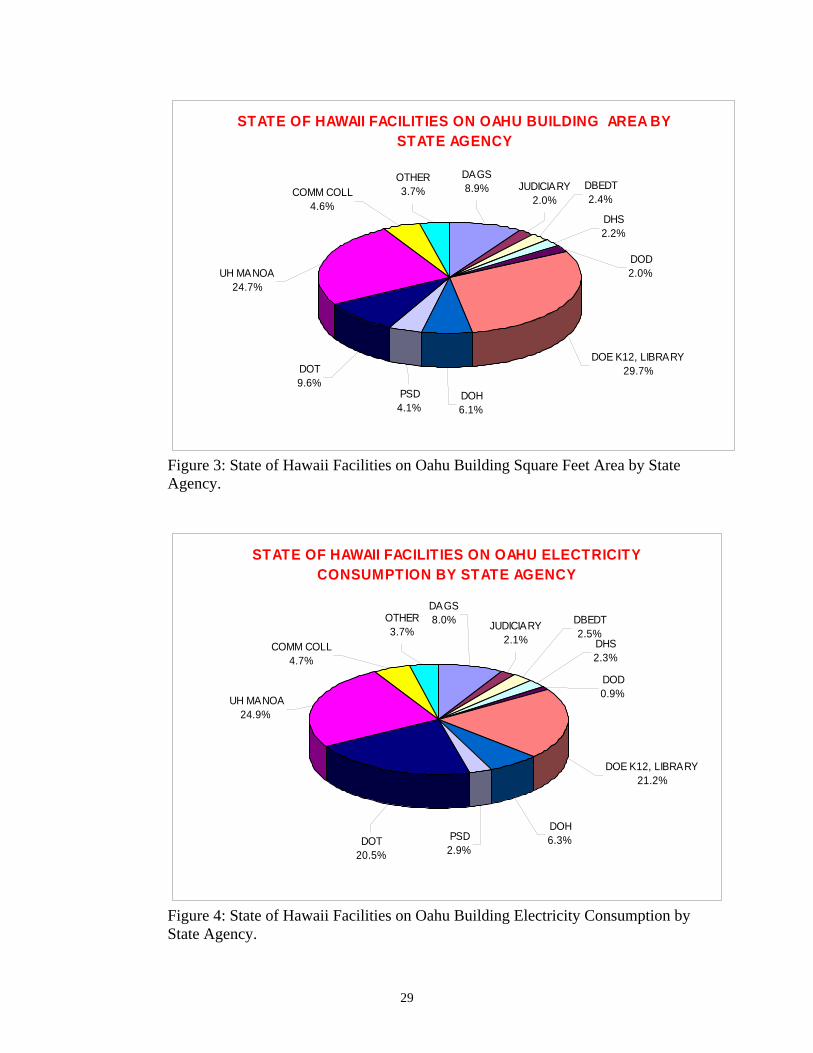
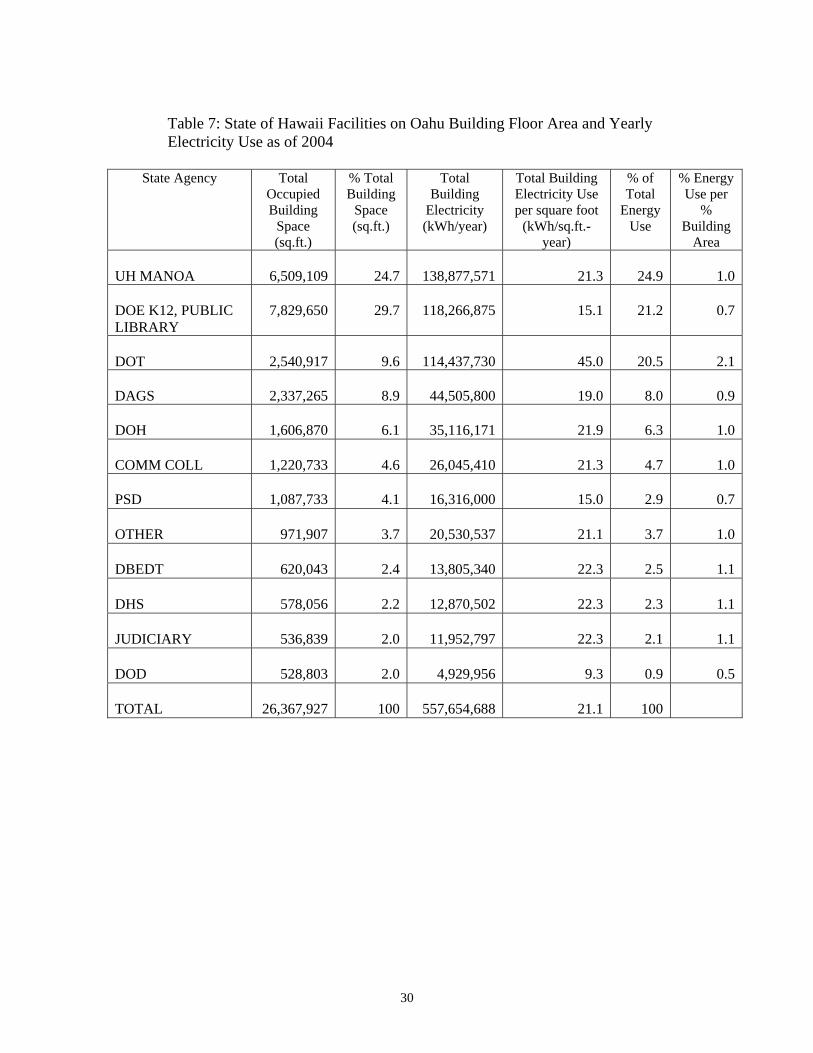
illustrated in charts in Figure 3 and Figure 4. As can be followed from the charts,
UH Manoa Campus, DOE K12 schools and DOT are the highest energy
consumers with the largest facility areas. The building floor area and yearly
electricity usage by square foot for each agency and States-wide percentage
electricity usage are documented in Table 7. The Table is ordered from the
largest to the smallest in terms of electrical consumption.
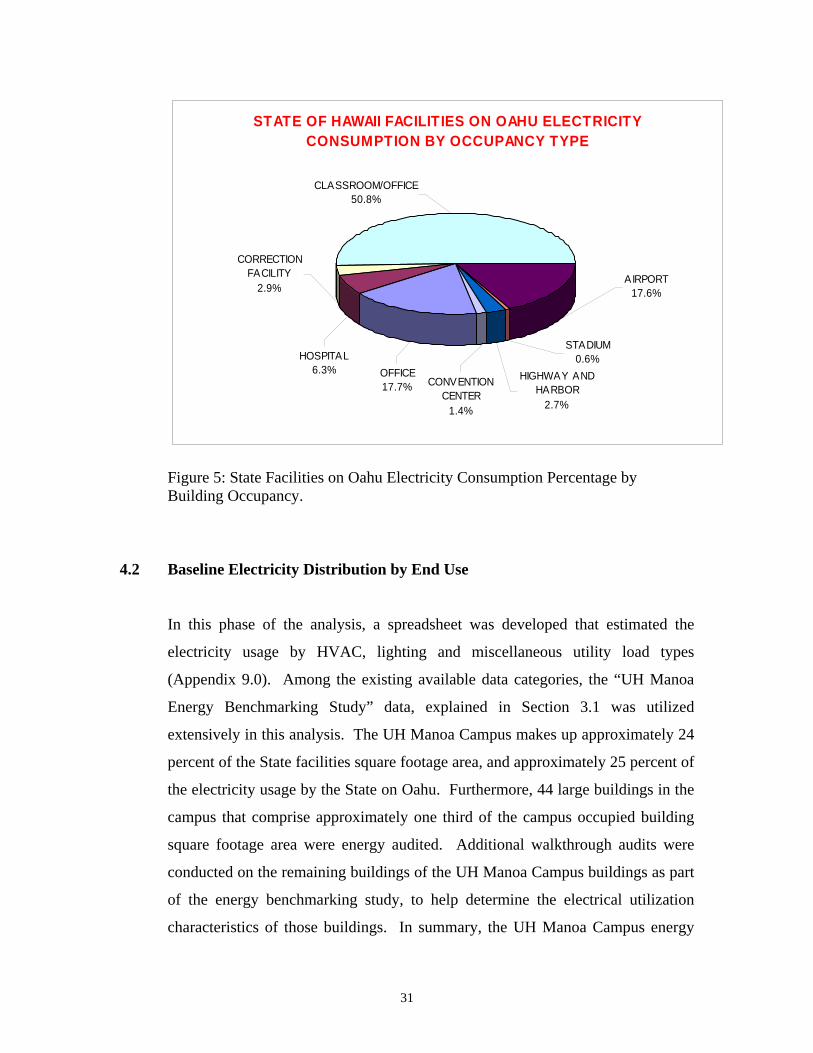
Electrical energy use distribution by occupancy type, including office, school
(including all university, community college and K-12 facilities), hospital, airport,
highway & harbor and correction facilities, for Oahu are illustrated in Figure 5.
This figure shows that approximately 50% of State facilities are classroom/office
type facilities, representing the DOE’s K - 12 schools, the community colleges
and the University of Hawaii at Manoa.
29
STATE OF HAWAII FACILITIES ON OAHU BUILDING AREA BY STATE AGENCY
OTHER3.7%
PSD4.1%
DOT9.6%
UH MANOA24.7%
COMM COLL4.6%
DOH6.1%
DOE K12, LIBRARY29.7%
DOD2.0%
DAGS8.9%
DHS2.2%
DBEDT2.4%
JUDICIARY2.0%
Figure 3: State of Hawaii Facilities on Oahu Building Square Feet Area by State Agency.
STATE OF HAWAII FACILITIES ON OAHU ELECTRICITY CONSUMPTION BY STATE AGENCY
OTHER3.7% JUDICIARY
2.1%
DBEDT2.5%
DHS2.3%
DAGS8.0%
DOD0.9%
DOE K12, LIBRARY21.2%
DOH6.3%
COMM COLL4.7%
UH MANOA24.9%
DOT20.5%
PSD2.9%
Figure 4: State of Hawaii Facilities on Oahu Building Electricity Consumption by State Agency.
30
Table 7: State of Hawaii Facilities on Oahu Building Floor Area and Yearly Electricity Use as of 2004
State Agency Total
Occupied Building
Space (sq.ft.)
% Total Building
Space (sq.ft.)
Total Building
Electricity (kWh/year)
Total Building Electricity Use per square foot
(kWh/sq.ft.-year)
% of Total
Energy Use
% Energy Use per
% Building
Area UH MANOA
6,509,109
24.7
138,877,571
21.3
24.9
1.0
DOE K12, PUBLIC LIBRARY
7,829,650
29.7
118,266,875
15.1
21.2
0.7
DOT
2,540,917
9.6
114,437,730
45.0
20.5
2.1
DAGS
2,337,265
8.9
44,505,800
19.0
8.0
0.9
DOH
1,606,870
6.1
35,116,171
21.9
6.3
1.0
COMM COLL
1,220,733
4.6
26,045,410
21.3
4.7
1.0
PSD
1,087,733
4.1
16,316,000
15.0
2.9
0.7
OTHER
971,907
3.7
20,530,537
21.1
3.7
1.0
DBEDT
620,043
2.4
13,805,340
22.3
2.5
1.1
DHS
578,056
2.2
12,870,502
22.3
2.3
1.1
JUDICIARY
536,839
2.0
11,952,797
22.3
2.1
1.1
DOD
528,803
2.0
4,929,956
9.3
0.9
0.5
TOTAL
26,367,927
100
557,654,688
21.1
100
31
STATE OF HAWAII FACILITIES ON OAHU ELECTRICITY CONSUMPTION BY OCCUPANCY TYPE
CONVENTION CENTER
1.4%
HIGHWAY AND HARBOR
2.7%
STADIUM0.6%
AIRPORT17.6%
OFFICE17.7%
CLASSROOM/OFFICE50.8%
CORRECTION FACILITY
2.9%
HOSPITAL6.3%
Figure 5: State Facilities on Oahu Electricity Consumption Percentage by Building Occupancy.
4.2 Baseline Electricity Distribution by End Use
In this phase of the analysis, a spreadsheet was developed that estimated the
electricity usage by HVAC, lighting and miscellaneous utility load types
(Appendix 9.0). Among the existing available data categories, the “UH Manoa
Energy Benchmarking Study” data, explained in Section 3.1 was utilized
extensively in this analysis. The UH Manoa Campus makes up approximately 24
percent of the State facilities square footage area, and approximately 25 percent of
the electricity usage by the State on Oahu. Furthermore, 44 large buildings in the
campus that comprise approximately one third of the campus occupied building
square footage area were energy audited. Additional walkthrough audits were
conducted on the remaining buildings of the UH Manoa Campus buildings as part
of the energy benchmarking study, to help determine the electrical utilization
characteristics of those buildings. In summary, the UH Manoa Campus energy
32
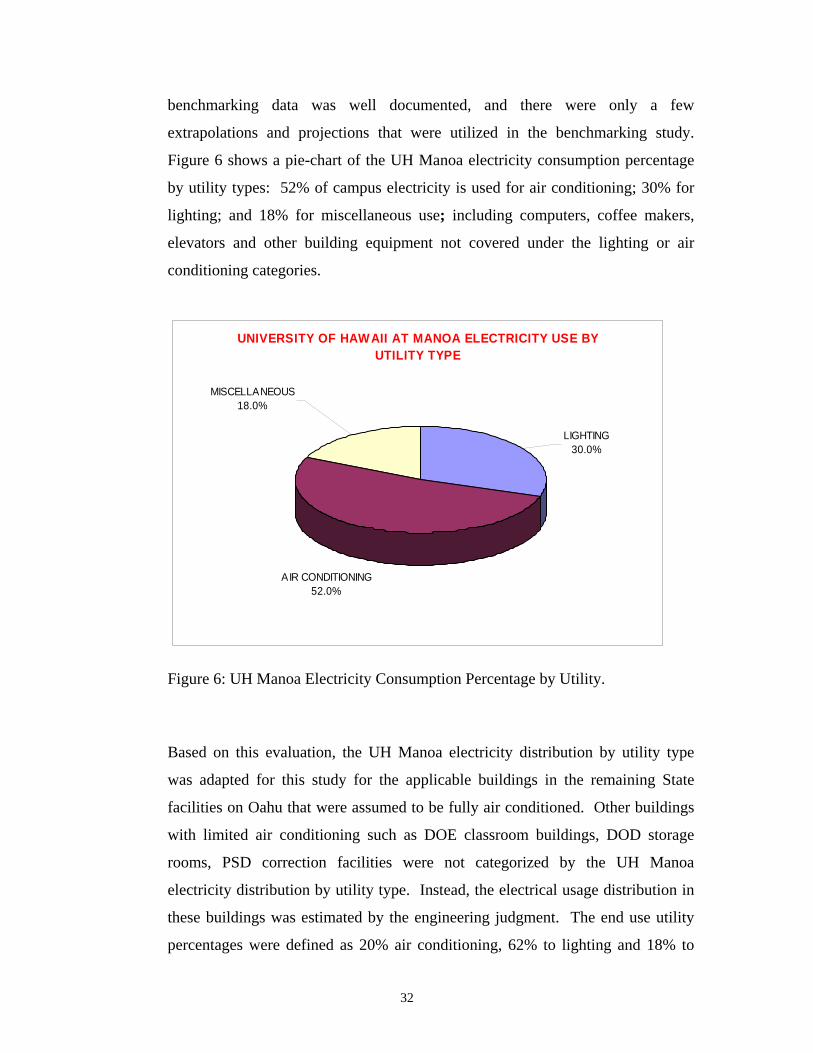
benchmarking data was well documented, and there were only a few
extrapolations and projections that were utilized in the benchmarking study.
Figure 6 shows a pie-chart of the UH Manoa electricity consumption percentage
by utility types: 52% of campus electricity is used for air conditioning; 30% for
lighting; and 18% for miscellaneous use; including computers, coffee makers,
elevators and other building equipment not covered under the lighting or air
conditioning categories.
UNIVERSITY OF HAWAII AT MANOA ELECTRICITY USE BY UTILITY TYPE
AIR CONDITIONING52.0%
MISCELLANEOUS18.0%
LIGHTING30.0%
Figure 6: UH Manoa Electricity Consumption Percentage by Utility.
Based on this evaluation, the UH Manoa electricity distribution by utility type
was adapted for this study for the applicable buildings in the remaining State
facilities on Oahu that were assumed to be fully air conditioned. Other buildings
with limited air conditioning such as DOE classroom buildings, DOD storage
rooms, PSD correction facilities were not categorized by the UH Manoa
electricity distribution by utility type. Instead, the electrical usage distribution in
these buildings was estimated by the engineering judgment. The end use utility
percentages were defined as 20% air conditioning, 62% to lighting and 18% to
33
miscellaneous use. Appendix 9.0 documents the baseline electricity distribution
by utility type for each State agency. .
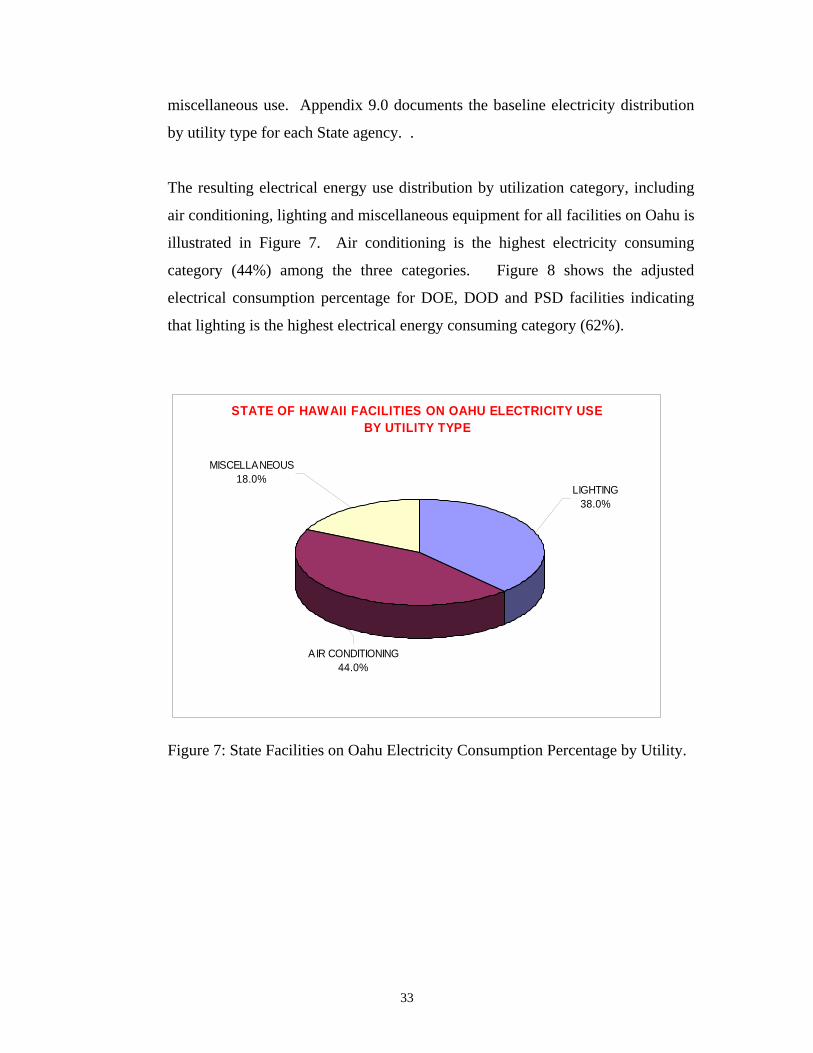
The resulting electrical energy use distribution by utilization category, including
air conditioning, lighting and miscellaneous equipment for all facilities on Oahu is
illustrated in Figure 7. Air conditioning is the highest electricity consuming
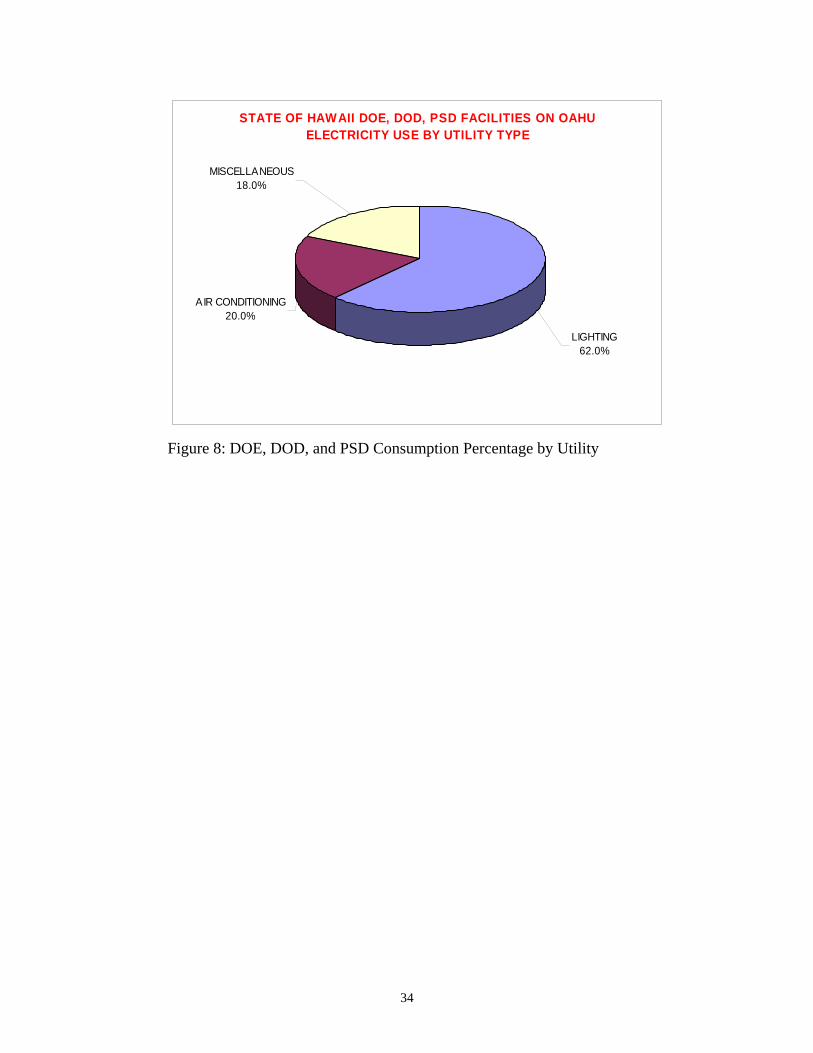
category (44%) among the three categories. Figure 8 shows the adjusted
electrical consumption percentage for DOE, DOD and PSD facilities indicating
that lighting is the highest electrical energy consuming category (62%).
STATE OF HAWAII FACILITIES ON OAHU ELECTRICITY USE BY UTILITY TYPE
AIR CONDITIONING44.0%
MISCELLANEOUS18.0%
LIGHTING38.0%
Figure 7: State Facilities on Oahu Electricity Consumption Percentage by Utility.
34
STATE OF HAWAII DOE, DOD, PSD FACILITIES ON OAHU ELECTRICITY USE BY UTILITY TYPE
LIGHTING62.0%
MISCELLANEOUS18.0%
AIR CONDITIONING20.0%
Figure 8: DOE, DOD, and PSD Consumption Percentage by Utility
35
5.0 BENCHMARKING ENERGY CONSERVATION MEASURES (ECM’s)
The ECM benchmarking analysis was developed for all State departments and
occupancy categories. The analysis utilized the baseline material in Section 4.0:
Benchmarking Energy Analysis. Three additional data sources were used in the
ECM benchmarking analysis: 1) Appendix 2.1: HECO Rebate History for All
State Facilities on Oahu from 1997 through 2004, 2) Appendix 3.0: Summary of
Existing Energy Audit/Survey Results Presented in “Task 1-a-1 Report”, and 3)
Appendix 7.0: UH Manoa Campus Energy Benchmarking Study ECM
Spreadsheet Analysis.
The process of developing the State facilities on Oahu ECM benchmark
spreadsheets and analysis is described as follows: First, the “Baseline Benchmark
Analysis by End Use Electricity” spreadsheet in Appendix 9.0 was utilized as the
initial spreadsheets. Second, the ECMs considered at the UH Manoa Energy
Benchmarking Study (Appendix 7.0) were evaluated for their applicability to the
State facilities. All of the identified ECMs in the UH Manoa study were found
applicable to the other State facilities in this study. However several ECM’s were
clustered under a category identified as “ECM: Other due to their applications
being too specific and/or their lower energy savings impact. A total of eleven
ECMs were identified as being applicable to all of the State facilities on Oahu.
Table 8 shows the comparison of the ECMs utilized in the State Facilities on
Oahu Benchmarking versus the UH Manoa Benchmarking.
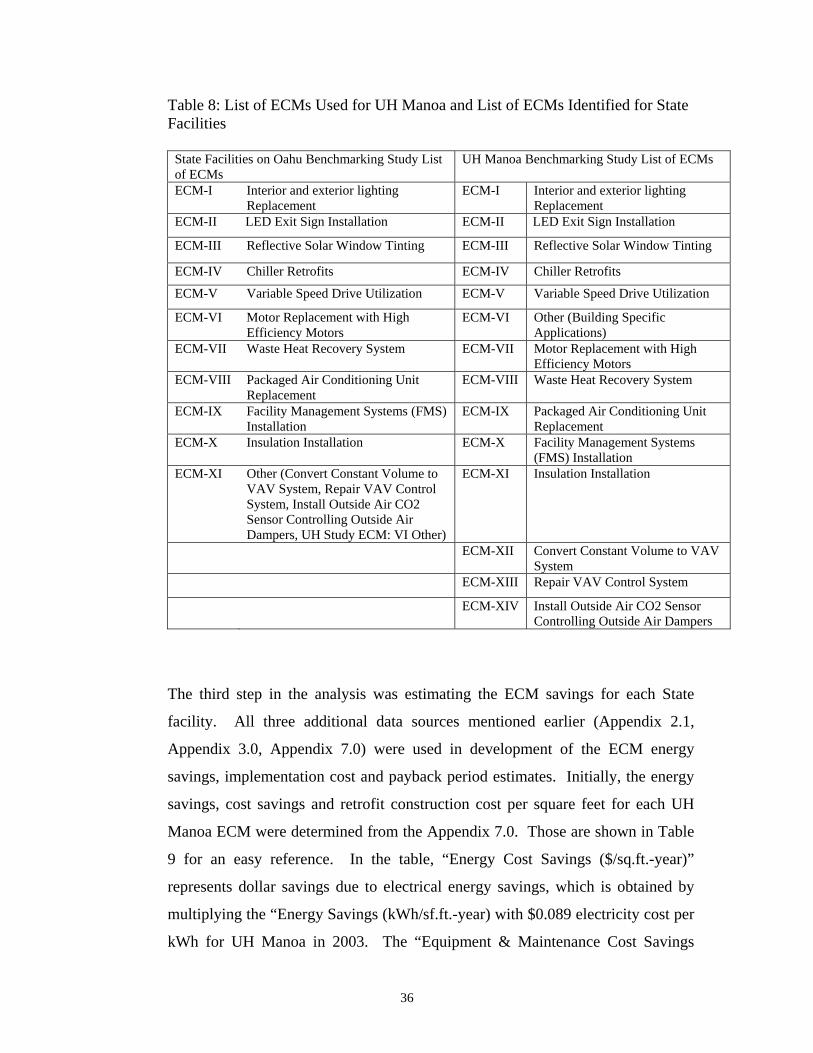
36
Table 8: List of ECMs Used for UH Manoa and List of ECMs Identified for State Facilities
State Facilities on Oahu Benchmarking Study List of ECMs
UH Manoa Benchmarking Study List of ECMs
ECM-I Interior and exterior lighting Replacement
ECM-I Interior and exterior lighting Replacement
ECM-II LED Exit Sign Installation ECM-II LED Exit Sign Installation
ECM-III Reflective Solar Window Tinting ECM-III Reflective Solar Window Tinting
ECM-IV Chiller Retrofits ECM-IV Chiller Retrofits
ECM-V Variable Speed Drive Utilization ECM-V Variable Speed Drive Utilization
ECM-VI Motor Replacement with High Efficiency Motors
ECM-VI Other (Building Specific Applications)
ECM-VII Waste Heat Recovery System ECM-VII Motor Replacement with High Efficiency Motors
ECM-VIII Packaged Air Conditioning Unit Replacement
ECM-VIII Waste Heat Recovery System
ECM-IX Facility Management Systems (FMS) Installation
ECM-IX Packaged Air Conditioning Unit Replacement
ECM-X Insulation Installation ECM-X Facility Management Systems (FMS) Installation
ECM-XI Other (Convert Constant Volume to VAV System, Repair VAV Control System, Install Outside Air CO2 Sensor Controlling Outside Air Dampers, UH Study ECM: VI Other)
ECM-XI Insulation Installation
ECM-XII Convert Constant Volume to VAV System
ECM-XIII Repair VAV Control System
ECM-XIV Install Outside Air CO2 Sensor Controlling Outside Air Dampers
The third step in the analysis was estimating the ECM savings for each State
facility. All three additional data sources mentioned earlier (Appendix 2.1,
Appendix 3.0, Appendix 7.0) were used in development of the ECM energy
savings, implementation cost and payback period estimates. Initially, the energy
savings, cost savings and retrofit construction cost per square feet for each UH
Manoa ECM were determined from the Appendix 7.0. Those are shown in Table
9 for an easy reference. In the table, “Energy Cost Savings ($/sq.ft.-year)”
represents dollar savings due to electrical energy savings, which is obtained by
multiplying the “Energy Savings (kWh/sf.ft.-year) with $0.089 electricity cost per
kWh for UH Manoa in 2003. The “Equipment & Maintenance Cost Savings
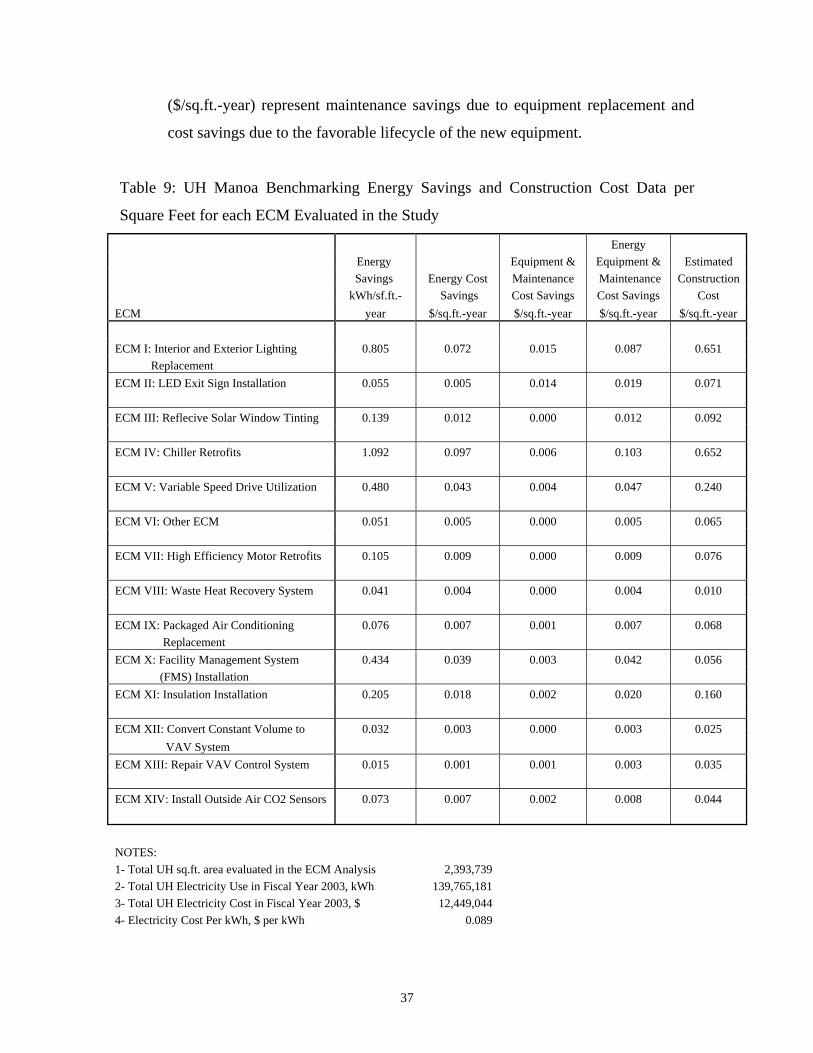
37
($/sq.ft.-year) represent maintenance savings due to equipment replacement and
cost savings due to the favorable lifecycle of the new equipment.
Table 9: UH Manoa Benchmarking Energy Savings and Construction Cost Data per
Square Feet for each ECM Evaluated in the Study
Energy Energy Equipment & Equipment & Estimated Savings Energy Cost Maintenance Maintenance Construction kWh/sf.ft.- Savings Cost Savings Cost Savings Cost ECM year $/sq.ft.-year $/sq.ft.-year $/sq.ft.-year $/sq.ft.-year ECM I: Interior and Exterior Lighting 0.805 0.072 0.015 0.087 0.651 Replacement ECM II: LED Exit Sign Installation 0.055 0.005 0.014 0.019 0.071 ECM III: Reflecive Solar Window Tinting 0.139 0.012 0.000 0.012 0.092 ECM IV: Chiller Retrofits 1.092 0.097 0.006 0.103 0.652 ECM V: Variable Speed Drive Utilization 0.480 0.043 0.004 0.047 0.240 ECM VI: Other ECM 0.051 0.005 0.000 0.005 0.065 ECM VII: High Efficiency Motor Retrofits 0.105 0.009 0.000 0.009 0.076 ECM VIII: Waste Heat Recovery System 0.041 0.004 0.000 0.004 0.010 ECM IX: Packaged Air Conditioning 0.076 0.007 0.001 0.007 0.068 Replacement ECM X: Facility Management System 0.434 0.039 0.003 0.042 0.056 (FMS) Installation ECM XI: Insulation Installation 0.205 0.018 0.002 0.020 0.160 ECM XII: Convert Constant Volume to 0.032 0.003 0.000 0.003 0.025 VAV System ECM XIII: Repair VAV Control System 0.015 0.001 0.001 0.003 0.035 ECM XIV: Install Outside Air CO2 Sensors 0.073 0.007 0.002 0.008 0.044 NOTES: 1- Total UH sq.ft. area evaluated in the ECM Analysis 2,393,739 2- Total UH Electricity Use in Fiscal Year 2003, kWh 139,765,181 3- Total UH Electricity Cost in Fiscal Year 2003, $ 12,449,044 4- Electricity Cost Per kWh, $ per kWh 0.089
38
Based on the ECM savings and cost per square feet summary in Table 9, an initial
ECM energy savings, cost savings and retrofit construction cost per square foot
table was developed for the State Facilities. This is shown in Table 10. The
process of developing the Table 10 is described as follows:
1- Energy Savings per kWh per sq.ft.-year is taken from Table 9.
2- Energy Cost Savings per sq.ft.-year is calculated by multiplying
(energy savings kWh per sq.ft.-year) with ($ 0.128 Electricity Cost
Per kWh for State Facilities in 2004).
3- Equipment & Maintenance Cost Savings ($/sq.ft.-year) is taken from
Table 9, and used for ECM I and ECM II, since they were relatively
high when compared to the other ECMs.
4- Equipment & Maintenance Cost Savings ($/sq.ft.-year) of other ECMs
were considered zero for simplicity since they were relatively small when
compared to energy cost savings ($/sq.ft.-year) in Table 9.
5- Energy Equipment & Maintenance Cost Savings ($/sq.ft.-year) is the
sum of energy cost savings and equipment & maintenance cost
savings.
6- Estimated Construction Cost ($/sq.ft.-year) is taken from the Table 9
and increased by 20% to reflect recent cost increases in the
construction industry.
7- Several ECMs which were originally evaluated under separate
categories in the UH Benchmarking Study were consolidated under a
single ECM (ECM IX:Other) in this study due to their less frequent
occurrence and lower savings when compared to the rest of the
ECMs.
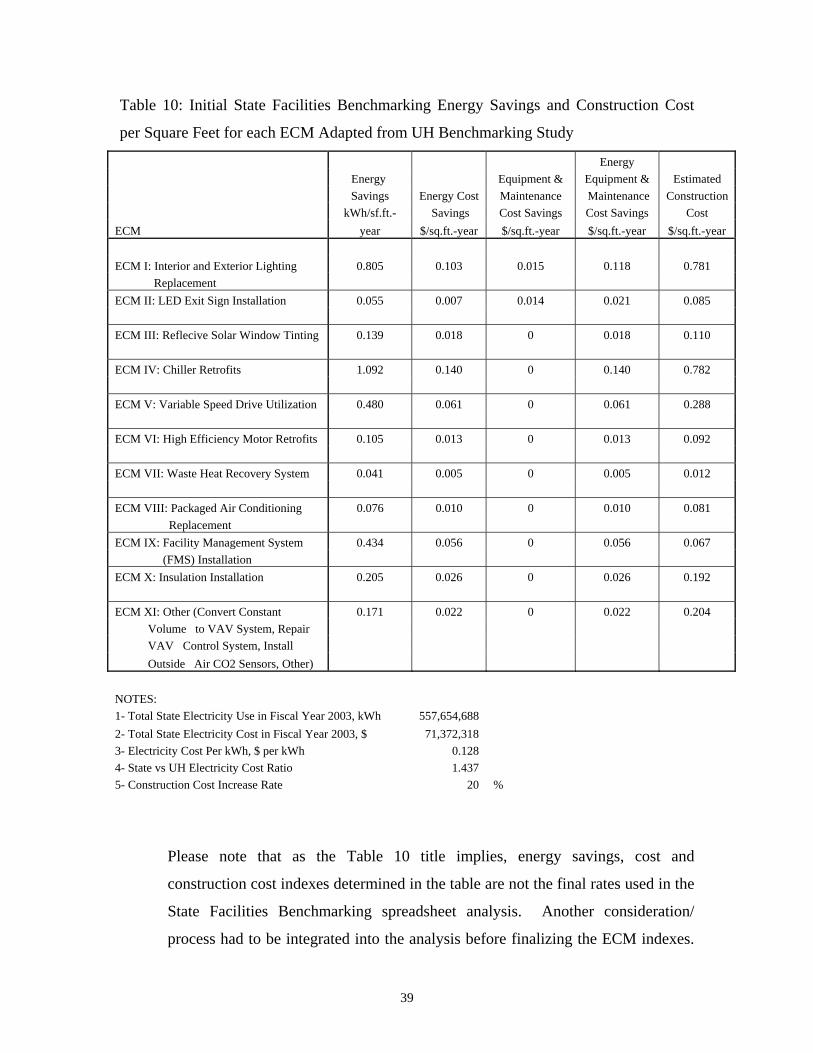
39
Table 10: Initial State Facilities Benchmarking Energy Savings and Construction Cost
per Square Feet for each ECM Adapted from UH Benchmarking Study
Energy Energy Equipment & Equipment & Estimated Savings Energy Cost Maintenance Maintenance Construction kWh/sf.ft.- Savings Cost Savings Cost Savings Cost ECM year $/sq.ft.-year $/sq.ft.-year $/sq.ft.-year $/sq.ft.-year ECM I: Interior and Exterior Lighting 0.805 0.103 0.015 0.118 0.781 Replacement ECM II: LED Exit Sign Installation 0.055 0.007 0.014 0.021 0.085 ECM III: Reflecive Solar Window Tinting 0.139 0.018 0 0.018 0.110 ECM IV: Chiller Retrofits 1.092 0.140 0 0.140 0.782 ECM V: Variable Speed Drive Utilization 0.480 0.061 0 0.061 0.288 ECM VI: High Efficiency Motor Retrofits 0.105 0.013 0 0.013 0.092 ECM VII: Waste Heat Recovery System 0.041 0.005 0 0.005 0.012 ECM VIII: Packaged Air Conditioning 0.076 0.010 0 0.010 0.081 Replacement ECM IX: Facility Management System 0.434 0.056 0 0.056 0.067 (FMS) Installation ECM X: Insulation Installation 0.205 0.026 0 0.026 0.192 ECM XI: Other (Convert Constant 0.171 0.022 0 0.022 0.204 Volume to VAV System, Repair VAV Control System, Install Outside Air CO2 Sensors, Other) NOTES: 1- Total State Electricity Use in Fiscal Year 2003, kWh 557,654,688 2- Total State Electricity Cost in Fiscal Year 2003, $ 71,372,318 3- Electricity Cost Per kWh, $ per kWh 0.128 4- State vs UH Electricity Cost Ratio 1.437 5- Construction Cost Increase Rate 20 %
Please note that as the Table 10 title implies, energy savings, cost and
construction cost indexes determined in the table are not the final rates used in the
State Facilities Benchmarking spreadsheet analysis. Another consideration/
process had to be integrated into the analysis before finalizing the ECM indexes.
40
This process had to do with integrating the HECO rebate history for all State
facilities on Oahu from 1997 through 2004 in Appendix 2.1 and the summary of
existing energy audit/survey results included in Appendix 3.0.
The energy audit/surveys summary in Appendix 3.0 included the four DAGS
buildings, one DBEDT buildings and all Judiciary buildings in Oahu that were
previously audited and some equipment was already retrofitted with one or more
energy conserving alternatives. The already completed ECM retrofits were listed
in the summary in Appendix 3.0. For those buildings listed in Appendix 3.0 with
a specific ECM already implemented, no further savings potentials were
considered for that particular ECM in the benchmarking spreadsheet analysis in
the current study. A similar approach was followed for the HECO rebate data in
Appendix 2.1. If HECO already awarded a building with a rebate due to an ECM
retrofit, no further savings potentials were considered for that particular ECM in
the benchmarking spreadsheet analysis in the current study. The “Energy
Savings” column in the ECM benchmarking spreadsheet was marked zero for
buildings that had already implemented the particular ECM.
Bu using the Appendix 8.0 Baseline Benchmarking Analysis Electricity Use,
integrated with Appendix 2.1 and Appendix 3.0, Table 11 was developed. The
table lists total State facilities on Oahu square footage considered for a particular
ECM (all State facilities square footage in this benchmarking study), the total
square footage State facility area with an already implemented ECM, and their
ratio.
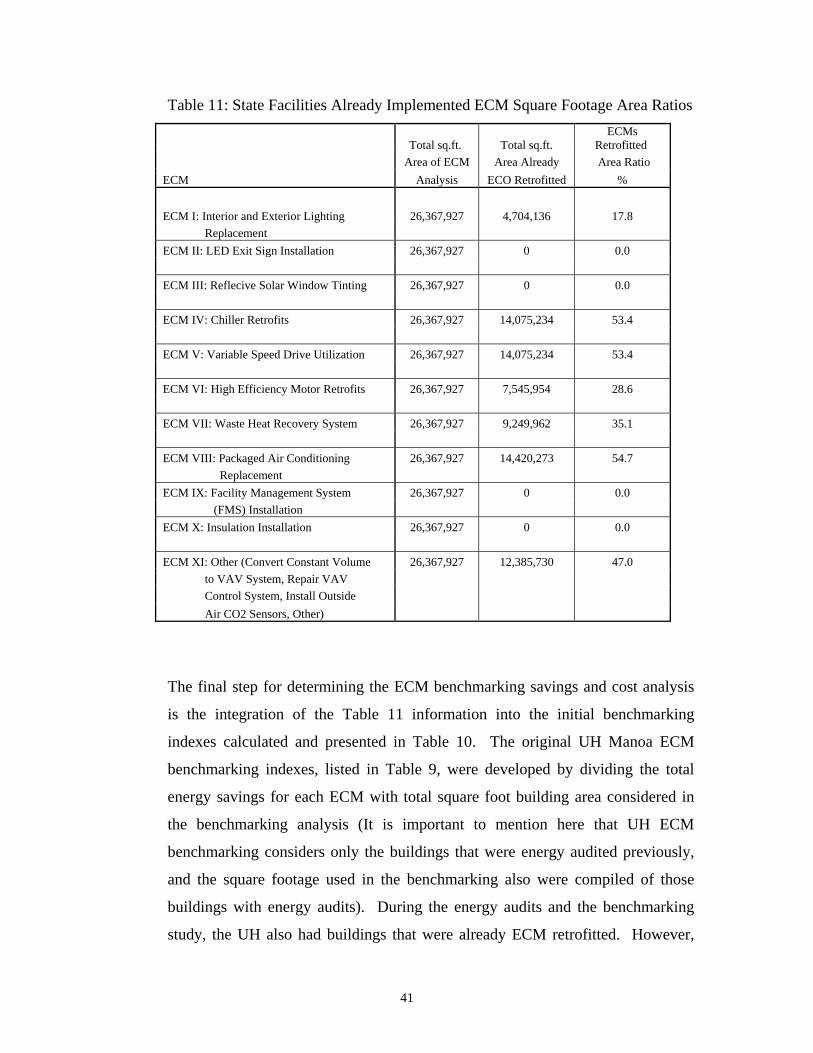
41
Table 11: State Facilities Already Implemented ECM Square Footage Area Ratios
Total sq.ft. Total sq.ft. ECMs
Retrofitted Area of ECM Area Already Area Ratio ECM Analysis ECO Retrofitted % ECM I: Interior and Exterior Lighting 26,367,927 4,704,136 17.8 Replacement ECM II: LED Exit Sign Installation 26,367,927 0 0.0 ECM III: Reflecive Solar Window Tinting 26,367,927 0 0.0 ECM IV: Chiller Retrofits 26,367,927 14,075,234 53.4 ECM V: Variable Speed Drive Utilization 26,367,927 14,075,234 53.4 ECM VI: High Efficiency Motor Retrofits 26,367,927 7,545,954 28.6 ECM VII: Waste Heat Recovery System 26,367,927 9,249,962 35.1 ECM VIII: Packaged Air Conditioning 26,367,927 14,420,273 54.7 Replacement ECM IX: Facility Management System 26,367,927 0 0.0 (FMS) Installation ECM X: Insulation Installation 26,367,927 0 0.0 ECM XI: Other (Convert Constant Volume 26,367,927 12,385,730 47.0 to VAV System, Repair VAV Control System, Install Outside Air CO2 Sensors, Other)
The final step for determining the ECM benchmarking savings and cost analysis
is the integration of the Table 11 information into the initial benchmarking
indexes calculated and presented in Table 10. The original UH Manoa ECM
benchmarking indexes, listed in Table 9, were developed by dividing the total
energy savings for each ECM with total square foot building area considered in
the benchmarking analysis (It is important to mention here that UH ECM
benchmarking considers only the buildings that were energy audited previously,
and the square footage used in the benchmarking also were compiled of those
buildings with energy audits). During the energy audits and the benchmarking
study, the UH also had buildings that were already ECM retrofitted. However,
42
the UH benchmarking did not separate those buildings that were already
retrofitted with a particular ECM, as in the case of the State of Hawaii
Benchmarking Study for Oahu facilities. Instead, the UH benchmarking study
added up already estimated ECM savings and associated construction costs for the
buildings that were energy audited, and extrapolated the results for all the
buildings considered in the benchmarking study. This difference in both
benchmarking studies necessitated a final adjustment in the Table 10 ECM
savings and cost indexes. The Energy Savings kWh/sq.ft.-year column and the
Estimated Construction Cost $/sq.ft.-year column in Table 10 had to be increased
by the percentage given in the Table 11 ECM Retrofitted Area Percentage
column. The effect of this final adjustment process, while not noticeable in the
total ECM savings and associated cost, was to develop as accurately as possible a
representation of already implemented ECMs (indicated with zeros in the energy
savings columns in the benchmarking spreadsheet) and potential ECMs for each
building and agency in the benchmarking study.
The final State facilities benchmarking energy savings and construction cost
indexes used in the current benchmarking study are listed in Table 12. The
benchmarking spreadsheet analysis developed by the final indexes in Table 12 is
documented in Appendix 10.0.
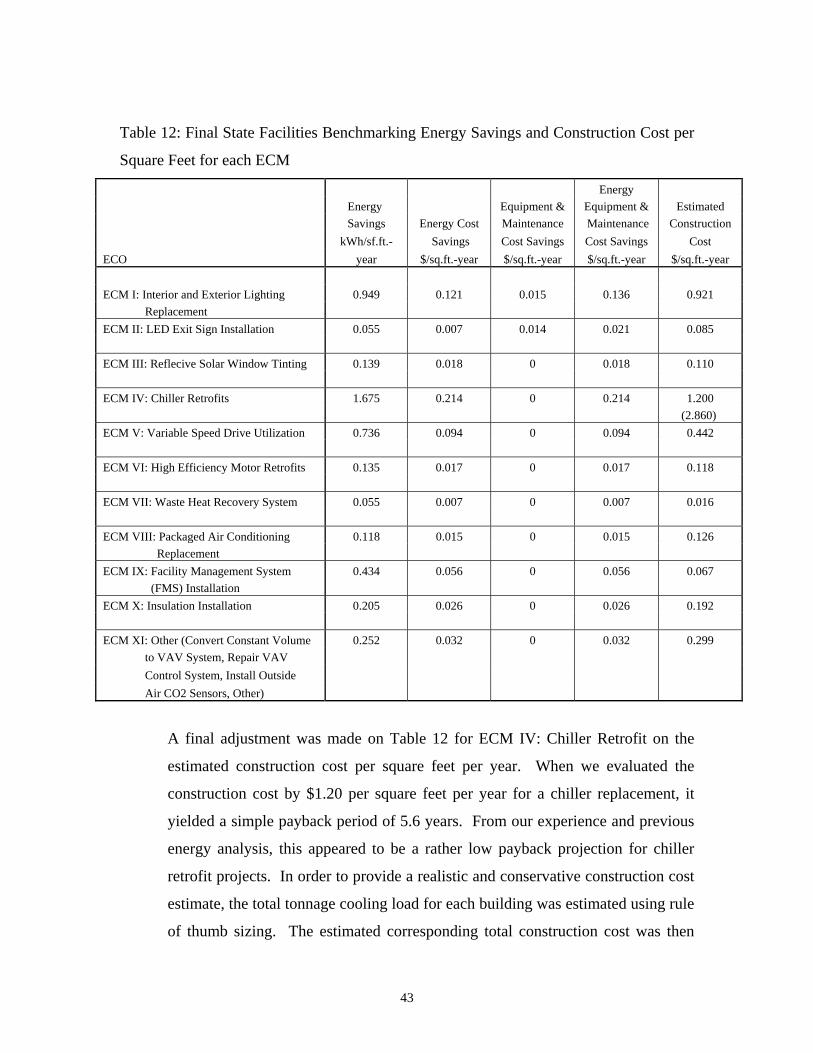
43
Table 12: Final State Facilities Benchmarking Energy Savings and Construction Cost per
Square Feet for each ECM
Energy Energy Equipment & Equipment & Estimated Savings Energy Cost Maintenance Maintenance Construction kWh/sf.ft.- Savings Cost Savings Cost Savings Cost ECO year $/sq.ft.-year $/sq.ft.-year $/sq.ft.-year $/sq.ft.-year ECM I: Interior and Exterior Lighting 0.949 0.121 0.015 0.136 0.921 Replacement ECM II: LED Exit Sign Installation 0.055 0.007 0.014 0.021 0.085 ECM III: Reflecive Solar Window Tinting 0.139 0.018 0 0.018 0.110 ECM IV: Chiller Retrofits 1.675 0.214 0 0.214 1.200 (2.860) ECM V: Variable Speed Drive Utilization 0.736 0.094 0 0.094 0.442 ECM VI: High Efficiency Motor Retrofits 0.135 0.017 0 0.017 0.118 ECM VII: Waste Heat Recovery System 0.055 0.007 0 0.007 0.016 ECM VIII: Packaged Air Conditioning 0.118 0.015 0 0.015 0.126 Replacement ECM IX: Facility Management System 0.434 0.056 0 0.056 0.067 (FMS) Installation ECM X: Insulation Installation 0.205 0.026 0 0.026 0.192 ECM XI: Other (Convert Constant Volume 0.252 0.032 0 0.032 0.299 to VAV System, Repair VAV Control System, Install Outside Air CO2 Sensors, Other)
A final adjustment was made on Table 12 for ECM IV: Chiller Retrofit on the
estimated construction cost per square feet per year. When we evaluated the
construction cost by $1.20 per square feet per year for a chiller replacement, it
yielded a simple payback period of 5.6 years. From our experience and previous
energy analysis, this appeared to be a rather low payback projection for chiller
retrofit projects. In order to provide a realistic and conservative construction cost
estimate, the total tonnage cooling load for each building was estimated using rule
of thumb sizing. The estimated corresponding total construction cost was then
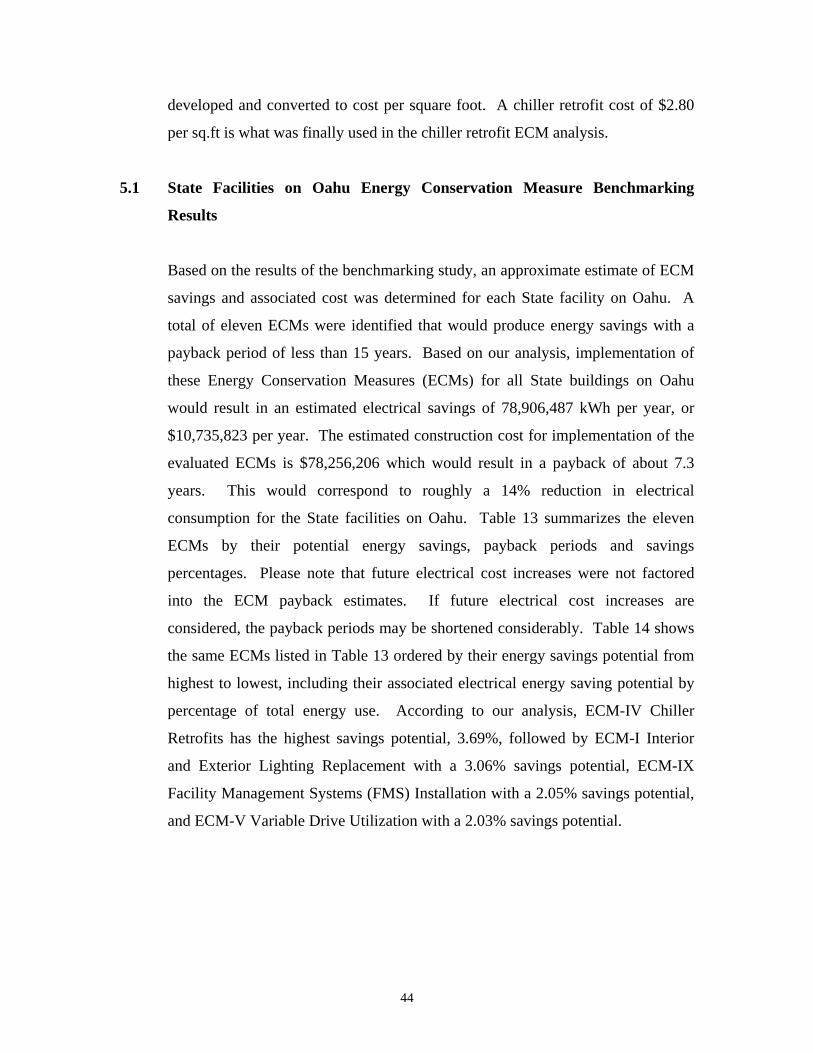
44
developed and converted to cost per square foot. A chiller retrofit cost of $2.80
per sq.ft is what was finally used in the chiller retrofit ECM analysis.
5.1 State Facilities on Oahu Energy Conservation Measure Benchmarking
Results
Based on the results of the benchmarking study, an approximate estimate of ECM
savings and associated cost was determined for each State facility on Oahu. A
total of eleven ECMs were identified that would produce energy savings with a
payback period of less than 15 years. Based on our analysis, implementation of
these Energy Conservation Measures (ECMs) for all State buildings on Oahu
would result in an estimated electrical savings of 78,906,487 kWh per year, or
$10,735,823 per year. The estimated construction cost for implementation of the
evaluated ECMs is $78,256,206 which would result in a payback of about 7.3
years. This would correspond to roughly a 14% reduction in electrical
consumption for the State facilities on Oahu. Table 13 summarizes the eleven
ECMs by their potential energy savings, payback periods and savings
percentages. Please note that future electrical cost increases were not factored
into the ECM payback estimates. If future electrical cost increases are
considered, the payback periods may be shortened considerably. Table 14 shows
the same ECMs listed in Table 13 ordered by their energy savings potential from
highest to lowest, including their associated electrical energy saving potential by
percentage of total energy use. According to our analysis, ECM-IV Chiller
Retrofits has the highest savings potential, 3.69%, followed by ECM-I Interior
and Exterior Lighting Replacement with a 3.06% savings potential, ECM-IX
Facility Management Systems (FMS) Installation with a 2.05% savings potential,
and ECM-V Variable Drive Utilization with a 2.03% savings potential.
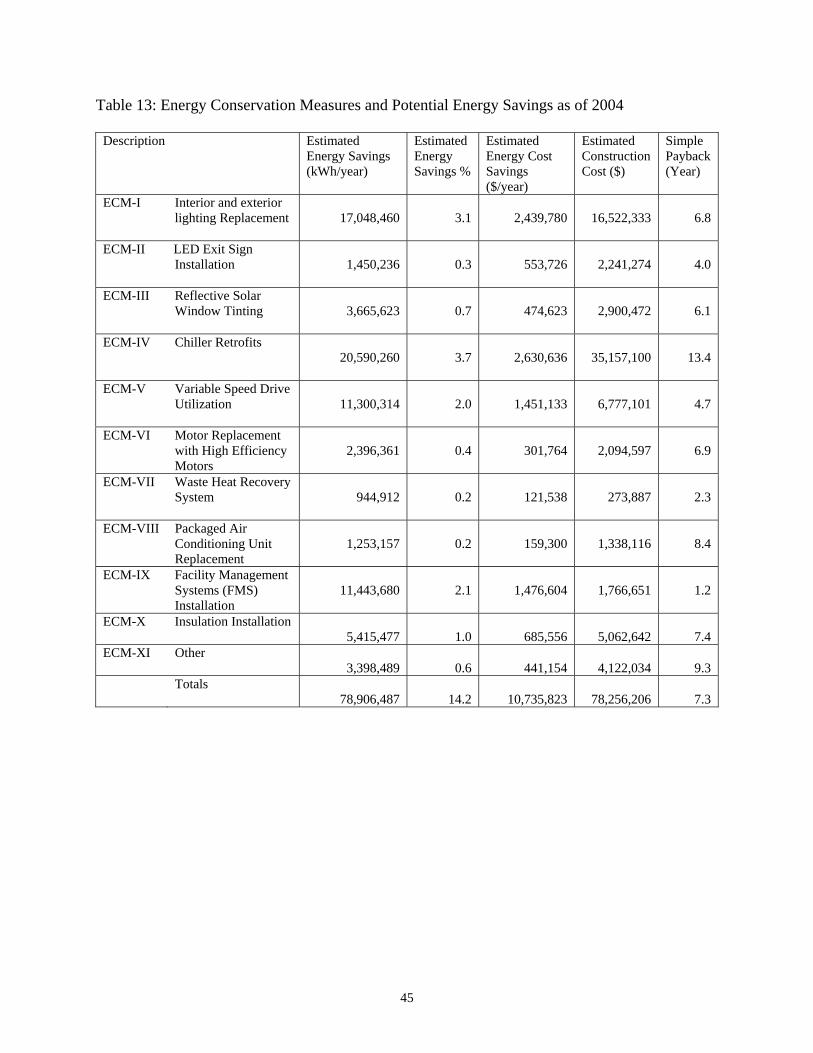
45
Table 13: Energy Conservation Measures and Potential Energy Savings as of 2004
Description Estimated Energy Savings (kWh/year)
Estimated Energy Savings %
Estimated Energy Cost Savings ($/year)
Estimated Construction Cost ($)
Simple Payback (Year)
ECM-I Interior and exterior lighting Replacement
17,048,460
3.1
2,439,780
16,522,333
6.8
ECM-II LED Exit Sign
Installation
1,450,236
0.3
553,726
2,241,274
4.0
ECM-III Reflective Solar Window Tinting
3,665,623
0.7
474,623
2,900,472
6.1
ECM-IV Chiller Retrofits
20,590,260
3.7
2,630,636
35,157,100
13.4
ECM-V Variable Speed Drive
Utilization
11,300,314
2.0
1,451,133
6,777,101
4.7
ECM-VI Motor Replacement with High Efficiency Motors
2,396,361
0.4
301,764
2,094,597
6.9
ECM-VII Waste Heat Recovery System
944,912
0.2
121,538
273,887
2.3
ECM-VIII Packaged Air
Conditioning Unit Replacement
1,253,157
0.2
159,300
1,338,116
8.4
ECM-IX Facility Management
Systems (FMS) Installation
11,443,680
2.1
1,476,604
1,766,651
1.2
ECM-X Insulation Installation 5,415,477
1.0
685,556
5,062,642
7.4
ECM-XI Other 3,398,489
0.6
441,154
4,122,034
9.3
Totals
78,906,487
14.2
10,735,823
78,256,206
7.3
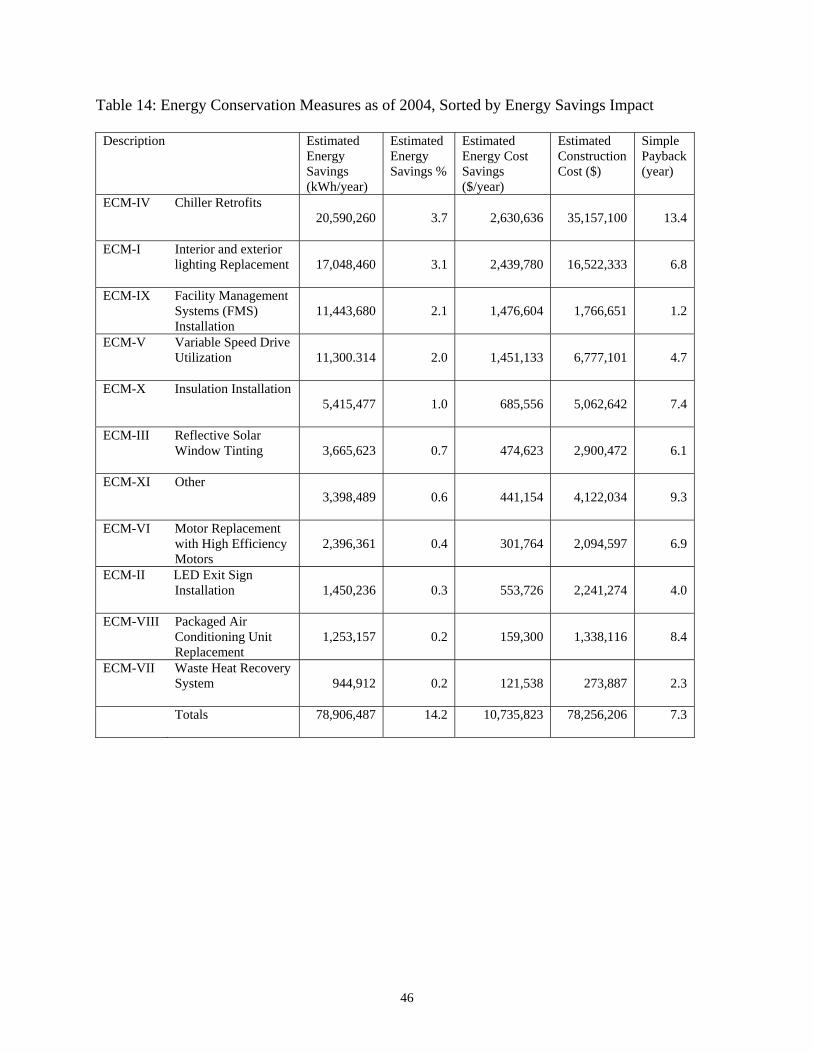
46
Table 14: Energy Conservation Measures as of 2004, Sorted by Energy Savings Impact
Description Estimated Energy Savings (kWh/year)
Estimated Energy Savings %
Estimated Energy Cost Savings ($/year)
Estimated Construction Cost ($)
Simple Payback (year)
ECM-IV Chiller Retrofits 20,590,260
3.7
2,630,636
35,157,100
13.4
ECM-I Interior and exterior
lighting Replacement
17,048,460
3.1
2,439,780
16,522,333
6.8
ECM-IX Facility Management
Systems (FMS) Installation
11,443,680
2.1
1,476,604
1,766,651
1.2
ECM-V Variable Speed Drive Utilization
11,300.314
2.0
1,451,133
6,777,101
4.7
ECM-X Insulation Installation
5,415,477
1.0
685,556
5,062,642
7.4
ECM-III Reflective Solar Window Tinting
3,665,623
0.7
474,623
2,900,472
6.1
ECM-XI Other
3,398,489
0.6
441,154
4,122,034
9.3
ECM-VI Motor Replacement with High Efficiency Motors
2,396,361
0.4
301,764
2,094,597
6.9
ECM-II LED Exit Sign Installation
1,450,236
0.3
553,726
2,241,274
4.0
ECM-VIII Packaged Air Conditioning Unit Replacement
1,253,157
0.2
159,300
1,338,116
8.4
ECM-VII Waste Heat Recovery
System
944,912
0.2
121,538
273,887
2.3
Totals
78,906,487 14.2 10,735,823 78,256,206 7.3
47
Table 15 summarizes the ECM’s for each State agency. The Table 15
information would be useful if the ECM implementation is prioritized by State
agency. According to the analysis, if all ECMs were implemented at the UH
Manoa facility, 5.2% of the State’s electrical costs may be saved on Oahu.
Similarly, implementation of the ECM’s at the DOE’s K - 12 Facilities and Public
Libraries would result in a 2.1 % reduction in the State total electrical costs.
Table 15: Energy Conservation Measures and Implementation Cost Breakdown by State Agency, as of 2004.
Building Occupancy Estimated
Energy Savings
(kWh/year)
Estimated Energy Savings
(kWh/sq.ft.-year)
Estimated Energy Savings
%
Estimated Energy
Cost Savings
($)
Estimated Energy
Cost Savings Per
sq.ft. ($)
Estimated Construction
Cost ($)
Estimated Const. Cost
per sq.ft. ($)
Simple Payback (Year)
UH MANOA
28,952,157 4.5 5.2 3,891,630 0.60 31,906,080 4.9 8.2
DOE K12, PUBLIC LIBRARY
11,895,402 1.5 2.1 1,690,408 0.22 8,751,558 1.1 5.2
DOT
9,389,534 3.7 1.7 1,247,371 0.50 10,320,922 4.1 8.3
DAGS
8,195,882 3.5 1.5 1,117,324 0.48 8,482,092 3.4 5.5
DOH
5,787,111 3.6 1.0 780,453 0.49 5,711,629 3.6 7.3
COMM COLL
3,779,793 3.1 0.7 501,856 0.41 4,107,137 3.4 8.2
OTHER*
2,742,918 2.8 0.5 379,141 0.39 2,015,736 2.1 5.3
PSD
2,213,972 2.0 0.4 314,355 0.29 1,761,040 1.6 5.6
DHS
2,218,352 3.8 0.4 300,422 0.52 2,182,610 3.9 7.4
DOD
1,745,860 3.3 0.3 238,626 0.45 1,521,358 2.9 6.4
DBEDT
1,153,667 1.9 0.2 160,331 0.26 823,276 1.3 5.1
JUDICIARY
831,839 1.6 0.2 113,905 0.21 672,767 1.3 5.9
TOTAL 78,906,487 3.0 14.2 10,735,823 0.41 78,256,206 3.0 7.3
* OTHER: Department of Attorney General Department of Labor and Industrial Relations Department of Land and Natural Resources Department of Hawaiian Homelands Department of Agriculture
48
6.0 CONCLUSIONS AND RECOMMENDATIONS
This energy benchmarking study characterizes electrical energy usage for State
facilities on Oahu. The data is presented for each State agency, and by end usage
distribution. This report also identifies the Energy Conservation Measures
(ECMs) that would help to reduce the State’s electrical consumption and
quantifies their energy savings potential and associated construction cost for their
implementation.
If the 11 ECMs, identified and evaluated in Section 5, are implemented, the State
can save up to 14.2% in electricity in Oahu. With those savings, the State
facilities’ electrical usage may be reduced from 21.1 kWh per sf per year down to
18.2 kWh per sf per year. Table 13 in Section 5 presents the energy savings
potential and the associated implementation cost and simple payback period for
each ECM. The information in this table is re-ordered by their estimated energy
savings in Table 16, by simple payback period in Table 17, and by estimated
cConstruction costs in Table 18. As can be followed from the tables, while the
ECM IV: Chiller Retrofits may yield the highest electricity savings (up to 3.7%),
its construction cost and simple payback period (13.4 years) is also the highest.
On the other hand, ECM IX: Facility Management System (FMS) Installation
offers up to 2.1% in toal energy savings with relatively low construction costs and
a 1.2 years simple payback period. These tables can thus be used to prioritize
decisions on implementing energy efficiency measures in these facilities.
Table 15 in Section 5 that illustrates the ECM analysis summary for each agency,
is also re-ordered by building square footage in Table 19, by estimated energy
savings in Table 20, by estimated energy cost savings in Table 21, by estimated
construction cost in Table 12, and by simple payback period in Table 23. From
the Tables, the UH Manoa and DOT offer the largest savings, but also require the
largest construction costs and have relatively higher simple payback periods. On
49
the other hand, DOE K-12 Schools and DAGS offer comparable energy savings
with lower construction costs and simple payback periods.
The data presented in this study is a good indicator that there is a large potential
for energy savings in the State facilities on Oahu. The analysis also suggests that
the cost to implement the recommended ECMs will be cost effective since the
simple payback periods for all of the ECMs at all of the State agencies on Oahu
are less than 15 years. Therefore, we do recommend that the energy conservation
measures identified for each State agency be pursued.
During the time this study was conducted, some information was not available.
Such information included building square footage for DOE K-12 schools, UH
Community Colleges, PSD facilities, and DHS facilities. Air conditioning status
for the DOE K-12 schools and PSD facilities were also not available. Data on
building operational hours and building age were not available for most of
agencies and facilities. The “Energy Survey Form” developed and distributed to
the State agencies were not completed by most of the agencies except DAGS and
DOT Airport Facilities. While DAGS surveys were included in this analysis, the
DOT Airport surveys were obtained just before the completion of this study, and
was therefore it was not included in the analysis. When the listed data becomes
available, this study may further be refined. Additionally, walkthrough energy
audits for the large State facilities would tremendously improve the study.
Performance contracting is one possible contracting mechanism for the State to
utilize in order to implement the identified ECMs in this study. If performance
contracting is utilized, we recommend that the performance contracts be pursued
for each State agency separately. All ECMs should be included in the
performance contracts as single package. Based on this benchmarking analysis,
the combined simple payback period for the implementation of all ECMs at each
agency is less than 10 years. This suggests that each agency’s facilities are an
acceptable candidate for performance contracting, since the energy cost savings
50
realized over the life of the contract will cover the costs for the ECM
improvements. The priority for performance contracting should be given to the
agencies with lower payback periods. Table 24 lists the State agencies
recommended for performance contracting with the priority ordered from lowest
simple payback period to the highest. In the list, performance contracts have
already been utilized at some of DAGS, DBEDT, DOD, and JUDICIARY
facilities to implement selected ECMs. The Table 24 has already factored the
previous implemented ECM savings into the analysis, and includes the additional
projected savings and cost savings for only the facilities that have not used
performance contracting and ECMs that have not yet been implemented.
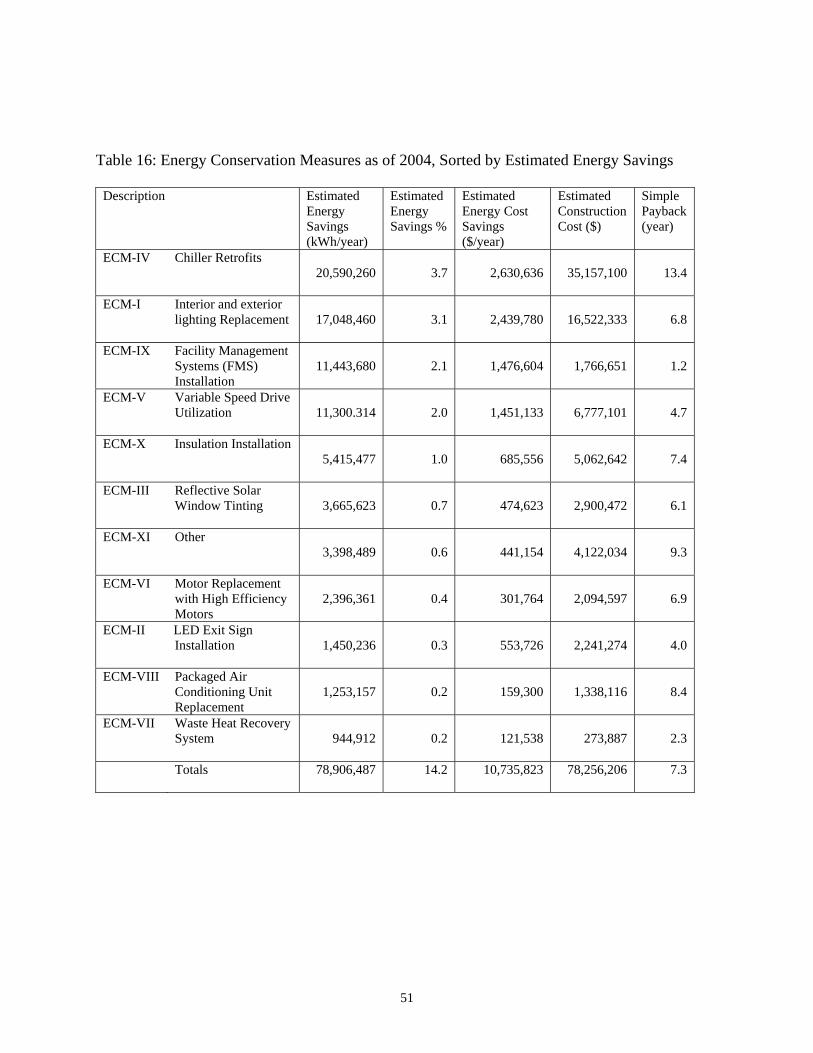
51
Table 16: Energy Conservation Measures as of 2004, Sorted by Estimated Energy Savings
Description Estimated Energy Savings (kWh/year)
Estimated Energy Savings %
Estimated Energy Cost Savings ($/year)
Estimated Construction Cost ($)
Simple Payback (year)
ECM-IV Chiller Retrofits 20,590,260
3.7
2,630,636
35,157,100
13.4
ECM-I Interior and exterior
lighting Replacement
17,048,460
3.1
2,439,780
16,522,333
6.8
ECM-IX Facility Management
Systems (FMS) Installation
11,443,680
2.1
1,476,604
1,766,651
1.2
ECM-V Variable Speed Drive Utilization
11,300.314
2.0
1,451,133
6,777,101
4.7
ECM-X Insulation Installation
5,415,477
1.0
685,556
5,062,642
7.4
ECM-III Reflective Solar Window Tinting
3,665,623
0.7
474,623
2,900,472
6.1
ECM-XI Other
3,398,489
0.6
441,154
4,122,034
9.3
ECM-VI Motor Replacement with High Efficiency Motors
2,396,361
0.4
301,764
2,094,597
6.9
ECM-II LED Exit Sign Installation
1,450,236
0.3
553,726
2,241,274
4.0
ECM-VIII Packaged Air Conditioning Unit Replacement
1,253,157
0.2
159,300
1,338,116
8.4
ECM-VII Waste Heat Recovery
System
944,912
0.2
121,538
273,887
2.3
Totals
78,906,487 14.2 10,735,823 78,256,206 7.3
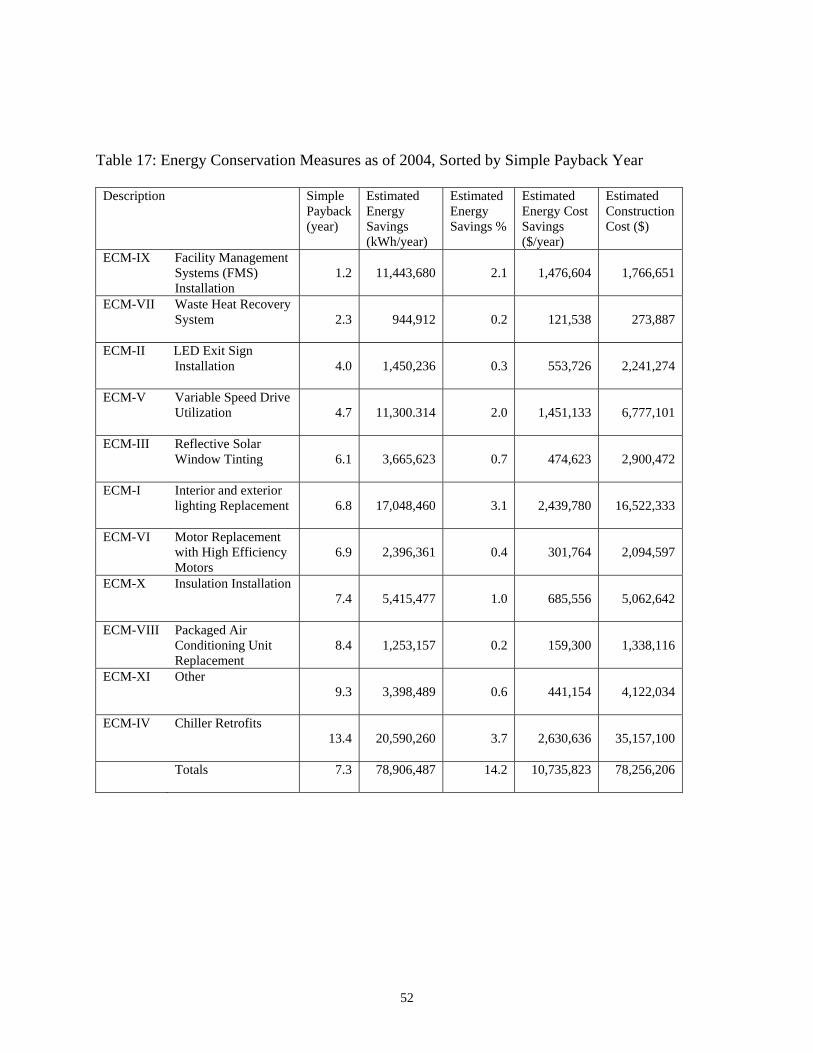
52
Table 17: Energy Conservation Measures as of 2004, Sorted by Simple Payback Year
Description Simple
Payback (year)
Estimated Energy Savings (kWh/year)
Estimated Energy Savings %
Estimated Energy Cost Savings ($/year)
Estimated Construction Cost ($)
ECM-IX Facility Management Systems (FMS) Installation
1.2
11,443,680
2.1
1,476,604
1,766,651
ECM-VII Waste Heat Recovery
System
2.3
944,912
0.2
121,538
273,887
ECM-II LED Exit Sign
Installation
4.0
1,450,236
0.3
553,726
2,241,274
ECM-V Variable Speed Drive
Utilization
4.7
11,300.314
2.0
1,451,133
6,777,101
ECM-III Reflective Solar Window Tinting
6.1
3,665,623
0.7
474,623
2,900,472
ECM-I Interior and exterior
lighting Replacement
6.8
17,048,460
3.1
2,439,780
16,522,333
ECM-VI Motor Replacement
with High Efficiency Motors
6.9
2,396,361
0.4
301,764
2,094,597
ECM-X Insulation Installation
7.4
5,415,477
1.0
685,556
5,062,642
ECM-VIII Packaged Air Conditioning Unit Replacement
8.4
1,253,157
0.2
159,300
1,338,116
ECM-XI Other 9.3
3,398,489
0.6
441,154
4,122,034
ECM-IV Chiller Retrofits 13.4
20,590,260
3.7
2,630,636
35,157,100
Totals
7.3 78,906,487 14.2 10,735,823 78,256,206
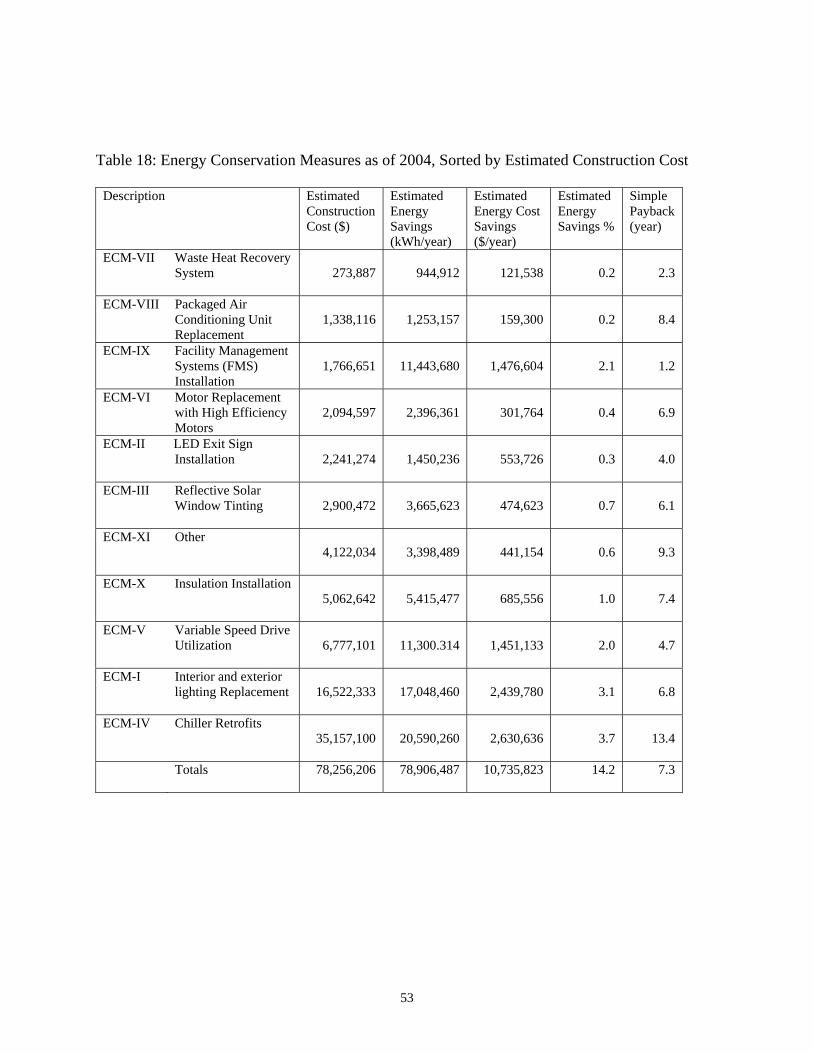
53
Table 18: Energy Conservation Measures as of 2004, Sorted by Estimated Construction Cost
Description Estimated Construction Cost ($)
Estimated Energy Savings (kWh/year)
Estimated Energy Cost Savings ($/year)
Estimated Energy Savings %
Simple Payback (year)
ECM-VII Waste Heat Recovery System
273,887
944,912
121,538
0.2
2.3
ECM-VIII Packaged Air
Conditioning Unit Replacement
1,338,116
1,253,157
159,300
0.2
8.4
ECM-IX Facility Management
Systems (FMS) Installation
1,766,651
11,443,680
1,476,604
2.1
1.2
ECM-VI Motor Replacement with High Efficiency Motors
2,094,597
2,396,361
301,764
0.4
6.9
ECM-II LED Exit Sign Installation
2,241,274
1,450,236
553,726
0.3
4.0
ECM-III Reflective Solar Window Tinting
2,900,472
3,665,623
474,623
0.7
6.1
ECM-XI Other
4,122,034
3,398,489
441,154
0.6
9.3
ECM-X Insulation Installation 5,062,642
5,415,477
685,556
1.0
7.4
ECM-V Variable Speed Drive
Utilization
6,777,101
11,300.314
1,451,133
2.0
4.7
ECM-I Interior and exterior
lighting Replacement
16,522,333
17,048,460
2,439,780
3.1
6.8
ECM-IV Chiller Retrofits
35,157,100
20,590,260
2,630,636
3.7
13.4
Totals
78,256,206 78,906,487 10,735,823 14.2 7.3
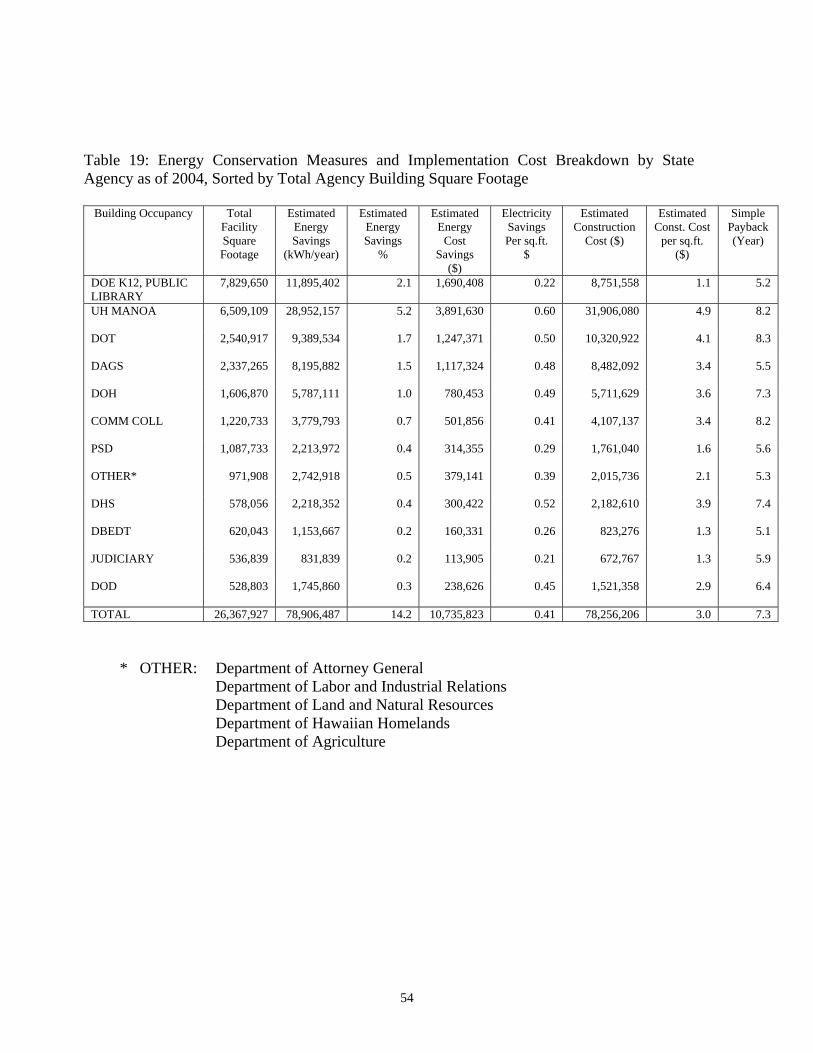
54
Table 19: Energy Conservation Measures and Implementation Cost Breakdown by State Agency as of 2004, Sorted by Total Agency Building Square Footage
Building Occupancy Total
Facility Square Footage
Estimated Energy Savings
(kWh/year)
Estimated Energy Savings
%
Estimated Energy
Cost Savings
($)
Electricity Savings Per sq.ft.
$
Estimated Construction
Cost ($)
Estimated Const. Cost
per sq.ft. ($)
Simple Payback (Year)
DOE K12, PUBLIC LIBRARY
7,829,650 11,895,402 2.1 1,690,408 0.22 8,751,558 1.1 5.2
UH MANOA
6,509,109 28,952,157 5.2 3,891,630 0.60 31,906,080 4.9 8.2
DOT
2,540,917 9,389,534 1.7 1,247,371 0.50 10,320,922 4.1 8.3
DAGS
2,337,265 8,195,882 1.5 1,117,324 0.48 8,482,092 3.4 5.5
DOH
1,606,870 5,787,111 1.0 780,453 0.49 5,711,629 3.6 7.3
COMM COLL
1,220,733 3,779,793 0.7 501,856 0.41 4,107,137 3.4 8.2
PSD
1,087,733 2,213,972 0.4 314,355 0.29 1,761,040 1.6 5.6
OTHER*
971,908 2,742,918 0.5 379,141 0.39 2,015,736 2.1 5.3
DHS
578,056 2,218,352 0.4 300,422 0.52 2,182,610 3.9 7.4
DBEDT
620,043 1,153,667 0.2 160,331 0.26 823,276 1.3 5.1
JUDICIARY
536,839 831,839 0.2 113,905 0.21 672,767 1.3 5.9
DOD
528,803 1,745,860 0.3 238,626 0.45 1,521,358 2.9 6.4
TOTAL 26,367,927 78,906,487 14.2 10,735,823 0.41 78,256,206 3.0 7.3 * OTHER: Department of Attorney General Department of Labor and Industrial Relations Department of Land and Natural Resources Department of Hawaiian Homelands Department of Agriculture
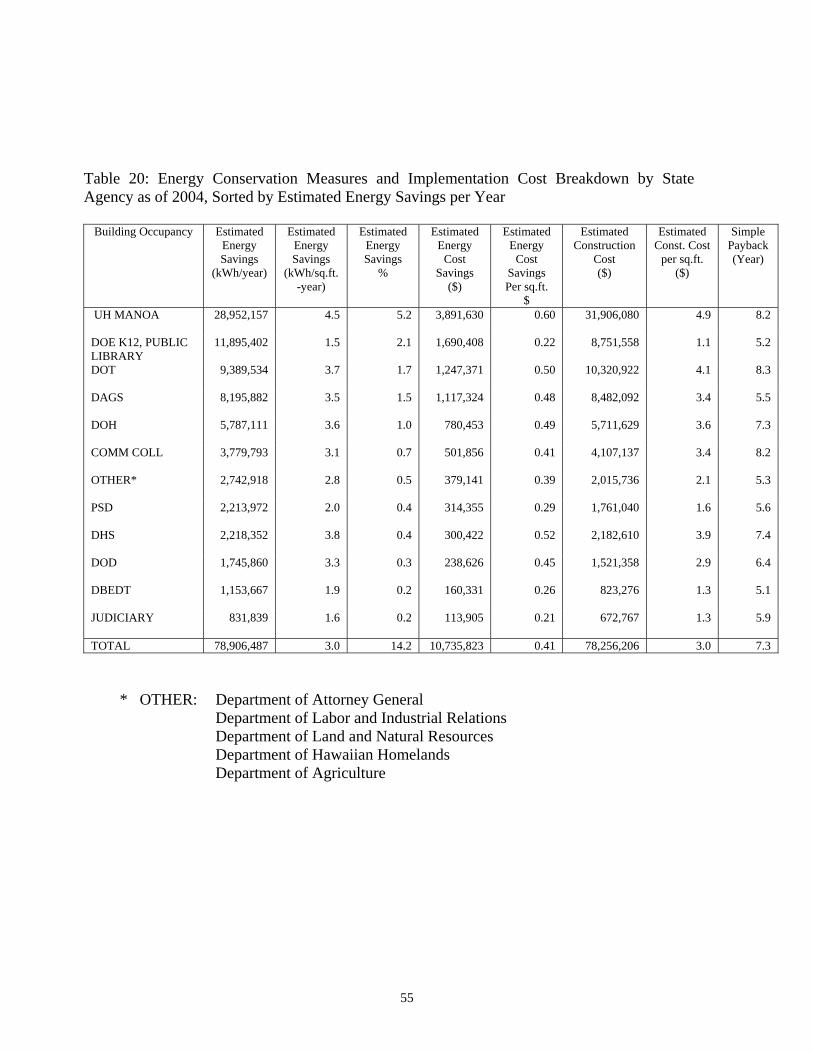
55
Table 20: Energy Conservation Measures and Implementation Cost Breakdown by State Agency as of 2004, Sorted by Estimated Energy Savings per Year
Building Occupancy Estimated
Energy Savings
(kWh/year)
Estimated Energy Savings
(kWh/sq.ft.-year)
Estimated Energy Savings
%
Estimated Energy
Cost Savings
($)
Estimated Energy
Cost Savings Per sq.ft.
$
Estimated Construction
Cost ($)
Estimated Const. Cost
per sq.ft. ($)
Simple Payback (Year)
UH MANOA
28,952,157 4.5 5.2 3,891,630 0.60 31,906,080 4.9 8.2
DOE K12, PUBLIC LIBRARY
11,895,402 1.5 2.1 1,690,408 0.22 8,751,558 1.1 5.2
DOT
9,389,534 3.7 1.7 1,247,371 0.50 10,320,922 4.1 8.3
DAGS
8,195,882 3.5 1.5 1,117,324 0.48 8,482,092 3.4 5.5
DOH
5,787,111 3.6 1.0 780,453 0.49 5,711,629 3.6 7.3
COMM COLL
3,779,793 3.1 0.7 501,856 0.41 4,107,137 3.4 8.2
OTHER*
2,742,918 2.8 0.5 379,141 0.39 2,015,736 2.1 5.3
PSD
2,213,972 2.0 0.4 314,355 0.29 1,761,040 1.6 5.6
DHS
2,218,352 3.8 0.4 300,422 0.52 2,182,610 3.9 7.4
DOD
1,745,860 3.3 0.3 238,626 0.45 1,521,358 2.9 6.4
DBEDT
1,153,667 1.9 0.2 160,331 0.26 823,276 1.3 5.1
JUDICIARY
831,839 1.6 0.2 113,905 0.21 672,767 1.3 5.9
TOTAL 78,906,487 3.0 14.2 10,735,823 0.41 78,256,206 3.0 7.3 * OTHER: Department of Attorney General Department of Labor and Industrial Relations Department of Land and Natural Resources Department of Hawaiian Homelands Department of Agriculture
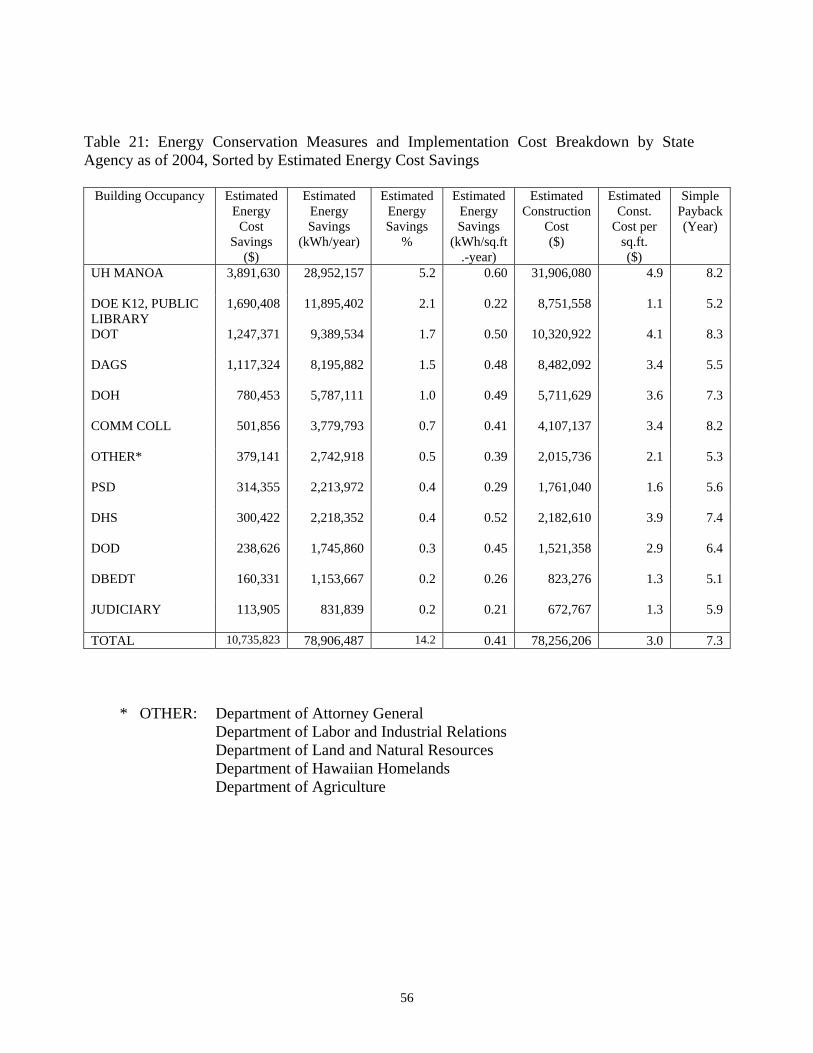
56
Table 21: Energy Conservation Measures and Implementation Cost Breakdown by State Agency as of 2004, Sorted by Estimated Energy Cost Savings
Building Occupancy Estimated
Energy Cost
Savings ($)
Estimated Energy Savings
(kWh/year)
Estimated Energy Savings
%
Estimated Energy Savings
(kWh/sq.ft.-year)
Estimated Construction
Cost ($)
Estimated Const.
Cost per sq.ft. ($)
Simple Payback (Year)
UH MANOA
3,891,630 28,952,157 5.2 0.60 31,906,080 4.9 8.2
DOE K12, PUBLIC LIBRARY
1,690,408 11,895,402 2.1 0.22 8,751,558 1.1 5.2
DOT
1,247,371 9,389,534 1.7 0.50 10,320,922 4.1 8.3
DAGS
1,117,324 8,195,882 1.5 0.48 8,482,092 3.4 5.5
DOH
780,453 5,787,111 1.0 0.49 5,711,629 3.6 7.3
COMM COLL
501,856 3,779,793 0.7 0.41 4,107,137 3.4 8.2
OTHER*
379,141 2,742,918 0.5 0.39 2,015,736 2.1 5.3
PSD
314,355 2,213,972 0.4 0.29 1,761,040 1.6 5.6
DHS
300,422 2,218,352 0.4 0.52 2,182,610 3.9 7.4
DOD
238,626 1,745,860 0.3 0.45 1,521,358 2.9 6.4
DBEDT
160,331 1,153,667 0.2 0.26 823,276 1.3 5.1
JUDICIARY
113,905 831,839 0.2 0.21 672,767 1.3 5.9
TOTAL 10,735,823 78,906,487 14.2 0.41 78,256,206 3.0 7.3
* OTHER: Department of Attorney General Department of Labor and Industrial Relations Department of Land and Natural Resources Department of Hawaiian Homelands Department of Agriculture
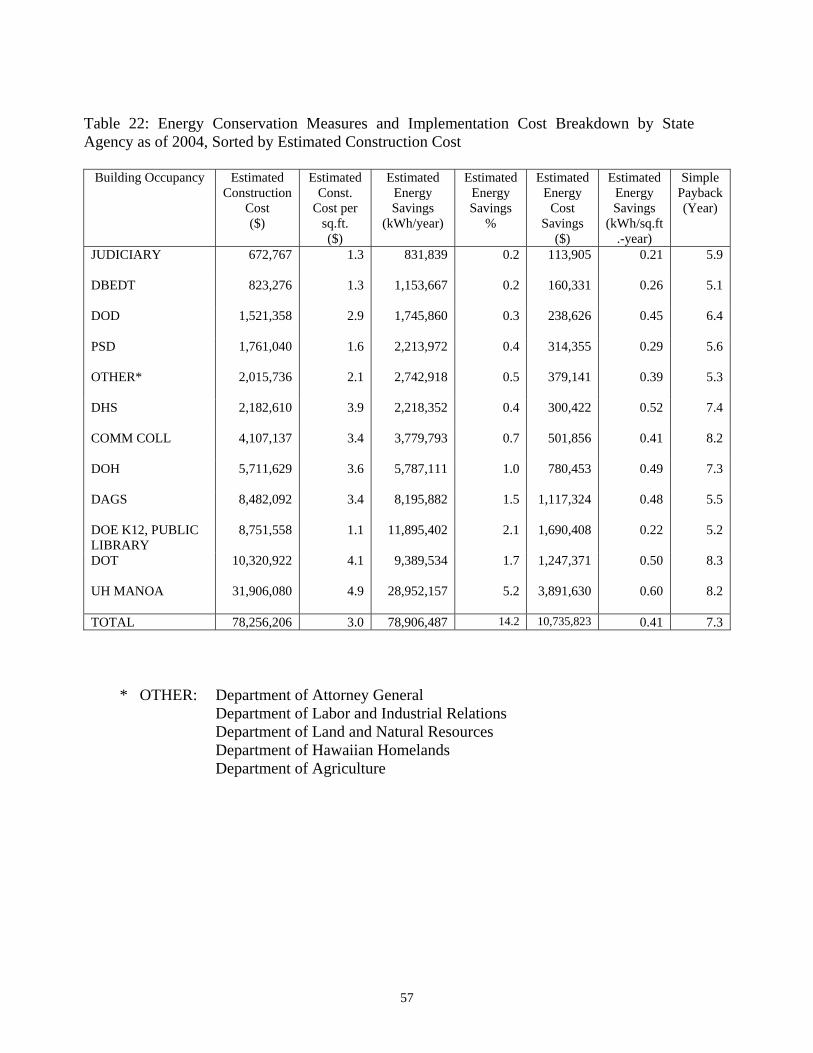
57
Table 22: Energy Conservation Measures and Implementation Cost Breakdown by State Agency as of 2004, Sorted by Estimated Construction Cost
Building Occupancy Estimated
Construction Cost ($)
Estimated Const.
Cost per sq.ft. ($)
Estimated Energy Savings
(kWh/year)
Estimated Energy Savings
%
Estimated Energy
Cost Savings
($)
Estimated Energy Savings
(kWh/sq.ft.-year)
Simple Payback (Year)
JUDICIARY
672,767 1.3 831,839 0.2 113,905 0.21 5.9
DBEDT
823,276 1.3 1,153,667 0.2 160,331 0.26 5.1
DOD
1,521,358 2.9 1,745,860 0.3 238,626 0.45 6.4
PSD
1,761,040 1.6 2,213,972 0.4 314,355 0.29 5.6
OTHER*
2,015,736 2.1 2,742,918 0.5 379,141 0.39 5.3
DHS
2,182,610 3.9 2,218,352 0.4 300,422 0.52 7.4
COMM COLL
4,107,137 3.4 3,779,793 0.7 501,856 0.41 8.2
DOH
5,711,629 3.6 5,787,111 1.0 780,453 0.49 7.3
DAGS
8,482,092 3.4 8,195,882 1.5 1,117,324 0.48 5.5
DOE K12, PUBLIC LIBRARY
8,751,558 1.1 11,895,402 2.1 1,690,408 0.22 5.2
DOT
10,320,922 4.1 9,389,534 1.7 1,247,371 0.50 8.3
UH MANOA
31,906,080 4.9 28,952,157 5.2 3,891,630 0.60 8.2
TOTAL 78,256,206 3.0 78,906,487 14.2 10,735,823 0.41 7.3
* OTHER: Department of Attorney General Department of Labor and Industrial Relations Department of Land and Natural Resources Department of Hawaiian Homelands Department of Agriculture
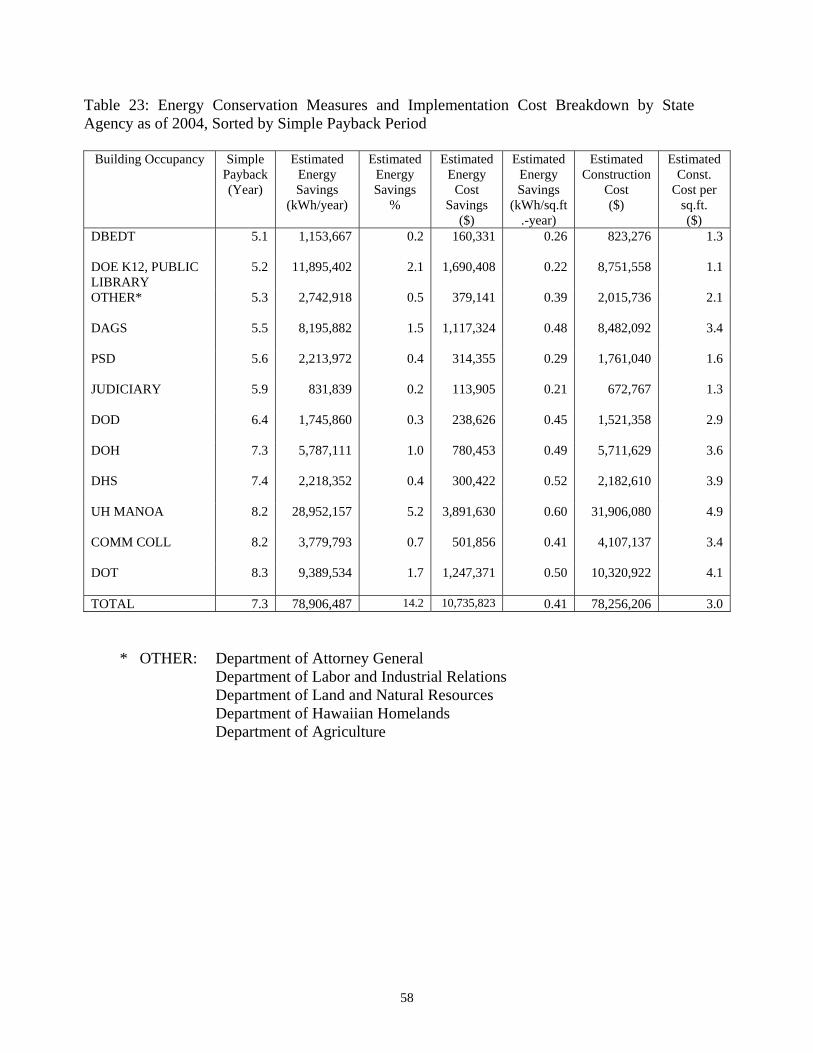
58
Table 23: Energy Conservation Measures and Implementation Cost Breakdown by State Agency as of 2004, Sorted by Simple Payback Period
Building Occupancy Simple
Payback (Year)
Estimated Energy Savings
(kWh/year)
Estimated Energy Savings
%
Estimated Energy
Cost Savings
($)
Estimated Energy Savings
(kWh/sq.ft.-year)
Estimated Construction
Cost ($)
Estimated Const.
Cost per sq.ft. ($)
DBEDT
5.1 1,153,667 0.2 160,331 0.26 823,276 1.3
DOE K12, PUBLIC LIBRARY
5.2 11,895,402 2.1 1,690,408 0.22 8,751,558 1.1
OTHER*
5.3 2,742,918 0.5 379,141 0.39 2,015,736 2.1
DAGS
5.5 8,195,882 1.5 1,117,324 0.48 8,482,092 3.4
PSD
5.6 2,213,972 0.4 314,355 0.29 1,761,040 1.6
JUDICIARY
5.9 831,839 0.2 113,905 0.21 672,767 1.3
DOD
6.4 1,745,860 0.3 238,626 0.45 1,521,358 2.9
DOH
7.3 5,787,111 1.0 780,453 0.49 5,711,629 3.6
DHS
7.4 2,218,352 0.4 300,422 0.52 2,182,610 3.9
UH MANOA
8.2 28,952,157 5.2 3,891,630 0.60 31,906,080 4.9
COMM COLL
8.2 3,779,793 0.7 501,856 0.41 4,107,137 3.4
DOT
8.3 9,389,534 1.7 1,247,371 0.50 10,320,922 4.1
TOTAL 7.3 78,906,487 14.2 10,735,823 0.41 78,256,206 3.0 * OTHER: Department of Attorney General Department of Labor and Industrial Relations Department of Land and Natural Resources Department of Hawaiian Homelands Department of Agriculture
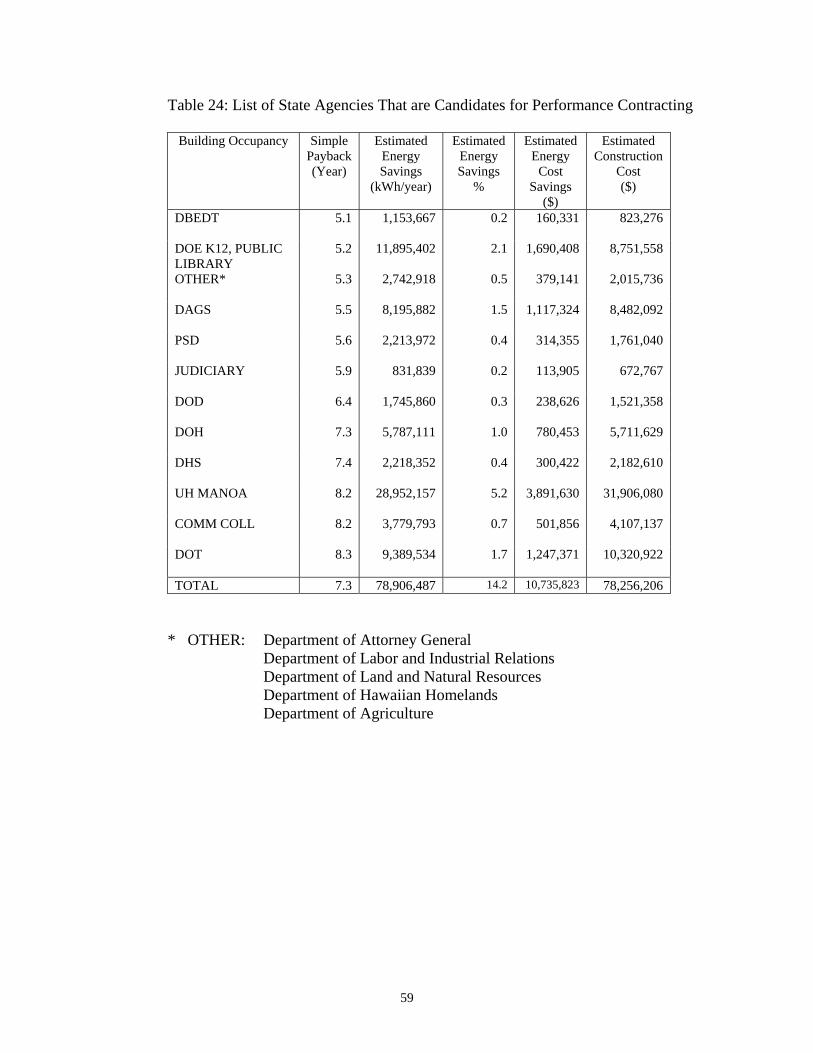
59
Table 24: List of State Agencies That are Candidates for Performance Contracting
Building Occupancy Simple Payback (Year)
Estimated Energy Savings
(kWh/year)
Estimated Energy Savings
%
Estimated Energy
Cost Savings
($)
Estimated Construction
Cost ($)
DBEDT
5.1 1,153,667 0.2 160,331 823,276
DOE K12, PUBLIC LIBRARY
5.2 11,895,402 2.1 1,690,408 8,751,558
OTHER*
5.3 2,742,918 0.5 379,141 2,015,736
DAGS
5.5 8,195,882 1.5 1,117,324 8,482,092
PSD
5.6 2,213,972 0.4 314,355 1,761,040
JUDICIARY
5.9 831,839 0.2 113,905 672,767
DOD
6.4 1,745,860 0.3 238,626 1,521,358
DOH
7.3 5,787,111 1.0 780,453 5,711,629
DHS
7.4 2,218,352 0.4 300,422 2,182,610
UH MANOA
8.2 28,952,157 5.2 3,891,630 31,906,080
COMM COLL
8.2 3,779,793 0.7 501,856 4,107,137
DOT
8.3 9,389,534 1.7 1,247,371 10,320,922
TOTAL 7.3 78,906,487 14.2 10,735,823 78,256,206
* OTHER: Department of Attorney General Department of Labor and Industrial Relations Department of Land and Natural Resources Department of Hawaiian Homelands Department of Agriculture