Embed Size (px)
Citation preview

Benchmarking the AS 2885 Safety Management Process
Peter Tuft
APIA Brisbane Seminar, 17 May 2012
Peter Tuft APIA Brisbane Seminar, 17 May 2012 2
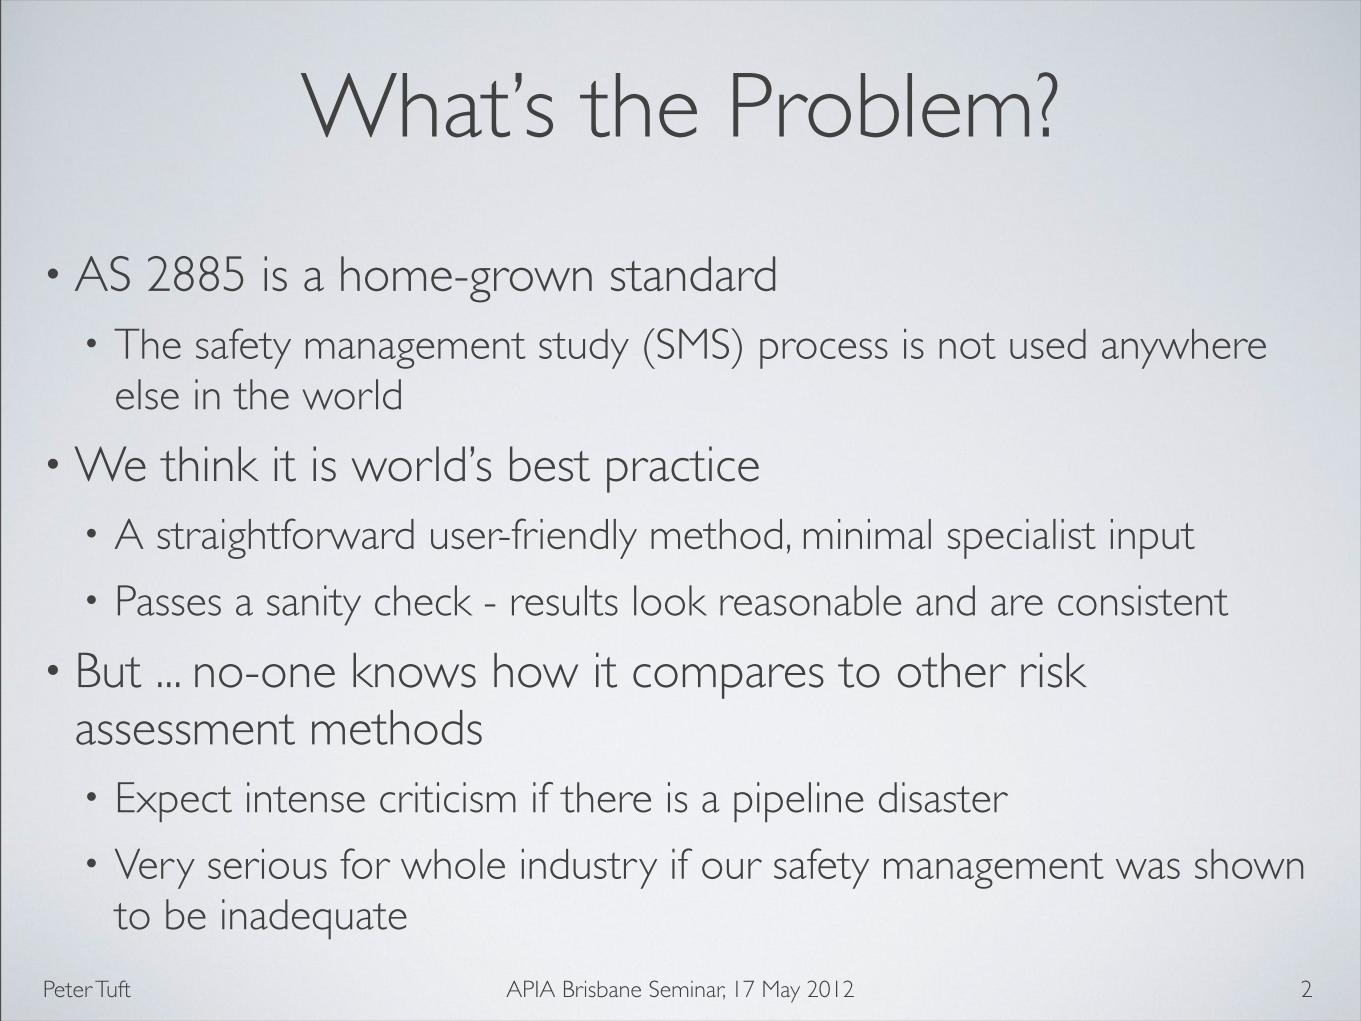
What’s the Problem?
• AS 2885 is a home-grown standard• The safety management study (SMS) process is not used anywhere
else in the world
•We think it is world’s best practice• A straightforward user-friendly method, minimal specialist input
• Passes a sanity check - results look reasonable and are consistent
• But ... no-one knows how it compares to other risk assessment methods• Expect intense criticism if there is a pipeline disaster
• Very serious for whole industry if our safety management was shown to be inadequate
Peter Tuft APIA Brisbane Seminar, 17 May 2012
What are the Alternatives?
Classical Quantitative Risk Assessment (QRA)
Modern Reliability Based Analysis (RBA)
If SMS compares unfavourably, need to improve SMS process
3

Peter Tuft APIA Brisbane Seminar, 17 May 2012
AS 2885 SMS
• Two phases• Design review to identify threats then eliminate them if possible by
modifying the design or operating procedures
• Risk assessment of residual threats that can’t be fully eliminated
• Risk assessment is qualitative• Uses risk matrix, expresses risk as High, Intermediate, Low, etc
• Frequency and severity of failure estimated on the basis of informed judgements (supported by calculations if necessary)
• Based on a cause-and-control model of risk management• Identify every cause of failure (threat)
• Implement targeted measures to control each individual threat
4

Peter Tuft APIA Brisbane Seminar, 17 May 2012
Quantitative Risk Assessment
• Calculates and expresses risk levels numerically• Individual risk• Probability of fatality for a person at distance X from pipeline
• Often expressed as graph of probability vs. distance
• Societal risk• Probability that pipeline failure will result in N deaths (societal risk)
• Often expressed as F-N curves (frequency vs. number of deaths)
• Estimating failure frequency requires valid historical data• Australian failure history very limited (good ! )
• Limited capacity to address specific causes of failure, or effects of specific mitigation measures
5

Peter Tuft APIA Brisbane Seminar, 17 May 2012
Reliability Based Analysis
•Developed by C-FER in Canada, industry-sponsored project• Included as an option in Canadian Standard CS Z662
• Also numerical, but much less reliant on failure history• Starts with probability distributions for all factors that influence pipe
failure (eg. WT, corrosion rates, level of third party activity, pipeline protection measures, etc)
• Calculates probability of failure by Monte Carlo simulation
• Compares against target reliability based on size of population affected by failure
• Should be more valid than QRA in situations where there is insufficient failure history (and perhaps generally)
6

Peter Tuft APIA Brisbane Seminar, 17 May 2012
But how to Compare?
• SMS, QRA and RBA are incommensurable• Each expresses risk in
different terms and compares it against different criteria
• Qualitative SMS vs quantitative risk (individual or societal) vs reliability
7
CATASTROPHIC MAJOR SEVERE MINOR TRIVIAL
PEOPLE: Multiple fatalitiesFew fatalities, or
several people with life-threatening injuries
Injury or illness requiring hospital
treatment
Injuries requiring first aid treatment
Minimal impact on health
SUPPLY: Long term interruptionProlonged interruption or long-term restriction
Short term interruption or prolonged restriction
Short term interruption or restriction but shortfall met from other sources
No interruption or restriction
ENVIRONMENT:
Effects widespread, viability of ecosystems or
species affected, permanent major changes
Major off-site impact or long-term severe effects or rectification difficult
Localised (<1 ha) & short-term (<2 yr)
effects, easily rectified
Effect very localised (<0.1 ha) and very short term (weeks), minimal rectification
No effect, or minor on-site effects rectified immediately with
negligible residual effect
FREQUENTExpected to occur several times
(! 10 events)Extreme Extreme High Intermediate Low
OCCASIONALMay occur occasionally
(0.1 - 10 events)Extreme High Intermediate Low Low
UNLIKELYUnlikely to occur but possible
(0.1% - 10% probability)High High Intermediate Low Negligible
REMOTENot anticipated for this pipeline at this
location (0.001 - 0.1% probability)High Intermediate Low Negligible Negligible
HYPOTHETICALTheoretically possible but has never occurred on a similar pipeline (<0.001% probability)
Intermediate Low Negligible Negligible Negligible
Peter Tuft APIA Brisbane Seminar, 17 May 2012
Basis for Comparison
Risk assessment methods are not absolute, just a decision aids: Is the risk tolerable or not?
Key to comparison:
Compare borderline cases to see if all methods agree they are borderline tolerable
Only single-point calibration, but it’s the most important point
8

Peter Tuft APIA Brisbane Seminar, 17 May 2012
Test Cases
• Basis for selection:• Already been through routine SMS• Risk level found to be Intermediate (ie. borderline in AS 2885 terms)
• Four cases, each segment 500 m long:
9
Location Class T1 (Suburban) T2 (High Density)
Pipeline AUrban Design, thick
Pipeline BRural Design, thin
T1 A T2 A
T1 B T2 B
•Details confidential at request of pipeline owner

Peter Tuft APIA Brisbane Seminar, 17 May 2012
SMS Results
• SMS done as part of routine responsibilities of pipeline owner, not set up specifically for this study• Outcomes still useful for this study despite some differences in
approach between Pipelines A and B
• Intermediate risk is borderline tolerable (and only if ALARP)
10
Corrosion Risk Puncture Risk Rupture Risk
Pipeline A (thick)
Pipeline B (thin)
Intermediate & ALARP
Low “No Rupture”
Intermediate & ALARP
Intermediate & ALARP
Intermediate & ALARP

Peter Tuft APIA Brisbane Seminar, 17 May 2012
RBA Results
• RBA results were calculated for two failure modes:• Corrosion leak• Mechanical damage rupture (including contribution from leak)
• Results presented as reliability vs. time, with target reliability also shown
11
Target Reliability
This graph for illustration of concept only. Corrosion and impact risks have different target reliabilities but only impact target shown here.

Peter Tuft APIA Brisbane Seminar, 17 May 2012
RBA Summary
• Corrosion risk borderline if target reliability exceeded soon• Burst risk borderline if failure rate roughly equals target rate
(on an order of magnitude scale)•Red cases are borderline tolerable
12
Segment T1A T2A T1B T2B
Years until corrosion target exceeded
Ratio of burst failure rate to target rate
25 17 5 5
0.20 2.60 2.00 2.50

Peter Tuft APIA Brisbane Seminar, 17 May 2012
QRA Results
•QRA calculated combined risk from three failure scenarios (corrosion pinhole, mechanical puncture, rupture)• Expressed as both individual risk and societal risk• Compared against risk criteria from NSW Dept of Planning• Other criteria exist, and vary widely
• Incident frequencies based on European data, extremely conservative for Australia (about 15 times higher)
13

Peter Tuft APIA Brisbane Seminar, 17 May 2012
QRA Individual Risk
14
NSW DoP Criterion (1x10⁻⁶ per year)
Close to criterion - borderline tolerable

Peter Tuft APIA Brisbane Seminar, 17 May 2012
QRA Societal Risk
15
All within borderline tolerable band

Peter Tuft APIA Brisbane Seminar, 17 May 2012
Comparison
16
Analysis Method Pipeline Corrosion leak Puncture Rupture
SMSSMS
RBARBA
QRA - individualQRA -
individual
QRA - societalQRA - societal
A Borderline Tolerable n/a
B Borderline Borderline Borderline
A Tolerable (~20 yr) n/a Borderline
B Borderline (~5 yr) n/a Borderline
A Borderline Borderline (low) Tolerable
B Borderline Borderline (low) Tolerable
A Borderline (low) Borderline Borderline
B Borderline (low) Borderline Borderline (low)

Peter Tuft APIA Brisbane Seminar, 17 May 2012
Observations
• Almost all cases are borderline - confirms that SMS results are consistent with other methods•Differences between analysis methods greater than between
pipelines, despite greater vulnerability of Pipeline B• Implies risk analyses are not absolute but at best indicative and an aid
to decision making
•QRA known to be conservative by at least an order of magnitude, yet roughly same results as SMS• Implies SMS would be much more conservative than QRA if latter
based on real Australian incident rates
17

Peter Tuft APIA Brisbane Seminar, 17 May 2012
Application
• RBA useful for quantifying increase in corrosion risk over time•QRA remains of limited use for pipelines• Little or no guidance on how to reduce risk
• Uncertain capacity to include effects of procedural protection
• May have a role in satisfying authorities (and the public) that pipelines are safe, in terms familiar to them
• SMS is more than a risk analysis• Threat mitigation is an integral part of the process - takes place even
before risk evaluation
• Threats that present highest risk are obvious targets for risk reduction
18

Peter Tuft APIA Brisbane Seminar, 17 May 2012
Benchmarked Successfully
SMS confirmed as consistent with QRA and RBA
Industry can be confident that SMS estimates risk at least as reliably as other methods
No need for changes to SMS process to calibrate it
SMS has additional benefit of focus on risk reduction, regardless of formal risk evaluation
19

Peter Tuft APIA Brisbane Seminar, 17 May 2012
Acknowledgements
•Nader Yoosef-Ghodsi (C-FER)• Reliability based analysis
• John Bertram (formerly Sherpa, now Capability By Design)• Quantitative risk assessment
• This work was funded by the Energy Pipelines CRC, supported through the Australian Government’s Cooperative Research Centres Program• The cash and in-kind support from the APIA RSC is gratefully
acknowledged
20

21
The Australian pipeline industry can be
confident in its home-grown process for
effective pipeline risk management