Embed Size (px)
Citation preview

CONCURRENCY: PRACTICE AND EXPERIENCE, VOL. 8( I) , 47-69 (JAN-FEB 1996)
Benchmarking the computation and communication performance of the CM-5* KIVANC DINCER, ZEKI BOZKUS, SANJAY RANKA AND GEOFFREY FOX Northeast Parallel Architectures Center and School of Computer and Information Science I I I College Place, Room 3-21 7 Center for Science and Technology Syracuse University Syracuse, NY 13244-4100, USA
SUMMARY Thinking Machines' CM-5 machine is a distributed-memory, message-passing computer. In the paper we devise a performance benchmark for the base and vector units and the data com- munication networks of the CM-5 machine. We model the communication characteristics such as communication latency and bandwidths of point-to-point and global communication prim- itives. We show, on a simple Gaussian elimination code, that an accurate static performance estimation of parallel algorithms is possible by using those basic machine properties connected with computation, vectorization, communication and synchronization. Furthermore, we de- scribe the embedding of meshes or hypercubes on the CM-5 fat-tree topology and illustrate the performance results of their basic communication primitives.
1. INTRODUCTION
The CM-5 is a parallel distributed-memory machine that can scale up to 16,384 processing nodes. Each node contains a SPARC microprocessor, a custom network interface, a local memory up to 128 Mbytes, and either a memory controller or vector controller units. The processing nodes are connected by three networks: the diagnostics network which identifies and isolates errors throughout the system; the high speed data network, which communicates bulk data; and the control network, which is mainly responsible for the operations requiring the participation of all nodes simultaneously, such as broadcasting and synchronization. As data communication between two nodes can be performed by using either the data network or the control network, we restrict our analysis to these two.
In making this study we have two objectives. The first includes evaluating the computation and communication performance of the CM-5 and modeling the system parameters such as computational processing rate, communication start-up time, and the latency and data transfer bandwidth. The fundamental measurement made in our benchmark programs is the elapsed time for completing some specific tasks or for completing a communication operation. All other performance figures are derived from this basic timing measurement.
Secondly, we want to investigate the feasibility and efficiency of embedding other kinds of network topologies into the CM-5 fat-tree topology and to devise a benchmark for the basic communication primitives of those topologies on the CM-5. There is an enormous
'This article is available on the World Wide Web at http://www.npac.syr.edu/techreports
CCC 1040-3 108/96/010047-23 01996 by John Wiley & Sons, Ltd.
Received I7 July I992 Revised 15 Junuary 1995
48 K. DINCER ETAL.
number of parallel algorithms for different types of network topologies in the literature[ 1,2]. We address the problem of efficiently embedding meshes and hypercubes into the fat-tree topology, and we present timings for basic mesh and hypercube primitives. Our bench- marking study shows that these embeddings give efficient results and that many algorithms can be transported to the CM-5 with little or no change.
The results of our study make it possible to predict the performance of parallel algorithms without actually running them on the CM-5. We present a Gaussian elimination code and give the corresponding real and estimated execution times in order to show the accuracy of the estimated performance figures.
1.1. Related work
There are numerous articles in the literature about benchmarking different aspects of recent parallel architectures or supercomputers[3,4,5,6,7,8,9]. There are also several benchmark suits specially developed to provide a common ground to test the performance of different high-performancecomputers[ 10,11,12,13]. Some of them investigate the use of real appli- cation programs, while others employ short kernel codes to evaluate the performance, just as we do here.
1.2. Overview
The rest of this paper is organized as follows. Section 2 gives a brief description of the CM-5 architecture. Section 3 introduces the test configurations and the message-passing library that were used to perform our experiments. Section 4 gives the computational per- formance of the SPARC processor and the vector units. Section 5 presents the benchmarks to measure communication performance from one node to another. Section 6 addresses the global operations provided by the CM-5. Section 7 shows how meshes and hypercubes can be simulated on the fat-tree network topology. Section 8 presents the estimation of the performance for a Gaussian elimination kernel code on the CM-5.
2. CM-5 SYSTEM OVERVIEW
The CM-5 is a scalable distributed-memory computer system which can efficiently support up to 16,384computation nodes. Each node contains a SPARC microprocessor and a portion of the global memory connected to the rest of the system through a network interface. Every node in the CM-5 is connected to two interprocessor communication networks, the data network and the control network. This Section gives a brief overview of the CM-5 processing nodes, data and control networks, which have enormous importance in our study.
2.1. Processing nodes
Each CM-5 computation node consists of a SPARC microprocessor, a custom network interface that connects the node to the rest of the system through data and control networks, a local memory up to 128 Mbytes, and an associated memory controller unit (Figure I(a)).
SPARC has a clock rate of 33 MHz. It has 64 KB cache that is used for both instructions and data. The SPARC is also responsible for managing the communication with other system components via the network interface.

BENCHMARKING THE CM-5 49
Data NW Control NW
Microprocessor Interface
t
Figure 1. CM-Sprocessing node (a) without and (b) with vector units (dashed lines indicate optional hardware)
Node memory is allocated as 8 MB chunks and controlled by a special memory controller. Optionally, this memory controller can be replaced by up to four vector units (Figure I(b)). In this configuration, size of each memory unit may be either 8 or 32 MB. The scalar multiprocessor is able to issue vector instructions to any subset of vector units. Each vector unit has a vector instruction decoder, a pipelined ALU, and 64 64-bit registers like a conven- tional vector processor (Figure 2). The 16 MHz vector unit allows one memory operation and one arithmetic operation per clock cycle which gives 16 Mflops peak performance for single arithmetic operations like add or multiply. On the other hand, it can perform a multiply-and-add operation in only one cycle which increases the peak performance to 32 MHops for this operation. To summarize, a node with four vector units has 256 64-bit data registers, 32 to 128 MB of DRAM memory, and 64 to 128 MHops peak performance for floating-point arithmetic operations.
All the components inside a node are connected via a 64-bit bus. The bandwidth of the local memory can increase to 512 Mbytes per second when vector units are attached.
2.2. The control network
The CM-5 control network provides high bandwidth and low latency for global operations, such as broadcast, reduction, parallel prefix and barrier synchronizations, where all the nodes are involved.
CM-5 control network has three subnetworks responsible for handling the global opera- tions; a broadcast subnetwork which is responsible for broadcast operations, a combining subnetwork which supports global operations like reduction or parallel prefix, and a global subnetwork which takes care of the synchronization.
2.3. The data network
The data network is a high-bandwidth network optimized for bulk transfers where each message has one source and one destination. It is a message-passing-based point-to-point

50 K. DINCER ETAL.
I
Mbus
Level 2
Level 1
Processing Nodes
I J
Memory u Figure 2. Vector unit functional architecture
Figure 3. CM-5 Data network’s fat-tree topology with 16 nodes (including network switches.)
routing network that guarantees delivery. In addition, it is deadlock-free and has fair conflict arbitration.
The network architecture is based on fat-tree (quad-tree) topology with a network in- terface at all the leaf nodes. Each internal node of the fat-tree is implemented by a set of switches. The number of switches per node doubles for each higher layer until level 3, and from there on it quadruples. Figure 3 illustrates a data network having 16 nodes. The communication switches are labeled as ( i , j ) , where i shows the number of the child switch and j the number of the parent switch.
The CM-5 is designed to provide a point-to-point peak transfer bandwidth of 5 Mbytesh between any two nodes in the system. However, if the destination node is within the same
BENCHMARKING THE CM-5 51
4-node cluster or 16-node cluster, it can reach to a peak bandwidth of 20 Mbytes/s and 10 Mbytesls, respectively.
3. TEST SYSTEM
Our experiments were performed on a 32-node CM-5 at the Northeast Parallel Architecture Center at Syracuse University and on an 864-node CM-5 (recently upgraded to 896 nodes) at the Army High Performance Research Center at the University of Minnesota. Both machines are timeshared and run under CMOST version 7.2. There was no one else using the systems while we were running our benchmarking programs.
The CM-5 processing nodes can be grouped into one or more logical partitions, each of which is controlled by a partition manager. Each partition uses separate processors and network resources and has equal access to the shared system resources. For example, Minnesota’s 864-node CM-5 machine is divided into 32-, 64-, 256- and 5 12-nodepartitions.
Most of the values reported in this paper were measured by using a set of short benchmark codes written in C with calls to the CM message-passing library (CMMD Version 3.0 Final). The codes were compiled by using the Gnu C compiler with all the optimizations turned on in order to exploit the full potential of the hardware. The precision of the CM-5 clock is 1 ps . The timings were estimated by recording the CM node busy-time for an average of 100 repetitions of the experiment and dividing the total time by the number of repetitions. CM node busy-time is the duration in which the user code is executed on a certain node within its own operating system time-sharing slice. We used the CM Fortran language[ 141 (version 2.1.1.2), which partitions and stores the vectors directly into the vector unit memories, to measure the vector unit performance.
As might be expected, testing the hardware system by using high-level software (e.g. CM Fortran or C compilers and CMMD message-passing software) influences the performance negatively. Performance is bounded by the software’s ability to exploit the capabilities of the hardware.
3.1. CM-5 message-passing library: CMMD
CMMD[ 151 provides facilities for co-operative message-passing between processing nodes. We used the nodeless model of programming, where all the processing nodes execute the same SPMD (single-program multiple-data) program and the partition manager acts simply as an VO server.
At the lowest layer, CMMD implements active messages[ 161, which provide fast packet- based communication and simple low-latency data transfer. When a message is to be sent across the data network, the data message is divided into a group of packets of size 20 bytes; 16 bytes of this packet are used for the user data, and the remaining 4 bytes contain control information such as the destination and the message size[ 171.
4. COMPUTATION BENCHMARKS
4.1. SPARC performance
We run a set of benchmark programs to measure the computational speed of the SPARC microprocessor for basic integer and floating-point operations. Execution times for any
52 K. DINCER E T A L.
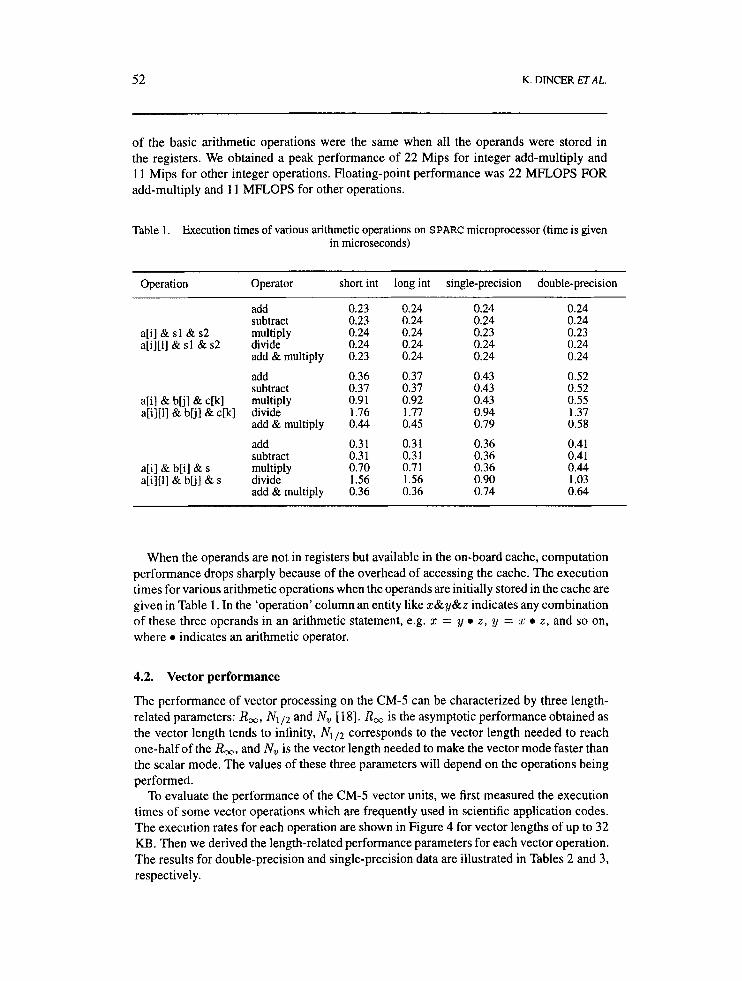
of the basic arithmetic operations were the same when all the operands were stored in the registers. We obtained a peak performance of 22 Mips for integer add-multiply and 1 1 Mips for other integer operations. Floating-point performance was 22 MFLOPS FOR add-multiply and 1 1 MFLOPS for other operations.
Table 1 . Execution times of various arithmetic operations on SPARC microprocessor (time is given in microseconds)
Operation Operator short int long int single-precision double-precision
add 0.23 0.24 0.24 0.24 subtract 0.23 0.24 0.24 0.24
a[i] & sl & s2 multiply 0.24 0.24 0.23 0.23 a[i][1] & sl & s2 divide 0.24 0.24 0.24 0.24
add & multiply 0.23 0.24 0.24 0.24
add 0.36 0.37 0.43 0.52 subtract 0.37 0.37 0.43 0.52
a[il & blil& c[k] multiply 0.9 1 0.92 0.43 0.55
add & multiply 0.44 0.45 0.79 0.58
add 0.3 1 0.3 1 0.36 0.41 subtract 0.3 1 0.3 1 0.36 0.41
a[i][l] & bu] & s divide 1.56 1.56 0.90 1.03 add & multiply 0.36 0.36 0.74 0.64
a[i][l] & blj] & c[k] divide 1.76 1.77 0.94 1.37
a[i] & b[i] & s multiply 0.70 0.7 1 0.36 0.44
When the operands are not in registers but available in the on-board cache, computation performance drops sharply because of the overhead of accessing the cache. The execution times for various arithmetic operations when the operands are initially stored in the cache are given in Table 1. In the ‘operation’ column an entity like x&y&z indicates any combination of these three operands in an arithmetic statement, e.g. x = y 0 z , y = z 0 z , and so on, where 0 indicates an arithmetic operator.
4.2. Vector performance
The performance of vector processing on the CM-5 can be characterized by three length- related parameters: R,, N , p and N , [ 181. R, is the asymptotic performance obtained as the vector length tends to infinity, N,/2 corresponds to the vector length needed to reach one-half of the R,, and N, is the vector length needed to make the vector mode faster than the scalar mode. The values of these three parameters will depend on the operations being performed.
To evaluate the performance of the CM-5 vector units, we first measured the execution times of some vector operations which are frequently used in scientific application codes. The execution rates for each operation are shown in Figure 4 for vector lengths of up to 32 KB. Then we derived the length-related performance parameters for each vector operation. The results for double-precision and single-precision data are illustrated in Tables 2 and 3, respectively.

BENCHMARKING THE CM-5 53
0 LI
m m
2 5
20
1 5
10
5
0
J d.+' A = B ' C -W- 1
_.-- I I I I I I I I
8 1 6 3 2 64 1 2 8 2 5 6 512 1 K 2K 4 K BK 16K 32K Message Length (Bytes)
Figure 4. Performance of vector units in one node for double-precision data
R , is important for estimating the peak performance. Double-precision operations are always faster than the single-precision ones, since vector unit registers are configured as 64- bit registers, and all the internal buses are 64-bit. Manipulating a scalar operand (operations 1 and 3) is faster compared to manipulating a vector operand (operations 2 and 4). This is because the scalar operand comes free, while the vector operands in operations 2 and 4 require a memory or cache access to load the corresponding vector into the vector registers.
Additions and multiplications give us about the same timings. Although addition is expected to be faster, cycle time is stretched to handle one addition, one multiplication or one add-multiply operation in a clock cycle. Therefore, a multiply-add operation gives twice the MFLOPS rate of a single add or multiply operation. N112 is a good measure of the impact of overhead. For finite vector lengths, a start-up
time is associated with each vector operation. N l j 2 parameterizes this start-up time. The use of vector units for processing of vectors shorter than N1/2 will result in significant loss in performance. We obtained large values for N,/2 which indicate that efficient use of vector units begins at large vector lengths on the CM-5. Nl/2 is longer for single-precision data than for double-precision data. This is, in fact, related to the higher MFLOPS rating of the double-precision data, as explained above.
N, measures both the overhead and the speed of scalars relative to vectors. The node processor can manipulate vectors of up to about 20 data items faster than the vector units can.

54 K. DINCER ETAL
Table 2. Length-related measures of vector performance for double-precision data
No. Operation
1 2 3 4 5 6
A(I) = B(I) + s A(I) = B(1) + C(1) A(I) = B(I) x s A(I) = B(1) x C(I) A(I) = s x B(I) + C(1) A(1) = B(I) x C(1) + D(I) x E(1)
One Node Performance R , N v
19.51 327 22 13.53 202 18 19.51 324 22 13.49 200 16 27.31 318 18 25.23 190 16
~~
Peak Rate (GFLOPS) 64-node 256-node 512-node
1.26 4.77 9.25 0.88 3.42 6.84 1.26 4.77 9.25 0.88 3.42 6.84 1.76 6.84 13.59 1.64 6.55 12.84
Table 3. Length-related measures of vector performance for single-precision data
No. Operation One node performance R , N l / z N , 64-node 256-node 512-node
Peak rate (GFLOPS)
1 A(I) = B(I) + s 11.17 214 20 0.7 1 2.86 5.52 2 A(I) = B(I) + C(I) 9.10 171 18 0.57 2.28 4.56 3 A(1) = B(1) x s 11.15 212 22 0.71 2.86 5.52 4 A(1) = B(I) x C(1) 9.05 170 20 0.58 2.28 4.77 5 A(I) = s x B(I) + C(1) 18.20 168 28 1.15 4.56 9.53 6 A(I) = B(1) x C(1) + D(1) x E(I) 19.82 160 20 1.25 4.92 9.83
Table 2 and 3 also show the achievable peak rate in gigaflops when the vectors are distributed across all the vector units. Peak performance figures indicate that, even for 512 nodes, the peak performance is close to the multiplication of the number of processors with the peak speed of a single node. This is a good indication of the scalability of vector processing capability. For these kinds of simple loops there is an insignificant amount of overhead, but it should not be forgotten that the overhead penalties encountered in real case problems may be much larger.
5. POINT-TO-POINT COMMUNICATION BENCHMARKS
In distributed-memory machines like the CM-5, data items are physically distributed among the node memories. Thus the performance of the communication primitives used to access non-local data is crucial. Point-to-point communication benchmarks measure basic com- munication properties of the CM-5 data network by performing the ping-pong test between a pair of nodes. The transmission time is recorded as half of the time of a round-trip message in the ping-pong test.
We used blocking sends and receives that transfer varying sizes of data blocks between two nodes. Both the source and the destination nodes take active parts in this exchange process, and the receiving node waits until it receives the last data byte from the data network.

BENCHMARKING THE CM-5 55
Regression analysis of the transmission time allows the calculation of the start-up time and the asymptotic bandwidth between a pair of nodes. The total transmission time T between two nodes can be formulated as
where 1 is the message length in bytes, tstart-uup is the time to set up the communication requirements, and tsend is the transfer time for one unit (byte) of data.
The asymptotic data transfer rate can be found approximately by taking the reciprocal of the transmission time (i.e. l/tsend.)
5.1. Nearest-neighbor communication
In this experiment we studied the communication time for sending a single message to another node in the same cluster of four nodes for different message sizes. This represents the shortest possible distance a message can travel. Figure 5 shows the communication time for messages of size 0-10 KB between two neighboring nodes on a 32-node CM-5. The communication time increases linearly with increasing message size. To establish a communication link between two nodes, a preliminary handshake is required. This sturt- up time is observed to be 84.65 ps. Using a linear chi-squared fit, we can model the communication time for aligned messages within a cluster of four processors as a function of message size:
T(1) = 84.65 + 0.117 x 1 p ~ . ( 1 )
The thick appearance of the curve in Figure 5 is because of the sawtooth effect caused by data alignment patterns. Figure 6 shows a smaller section (for message sizes of 320-576 bytes) of the previous graph to magnify this sawtooth effect. As indicated by dips in the curve, when the message length is a multiple of the byte size, the communication time goes down to a local minimum. On the CM-5, the unaligned message transfer is more costly than aligned message transfers, but the communication time differences between byte-aligned, word-aligned and double-word-aligned data are negligible. As stated earlier, each data packet contains 16 bytes of user data. Misalignment causes hardware complications since the memory is typically aligned on a word boundary. A misaligned memory access will be performed, therefore, by using several aligned memory accesses. In addition, since the network interface accepts only word and double-word writes, odd-sized buffers cannot be moved efficiently into the data registers.
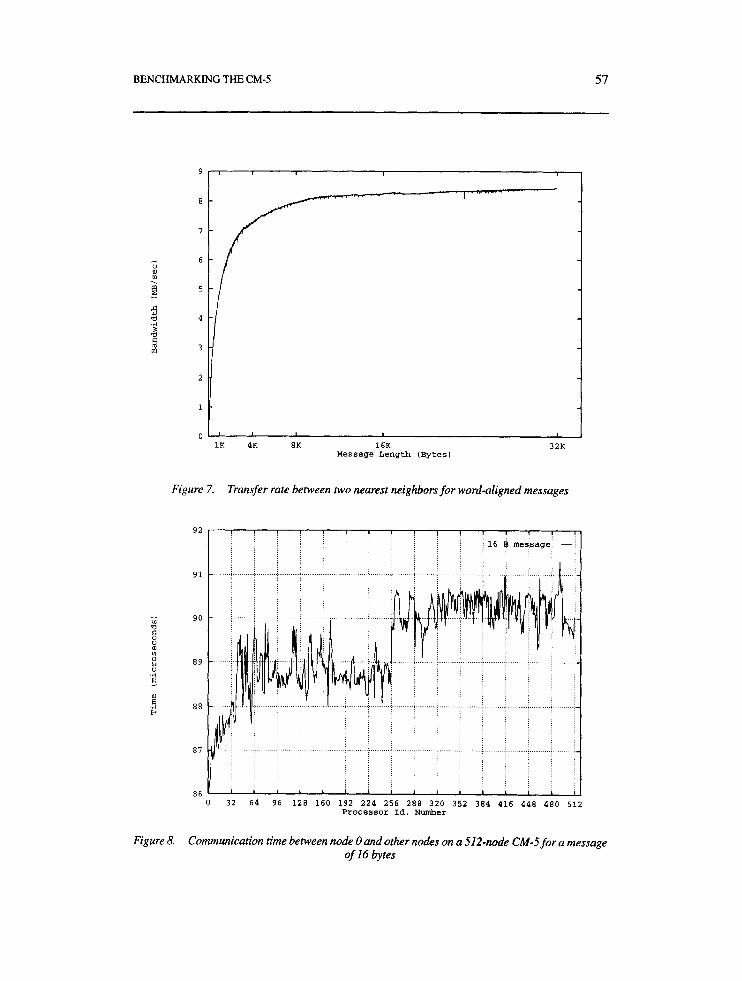
We studied the maximum bandwidth that can be sustained for a single message travelling to the shortest possible distance for message sizes up to 32 Kbytes. Figure 7 illustrates that the transfer rate (approximately l / t send) for an aligned buffer is x 8.5 MB/s. This bandwidth is significantly lower than the theoretical peak bandwidth of 20 MB/s. In the current CMMD implementation, a node’s ability to inject data into the network is much less than the network’s capacity to accept the data[8]. Assembler codes can achieve close to 18 MB/sec moving data from one node’s registers to another’s[l9]. However C codes with calls to the CMMD library tend to run slower, partly because the C compiler’s output is never as efficient as a hand-crafted assembler code.

56 K. DINCER ETAL.
1.4
1.2
1
a" 0
P) 0 4 rl d . P i
0.8
E 0.6 - $ -4
0.4
0.2
0 I I 1 I I I I 512 1K 2K Message 4K Length (Bytes) 8K 1 OK
Figure 5. Communication time between two nearest-neighbor nodes as a function of message size
155
150
145 - 4 8 a P) 140
0 -4 135 - 130
125
120
320 336 352 368 384 400 416 432 448 464 480 496 512 528 544 560 576 Message Length (Bytes)
Figure 6. Communication time between two nearest-neighbor nodes for message sizes of 320-576B
BENCHMARKING THE CM-5 57
9
2
1
0 , I I I I
1K 4K 8K 16K 3 2K Message Length (Bytes)
Figure 7. Transfer rate between two nearest neighbors for word-aligned messages
9 2
91
8 8 3 .rl
87
8 6
I I I I I I I
16 p message -
. . . . . . . . . . . . . . . . . . . . . . . . . .
.................. . ,...... ! . . . i ..... . . . . . . . . . . . . . . . . . . . . ........,....... < . .
. . . . . , . . . . . . .
, ' , ' ' I L
0 32 6 4 96 1 2 8 160 1 9 2 2 2 4 2 5 6 2 8 8 3 2 0 352 3 8 4 416 4 4 8 480 512 Processor Id. Number
Figure 8. Communication time between node 0 and other nodes on a 512-node CM-5 for a message of 16 bytes

58 K. DINCER ETAL.
211
210
209
208
207
206
205
204
203
202 0 32 64 96 128 160 192 224 256 288 320 352 384 416 448 480 512
Processor Id. Number
Figure 9. Communication time between node 0 and other nodes on a SI2-node CM-Sfor a message of 1 Kilobyte
5.2.
In this Section we examine how the communication between any two nodes compares with the communication between two nearest neighbors. We measured the communica- tion time from node 0 to every other node using the same strategy as in the previous Section. Figures 8 and 9 show the effect of distance on the communication time on a 512-node CM-5 for message sizes of 16 bytes and 1 Kbyte, respectively. If we ignore the spikes related to noise in the network, it can be observed that the communication time is not significantly affected by the internode distance. Each time another level of the fat-tree topology is traversed, there is a slight increase in time (z 1 ps). This is due to the cost of traversing an extra switch in the data network, i.e. the cost of the extra hop needed.
The transmission time difference between the nearest neighbor and the neighbor at the maximum distance is less than 5 ps on a 512-node CM-5. The results are consistent for both short (16 bytes) and long messages (1 Kbyte).
Effect of distance on communication
6. GLOBAL COMMUNICATION BENCHMARKS
The CM-5 hardware supports a rich set of global (co-operative) operations. Global op- erations involve any data transfer among nodes, possibly with an arithmetic or logical computation on the data while they are being transferred. Global communication patterns, such as reduction, broadcast, concatenation or synchronization, are very important in the implementation of high-level language constructs for distributed-memory machines.
BENCHMARKING THE CM-5 59
We measured the performance of the communication networks by using a set of bench- mark programs employing the global operations provided by the CM-5 hardware.
6.1. Scans
A scan (parallel prefix) operation creates a running tally of results in each processor in the order of the processor identifier. Assuming that the A [ j 1 represents the element A in the j th processor and R [ j ] represents the result R in the j th processor, an inclusive scan with a summation operator performs the following operation:
i
R[i] = X A b ] , 0 5 i < Nzmber--of-Pr-ocessor-s - 1 j=O
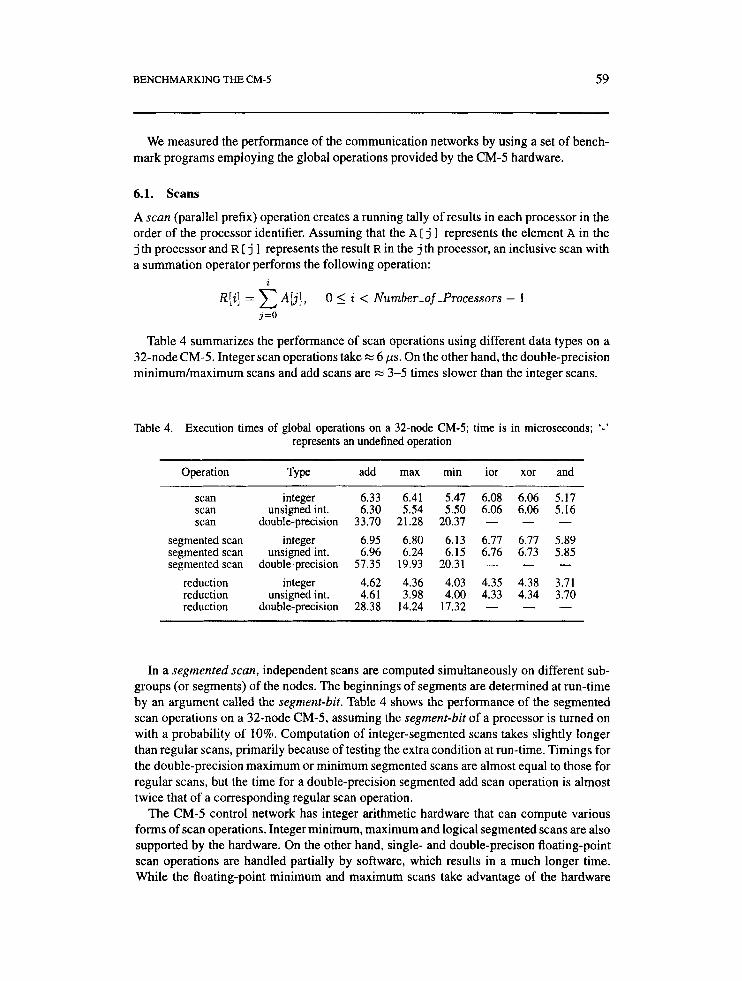
Table 4 summarizes the performance of scan operations using different data types on a 32-node CM-5. Integer scan operations take x 6 ps. On the other hand, the double-precision minimum/maximum scans and add scans are M 3-5 times slower than the integer scans.
Table 4. Execution times of global operations on a 32-node CM-5; time is in microseconds; '-' represents an undefined operation
Operation ?LPe add max min ior xor and ~
scan scan SCan
segmented scan segmented scan segmented scan
reduction reduction reduction
integer unsigned int.
double-precision integer
unsigned int. double- preci sion
integer unsigned int.
double-precision
6.33 6.30
33.70 6.95 6.96
57.35 4.62 4.61
28.38
6.41 5.54
21.28 6.80 6.24
19.93 4.36 3.98
14.24
5.47 6.08 5.50 6.06
20.31 - 6.13 6.77 6.15 6.76
4.03 4.35 4.00 4.33
20.31 -
17.32 -
6.06 6.06
6.77 6.73
4.38 4.34
-
-
~ ~~
5.17 5.16
5.89 5.85
-
- 3.71 3.70
In a segmented scan, independent scans are computed simultaneously on different sub- groups (or segments) of the nodes. The beginnings of segments are determined at run-time by an argument called the segment-bit. Table 4 shows the performance of the segmented scan operations on a 32-node CM-5, assuming the segment-bit of a processor is turned on with a probability of 10%. Computation of integer-segmented scans takes slightly longer than regular scans, primarily because of testing the extra condition at run-time. Timings for the double-precision maximum or minimum segmented scans are almost equal to those for regular scans, but the time for a double-precision segmented add scan operation is almost twice that of a corresponding regular scan operation.
The CM-5 control network has integer arithmetic hardware that can compute various forms of scan operations. Integer minimum, maximum and logical segmented scans are also supported by the hardware. On the other hand, single- and double-precison floating-point scan operations are handled partially by software, which results in a much longer time. While the floating-point minimum and maximum scans take advantage of the hardware

60 K. DINCER ETAL.
partially, the floating-point add scan is performed almost completely by the software. This is the reason add scans and segmented scans are so costly.
6.2. Reductions
A reduction operation takes an input value from each node, applies a global operation such as summation, minimum or bitwise xor on all the values, and returns the result to all other nodes.
We measured the speed of combining subnetworks for various types of reduction oper- ations (Table 4). Double-precision reduction operations take four to six times longer than integer reductions. Again, this can be explained by the same reasons described above.
6.3. Concatenation
Some computations on distributed data structures require that each processor receive data from all the other processors. For example, in the classical N-body algorithm, every particle interacts with every other particle. Concatenation is a cumulative operation that appends a value from each processor to the values of all the preceding processors in processor identifier order.
Assume that there are P processors, and B = N / P data elements of a large vector are dis- tributed among these processors so that processor p contains a vector V,, [p . B. . . ( p+ 1 ) B- 1 ] . The global concatenate operation stores the resultant vector V [ 0 . . . N- 1 ] i n every node.
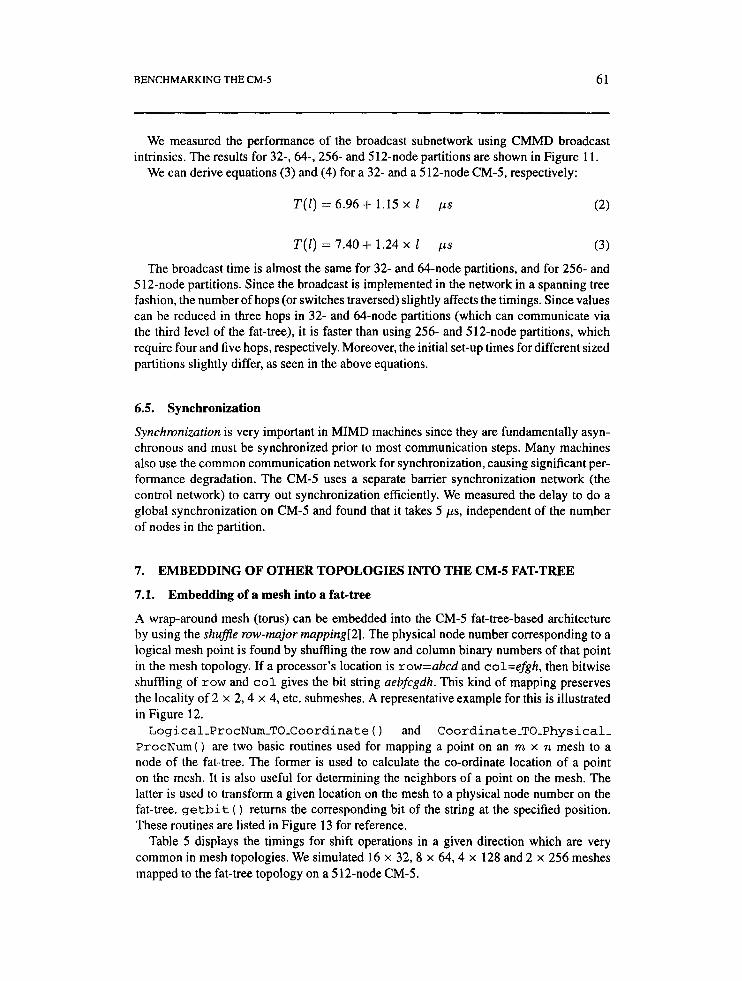
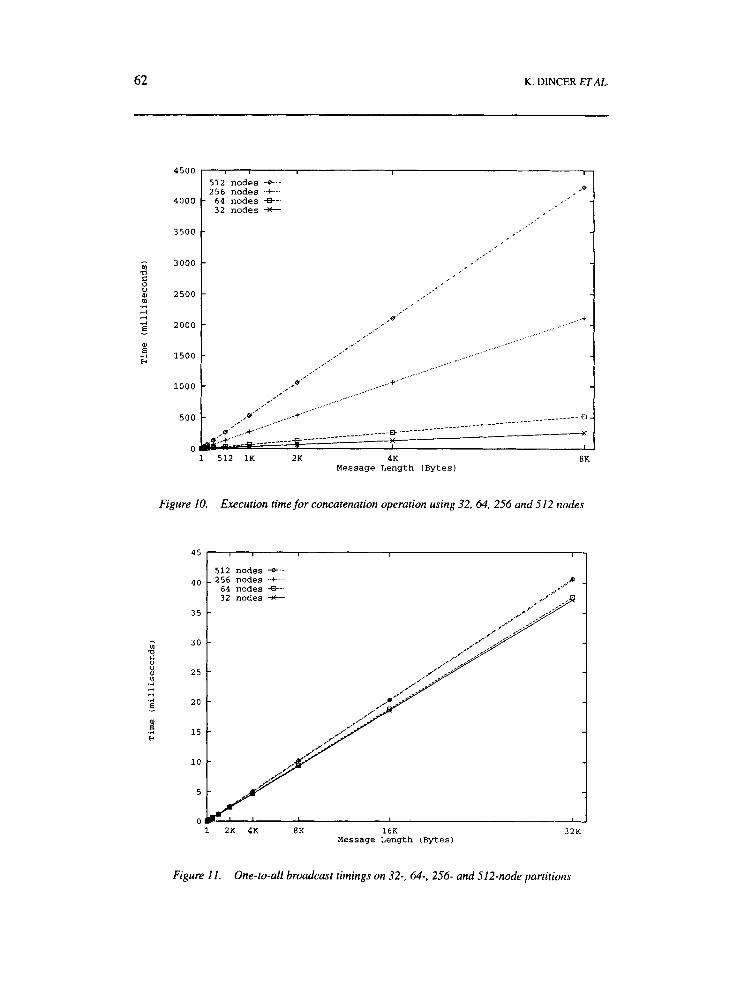
We tested the effects of message size and number of processors on the concatenation operation execution time. Figure 10 shows the time required for the concatenation operation using 32-, 64-, 256- and 512-node partitions. We can derive the following equation for the concatenation operation:
T(1,P) = 23.44 + 0.975 x ( P x 1 ) ps
where p is the number of processors in that partition and 1 is the size of the local portion of the data to be concatenated. Note that time for concatenation depends only on P for its contribution to the message size, and the operation is itself independent of P.
From Figure 10 it is clear that the time for concatenation on 512 nodes is about 16 times larger than the time on 32 nodes, which may be surprising when compared to scan operations. The amount of data sent by each node is about N data items, which leads to N x P data items in the network and may cause congestion in the network, especially for large messages. Therefore, as the message length and number of processes increase, the horizontal distance between the lines increases.
6.4. One-to-all broadcast
When we use SPMD-style programming, one of the basic types of communication is to broadcast a value from one node to all the other nodes. For example, spreading a row to all other rows is a common operation in LU decomposition and many other linear algebra computations. On the CM-5 any node can broadcast a buffer of a specified length to all other nodes within the partition.
BENCHMARKING THE CM-5 61
We measured the performance of the broadcast subnetwork using CMMD broadcast intrinsics. The results for 32-, 64-, 256- and 512-node partitions are shown in Figure 11.
We can derive equations (3) and (4) for a 32- and a 5 12-node CM-5, respectively:
T(Z) = 6.96 + 1.15 x 1 ps
T(Z) = 7.40 + 1.24 x 1 ps (3) The broadcast time is almost the same for 32- and 64-node partitions, and for 256- and
512-node partitions. Since the broadcast is implemented in the network in a spanning tree fashion, the number of hops (or switches traversed) slightly affects the timings. Since values can be reduced in three hops in 32- and 64-node partitions (which can communicate via the third level of the fat-tree), it is faster than using 256- and 512-node partitions, which require four and five hops, respectively. Moreover, the initial set-up times for different sized partitions slightly differ, as seen in the above equations.
6.5. Synchronization
Synchronization is very important in MIMD machines since they are fundamentally asyn- chronous and must be synchronized prior to most communication steps. Many machines also use the common communication network for synchronization, causing significant per- formance degradation. The CM-5 uses a separate barrier synchronization network (the control network) to carry out synchronization efficiently. We measured the delay to do a global synchronization on CM-5 and found that it takes 5 ps, independent of the number of nodes in the partition.
7. EMBEDDING OF OTHER TOPOLOGIES INTO THE CM-5 FAT-TREE
7.1.
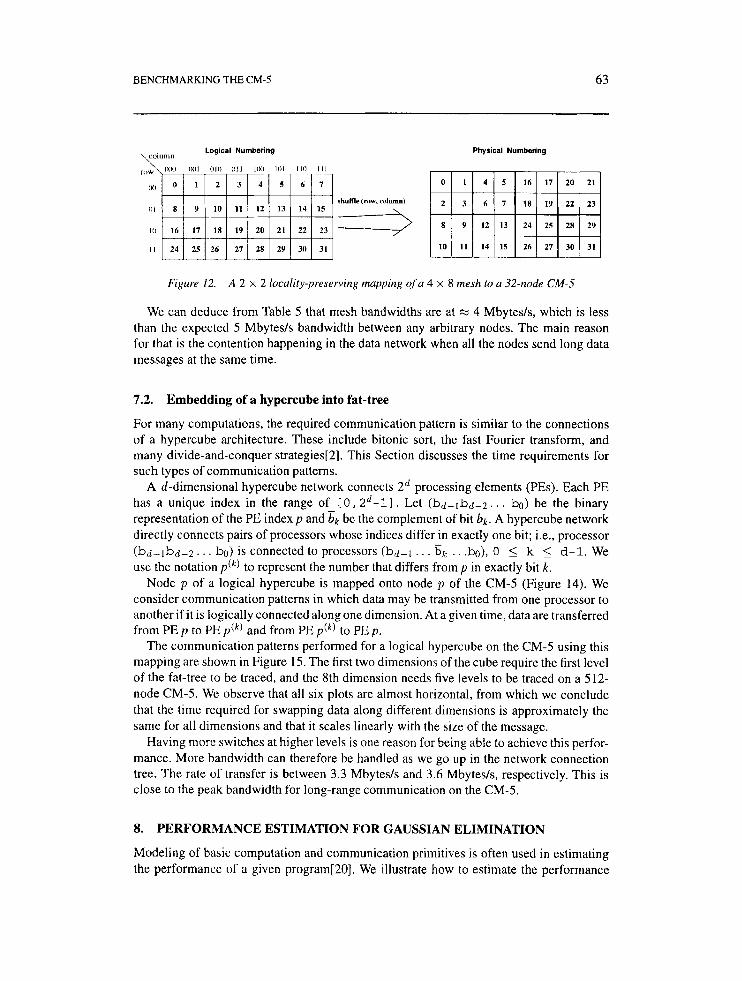
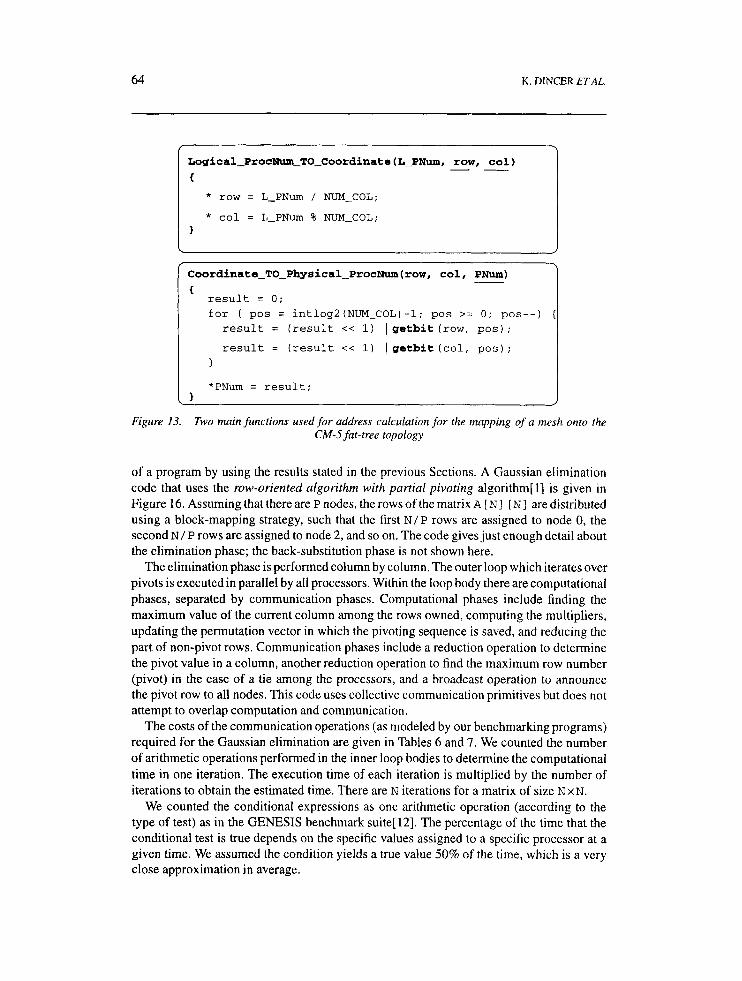
A wrap-around mesh (torus) can be embedded into the CM-5 fat-tree-based architecture by using the shuffle row-major rnapping[2]. The physical node number corresponding to a logical mesh point is found by shuffling the row and column binary numbers of that point in the mesh topology. If a processor’s location is row=abcd and col=efgh, then bitwise shuffling of row and c o l gives the bit string aebfcgdh. This kind of mapping preserves the locality of 2 x 2,4 x 4, etc. submeshes. A representative example for this is illustrated in Figure 12. Logical-ProcNum-TO-Coordinate ( ) and Coordinate-TO-Physical-
ProcNum ( ) are two basic routines used for mapping a point on an m x n mesh to a node of the fat-tree. The former is used to calculate the co-ordinate location of a point on the mesh. It is also useful for determining the neighbors of a point on the mesh. The latter is used to transform a given location on the mesh to a physical node number on the fat-tree. g e t b i t ( ) returns the corresponding bit of the string at the specified position. These routines are listed in Figure 13 for reference.
Table 5 displays the timings for shift operations in a given direction which are very common in mesh topologies. We simulated 16 x 32, 8 x 64,4 x 128 and 2 x 256 meshes mapped to the fat-tree topology on a 512-node CM-5.
Embedding of a mesh into a fat-tree
62 K. DINCER ETAL.
4500
4000
3500
3000 $ 5 P 2500
Q
e 5 1500
1000
500
0
I 1 I I I
,e 512 nodes -0.- 256 nodes -+---- 64 nodes +--- 32 nodes *
..... .....' ,9' ...... ,._..--. ...- .... ....-
512 1K 2K 4K Message Length (Bytes)
8K
Figure 10. Execution time for concatenation operation using 32, 64, 256 and 512 nodes
45
40
3 5
30 - B
al 25 Lo
.r( rl 4
.* 20 1
15 I .r( E
1 0
5
1 2K 4K EK 16K Message Length (Bytes)
32K
Figure 11. One-to-all broadcast timings on 32-, 64-, 256- and 512-node partitions
BENCHMARKING THE CM-5 63
\column Logical Numbering Physical Numbering
010 I l l I 1(Xl 101 I 1 0 I I 1
2 18 I 9 22 23 shuffle (row( cdumn)
1
Figure 12. A 2 x 2 locality-preserving mapping of a 4 x 8 mesh to a 32-node CM-5
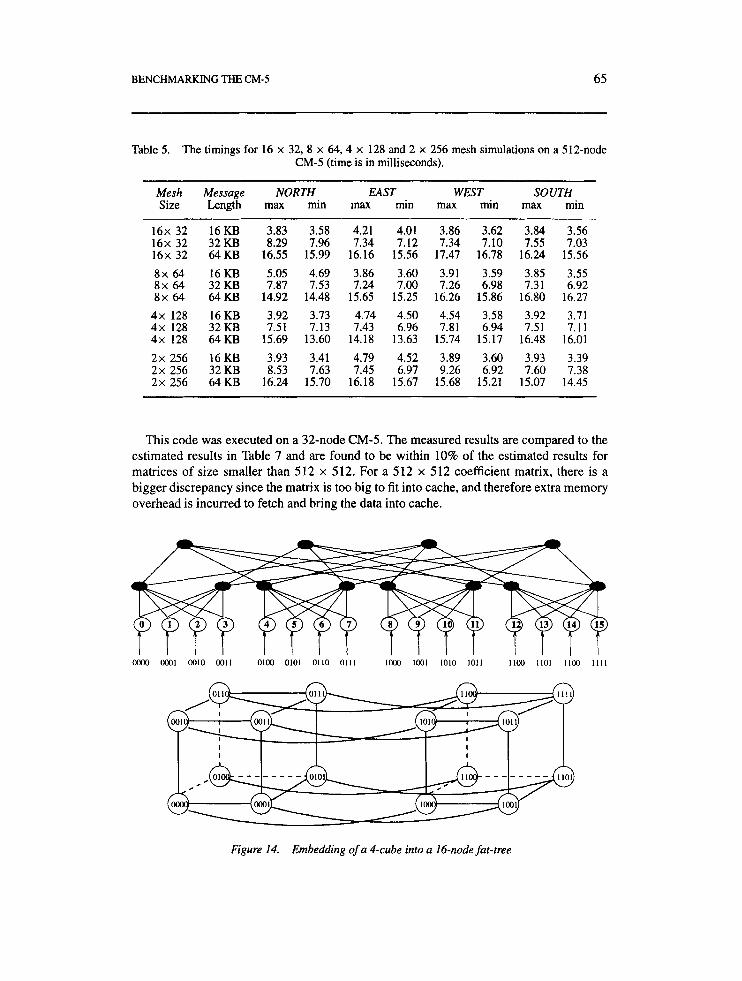
We can deduce from Table 5 that mesh bandwidths are at M 4 Mbytesls, which is less than the expected 5 Mbytesls bandwidth between any arbitrary nodes. The main reason for that is the contention happening in the data network when all the nodes send long data messages at the same time.
7.2. Embedding of a hypercube into fat-tree
For many computations, the required communication pattern is similar to the connections of a hypercube architecture. These include bitonic sort, the fast Fourier transform, and many divide-and-conquer strategies[2]. This Section discusses the time requirements for such types of communication patterns.
A d-dimensional hypercube network connects 2* processing elements (PEs). Each PE has a unique index in the range of [0,2'-11. Let ( b d - 1 b d - 2 . . . bo) be the binary representation of the PE index p and bk be the complement of bit bk. A hypercube network directly connects pairs of processors whose indices differ in exactly one bit; i.e., processor ( b d - l b d - 2 . . . bo) is connected to processors (bd-1 . . . bk . . .bo), 0 5 k 5 d-1. We use the notation p ( k ) to represent the number that differs fromp in exactly bit k.
Node p of a logical hypercube is mapped onto node p of the CM-5 (Figure 14). We consider communication patterns in which data may be transmitted from one processor to another if it is logically connected along one dimension. At a given time, data are transferred from PE p to PE p ( k ) and from PE p @ ) to PE p .
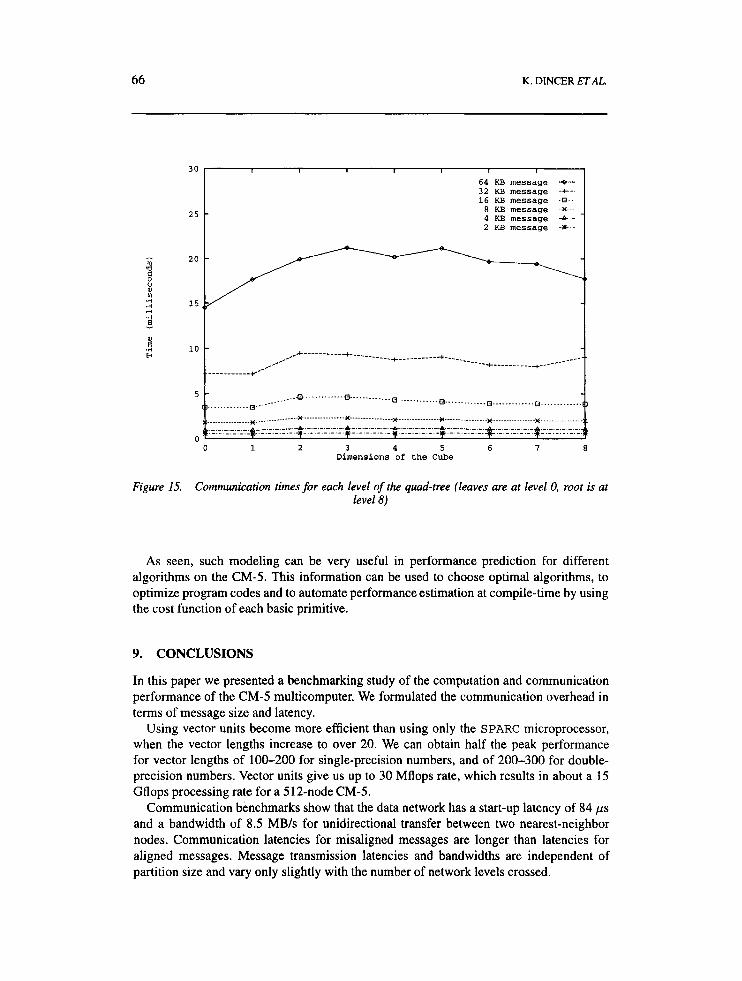
The communication patterns performed for a logical hypercube on the CM-5 using this mapping are shown in Figure 15. The first two dimensions of the cube require the first level of the fat-tree to be traced, and the 8th dimension needs five levels to be traced on a 512- node CM-5. We observe that all six plots are almost horizontal, from which we conclude that the time required for swapping data along different dimensions is approximately the same for all dimensions and that it scales linearly with the size of the message.
Having more switches at higher levels is one reason for being able to achieve this perfor- mance. More bandwidth can therefore be handled as we go up in the network connection tree. The rate of transfer is between 3.3 Mbytesls and 3.6 Mbytesls, respectively. This is close to the peak bandwidth for long-range communication on the CM-5.
-
8.
Modeling of basic computation and communication primitives is often used in estimating the performance of a given program[20]. We illustrate how to estimate the performance
PERFORMANCE ESTIMATION FOR GAUSSIAN ELIMINATION
64 K. DlNCER ETAL.
I \ Coordinate-TO-Physical-Procm(row, col, PNum)
{ ___
result = 0; for ( pos = intlog2(NUM_COL)-l; pos >= 0 ; pos--) (
result = (result << 1) 1 getbit (row, pos); result = (result << 1) I getbit(co1, p o s ) ;
i Logical-ProcNum_TO-Coordinate(L-PNum, row, col) - - I { I * row = L-PNum / "M-COL; I
* col = L-PNum % NUM-COL; I ]
Figure 13. Two main functions used for address calculation for the mapping of a mesh onto the CM-5 fat-tree topology
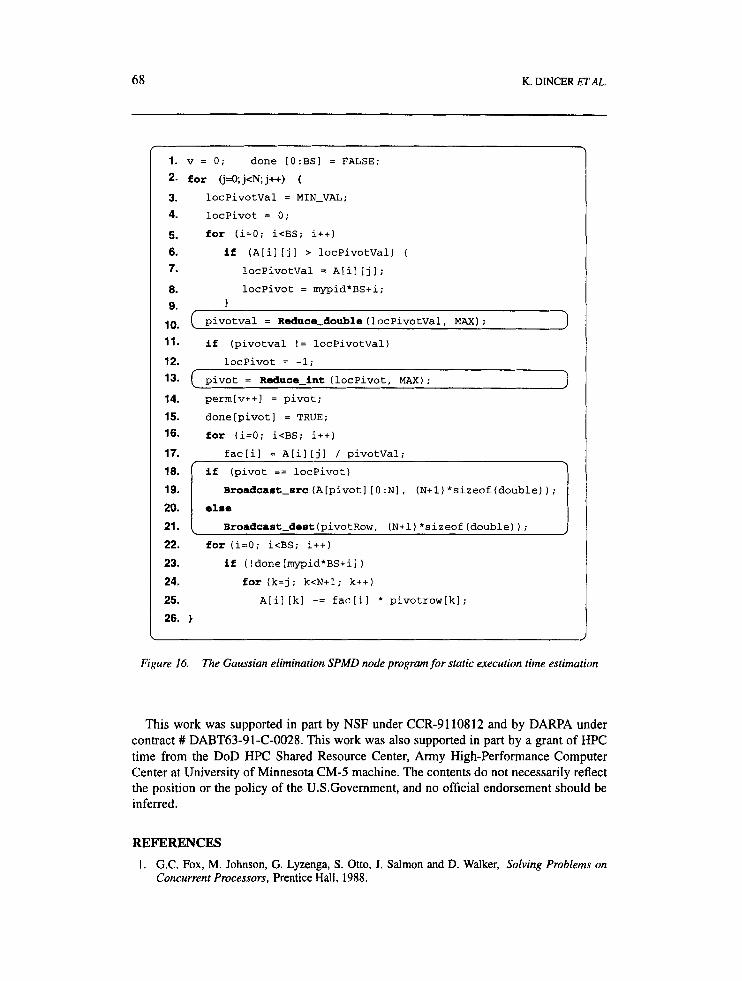
of a program by using the results stated in the previous Sections. A Gaussian elimination code that uses the row-oriented algorithm with partial pivoting algorithm[ 11 is given in Figure 16. Assuming that thereare P nodes, the rows ofthe matrix A IN] "1 aredistributed using a block-mapping strategy, such that the first N/P rows are assigned to node 0, the second N/ P rows are assigned to node 2, and so on. The code gives just enough detail about the elimination phase; the back-substitution phase is not shown here.
The elimination phase is performed column by column. The outer loop which iterates over pivots is executed in parallel by all processors. Within the loop body there are computational phases, separated by communication phases. Computational phases include finding the maximum value of the current column among the rows owned, computing the multipliers, updating the permutation vector in which the pivoting sequence is saved, and reducing the part of non-pivot rows. Communication phases include a reduction operation to determine the pivot value in a column, another reduction operation to find the maximum row number (pivot) in the case of a tie among the processors, and a broadcast operation to announce the pivot row to all nodes. This code uses collective communication primitives but does not attempt to overlap computation and communication.
The costs of the communication operations (as modeled by our benchmarking programs) required for the Gaussian elimination are given in Tables 6 and 7. We counted the number of arithmetic operations performed in the inner loop bodies to determine the computational time in one iteration. The execution time of each iteration is multiplied by the number of iterations to obtain the estimated time. There are N iterations for a matrix of size NxN.
We counted the conditional expressions as one arithmetic operation (according to the type of test) as in the GENESIS benchmark suite[ 121. The percentage of the time that the conditional test is true depends on the specific values assigned to a specific processor at a given time. We assumed the condition yields a true value 50% of the time, which is a very close approximation in average.
BENCHMARKING THE CM-5 65
Table 5. The timings for 16 x 32, 8 x 64,4 x 128 and 2 x 256 mesh simulations on a 512-node CM-5 (time is in milliseconds).
Mesh Message NORTH EAST WEST SOUTH Size Length rnax min rnax min max min max min
16x 32 16KB 3.83 3.58 4.21 4.01 3.86 3.62 3.84 3.56 16x 32 32KB 8.29 7.96 7.34 7.12 7.34 7.10 7.55 7.03 16x 32 64KB 16.55 15.99 16.16 15.56 17.47 16.78 16.24 15.56 8x 64 16KB 5.05 4.69 3.86 3.60 3.91 3.59 3.85 3.55 8x 64 32KB 7.87 7.53 7.24 7.00 7.26 6.98 7.31 6.92 8x 64 64KB 14.92 14.48 15.65 15.25 16.26 15.86 16.80 16.27 4x 128 16KB 3.92 3.73 4.74 4.50 4.54 3.58 3.92 3.71 4x 128 32KB 7.51 7.13 7.43 6.96 7.81 6.94 7.51 7.11 4x 128 64KB 15.69 13.60 14.18 13.63 15.74 15.17 16.48 16.01 2x 256 16KB 3.93 3.41 4.79 4.52 3.89 3.60 3.93 3.39 2x 256 32KB 8.53 7.63 7.45 6.97 9.26 6.92 7.60 7.38 2x 256 64KB 16.24 15.70 16.18 15.67 15.68 15.21 15.07 14.45
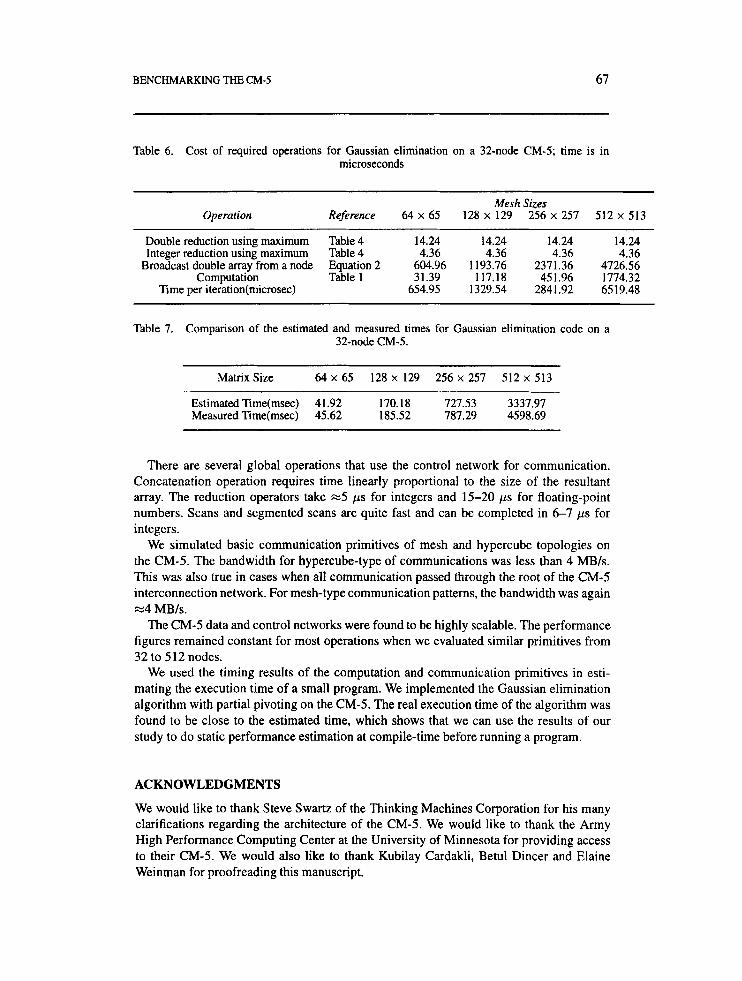
This code was executed on a 32-node CM-5. The measured results are compared to the estimated results in Table 7 and are found to be within 10% of the estimated results for matrices of size smaller than 512 x 512, For a 512 x 512 coefficient matrix, there is a bigger discrepancy since the matrix is too big to fit into cache, and therefore extra memory overhead is incurred to fetch and bring the data into cache.
oooo (xx)I 00IO 0011 0100 0101 0110 0111 I(K)o 1001 1010 1011 1100 1101 1 1 0 0 I l l 1
A n n n
Figure 14. Embedding of a 4-cube into a 16-node fat-tree
66 K. DINCER ETAL.
30 I I I I I I , I 1
I 2 5
64 KB message 4- 32 KB message -+- 16 KB message .D . 8 KB message X 4 KB message 8-
2 KB message -* -
0 0 1 2 3 4 5 6 7 8
Dimensions of the Cube
Figure I S . Communication times for each level of the quad-tree (leaves are at level 0, root is at level 8)
As seen, such modeling can be very useful in performance prediction for different algorithms on the CM-5. This information can be used to choose optimal algorithms, to optimize program codes and to automate performance estimation at compile-time by using the cost function of each basic primitive.
9. CONCLUSIONS
In this paper we presented a benchmarking study of the computation and communication performance of the CM-5 multicomputer. We formulated the communication overhead in terms of message size and latency.
Using vector units become more efficient than using only the S PARC microprocessor, when the vector lengths increase to over 20. We can obtain half the peak performance for vector lengths of 100-200 for single-precision numbers, and of 200-300 for double- precision numbers. Vector units give us up to 30 Mflops rate, which results in about a 15 Gflops processing rate for a 5 12-node CM-5.
Communication benchmarks show that the data network has a start-up latency of 84 p s and a bandwidth of 8.5 MB/s for unidirectional transfer between two nearest-neighbor nodes. Communication latencies for misaligned messages are longer than latencies for aligned messages. Message transmission latencies and bandwidths are independent of partition size and vary only slightly with the number of network levels crossed.
BENCHMARKING THE CM-5 67
Table 6. Cost of required operations for Gaussian elimination on a 32-node CM-5; time is in microseconds
Mesh Sizes Operation Reference 64 x 65 128 x 129 256 x 257 512 x 513
Double reduction using maximum Table 4 14.24 14.24 14.24 14.24 Integer reduction using maximum Table 4 4.36 4.36 4.36 4.36
Broadcast double array from a node Equation 2 604.96 1193.76 2371.36 4726.56 Computation Table 1 3 1.39 117.18 451.96 1774.32
Time per iteration(microsec) 654.95 1329.54 2841.92 6519.48
Table 7. Comparison of the estimated and measured times for Gaussian elimination code on a 32-node CM-5.
~ ~
Matrix Size 64 x 65 128 x 129 256 x 257 512 x 513
Estimated Time(msec) 41.92 170.18 727.53 3337.97 Measured Time(msec) 45.62 185.52 787.29 4598.69
There are several global operations that use the control network for communication. Concatenation operation requires time linearly proportional to the size of the resultant array. The reduction operators take 225 ps for integers and 15-20 ps for floating-point numbers. Scans and segmented scans are quite fast and can be completed in 6-7 ps for integers.
We simulated basic communication primitives of mesh and hypercube topologies on the CM-5. The bandwidth for hypercube-type of communications was less than 4 MB/s. This was also true in cases when all communication passed through the root of the CM-5 interconnection network. For mesh-type communication patterns, the bandwidth was again x 4 MB/s.
The CM-5 data and control networks were found to be highly scalable. The performance figures remained constant for most operations when we evaluated similar primitives from 32 to 512 nodes.
We used the timing results of the computation and communication primitives in esti- mating the execution time of a small program. We implemented the Gaussian elimination algorithm with partial pivoting on the CM-5. The real execution time of the algorithm was found to be close to the estimated time, which shows that we can use the results of our study to do static performance estimation at compile-time before running a program.
ACKNOWLEDGMENTS
We would like to thank Steve Swartz of the Thinking Machines Corporation for his many clarifications regarding the architecture of the CM-5. We would like to thank the Army High Performance Computing Center at the University of Minnesota for providing access to their CM-5. We would also like to thank Kubilay Cardakli, Betul Dincer and Elaine Weinman for proofreading this manuscript.
68 K. DINCER ETAL.
~~
1. v = 0; done [O:BS] = FALSE; 2. for ('j=O;jcN;j++) {
3. 1ocPivotVal = MIN-VAL; 4. locpivot = 0;
5. for (i=O; i<BS; i++)
6. if (A[i][jl > 1ocPivotVal) {
7. 1ocPivotVal = A[il [j 1 ; 8. locpivot = mypid*BS+i; 9. 1
11. if (pivotval ! = locpivotval)
12. locPivot = -1;
pivotval = Reduce-double (locPivotVa1, MAX) ;
13. [ Divot = Reduce-int (locPivot, MAX); 1 14. 15. 16.
17.
18.
19.
20.
21.
22.
23.
24.
25.
26.
perm[v++] = pivot;
done[pivotl = TRUE; for (i=O; i<BS; i++)
fac[i] = A[i] [j] / pivotval; if (pivot == locpivot)
Broadcast-arc(A[pivot] [O:N], (N+l)*sizeof(double)); [..- Broadcast-deot(pivotRow, (N+l)*sizeof(double));
for(i=O; i<BS; i++) i f (!done[mypid*BS+il)
for (k=j; k<N+1; k++)
A[i] [k] -= fac[il * pivotrow[kl; 1
Figure 16. The Gaussian elimination SPMD node program for static execution time estimation
This work was supported in part by NSF under CCR-91108 12 and by DARPA under contract # DABT63-91-C-0028. This work was also supported in part by a grant of HPC time from the DoD HPC Shared Resource Center, Army High-Performance Computer Center at University of Minnesota CM-5 machine. The contents do not necessarily reflect the position or the policy of the U.S.Government, and no official endorsement should be inferred.
REFERENCES 1. G.C. Fox, M. Johnson, G. Lyzenga, S. Otto, J. Salmon and D. Walker, Solving Problems on
Concurrent Processors, Prentice Hall, 1988.
BENCHMARKING THE CM-5 69
2.
3.
4.
5.
6.
7.
8.
9.
10.
11.
12.
13.
14. 15. 16.
17. 18.
19. 20.
S. Ranka and S . Sahni, Hypercube Algorithms with Applications to Image Processing and Pattern Recognition (Bilkent University Lecture Series), Springer-Verlag, 1990. L. Bomans and D. Roose, ‘Benchmarking the IPSC/2 hypercube multiprocessor’, Concurrency: Pract. Exp., 1, ( I ) , 3-18 (1989). Z. Bozkus, S. Ranka and G.C. Fox, ‘Benchmarking the CM-5 multicomputer’, in Proc. of 4th Symp. on the Frontiers of Massively Parallel Computation, 1992, pp. 100-107. R. W. Hockney, ‘Performance parameters and benchmarking of supercomputers’, Parallel Comput., 17, (10-11), 1111-1130(1991). T.T. Kwan, B.K. Totty and D.A. Reed, ‘Communication and computation performance of the CM-5’, in Proc. of Supercomputing 1993, pp. 192-201. C.E. Leiserson et al., ‘The network architecture of the connection machine CM-5’, in Proc. of Parallel Algorithms and Architectures Symposium, 1992, pp. 272-285. M. Lin, R. Tsang, D.H.C. Du, A. E. Klietz and S. Saroff, ‘Performance evaluation of the CM-5 interconnection network’, in Proc. of Spring COMPCON 93, 1993. R. Ponnusamy, R. Thakur, A. Choudhary, K. Velamakanni, Z. Bozkus and G.C. Fox, ‘Exper- imental performance evaluation of the CM-5’, J. Parallel Distrib. Comput., 19, (3), 192-202 (1993). D.H. Bailey, E. Barszcz, J.T. Barton, D.S. Browning, R.L. Carter, L. Dagum, R.A. Fatoohi, P.O. Frederickson, T.A. Lasinski, R.S. Schreiber, D.H. Simon, V. Venkatakrishnan and W. Weer- atunga, ‘The NAS parallel benchmarks’, Int. J. Supercomput. Appl., 5 , (3), 63-73 (1991). M. Berry, D. Chen, P. Koss, D. Kuck, S. Lo, Y. Pang, L. Pointer, R. Roloff, A. Sameh, E. Clementi, S. Chin, D. Schneider, G. Fox, P. Messina, D. Walker, C. Hsiung, J . Schwarzmeier, K. Lue, S. Orszag, F. Seidl, 0. Johnson, R. Goodrum and J. Martin, ‘The PERFECT club benchmarks: Effective performance evaluation of supercomputers’, Int. J. Supercornput. A&., 3, (3), 5-40 (1989). A.J.G. Hey, ‘The GENESIS distributed-memory benchmarks’, Parallel Cornput., 17, (10-1 l), 1275-1283 (1991). P. Messina, C. Baillie, E. Felten, P. Hipes, R. Williams, A. Alagar, A. Kamrath, R. Leary, W. Pfeif- fer, J. Rogers and D. Walker, ‘Benchmarking advanced architecture computers’, Concurrency: Pract. Exp., 2, (3), 195-256 (1990). Thinking Machines Corporation, CM Fortran Programming Guide, 1993. Thinking Machines Corporation, CMMD Reference ManuaZ, Version 3.0, 1993. T. Von Eicken, D. Culler, S. Goldstein and K. Schauser, ‘Active messages: A mechanism for integrated communication and computation’, in Proc. of the 19th International Symposium on Computer Architecture, 1992, pp. 256-266. Thinking Machines Corporation, Connection Machine CM-5 Technical Summary, 1993. J. L. Hennesy and D. Patterson, Computer Architecture: A Quantitative Approach, Morgan Kaufmann, 1990. S. Swartz, Thinking machines corporation, Personal communications, 1992. W. Wu, M.-Y.and Shu, ‘Performance estimation of Gaussian-elimination on the Connection Machine’, 1989 h t . Con$ on Parallel Processing, 1989, pp. 18 1-1 84.