Embed Size (px)
Citation preview

Who is TOD inMetro Denver?
Employee SurveyReport
April 2010
Benchmarking the Evolution of TOD in Metro Denver
Who is TOD in Metro Denver? Employee Survey Report April 2010
Page 1
Preparation of this report has been financed in part through grants from the U.S. Department of Transportation, Federal Transit Administration and Federal Highway Administration.
Acknowledgments______________________________
Special thanks to the public- and private-sector financial contributors.
Arapahoe County
City of Arvada
City of Boulder
City of Centennial
City of Commerce City
City and County of Denver
City of Englewood
City of Lakewood
City of Louisville
Colorado Department of Local Affairs, Division of Housing
Regional Transportation District
Thornton Gateway Property, LLC
City of Thornton
City of Westminster
City of Wheat Ridge
Research Conducted by:
3005 30th Street • Boulder, Colorado 80301 • t: 303-444-7863 • f: 303-444-1145 • www.n-r-c.com
Who is TOD in Metro Denver? Employee Survey Report April 2010
Page 2
Survey Background ........................................................................................................................... 8
Table of Contents________________________________
Study Purpose ............................................................................................................................. 8 Study Methods ............................................................................................................................ 8
Survey Stratification .............................................................................................................. 9 Weighting the Data ............................................................................................................ 11 Representativeness of the Results ....................................................................................... 11 How the Results Are Reported ............................................................................................. 11 Precision of Estimates ......................................................................................................... 11 Missing Responses and Rounding ........................................................................................ 12
Employee and Household Characteristics ......................................................................................... 13 Demographics ........................................................................................................................... 13 Commute Trip Distance (Home to Work) .................................................................................... 15 Influence of Work Amenities on Job Choice ................................................................................. 16
Employee Behaviors ........................................................................................................................ 17 Commute Mode Shares ............................................................................................................. 17 Mode Choice and Demographics ................................................................................................ 19 Mode Choice and Employment Location ..................................................................................... 20 Mode Choice and Commute Distance ......................................................................................... 21 Mode Choice and Midday Trips .................................................................................................. 22 Stops Made During Work Commute ............................................................................................ 25 Parking ..................................................................................................................................... 26 Use of Transportation Demand Management (TDM) Strategies .................................................... 28 Familiarity with Transportation Related Organizations ................................................................. 32
Conclusion ...................................................................................................................................... 33
Bibliography ................................................................................................................................... 34
Who is TOD in Metro Denver? Employee Survey Report April 2010
Page 3
List of Tables____________________________________ Table 1: Employment Density within Walk Sheds of Rail Transit Stations .............................................................. 9Table 2: Respondent Demographics ................................................................................................................ 13Table 3: Respondent Demographics (cont’d) .................................................................................................... 14Table 4: Income by Work Area ........................................................................................................................ 14Table 5: Measured Distance from Home to Work by Work Area (miles) ............................................................. 15Table 6: Used Commute Mode in Prior Week by Demographic Characteristic ..................................................... 19Table 7: Commute Mode Share (percent of all trips taken in prior week) ........................................................... 20Table 8: Commute Mode Share (percent of all trips taken in prior week) by Actual Distance to Work ................... 21Table 9: Leave Work during the Day at Least Once a Week by Work Area ........................................................... 22Table 10: Stops Made During Work Commute ................................................................................................. 25Table 11: Stops Made During Commute (at least once a month) by Work Area .................................................. 25Table 12: Stops Made At Least Once Last Week During Commute by Mode Choice ............................................ 25Table 13: Commute Mode Share (percent of all trips taken in prior week) by Distance from Work to Free Parking 26Table 14: Type of Parking Used when Drive to Work ......................................................................................... 27Table 15: Transportation Demand Management Strategies, Availability and Use ................................................ 28Table 16: Transportation Demand Management Program Groups Available ....................................................... 29Table 17: TDM Program Availability by Area ..................................................................................................... 29Table 18: TDM Program Impact on Travel Mode Choice – Total Sample ............................................................. 30Table 19: TDM Program Impact on Travel Mode – Downtown ........................................................................... 30Table 20: TDM Program Impact on Travel Mode ............................................................................................... 31
Who is TOD in Metro Denver? Employee Survey Report April 2010
Page 4
List of Figures___________________________________ Figure 1: Stratification of Station Areas Included in Business and Employee Survey Samples ............................... 10Figure 2: Respondent Distance to Work ........................................................................................................... 15Figure 3: Influence of Work Amenities on Job Choice by Work Location ............................................................. 16Figure 4: Use of Commute Modes ................................................................................................................... 17Figure 5: Commute Mode Shares .................................................................................................................... 18Figure 6: Commute Mode Share (percent of all trips taken in prior week) by Actual Distance from Work to Nearest Rail Transit Station ......................................................................................................................................... 20Figure 7: Travel Mode for Workday Lunch or Personal Errands .......................................................................... 22Figure 8: Travel Mode for Workday Lunch or Personal Errands .......................................................................... 23Figure 9: Travel Mode for Workday Lunch or Personal Errands .......................................................................... 23Figure 10: Travel Mode for Workday Work-Related Trips .................................................................................. 24Figure 11: Travel Mode for Workday Work-Related Trips .................................................................................. 24Figure 12: Distance to Free Parking from Employment ...................................................................................... 26Figure 13: Awareness of Transportation Related Organizations ......................................................................... 32

Who is TOD in Metro Denver? Employee Survey Report April 2010
Page 5
This page intentionally left blank.
Who is TOD in Metro Denver? Employee Survey Report April 2010
Page 6
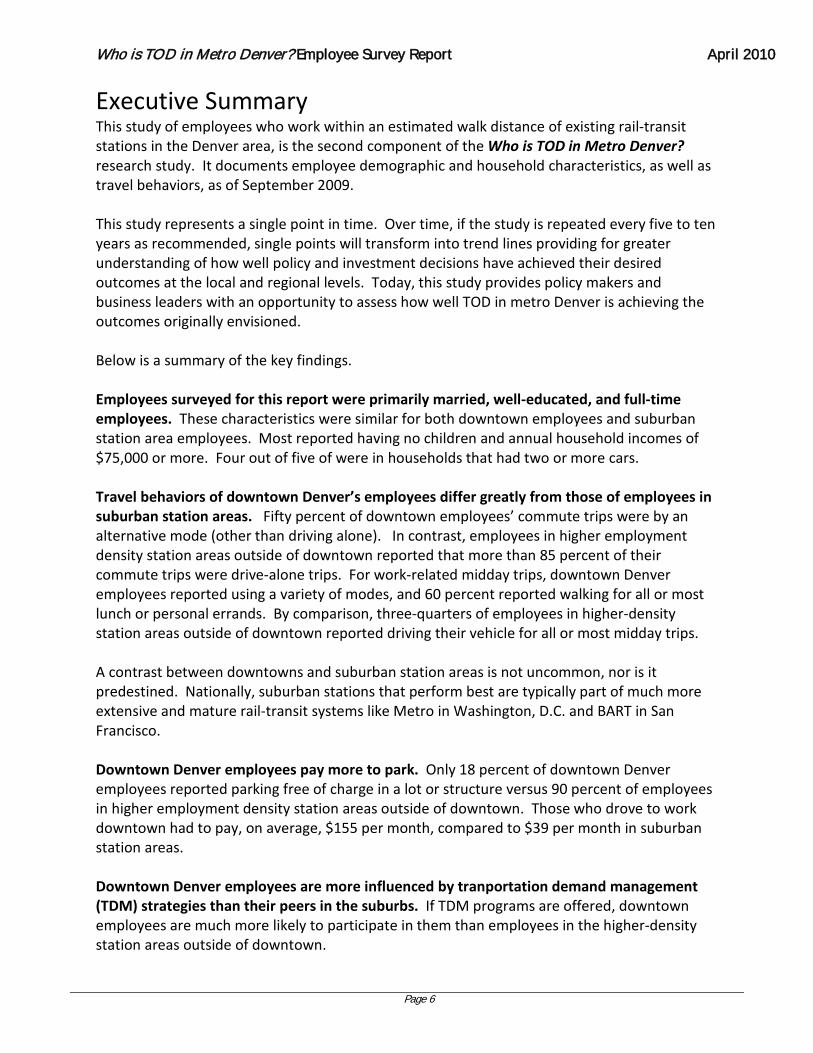
Executive Summary This study of employees who work within an estimated walk distance of existing rail-transit stations in the Denver area, is the second component of the Who is TOD in Metro Denver? research study. It documents employee demographic and household characteristics, as well as travel behaviors, as of September 2009. This study represents a single point in time. Over time, if the study is repeated every five to ten years as recommended, single points will transform into trend lines providing for greater understanding of how well policy and investment decisions have achieved their desired outcomes at the local and regional levels. Today, this study provides policy makers and business leaders with an opportunity to assess how well TOD in metro Denver is achieving the outcomes originally envisioned. Below is a summary of the key findings. Employees surveyed for this report were primarily married, well-educated, and full-time employees. These characteristics were similar for both downtown employees and suburban station area employees. Most reported having no children and annual household incomes of $75,000 or more. Four out of five of were in households that had two or more cars. Travel behaviors of downtown Denver’s employees differ greatly from those of employees in suburban station areas. Fifty percent of downtown employees’ commute trips were by an alternative mode (other than driving alone). In contrast, employees in higher employment density station areas outside of downtown reported that more than 85 percent of their commute trips were drive-alone trips. For work-related midday trips, downtown Denver employees reported using a variety of modes, and 60 percent reported walking for all or most lunch or personal errands. By comparison, three-quarters of employees in higher-density station areas outside of downtown reported driving their vehicle for all or most midday trips. A contrast between downtowns and suburban station areas is not uncommon, nor is it predestined. Nationally, suburban stations that perform best are typically part of much more extensive and mature rail-transit systems like Metro in Washington, D.C. and BART in San Francisco. Downtown Denver employees pay more to park. Only 18 percent of downtown Denver employees reported parking free of charge in a lot or structure versus 90 percent of employees in higher employment density station areas outside of downtown. Those who drove to work downtown had to pay, on average, $155 per month, compared to $39 per month in suburban station areas. Downtown Denver employees are more influenced by tranportation demand management (TDM) strategies than their peers in the suburbs. If TDM programs are offered, downtown employees are much more likely to participate in them than employees in the higher-density station areas outside of downtown.

Who is TOD in Metro Denver? Employee Survey Report April 2010
Page 7
DRCOG encourages a broad-based discussion of these findings, and offers this report to policy makers and business leaders to help them make land use and transportation decisions that achieve regional goals and individual community visions. The conclusion of this report suggests several policy questions for discussion and debate. For more information, contact Tom Boone, DRCOG TOD Project Manager, at 303-480-6776 or [email protected] for further information.
Who is TOD in Metro Denver? Employee Survey Report April 2010
Page 8
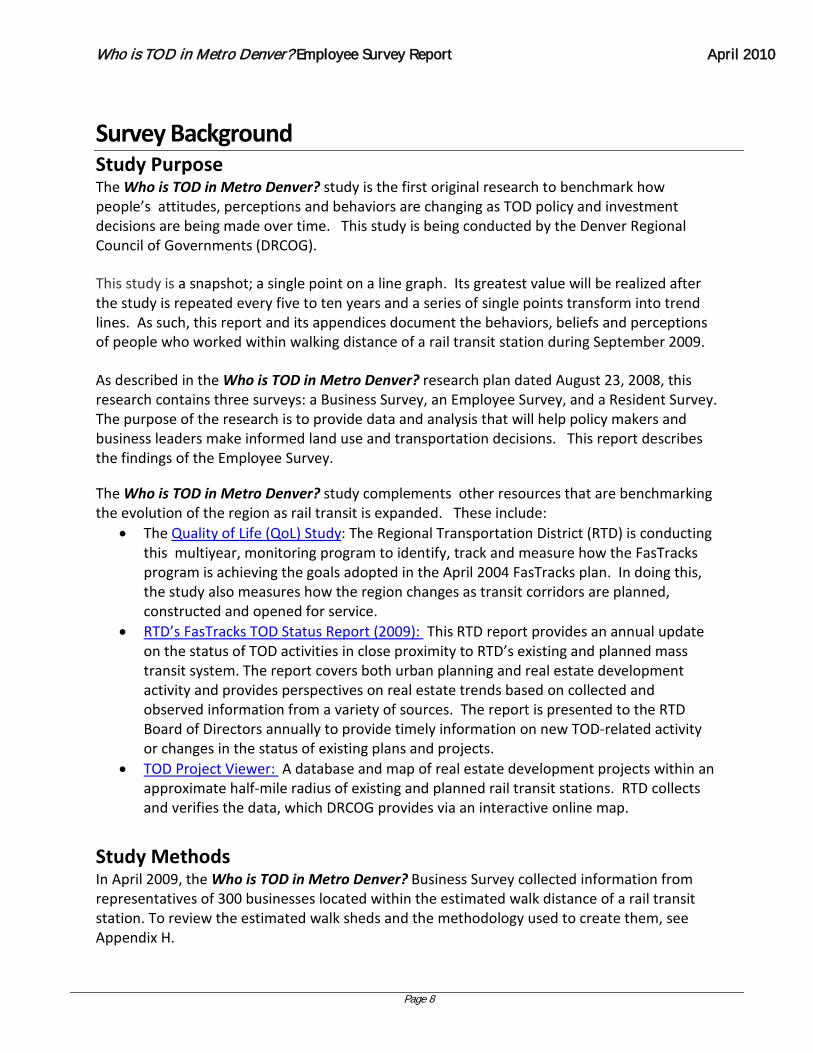
Survey Background Study Purpose The Who is TOD in Metro Denver? study is the first original research to benchmark how people’s attitudes, perceptions and behaviors are changing as TOD policy and investment decisions are being made over time. This study is being conducted by the Denver Regional Council of Governments (DRCOG).
This study is a snapshot; a single point on a line graph. Its greatest value will be realized after the study is repeated every five to ten years and a series of single points transform into trend lines. As such, this report and its appendices document the behaviors, beliefs and perceptions of people who worked within walking distance of a rail transit station during September 2009.
As described in the Who is TOD in Metro Denver? research plan dated August 23, 2008, this research contains three surveys: a Business Survey, an Employee Survey, and a Resident Survey. The purpose of the research is to provide data and analysis that will help policy makers and business leaders make informed land use and transportation decisions. This report describes the findings of the Employee Survey.
The Who is TOD in Metro Denver? study complements other resources that are benchmarking the evolution of the region as rail transit is expanded. These include:
• The Quality of Life (QoL) Study: The Regional Transportation District (RTD) is conducting this multiyear, monitoring program to identify, track and measure how the FasTracks program is achieving the goals adopted in the April 2004 FasTracks plan. In doing this, the study also measures how the region changes as transit corridors are planned, constructed and opened for service.
• RTD’s FasTracks TOD Status Report (2009): This RTD report provides an annual update on the status of TOD activities in close proximity to RTD’s existing and planned mass transit system. The report covers both urban planning and real estate development activity and provides perspectives on real estate trends based on collected and observed information from a variety of sources. The report is presented to the RTD Board of Directors annually to provide timely information on new TOD-related activity or changes in the status of existing plans and projects.
• TOD Project Viewer: A database and map of real estate development projects within an approximate half-mile radius of existing and planned rail transit stations. RTD collects and verifies the data, which DRCOG provides via an interactive online map.
Study Methods In April 2009, the Who is TOD in Metro Denver? Business Survey collected information from representatives of 300 businesses located within the estimated walk distance of a rail transit station. To review the estimated walk sheds and the methodology used to create them, see Appendix H.
Who is TOD in Metro Denver? Employee Survey Report April 2010
Page 9
Of the 300 businesses, 199 agreed to have their employees participate in a survey about employee travel behavior. At least one employee from 79 companies responded to the survey for a company response rate of 40 percent. A total of 403 employees completed the survey, representing 9 percent of the employees in the 199 companies that agreed to participate, and 18 percent of the employees in the 79 companies where at least one employee responded.
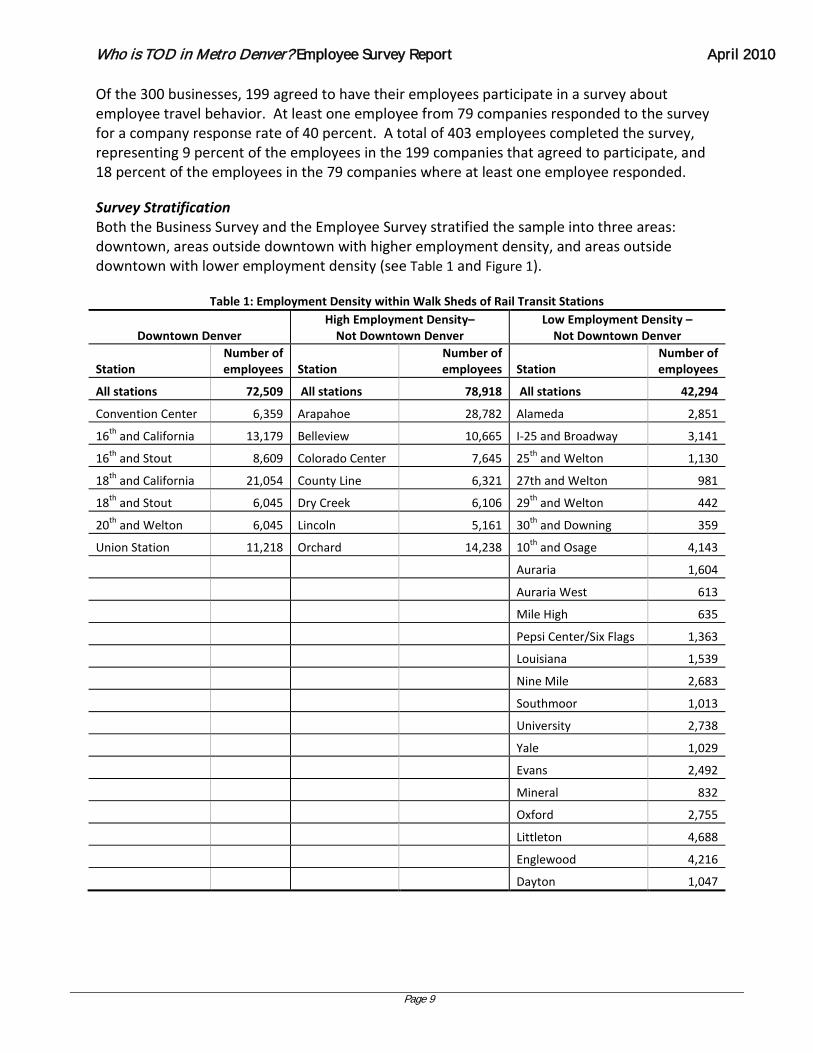
Survey Stratification Both the Business Survey and the Employee Survey stratified the sample into three areas: downtown, areas outside downtown with higher employment density, and areas outside downtown with lower employment density (see Table 1 and Figure 1).
Table 1: Employment Density within Walk Sheds of Rail Transit Stations
Downtown Denver High Employment Density–
Not Downtown Denver Low Employment Density –
Not Downtown Denver
Station Number of employees Station
Number of employees Station
Number of employees
All stations 72,509 All stations 78,918 All stations 42,294
Convention Center 6,359 Arapahoe 28,782 Alameda 2,851
16th and California 13,179 Belleview 10,665 I-25 and Broadway 3,141
16th and Stout 8,609 Colorado Center 7,645 25th and Welton 1,130
18th and California 21,054 County Line 6,321 27th and Welton 981
18th and Stout 6,045 Dry Creek 6,106 29th and Welton 442
20th and Welton 6,045 Lincoln 5,161 30th and Downing 359
Union Station 11,218 Orchard 14,238 10th and Osage 4,143
Auraria 1,604
Auraria West 613
Mile High 635
Pepsi Center/Six Flags 1,363
Louisiana 1,539
Nine Mile 2,683
Southmoor 1,013
University 2,738
Yale 1,029
Evans 2,492
Mineral 832
Oxford 2,755
Littleton 4,688
Englewood 4,216
Dayton 1,047
Who is TOD in Metro Denver? Employee Survey Report April 2010
Page 10
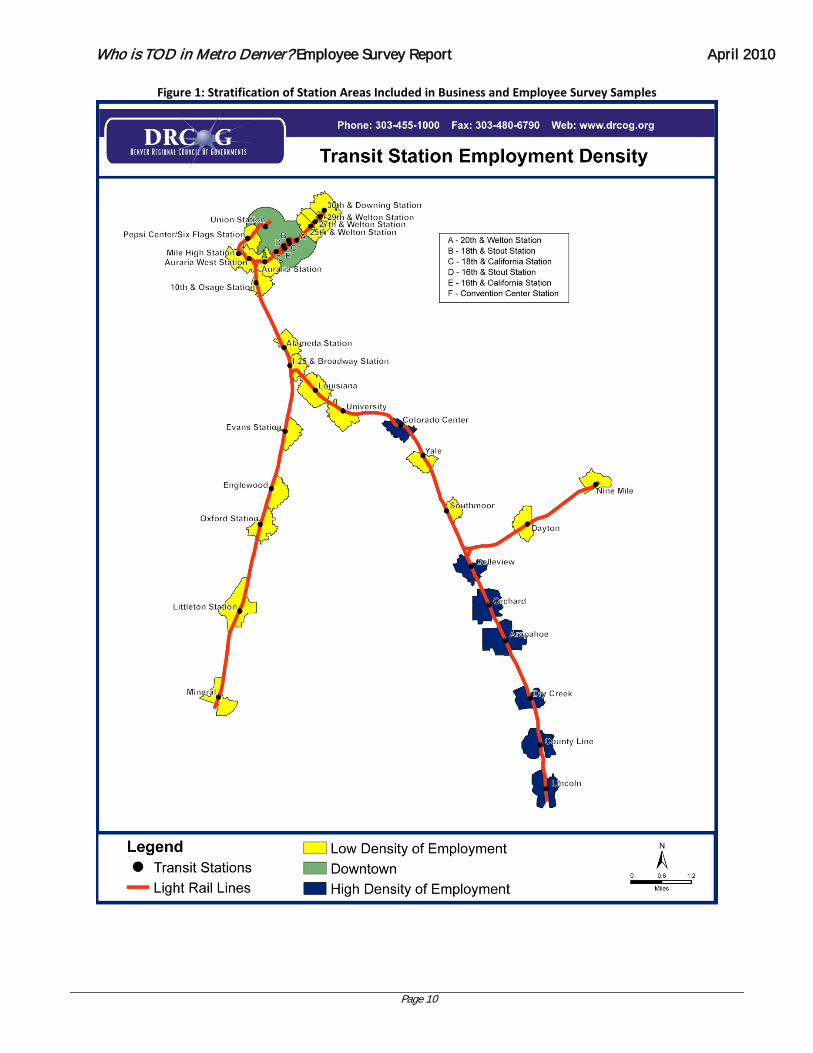
Figure 1: Stratification of Station Areas Included in Business and Employee Survey Samples
Who is TOD in Metro Denver? Employee Survey Report April 2010
Page 11
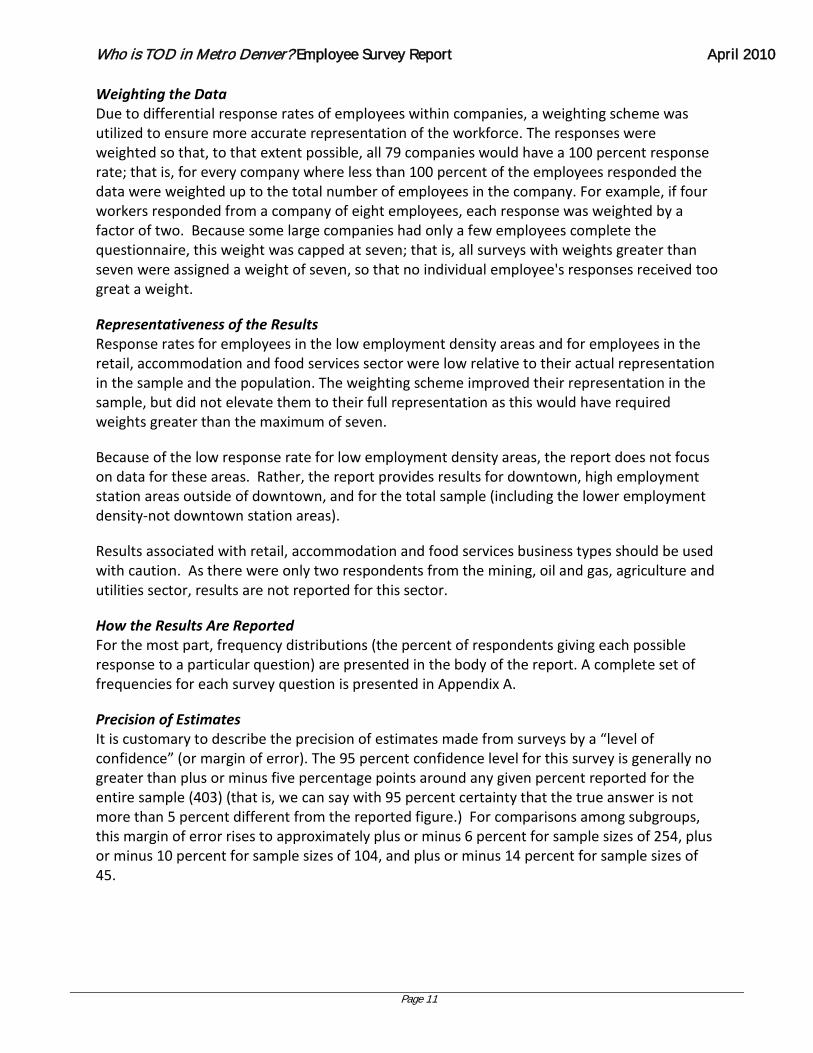
Weighting the Data Due to differential response rates of employees within companies, a weighting scheme was utilized to ensure more accurate representation of the workforce. The responses were weighted so that, to that extent possible, all 79 companies would have a 100 percent response rate; that is, for every company where less than 100 percent of the employees responded the data were weighted up to the total number of employees in the company. For example, if four workers responded from a company of eight employees, each response was weighted by a factor of two. Because some large companies had only a few employees complete the questionnaire, this weight was capped at seven; that is, all surveys with weights greater than seven were assigned a weight of seven, so that no individual employee's responses received too great a weight.
Representativeness of the Results Response rates for employees in the low employment density areas and for employees in the retail, accommodation and food services sector were low relative to their actual representation in the sample and the population. The weighting scheme improved their representation in the sample, but did not elevate them to their full representation as this would have required weights greater than the maximum of seven.
Because of the low response rate for low employment density areas, the report does not focus on data for these areas. Rather, the report provides results for downtown, high employment station areas outside of downtown, and for the total sample (including the lower employment density-not downtown station areas).
Results associated with retail, accommodation and food services business types should be used with caution. As there were only two respondents from the mining, oil and gas, agriculture and utilities sector, results are not reported for this sector.
How the Results Are Reported For the most part, frequency distributions (the percent of respondents giving each possible response to a particular question) are presented in the body of the report. A complete set of frequencies for each survey question is presented in Appendix A.
Precision of Estimates It is customary to describe the precision of estimates made from surveys by a “level of confidence” (or margin of error). The 95 percent confidence level for this survey is generally no greater than plus or minus five percentage points around any given percent reported for the entire sample (403) (that is, we can say with 95 percent certainty that the true answer is not more than 5 percent different from the reported figure.) For comparisons among subgroups, this margin of error rises to approximately plus or minus 6 percent for sample sizes of 254, plus or minus 10 percent for sample sizes of 104, and plus or minus 14 percent for sample sizes of 45.
Who is TOD in Metro Denver? Employee Survey Report April 2010
Page 12
Missing Responses and Rounding In this survey “don’t know” answers were generally not permitted as all the questions were about personal behavior. However, as will happen, some respondents skipped some of the questions. The proportion of respondents who skipped a question is shown in the full set of responses included in Appendices A through D. These “missing” responses are excluded from the analyses presented in the body of the report. In other words, the majority of the tables and graphs in the body of the report display the responses from respondents who had an opinion about a specific item. Questions were generally answered by at least 94% of the respondents.
For some questions, respondents were permitted to select multiple responses. When the total exceeds 100 percent in a table for a multiple-response question, it is because some respondents are counted in multiple categories. When a table for a question that only permitted a single response does not total exactly 100 percent, it is due to the customary practice of rounding percentages to the nearest whole number.
For more information of Survey Methodology, see Appendix E.
Who is TOD in Metro Denver? Employee Survey Report April 2010
Page 13
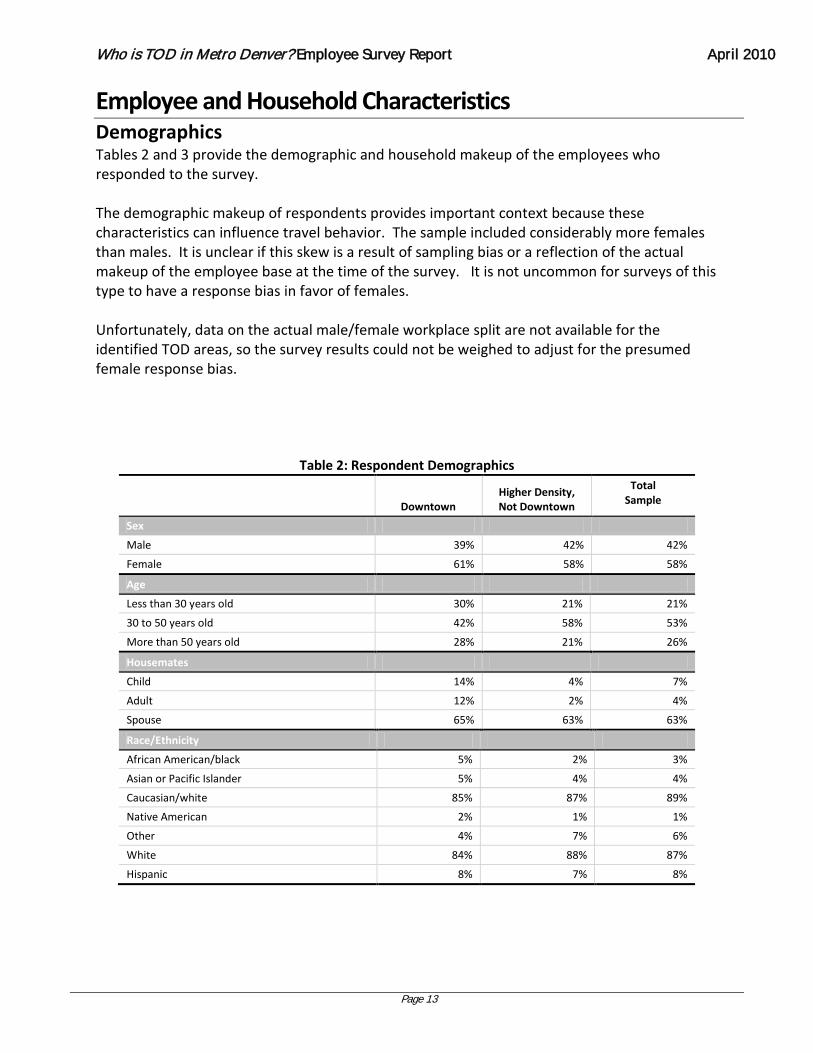
Employee and Household Characteristics Demographics Tables 2 and 3 provide the demographic and household makeup of the employees who responded to the survey. The demographic makeup of respondents provides important context because these characteristics can influence travel behavior. The sample included considerably more females than males. It is unclear if this skew is a result of sampling bias or a reflection of the actual makeup of the employee base at the time of the survey. It is not uncommon for surveys of this type to have a response bias in favor of females. Unfortunately, data on the actual male/female workplace split are not available for the identified TOD areas, so the survey results could not be weighed to adjust for the presumed female response bias.
Table 2: Respondent Demographics
Downtown Higher Density, Not Downtown
Total Sample
Sex
Male 39% 42% 42%
Female 61% 58% 58%
Age
Less than 30 years old 30% 21% 21%
30 to 50 years old 42% 58% 53%
More than 50 years old 28% 21% 26%
Housemates
Child 14% 4% 7%
Adult 12% 2% 4%
Spouse 65% 63% 63%
Race/Ethnicity
African American/black 5% 2% 3%
Asian or Pacific Islander 5% 4% 4%
Caucasian/white 85% 87% 89%
Native American 2% 1% 1%
Other 4% 7% 6%
White 84% 88% 87%
Hispanic 8% 7% 8%
Who is TOD in Metro Denver? Employee Survey Report April 2010
Page 14
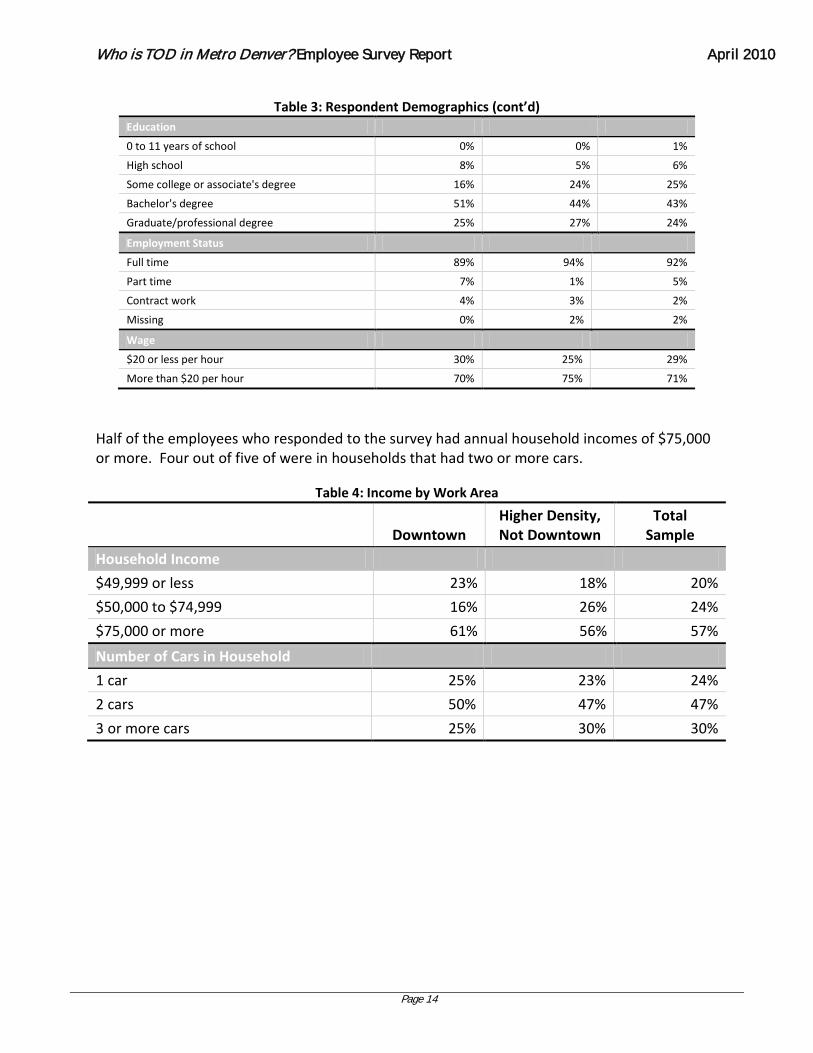
Table 3: Respondent Demographics (cont’d)
Education
0 to 11 years of school 0% 0% 1%
High school 8% 5% 6%
Some college or associate's degree 16% 24% 25%
Bachelor's degree 51% 44% 43%
Graduate/professional degree 25% 27% 24%
Employment Status
Full time 89% 94% 92%
Part time 7% 1% 5%
Contract work 4% 3% 2%
Missing 0% 2% 2%
Wage
$20 or less per hour 30% 25% 29%
More than $20 per hour 70% 75% 71%
Half of the employees who responded to the survey had annual household incomes of $75,000 or more. Four out of five of were in households that had two or more cars.
Table 4: Income by Work Area
Downtown Higher Density, Not Downtown
Total Sample
Household Income
$49,999 or less 23% 18% 20%
$50,000 to $74,999 16% 26% 24%
$75,000 or more 61% 56% 57%
Number of Cars in Household
1 car 25% 23% 24%
2 cars 50% 47% 47%
3 or more cars 25% 30% 30%
Who is TOD in Metro Denver? Employee Survey Report April 2010
Page 15
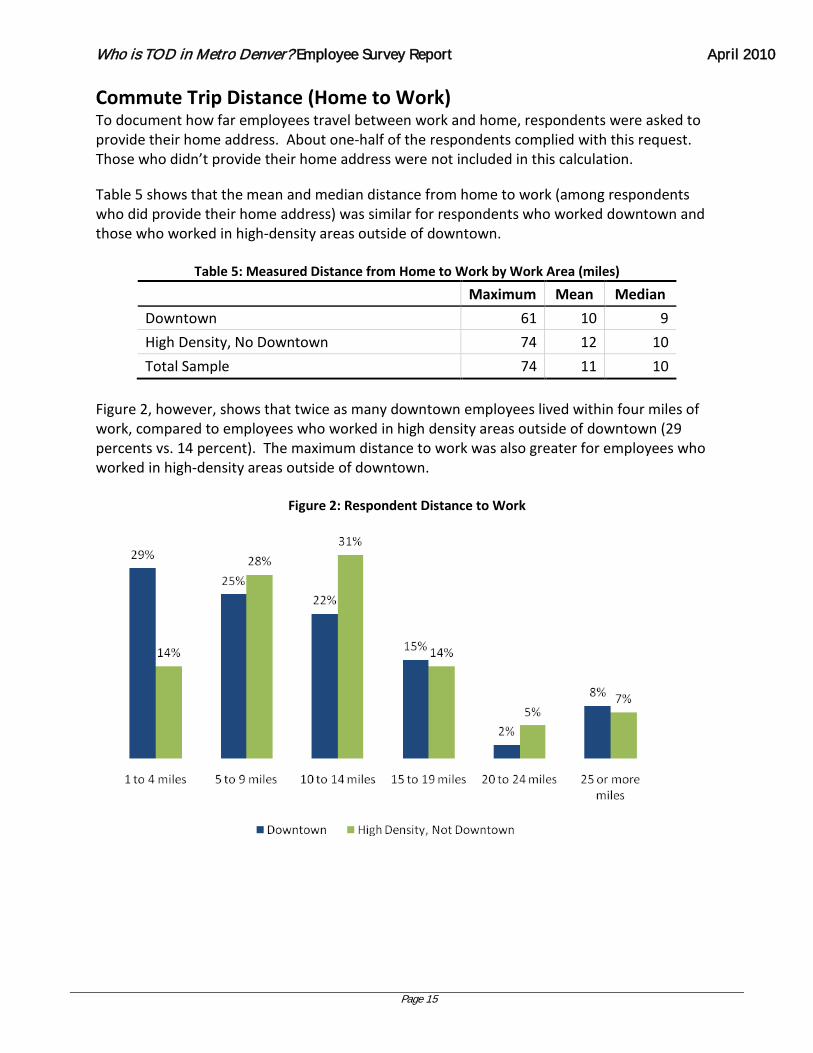
Commute Trip Distance (Home to Work) To document how far employees travel between work and home, respondents were asked to provide their home address. About one-half of the respondents complied with this request. Those who didn’t provide their home address were not included in this calculation.
Table 5 shows that the mean and median distance from home to work (among respondents who did provide their home address) was similar for respondents who worked downtown and those who worked in high-density areas outside of downtown.
Table 5: Measured Distance from Home to Work by Work Area (miles)
Maximum Mean Median
Downtown 61 10 9
High Density, No Downtown 74 12 10
Total Sample 74 11 10
Figure 2, however, shows that twice as many downtown employees lived within four miles of work, compared to employees who worked in high density areas outside of downtown (29 percents vs. 14 percent). The maximum distance to work was also greater for employees who worked in high-density areas outside of downtown.
Figure 2: Respondent Distance to Work
Who is TOD in Metro Denver? Employee Survey Report April 2010
Page 16
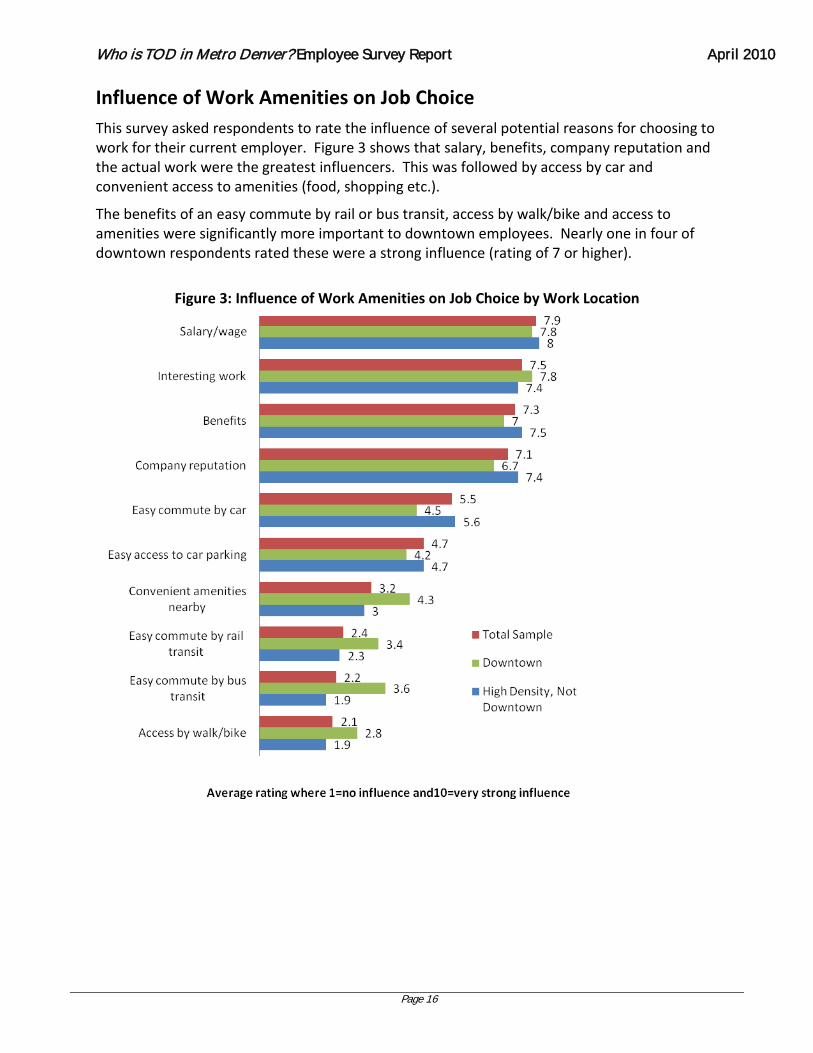
Influence of Work Amenities on Job Choice This survey asked respondents to rate the influence of several potential reasons for choosing to work for their current employer. Figure 3 shows that salary, benefits, company reputation and the actual work were the greatest influencers. This was followed by access by car and convenient access to amenities (food, shopping etc.).
The benefits of an easy commute by rail or bus transit, access by walk/bike and access to amenities were significantly more important to downtown employees. Nearly one in four of downtown respondents rated these were a strong influence (rating of 7 or higher).
Figure 3: Influence of Work Amenities on Job Choice by Work Location
Who is TOD in Metro Denver? Employee Survey Report April 2010
Page 17
Employee Behaviors
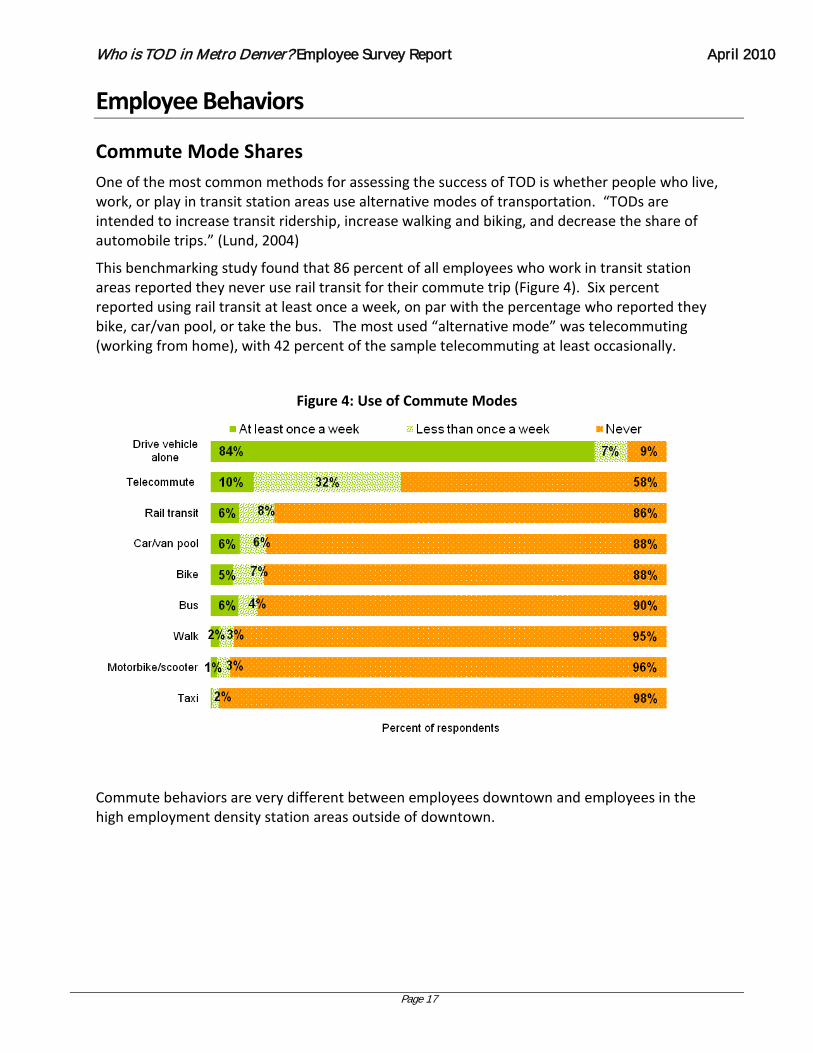
Commute Mode Shares One of the most common methods for assessing the success of TOD is whether people who live, work, or play in transit station areas use alternative modes of transportation. “TODs are intended to increase transit ridership, increase walking and biking, and decrease the share of automobile trips.” (Lund, 2004)
This benchmarking study found that 86 percent of all employees who work in transit station areas reported they never use rail transit for their commute trip (Figure 4). Six percent reported using rail transit at least once a week, on par with the percentage who reported they bike, car/van pool, or take the bus. The most used “alternative mode” was telecommuting (working from home), with 42 percent of the sample telecommuting at least occasionally.
Figure 4: Use of Commute Modes
Commute behaviors are very different between employees downtown and employees in the high employment density station areas outside of downtown.
Who is TOD in Metro Denver? Employee Survey Report April 2010
Page 18
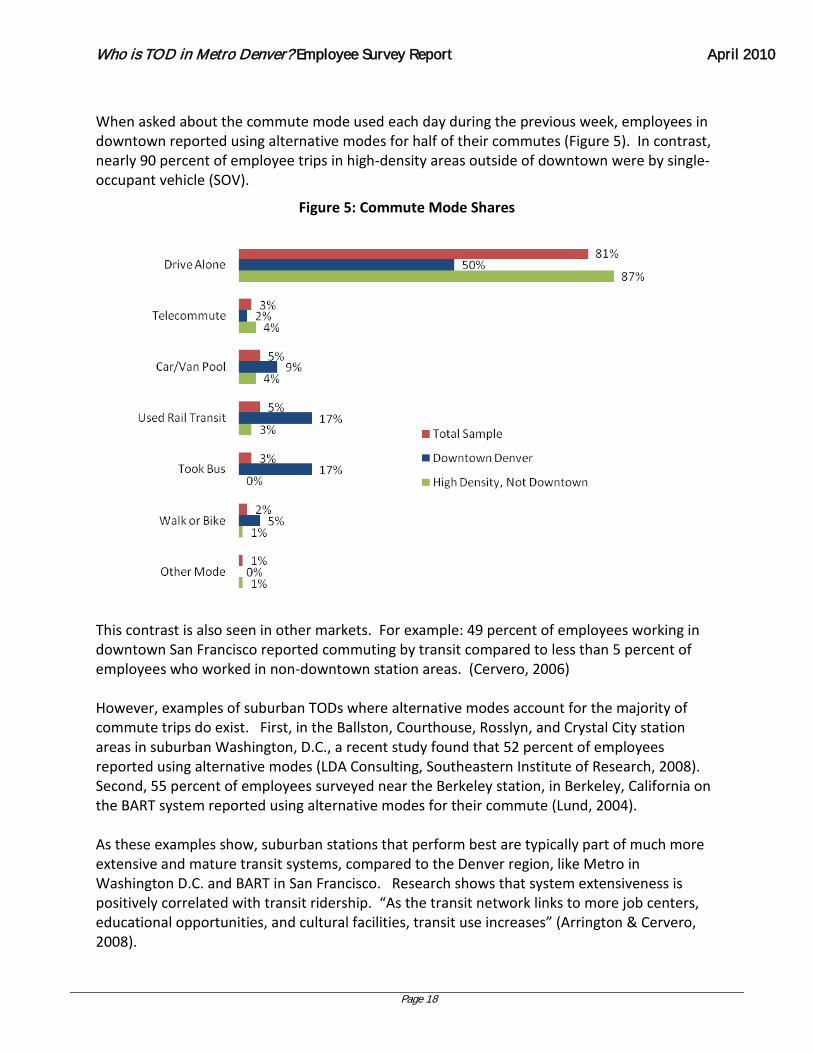
When asked about the commute mode used each day during the previous week, employees in downtown reported using alternative modes for half of their commutes (Figure 5). In contrast, nearly 90 percent of employee trips in high-density areas outside of downtown were by single-occupant vehicle (SOV).
Figure 5: Commute Mode Shares
This contrast is also seen in other markets. For example: 49 percent of employees working in downtown San Francisco reported commuting by transit compared to less than 5 percent of employees who worked in non-downtown station areas. (Cervero, 2006) However, examples of suburban TODs where alternative modes account for the majority of commute trips do exist. First, in the Ballston, Courthouse, Rosslyn, and Crystal City station areas in suburban Washington, D.C., a recent study found that 52 percent of employees reported using alternative modes (LDA Consulting, Southeastern Institute of Research, 2008). Second, 55 percent of employees surveyed near the Berkeley station, in Berkeley, California on the BART system reported using alternative modes for their commute (Lund, 2004). As these examples show, suburban stations that perform best are typically part of much more extensive and mature transit systems, compared to the Denver region, like Metro in Washington D.C. and BART in San Francisco. Research shows that system extensiveness is positively correlated with transit ridership. “As the transit network links to more job centers, educational opportunities, and cultural facilities, transit use increases” (Arrington & Cervero, 2008).
Who is TOD in Metro Denver? Employee Survey Report April 2010
Page 19
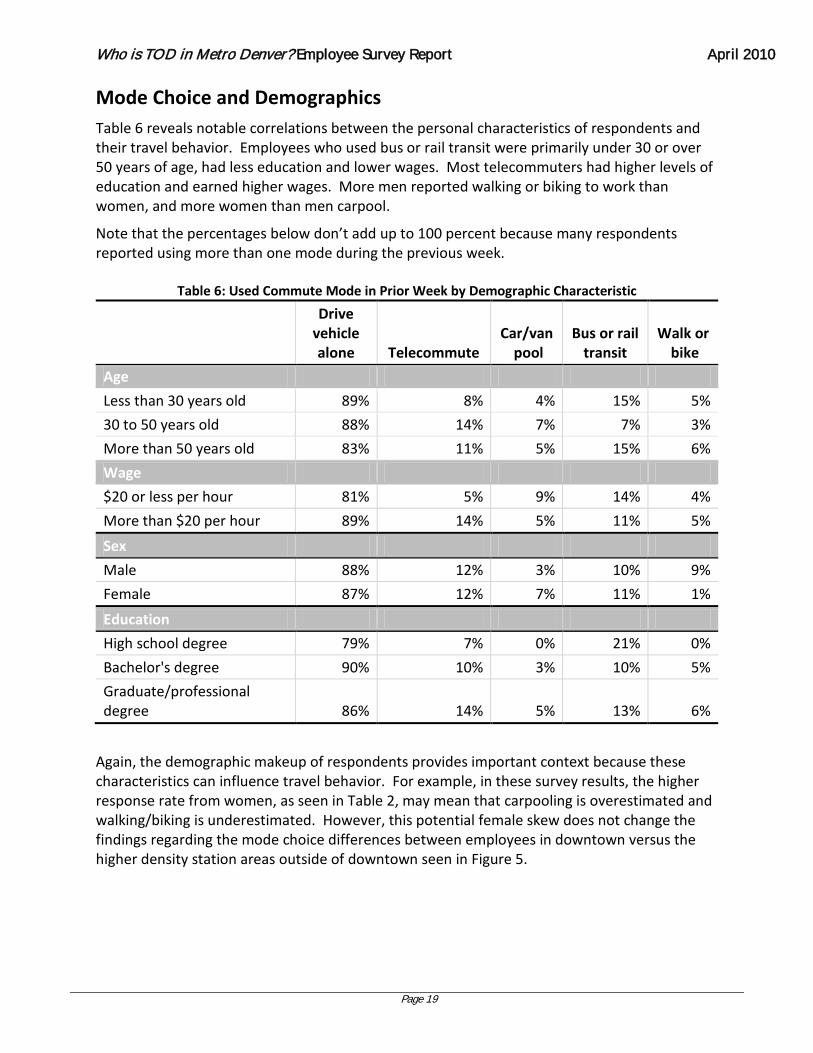
Mode Choice and Demographics Table 6 reveals notable correlations between the personal characteristics of respondents and their travel behavior. Employees who used bus or rail transit were primarily under 30 or over 50 years of age, had less education and lower wages. Most telecommuters had higher levels of education and earned higher wages. More men reported walking or biking to work than women, and more women than men carpool.
Note that the percentages below don’t add up to 100 percent because many respondents reported using more than one mode during the previous week.
Table 6: Used Commute Mode in Prior Week by Demographic Characteristic
Drive vehicle alone Telecommute
Car/van pool
Bus or rail transit
Walk or bike
Age
Less than 30 years old 89% 8% 4% 15% 5%
30 to 50 years old 88% 14% 7% 7% 3%
More than 50 years old 83% 11% 5% 15% 6%
Wage
$20 or less per hour 81% 5% 9% 14% 4%
More than $20 per hour 89% 14% 5% 11% 5%
Sex
Male 88% 12% 3% 10% 9%
Female 87% 12% 7% 11% 1%
Education
High school degree 79% 7% 0% 21% 0%
Bachelor's degree 90% 10% 3% 10% 5%
Graduate/professional degree 86% 14% 5% 13% 6%
Again, the demographic makeup of respondents provides important context because these characteristics can influence travel behavior. For example, in these survey results, the higher response rate from women, as seen in Table 2, may mean that carpooling is overestimated and walking/biking is underestimated. However, this potential female skew does not change the findings regarding the mode choice differences between employees in downtown versus the higher density station areas outside of downtown seen in Figure 5.

Who is TOD in Metro Denver? Employee Survey Report April 2010
Page 20
Mode Choice and Employment Location Figure 6 shows that among employees who work within a quarter-mile of a rail transit station, transit accounts for 16 percent of their trips, while driving alone accounts for 53 percent. Between a quarter-mile and half-mile from the station, transit’s share drops to 3 percent and drive alone increases to 88 percent. Several TOD research studies have shown similar results: the closer employment is to a transit station, the more likely employees will use transit to commute to work. A study of California TODs (Lund, 2004) found that “work trip transit shares fall in an exponential manner as the distance of an office site to its nearest station increases. “
Figure 6: Commute Mode Share (percent of all trips taken in prior week) by Actual Distance from Work to Nearest Rail Transit Station
Other modes like carpooling, walking, biking and using the bus were also used more when the distance between employment and station area was less than a quarter-mile (Table 7).
Table 7: Commute Mode Share (percent of all trips taken in prior week) by Actual Distance from Work to Nearest Rail Transit Station – Total Sample
0.00 to 0.24 miles 0.25 to 0.49 miles 0.50 to 0.74 miles 0.75 to 1.00 miles Drove alone 53% 88% 85% 87%
Telecommuted 1% 1% 6% 2%
Carpooled 12% 1% 3% 6%
Used rail transit 16% 3% 3% 3%
Took bus 13% 5% 0% 0%
Walked/ Biked 5% 1% 1% 2%
Other mode 0% 2% 0% 0%
Who is TOD in Metro Denver? Employee Survey Report April 2010
Page 21
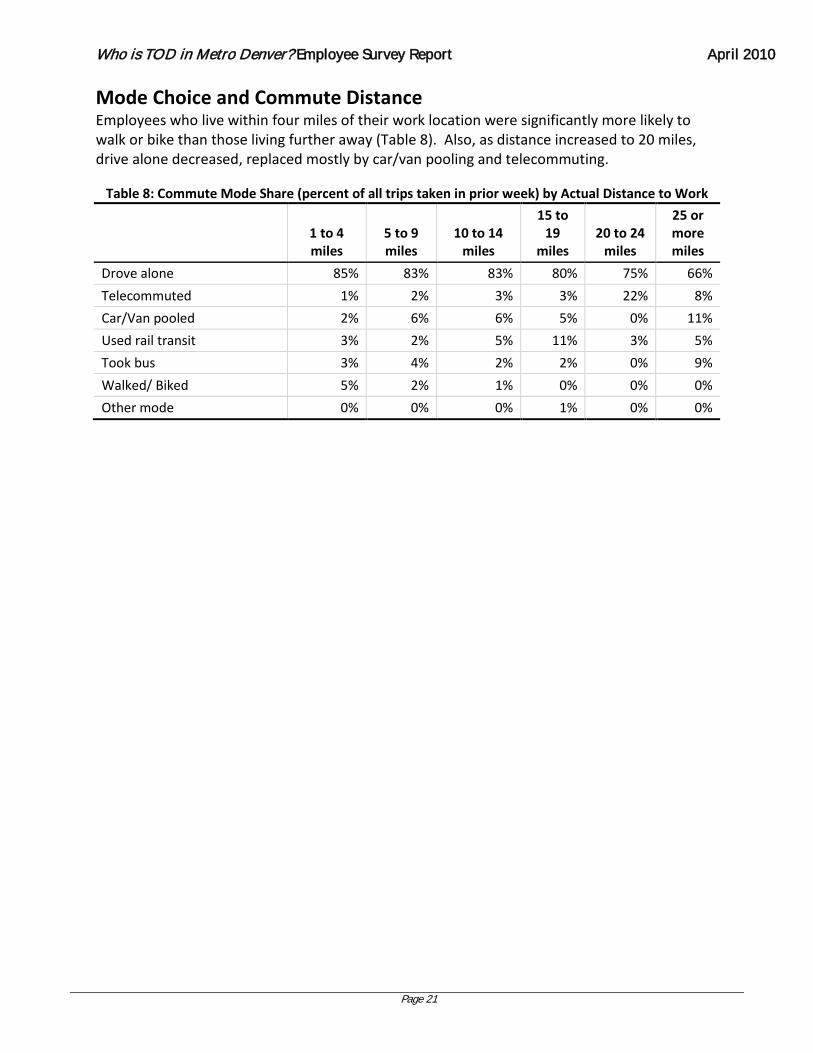
Mode Choice and Commute Distance Employees who live within four miles of their work location were significantly more likely to walk or bike than those living further away (Table 8). Also, as distance increased to 20 miles, drive alone decreased, replaced mostly by car/van pooling and telecommuting.
Table 8: Commute Mode Share (percent of all trips taken in prior week) by Actual Distance to Work
1 to 4 miles
5 to 9 miles
10 to 14 miles
15 to 19
miles 20 to 24
miles
25 or more miles
Drove alone 85% 83% 83% 80% 75% 66%
Telecommuted 1% 2% 3% 3% 22% 8%
Car/Van pooled 2% 6% 6% 5% 0% 11%
Used rail transit 3% 2% 5% 11% 3% 5%
Took bus 3% 4% 2% 2% 0% 9%
Walked/ Biked 5% 2% 1% 0% 0% 0%
Other mode 0% 0% 0% 1% 0% 0%
Who is TOD in Metro Denver? Employee Survey Report April 2010
Page 22
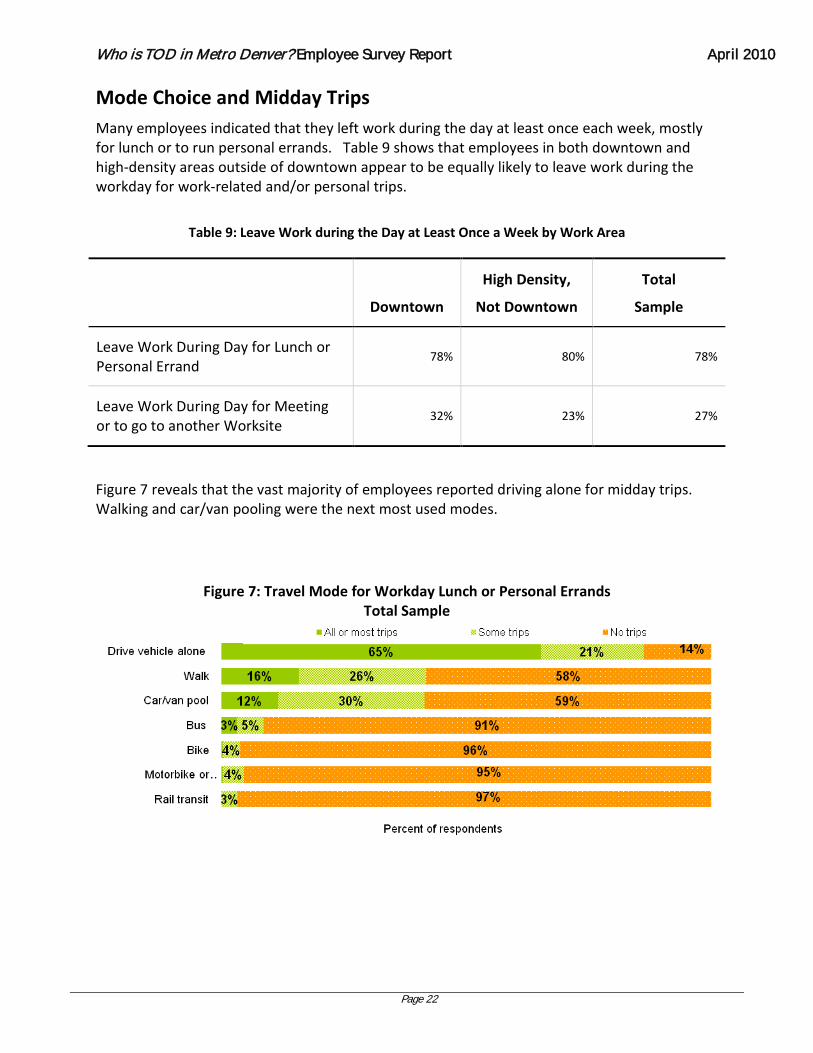
Mode Choice and Midday Trips Many employees indicated that they left work during the day at least once each week, mostly for lunch or to run personal errands. Table 9 shows that employees in both downtown and high-density areas outside of downtown appear to be equally likely to leave work during the workday for work-related and/or personal trips.
Table 9: Leave Work during the Day at Least Once a Week by Work Area
Downtown
High Density,
Not Downtown
Total
Sample
Leave Work During Day for Lunch or Personal Errand
78% 80% 78%
Leave Work During Day for Meeting or to go to another Worksite
32% 23% 27%
Figure 7 reveals that the vast majority of employees reported driving alone for midday trips. Walking and car/van pooling were the next most used modes.
Figure 7: Travel Mode for Workday Lunch or Personal Errands Total Sample
Who is TOD in Metro Denver? Employee Survey Report April 2010
Page 23
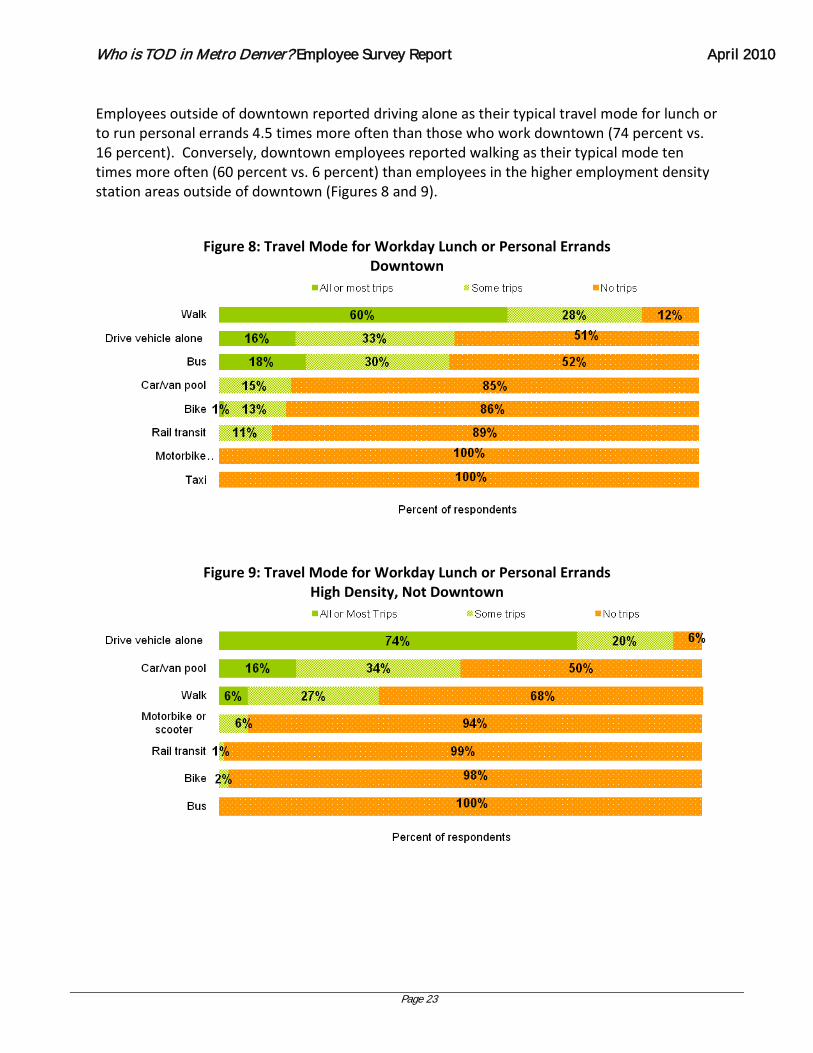
Employees outside of downtown reported driving alone as their typical travel mode for lunch or to run personal errands 4.5 times more often than those who work downtown (74 percent vs. 16 percent). Conversely, downtown employees reported walking as their typical mode ten times more often (60 percent vs. 6 percent) than employees in the higher employment density station areas outside of downtown (Figures 8 and 9).
Figure 8: Travel Mode for Workday Lunch or Personal Errands Downtown
Figure 9: Travel Mode for Workday Lunch or Personal Errands High Density, Not Downtown
Who is TOD in Metro Denver? Employee Survey Report April 2010
Page 24
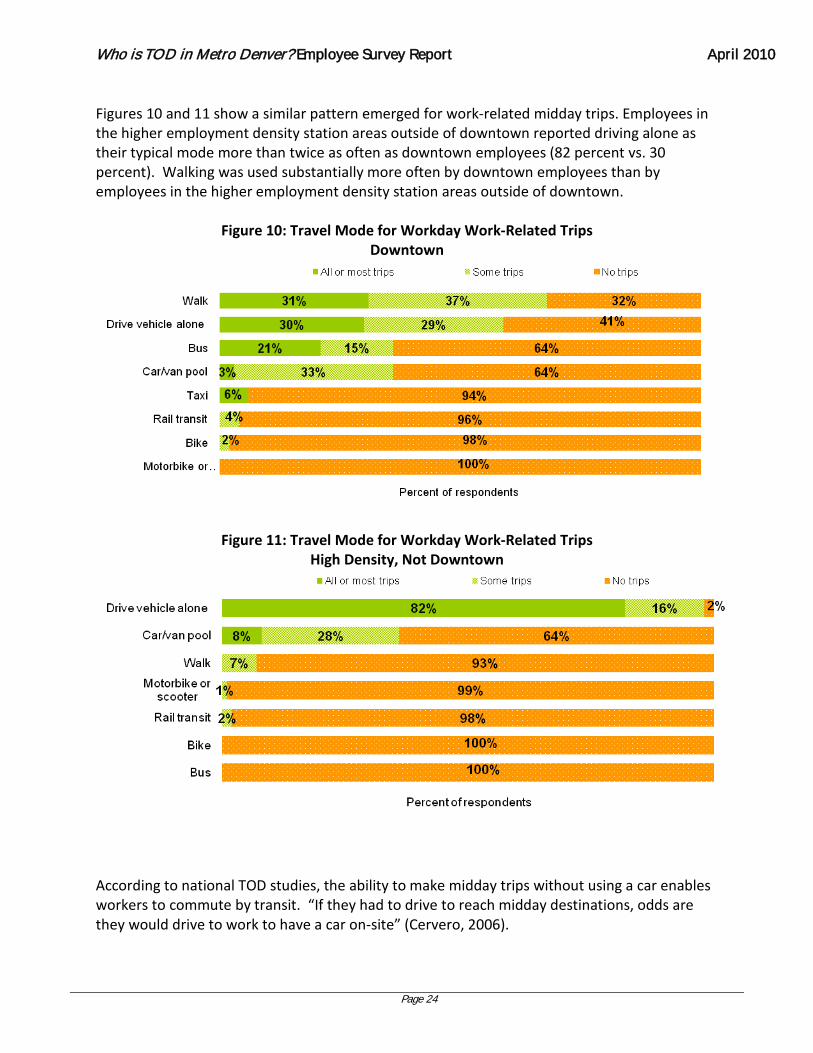
Figures 10 and 11 show a similar pattern emerged for work-related midday trips. Employees in the higher employment density station areas outside of downtown reported driving alone as their typical mode more than twice as often as downtown employees (82 percent vs. 30 percent). Walking was used substantially more often by downtown employees than by employees in the higher employment density station areas outside of downtown.
Figure 10: Travel Mode for Workday Work-Related Trips Downtown
Figure 11: Travel Mode for Workday Work-Related Trips
High Density, Not Downtown
According to national TOD studies, the ability to make midday trips without using a car enables workers to commute by transit. “If they had to drive to reach midday destinations, odds are they would drive to work to have a car on-site” (Cervero, 2006).
Who is TOD in Metro Denver? Employee Survey Report April 2010
Page 25
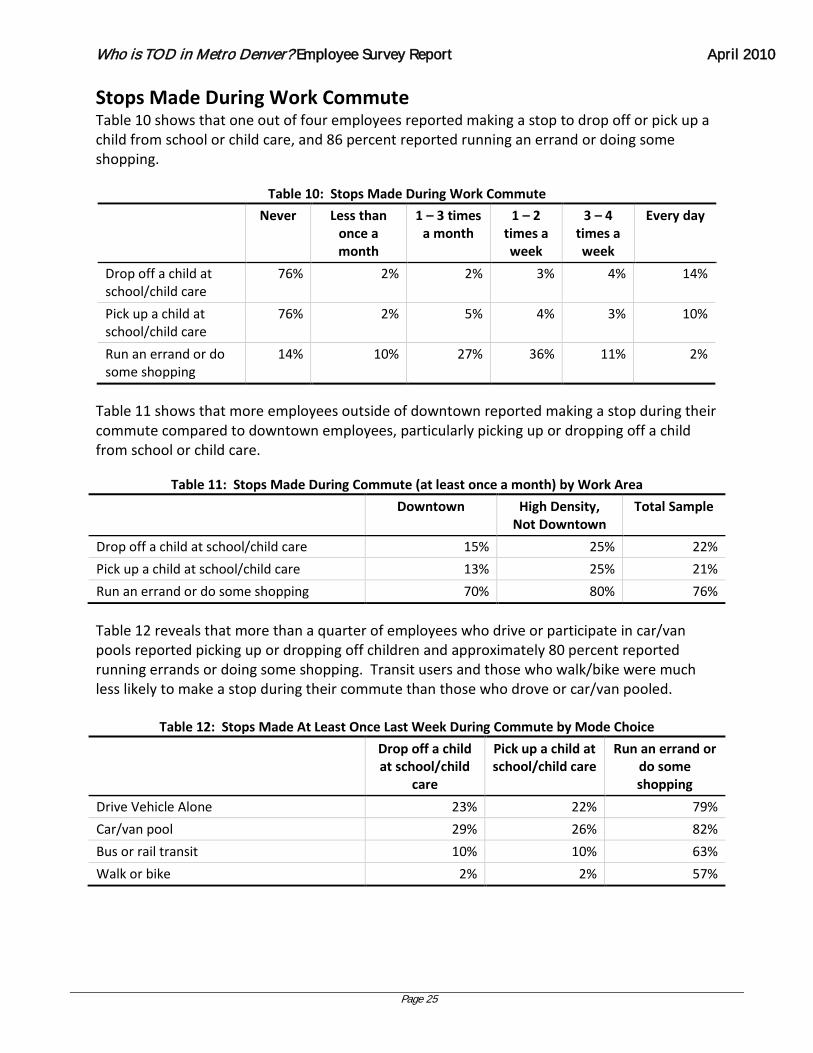
Stops Made During Work Commute Table 10 shows that one out of four employees reported making a stop to drop off or pick up a child from school or child care, and 86 percent reported running an errand or doing some shopping.
Table 10: Stops Made During Work Commute
Never Less than once a month
1 – 3 times a month
1 – 2 times a week
3 – 4 times a week
Every day
Drop off a child at school/child care
76% 2% 2% 3% 4% 14%
Pick up a child at school/child care
76% 2% 5% 4% 3% 10%
Run an errand or do some shopping
14% 10% 27% 36% 11% 2%
Table 11 shows that more employees outside of downtown reported making a stop during their commute compared to downtown employees, particularly picking up or dropping off a child from school or child care.
Table 11: Stops Made During Commute (at least once a month) by Work Area
Downtown High Density, Not Downtown
Total Sample
Drop off a child at school/child care 15% 25% 22%
Pick up a child at school/child care 13% 25% 21%
Run an errand or do some shopping 70% 80% 76% Table 12 reveals that more than a quarter of employees who drive or participate in car/van pools reported picking up or dropping off children and approximately 80 percent reported running errands or doing some shopping. Transit users and those who walk/bike were much less likely to make a stop during their commute than those who drove or car/van pooled.
Table 12: Stops Made At Least Once Last Week During Commute by Mode Choice
Drop off a child at school/child
care
Pick up a child at school/child care
Run an errand or do some shopping
Drive Vehicle Alone 23% 22% 79%
Car/van pool 29% 26% 82%
Bus or rail transit 10% 10% 63%
Walk or bike 2% 2% 57%
Who is TOD in Metro Denver? Employee Survey Report April 2010
Page 26
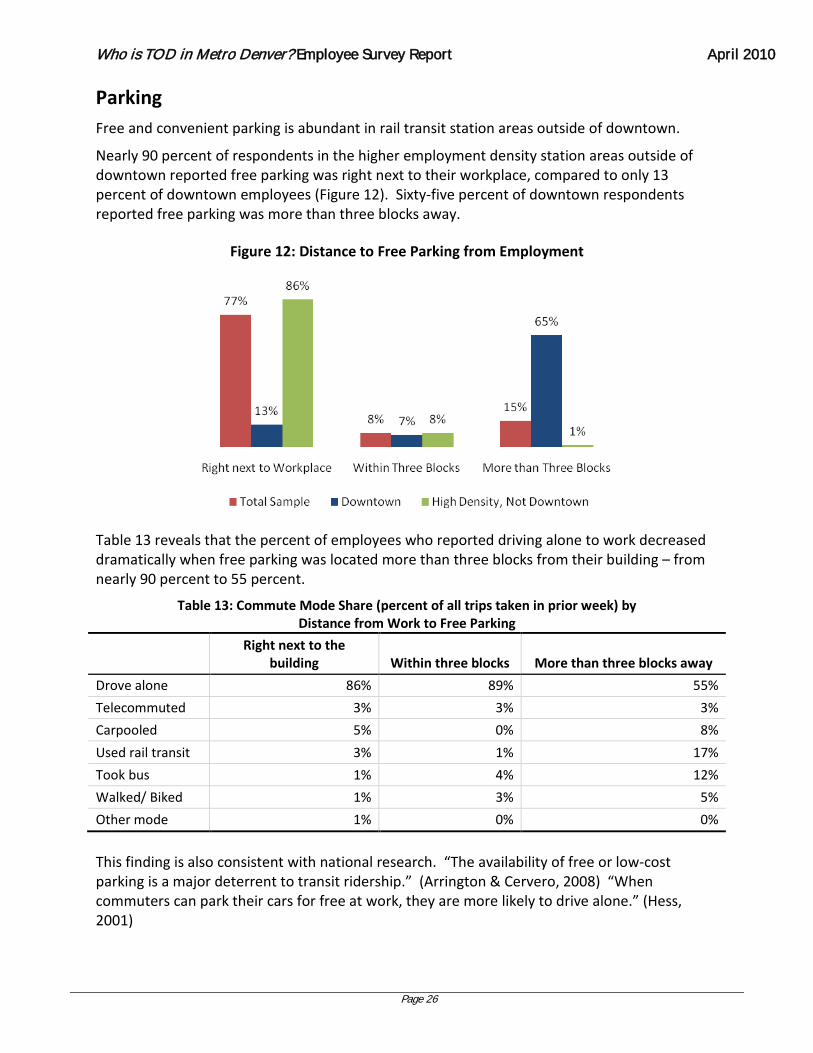
Parking Free and convenient parking is abundant in rail transit station areas outside of downtown.
Nearly 90 percent of respondents in the higher employment density station areas outside of downtown reported free parking was right next to their workplace, compared to only 13 percent of downtown employees (Figure 12). Sixty-five percent of downtown respondents reported free parking was more than three blocks away.
Figure 12: Distance to Free Parking from Employment
Table 13 reveals that the percent of employees who reported driving alone to work decreased dramatically when free parking was located more than three blocks from their building – from nearly 90 percent to 55 percent.
Table 13: Commute Mode Share (percent of all trips taken in prior week) by Distance from Work to Free Parking
Right next to the
building Within three blocks More than three blocks away
Drove alone 86% 89% 55%
Telecommuted 3% 3% 3%
Carpooled 5% 0% 8%
Used rail transit 3% 1% 17%
Took bus 1% 4% 12%
Walked/ Biked 1% 3% 5%
Other mode 1% 0% 0%
This finding is also consistent with national research. “The availability of free or low-cost parking is a major deterrent to transit ridership.” (Arrington & Cervero, 2008) “When commuters can park their cars for free at work, they are more likely to drive alone.” (Hess, 2001)
Who is TOD in Metro Denver? Employee Survey Report April 2010
Page 27
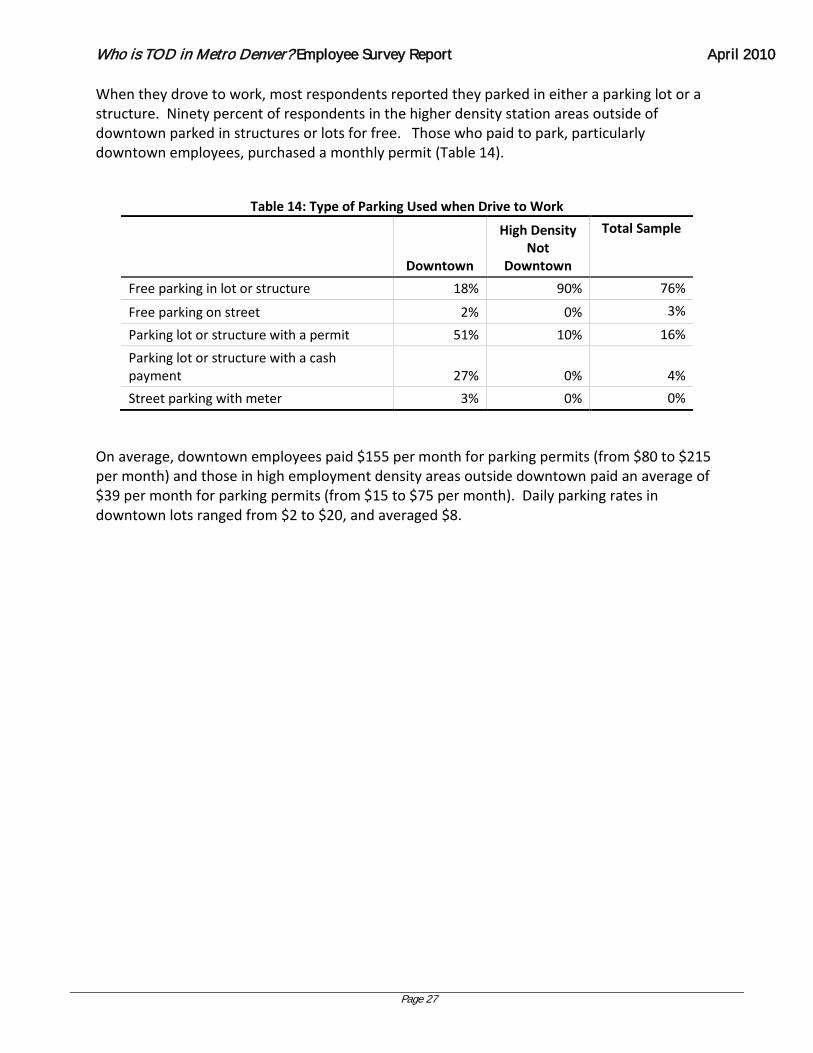
When they drove to work, most respondents reported they parked in either a parking lot or a structure. Ninety percent of respondents in the higher density station areas outside of downtown parked in structures or lots for free. Those who paid to park, particularly downtown employees, purchased a monthly permit (Table 14).
Table 14: Type of Parking Used when Drive to Work
Downtown
High Density Not
Downtown
Total Sample
Free parking in lot or structure 18% 90% 76%
Free parking on street 2% 0% 3%
Parking lot or structure with a permit 51% 10% 16%
Parking lot or structure with a cash payment 27% 0% 4%
Street parking with meter 3% 0% 0%
On average, downtown employees paid $155 per month for parking permits (from $80 to $215 per month) and those in high employment density areas outside downtown paid an average of $39 per month for parking permits (from $15 to $75 per month). Daily parking rates in downtown lots ranged from $2 to $20, and averaged $8.
Who is TOD in Metro Denver? Employee Survey Report April 2010
Page 28
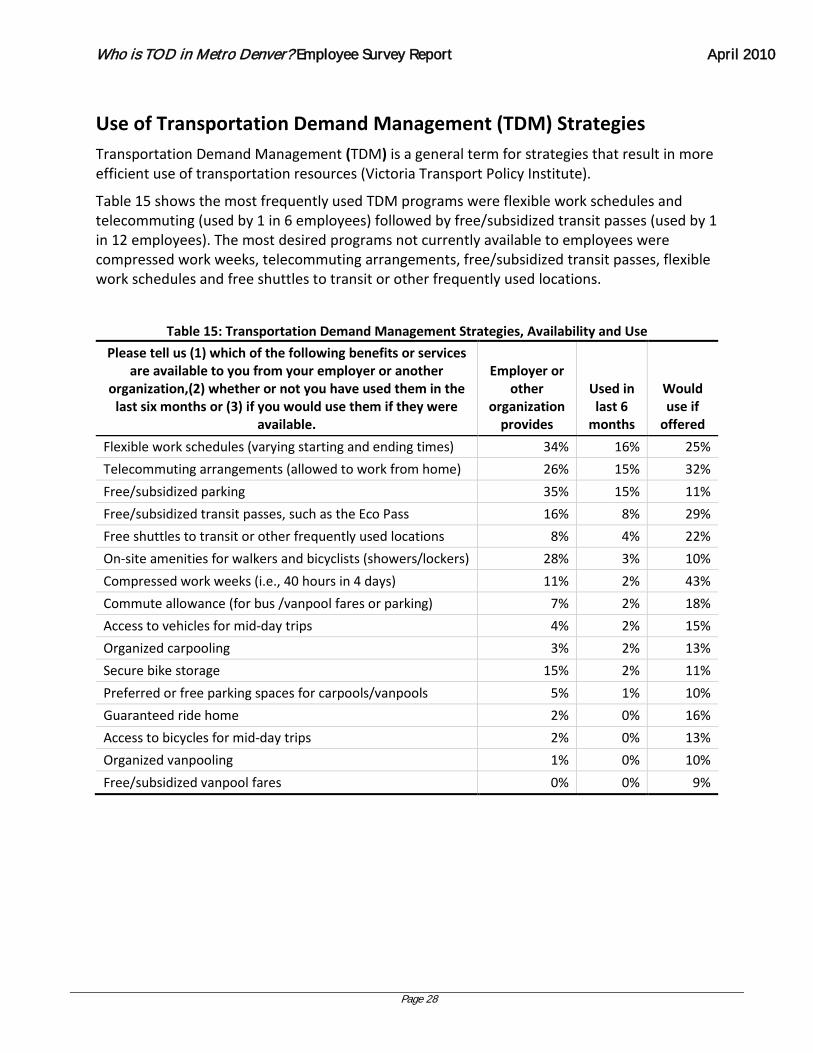
Use of Transportation Demand Management (TDM) Strategies Transportation Demand Management (TDM) is a general term for strategies that result in more efficient use of transportation resources (Victoria Transport Policy Institute).
Table 15 shows the most frequently used TDM programs were flexible work schedules and telecommuting (used by 1 in 6 employees) followed by free/subsidized transit passes (used by 1 in 12 employees). The most desired programs not currently available to employees were compressed work weeks, telecommuting arrangements, free/subsidized transit passes, flexible work schedules and free shuttles to transit or other frequently used locations.
Table 15: Transportation Demand Management Strategies, Availability and Use
Please tell us (1) which of the following benefits or services are available to you from your employer or another
organization,(2) whether or not you have used them in the last six months or (3) if you would use them if they were
available.
Employer or other
organization provides
Used in last 6
months
Would use if
offered
Flexible work schedules (varying starting and ending times) 34% 16% 25%
Telecommuting arrangements (allowed to work from home) 26% 15% 32%
Free/subsidized parking 35% 15% 11%
Free/subsidized transit passes, such as the Eco Pass 16% 8% 29%
Free shuttles to transit or other frequently used locations 8% 4% 22%
On-site amenities for walkers and bicyclists (showers/lockers) 28% 3% 10%
Compressed work weeks (i.e., 40 hours in 4 days) 11% 2% 43%
Commute allowance (for bus /vanpool fares or parking) 7% 2% 18%
Access to vehicles for mid-day trips 4% 2% 15%
Organized carpooling 3% 2% 13%
Secure bike storage 15% 2% 11%
Preferred or free parking spaces for carpools/vanpools 5% 1% 10%
Guaranteed ride home 2% 0% 16%
Access to bicycles for mid-day trips 2% 0% 13%
Organized vanpooling 1% 0% 10%
Free/subsidized vanpool fares 0% 0% 9%
Who is TOD in Metro Denver? Employee Survey Report April 2010
Page 29
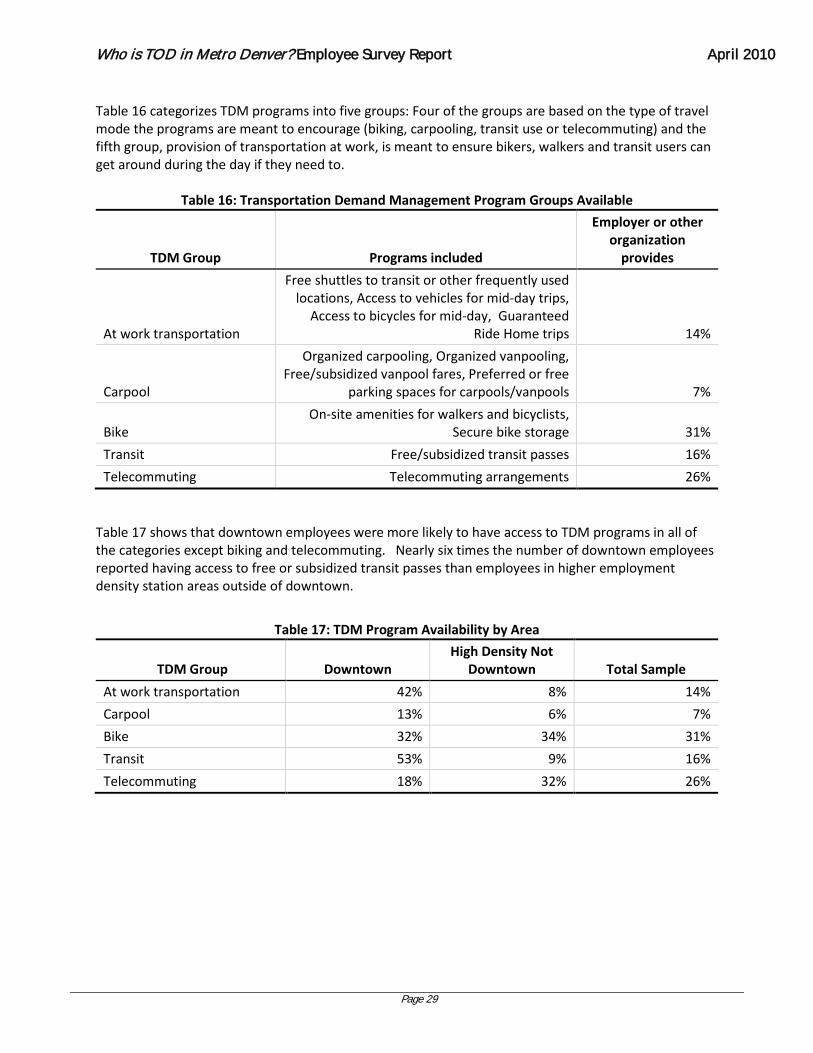
Table 16 categorizes TDM programs into five groups: Four of the groups are based on the type of travel mode the programs are meant to encourage (biking, carpooling, transit use or telecommuting) and the fifth group, provision of transportation at work, is meant to ensure bikers, walkers and transit users can get around during the day if they need to.
Table 16: Transportation Demand Management Program Groups Available
TDM Group Programs included
Employer or other organization
provides
At work transportation
Free shuttles to transit or other frequently used locations, Access to vehicles for mid-day trips,
Access to bicycles for mid-day, Guaranteed Ride Home trips 14%
Carpool
Organized carpooling, Organized vanpooling, Free/subsidized vanpool fares, Preferred or free
parking spaces for carpools/vanpools 7%
Bike On-site amenities for walkers and bicyclists,
Secure bike storage 31%
Transit Free/subsidized transit passes 16%
Telecommuting Telecommuting arrangements 26%
Table 17 shows that downtown employees were more likely to have access to TDM programs in all of the categories except biking and telecommuting. Nearly six times the number of downtown employees reported having access to free or subsidized transit passes than employees in higher employment density station areas outside of downtown.
Table 17: TDM Program Availability by Area
TDM Group Downtown High Density Not
Downtown Total Sample
At work transportation 42% 8% 14%
Carpool 13% 6% 7%
Bike 32% 34% 31%
Transit 53% 9% 16%
Telecommuting 18% 32% 26%
Who is TOD in Metro Denver? Employee Survey Report April 2010
Page 30
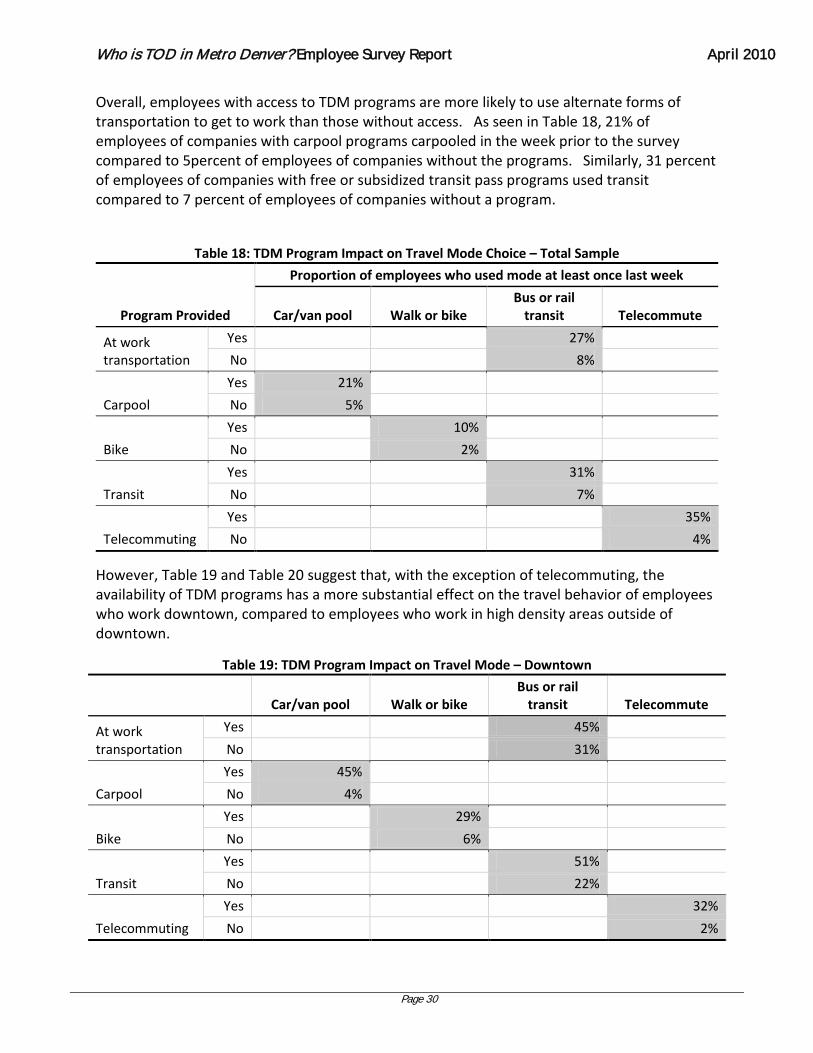
Overall, employees with access to TDM programs are more likely to use alternate forms of transportation to get to work than those without access. As seen in Table 18, 21% of employees of companies with carpool programs carpooled in the week prior to the survey compared to 5percent of employees of companies without the programs. Similarly, 31 percent of employees of companies with free or subsidized transit pass programs used transit compared to 7 percent of employees of companies without a program.
Table 18: TDM Program Impact on Travel Mode Choice – Total Sample
Program Provided
Proportion of employees who used mode at least once last week
Car/van pool Walk or bike Bus or rail
transit Telecommute
At work transportation
Yes 27%
No 8%
Carpool
Yes 21%
No 5%
Bike
Yes 10%
No 2%
Transit
Yes 31%
No 7%
Telecommuting
Yes 35%
No 4%
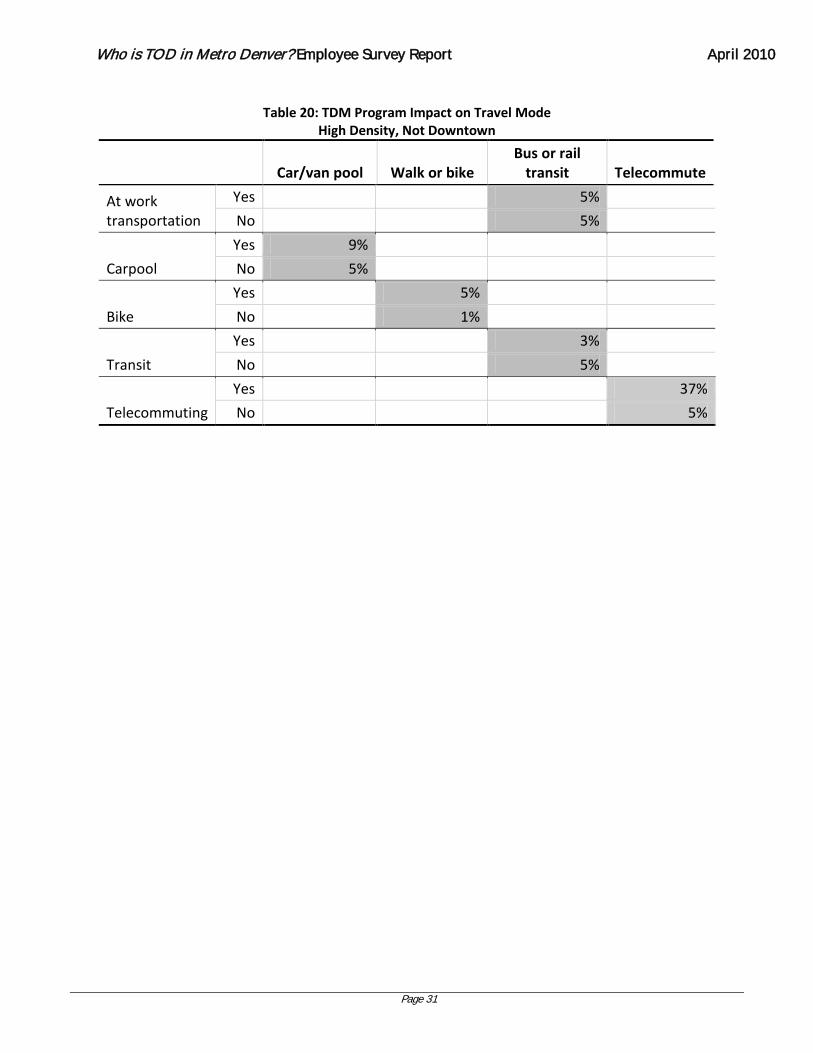
However, Table 19 and Table 20 suggest that, with the exception of telecommuting, the availability of TDM programs has a more substantial effect on the travel behavior of employees who work downtown, compared to employees who work in high density areas outside of downtown.
Table 19: TDM Program Impact on Travel Mode – Downtown
Car/van pool Walk or bike Bus or rail
transit Telecommute
At work transportation
Yes 45%
No 31%
Carpool
Yes 45%
No 4%
Bike
Yes 29%
No 6%
Transit
Yes 51%
No 22%
Telecommuting
Yes 32%
No 2%
Who is TOD in Metro Denver? Employee Survey Report April 2010
Page 31
Table 20: TDM Program Impact on Travel Mode
High Density, Not Downtown
Car/van pool Walk or bike Bus or rail
transit Telecommute
At work transportation
Yes 5%
No 5%
Carpool
Yes 9%
No 5%
Bike
Yes 5%
No 1%
Transit
Yes 3%
No 5%
Telecommuting
Yes 37%
No 5%
Who is TOD in Metro Denver? Employee Survey Report April 2010
Page 32
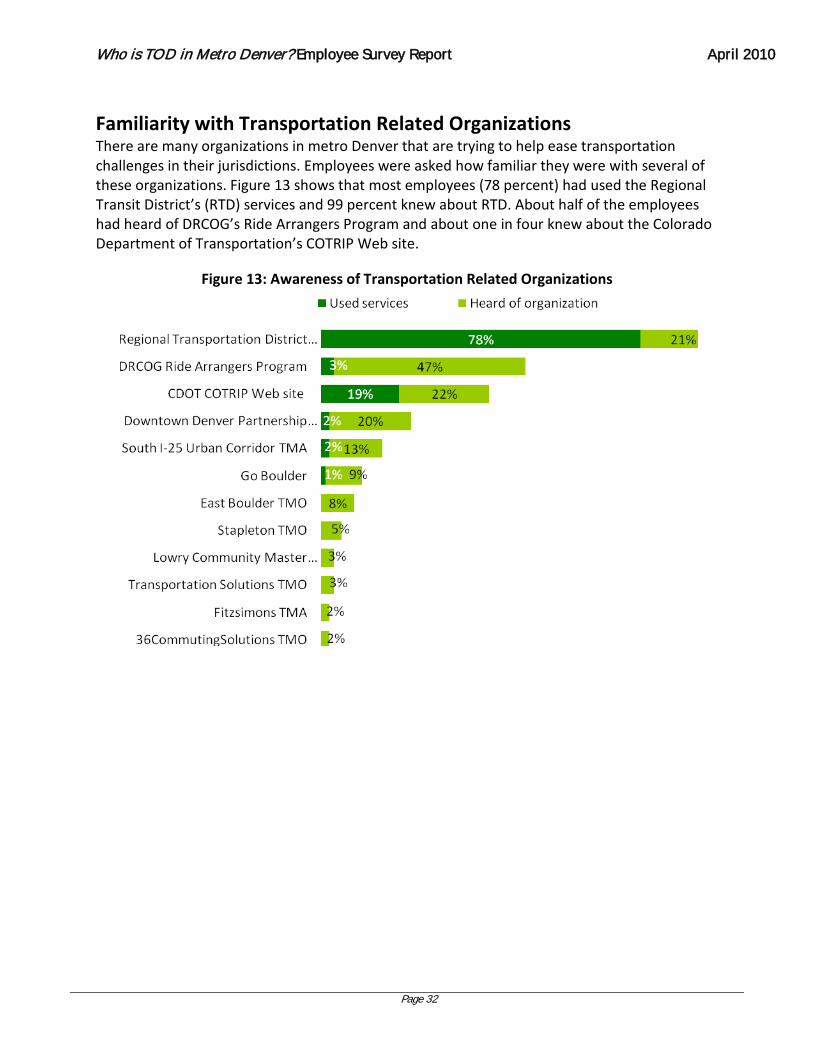
Familiarity with Transportation Related Organizations There are many organizations in metro Denver that are trying to help ease transportation challenges in their jurisdictions. Employees were asked how familiar they were with several of these organizations. Figure 13 shows that most employees (78 percent) had used the Regional Transit District’s (RTD) services and 99 percent knew about RTD. About half of the employees had heard of DRCOG’s Ride Arrangers Program and about one in four knew about the Colorado Department of Transportation’s COTRIP Web site.
Figure 13: Awareness of Transportation Related Organizations

Who is TOD in Metro Denver? Employee Survey Report April 2010
Page 33
Conclusion Similar to the business report, this study’s key findings indicate that metro Denver is early on the TOD evolutionary curve, with an auto orientation still dominating employee commute behaviors in station areas outside of downtown. Half (50 percent) of downtown employees reported that they commute by alternative modes other than driving alone. In contrast, 87 percent of employees within walking distance of higher employment density station areas outside of downtown reported driving alone to work. While part of this difference in mode choice between areas is likely attributable to downtown Denver being the region’s central business district (CBD), other factors may be at play. Studies conducted in other regions suggest that suburban stations areas are not predestined to remain auto oriented. Studies indicate that several place-based characteristics may play an important role in influencing employee mode choice. Free, convenient parking, abundant at station areas outside of downtown, is known to discourage the use of alternative modes (Hess 2001; Arrington & Cervero, 2008). The proximity of employment density to station areas is known to increase transit ridership (Arrington & Cervero, 2008). Quality pedestrian environments are also associated with increasing transit use (Lund, 2004; Cervero, 2006). Last but not least, completing FasTracks promises to provide the backbone of a regional transit system that will help transit compete more effectively as the commute mode of choice for more employees. Policy questions for discussion and debate include:
• Is TOD performing as expected? • Does this information suggest any policy changes? • Is a regional parking policy needed to encourage the use of alternative transportation
modes to access jobs in station areas outside of downtown? • What investments or policy decisions can best help local governments and the region
successfully implement and evolve TOD? • What additional research should be conducted to help guide these decisions?
Readers of this report are encouraged and welcomed to perform additional analysis of the data collected in this study. Caution is advised. As the sample is subdivided, margins of error increase. See the “Representativeness of the Results” in Appendix E. Data can be downloaded from: http://gis.drcog.org/datacatalog/index.php?subjectid=23&searchButton=Go Contact Tom Boone, DRCOG TOD Project Manager at 303-480-6776 or [email protected] for further information.
Who is TOD in Metro Denver? Employee Survey Report April 2010
Page 34
Bibliography Arrington, G., & Cervero, R. (2008). TCRP Report 128: Effects of TOD on Housing, Parking and Travel. Washington, D.C.: Transporatation Research Board. Cambridge Systematics. (1994). The Effects of Land Use and Travel Demand Management Strategies on Commuting Behavior. Travel Model Improvement Program, USDOT . Cervero, R. (2006). Office Development, Rail Transit, and Commuting Choices. Journal of Public Transportation , pp. 41 - 55. Eaves, E. (2009, April 10). In This Recession, Men Drop Out. Retrieved February 2, 2010, from Forbes.com: http://www.forbes.com/2009/04/09/employment-men-women-recession-opinions-columnists-gender-roles.html Hess, D. B. (2001). The Effects of Free Parking on Commuter Mode Choice: Evidence from Travel Diary Data. Los Angeles, CA: The Ralph and Goldy Lewis Center for Regional Policy Studies. LDA Consulting, Southeastern Institute of Research. (2008). 2008 ACCS Commercial Building Study. Arlington County's Transportation Demand Management Research Center. Lund, C. W. (2004). Travel Characteristics of Transit Oriented Development in California. Caltrans Transportation Grant—“Statewide Planning Studies”—FTA Section 5313 (b). Victoria Transport Policy Institute. (n.d.). Online TDM Encyclopedia. Retrieved Februrary 16, 2010, from Victoria Transport Policy Institute: http://www.vtpi.org/tdm/