Embed Size (px)
Citation preview

Benchmarking Tools and Analysis

SelectedBenchmarking Toolsand Data Sources
•IPEDS (Integrated Postsecondary Education Data System)
•WICHE (Western Interstate Commission for Higher Education)
•Delta Cost Project (funded by Lumina Foundation)
•Delaware Study (National Study of Instructional Cost and Productivity)
•CUPA HR (Salary comparisons)
•NCHEMS (National Center for Higher Education Management Systems)
•SHEEO (State Higher Education Executive Officers)

What kinds of data are available?

Student Data
• Enrollment• Incoming credentials• Demographics• Student success

Faculty Data
• FTE• Credentials• Demographics• Salaries
Institutional Data
• Category (public/private)• Size (enrollment, funding)• Program array• Admission requirements, profiles
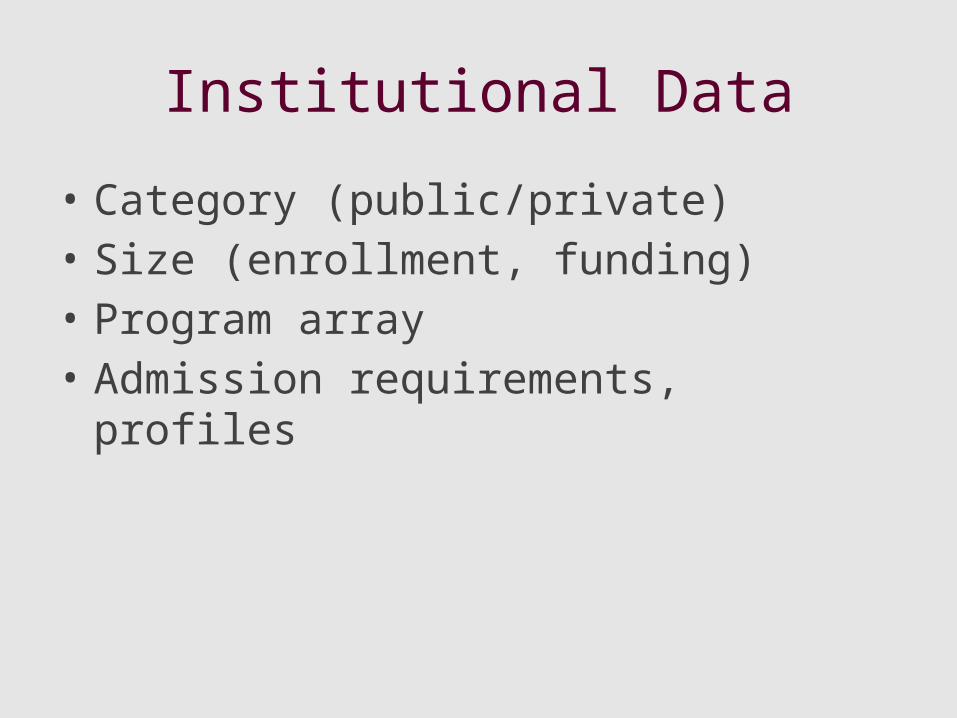
Financial Data
• Expenditures by program• Tuition rates• Financial aid • Funding by source
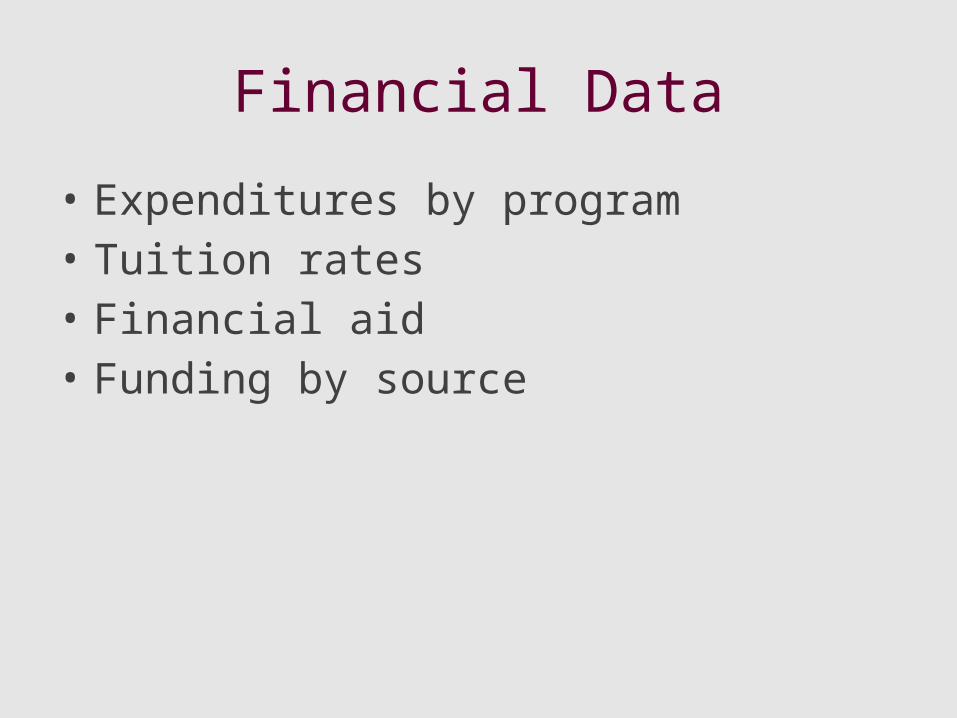
Selected Reporting Tools
• IPEDS (Data Feedback Report)
• IPEDS (Executive Peer Analysis Tool)
• IPEDS (Custom queries)
• NCHEMS (Interactive benchmarking reports)
• WICHE (Electronic Fact Book)
• DELTA PROJECT (TCS Online)
Comparison with other Public Flagship Universities
(Population ≤ 2 million)
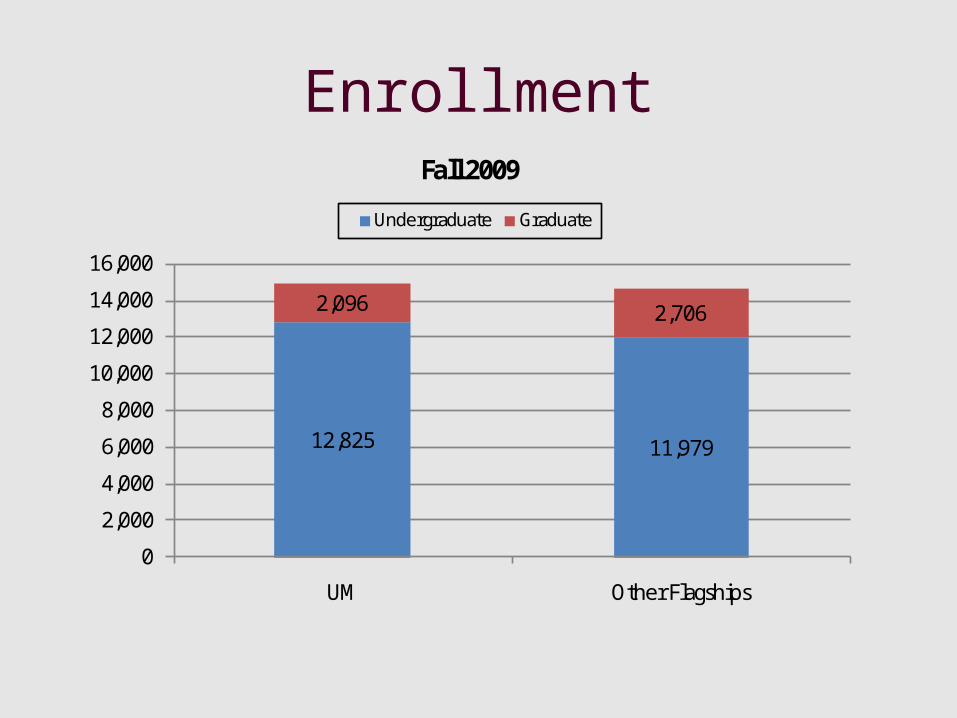
Enrollment
12,825 11,979
2,096 2,706
0
2,000
4,000
6,000
8,000
10,000
12,000
14,000
16,000
UM Other Flagships
Fall 2009
Undergraduate Graduate
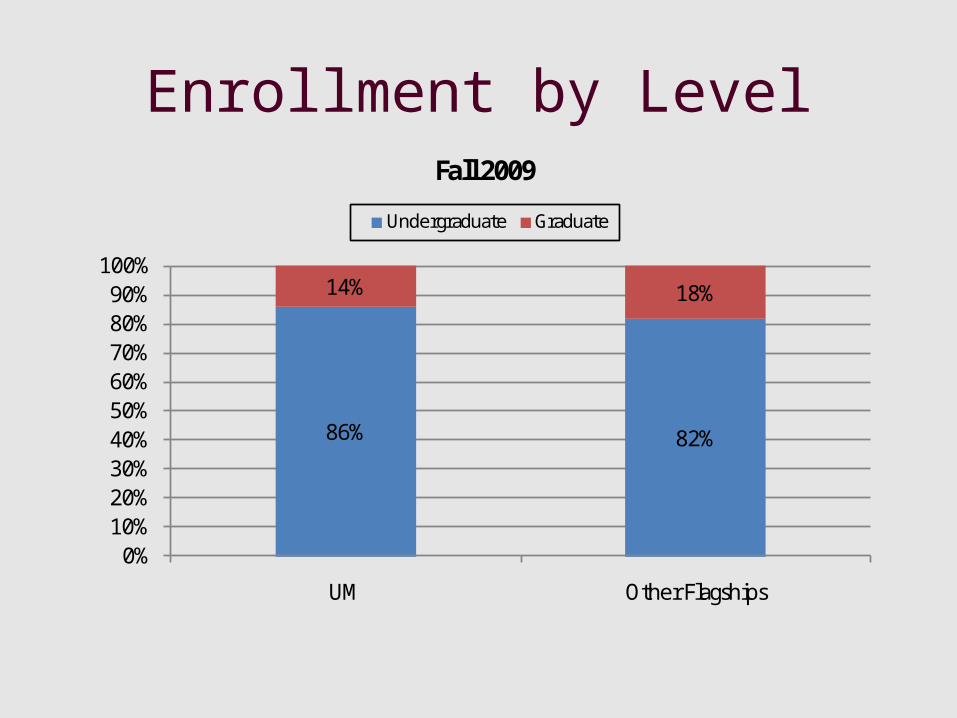
Enrollment by Level
86% 82%
14% 18%
0%10%20%30%40%50%60%70%80%90%
100%
UM Other Flagships
Fall 2009
Undergraduate Graduate
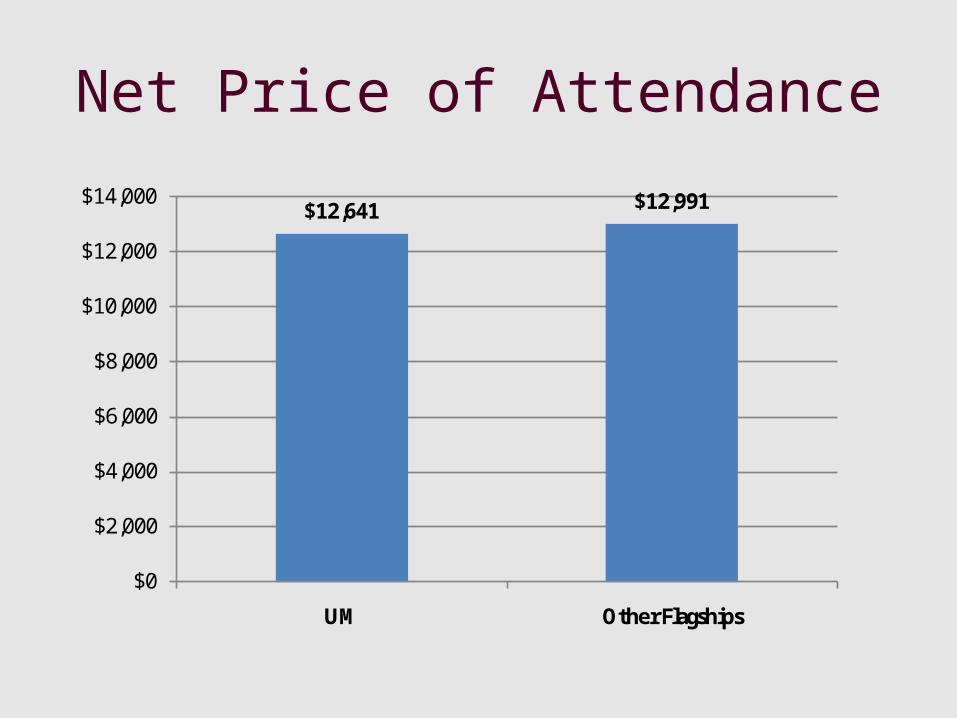
Net Price of Attendance
$12,641 $12,991
$0
$2,000
$4,000
$6,000
$8,000
$10,000
$12,000
$14,000
UM Other Flagships
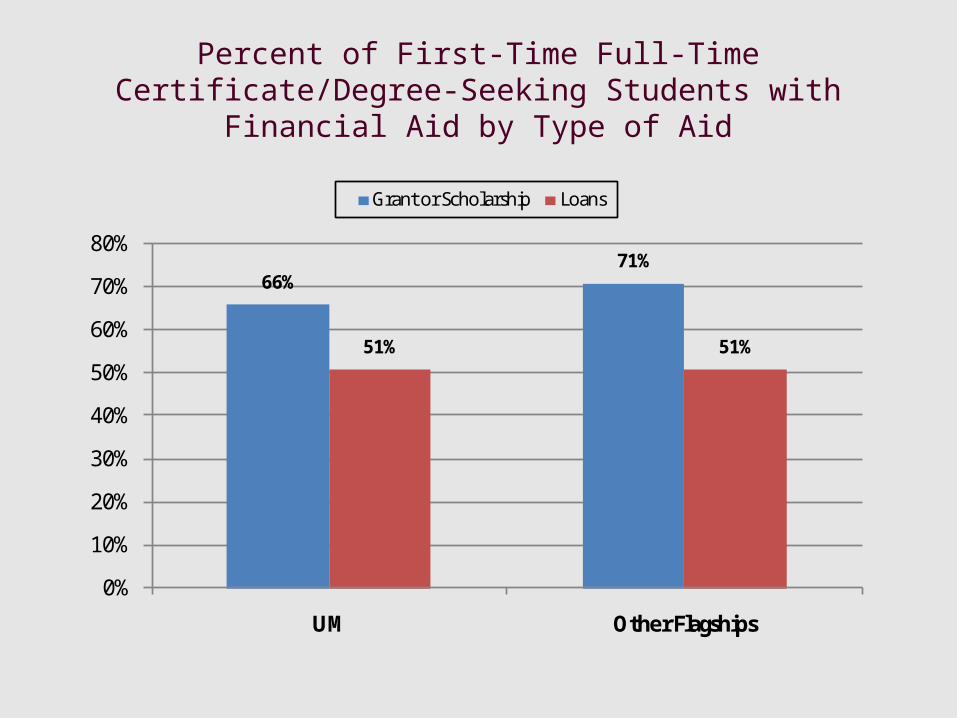
Percent of First-Time Full-Time Certificate/Degree-Seeking Students with Financial Aid by Type of Aid
66%71%
51% 51%
0%
10%
20%
30%
40%
50%
60%
70%
80%
UM Other Flagships
Grant or Scholarship Loans
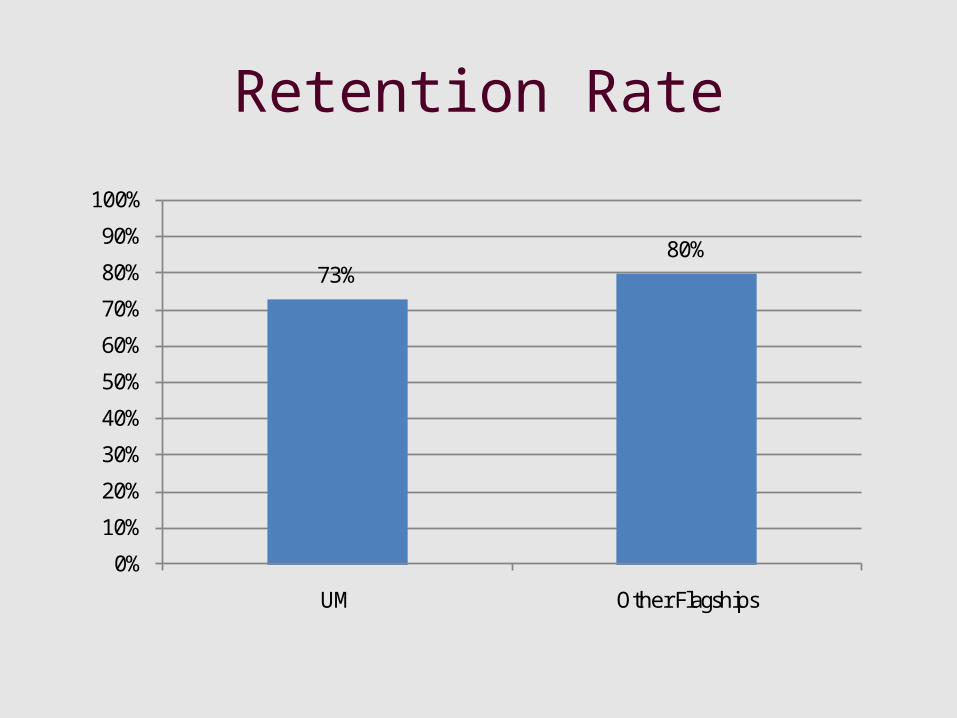
Retention Rate
73%80%
0%
10%
20%
30%
40%
50%
60%
70%
80%
90%
100%
UM Other Flagships
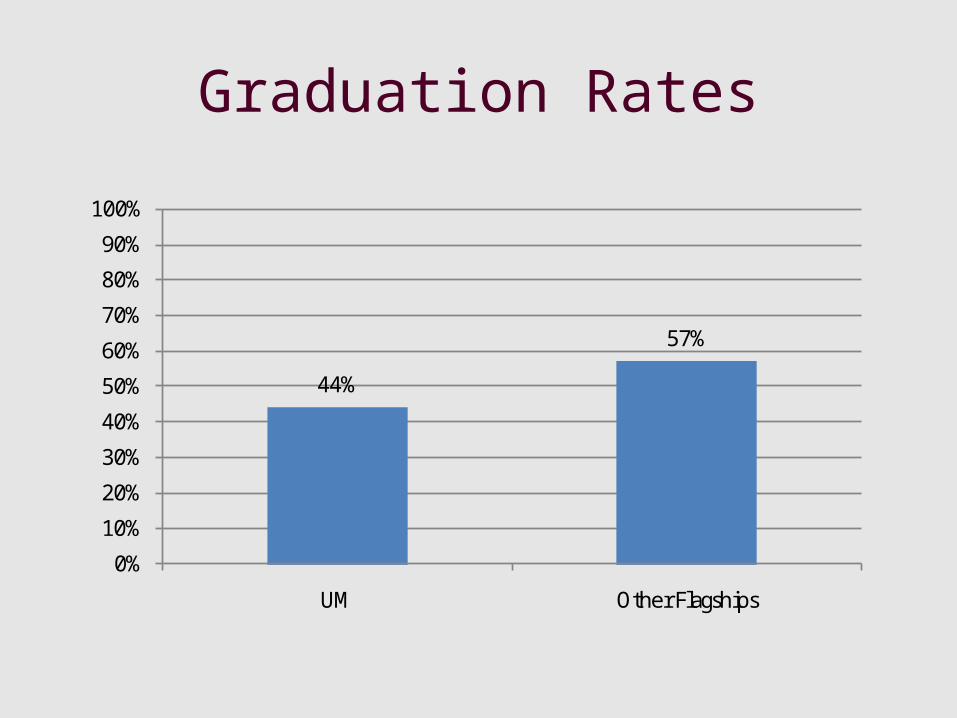
Graduation Rates
44%
57%
0%
10%
20%
30%
40%
50%
60%
70%
80%
90%
100%
UM Other Flagships
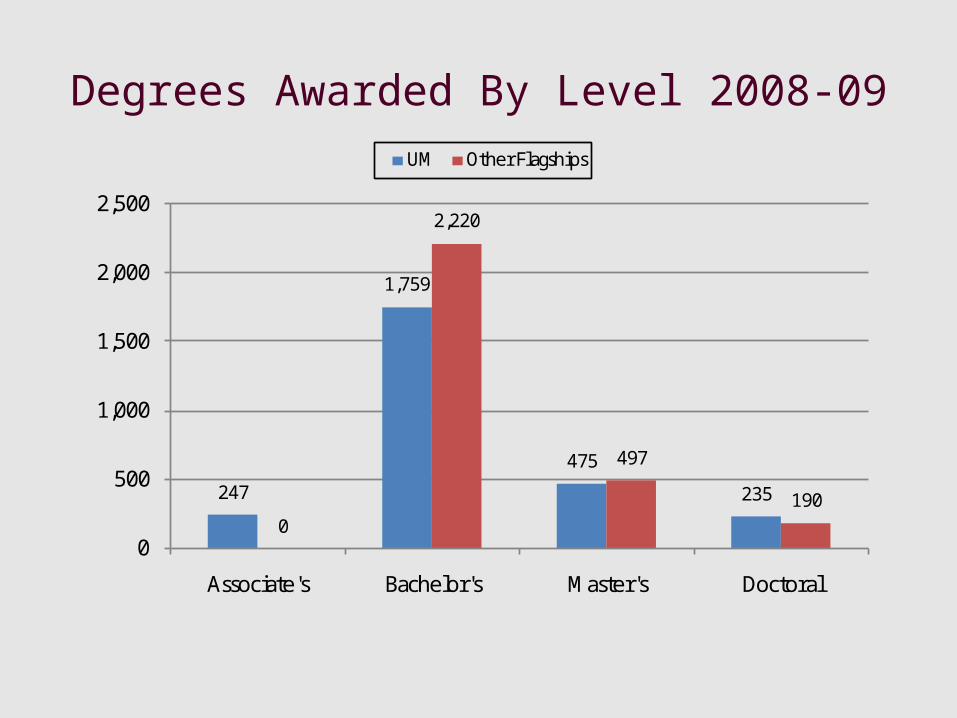
Degrees Awarded By Level 2008-09
247
1,759
475
235
0
2,220
497
190
0
500
1,000
1,500
2,000
2,500
Associate's Bachelor's Master's Doctoral
UM Other Flagships
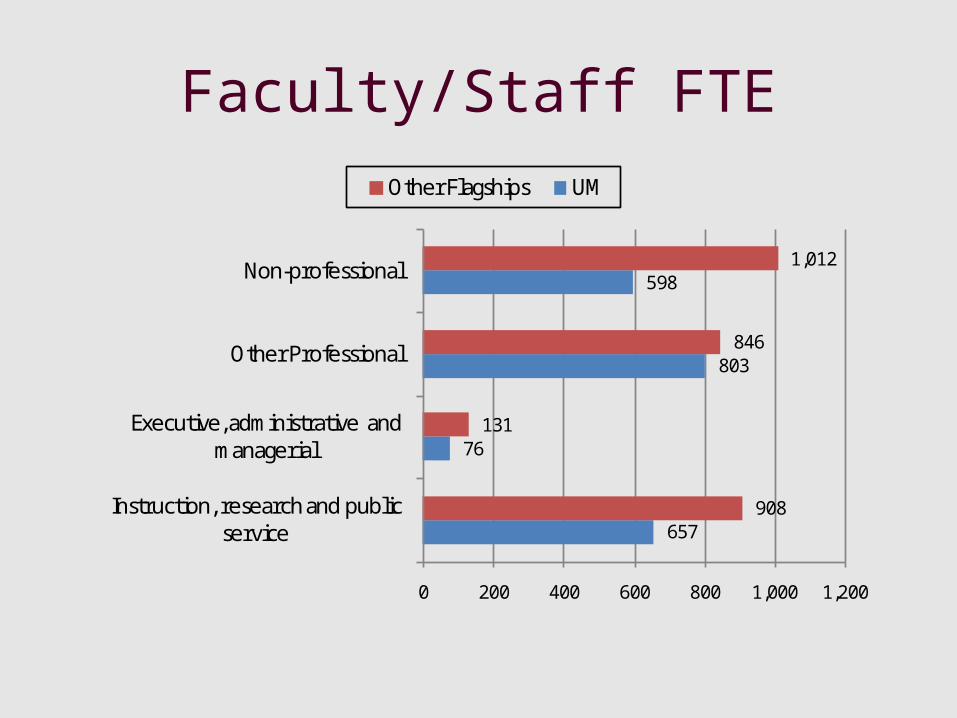
Faculty/Staff FTE
657
76
803
598
908
131
846
1,012
0 200 400 600 800 1,000 1,200
Instruction, research and public service
Executive, administrative and managerial
Other Professional
Non-professional
Other Flagships UM
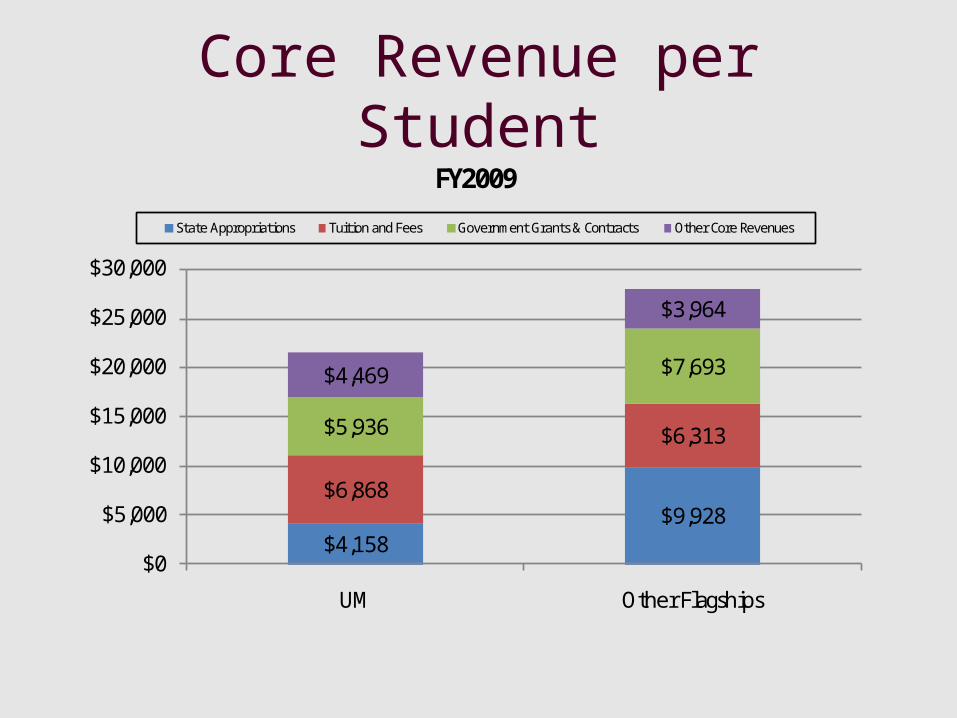
Core Revenue per Student
$4,158$9,928
$6,868
$6,313$5,936
$7,693$4,469
$3,964
$0
$5,000
$10,000
$15,000
$20,000
$25,000
$30,000
UM Other Flagships
FY2009
State Appropriations Tuition and Fees Government Grants & Contracts Other Core Revenues
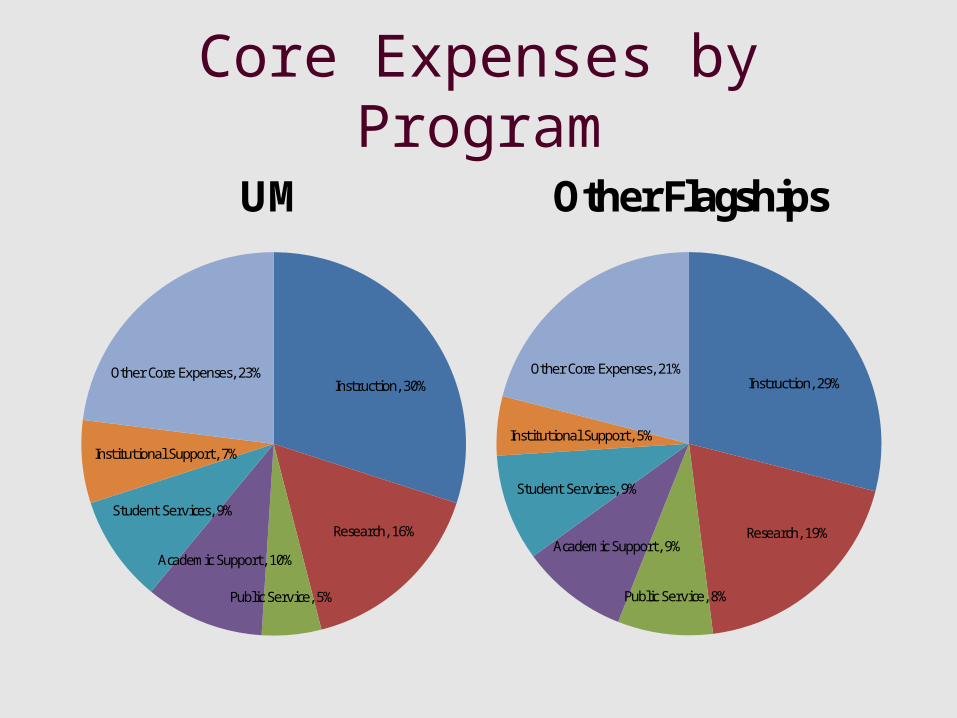
Core Expenses by Program
Instruction, 30%
Research, 16%
Public Service, 5%
Academic Support, 10%
Student Services, 9%
Institutional Support, 7%
Other Core Expenses, 23%
UM
Instruction, 29%
Research, 19%
Public Service, 8%
Academic Support, 9%
Student Services, 9%
Institutional Support, 5%
Other Core Expenses, 21%
Other Flagships

Tuition Comparison
WICHE States
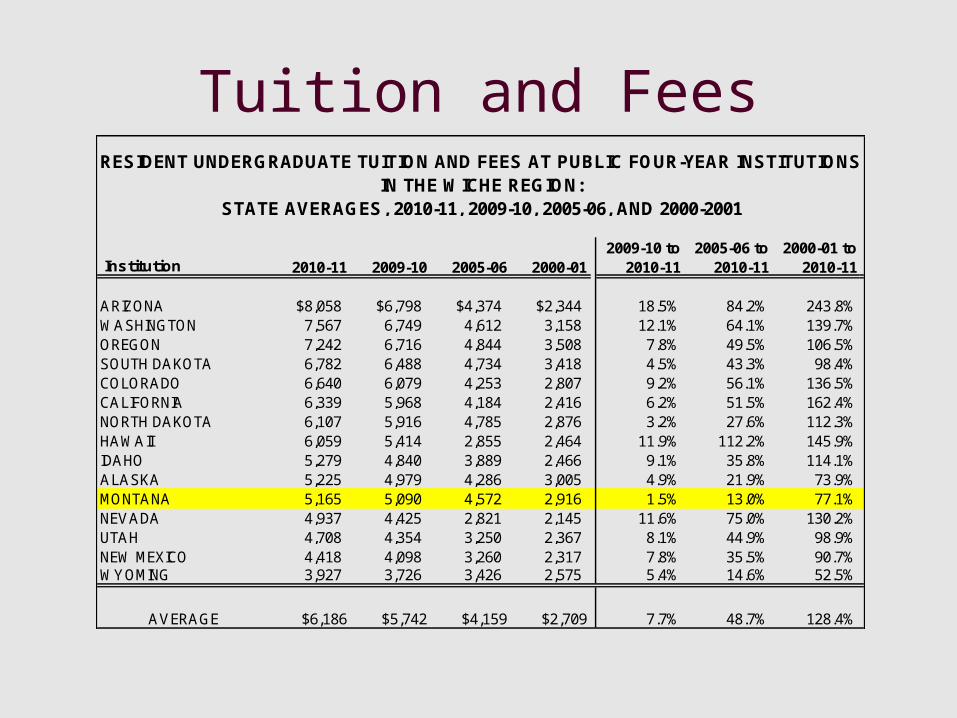
Tuition and Fees
2009-10 to 2005-06 to 2000-01 to Institution 2010-11 2009-10 2005-06 2000-01 2010-11 2010-11 2010-11
ARIZONA $8,058 $6,798 $4,374 $2,344 18.5% 84.2% 243.8%WASHINGTON 7,567 6,749 4,612 3,158 12.1% 64.1% 139.7%OREGON 7,242 6,716 4,844 3,508 7.8% 49.5% 106.5%SOUTH DAKOTA 6,782 6,488 4,734 3,418 4.5% 43.3% 98.4%COLORADO 6,640 6,079 4,253 2,807 9.2% 56.1% 136.5%CALIFORNIA 6,339 5,968 4,184 2,416 6.2% 51.5% 162.4%NORTH DAKOTA 6,107 5,916 4,785 2,876 3.2% 27.6% 112.3%HAWAII 6,059 5,414 2,855 2,464 11.9% 112.2% 145.9%IDAHO 5,279 4,840 3,889 2,466 9.1% 35.8% 114.1%ALASKA 5,225 4,979 4,286 3,005 4.9% 21.9% 73.9%MONTANA 5,165 5,090 4,572 2,916 1.5% 13.0% 77.1%NEVADA 4,937 4,425 2,821 2,145 11.6% 75.0% 130.2%UTAH 4,708 4,354 3,250 2,367 8.1% 44.9% 98.9%NEW MEXICO 4,418 4,098 3,260 2,317 7.8% 35.5% 90.7%WYOMING 3,927 3,726 3,426 2,575 5.4% 14.6% 52.5%
$6,186 $5,742 $4,159 $2,709 7.7% 48.7% 128.4%AVERAGE
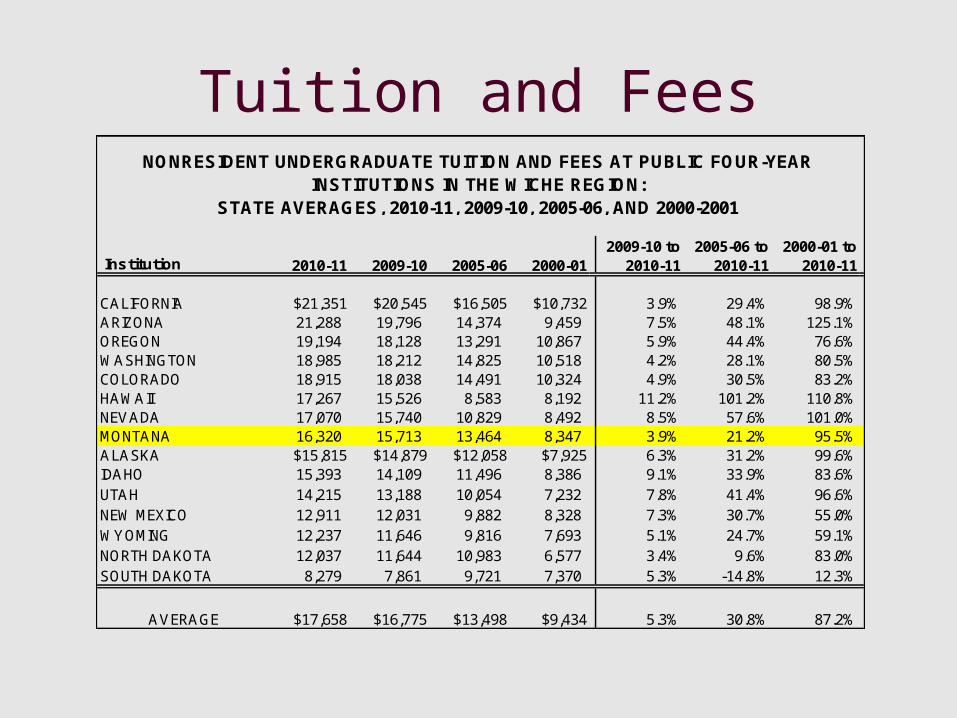
RESIDENT UNDERGRADUATE TUITION AND FEES AT PUBLIC FOUR-YEAR INSTITUTIONS IN THE WICHE REGION:
STATE AVERAGES, 2010-11, 2009-10, 2005-06, AND 2000-2001
Tuition and Fees
2009-10 to 2005-06 to 2000-01 to Institution 2010-11 2009-10 2005-06 2000-01 2010-11 2010-11 2010-11
CALIFORNIA $21,351 $20,545 $16,505 $10,732 3.9% 29.4% 98.9%ARIZONA 21,288 19,796 14,374 9,459 7.5% 48.1% 125.1%OREGON 19,194 18,128 13,291 10,867 5.9% 44.4% 76.6%WASHINGTON 18,985 18,212 14,825 10,518 4.2% 28.1% 80.5%COLORADO 18,915 18,038 14,491 10,324 4.9% 30.5% 83.2%HAWAII 17,267 15,526 8,583 8,192 11.2% 101.2% 110.8%NEVADA 17,070 15,740 10,829 8,492 8.5% 57.6% 101.0%MONTANA 16,320 15,713 13,464 8,347 3.9% 21.2% 95.5%ALASKA $15,815 $14,879 $12,058 $7,925 6.3% 31.2% 99.6%IDAHO 15,393 14,109 11,496 8,386 9.1% 33.9% 83.6%UTAH 14,215 13,188 10,054 7,232 7.8% 41.4% 96.6%NEW MEXICO 12,911 12,031 9,882 8,328 7.3% 30.7% 55.0%WYOMING 12,237 11,646 9,816 7,693 5.1% 24.7% 59.1%NORTH DAKOTA 12,037 11,644 10,983 6,577 3.4% 9.6% 83.0%SOUTH DAKOTA 8,279 7,861 9,721 7,370 5.3% -14.8% 12.3%
$17,658 $16,775 $13,498 $9,434 5.3% 30.8% 87.2%AVERAGE
NONRESIDENT UNDERGRADUATE TUITION AND FEES AT PUBLIC FOUR-YEAR INSTITUTIONS IN THE WICHE REGION:
STATE AVERAGES, 2010-11, 2009-10, 2005-06, AND 2000-2001
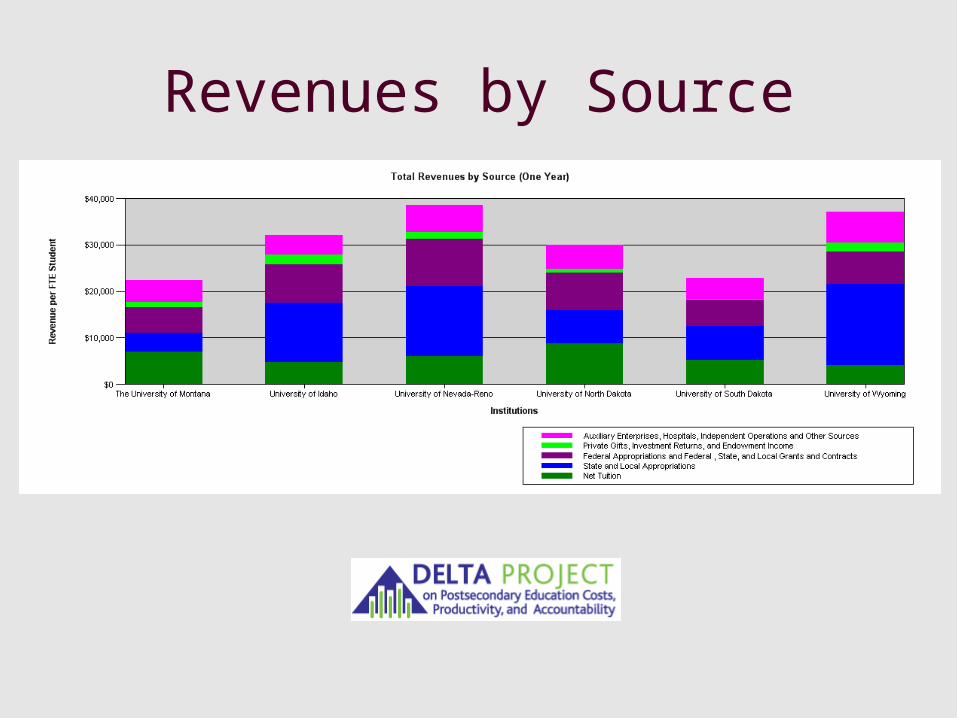
Revenues by Source