Embed Size (px)
Citation preview

1
Benchmarks and Best Practices in the Emergency Department
Jeanne McGraynePremier Consulting Solutions
2
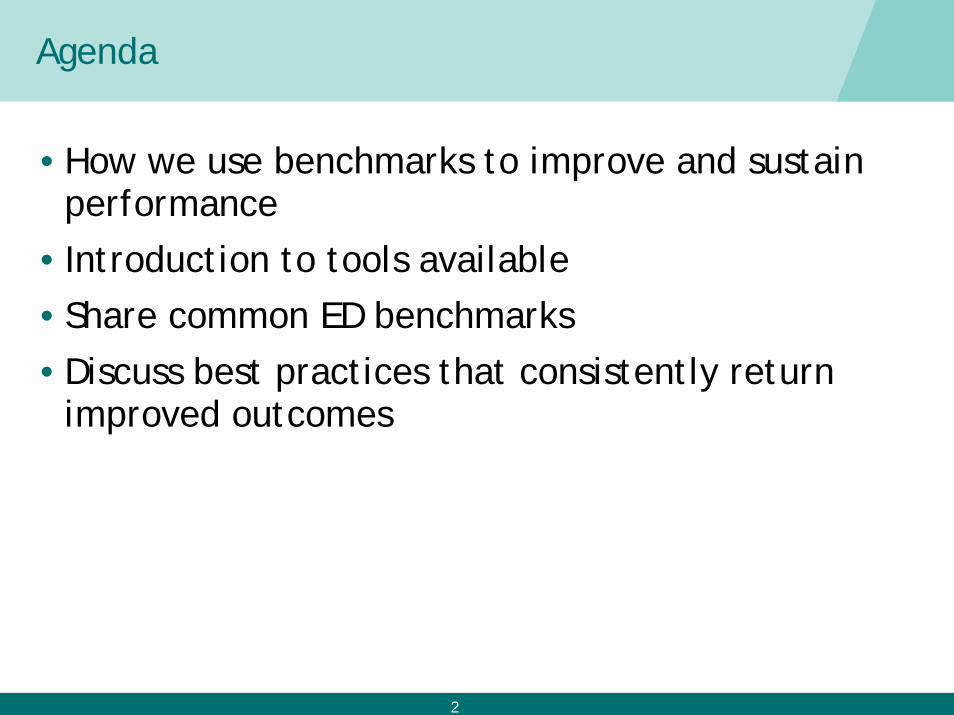
Agenda
•How we use benchmarks to improve and sustain performance
• Introduction to tools available•Share common ED benchmarks•Discuss best practices that consistently return
improved outcomes
3
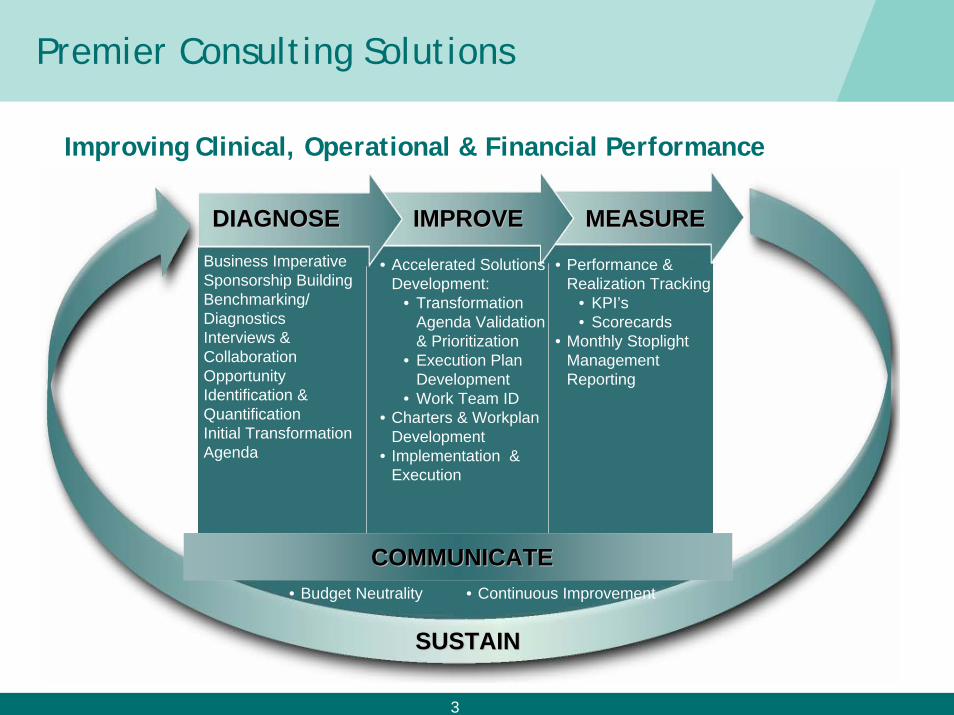
Premier Consulting Solutions
Improving Clinical, Operational & Financial Performance
DIAGNOSEDIAGNOSE IMPROVEIMPROVE MEASUREMEASURE
SUSTAINSUSTAIN
• Business Imperative • Sponsorship Building• Benchmarking/
Diagnostics • Interviews &
Collaboration• Opportunity
Identification & Quantification
• Initial Transformation Agenda
• Performance & Realization Tracking
• KPI’s• Scorecards
• Monthly Stoplight Management Reporting
• Accelerated Solutions Development:
• Transformation Agenda Validation & Prioritization
• Execution Plan Development
• Work Team ID • Charters & Workplan
Development• Implementation &
Execution
COMMUNICATECOMMUNICATE• Budget Neutrality • Continuous Improvement

4
Trends and Issues in Emergency Care
• It’s all about the Economy• Patients• Staff • Physicians• Payers
• Increasing regulatory pressure
•What does it mean for ED Operations?
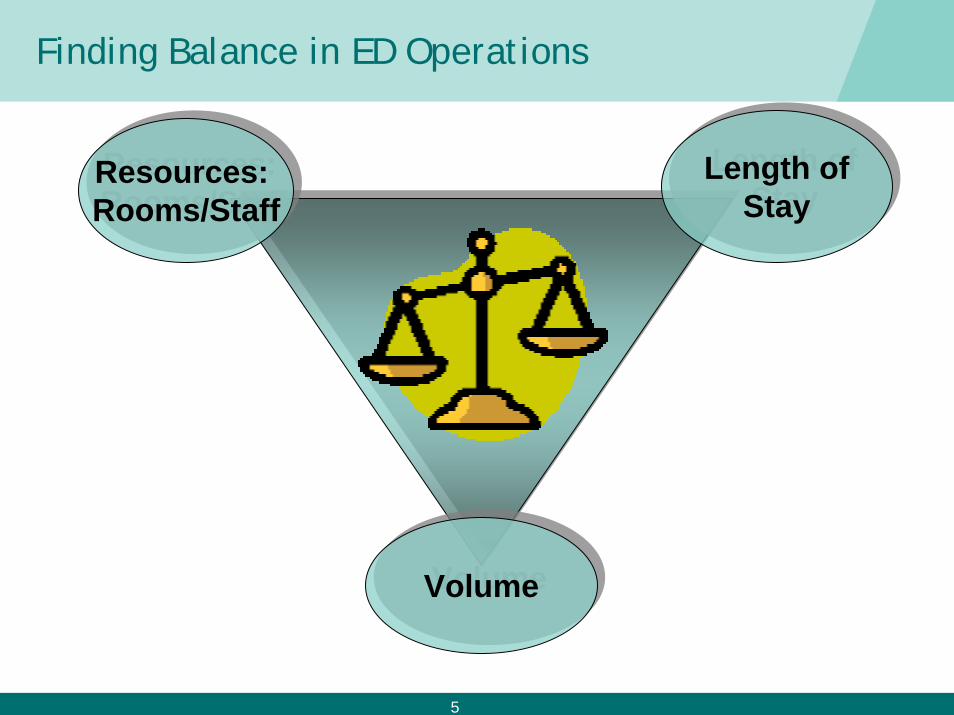
5
Finding Balance in ED Operations
Resources: Rooms/StaffResources: Rooms/Staff
Length ofStay
Length ofStay
VolumeVolume

6
Why Benchmark?
•To set goals•To find peer organizations•To discover better performing organizations•To identify practices which result in better
outcomes
7
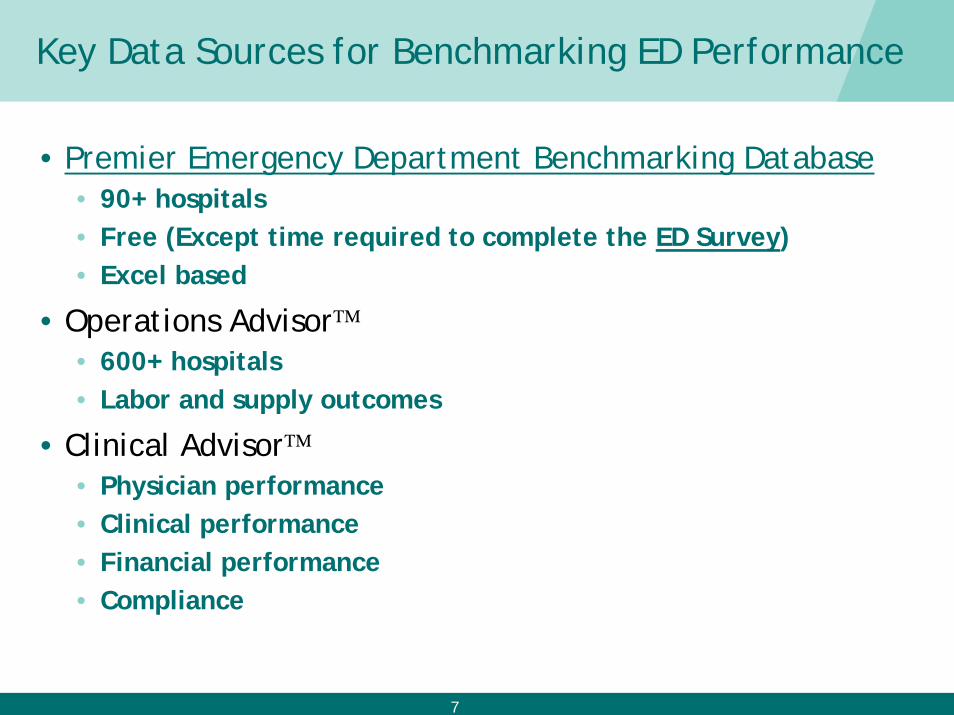
Key Data Sources for Benchmarking ED Performance
• Premier Emergency Department Benchmarking Database• 90+ hospitals • Free (Except time required to complete the ED Survey)• Excel based
• Operations Advisor™• 600+ hospitals • Labor and supply outcomes
• Clinical Advisor™• Physician performance• Clinical performance• Financial performance• Compliance
8
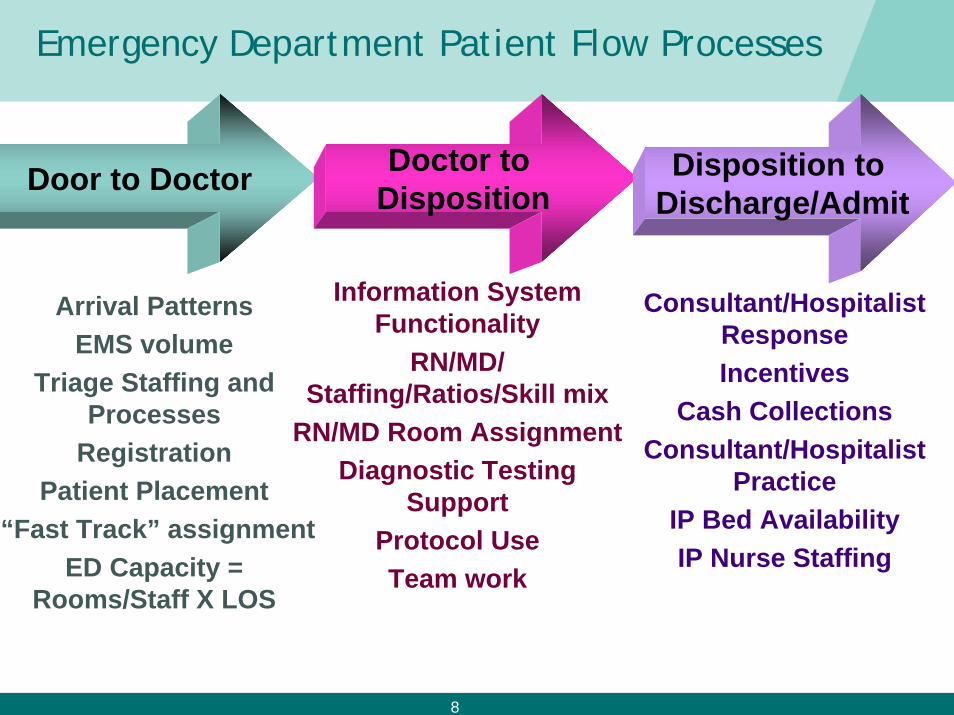
Emergency Department Patient Flow Processes
Door to Doctor Doctor to Disposition
Disposition to Discharge/Admit
Arrival PatternsEMS volume
Triage Staffing and Processes
RegistrationPatient Placement
“Fast Track” assignmentED Capacity =
Rooms/Staff X LOS
Information System Functionality
RN/MD/ Staffing/Ratios/Skill mix
RN/MD Room AssignmentDiagnostic Testing
SupportProtocol UseTeam work
Consultant/Hospitalist ResponseIncentives
Cash CollectionsConsultant/Hospitalist
PracticeIP Bed AvailabilityIP Nurse Staffing
9
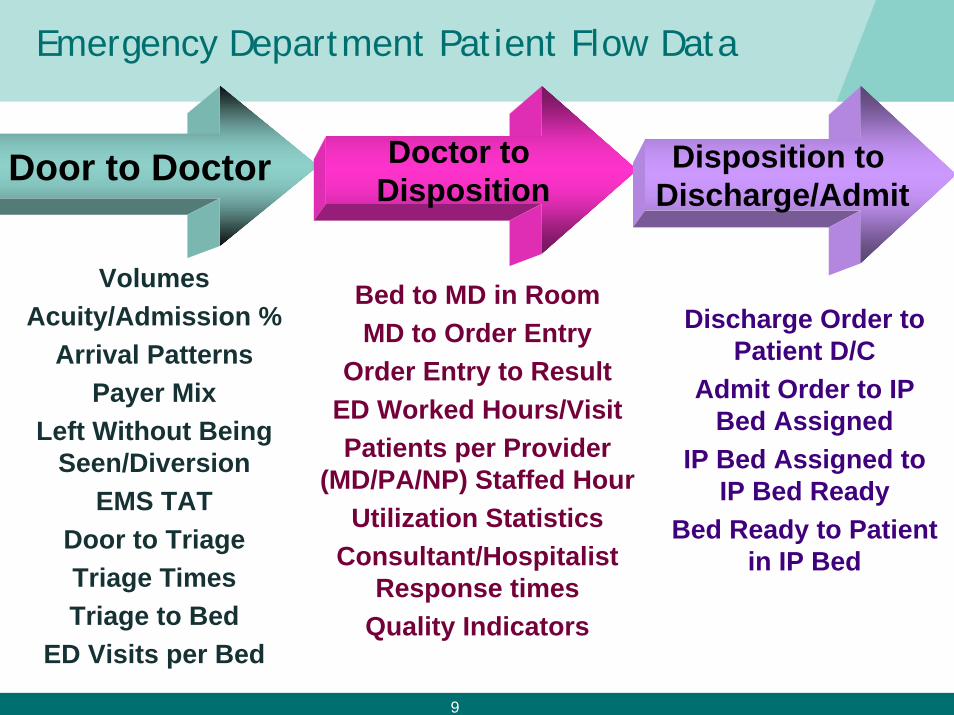
Emergency Department Patient Flow Data
Door to Doctor
VolumesAcuity/Admission %
Arrival PatternsPayer Mix
Left Without Being Seen/Diversion
EMS TATDoor to TriageTriage TimesTriage to Bed
ED Visits per Bed
Bed to MD in RoomMD to Order Entry
Order Entry to ResultED Worked Hours/VisitPatients per Provider
(MD/PA/NP) Staffed HourUtilization Statistics
Consultant/Hospitalist Response times
Quality Indicators
Discharge Order to Patient D/C
Admit Order to IP Bed Assigned
IP Bed Assigned to IP Bed Ready
Bed Ready to Patient in IP Bed
Doctor to Disposition
Disposition to Discharge/Admit
10
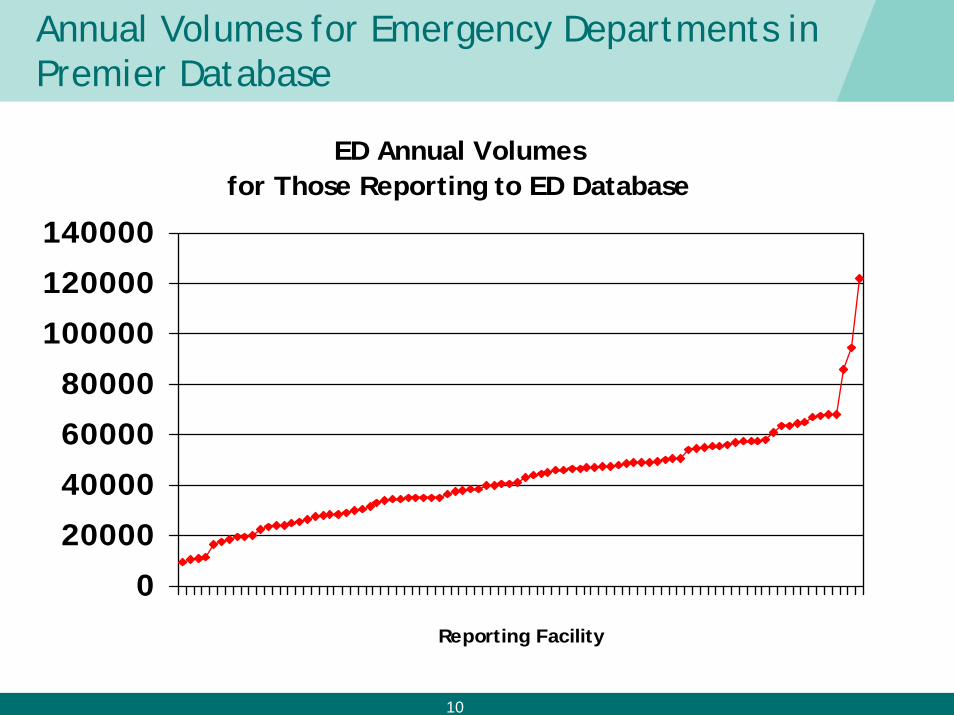
Annual Volumes for Emergency Departments in Premier Database
ED Annual Volumes for Those Reporting to ED Database
0
20000
40000
60000
80000
100000
120000
140000
Reporting Facility
11
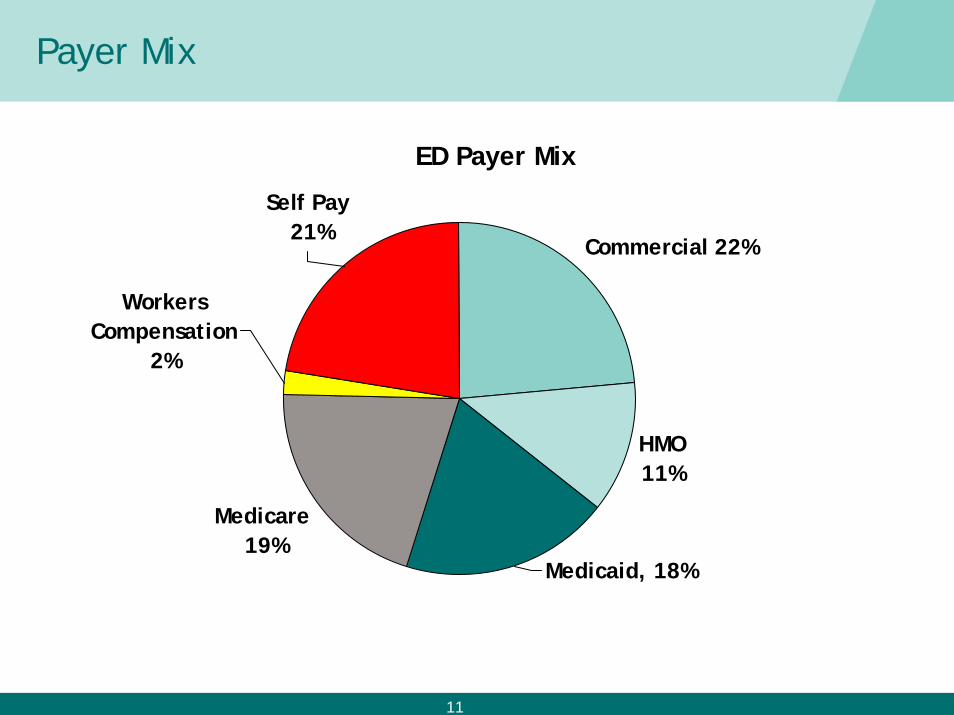
Payer Mix
ED Payer Mix
Medicaid, 18%
Medicare 19%
Workers Compensation
2%
Self Pay 21%
HMO 11%
Commercial 22%
12
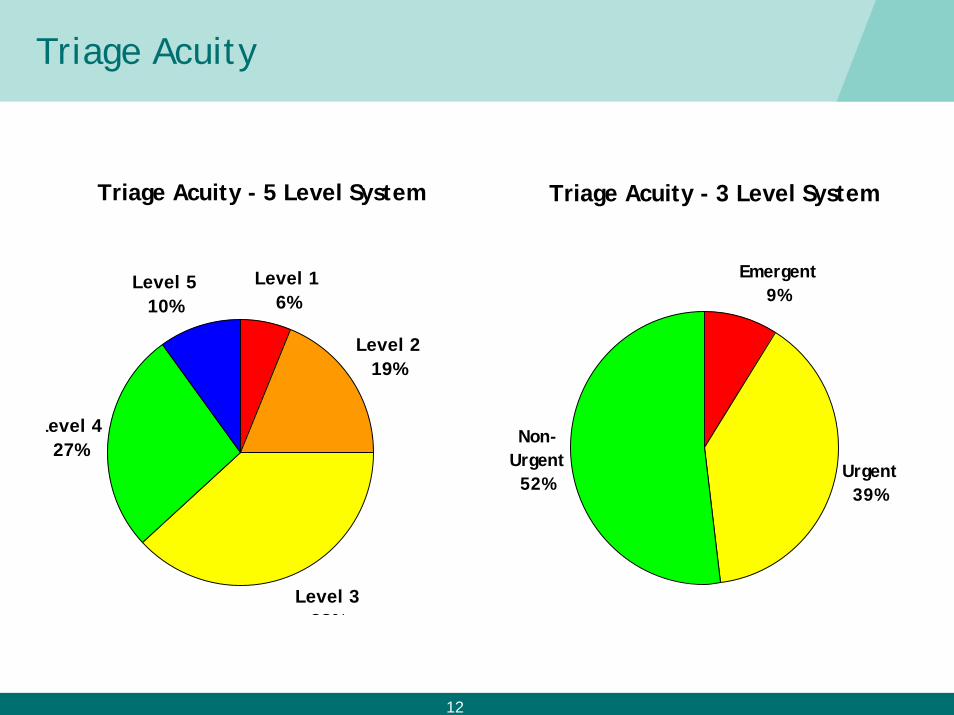
Triage Acuity
Triage Acuity - 5 Level System
Level 1 6%
Level 2 19%
Level 3 38%
Level 4 27%
Level 5 10%
Triage Acuity - 3 Level System
Emergent9%
Urgent39%
Non-Urgent
52%
13
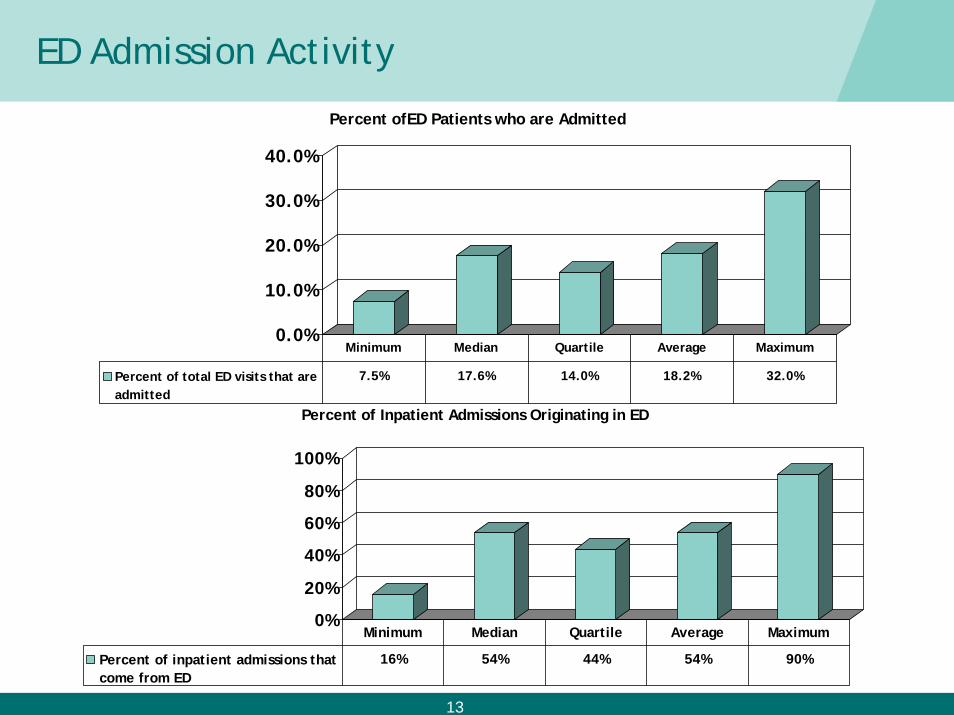
ED Admission Activity
0.0%
10.0%
20.0%
30.0%
40.0%
Percent ofED Patients who are Admitted
Percent of total ED visits that areadmitted
7.5% 17.6% 14.0% 18.2% 32.0%
Minimum Median Quartile Average Maximum
0%
20%
40%
60%
80%
100%
Percent of Inpatient Admissions Originating in ED
Percent of inpatient admissions thatcome from ED
16% 54% 44% 54% 90%
Minimum Median Quartile Average Maximum
14
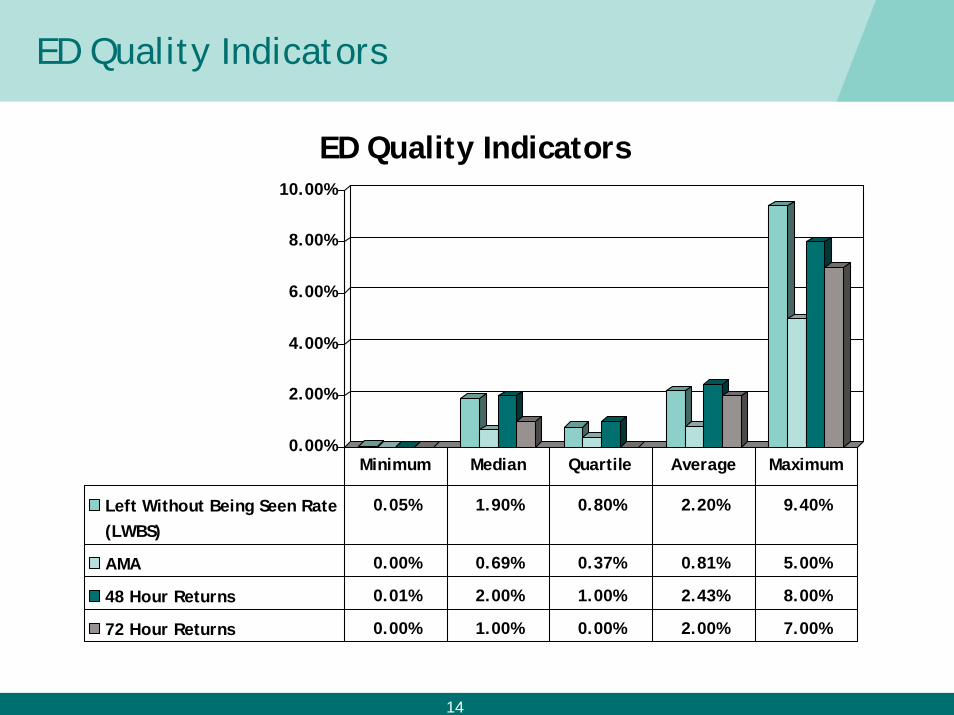
ED Quality Indicators
0.00%
2.00%
4.00%
6.00%
8.00%
10.00%
ED Quality Indicators
Left Without Being Seen Rate(LWBS)
0.05% 1.90% 0.80% 2.20% 9.40%
AMA 0.00% 0.69% 0.37% 0.81% 5.00%
48 Hour Returns 0.01% 2.00% 1.00% 2.43% 8.00%
72 Hour Returns 0.00% 1.00% 0.00% 2.00% 7.00%
Minimum Median Quartile Average Maximum
15
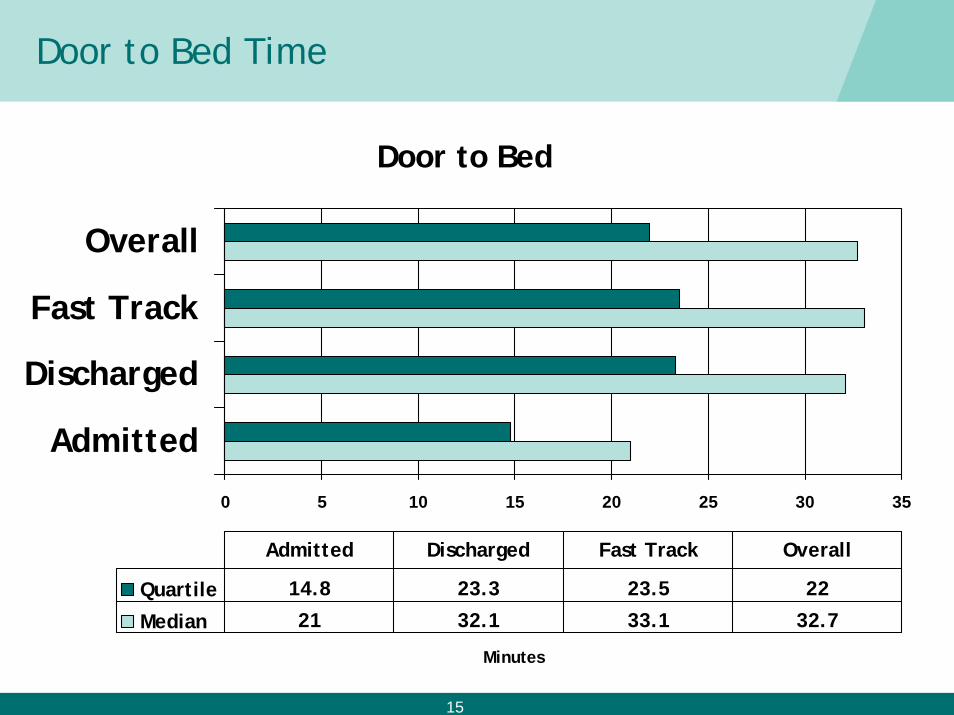
Door to Bed Time
Door to Bed
0 5 10 15 20 25 30 35
Admitted
Discharged
Fast Track
Overall
Minutes
Quartile 14.8 23.3 23.5 22
Median 21 32.1 33.1 32.7
Admitted Discharged Fast Track Overall
16
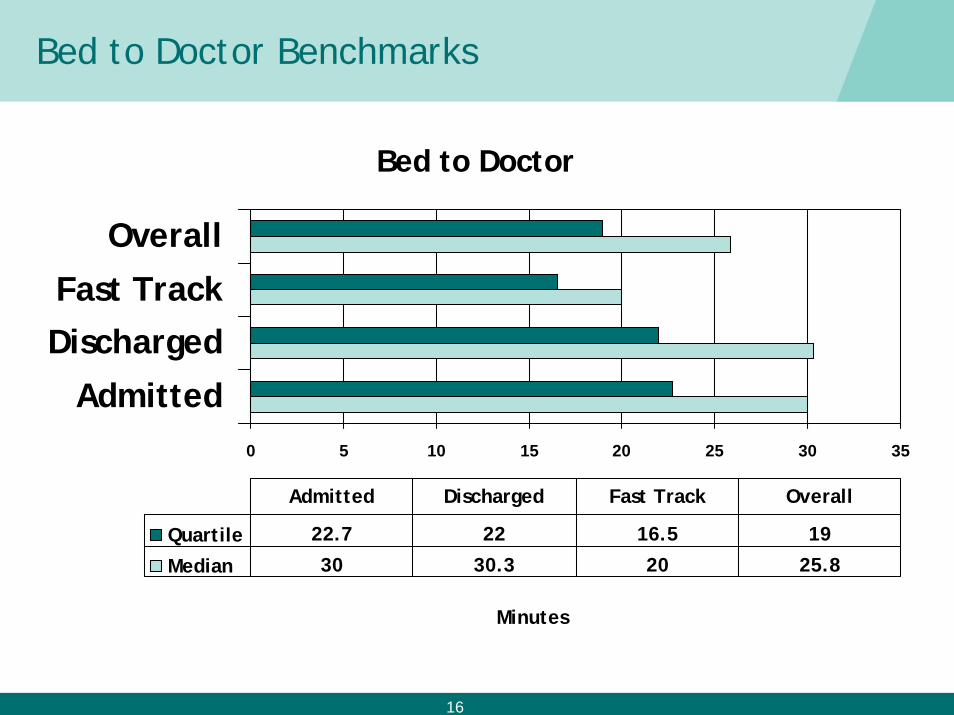
Bed to Doctor Benchmarks
Bed to Doctor
0 5 10 15 20 25 30 35
Admitted
DischargedFast Track
Overall
Minutes
Quartile 22.7 22 16.5 19
Median 30 30.3 20 25.8
Admitted Discharged Fast Track Overall
17
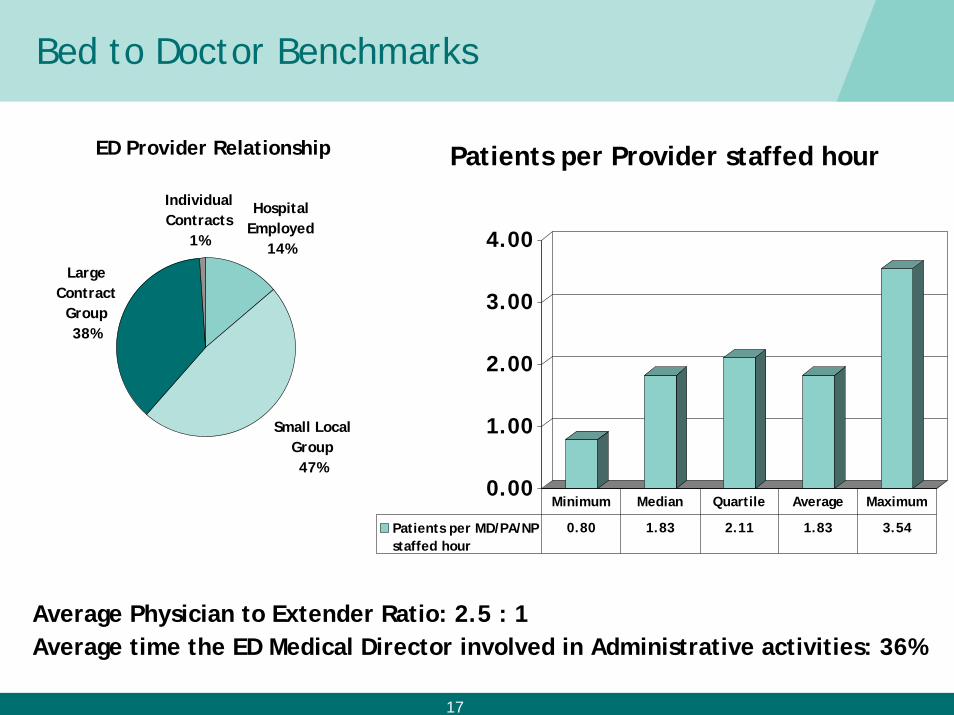
Bed to Doctor Benchmarks
Average Physician to Extender Ratio: 2.5 : 1Average time the ED Medical Director involved in Administrative activities: 36%
0.00
1.00
2.00
3.00
4.00
Patients per Provider staffed hour
Patients per MD/PA/NPstaffed hour
0.80 1.83 2.11 1.83 3.54
Minimum Median Quartile Average Maximum
ED Provider Relationship
Hospital Employed
14%
Small Local Group47%
Large Contract
Group38%
Individual Contracts
1%
18
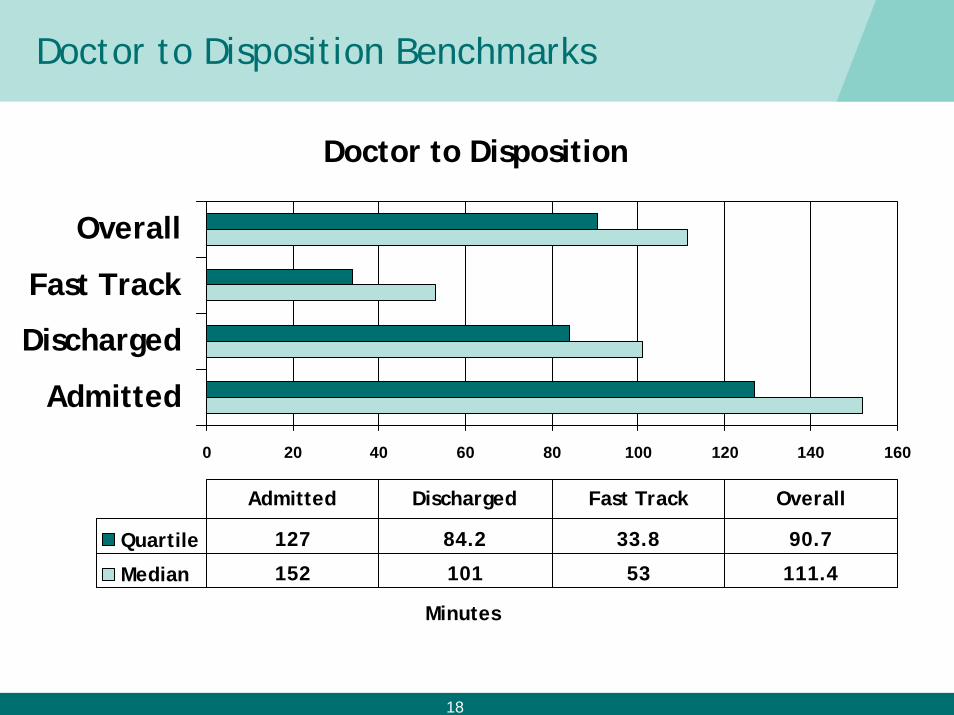
Doctor to Disposition Benchmarks
Doctor to Disposition
0 20 40 60 80 100 120 140 160
Admitted
Discharged
Fast Track
Overall
Minutes
Quartile 127 84.2 33.8 90.7
Median 152 101 53 111.4
Admitted Discharged Fast Track Overall
19
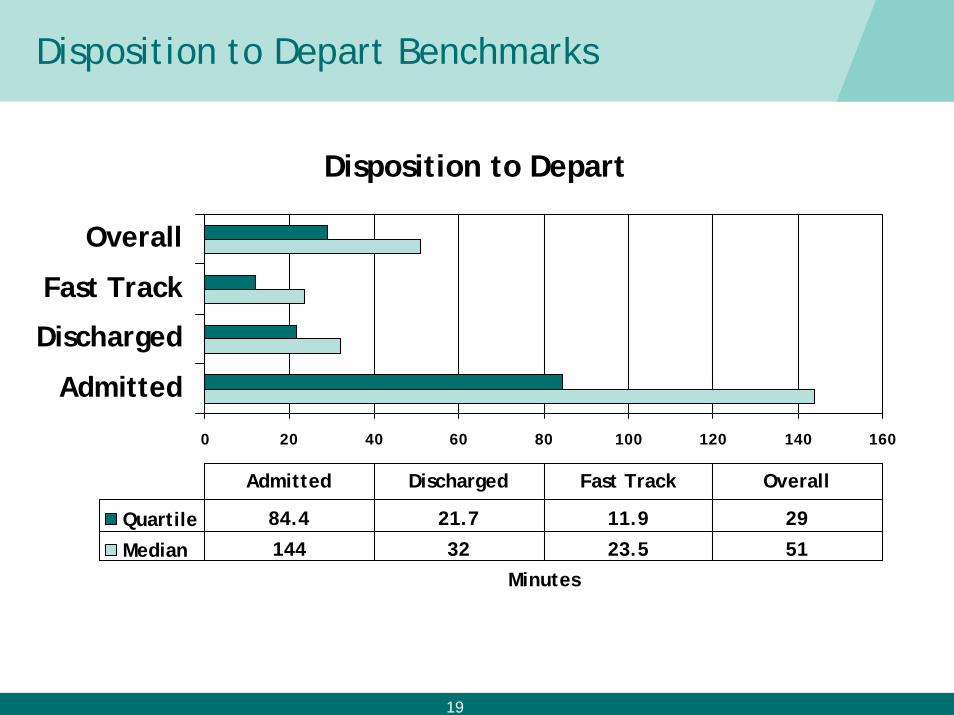
Disposition to Depart Benchmarks
Disposition to Depart
0 20 40 60 80 100 120 140 160
Admitted
Discharged
Fast Track
Overall
Minutes
Quartile 84.4 21.7 11.9 29
Median 144 32 23.5 51
Admitted Discharged Fast Track Overall
20
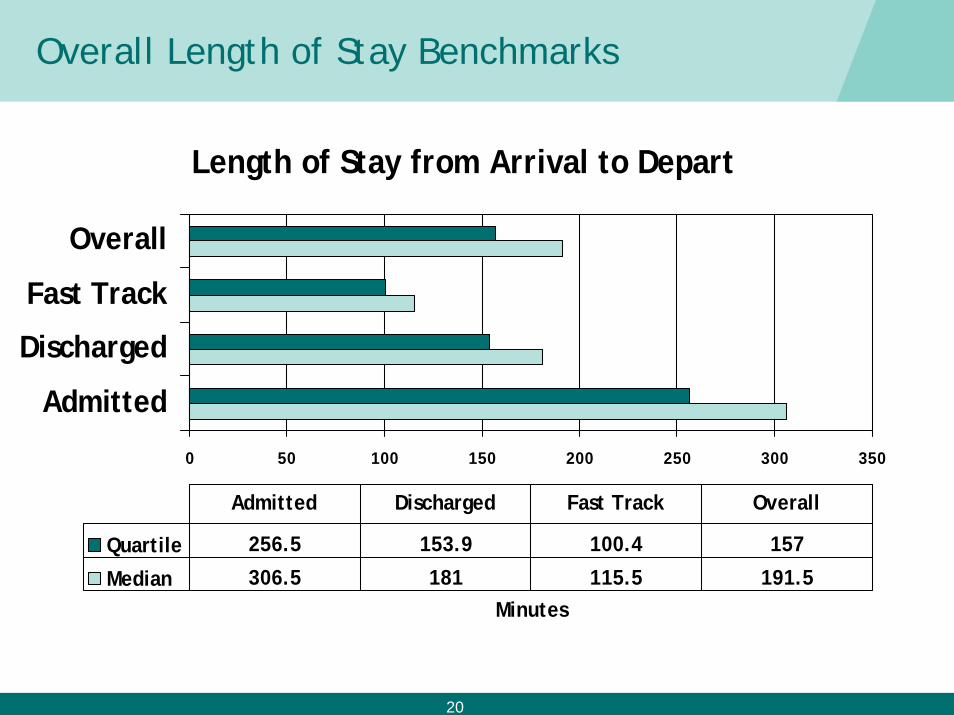
Overall Length of Stay Benchmarks
Length of Stay from Arrival to Depart
0 50 100 150 200 250 300 350
Admitted
Discharged
Fast Track
Overall
Minutes
Quartile 256.5 153.9 100.4 157
Median 306.5 181 115.5 191.5
Admitted Discharged Fast Track Overall
21
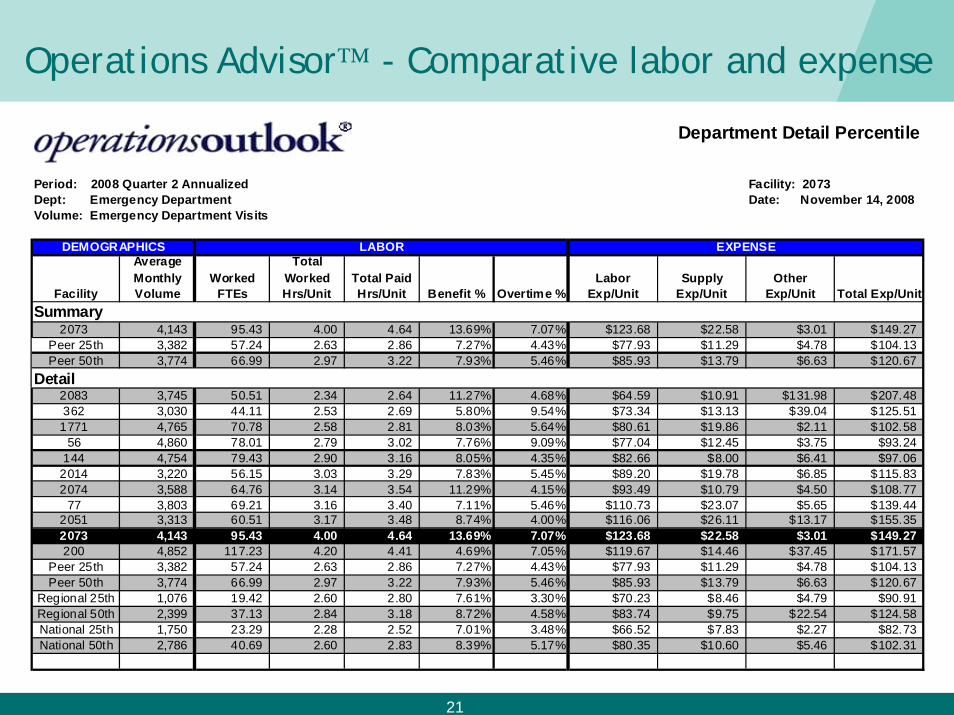
Operations Advisor™ - Comparative labor and expense
Facility
Average Monthly Volume
Worked FTEs
Total Worked Hrs/Unit
Total Paid Hrs/Unit Benefit % Overtime %
Labor Exp/Unit
Supply Exp/Unit
Other Exp/Unit Total Exp/Unit
2073 4,143 95.43 4.00 4.64 13.69% 7.07% $123.68 $22.58 $3.01 $149.27Peer 25th 3,382 57.24 2.63 2.86 7.27% 4.43% $77.93 $11.29 $4.78 $104.13Peer 50th 3,774 66.99 2.97 3.22 7.93% 5.46% $85.93 $13.79 $6.63 $120.67
2083 3,745 50.51 2.34 2.64 11.27% 4.68% $64.59 $10.91 $131.98 $207.48362 3,030 44.11 2.53 2.69 5.80% 9.54% $73.34 $13.13 $39.04 $125.51
1771 4,765 70.78 2.58 2.81 8.03% 5.64% $80.61 $19.86 $2.11 $102.5856 4,860 78.01 2.79 3.02 7.76% 9.09% $77.04 $12.45 $3.75 $93.24
144 4,754 79.43 2.90 3.16 8.05% 4.35% $82.66 $8.00 $6.41 $97.062014 3,220 56.15 3.03 3.29 7.83% 5.45% $89.20 $19.78 $6.85 $115.832074 3,588 64.76 3.14 3.54 11.29% 4.15% $93.49 $10.79 $4.50 $108.77
77 3,803 69.21 3.16 3.40 7.11% 5.46% $110.73 $23.07 $5.65 $139.442051 3,313 60.51 3.17 3.48 8.74% 4.00% $116.06 $26.11 $13.17 $155.352073 4,143 95.43 4.00 4.64 13.69% 7.07% $123.68 $22.58 $3.01 $149.27200 4,852 117.23 4.20 4.41 4.69% 7.05% $119.67 $14.46 $37.45 $171.57
Peer 25th 3,382 57.24 2.63 2.86 7.27% 4.43% $77.93 $11.29 $4.78 $104.13Peer 50th 3,774 66.99 2.97 3.22 7.93% 5.46% $85.93 $13.79 $6.63 $120.67
Regional 25th 1,076 19.42 2.60 2.80 7.61% 3.30% $70.23 $8.46 $4.79 $90.91Regional 50th 2,399 37.13 2.84 3.18 8.72% 4.58% $83.74 $9.75 $22.54 $124.58National 25th 1,750 23.29 2.28 2.52 7.01% 3.48% $66.52 $7.83 $2.27 $82.73National 50th 2,786 40.69 2.60 2.83 8.39% 5.17% $80.35 $10.60 $5.46 $102.31
Department Detail Percentile
Period: 2008 Quarter 2 Annualized Facility: 2073Dept: Emergency Department Date: November 14, 2008Volume: Emergency Department Visits
Detail
DEMOGRAPHICS LABOR EXPENSE
Summary
22
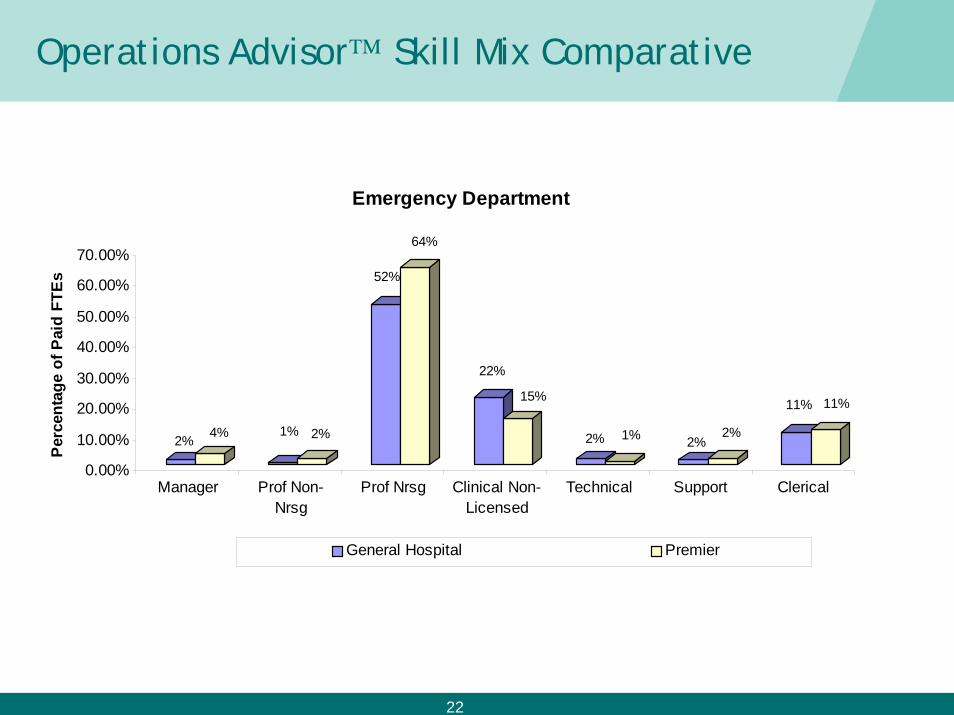
Operations Advisor™ Skill Mix Comparative
2% 4% 1% 2%
52%
64%
22%
15%
2% 1% 2%2%
11% 11%
0.00%
10.00%
20.00%
30.00%
40.00%
50.00%
60.00%
70.00%
Per
cent
age
of P
aid
FTE
s
Manager Prof Non-Nrsg
Prof Nrsg Clinical Non-Licensed
Technical Support Clerical
Emergency Department
General Hospital Premier
23
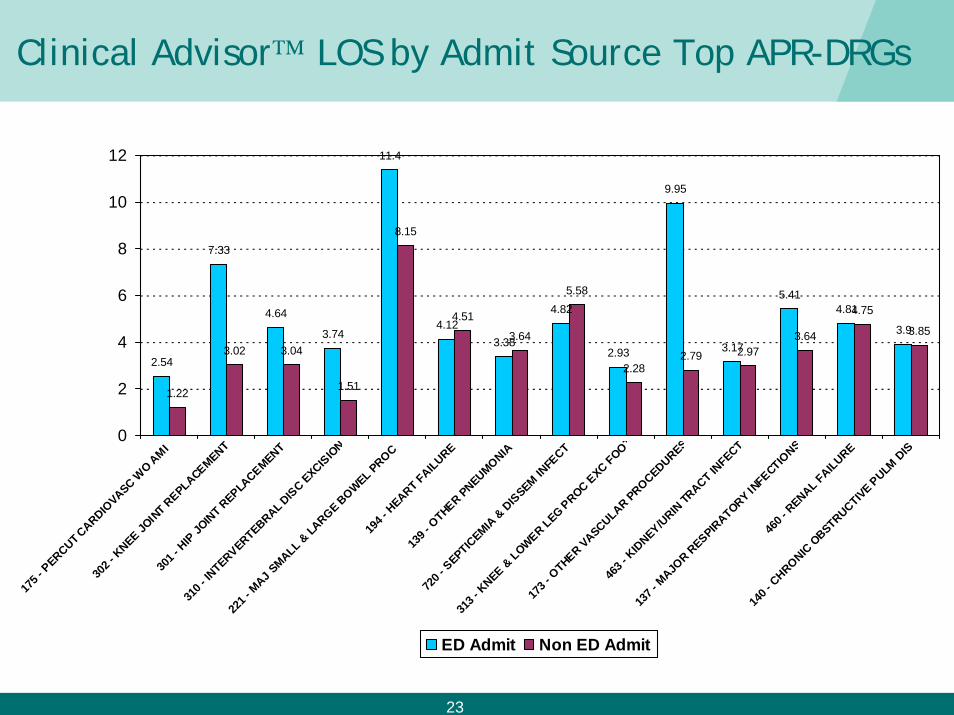
Clinical Advisor™ LOS by Admit Source Top APR-DRGs
2.54
7.33
4.64
3.74
11.4
4.123.38
4.82
2.93
9.95
3.17
5.414.81
3.9
1.22
3.02 3.04
1.51
8.15
4.51
3.64
5.58
2.282.79 2.97
3.64
4.75
3.85
0
2
4
6
8
10
12
175 -
PERCUT C
ARDIOVASC W
O AMI
302 -
KNEE JO
INT R
EPLACEMENT
301 -
HIP
JOIN
T REPLA
CEMENT
310 -
INTERVERTEBRAL D
ISC EXCIS
ION
221 -
MAJ S
MALL & LA
RGE BOWEL PROC
194 -
HEART FAILURE
139 -
OTHER PNEUMONIA
720 -
SEPTIC
EMIA &
DIS
SEM INFE
CT
313 -
KNEE &
LOWER LEG PROC E
XC FOOT
173 -
OTHER VASCULAR PROCEDURES
463 -
KID
NEY/URIN
TRACT IN
FECT
137 -
MAJO
R RESPIR
ATORY INFECTIO
NS
460 -
RENAL FAILURE
140 -
CHRONIC
OBSTRUCTIVE P
ULM D
IS
ED Admit Non ED Admit
24
“Door to Doctor” Best Practices
• Quick Registration
• Brief triage assessment (but not too brief)
• Triage Nurse assigns room
• Active Use of Acuity/Status Column
• ED Tech escorts patient to room
• Beds are made available
• “Fast Track” criteria flexible
• Staff “Pull” patients when triage times excessive
• ED patient tracking system
• Aligned ED Physician Incentives
25
“Doctor to Disposition” Best Practices
• “Free” Charge Nurse able to focus on moving patients out of ED
• Nurses pre-assigned to rooms
• Physicians pre-assigned to rooms
• Teamwork!!
• Reduced Variation (room set up, practice, protocols)
• Protocols so that expected care is anticipated
• Rapid laboratory turnaround times
• Appropriate amount of point of care testing
• Dedicated ED radiology staff and rapid 2D interpretations
26
“Disposition to Discharge” Best Practices
• Measuring and monitoring disposition order to time of discharge by nurse.
• Discharge planning begins on admission
• Case Management/Social workers staffed in ED
• Smooth collections process
• Automated discharge instructions initiated by the physician and reviewed by the RN with the patient
27
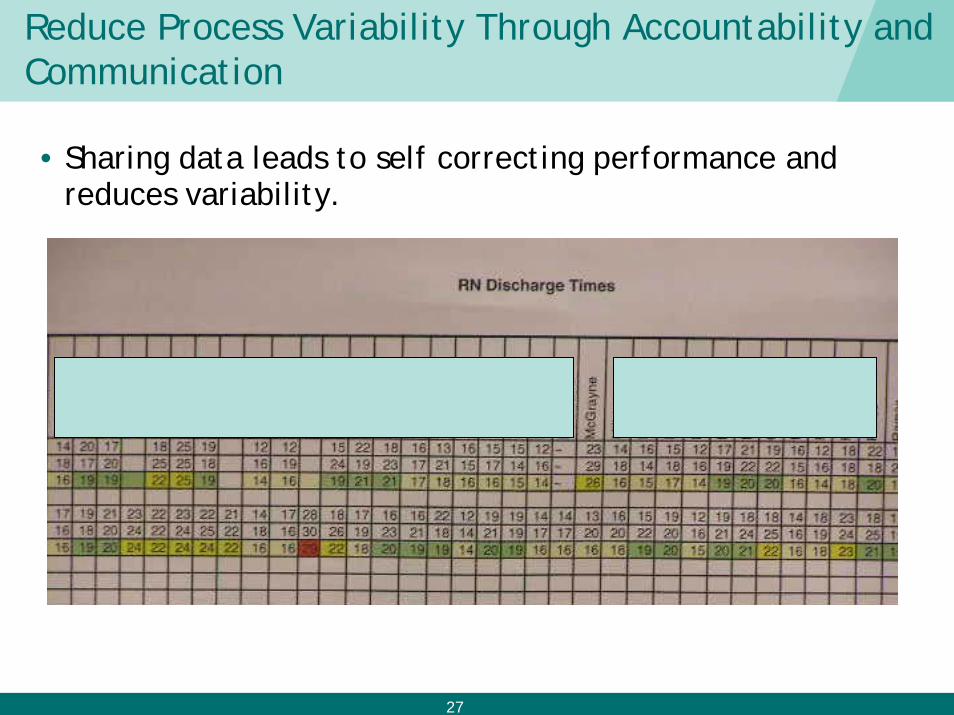
Reduce Process Variability Through Accountability and Communication
• Sharing data leads to self correcting performance and reduces variability.
28
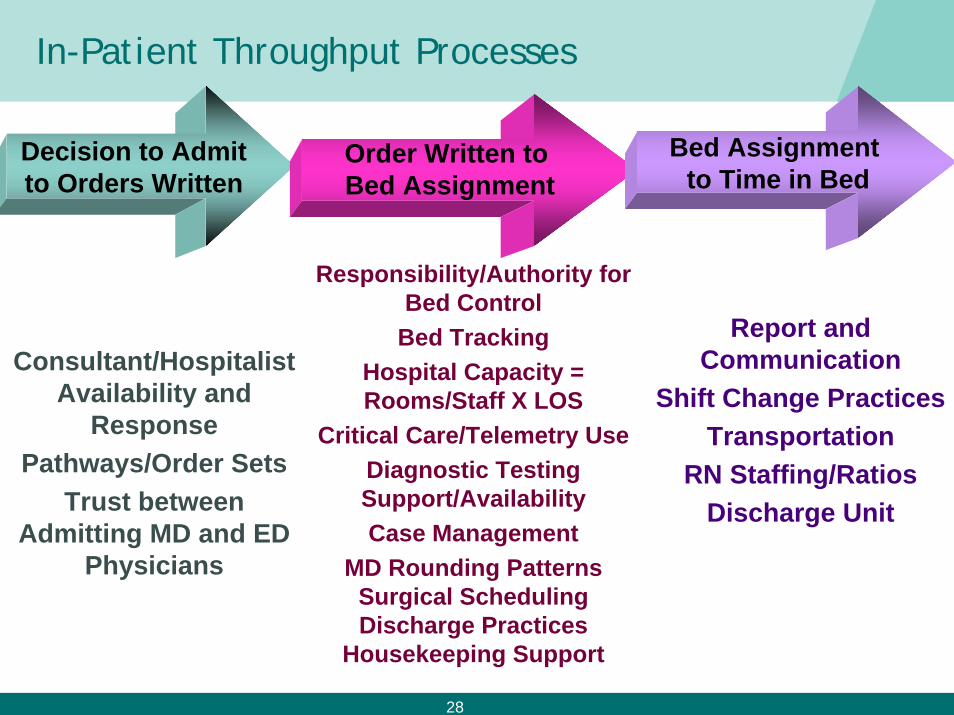
In-Patient Throughput Processes
Decision to Admitto Orders Written
Order Written to Bed Assignment
Bed Assignment to Time in Bed
Responsibility/Authority for Bed Control
Bed Tracking Hospital Capacity = Rooms/Staff X LOS
Critical Care/Telemetry UseDiagnostic Testing Support/AvailabilityCase Management
MD Rounding PatternsSurgical SchedulingDischarge Practices
Housekeeping Support
Report and Communication
Shift Change PracticesTransportation
RN Staffing/RatiosDischarge Unit
Consultant/Hospitalist Availability and
ResponsePathways/Order Sets
Trust between Admitting MD and ED
Physicians
29
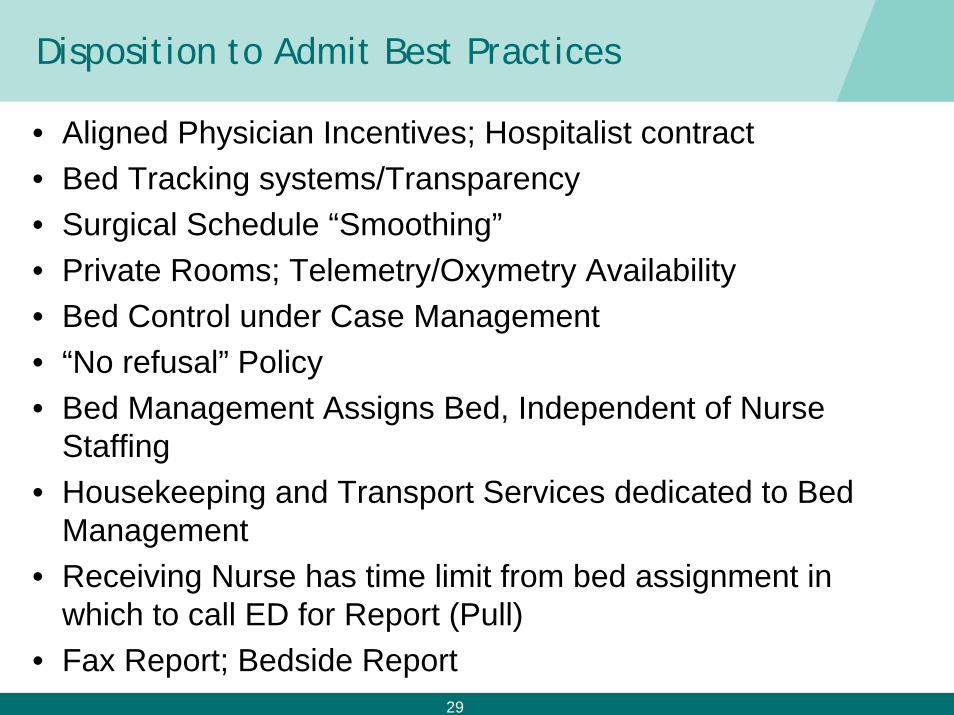
Disposition to Admit Best Practices
• Aligned Physician Incentives; Hospitalist contract• Bed Tracking systems/Transparency• Surgical Schedule “Smoothing”• Private Rooms; Telemetry/Oxymetry Availability• Bed Control under Case Management• “No refusal” Policy• Bed Management Assigns Bed, Independent of Nurse
Staffing• Housekeeping and Transport Services dedicated to Bed
Management• Receiving Nurse has time limit from bed assignment in
which to call ED for Report (Pull)• Fax Report; Bedside Report


![Benchmarks - May, 2011 | Benchmarks Onlineit.unt.edu/sites/default/files/benchmarks-05-2011.pdf · Benchmarks - May, 2011 | Benchmarks Online 4/28/16, 9:13:42 AM] By Patrick McLoud,](https://img.pdfslide.net/doc/110x75/5fe545814aa19825752e7bae/benchmarks-may-2011-benchmarks-benchmarks-may-2011-benchmarks-online-42816.jpg)