Embed Size (px)
Citation preview

BenefitndashCost Analysis andDistributional Weights An Overview
Matthew D Adler
Introduction
Benefitndashcost analysis (BCA)1 evaluates governmental policies by summing individualsrsquo mon-
etary equivalents and is insensitive to distributional concerns BCA does not take into account
whether those made better off by a policy have higher or lower incomes or higher or lower
levels of nonincome welfare-relevant attributes (eg health) than those made worse off
Arguably distributional considerations should be incorporated into BCA via ldquodistributional
weightsrdquo A scholarly literature dating from the 1950s endorses distributional weights and
analyzes how to specify them (Meade 1955 chap 2 Weisbrod 1968 Dasgupta and Pearce
1972 Dasgupta Sen and Marglin 1972 Little and Mirrlees 1974 Squire and van der Tak 1975
Boadway and Bruce 1984 pp 271ndash81 Brent 1984 Ray 1984 Dreze and Stern 1987 Dreze 1998
Cowell and Gardiner 1999 Yitzhaki 2003 Johansson-Stenman 2005 Creedy 2006 Liu 2006
Fleurbaey et al 2013 Boadway 2016)
Distributional weights were adopted for a time at the World Bank (Little and Mirrlees
1994) They are currently recommended by the UKrsquos official BCA guidance document (HM
Treasury 2003 pp 91ndash94) However it appears that distributional weights have rarely if ever
been used by BCA practitioners in the US government and the parallel US guidance docu-
ment does not mention them (Office of Management and Budget 2003)
This article which is part of a symposium on Distributional Considerations in BenefitndashCost
Analysis provides an introduction to distributional weights2 The fulcrum for my discussion
will be the concept of the social welfare function (SWF) The SWF is a fundamental construct in
many areas of welfare economics including optimal tax theory growth theory and analysis of
climate change BCA with distributional weights in turn is a practicable method for imple-
menting an SWF This is the view of BCA running through the literature on distributional
weights and is presented here
This account of BCA is quite different from the familiar view that sees BCA as a tool for
implementing the criterion of KaldorndashHicks efficiency (potential Pareto superiority) The
Richard A Horvitz Professor of Law and Professor of Economics Philosophy and Public Policy DukeUniversity Many thanks to Marc Fleurbaey James Hammitt Alex Pfaff and Nicolas Treich for their comments1Some prefer the term costndashbenefit analysis (CBA) In conformity with this journalrsquos style I use BCA here2The other articles in the symposium are Fleurbaey and Rafeh (2016) which uses insights from welfare eco-nomics to examine how distributional weights can be introduced into benefitndashcost analysis and RobinsonHammitt and Zeckhauser (2016) which focuses specifically on the role of distributional considerations in USregulatory analyses
264
Review of Environmental Economics and Policy volume 10 issue 2 Summer 2016 pp 264ndash285doi101093reeprew005
The Author 2016 Published by Oxford University Press on behalf of the Association of Environmental and Resource
Economists All rights reserved For Permissions please email journalspermissionsoupcom
KaldorndashHicks criterion has the advantage of avoiding interpersonal comparability but has
various flaws described in a literature beginning with Scitovsky (1941 see also Gorman
1955 Chipman and Moore 1978 Sen 1979 Boadway and Bruce 1984 Boadway 2016)3
The article is not a comprehensive survey of the literature on distributional weights Rather it
aims to explain the key ideas I first describe the SWF concept with a particular focus on two
specific SWFs the utilitarian and isoelasticAtkinson SWFs The article then discusses the
functional form of weights matching these two SWFs Next it provides a concrete example
involving risk-reduction policies and the ldquovalue of statistical liferdquo
The article concludes by considering two objections to weights One concerns the possibility
of interpersonal comparisons given heterogeneous preferences The second is that distribu-
tional considerations are better handled via the combination of the tax system and unweighted
BCA
The discussion aims to be accessible The fundamentals of distributional weighting are
illustrated with a simple one-period model Space constraints preclude a treatment of certain
additional issues that arise in the intertemporal context in particular the relation between
distributional weights and discounting Key mathematical formulas are provided in a
Technical Appendix A more rigorous mathematical analysis of many of the topics discussed
in the main text is provided in the online supplementary materials The reader should consult
these materials along with cited references as backup for the discussion
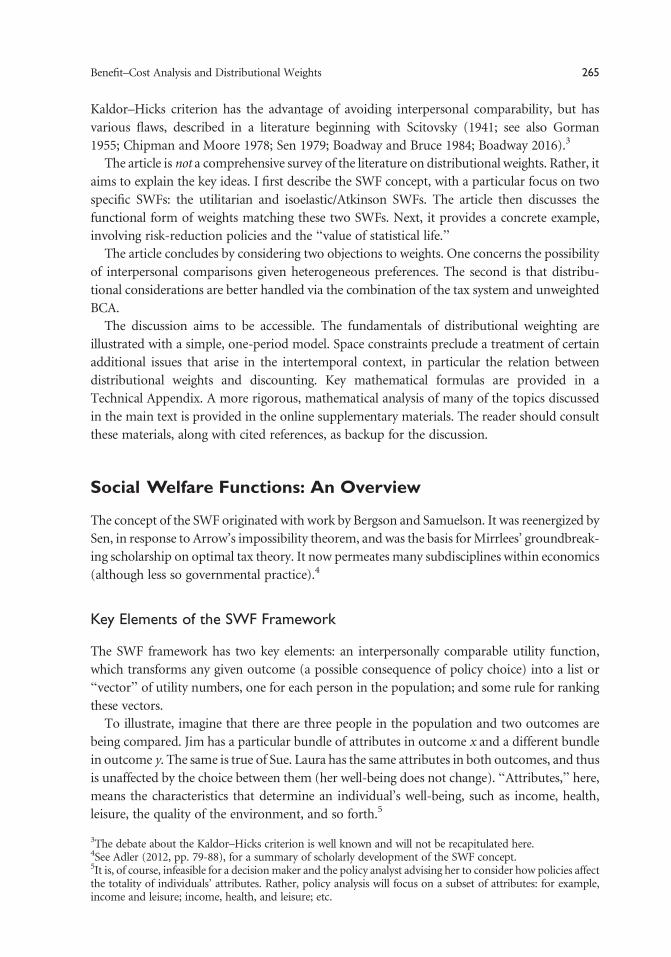
Social Welfare Functions An Overview
The concept of the SWF originated with work by Bergson and Samuelson It was reenergized by
Sen in response to Arrowrsquos impossibility theorem and was the basis for Mirrleesrsquo groundbreak-
ing scholarship on optimal tax theory It now permeates many subdisciplines within economics
(although less so governmental practice)4
Key Elements of the SWF Framework
The SWF framework has two key elements an interpersonally comparable utility function
which transforms any given outcome (a possible consequence of policy choice) into a list or
ldquovectorrdquo of utility numbers one for each person in the population and some rule for ranking
these vectors
To illustrate imagine that there are three people in the population and two outcomes are
being compared Jim has a particular bundle of attributes in outcome x and a different bundle
in outcome y The same is true of Sue Laura has the same attributes in both outcomes and thus
is unaffected by the choice between them (her well-being does not change) ldquoAttributesrdquo here
means the characteristics that determine an individualrsquos well-being such as income health
leisure the quality of the environment and so forth5
3The debate about the KaldorndashHicks criterion is well known and will not be recapitulated here4See Adler (2012 pp 79-88) for a summary of scholarly development of the SWF concept5It is of course infeasible for a decision maker and the policy analyst advising her to consider how policies affectthe totality of individualsrsquo attributes Rather policy analysis will focus on a subset of attributes for exampleincome and leisure income health and leisure etc
BenefitndashCost Analysis and Distributional Weights 265
Our utility function assigns Jimrsquos bundles of attributes in x and y the utility values 10 and 11
respectively it assigns Suersquos bundles the values 30 and 25 respectively and it assigns 40 to
Laurarsquos bundle Thus outcome x is mapped onto the utility vector (10 30 40) and y is mapped
onto the vector (11 25 40)mdashwith the first entry the utility number for Jim the second for Sue
and the third for Laura (see table 1)
There are various possible rules for comparing utility vectors (Bossert and Weymark 2004
Adler 2012 chap 5 Weymark 2016) One such rule is the leximin rule it compares the utility
levels of the worst-off individuals if those are equal then the second-worst-off and so forth
Leximin here prefers y since Jim (the worst off) has utility 11 instead of 10
A different rule is the utilitarian rule which sums utilities Utilitarianism prefers x since the
sum of utilities is 80 rather than 76 Although utilitarianism is sensitive to the distribution of
income (given the declining marginal utility of income) utilitarianism does not take account of
the distribution of utility itself One outcome is ranked higher than a second as long as the sum
total of utility gains for those better off in the first outcome exceeds the sum total of utility losses
for those worse offmdashregardless of the comparative utility levels of the two groups
Leximin is sensitive to the distribution of utility In the case at hand even though Suersquos loss
from y is greater than Jimrsquos gain leximin prefers y However leximin is absolutist in the sense
that it is willing to incur arbitrarily large utility losses for better-off individuals in order to realize
a utility gain (however small) for an individual who is worse off and would remain so after the
gain
The isoelasticAtkinson SWF lies in between leximin and utilitarianism This SWF is para-
meterized by an inequality aversion parameter g which can take any positive value With g set
to zero the isoelastic formula becomes utilitarianism As g increases the isoelastic SWF gives
increasing priority to utility changes affecting worse-off individuals (those at lower utility
levels) In the example in table 1 if g is less than or equal to approximately 16 the isoelastic
SWF prefers outcome x to y Sue stands to lose more utility moving to y (5 units) than Jim
stands to gain (1 unit) and with a low value of g the isoelastic SWF assigns a greater social value
to her loss than to Jimrsquos gain even though Jim is worse off than Sue in both outcomes With ggreater than 16 the isoelastic SWF prefers y to x The priority given to utility changes affecting
those who are worse off is now large enough that moving Jim from 10 to 11 is seen as more
socially valuable than avoiding Suersquos move from 30 to 25
The utilitarian and isoelastic SWFs are both popular in the SWF literature and with good
reason Both satisfy the Pareto principle if at least one personrsquos utility increases and no one
elsersquos decreases the value of the SWF increases These SWFs also satisfy an axiom of anonymity
impartiality meaning indifference between any given utility vector and all rearrangements of its
Table 1 Outcomes as utility vectors
Outcomes
x y
Jim 10 11
Sue 30 25
Laura 40 40
266 M D Adler
component utility numbers Anonymousimpartial SWFs focus only on the pattern of well-
being and not the identities of the people who end up at particular well-being levels
Moreover the utilitarian and isoelastic SWFs are separablemdashmeaning that the ranking of
outcomes is not influenced by the utility levels of unaffected people In the above example
Laura is unaffected She happens to be at level 40 in both outcomes but note that the utilitarian
SWF would prefer x to y in any case where Jimrsquos and Suersquos utilities are as in table 1 and Laura has
the same utility level in the two outcomes regardless of what that level is Similarly the isoelastic
SWF with g less than or equal to 16 would prefer x to y regardless of Laurarsquos level and the
isoelastic SWF with g greater than 16 would prefer y to x regardless of Laurarsquos level Separability
is a big practical advantage in policy analysismdashenabling the analyst to focus her efforts on
determining the utilities of those whose well-being would be changed by a policy and not also
to worry about how the policy would alter their position relative to the potentially vast number
of unaffected
The leximin SWF is also Paretian anonymous and separable and is popular among some
SWF theorists But it cannot be represented by a mathematical formula which creates diffi-
culties in mimicking this SWF with distributional weights Moreover the leximin SWF can be
approximated by the isoelastic SWF with a large value of g
Interpersonal Comparisons of Well-Being
In order to achieve a stable ranking of outcomes all SWFs require some degree of interpersonal
comparability of well-being If we start with a particular rule for ranking utility vectors and then
transform the utility vectors associated with outcomes so that intrapersonal comparisons of
utility levels differences and ratios are preserved but interpersonal comparisons are not the
ranking of outcomes may change as well6 (Bossert and Weymark 2004 Weymark 2016)
More specifically the utilitarian SWF requires interpersonal comparability of well-being
differences Consider table 2 which shows possible renumberings of Jim and Suersquos utility In
the first renumbering we rescale Jimrsquos utility by a Jim-specific ratio transformation and we
rescale Suersquos by a Sue-specific ratio transformation In the second renumbering we rescale Jimrsquos
and Suersquos utility by a common linear transformation In the third renumbering we rescale Jimrsquos
and Suersquos utility by a common ratio transformation
With the original scheme of utility assignments Suersquos utility difference between the outcomes
is5 and Jimrsquos is 1 The first renumbering changes the relative magnitude of these differences
the second and third renumberings do not And now observe that the first renumbering alters
the utilitarian ranking of the outcomes while the second and third renumberings do not
The isoelastic SWF is more demanding in terms of interpersonal comparability than the
utilitarian SWF While the utilitarian SWF requires interpersonal comparability of differences
the isoelastic SWF requires interpersonal comparability of levels differences and ratios Note
that the second renumbering changes the well-being ratios between Sue and Jim in the two
outcomes Given a particular value of inequality aversion g the isoelastic SWF might prefer x
to y using the original numbering but not the second renumbering (This occurs for example
with gfrac14 05) However the third renumbering preserves well-being ratios If the isoelastic SWF
6More precisely all ethically plausible SWFs require some degree of interpersonal comparability A ldquodictatorialrdquoSWF which focuses solely on the well-being of one particular individual requires nothing more than intra-personal well-being information regarding that person
BenefitndashCost Analysis and Distributional Weights 267
with a particular value of g prefers one outcome over the other using the original numbering
than it does so with the third renumbering
The Normative Basis for the SWF
We can now address two related questions First what is the normative basis for a determin-
ation that one SWF is ldquobetterrdquo than another or that the SWF framework for social decision is
ldquobetterrdquo than alternative frameworks Second what is the basis for assigning utility numbers
that are interpersonally comparable
The view adopted here is that the SWF is a template for ethicalmoral preferences (Bergson
1948 1954 Samuelson 1947 p 221 Harsanyi 1977 chap 4) The term ldquoethicalrdquo is more
common among economists ldquomoralrdquo among philosophers but the two terms are essentially
synonymsmdashdenoting a standpoint of impartiality whereby the decision maker gives equal
weight to everyonersquos interests (or at least the interests of everyone within some population)
An SWF constitutes a systematic framework for structuring ethicalmoral (henceforth
ldquomoralrdquo) preferences a framework that a decision maker who has adopted the standpoint
of impartiality might wish to use in specifying her moral tastes
Is there some deeper criterion of moral truth that establishes whether someonersquos moral
preferences are ldquocorrectrdquo That is a question of metaethics that is debated by philosophers
but is beyond the scope of welfare economics and in any event not relevant to the discussion
here Whatever the nature of ultimate moral truth a decision maker motivated by impartial
concern will need to figure out what her moral preferences are The SWF framework is a
plausible format for regimenting those preferences a format that conforms to various
axioms that seem (to those in the SWF tradition) morally very attractive and that the decision
maker may find attractive as well
While the SWF framework itself is a tool for specifying the moral preferences of some
decision maker the inputs for the framework are utility numbers measuring the well-being
of everyone within some population (relative to which the decision maker has adopted an
attitude of impartiality) Very plausibly there is a close connection between someonersquos welfare
and that individualrsquos personal that is self-interested preferences Phillip is better off in outcome
Table 2 Interpersonal comparisons and the renumbering of utility
Original Renumbering 1 Renumbering 2 Renumbering 3
x y Diff x y Diff x y Diff x y Diff
Jim 10 11 1 200 220 20 2 12 10 30 33 3
Sue 30 25 5 60 50 10 202 152 50 90 75 15
Sum 40 36 260 270 204 164 120 108
Notes In the first renumbering Jimrsquos utilities are each multiplied by a Jim-specific factor aJim equaling 20 while Suersquos are
multiplied by a Sue-specific aSue equaling 2 In the second renumbering Jimrsquos and Suersquos utilities are subject to a common
linear transformation au + b with the common scaling factor a equaling 10 and the constant b equaling 98 Finally in the
third renumbering Jimrsquos and Suersquos utilities are subject to a common ratio transformation each multiplied by the common
positive number 3 The bold columns labeled ldquoDiffrdquo show the difference between each personrsquos utility in y and x The last
row displays the sum of utilities
268 M D Adler
x than y if and only if Phillip has a personal preference for x (Adler 2012 chap 3 Fleurbaey
et al 2013)7
Moreover if members of the population have identical personal preferences interpersonal
comparisons become straightforward as we shall now see My analysis of distributional weights
will start with this simplifying assumption of identical personal preferencesmdashpostponing until
later in the article the question of how the SWF framework should handle heterogeneity of
personal preferences
BCA and Utilitarian Distributional Weights
A simple one-period model will illustrate utilitarian distributional weights In any given out-
come each individual has a bundle of attributes consisting of the following her consumption
that is the total amount of money she expends on marketed goods and services the market
prices she faces assumed to be the same for all individuals and her nonconsumption attributes
such as health leisure or environmental quality8 Each policy choice including the status quo
choice of inaction leads for sure to some outcome There are a fixed number of individuals in
the population9
BCA and Monetary Equivalents
Unweighted BCA assigns each outcome a value equaling the sum of individual monetary
equivalents relative to the status quo and ranks outcomes in the order of these values
Monetary equivalents can be defined as ldquoequivalent variationsrdquo (equilibrating changes to
status quo consumption) or ldquocompensating variationsrdquo (equilibrating consumption changes
in each outcome) (Freeman 2003 chap 3) Equivalent variations are theoretically preferable
because BCA with compensating variations can violate the Pareto principle while BCA with
equivalent variations cannot My presentation will henceforth focus on the equivalent vari-
ationmdashnow using the term ldquomonetary equivalentrdquo to mean specifically that In practice BCA
analysts often employ compensating variations which can be seen as a rough-and-ready proxy
for equivalent variations
The Utility Function
Consider now the utilitarian SWF Recall that in order to arrive at interpersonally comparable
utilities we are starting with the simplified assumption of common personal preferences
Moreover utilitarianism requires a cardinal interpersonally comparable utility function one
that contains information about utility differences
7To be clear the choice of a conception of well-being (eg the view that well-being is equivalent to thesatisfaction of personal preferences) to be measured by utility numbers is a normative choice for the decisionmakermdashno less so than the prior choice to regiment her moral preferences via the SWF format However theimplementation of the particular conception chosen may depend on empirical facts In particular what peoplersquospersonal preferences are is an empirical question8In general an individualrsquos income need not equal her consumption but in a one-period model withoutbequests they are identical and so the reader can substitute ldquoincomerdquo for ldquoconsumptionrdquo if she likes9Space constraints preclude a discussion here of the SWF approach with variable population size
BenefitndashCost Analysis and Distributional Weights 269
Given common personal preferences expected utility theory provides a straightforward path
to cardinal and interpersonally comparable utilities This theory shows that if someone has a
well-behaved ranking of lotteries over attribute bundles there will exist a so-called von
NeumannndashMorgenstern (vNM) utility function the mathematical expectation of which cor-
responds to the ranking Moreover this utility function albeit not unique is unique ldquoup to a
positive linear transformationrdquo (Kreps 1988)
In the model now being discussed assume that individuals indeed have common personal
preferences with respect to lotteries over consumptionmarket pricenonconsumption attribute
bundles and that these preferences are represented by some vNM utility function denoted as
u() Imagine that the utilitarian SWF with u() as the utility function achieves a particular
ranking of outcomes If any other vNM utility function also represents the common prefer-
ences it is straightforward to show that the utilitarian SWF with this second function will
achieve the very same ranking of outcomes because the second function must be a positive
linear transformation of u()
In short with common personal preferences and the utilitarian SWF we can simply use any
vNM function representing the common preferences as the basis for interpersonal comparisons
and the input to the SWF10
Marginal Utility and Distributional Weights
Take any vNM utility function representing the common preferences Let the weighting factor
for each individual i be her marginal utility of consumption in the status quo the change in
utility that occurs when a small amount is added to the individualrsquos status quo consumption
divided by the consumption change Denote this as MUi Assign a given outcome the sum of
monetary equivalents multiplied by these weighting factors Then if all the outcomes are suf-
ficiently small variations around the status quomdashprices individualsrsquo consumption amounts
and their nonconsumption attributes do not change very muchmdashthe ranking of outcomes by
the utilitarian SWF is well approximated by this formula
This formula is very intuitive BCA measures well-being changes in money a given change in
welfare-relevant attributes is measured as the equivalent change in the individualrsquos consump-
tion (total monetary expenditure) But equal money changes do not necessarily correspond to
equal changes in interpersonally comparable utility A small money change for a given indi-
vidual can be translated into a utility change by using the individualrsquos marginal utility of money
as an adjustment factor
How do we calculate MUi Recall that we are trying to estimate individualsrsquo marginal utilities
in the status quomdashwhere individuals have various consumption and nonconsumption attri-
butes but face a common price vector We can therefore ignore the full content of the utility
function u() and focus on estimating the utility values of consumptionndashnonconsumption
bundles at status quo prices
There are many different empirical methods for estimating these utility values Let me briefly
describe one approach Consider the ranking (by the common preferences) of lotteries over
consumption amounts given that nonconsumption attributes are fixed at one or another
specific level Each such ranking is captured by a ldquoconditionalrdquo utility function which takes
10For a defense of vNM theory as the basis for interpersonal comparisons see Adler (2016)
270 M D Adler
consumption alone as its argument The conditional utility function will be concave convex or
linear in consumption if individuals are respectively risk averse risk prone or risk neutral over
consumption lotteries holding fixed nonconsumption attributes at the designated level
Assume that we have estimated this conditional utility function for the various levels of
nonconsumption attributes that individuals experience in the status quo Assume moreover
that we have ordinary (nonlottery) willingness-to-paywillingness-to-accept data indicating
the change in consumption that suffices to compensate individuals for moving from one level of
the nonconsumption attributes to another Putting both sorts of data together we are in a
position to estimate utility as a function of both consumption and nonconsumption attributes
and thus the weighting factor MUi for each individual i
The conditional utility function depends upon the level of nonconsumption attributes This
allows for the possibility that the degree of individualsrsquo risk aversionproneness with respect to
consumption gambles depends upon the specific level of nonconsumption attributes But two
useful simplifications can now be introduced First we might assume that preferences over
consumption gambles are invariant to the level of nonconsumption attributes If so there is a
single conditional utility function and it can be shown that MUi is just equal to the slope
(derivative) of this function at irsquos status quo consumption level multiplied by a scaling factor
that inflates or deflates this value to take account of her nonconsumption attributes
A second simplification is to assume that preferences over consumption gambles holding
fixed nonconsumption attributes take the constant relative risk aversion (CRRA) form (Gollier
2001 chap 2) The CRRA form is extremely popular in the literature on preferences for
consumption (or income or wealth) gambles It allows us to capture the degree of risk aversion
or proneness with respect to consumption in a single parameter Indeed much of the existing
work on distributional weights incorporates the CRRA form11
The risk-aversion parameter of the CRRA utility function and the inequality-aversion par-
ameter g of the isoelastic SWF are conceptually quite different is a number that captures
individualsrsquo personal preferences over consumption gambles It is useful in estimating distribu-
tional weights both for the utilitarian SWF (which has no g parameter) and for the isoelastic SWF
(which does) In contrast the inequality-aversion parameter g captures the moral preferences of a
certain kind of social planner (namely one who morally prefers to give some priority to utility
changes affecting worse-off individuals rather than simply aggregating utilities in utilitarian
fashion) Appendix table 1 gives formulas for BCA with distributional weights to mimic a
utilitarian SWF both in the general case and with the two simplifications just mentioned
Weights That Depend Only on Consumption
As can be seen from Appendix table 1 the weighting factor MUi for individual i depends on
both her status quo consumption and her status quo nonconsumption attributes Much work
on distributional weights is yet more simplifiedmdashmaking someonersquos weighting factor just a
function of his consumption (or income or wealth) (see eg HM Treasury 2003)
Distributional weights of this consumption-only form can be theoretically supported in only
two special cases (1) those affected by the policy are heterogeneous with respect to status quo
consumption but relatively homogeneous with respect to status quo nonconsumption
11For estimates of see Kaplow (2005)
BenefitndashCost Analysis and Distributional Weights 271
attributes or (2) the utility function not only satisfies the invariance requirement but takes a
special additively separable form
Generalizations Uncertainty and Inframarginal Changes
The model presented here has assumed that each policy choice for certain leads to a particular
outcome More realistically each policy choice is a probability distribution over outcomes
(with these probabilities capturing the decision makerrsquos uncertainty about which outcome
will result) and the status quo itself is a probability distribution over outcomes In this case
BCA defines an individualrsquos monetary equivalent for a policy as the change to her consumption
in all status quo outcomes that makes her indifferent between the status quo and the policy The
utilitarian SWF in turn can now be approximated by a formula that smoothly generalizes the
one given above the sum of each individualrsquos monetary equivalent multiplied by a weighting
factor (denote this as EMUi) equaling her expected marginal utility of consumption given the
probability distribution over consumption and other attributes that she faces in the status quo
The use of weighted BCA to mimic a utilitarian SWF also generalizes to the case where
policies are no longer ldquosmallrdquo variations from the status quo An individualrsquos weight now is
policy specific It depends not only on her status quo attributes but also the magnitude of the
monetary equivalent corresponding to a particular policy
BCA and Isoelastic Distributional Weights
Let us continue using the simple one-period model of choice under certainty from the previous
section However we now assume that the decision maker has ldquoisoelasticrdquo moral preferences
taking the form of an isoelastic SWF
The isoelastic SWFrsquos ranking of policies that are ldquosmallrdquo deviations from the status quomdashlike
the utilitarian rankingmdashcan be approximated by the sum of individual monetary equivalents
each multiplied by a weighting factor that is just a function of the individualrsquos status quo
attributes Recall that isoelastic moral preferences give priority to well-being changes affecting
worse-off individuals Recall too that the degree of such priority is embodied in an inequality-
aversion parameter g which can take any positive value These features of the isoelastic SWF are
reflected in the corresponding distributional weights Individual irsquos isoelastic distributional
weight is her utilitarian distributional weight MUimdashher marginal utility of consumption
given her status quo attributesmdashmultiplied by an additional term MMVUi
MMVUi is the marginal moral value of utility for individual i If we increase irsquos utility by
some small delta (an increment to utility) there is a ldquomoral benefitrdquo the outcome in which that
increase occurs becomes morally better ceteris paribus This moral benefit divided by deltamdash
the moral benefit per unit of utilitymdashis MMVUi
If the utility level of individual i is larger than that of individual j MMVUi is less than
MMVUj This reflects the priority that the isoelastic SWF gives to worse-off individuals A small
increment to individual jrsquos utility yields a larger moral benefit than the very same increase in
individual irsquos utility12
12In contrast in the case of the utilitarian SWF the moral benefit per unit of utility is constant A givenwell-being increment yields the same moral improvement regardless of the utility level of the person receivingthe increment and so there is no need to multiply MUi by a MMVUi term
272 M D Adler
MMVUi is not merely decreasing with utility level its specific magnitude depends upon the
value of g Adler (2012 pp 392ndash399) describes various thought experiments that the decision
maker might undertake in choosing a value of g Appendix table 1 provides formulas for BCA
with isoelastic distributional weights
Further Differences Between Isoelastic and Utilitarian Distributional Weights
Apart from the extra MMVUIi term there are three additional respects in which isoelastic
weighting differs from utilitarian weighting First the isoelastic SWF requires interpersonal
comparability of utility ratios Even given the assumption of common personal preferences a
vNM utility function representing such preferences is only unique up to a positive linear
transformation and thus is adequate for utilitarian weights but not isoelastic weights Given
common personal preferences a utility function unique up to a positive ratio transformation
(and thus sufficient to determine both isoelastic and utilitarian weights) can be produced by
taking the vNM function and then assigning the number zero to a ldquothreshold bundlerdquo one
which individuals regard as being just at the threshold of a life worth living (eg a bundle with
very low consumption and bad health) (Adler 2012 chap 5)
A second additional difference from utilitarian weights concerns policy choice under uncer-
tainty (Fleurbaey 2010 Adler 2012 chap 7) It turns out that there are two ways to apply an
isoelastic SWF to a set of policies each of which is a probability distribution over outcomes the
ldquoex anterdquo approach and the ldquoex postrdquo approach The ex ante approach is readily operationa-
lized by taking monetary equivalents under uncertainty and by setting the weighting factor
equal to the EMUi term multiplied by an MMVEUi term (marginal moral value of expected
utility) analogous to the MMVUIi term in the certainty case The ex post approach is more
complicated to mimic with distributional weights
Finally the utilitarian SWF yields consumption-only weights even with population hetero-
geneity in nonconsumption attributes if the utility function takes a special additively separable
form That is not true for the isoelastic SWF
An Illustrative Example VSL and Weights
This section uses the value of statistical life (VSL) to illustrate distributional weighing VSL is the
marginal rate of substitution between survival probability and income This is the concept used
to monetize the benefits that accrue from reducing fatality risks VSL is central to the practice of
BCA by the Environmental Protection Agency and other US governmental agencies (Cropper
Hammitt and Robinson 2011)
I use the workhouse one-period model of VSL that is standard in the literature (Eeckhoudt
and Hammitt 2004) Each individual in the status quo earns some income and has some
probability of surviving through the end of the current period (eg the current year) and
consuming her income if she doesnrsquot survive the income is bequeathed Policies change in-
dividualsrsquo survival probabilities or incomes In other words each individual in any given out-
come has an attribute bundle consisting of an income amount plus a single binary nonincome
attribute surviving the current period or dying The status quo and policies are lotteries over
such outcomes Each individual has personal preferences over (income diesurvive) bundles
BenefitndashCost Analysis and Distributional Weights 273
represented by a vNM utility function Her VSL in the status quo reflects her status quo income
and survival probability plus these preferences
In order to enable the calculation of distributional weights I assume that individuals have
common personal preferences over (income diesurvive) bundles represented by a common
vNM function I also assume that marginal utility in the death state is zero the utility of income
conditional on the attribute ldquodierdquo is a flat line Since utility here is supposed to represent personal
benefit this assumption seems compelling13 It also means that we can calibrate the common
vNM function by knowing the ldquosubsistencerdquo level of income the level which if combined with
the attribute ldquosurviverdquo is so low that individuals are indifferent between that bundle and dying I
add the simplifying assumption that individualsrsquo preferences over consumption lotteries in the
ldquosurviverdquo state are CRRA Note finally that by determining the subsistence level of income we
have at the very same time identified a natural zero point for purposes of the isoelastic SWF
Given an individualrsquos status quo income and survival probability we can now assign her (1) a
VSL value (2) a utilitarian weight equaling her expected marginal utility of income (EMUi)
and (3) an isoelastic weight equaling EMUi multiplied by the marginal moral value of expected
utility (MMVEUi) with MMVEUi in turn a function of the coefficient of inequality aversion
(g) that the policymaker chooses For small changes in income and survival probability an
individualrsquos monetary equivalent is approximately the income change plus the product of her
VSL and the change in survival probability The utilitarian ranking of policies is in turn
approximated by the sum of monetary equivalents multiplied by the utilitarian weights and
the ex ante isoelastic ranking by the sum of monetary equivalents multiplied by the isoelastic
weights [see Adler Hammitt and Treich (2014) for a related analysis]
VSL and Distributional Weights for Two Populations
Assume thatwe areconsidering policies thatwill affect two populations a better-offgroup witha
higher income and lower status quo fatality risk and a worse-off group with a lower income and
higher status quo risk Specifically let each member of the first group have an annual income of
$100000 and face an annual all-cause fatality risk of 0005 while each member of the second
group has an annual income of $20000 and faces an annual all-cause fatality risk of 00114
Table 3 calculates VSL values for the better- and worse-off individuals (for short ldquoRichrdquo and
ldquoPoorrdquo) as well as the ratios of these values the ratios of the Poor and Rich utilitarian distri-
butional weights and the ratios of their isoelastic weightsmdashgiven different assumptions about
the coefficient of risk aversion the subsistence level and the degree of inequality aversion g
Note that especially at higher values of the Rich VSL is many multiples of the Poor VSL
Such high multiples are inconsistent with observed values of the income elasticity of VSLmdash
perhaps reflecting the limitations of the simple analytic model of VSL used here Alternatively
low observed income elasticities of VSL may reflect real-world violations of the axioms of
expected utility15
In any event what bears special note about table 3 is how weights counteract the higher VSL
values of Rich individuals For example at frac14 2 and a subsistence level of $1000 the Rich VSL
13I may have moral or altruistic reasons to care about the amount of income left to my heirs but theirconsumption after my death does not change my well-being14The annual all-cause fatality risk for the entire US population is approximately 0008 (Xu et al 2016)15On income elasticity of VSL see Kaplow (2005) Evans and Smith (2010) and Viscusi (2010)
274 M D Adler
is 259 times that of the Poor but the Poor utilitarian weight is 249 times that of the Rich16
Thus while traditional BCA would assign Rich a monetary equivalent for a given small risk
reduction that is 259 times larger than Poorrsquos monetary equivalent for the same risk reduction
utilitarian weighted BCA would assign Rich an adjusted monetary equivalent that is 259
249frac14 104 times larger than Poorrsquos
Adding isoelastic weights further counteracts the RichPoor VSL divergence Continuing
with the scenario of frac14 2 and a subsistence level of $1000 note that at a low value (05) of
inequality aversion g the PoorRich ratio of isoelastic weights is 255 Richrsquos adjusted monetary
equivalent is now even closer to Poorrsquos (the ratio is 259255 frac14 102) At larger values of g
isoelastic weights ldquoovercompensaterdquo for the difference between Rich and Poor VSL the Poor
Rich ratio of isoelastic weights exceeds the RichPoor VSL ratio
The utilitarian and isoelastic weights would also of course affect the relative weighting of
income reductions incurred by Rich or Poor If someonersquos income is reduced by amount c
traditional BCA assigns the same value (c) to that reduction regardless of the individualrsquos
attributes Weighted BCA assigns the reduction a value equaling c multiplied by the distri-
butional weight Thus the ratio between the weighted value of a reduction in Poorrsquos income and
the weighted value of the very same reduction in Richrsquos income is simply the ratio of distri-
butional weightsmdashas displayed in the fourth row of the table for the utilitarian case and in
subsequent rows for isoelastic weights
Using Traditional BCA and Weighted BCA to Evaluate Risk-Reduction Policies
Let us now consider four types of policies assuming that the two groups have the same number
of members (1) uniform risk reduction and cost incidence (the policy produces the same
Table 3 Distributional weights and VSL
jfrac14 05 jfrac14 05 jfrac141 jfrac14 1 jfrac142 jfrac14 2 jfrac143 jfrac14 3
Sub frac14
$1000
Sub frac14
$5000
Sub frac14
$1000
Sub frac14
$5000
Sub frac14
$1000
Sub frac14
$5000
Sub frac14
$1000
Sub frac14
$5000
VSLRich $180905 $156059 $462831 $301079 $9949749 $1909548 $502462312 $20050251
VSLPoor $31369 $20202 $60520 $28006 $383838 $60606 $4030303 $151515
VSLRichVSLPoor 58 77 76 108 259 315 1247 1323
U-WeightPoorU-WeightRich 22 22 5 5 249 249 1244 1244
Iso-WeightPoorIso-
WeightRich gfrac14 05
36 42 62 73 255 281 1248 1286
Iso-WeightPoorIso-
WeightRich gfrac14 1
58 78 77 108 261 317 1253 133
Iso-WeightPoorIso-
WeightRich gfrac14 2
151 271 119 235 273 403 1262 1422
Note ldquoU-Weightrdquo indicates the utilitarian distributional weight for Rich or Poor (depending on the subscript) and ldquoIso-
Weightrdquo indicates the isoelastic weight Each column corresponds to different assumptions about the coefficient of risk
aversion for the CRRA utility function and the subsistence level of income
16A subsistence level of $1000 is in the range of the ldquoextreme povertyrdquo level of $190day now used by the WorldBank (Ferreira et al 2015) Empirical evidence on is mixed a value of 2 or even substantially higher is notempirically implausible (Kaplow 2005)
BenefitndashCost Analysis and Distributional Weights 275
reduction in fatality risk for both Rich and Poor individuals specifically a 1-in-100000
reduction for each individual of the risk of dying during the current year and the dollar
costs of the policy are borne equally by the Rich and Poor groups) (2) uniform risk reduction
and redistributive incidence (both Rich and Poor individuals receive the 1-in-100000 risk
reduction but all the costs are borne by the Rich group) (3) concentrated risk reduction
and cost incidence (only Poor individuals receive the 1-in-100000 risk reduction and they
pay the costs) and (4) regressive risk transfer (Poor individuals suffer an increase in risk of 1-in-
100000 with Rich individuals receiving a risk reduction of the same amountmdashas might occur
with a decision to relocate a hazardous facility closer to where Poor rather than Rich individuals
reside)
Table 4 shows how each of these policy choices would be evaluated by traditional
BCA (summing monetary equivalents) BCA with population-average rather than
differentiated VSL values BCA with utilitarian weights and BCA with isoelastic weights
The use of BCA with population-average values lacks any firm theoretical justification but is
now standard practice in the US government (Robinson 2007) and so it is included in the
analysis
In the case of uniform risk reduction and cost incidence utilitarian BCA is only willing to
impose a relatively low per capita cost on all individuals (as compared with traditional or
population-average BCA) and isoelastic BCA a yet lower cost paying more for a 1-in-
100000 fatality risk reduction would still be net beneficial for the Rich (given their larger
VSL values) but would be too large a net welfare loss for the Poor Conversely in the case
of uniform risk reduction and redistributive incidence utilitarian BCA is willing to impose a
larger per capita cost (now borne exclusively by Rich individuals) than traditional or popula-
tion-average BCA and isoelastic BCA a yet larger cost
In the case of concentrated risk reduction and cost incidence population-average BCA
violates the Pareto principle government may end up imposing a per-capita cost on Poor
individuals much larger than they are willing to pay for a 1-in-100000 risk reduction17 Note
that traditional BCA avoids this unpleasant result but so do the weighted versions
Although the use of population-average BCA conflicts with the Pareto principle it does have
a key intuitive advantage in a case such as regressive risk transfer traditional BCA approves the
transfer while population-average BCA is neutral Interestingly utilitarian BCA also approves
the regressive transfer and isoelastic BCA will do so for a sufficiently low value of the inequality-
aversion parameter gmdashbut as g increases the isoelastic SWF ldquoswitchesrdquo and favors a progres-
sive risk transfer from Poor to Rich
Objections to Distributional Weighting
Next I examine two potential concerns about distributional weighting first that interpersonal
comparisons of well-being and thus weights are undermined by heterogeneous preferences
and second that distributional considerations are best addressed through the tax system
17This break-even cost is approximately VSLPoor times the risk reduction which in the scenario covered by thetable is $384
276 M D Adler
Heterogeneous Preferences
It is important to distinguish between the heterogeneity of moral preferences and the
heterogeneity of personal preferences
Heterogeneity of moral preferences is no threat to the view of distributional weighting
presented here Some citizens or officials will oppose BCA as a criterion for assessing govern-
mental policies while others will endorse BCA Within the latter group some will be persuaded
by the KaldorndashHicks defense of BCA while others will find the SWF framework more attractive
Table 4 The effect of distributional weights on different kinds of risk policies
Uniform risk
reduction
and cost
incidence
Uniform risk
reduction
and redis-
tributive
incidence
Concentrated
risk reduction
and cost
incidence
Regressive risk transfer
Maximum
per capita
cost imposed
uniformly on
Rich and
Poor
Maximum
per capita
cost imposed
on Rich
Maximum per
capita cost
imposed on
Poor
ldquoYesrdquo if the transfer is assigned
a positive sum of monetary
equivalents or weighted
equivalents ldquoNordquo if it is as-
signed a negative sum
ldquoNeutralrdquo if assigned a zero
sum
BCA without weights $5167 $10333 $384 Yes
VSLRichVSLPoorfrac14 259 gt 1
BCA with population
average VSL
$4233 $8467 $4233 Neutral
Cost to Poor frac14 Benefit to
Rich frac14 VSLAvg 1100000
frac14 $4233
BCA with utilitarian
weights
$754 $19497 $384 Yes
(VSLRichVSLPoor)7(U-WeightPoorU-WeightRich)
frac14 104 gt 1
BCA with isoelastic
weights gfrac14 05
$745 $19721 $384 Yes
(VSLRichVSLPoor)7 (Iso-
WeightPoorIso-WeightRich)
frac14 102 gt 1
BCA with isoelastic
weights gfrac14 1
$737 $19950 $384 No
(VSLRichVSLPoor)7 (Iso-
WeightPoorIso-WeightRich)
frac14 099 lt 1
BCA with isoelastic
weights gfrac14 2
$722 $20423 $384 No
(VSLRichVSLPoor)7 (Iso-
WeightPoorIso-WeightRich)
frac14 095 lt 1
Notes These calculations assume the scenario of frac14 2 and a subsistence level of $1000 The population-average VSL of
$4233 million is calculated by assuming that individuals are uniformly distributed from income levels of Poor frac14 $20000 in
$10000 increments to Rich frac14 $100000 and that background fatality risk decreases linearly from the Poor level of 001 to
the Rich level of 0005 To understand the regressive risk transfer column note that BCA without weights approves the
transfer if VSLRich (1100000) gt VSLPoor
(1100000) which is equivalent to VSLRichVSLPoor gt 1 Similarly BCA with
utilitarian weights approves the transfer if VSLRich U-WeightRich
(1100000) gt VSLPoor U-WeightPoor
(1100000)
which is equivalent to (VSLRichVSLPoor)7 (U-WeightPoorU-WeightRich) gt 1 This explains the formulas in the first and third
rows and a similar explanation can be provided for the other formulas
BenefitndashCost Analysis and Distributional Weights 277
Weighting is a procedure that operationalizes the moral preferences of this last group in a
systematic form
Thus critiques of distributional weights as ldquovalue ladenrdquo are inapposite Of course the
decision to use weights and the choice of SWF to be mirrored by weights are ldquovalue
ladenrdquomdashbut so is the decision to use BCA at all or to use the unweighted variant These
decisions too involve a whole series of contestable moral judgments Governmental officials
inevitably make such judgments or work for higher-ups who do
The use of distributional weights does raise questions of institutional role An unelected
bureaucrat might feel that it would be legally problematic or democratically illegitimate for her
to specify weights Who in government gets to act on contestable moral preferences is a
complicated (and itself contestable) question of law and democratic theory Suffice it to say
that the advice welfare economists and moral theorists provide about the specification of
weights is addressed to officials with the legal and democratic authority to act on such
advicemdashwhoever exactly those officials may be
Heterogeneity of personal preferences creates additional complexity in the construction of the
utility function which generates the vectors of interpersonally comparable utility numbers that
are the inputs into the SWF We are presuming throughout this article that the decision maker
whose moral preferences are represented by the SWF has adopted the following (very plausible)
conception of well-being each personrsquos well-being is determined by her personal preferences
Until this point we have further assumed that individuals in the population of concern have
identical personal preferences over attribute bundles What happens if that assumption is relaxed
If so the utility function must assume a more complicated form than was used earlier It
must now take into account both the individualrsquos attributes and her preference structure with
respect to attribute bundles If two individuals in some outcome have the same attributes but
different personal preferences this more complicated utility function may assign them different
utility numbers
How to construct an interpersonally comparable utility function that makes an individualrsquos
utility a function of both her attributes and her preferences is a topic of ongoing research One
possibility deploys the concept of equivalent income (Fleurbaey 2016 Fleurbaey and Rafeh
2016) Each personrsquos income is adjusted to take account of her nonincome attributes
(health leisure etc) and her preferences This adjusted (ldquoequivalentrdquo) income is then used
as the measure of her well-being
A different possibility is suggested by John Harsanyirsquos concept of ldquoextended preferencesrdquo
which I have further developed in recent work (Harsanyi 1977 Adler 2016) In effect the utility
function is constructed by taking vNM functions representing the different possible preferences
over bundles in the population and choosing scaling factors for each one
However we construct a utility function that allows for heterogeneous personal prefer-
encesmdashwhether by using equivalent incomes extended preferences or in some other
mannermdashwe can generate a corresponding scheme of distributional weights
The Tax System
Are distributional considerations better handled through a combination of the tax system and
unweighted BCA as opposed to BCA with distributional weights I examine two arguments for
this position
278 M D Adler
If taxes and transfers are optimal distributional weights are uniform
Assume that the decision maker with legal authority over some nontax body has moral pref-
erences reflected in a utilitarian or isoelastic SWF and that the legislature (which controls the tax
system) has the very same moral preferences Moreover the tax system is a ldquolump sumrdquo system
meaning taxation has zero administrative cost and no adverse incentive effects (eg with
respect to individual labor supply)
Under these assumptions utilitarian or isoelastic distributional weights will be identical for
all individuals In the case where the legislature and decision maker share utilitarian moral
preferences the legislature will have enacted taxes and transfers that equalize individualsrsquo MUi
values And in the case where they have isoelastic moral preferences (with the same value of g)
the legislature will have enacted taxes and transfers that equalize individualsrsquo MUi MMVUi
values (Dreze and Stern 1987 pp 935ndash937 Salanie 2003 pp 79ndash83) If so the decision costs of
calculating weights are unnecessary since BCA with identical weights is equivalent to BCA
without weights
However the assumptions can readily fail First the decision maker may have different moral
preferences from the legislature For example a President elected by one political party may
have more strongly egalitarian preferences than the competing party that controls the legisla-
ture If so and even if the tax system is a ldquolump sumrdquo system the status quo distribution of
income could well be such that distributional weights according to the SWF that the President
endorses are unequal Thus the President (given his moral preferences) would have good moral
reason to direct nontax bodies within his control to use BCA with distributional weights and he
might well also believe that doing so is democratically and legally legitimate
Indeed preference heterogeneity on the part of government officials is reflected in the
institutional history of BCA in the United States Since 1981 a presidential order has directed
Executive Branch agencies to use BCA as a general tool for evaluating regulation but propon-
ents of BCA have never succeeded in persuading Congress to embody this directive in a statute
(Wiener 2006 pp 461ndash466) Thus it is hardly science fiction to suppose that a President might
prefer to move BCA now in place in a more egalitarian direction but be unable to secure tax
code changes reflecting this preference
Second even if the legislature and decision maker share a moral commitment to a utilitarian
SWF or to an isoelastic SWF with a particular value of g the absence of a lump-sum tax and
transfer system may mean that distributional weights in the status quo are not equal by the
lights of the shared SWF The most systematic scholarly thinking about non-lump-sum tax-
ation has occurred in the field of optimal tax theory (see eg Salanie 2003 Kaplow 2008) It is
not generally true in this context that the optimal taxes (in light of a given SWF) will yield a
pattern of income and nonincome attributes such that distributional weights (in light of that
same SWF) are equal (Layard 1980 Fleurbaey et al 2013) The optimal-tax setup typically
ignores administrative costs adding these to the tax system may also help to produce unequal
distributional weights at the optimum (Quiggin 1995)
Whether or not distributional weights are uniform the decision maker can produce aPareto-superior result by a combination of unweighted BCA and tax changes
A second argument against the use of distributionally weighted BCA has been developed by
Kaplow (see eg1996 2008) Consider a nontax decision maker who endorses some Paretian
BenefitndashCost Analysis and Distributional Weights 279
SWF (be it isoelastic utilitarian or any other SWF that respects the Pareto principle) Assume
that some policy P is chosen by traditional BCA without weights as opposed to an alternative
policy P Thus those who gain from P have enough to compensate those who lose Kaplow
shows how these gains can be redistributed from the winners to the losers to yield a Pareto-
superior result even with a non-lump-sum tax system18 Note now that if P together with a
change to the tax code is Pareto superior to P any Pareto-respecting SWF will favor that
package as opposed to the enactment of P
Kaplowrsquos analysis relies on a key technical assumption of labor separability This assumption
has no clear empirical basis and a different assumption is adopted by much scholarship in
environmental economics (Johansson-Stenman 2005 Fullerton 2009 p xxi) Moreover the
analysis does not consider the administrative costs of changes to the tax system ormdashonce
againmdashthe possibility that a nontax decision maker who favors some SWF may not control
the tax system Imagine that a decision maker has the power to choose between P and P If the
tax code does not change her morally preferred SWF favors P over P Although P bundled
with a change to the tax code is Pareto superior to P the decision maker does not believe the
legislature will make this tax change She is therefore morally justified in picking P
Given these caveats Kaplowrsquos analysis does not demonstrate that a decision maker favoring
some SWF should refrain from putting in place a matching schedule of distributional weights
Rather the analysis has a less dramaticmdashbut still importantmdashimplication It suggests that the
ldquopoliciesrdquo being considered should include not merely nontax policies but also such policies
combined with changes to the tax code where the decision maker believes these changes to be
politically feasible In some cases P will be favored by distributionally weighted BCA (mirroring the
SWF) over P but P together with a politically feasible change to the tax system will be favored by
distributionally weighted BCA over P even given the actual administrative costs of this change and
the predicted incentive effects of the change on labor supply (zero or not) If the combined option
of P plus the feasible tax change is Pareto superior to P distributionally weighted BCA will prefer
the first option to the second and it might do so even absent Pareto superiority
In short decision makers favoring an SWF mirrored by distributional weights should con-
sider an expanded menu of policy optionsmdashto include tax system changes if feasible as well as
nontax policiesmdashbut the existence of the tax system does not show that they should abandon
weighting entirely
Conclusion
This article has shown how to ldquoput structurerdquo on the problem of distributional weights and has
addressed some recurrent objections The decision to use weights to mimic a particular SWF
does require an ethicalmoral judgment but so does the decision to use unweighted BCAmdasha
procedure that is intensely controversial outside the community of economists (Ackerman and
Heinzerling 2004) The specification of utilitarian weights is quite straightforward these simply
reflect the marginal utility of consumptionincome The specification of ldquoisoelasticrdquo weights is
somewhat more complicated requiring a further moral judgment regarding the appropriate
degree of inequality aversion g and the specification of a ldquozero pointrdquo (subsistence level) so that
18Specifically he works within the setup from optimal tax theory which takes account of the labor-disincentiveeffects of an income tax
280 M D Adler
utility will be measurable on a ratio scale Still some will feel that the utilitarian SWF is
insufficiently sensitive to distribution and that this additional complexity is justified
Traditional BCA assigns a higher monetary value to risk reductions incurred by richer in-
dividuals since VSL increases with income The use of weights tends to counteract this feature
of traditional BCA without producing a conflict with the Pareto principle (a key flaw in BCA
with a population-average VSL)
The absence of a lump-sum tax system and the economic and political costs of tax reform
undercut the objection that distributional concerns should be wholly relegated to the tax code
The SWF approach and thus weights do require interpersonal well-being comparisons These
are straightforward with common personal preferences Heterogeneous personal preferences
pose additional complications but are not an insuperable obstacle to interpersonal comparisons
Technical Appendix
The main text focuses on the case in which each policy choice leads with certainty to some
outcome This Appendix provides some key formulas for that case For their derivation and
further discussion see the online supplementary materials and Adler (2012 chaps 2 3 and 5)
Utilitarian and Isoelastic SWF
Let Bxi be individual irsquos bundle of attributes in a given outcome x and u() be the utility function
mapping bundles onto utility numbers Then outcome x corresponds to the utility vector
uethBx1THORN
uethBx
NTHORNTHORN with N individuals in the population
The utilitarian and isoelastic SWFsmdashexpressed as rules for ranking outcomes in light of their
corresponding utility vectorsmdashare as follows The utilitarian SWF x at least as good as y iffPN
ifrac141 uethBxi THORN
PNifrac141 uethB
yi THORN The isoelastic SWF parameterized by ggt 0 x at least as good as y
iff eth1 gTHORN1PNifrac141 uethBx
i THORN1g eth1 gTHORN1PN
ifrac141 uethByi THORN
1g In the special case of gfrac14 1 x at least as
good as y iffPN
ifrac141 ln uethBxi THORN
PNifrac141 ln uethB
yi THORN
The Utility Function
Assume individuals have common personal preferences over bundles and bundle lotteries If
these preferences satisfy the axioms of vNM theory there exists a vNM function u() that rep-
resents these preferences and another function u() is a vNM function iff there exists agt 0 b
st u(B) frac14 au(B) + b for all B
Note that the utilitarian SWF is invariant to the substitution of u() for u()PN
ifrac141 uethBxi THORN
PN
ifrac141 uethByi THORN iff
PNifrac141u(Bx
i )PN
ifrac141u(Byi ) This is not true for the isoelastic SWF However
we can define a subfamily of the vNM functions representing the common preferences unique
up to a ratio transformation as follows Let BZero be a threshold bundle and let u() be a vNM
function st u(BZero) frac14 0 Then if u() frac14 au() a gt 0 the isoelastic SWF is invariant to the
substitution of u() for u()
BenefitndashCost Analysis and Distributional Weights 281
BCA and Equivalent Variations
Let ethcxi px ax
i THORN denote individual irsquos bundle in outcome xmdashwith cxi individual irsquos con-
sumption and axi her nonconsumption attributes respectively in x and px the price vector in
x Let ethcsi ps as
i THORN denote irsquos status quo bundle Individual irsquos equivalent variation for outcome x is
the amount cxi such that she is indifferent between the bundle ethcs
i +cxi ps as
i THORN and the bun-
dleethcxi px ax
i THORN Traditional (unweighted) BCA using equivalent variations assigns each outcome
x the numerical valuePN
ifrac141 cxi and ranks outcomes in the order of these values
BCA with Distributional Weights
We simplify notation by suppressing reference to status quo prices and abbreviating u(c ps a)
as u(c a) MUi is individual irsquos status quo marginal utility of consumption MUifrac14quethcs
ias
iTHORN
qc BCA
with utilitarian distributional weights assigns each outcome x the valuePN
ifrac141 MUi cxi
Let ha()frac14 ha(c) be a conditional utility function representing the ranking (by the common
preferences) of lotteries over consumption amounts with nonconsumption attributes fixed at
level a and prices at ps ldquoInvariancerdquo means that this ranking is independent of a and thus there
is a single conditional utility function h() st ha()frac14 h() for all a Given invariance there exists
a positive constant m(a) and a constant k(a) such that u(c a)frac14m(a) h(c) + k(a) and MUifrac14
h0ethcsi THORN methas
i THORN with h0() the first derivative In the case of invariance plus CRRA h() is a
CRRA function parameterized by risk aversion parameter Then hethcTHORN frac14 eth1 THORN1c1 (or ln
c in the special case of frac14 1) and MUi frac14 ethcsi THORNmethas
i THORN
BCA with Isoelastic Distributional Weights
MMVUi the marginal moral value of utility for individual i equals uethcsi as
i THORNg BCA with isoelastic
distributional weights assigns each outcome x the valuePN
ifrac141 MMVUiMUi cxi
A Consolidated Table
Appendix table 1 provides formulas for utilitarian and isoelastic weights in the general case
with invariance and with invariance plus CRRA
Appendix Table 1 Formulas for distributional weights
General case Invariance Invariance plus
CRRA
Utilitarian weights
Outcome x is assigned
the valuePN
ifrac141 MUi cxi
MUi frac14quethcs
i asi THORN
qcMUi frac14 h0ethcs
i THORN methasi THORN MUi frac14 ethc
si THORNmethas
i THORN
Isoelastic weights
Outcome x is assigned
the valuePNifrac141 MMVUi MUi cx
i
MUi frac14quethcs
i asi THORN
qcMUi frac14 h0ethcs
i THORN methasi THORN MUi frac14 ethc
si THORNmethas
i THORN
MMVUi frac14
uethcsi as
i THORNg
MMVUi frac14 uethcsi as
i THORNg
with uethcsi as
i THORN frac14 hethcsi THORN
methasi THORN+kethas
i THORN
MMVUi frac14 uethcsi as
i THORNg with
uethcsi as
i THORN frac14 hethcsi THORN methas
i THORN+kethasi THORN
and hethcsi THORN frac14 eth1 THORN
1ethcs
i THORN1
282 M D Adler
References
Ackerman Frank and Lisa Heinzerling 2004
Priceless On knowing the price of everything and the
value of nothing New York New Press
Adler Matthew D 2012 Well-being and fair distri-
bution Beyond cost-benefit analysis Oxford Oxford
University Press
mdashmdashmdash 2016 Extended preferences In The
Oxford handbook of well-being and public policy
eds Matthew D Adler and Marc Fleurbaey 476ndash
517 New York Oxford University Press
Adler Matthew D James Hammitt and
Nicolas Treich 2014 The social value of mor-
tality risk reduction Journal of Health Economics
3582ndash93
Bergson Abram 1948 Socialist economics In A
survey of contemporary economics vol 1 ed
Howard S Ellis 412ndash448 Homewood Richard D
Irwin
mdashmdashmdash 1954 On the concept of social welfare
Quarterly Journal of Economics 68233ndash252
Boadway Robin 2016 Cost-benefit analysis In
The Oxford handbook of well-being and public
policy eds Matthew D Adler and Marc
Fleurbaey 47ndash81 New York Oxford University
Press
Boadway Robin and Neil Bruce 1984 Welfare
economics Oxford Basil Blackwell
Bossert Walter and John A Weymark 2004
Utility in social choice In Handbook of utility
theory vol 2 eds Salvador Barbera Peter J
Hammond and Christian Seidl 1099ndash1177
Boston Kluwer Academic
Brent Robert J 1984 Use of distributional weights
in cost-benefit analysis A survey of schools Public
Finance Quarterly 12213ndash230
Chipman John S and James C Moore 1978 The
new welfare economics 1939ndash1974 International
Economic Review 19547ndash584
Cowell Frank A and Karen Gardiner 1999
Welfare weights Suntory and Toyota International
Centres for Economics and Related Disciplines
London School of Economics httpdarplseacuk
papersDBCowell-Gardiner_(OFT)pdf
Creedy John 2006 Evaluating policy Welfare
weights and value judgments Working Paper 971
Department of Economics University of
Melbourne Melbourne Australia httpideas
repecorgpmlbwpaper971html
Cropper Maureen James K Hammitt and Lisa A
Robinson 2011 Valuing mortality risk reductions
Progress and challenges Annual Review of Resource
and Environmental Economics 3313ndash336
Dasgupta Ajit K and D W Pearce 1972 Cost-
benefit analysis Theory and practice New York
Harper and Row
Dasgupta Partha Amartya Kumar Sen and
Stephen A Marglin 1972 Guidelines for project
evaluation Vienna United Nations Industrial
Development Organization
Dreze Jean 1998 Distribution matters in cost-
benefit analysis Comment on K A Brekke Journal
of Public Economics 70485ndash488
Dreze Jean and Nicholas Stern 1987 The theory
of cost-benefit analysis In Handbook of public
economics vol 2 eds Alan J Auerbach and
Martin Feldstein 909ndash989 Amsterdam North-
Holland
Eeckhoudt Louis R and James K Hammitt 2004
Does risk aversion increase the value of mortality
risk Journal of Environmental Economics and
Management 4713ndash29
Evans Mary F and V Kerry Smith 2010
Measuring how risk tradeoffs adjust with income
Journal of Risk and Uncertainty 4033ndash55
Ferreira F H G S Chen A Dabalen Y
Dikhanov N Hamadeh D Jolliffe A Narayan E
B Prydz A Revenga P Sangraula U Serajuddin
and N Yoshida 2015 A global count of the ex-
treme poor in 2012 World Bank Policy Research
Working Paper 7432 httpeconworldbankorg
Fleurbaey Marc 2010 Assessing risky social situ-
ations Journal of Political Economy 118649ndash680
mdashmdashmdash 2016 Equivalent income In The Oxford
handbook of well-being and public policy eds
Matthew D Adler and Marc Fleurbaey 453ndash475
New York Oxford University Press
Fleurbaey Marc Stephane Luchini Christophe
Muller and Erik Schokkaert 2013 Equivalent
income and fair evaluation of health care Health
Economics 22711ndash729
Fleurbaey Marc and Rossi Abi Rafeh 2016 The
use of distributional weights in benefit-cost
BenefitndashCost Analysis and Distributional Weights 283
analysis Insights from welfare economics Review
of Environmental Economics and Policy 10(2)
286ndash307
Freeman A Myrick 2003 The measurement of en-
vironmental and resource values 2nd ed
Washington DC Resources for the Future
Fullerton Don ed 2009 Distributional effects of envir-
onmental and energy policy Farnham UK Ashgate
Gollier Christian 2001 The economics of risk and
time Cambridge MA MIT Press
Gorman W M 1955 The intransitivity of certain
criteria used in welfare economics Oxford
Economic Papers 725ndash35
Harsanyi John 1977 Rational behavior and bar-
gaining equilibrium in games and social situations
Cambridge Cambridge University Press
HM Treasury 2003 The green book Appraisal and
evaluation in central government Norwich UK
The Stationery Office
Johansson-Stenman Olof 2005
Distributional weights in cost-benefit analysis
Should we forget about them Land Economics
81337ndash52
Kaplow Louis 1996 The optimal supply of public
goods and the distortionary cost of taxation
National Tax Journal 49513ndash533
Kaplow Louis 2005 The value of a statistical life
and the coefficient of relative risk aversion Journal
of Risk and Uncertainty 3123ndash34
mdashmdashmdash 2008 The theory of taxation and public eco-
nomics Princeton NJ Princeton University Press
Layard Richard 1980 On the use of distributional
weights in social cost-benefit analysis Journal of
Political Economy 881041ndash1047
Liu Liqun 2006 Combining distributional weights
and the marginal cost of funds Public Finance
Review 3460ndash78
Kreps David M 1988 Notes on the theory of choice
Boulder CO Westview Press
Little I M D and J A Mirrlees 1974 Project ap-
praisal and planning for developing countries New
York Basic Books
mdashmdashmdash 1994 The costs and benefits of analysis
Project appraisal and planning twenty years on In
Cost-benefit analysis eds Richard Layard and
Stephen Glaister 199ndash231 Cambridge Cambridge
University Press
Meade J E 1955 Trade and welfare Mathematical
supplement London Oxford University Press
Office of Management and Budget 2003 Circular
A-4 Regulatory analysis httpwwwwhitehouse
govombinforeg_default
Quiggin John 1995 The suboptimality of effi-
ciency Economics Letters 47389ndash392
Ray Anandarup 1984 Cost-benefit analysis Issues
and methodologies Baltimore Johns Hopkins
University Press
Robinson Lisa 2007 How US government
agencies value mortality risk reductions
Review of Environmental Economics and Policy
1283ndash299
Robinson Lisa A James K Hammitt and Richard
Zeckhauser 2016 Attention to distribution in US
regulatory analyses Review of Environmental
Economics and Policy 10(2)308ndash328
Salanie Bernard 2003 The economics of taxation
Cambridge MA MIT Press
Samuelson Paul A 1947 Foundations of economic
analysis Cambridge MA Harvard University
Press
Sen Amartya 1979 The welfare basis of real
income comparisons A survey Journal of Economic
Literature 171ndash45
Scitovsky T 1941 A note on welfare propositions
in economics Review of Economic Studies 977ndash88
Squire Lyn and Herman G van der Tak 1975
Economic analysis of projects Baltimore Johns
Hopkins University Press
Viscusi W Kip 2010 The heterogeneity of the
value of statistical life Introduction and overview
Journal of Risk and Uncertainty 401ndash13
Weisbrod Burton A 1968 Income redistribution
effects and benefit-cost analysis In Problems in
public expenditure analysis ed Samuel B Chase
177ndash209 Washington DC Brookings Institution
Wiener Jonathan B 2006 Better regulation
in Europe Current Legal Problems 59447ndash
518
284 M D Adler
Weymark John A 2016 Social welfare functions
In The Oxford handbook of well-being and public
policy eds Matthew D Adler and Marc
Fleurbaey 126ndash159 New York Oxford University
Press
Xu Jiaquan Sherry L Murphy Kenneth D
Kochanek and Brigham A Bastian 2016 Deaths
Final data for 2013 National Vital Statistics
Reports (vol 64 no 2 February 16 2016)
httpwwwcdcgovnchsdatanvsrnvsr64nvsr64_
02pdf
Yitzhaki Shlomo 2003 Cost-benefit analysis and
the distributional consequences of government
projects National Tax Journal 56319ndash336
BenefitndashCost Analysis and Distributional Weights 285
KaldorndashHicks criterion has the advantage of avoiding interpersonal comparability but has
various flaws described in a literature beginning with Scitovsky (1941 see also Gorman
1955 Chipman and Moore 1978 Sen 1979 Boadway and Bruce 1984 Boadway 2016)3
The article is not a comprehensive survey of the literature on distributional weights Rather it
aims to explain the key ideas I first describe the SWF concept with a particular focus on two
specific SWFs the utilitarian and isoelasticAtkinson SWFs The article then discusses the
functional form of weights matching these two SWFs Next it provides a concrete example
involving risk-reduction policies and the ldquovalue of statistical liferdquo
The article concludes by considering two objections to weights One concerns the possibility
of interpersonal comparisons given heterogeneous preferences The second is that distribu-
tional considerations are better handled via the combination of the tax system and unweighted
BCA
The discussion aims to be accessible The fundamentals of distributional weighting are
illustrated with a simple one-period model Space constraints preclude a treatment of certain
additional issues that arise in the intertemporal context in particular the relation between
distributional weights and discounting Key mathematical formulas are provided in a
Technical Appendix A more rigorous mathematical analysis of many of the topics discussed
in the main text is provided in the online supplementary materials The reader should consult
these materials along with cited references as backup for the discussion
Social Welfare Functions An Overview
The concept of the SWF originated with work by Bergson and Samuelson It was reenergized by
Sen in response to Arrowrsquos impossibility theorem and was the basis for Mirrleesrsquo groundbreak-
ing scholarship on optimal tax theory It now permeates many subdisciplines within economics
(although less so governmental practice)4
Key Elements of the SWF Framework
The SWF framework has two key elements an interpersonally comparable utility function
which transforms any given outcome (a possible consequence of policy choice) into a list or
ldquovectorrdquo of utility numbers one for each person in the population and some rule for ranking
these vectors
To illustrate imagine that there are three people in the population and two outcomes are
being compared Jim has a particular bundle of attributes in outcome x and a different bundle
in outcome y The same is true of Sue Laura has the same attributes in both outcomes and thus
is unaffected by the choice between them (her well-being does not change) ldquoAttributesrdquo here
means the characteristics that determine an individualrsquos well-being such as income health
leisure the quality of the environment and so forth5
3The debate about the KaldorndashHicks criterion is well known and will not be recapitulated here4See Adler (2012 pp 79-88) for a summary of scholarly development of the SWF concept5It is of course infeasible for a decision maker and the policy analyst advising her to consider how policies affectthe totality of individualsrsquo attributes Rather policy analysis will focus on a subset of attributes for exampleincome and leisure income health and leisure etc
BenefitndashCost Analysis and Distributional Weights 265
Our utility function assigns Jimrsquos bundles of attributes in x and y the utility values 10 and 11
respectively it assigns Suersquos bundles the values 30 and 25 respectively and it assigns 40 to
Laurarsquos bundle Thus outcome x is mapped onto the utility vector (10 30 40) and y is mapped
onto the vector (11 25 40)mdashwith the first entry the utility number for Jim the second for Sue
and the third for Laura (see table 1)
There are various possible rules for comparing utility vectors (Bossert and Weymark 2004
Adler 2012 chap 5 Weymark 2016) One such rule is the leximin rule it compares the utility
levels of the worst-off individuals if those are equal then the second-worst-off and so forth
Leximin here prefers y since Jim (the worst off) has utility 11 instead of 10
A different rule is the utilitarian rule which sums utilities Utilitarianism prefers x since the
sum of utilities is 80 rather than 76 Although utilitarianism is sensitive to the distribution of
income (given the declining marginal utility of income) utilitarianism does not take account of
the distribution of utility itself One outcome is ranked higher than a second as long as the sum
total of utility gains for those better off in the first outcome exceeds the sum total of utility losses
for those worse offmdashregardless of the comparative utility levels of the two groups
Leximin is sensitive to the distribution of utility In the case at hand even though Suersquos loss
from y is greater than Jimrsquos gain leximin prefers y However leximin is absolutist in the sense
that it is willing to incur arbitrarily large utility losses for better-off individuals in order to realize
a utility gain (however small) for an individual who is worse off and would remain so after the
gain
The isoelasticAtkinson SWF lies in between leximin and utilitarianism This SWF is para-
meterized by an inequality aversion parameter g which can take any positive value With g set
to zero the isoelastic formula becomes utilitarianism As g increases the isoelastic SWF gives
increasing priority to utility changes affecting worse-off individuals (those at lower utility
levels) In the example in table 1 if g is less than or equal to approximately 16 the isoelastic
SWF prefers outcome x to y Sue stands to lose more utility moving to y (5 units) than Jim
stands to gain (1 unit) and with a low value of g the isoelastic SWF assigns a greater social value
to her loss than to Jimrsquos gain even though Jim is worse off than Sue in both outcomes With ggreater than 16 the isoelastic SWF prefers y to x The priority given to utility changes affecting
those who are worse off is now large enough that moving Jim from 10 to 11 is seen as more
socially valuable than avoiding Suersquos move from 30 to 25
The utilitarian and isoelastic SWFs are both popular in the SWF literature and with good
reason Both satisfy the Pareto principle if at least one personrsquos utility increases and no one
elsersquos decreases the value of the SWF increases These SWFs also satisfy an axiom of anonymity
impartiality meaning indifference between any given utility vector and all rearrangements of its
Table 1 Outcomes as utility vectors
Outcomes
x y
Jim 10 11
Sue 30 25
Laura 40 40
266 M D Adler
component utility numbers Anonymousimpartial SWFs focus only on the pattern of well-
being and not the identities of the people who end up at particular well-being levels
Moreover the utilitarian and isoelastic SWFs are separablemdashmeaning that the ranking of
outcomes is not influenced by the utility levels of unaffected people In the above example
Laura is unaffected She happens to be at level 40 in both outcomes but note that the utilitarian
SWF would prefer x to y in any case where Jimrsquos and Suersquos utilities are as in table 1 and Laura has
the same utility level in the two outcomes regardless of what that level is Similarly the isoelastic
SWF with g less than or equal to 16 would prefer x to y regardless of Laurarsquos level and the
isoelastic SWF with g greater than 16 would prefer y to x regardless of Laurarsquos level Separability
is a big practical advantage in policy analysismdashenabling the analyst to focus her efforts on
determining the utilities of those whose well-being would be changed by a policy and not also
to worry about how the policy would alter their position relative to the potentially vast number
of unaffected
The leximin SWF is also Paretian anonymous and separable and is popular among some
SWF theorists But it cannot be represented by a mathematical formula which creates diffi-
culties in mimicking this SWF with distributional weights Moreover the leximin SWF can be
approximated by the isoelastic SWF with a large value of g
Interpersonal Comparisons of Well-Being
In order to achieve a stable ranking of outcomes all SWFs require some degree of interpersonal
comparability of well-being If we start with a particular rule for ranking utility vectors and then
transform the utility vectors associated with outcomes so that intrapersonal comparisons of
utility levels differences and ratios are preserved but interpersonal comparisons are not the
ranking of outcomes may change as well6 (Bossert and Weymark 2004 Weymark 2016)
More specifically the utilitarian SWF requires interpersonal comparability of well-being
differences Consider table 2 which shows possible renumberings of Jim and Suersquos utility In
the first renumbering we rescale Jimrsquos utility by a Jim-specific ratio transformation and we
rescale Suersquos by a Sue-specific ratio transformation In the second renumbering we rescale Jimrsquos
and Suersquos utility by a common linear transformation In the third renumbering we rescale Jimrsquos
and Suersquos utility by a common ratio transformation
With the original scheme of utility assignments Suersquos utility difference between the outcomes
is5 and Jimrsquos is 1 The first renumbering changes the relative magnitude of these differences
the second and third renumberings do not And now observe that the first renumbering alters
the utilitarian ranking of the outcomes while the second and third renumberings do not
The isoelastic SWF is more demanding in terms of interpersonal comparability than the
utilitarian SWF While the utilitarian SWF requires interpersonal comparability of differences
the isoelastic SWF requires interpersonal comparability of levels differences and ratios Note
that the second renumbering changes the well-being ratios between Sue and Jim in the two
outcomes Given a particular value of inequality aversion g the isoelastic SWF might prefer x
to y using the original numbering but not the second renumbering (This occurs for example
with gfrac14 05) However the third renumbering preserves well-being ratios If the isoelastic SWF
6More precisely all ethically plausible SWFs require some degree of interpersonal comparability A ldquodictatorialrdquoSWF which focuses solely on the well-being of one particular individual requires nothing more than intra-personal well-being information regarding that person
BenefitndashCost Analysis and Distributional Weights 267
with a particular value of g prefers one outcome over the other using the original numbering
than it does so with the third renumbering
The Normative Basis for the SWF
We can now address two related questions First what is the normative basis for a determin-
ation that one SWF is ldquobetterrdquo than another or that the SWF framework for social decision is
ldquobetterrdquo than alternative frameworks Second what is the basis for assigning utility numbers
that are interpersonally comparable
The view adopted here is that the SWF is a template for ethicalmoral preferences (Bergson
1948 1954 Samuelson 1947 p 221 Harsanyi 1977 chap 4) The term ldquoethicalrdquo is more
common among economists ldquomoralrdquo among philosophers but the two terms are essentially
synonymsmdashdenoting a standpoint of impartiality whereby the decision maker gives equal
weight to everyonersquos interests (or at least the interests of everyone within some population)
An SWF constitutes a systematic framework for structuring ethicalmoral (henceforth
ldquomoralrdquo) preferences a framework that a decision maker who has adopted the standpoint
of impartiality might wish to use in specifying her moral tastes
Is there some deeper criterion of moral truth that establishes whether someonersquos moral
preferences are ldquocorrectrdquo That is a question of metaethics that is debated by philosophers
but is beyond the scope of welfare economics and in any event not relevant to the discussion
here Whatever the nature of ultimate moral truth a decision maker motivated by impartial
concern will need to figure out what her moral preferences are The SWF framework is a
plausible format for regimenting those preferences a format that conforms to various
axioms that seem (to those in the SWF tradition) morally very attractive and that the decision
maker may find attractive as well
While the SWF framework itself is a tool for specifying the moral preferences of some
decision maker the inputs for the framework are utility numbers measuring the well-being
of everyone within some population (relative to which the decision maker has adopted an
attitude of impartiality) Very plausibly there is a close connection between someonersquos welfare
and that individualrsquos personal that is self-interested preferences Phillip is better off in outcome
Table 2 Interpersonal comparisons and the renumbering of utility
Original Renumbering 1 Renumbering 2 Renumbering 3
x y Diff x y Diff x y Diff x y Diff
Jim 10 11 1 200 220 20 2 12 10 30 33 3
Sue 30 25 5 60 50 10 202 152 50 90 75 15
Sum 40 36 260 270 204 164 120 108
Notes In the first renumbering Jimrsquos utilities are each multiplied by a Jim-specific factor aJim equaling 20 while Suersquos are
multiplied by a Sue-specific aSue equaling 2 In the second renumbering Jimrsquos and Suersquos utilities are subject to a common
linear transformation au + b with the common scaling factor a equaling 10 and the constant b equaling 98 Finally in the
third renumbering Jimrsquos and Suersquos utilities are subject to a common ratio transformation each multiplied by the common
positive number 3 The bold columns labeled ldquoDiffrdquo show the difference between each personrsquos utility in y and x The last
row displays the sum of utilities
268 M D Adler
x than y if and only if Phillip has a personal preference for x (Adler 2012 chap 3 Fleurbaey
et al 2013)7
Moreover if members of the population have identical personal preferences interpersonal
comparisons become straightforward as we shall now see My analysis of distributional weights
will start with this simplifying assumption of identical personal preferencesmdashpostponing until
later in the article the question of how the SWF framework should handle heterogeneity of
personal preferences
BCA and Utilitarian Distributional Weights
A simple one-period model will illustrate utilitarian distributional weights In any given out-
come each individual has a bundle of attributes consisting of the following her consumption
that is the total amount of money she expends on marketed goods and services the market
prices she faces assumed to be the same for all individuals and her nonconsumption attributes
such as health leisure or environmental quality8 Each policy choice including the status quo
choice of inaction leads for sure to some outcome There are a fixed number of individuals in
the population9
BCA and Monetary Equivalents
Unweighted BCA assigns each outcome a value equaling the sum of individual monetary
equivalents relative to the status quo and ranks outcomes in the order of these values
Monetary equivalents can be defined as ldquoequivalent variationsrdquo (equilibrating changes to
status quo consumption) or ldquocompensating variationsrdquo (equilibrating consumption changes
in each outcome) (Freeman 2003 chap 3) Equivalent variations are theoretically preferable
because BCA with compensating variations can violate the Pareto principle while BCA with
equivalent variations cannot My presentation will henceforth focus on the equivalent vari-
ationmdashnow using the term ldquomonetary equivalentrdquo to mean specifically that In practice BCA
analysts often employ compensating variations which can be seen as a rough-and-ready proxy
for equivalent variations
The Utility Function
Consider now the utilitarian SWF Recall that in order to arrive at interpersonally comparable
utilities we are starting with the simplified assumption of common personal preferences
Moreover utilitarianism requires a cardinal interpersonally comparable utility function one
that contains information about utility differences
7To be clear the choice of a conception of well-being (eg the view that well-being is equivalent to thesatisfaction of personal preferences) to be measured by utility numbers is a normative choice for the decisionmakermdashno less so than the prior choice to regiment her moral preferences via the SWF format However theimplementation of the particular conception chosen may depend on empirical facts In particular what peoplersquospersonal preferences are is an empirical question8In general an individualrsquos income need not equal her consumption but in a one-period model withoutbequests they are identical and so the reader can substitute ldquoincomerdquo for ldquoconsumptionrdquo if she likes9Space constraints preclude a discussion here of the SWF approach with variable population size
BenefitndashCost Analysis and Distributional Weights 269
Given common personal preferences expected utility theory provides a straightforward path
to cardinal and interpersonally comparable utilities This theory shows that if someone has a
well-behaved ranking of lotteries over attribute bundles there will exist a so-called von
NeumannndashMorgenstern (vNM) utility function the mathematical expectation of which cor-
responds to the ranking Moreover this utility function albeit not unique is unique ldquoup to a
positive linear transformationrdquo (Kreps 1988)
In the model now being discussed assume that individuals indeed have common personal
preferences with respect to lotteries over consumptionmarket pricenonconsumption attribute
bundles and that these preferences are represented by some vNM utility function denoted as
u() Imagine that the utilitarian SWF with u() as the utility function achieves a particular
ranking of outcomes If any other vNM utility function also represents the common prefer-
ences it is straightforward to show that the utilitarian SWF with this second function will
achieve the very same ranking of outcomes because the second function must be a positive
linear transformation of u()
In short with common personal preferences and the utilitarian SWF we can simply use any
vNM function representing the common preferences as the basis for interpersonal comparisons
and the input to the SWF10
Marginal Utility and Distributional Weights
Take any vNM utility function representing the common preferences Let the weighting factor
for each individual i be her marginal utility of consumption in the status quo the change in
utility that occurs when a small amount is added to the individualrsquos status quo consumption
divided by the consumption change Denote this as MUi Assign a given outcome the sum of
monetary equivalents multiplied by these weighting factors Then if all the outcomes are suf-
ficiently small variations around the status quomdashprices individualsrsquo consumption amounts
and their nonconsumption attributes do not change very muchmdashthe ranking of outcomes by
the utilitarian SWF is well approximated by this formula
This formula is very intuitive BCA measures well-being changes in money a given change in
welfare-relevant attributes is measured as the equivalent change in the individualrsquos consump-
tion (total monetary expenditure) But equal money changes do not necessarily correspond to
equal changes in interpersonally comparable utility A small money change for a given indi-
vidual can be translated into a utility change by using the individualrsquos marginal utility of money
as an adjustment factor
How do we calculate MUi Recall that we are trying to estimate individualsrsquo marginal utilities
in the status quomdashwhere individuals have various consumption and nonconsumption attri-
butes but face a common price vector We can therefore ignore the full content of the utility
function u() and focus on estimating the utility values of consumptionndashnonconsumption
bundles at status quo prices
There are many different empirical methods for estimating these utility values Let me briefly
describe one approach Consider the ranking (by the common preferences) of lotteries over
consumption amounts given that nonconsumption attributes are fixed at one or another
specific level Each such ranking is captured by a ldquoconditionalrdquo utility function which takes
10For a defense of vNM theory as the basis for interpersonal comparisons see Adler (2016)
270 M D Adler
consumption alone as its argument The conditional utility function will be concave convex or
linear in consumption if individuals are respectively risk averse risk prone or risk neutral over
consumption lotteries holding fixed nonconsumption attributes at the designated level
Assume that we have estimated this conditional utility function for the various levels of
nonconsumption attributes that individuals experience in the status quo Assume moreover
that we have ordinary (nonlottery) willingness-to-paywillingness-to-accept data indicating
the change in consumption that suffices to compensate individuals for moving from one level of
the nonconsumption attributes to another Putting both sorts of data together we are in a
position to estimate utility as a function of both consumption and nonconsumption attributes
and thus the weighting factor MUi for each individual i
The conditional utility function depends upon the level of nonconsumption attributes This
allows for the possibility that the degree of individualsrsquo risk aversionproneness with respect to
consumption gambles depends upon the specific level of nonconsumption attributes But two
useful simplifications can now be introduced First we might assume that preferences over
consumption gambles are invariant to the level of nonconsumption attributes If so there is a
single conditional utility function and it can be shown that MUi is just equal to the slope
(derivative) of this function at irsquos status quo consumption level multiplied by a scaling factor
that inflates or deflates this value to take account of her nonconsumption attributes
A second simplification is to assume that preferences over consumption gambles holding
fixed nonconsumption attributes take the constant relative risk aversion (CRRA) form (Gollier
2001 chap 2) The CRRA form is extremely popular in the literature on preferences for
consumption (or income or wealth) gambles It allows us to capture the degree of risk aversion
or proneness with respect to consumption in a single parameter Indeed much of the existing
work on distributional weights incorporates the CRRA form11
The risk-aversion parameter of the CRRA utility function and the inequality-aversion par-
ameter g of the isoelastic SWF are conceptually quite different is a number that captures
individualsrsquo personal preferences over consumption gambles It is useful in estimating distribu-
tional weights both for the utilitarian SWF (which has no g parameter) and for the isoelastic SWF
(which does) In contrast the inequality-aversion parameter g captures the moral preferences of a
certain kind of social planner (namely one who morally prefers to give some priority to utility
changes affecting worse-off individuals rather than simply aggregating utilities in utilitarian
fashion) Appendix table 1 gives formulas for BCA with distributional weights to mimic a
utilitarian SWF both in the general case and with the two simplifications just mentioned
Weights That Depend Only on Consumption
As can be seen from Appendix table 1 the weighting factor MUi for individual i depends on
both her status quo consumption and her status quo nonconsumption attributes Much work
on distributional weights is yet more simplifiedmdashmaking someonersquos weighting factor just a
function of his consumption (or income or wealth) (see eg HM Treasury 2003)
Distributional weights of this consumption-only form can be theoretically supported in only
two special cases (1) those affected by the policy are heterogeneous with respect to status quo
consumption but relatively homogeneous with respect to status quo nonconsumption
11For estimates of see Kaplow (2005)
BenefitndashCost Analysis and Distributional Weights 271
attributes or (2) the utility function not only satisfies the invariance requirement but takes a
special additively separable form
Generalizations Uncertainty and Inframarginal Changes
The model presented here has assumed that each policy choice for certain leads to a particular
outcome More realistically each policy choice is a probability distribution over outcomes
(with these probabilities capturing the decision makerrsquos uncertainty about which outcome
will result) and the status quo itself is a probability distribution over outcomes In this case
BCA defines an individualrsquos monetary equivalent for a policy as the change to her consumption
in all status quo outcomes that makes her indifferent between the status quo and the policy The
utilitarian SWF in turn can now be approximated by a formula that smoothly generalizes the
one given above the sum of each individualrsquos monetary equivalent multiplied by a weighting
factor (denote this as EMUi) equaling her expected marginal utility of consumption given the
probability distribution over consumption and other attributes that she faces in the status quo
The use of weighted BCA to mimic a utilitarian SWF also generalizes to the case where
policies are no longer ldquosmallrdquo variations from the status quo An individualrsquos weight now is
policy specific It depends not only on her status quo attributes but also the magnitude of the
monetary equivalent corresponding to a particular policy
BCA and Isoelastic Distributional Weights
Let us continue using the simple one-period model of choice under certainty from the previous
section However we now assume that the decision maker has ldquoisoelasticrdquo moral preferences
taking the form of an isoelastic SWF
The isoelastic SWFrsquos ranking of policies that are ldquosmallrdquo deviations from the status quomdashlike
the utilitarian rankingmdashcan be approximated by the sum of individual monetary equivalents
each multiplied by a weighting factor that is just a function of the individualrsquos status quo
attributes Recall that isoelastic moral preferences give priority to well-being changes affecting
worse-off individuals Recall too that the degree of such priority is embodied in an inequality-
aversion parameter g which can take any positive value These features of the isoelastic SWF are
reflected in the corresponding distributional weights Individual irsquos isoelastic distributional
weight is her utilitarian distributional weight MUimdashher marginal utility of consumption
given her status quo attributesmdashmultiplied by an additional term MMVUi
MMVUi is the marginal moral value of utility for individual i If we increase irsquos utility by
some small delta (an increment to utility) there is a ldquomoral benefitrdquo the outcome in which that
increase occurs becomes morally better ceteris paribus This moral benefit divided by deltamdash
the moral benefit per unit of utilitymdashis MMVUi
If the utility level of individual i is larger than that of individual j MMVUi is less than
MMVUj This reflects the priority that the isoelastic SWF gives to worse-off individuals A small
increment to individual jrsquos utility yields a larger moral benefit than the very same increase in
individual irsquos utility12
12In contrast in the case of the utilitarian SWF the moral benefit per unit of utility is constant A givenwell-being increment yields the same moral improvement regardless of the utility level of the person receivingthe increment and so there is no need to multiply MUi by a MMVUi term
272 M D Adler
MMVUi is not merely decreasing with utility level its specific magnitude depends upon the
value of g Adler (2012 pp 392ndash399) describes various thought experiments that the decision
maker might undertake in choosing a value of g Appendix table 1 provides formulas for BCA
with isoelastic distributional weights
Further Differences Between Isoelastic and Utilitarian Distributional Weights
Apart from the extra MMVUIi term there are three additional respects in which isoelastic
weighting differs from utilitarian weighting First the isoelastic SWF requires interpersonal
comparability of utility ratios Even given the assumption of common personal preferences a
vNM utility function representing such preferences is only unique up to a positive linear
transformation and thus is adequate for utilitarian weights but not isoelastic weights Given
common personal preferences a utility function unique up to a positive ratio transformation
(and thus sufficient to determine both isoelastic and utilitarian weights) can be produced by
taking the vNM function and then assigning the number zero to a ldquothreshold bundlerdquo one
which individuals regard as being just at the threshold of a life worth living (eg a bundle with
very low consumption and bad health) (Adler 2012 chap 5)
A second additional difference from utilitarian weights concerns policy choice under uncer-
tainty (Fleurbaey 2010 Adler 2012 chap 7) It turns out that there are two ways to apply an
isoelastic SWF to a set of policies each of which is a probability distribution over outcomes the
ldquoex anterdquo approach and the ldquoex postrdquo approach The ex ante approach is readily operationa-
lized by taking monetary equivalents under uncertainty and by setting the weighting factor
equal to the EMUi term multiplied by an MMVEUi term (marginal moral value of expected
utility) analogous to the MMVUIi term in the certainty case The ex post approach is more
complicated to mimic with distributional weights
Finally the utilitarian SWF yields consumption-only weights even with population hetero-
geneity in nonconsumption attributes if the utility function takes a special additively separable
form That is not true for the isoelastic SWF
An Illustrative Example VSL and Weights
This section uses the value of statistical life (VSL) to illustrate distributional weighing VSL is the
marginal rate of substitution between survival probability and income This is the concept used
to monetize the benefits that accrue from reducing fatality risks VSL is central to the practice of
BCA by the Environmental Protection Agency and other US governmental agencies (Cropper
Hammitt and Robinson 2011)
I use the workhouse one-period model of VSL that is standard in the literature (Eeckhoudt
and Hammitt 2004) Each individual in the status quo earns some income and has some
probability of surviving through the end of the current period (eg the current year) and
consuming her income if she doesnrsquot survive the income is bequeathed Policies change in-
dividualsrsquo survival probabilities or incomes In other words each individual in any given out-
come has an attribute bundle consisting of an income amount plus a single binary nonincome
attribute surviving the current period or dying The status quo and policies are lotteries over
such outcomes Each individual has personal preferences over (income diesurvive) bundles
BenefitndashCost Analysis and Distributional Weights 273
represented by a vNM utility function Her VSL in the status quo reflects her status quo income
and survival probability plus these preferences
In order to enable the calculation of distributional weights I assume that individuals have
common personal preferences over (income diesurvive) bundles represented by a common
vNM function I also assume that marginal utility in the death state is zero the utility of income
conditional on the attribute ldquodierdquo is a flat line Since utility here is supposed to represent personal
benefit this assumption seems compelling13 It also means that we can calibrate the common
vNM function by knowing the ldquosubsistencerdquo level of income the level which if combined with
the attribute ldquosurviverdquo is so low that individuals are indifferent between that bundle and dying I
add the simplifying assumption that individualsrsquo preferences over consumption lotteries in the
ldquosurviverdquo state are CRRA Note finally that by determining the subsistence level of income we
have at the very same time identified a natural zero point for purposes of the isoelastic SWF
Given an individualrsquos status quo income and survival probability we can now assign her (1) a
VSL value (2) a utilitarian weight equaling her expected marginal utility of income (EMUi)
and (3) an isoelastic weight equaling EMUi multiplied by the marginal moral value of expected
utility (MMVEUi) with MMVEUi in turn a function of the coefficient of inequality aversion
(g) that the policymaker chooses For small changes in income and survival probability an
individualrsquos monetary equivalent is approximately the income change plus the product of her
VSL and the change in survival probability The utilitarian ranking of policies is in turn
approximated by the sum of monetary equivalents multiplied by the utilitarian weights and
the ex ante isoelastic ranking by the sum of monetary equivalents multiplied by the isoelastic
weights [see Adler Hammitt and Treich (2014) for a related analysis]
VSL and Distributional Weights for Two Populations
Assume thatwe areconsidering policies thatwill affect two populations a better-offgroup witha
higher income and lower status quo fatality risk and a worse-off group with a lower income and
higher status quo risk Specifically let each member of the first group have an annual income of
$100000 and face an annual all-cause fatality risk of 0005 while each member of the second
group has an annual income of $20000 and faces an annual all-cause fatality risk of 00114
Table 3 calculates VSL values for the better- and worse-off individuals (for short ldquoRichrdquo and
ldquoPoorrdquo) as well as the ratios of these values the ratios of the Poor and Rich utilitarian distri-
butional weights and the ratios of their isoelastic weightsmdashgiven different assumptions about
the coefficient of risk aversion the subsistence level and the degree of inequality aversion g
Note that especially at higher values of the Rich VSL is many multiples of the Poor VSL
Such high multiples are inconsistent with observed values of the income elasticity of VSLmdash
perhaps reflecting the limitations of the simple analytic model of VSL used here Alternatively
low observed income elasticities of VSL may reflect real-world violations of the axioms of
expected utility15
In any event what bears special note about table 3 is how weights counteract the higher VSL
values of Rich individuals For example at frac14 2 and a subsistence level of $1000 the Rich VSL
13I may have moral or altruistic reasons to care about the amount of income left to my heirs but theirconsumption after my death does not change my well-being14The annual all-cause fatality risk for the entire US population is approximately 0008 (Xu et al 2016)15On income elasticity of VSL see Kaplow (2005) Evans and Smith (2010) and Viscusi (2010)
274 M D Adler
is 259 times that of the Poor but the Poor utilitarian weight is 249 times that of the Rich16
Thus while traditional BCA would assign Rich a monetary equivalent for a given small risk
reduction that is 259 times larger than Poorrsquos monetary equivalent for the same risk reduction
utilitarian weighted BCA would assign Rich an adjusted monetary equivalent that is 259
249frac14 104 times larger than Poorrsquos
Adding isoelastic weights further counteracts the RichPoor VSL divergence Continuing
with the scenario of frac14 2 and a subsistence level of $1000 note that at a low value (05) of
inequality aversion g the PoorRich ratio of isoelastic weights is 255 Richrsquos adjusted monetary
equivalent is now even closer to Poorrsquos (the ratio is 259255 frac14 102) At larger values of g
isoelastic weights ldquoovercompensaterdquo for the difference between Rich and Poor VSL the Poor
Rich ratio of isoelastic weights exceeds the RichPoor VSL ratio
The utilitarian and isoelastic weights would also of course affect the relative weighting of
income reductions incurred by Rich or Poor If someonersquos income is reduced by amount c
traditional BCA assigns the same value (c) to that reduction regardless of the individualrsquos
attributes Weighted BCA assigns the reduction a value equaling c multiplied by the distri-
butional weight Thus the ratio between the weighted value of a reduction in Poorrsquos income and
the weighted value of the very same reduction in Richrsquos income is simply the ratio of distri-
butional weightsmdashas displayed in the fourth row of the table for the utilitarian case and in
subsequent rows for isoelastic weights
Using Traditional BCA and Weighted BCA to Evaluate Risk-Reduction Policies
Let us now consider four types of policies assuming that the two groups have the same number
of members (1) uniform risk reduction and cost incidence (the policy produces the same
Table 3 Distributional weights and VSL
jfrac14 05 jfrac14 05 jfrac141 jfrac14 1 jfrac142 jfrac14 2 jfrac143 jfrac14 3
Sub frac14
$1000
Sub frac14
$5000
Sub frac14
$1000
Sub frac14
$5000
Sub frac14
$1000
Sub frac14
$5000
Sub frac14
$1000
Sub frac14
$5000
VSLRich $180905 $156059 $462831 $301079 $9949749 $1909548 $502462312 $20050251
VSLPoor $31369 $20202 $60520 $28006 $383838 $60606 $4030303 $151515
VSLRichVSLPoor 58 77 76 108 259 315 1247 1323
U-WeightPoorU-WeightRich 22 22 5 5 249 249 1244 1244
Iso-WeightPoorIso-
WeightRich gfrac14 05
36 42 62 73 255 281 1248 1286
Iso-WeightPoorIso-
WeightRich gfrac14 1
58 78 77 108 261 317 1253 133
Iso-WeightPoorIso-
WeightRich gfrac14 2
151 271 119 235 273 403 1262 1422
Note ldquoU-Weightrdquo indicates the utilitarian distributional weight for Rich or Poor (depending on the subscript) and ldquoIso-
Weightrdquo indicates the isoelastic weight Each column corresponds to different assumptions about the coefficient of risk
aversion for the CRRA utility function and the subsistence level of income
16A subsistence level of $1000 is in the range of the ldquoextreme povertyrdquo level of $190day now used by the WorldBank (Ferreira et al 2015) Empirical evidence on is mixed a value of 2 or even substantially higher is notempirically implausible (Kaplow 2005)
BenefitndashCost Analysis and Distributional Weights 275
reduction in fatality risk for both Rich and Poor individuals specifically a 1-in-100000
reduction for each individual of the risk of dying during the current year and the dollar
costs of the policy are borne equally by the Rich and Poor groups) (2) uniform risk reduction
and redistributive incidence (both Rich and Poor individuals receive the 1-in-100000 risk
reduction but all the costs are borne by the Rich group) (3) concentrated risk reduction
and cost incidence (only Poor individuals receive the 1-in-100000 risk reduction and they
pay the costs) and (4) regressive risk transfer (Poor individuals suffer an increase in risk of 1-in-
100000 with Rich individuals receiving a risk reduction of the same amountmdashas might occur
with a decision to relocate a hazardous facility closer to where Poor rather than Rich individuals
reside)
Table 4 shows how each of these policy choices would be evaluated by traditional
BCA (summing monetary equivalents) BCA with population-average rather than
differentiated VSL values BCA with utilitarian weights and BCA with isoelastic weights
The use of BCA with population-average values lacks any firm theoretical justification but is
now standard practice in the US government (Robinson 2007) and so it is included in the
analysis
In the case of uniform risk reduction and cost incidence utilitarian BCA is only willing to
impose a relatively low per capita cost on all individuals (as compared with traditional or
population-average BCA) and isoelastic BCA a yet lower cost paying more for a 1-in-
100000 fatality risk reduction would still be net beneficial for the Rich (given their larger
VSL values) but would be too large a net welfare loss for the Poor Conversely in the case
of uniform risk reduction and redistributive incidence utilitarian BCA is willing to impose a
larger per capita cost (now borne exclusively by Rich individuals) than traditional or popula-
tion-average BCA and isoelastic BCA a yet larger cost
In the case of concentrated risk reduction and cost incidence population-average BCA
violates the Pareto principle government may end up imposing a per-capita cost on Poor
individuals much larger than they are willing to pay for a 1-in-100000 risk reduction17 Note
that traditional BCA avoids this unpleasant result but so do the weighted versions
Although the use of population-average BCA conflicts with the Pareto principle it does have
a key intuitive advantage in a case such as regressive risk transfer traditional BCA approves the
transfer while population-average BCA is neutral Interestingly utilitarian BCA also approves
the regressive transfer and isoelastic BCA will do so for a sufficiently low value of the inequality-
aversion parameter gmdashbut as g increases the isoelastic SWF ldquoswitchesrdquo and favors a progres-
sive risk transfer from Poor to Rich
Objections to Distributional Weighting
Next I examine two potential concerns about distributional weighting first that interpersonal
comparisons of well-being and thus weights are undermined by heterogeneous preferences
and second that distributional considerations are best addressed through the tax system
17This break-even cost is approximately VSLPoor times the risk reduction which in the scenario covered by thetable is $384
276 M D Adler
Heterogeneous Preferences
It is important to distinguish between the heterogeneity of moral preferences and the
heterogeneity of personal preferences
Heterogeneity of moral preferences is no threat to the view of distributional weighting
presented here Some citizens or officials will oppose BCA as a criterion for assessing govern-
mental policies while others will endorse BCA Within the latter group some will be persuaded
by the KaldorndashHicks defense of BCA while others will find the SWF framework more attractive
Table 4 The effect of distributional weights on different kinds of risk policies
Uniform risk
reduction
and cost
incidence
Uniform risk
reduction
and redis-
tributive
incidence
Concentrated
risk reduction
and cost
incidence
Regressive risk transfer
Maximum
per capita
cost imposed
uniformly on
Rich and
Poor
Maximum
per capita
cost imposed
on Rich
Maximum per
capita cost
imposed on
Poor
ldquoYesrdquo if the transfer is assigned
a positive sum of monetary
equivalents or weighted
equivalents ldquoNordquo if it is as-
signed a negative sum
ldquoNeutralrdquo if assigned a zero
sum
BCA without weights $5167 $10333 $384 Yes
VSLRichVSLPoorfrac14 259 gt 1
BCA with population
average VSL
$4233 $8467 $4233 Neutral
Cost to Poor frac14 Benefit to
Rich frac14 VSLAvg 1100000
frac14 $4233
BCA with utilitarian
weights
$754 $19497 $384 Yes
(VSLRichVSLPoor)7(U-WeightPoorU-WeightRich)
frac14 104 gt 1
BCA with isoelastic
weights gfrac14 05
$745 $19721 $384 Yes
(VSLRichVSLPoor)7 (Iso-
WeightPoorIso-WeightRich)
frac14 102 gt 1
BCA with isoelastic
weights gfrac14 1
$737 $19950 $384 No
(VSLRichVSLPoor)7 (Iso-
WeightPoorIso-WeightRich)
frac14 099 lt 1
BCA with isoelastic
weights gfrac14 2
$722 $20423 $384 No
(VSLRichVSLPoor)7 (Iso-
WeightPoorIso-WeightRich)
frac14 095 lt 1
Notes These calculations assume the scenario of frac14 2 and a subsistence level of $1000 The population-average VSL of
$4233 million is calculated by assuming that individuals are uniformly distributed from income levels of Poor frac14 $20000 in
$10000 increments to Rich frac14 $100000 and that background fatality risk decreases linearly from the Poor level of 001 to
the Rich level of 0005 To understand the regressive risk transfer column note that BCA without weights approves the
transfer if VSLRich (1100000) gt VSLPoor
(1100000) which is equivalent to VSLRichVSLPoor gt 1 Similarly BCA with
utilitarian weights approves the transfer if VSLRich U-WeightRich
(1100000) gt VSLPoor U-WeightPoor
(1100000)
which is equivalent to (VSLRichVSLPoor)7 (U-WeightPoorU-WeightRich) gt 1 This explains the formulas in the first and third
rows and a similar explanation can be provided for the other formulas
BenefitndashCost Analysis and Distributional Weights 277
Weighting is a procedure that operationalizes the moral preferences of this last group in a
systematic form
Thus critiques of distributional weights as ldquovalue ladenrdquo are inapposite Of course the
decision to use weights and the choice of SWF to be mirrored by weights are ldquovalue
ladenrdquomdashbut so is the decision to use BCA at all or to use the unweighted variant These
decisions too involve a whole series of contestable moral judgments Governmental officials
inevitably make such judgments or work for higher-ups who do
The use of distributional weights does raise questions of institutional role An unelected
bureaucrat might feel that it would be legally problematic or democratically illegitimate for her
to specify weights Who in government gets to act on contestable moral preferences is a
complicated (and itself contestable) question of law and democratic theory Suffice it to say
that the advice welfare economists and moral theorists provide about the specification of
weights is addressed to officials with the legal and democratic authority to act on such
advicemdashwhoever exactly those officials may be
Heterogeneity of personal preferences creates additional complexity in the construction of the
utility function which generates the vectors of interpersonally comparable utility numbers that
are the inputs into the SWF We are presuming throughout this article that the decision maker
whose moral preferences are represented by the SWF has adopted the following (very plausible)
conception of well-being each personrsquos well-being is determined by her personal preferences
Until this point we have further assumed that individuals in the population of concern have
identical personal preferences over attribute bundles What happens if that assumption is relaxed
If so the utility function must assume a more complicated form than was used earlier It
must now take into account both the individualrsquos attributes and her preference structure with
respect to attribute bundles If two individuals in some outcome have the same attributes but
different personal preferences this more complicated utility function may assign them different
utility numbers
How to construct an interpersonally comparable utility function that makes an individualrsquos
utility a function of both her attributes and her preferences is a topic of ongoing research One
possibility deploys the concept of equivalent income (Fleurbaey 2016 Fleurbaey and Rafeh
2016) Each personrsquos income is adjusted to take account of her nonincome attributes
(health leisure etc) and her preferences This adjusted (ldquoequivalentrdquo) income is then used
as the measure of her well-being
A different possibility is suggested by John Harsanyirsquos concept of ldquoextended preferencesrdquo
which I have further developed in recent work (Harsanyi 1977 Adler 2016) In effect the utility
function is constructed by taking vNM functions representing the different possible preferences
over bundles in the population and choosing scaling factors for each one
However we construct a utility function that allows for heterogeneous personal prefer-
encesmdashwhether by using equivalent incomes extended preferences or in some other
mannermdashwe can generate a corresponding scheme of distributional weights
The Tax System
Are distributional considerations better handled through a combination of the tax system and
unweighted BCA as opposed to BCA with distributional weights I examine two arguments for
this position
278 M D Adler
If taxes and transfers are optimal distributional weights are uniform
Assume that the decision maker with legal authority over some nontax body has moral pref-
erences reflected in a utilitarian or isoelastic SWF and that the legislature (which controls the tax
system) has the very same moral preferences Moreover the tax system is a ldquolump sumrdquo system
meaning taxation has zero administrative cost and no adverse incentive effects (eg with
respect to individual labor supply)
Under these assumptions utilitarian or isoelastic distributional weights will be identical for
all individuals In the case where the legislature and decision maker share utilitarian moral
preferences the legislature will have enacted taxes and transfers that equalize individualsrsquo MUi
values And in the case where they have isoelastic moral preferences (with the same value of g)
the legislature will have enacted taxes and transfers that equalize individualsrsquo MUi MMVUi
values (Dreze and Stern 1987 pp 935ndash937 Salanie 2003 pp 79ndash83) If so the decision costs of
calculating weights are unnecessary since BCA with identical weights is equivalent to BCA
without weights
However the assumptions can readily fail First the decision maker may have different moral
preferences from the legislature For example a President elected by one political party may
have more strongly egalitarian preferences than the competing party that controls the legisla-
ture If so and even if the tax system is a ldquolump sumrdquo system the status quo distribution of
income could well be such that distributional weights according to the SWF that the President
endorses are unequal Thus the President (given his moral preferences) would have good moral
reason to direct nontax bodies within his control to use BCA with distributional weights and he
might well also believe that doing so is democratically and legally legitimate
Indeed preference heterogeneity on the part of government officials is reflected in the
institutional history of BCA in the United States Since 1981 a presidential order has directed
Executive Branch agencies to use BCA as a general tool for evaluating regulation but propon-
ents of BCA have never succeeded in persuading Congress to embody this directive in a statute
(Wiener 2006 pp 461ndash466) Thus it is hardly science fiction to suppose that a President might
prefer to move BCA now in place in a more egalitarian direction but be unable to secure tax
code changes reflecting this preference
Second even if the legislature and decision maker share a moral commitment to a utilitarian
SWF or to an isoelastic SWF with a particular value of g the absence of a lump-sum tax and
transfer system may mean that distributional weights in the status quo are not equal by the
lights of the shared SWF The most systematic scholarly thinking about non-lump-sum tax-
ation has occurred in the field of optimal tax theory (see eg Salanie 2003 Kaplow 2008) It is
not generally true in this context that the optimal taxes (in light of a given SWF) will yield a
pattern of income and nonincome attributes such that distributional weights (in light of that
same SWF) are equal (Layard 1980 Fleurbaey et al 2013) The optimal-tax setup typically
ignores administrative costs adding these to the tax system may also help to produce unequal
distributional weights at the optimum (Quiggin 1995)
Whether or not distributional weights are uniform the decision maker can produce aPareto-superior result by a combination of unweighted BCA and tax changes
A second argument against the use of distributionally weighted BCA has been developed by
Kaplow (see eg1996 2008) Consider a nontax decision maker who endorses some Paretian
BenefitndashCost Analysis and Distributional Weights 279
SWF (be it isoelastic utilitarian or any other SWF that respects the Pareto principle) Assume
that some policy P is chosen by traditional BCA without weights as opposed to an alternative
policy P Thus those who gain from P have enough to compensate those who lose Kaplow
shows how these gains can be redistributed from the winners to the losers to yield a Pareto-
superior result even with a non-lump-sum tax system18 Note now that if P together with a
change to the tax code is Pareto superior to P any Pareto-respecting SWF will favor that
package as opposed to the enactment of P
Kaplowrsquos analysis relies on a key technical assumption of labor separability This assumption
has no clear empirical basis and a different assumption is adopted by much scholarship in
environmental economics (Johansson-Stenman 2005 Fullerton 2009 p xxi) Moreover the
analysis does not consider the administrative costs of changes to the tax system ormdashonce
againmdashthe possibility that a nontax decision maker who favors some SWF may not control
the tax system Imagine that a decision maker has the power to choose between P and P If the
tax code does not change her morally preferred SWF favors P over P Although P bundled
with a change to the tax code is Pareto superior to P the decision maker does not believe the
legislature will make this tax change She is therefore morally justified in picking P
Given these caveats Kaplowrsquos analysis does not demonstrate that a decision maker favoring
some SWF should refrain from putting in place a matching schedule of distributional weights
Rather the analysis has a less dramaticmdashbut still importantmdashimplication It suggests that the
ldquopoliciesrdquo being considered should include not merely nontax policies but also such policies
combined with changes to the tax code where the decision maker believes these changes to be
politically feasible In some cases P will be favored by distributionally weighted BCA (mirroring the
SWF) over P but P together with a politically feasible change to the tax system will be favored by
distributionally weighted BCA over P even given the actual administrative costs of this change and
the predicted incentive effects of the change on labor supply (zero or not) If the combined option
of P plus the feasible tax change is Pareto superior to P distributionally weighted BCA will prefer
the first option to the second and it might do so even absent Pareto superiority
In short decision makers favoring an SWF mirrored by distributional weights should con-
sider an expanded menu of policy optionsmdashto include tax system changes if feasible as well as
nontax policiesmdashbut the existence of the tax system does not show that they should abandon
weighting entirely
Conclusion
This article has shown how to ldquoput structurerdquo on the problem of distributional weights and has
addressed some recurrent objections The decision to use weights to mimic a particular SWF
does require an ethicalmoral judgment but so does the decision to use unweighted BCAmdasha
procedure that is intensely controversial outside the community of economists (Ackerman and
Heinzerling 2004) The specification of utilitarian weights is quite straightforward these simply
reflect the marginal utility of consumptionincome The specification of ldquoisoelasticrdquo weights is
somewhat more complicated requiring a further moral judgment regarding the appropriate
degree of inequality aversion g and the specification of a ldquozero pointrdquo (subsistence level) so that
18Specifically he works within the setup from optimal tax theory which takes account of the labor-disincentiveeffects of an income tax
280 M D Adler
utility will be measurable on a ratio scale Still some will feel that the utilitarian SWF is
insufficiently sensitive to distribution and that this additional complexity is justified
Traditional BCA assigns a higher monetary value to risk reductions incurred by richer in-
dividuals since VSL increases with income The use of weights tends to counteract this feature
of traditional BCA without producing a conflict with the Pareto principle (a key flaw in BCA
with a population-average VSL)
The absence of a lump-sum tax system and the economic and political costs of tax reform
undercut the objection that distributional concerns should be wholly relegated to the tax code
The SWF approach and thus weights do require interpersonal well-being comparisons These
are straightforward with common personal preferences Heterogeneous personal preferences
pose additional complications but are not an insuperable obstacle to interpersonal comparisons
Technical Appendix
The main text focuses on the case in which each policy choice leads with certainty to some
outcome This Appendix provides some key formulas for that case For their derivation and
further discussion see the online supplementary materials and Adler (2012 chaps 2 3 and 5)
Utilitarian and Isoelastic SWF
Let Bxi be individual irsquos bundle of attributes in a given outcome x and u() be the utility function
mapping bundles onto utility numbers Then outcome x corresponds to the utility vector
uethBx1THORN
uethBx
NTHORNTHORN with N individuals in the population
The utilitarian and isoelastic SWFsmdashexpressed as rules for ranking outcomes in light of their
corresponding utility vectorsmdashare as follows The utilitarian SWF x at least as good as y iffPN
ifrac141 uethBxi THORN
PNifrac141 uethB
yi THORN The isoelastic SWF parameterized by ggt 0 x at least as good as y
iff eth1 gTHORN1PNifrac141 uethBx
i THORN1g eth1 gTHORN1PN
ifrac141 uethByi THORN
1g In the special case of gfrac14 1 x at least as
good as y iffPN
ifrac141 ln uethBxi THORN
PNifrac141 ln uethB
yi THORN
The Utility Function
Assume individuals have common personal preferences over bundles and bundle lotteries If
these preferences satisfy the axioms of vNM theory there exists a vNM function u() that rep-
resents these preferences and another function u() is a vNM function iff there exists agt 0 b
st u(B) frac14 au(B) + b for all B
Note that the utilitarian SWF is invariant to the substitution of u() for u()PN
ifrac141 uethBxi THORN
PN
ifrac141 uethByi THORN iff
PNifrac141u(Bx
i )PN
ifrac141u(Byi ) This is not true for the isoelastic SWF However
we can define a subfamily of the vNM functions representing the common preferences unique
up to a ratio transformation as follows Let BZero be a threshold bundle and let u() be a vNM
function st u(BZero) frac14 0 Then if u() frac14 au() a gt 0 the isoelastic SWF is invariant to the
substitution of u() for u()
BenefitndashCost Analysis and Distributional Weights 281
BCA and Equivalent Variations
Let ethcxi px ax
i THORN denote individual irsquos bundle in outcome xmdashwith cxi individual irsquos con-
sumption and axi her nonconsumption attributes respectively in x and px the price vector in
x Let ethcsi ps as
i THORN denote irsquos status quo bundle Individual irsquos equivalent variation for outcome x is
the amount cxi such that she is indifferent between the bundle ethcs
i +cxi ps as
i THORN and the bun-
dleethcxi px ax
i THORN Traditional (unweighted) BCA using equivalent variations assigns each outcome
x the numerical valuePN
ifrac141 cxi and ranks outcomes in the order of these values
BCA with Distributional Weights
We simplify notation by suppressing reference to status quo prices and abbreviating u(c ps a)
as u(c a) MUi is individual irsquos status quo marginal utility of consumption MUifrac14quethcs
ias
iTHORN
qc BCA
with utilitarian distributional weights assigns each outcome x the valuePN
ifrac141 MUi cxi
Let ha()frac14 ha(c) be a conditional utility function representing the ranking (by the common
preferences) of lotteries over consumption amounts with nonconsumption attributes fixed at
level a and prices at ps ldquoInvariancerdquo means that this ranking is independent of a and thus there
is a single conditional utility function h() st ha()frac14 h() for all a Given invariance there exists
a positive constant m(a) and a constant k(a) such that u(c a)frac14m(a) h(c) + k(a) and MUifrac14
h0ethcsi THORN methas
i THORN with h0() the first derivative In the case of invariance plus CRRA h() is a
CRRA function parameterized by risk aversion parameter Then hethcTHORN frac14 eth1 THORN1c1 (or ln
c in the special case of frac14 1) and MUi frac14 ethcsi THORNmethas
i THORN
BCA with Isoelastic Distributional Weights
MMVUi the marginal moral value of utility for individual i equals uethcsi as
i THORNg BCA with isoelastic
distributional weights assigns each outcome x the valuePN
ifrac141 MMVUiMUi cxi
A Consolidated Table
Appendix table 1 provides formulas for utilitarian and isoelastic weights in the general case
with invariance and with invariance plus CRRA
Appendix Table 1 Formulas for distributional weights
General case Invariance Invariance plus
CRRA
Utilitarian weights
Outcome x is assigned
the valuePN
ifrac141 MUi cxi
MUi frac14quethcs
i asi THORN
qcMUi frac14 h0ethcs
i THORN methasi THORN MUi frac14 ethc
si THORNmethas
i THORN
Isoelastic weights
Outcome x is assigned
the valuePNifrac141 MMVUi MUi cx
i
MUi frac14quethcs
i asi THORN
qcMUi frac14 h0ethcs
i THORN methasi THORN MUi frac14 ethc
si THORNmethas
i THORN
MMVUi frac14
uethcsi as
i THORNg
MMVUi frac14 uethcsi as
i THORNg
with uethcsi as
i THORN frac14 hethcsi THORN
methasi THORN+kethas
i THORN
MMVUi frac14 uethcsi as
i THORNg with
uethcsi as
i THORN frac14 hethcsi THORN methas
i THORN+kethasi THORN
and hethcsi THORN frac14 eth1 THORN
1ethcs
i THORN1
282 M D Adler
References
Ackerman Frank and Lisa Heinzerling 2004
Priceless On knowing the price of everything and the
value of nothing New York New Press
Adler Matthew D 2012 Well-being and fair distri-
bution Beyond cost-benefit analysis Oxford Oxford
University Press
mdashmdashmdash 2016 Extended preferences In The
Oxford handbook of well-being and public policy
eds Matthew D Adler and Marc Fleurbaey 476ndash
517 New York Oxford University Press
Adler Matthew D James Hammitt and
Nicolas Treich 2014 The social value of mor-
tality risk reduction Journal of Health Economics
3582ndash93
Bergson Abram 1948 Socialist economics In A
survey of contemporary economics vol 1 ed
Howard S Ellis 412ndash448 Homewood Richard D
Irwin
mdashmdashmdash 1954 On the concept of social welfare
Quarterly Journal of Economics 68233ndash252
Boadway Robin 2016 Cost-benefit analysis In
The Oxford handbook of well-being and public
policy eds Matthew D Adler and Marc
Fleurbaey 47ndash81 New York Oxford University
Press
Boadway Robin and Neil Bruce 1984 Welfare
economics Oxford Basil Blackwell
Bossert Walter and John A Weymark 2004
Utility in social choice In Handbook of utility
theory vol 2 eds Salvador Barbera Peter J
Hammond and Christian Seidl 1099ndash1177
Boston Kluwer Academic
Brent Robert J 1984 Use of distributional weights
in cost-benefit analysis A survey of schools Public
Finance Quarterly 12213ndash230
Chipman John S and James C Moore 1978 The
new welfare economics 1939ndash1974 International
Economic Review 19547ndash584
Cowell Frank A and Karen Gardiner 1999
Welfare weights Suntory and Toyota International
Centres for Economics and Related Disciplines
London School of Economics httpdarplseacuk
papersDBCowell-Gardiner_(OFT)pdf
Creedy John 2006 Evaluating policy Welfare
weights and value judgments Working Paper 971
Department of Economics University of
Melbourne Melbourne Australia httpideas
repecorgpmlbwpaper971html
Cropper Maureen James K Hammitt and Lisa A
Robinson 2011 Valuing mortality risk reductions
Progress and challenges Annual Review of Resource
and Environmental Economics 3313ndash336
Dasgupta Ajit K and D W Pearce 1972 Cost-
benefit analysis Theory and practice New York
Harper and Row
Dasgupta Partha Amartya Kumar Sen and
Stephen A Marglin 1972 Guidelines for project
evaluation Vienna United Nations Industrial
Development Organization
Dreze Jean 1998 Distribution matters in cost-
benefit analysis Comment on K A Brekke Journal
of Public Economics 70485ndash488
Dreze Jean and Nicholas Stern 1987 The theory
of cost-benefit analysis In Handbook of public
economics vol 2 eds Alan J Auerbach and
Martin Feldstein 909ndash989 Amsterdam North-
Holland
Eeckhoudt Louis R and James K Hammitt 2004
Does risk aversion increase the value of mortality
risk Journal of Environmental Economics and
Management 4713ndash29
Evans Mary F and V Kerry Smith 2010
Measuring how risk tradeoffs adjust with income
Journal of Risk and Uncertainty 4033ndash55
Ferreira F H G S Chen A Dabalen Y
Dikhanov N Hamadeh D Jolliffe A Narayan E
B Prydz A Revenga P Sangraula U Serajuddin
and N Yoshida 2015 A global count of the ex-
treme poor in 2012 World Bank Policy Research
Working Paper 7432 httpeconworldbankorg
Fleurbaey Marc 2010 Assessing risky social situ-
ations Journal of Political Economy 118649ndash680
mdashmdashmdash 2016 Equivalent income In The Oxford
handbook of well-being and public policy eds
Matthew D Adler and Marc Fleurbaey 453ndash475
New York Oxford University Press
Fleurbaey Marc Stephane Luchini Christophe
Muller and Erik Schokkaert 2013 Equivalent
income and fair evaluation of health care Health
Economics 22711ndash729
Fleurbaey Marc and Rossi Abi Rafeh 2016 The
use of distributional weights in benefit-cost
BenefitndashCost Analysis and Distributional Weights 283
analysis Insights from welfare economics Review
of Environmental Economics and Policy 10(2)
286ndash307
Freeman A Myrick 2003 The measurement of en-
vironmental and resource values 2nd ed
Washington DC Resources for the Future
Fullerton Don ed 2009 Distributional effects of envir-
onmental and energy policy Farnham UK Ashgate
Gollier Christian 2001 The economics of risk and
time Cambridge MA MIT Press
Gorman W M 1955 The intransitivity of certain
criteria used in welfare economics Oxford
Economic Papers 725ndash35
Harsanyi John 1977 Rational behavior and bar-
gaining equilibrium in games and social situations
Cambridge Cambridge University Press
HM Treasury 2003 The green book Appraisal and
evaluation in central government Norwich UK
The Stationery Office
Johansson-Stenman Olof 2005
Distributional weights in cost-benefit analysis
Should we forget about them Land Economics
81337ndash52
Kaplow Louis 1996 The optimal supply of public
goods and the distortionary cost of taxation
National Tax Journal 49513ndash533
Kaplow Louis 2005 The value of a statistical life
and the coefficient of relative risk aversion Journal
of Risk and Uncertainty 3123ndash34
mdashmdashmdash 2008 The theory of taxation and public eco-
nomics Princeton NJ Princeton University Press
Layard Richard 1980 On the use of distributional
weights in social cost-benefit analysis Journal of
Political Economy 881041ndash1047
Liu Liqun 2006 Combining distributional weights
and the marginal cost of funds Public Finance
Review 3460ndash78
Kreps David M 1988 Notes on the theory of choice
Boulder CO Westview Press
Little I M D and J A Mirrlees 1974 Project ap-
praisal and planning for developing countries New
York Basic Books
mdashmdashmdash 1994 The costs and benefits of analysis
Project appraisal and planning twenty years on In
Cost-benefit analysis eds Richard Layard and
Stephen Glaister 199ndash231 Cambridge Cambridge
University Press
Meade J E 1955 Trade and welfare Mathematical
supplement London Oxford University Press
Office of Management and Budget 2003 Circular
A-4 Regulatory analysis httpwwwwhitehouse
govombinforeg_default
Quiggin John 1995 The suboptimality of effi-
ciency Economics Letters 47389ndash392
Ray Anandarup 1984 Cost-benefit analysis Issues
and methodologies Baltimore Johns Hopkins
University Press
Robinson Lisa 2007 How US government
agencies value mortality risk reductions
Review of Environmental Economics and Policy
1283ndash299
Robinson Lisa A James K Hammitt and Richard
Zeckhauser 2016 Attention to distribution in US
regulatory analyses Review of Environmental
Economics and Policy 10(2)308ndash328
Salanie Bernard 2003 The economics of taxation
Cambridge MA MIT Press
Samuelson Paul A 1947 Foundations of economic
analysis Cambridge MA Harvard University
Press
Sen Amartya 1979 The welfare basis of real
income comparisons A survey Journal of Economic
Literature 171ndash45
Scitovsky T 1941 A note on welfare propositions
in economics Review of Economic Studies 977ndash88
Squire Lyn and Herman G van der Tak 1975
Economic analysis of projects Baltimore Johns
Hopkins University Press
Viscusi W Kip 2010 The heterogeneity of the
value of statistical life Introduction and overview
Journal of Risk and Uncertainty 401ndash13
Weisbrod Burton A 1968 Income redistribution
effects and benefit-cost analysis In Problems in
public expenditure analysis ed Samuel B Chase
177ndash209 Washington DC Brookings Institution
Wiener Jonathan B 2006 Better regulation
in Europe Current Legal Problems 59447ndash
518
284 M D Adler
Weymark John A 2016 Social welfare functions
In The Oxford handbook of well-being and public
policy eds Matthew D Adler and Marc
Fleurbaey 126ndash159 New York Oxford University
Press
Xu Jiaquan Sherry L Murphy Kenneth D
Kochanek and Brigham A Bastian 2016 Deaths
Final data for 2013 National Vital Statistics
Reports (vol 64 no 2 February 16 2016)
httpwwwcdcgovnchsdatanvsrnvsr64nvsr64_
02pdf
Yitzhaki Shlomo 2003 Cost-benefit analysis and
the distributional consequences of government
projects National Tax Journal 56319ndash336
BenefitndashCost Analysis and Distributional Weights 285
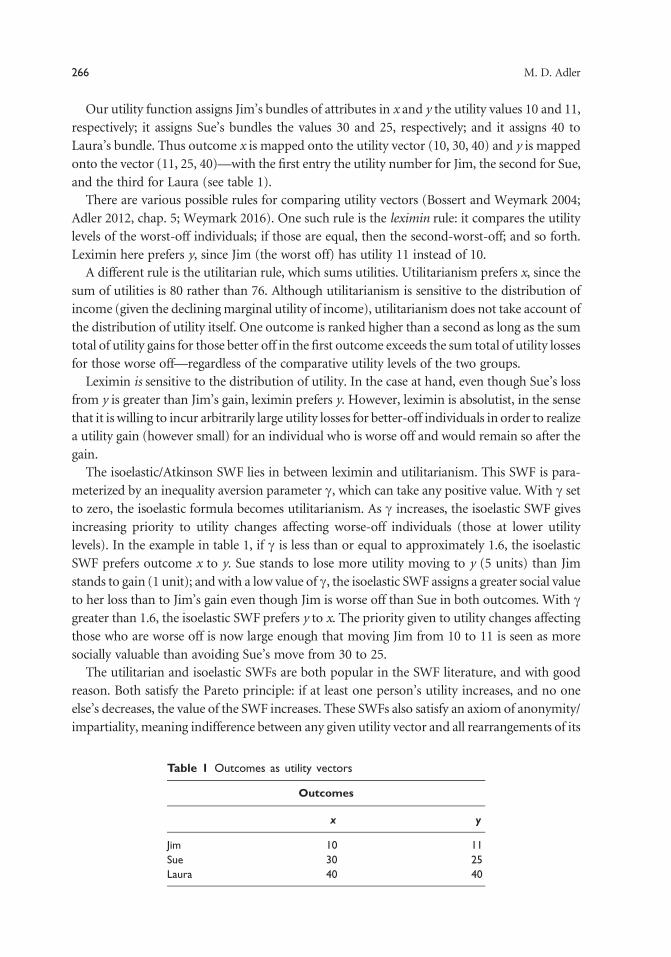
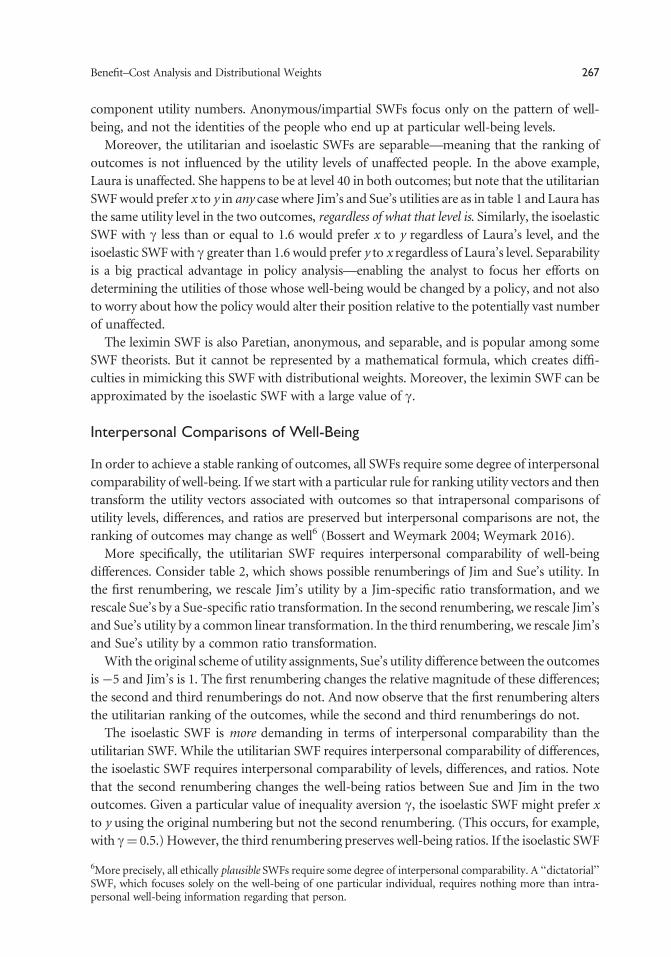
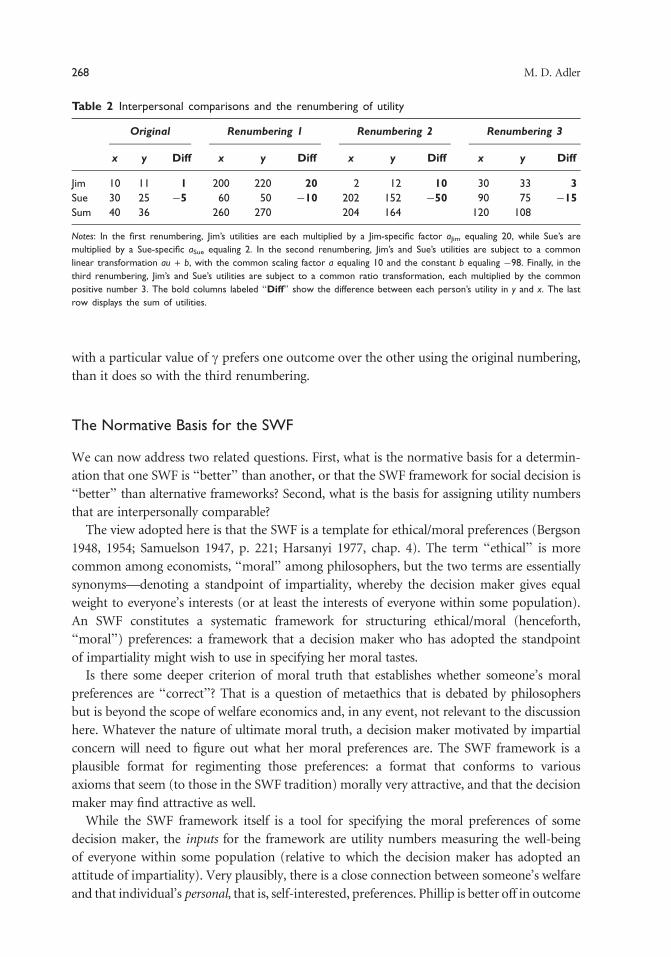
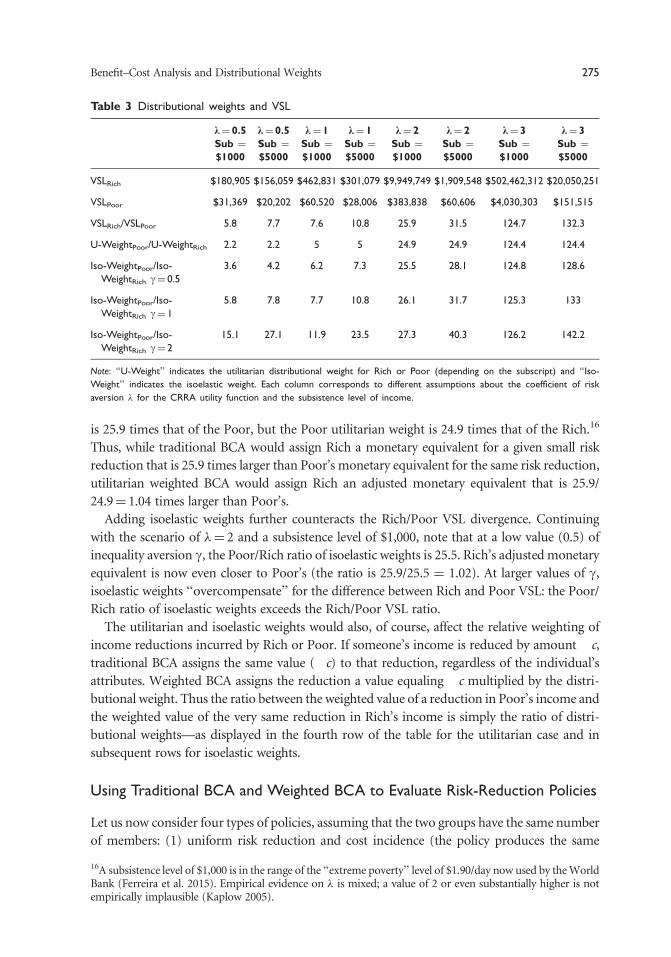
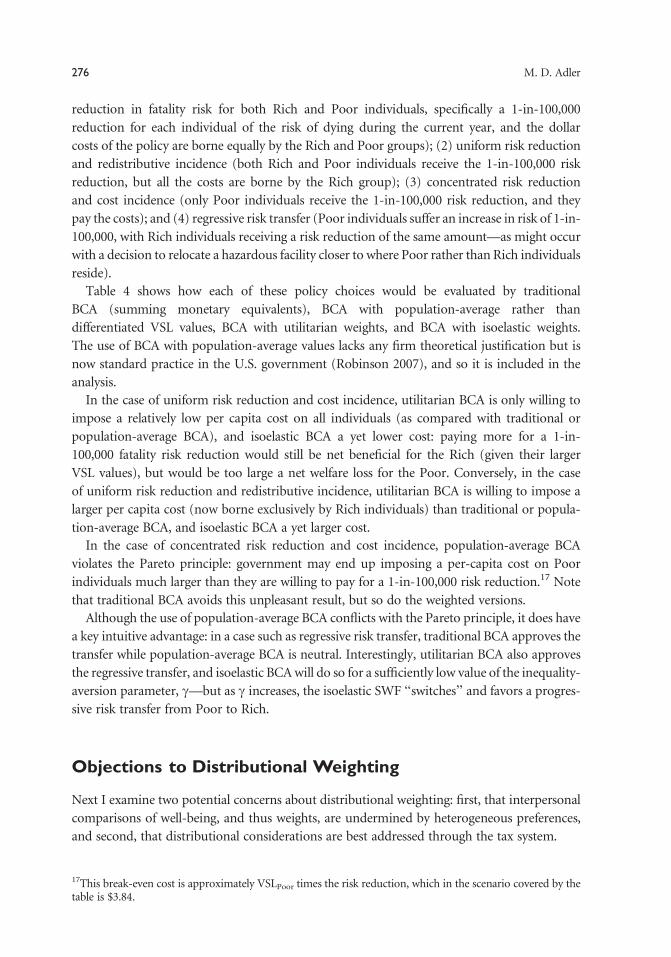
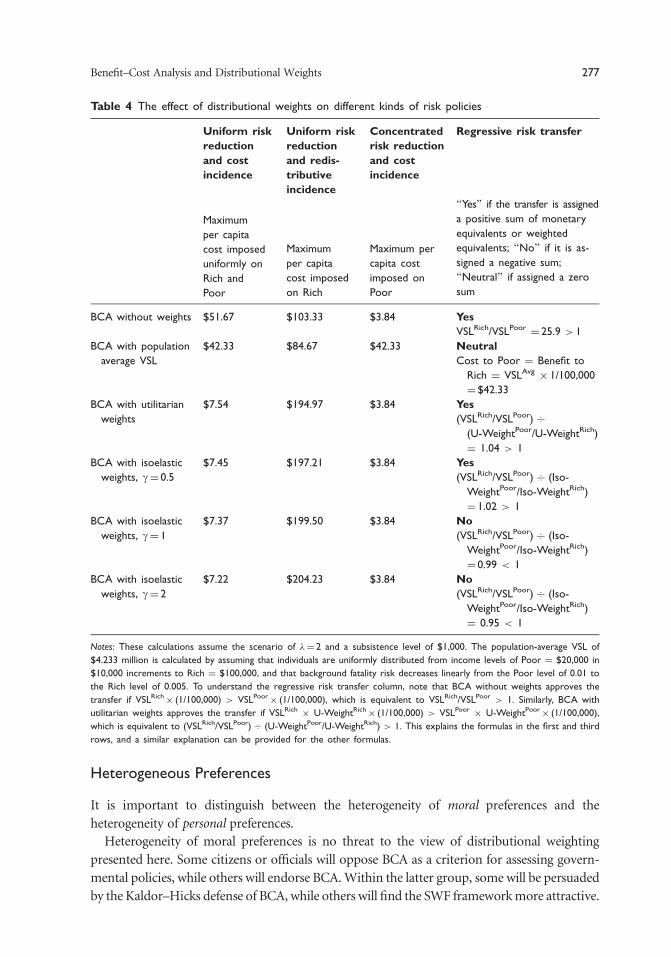
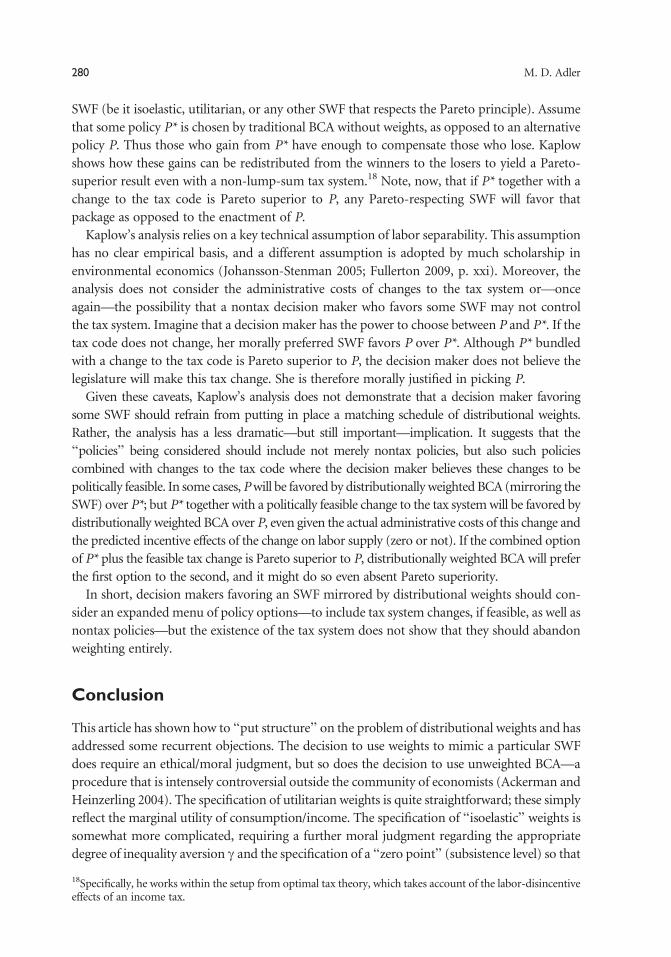
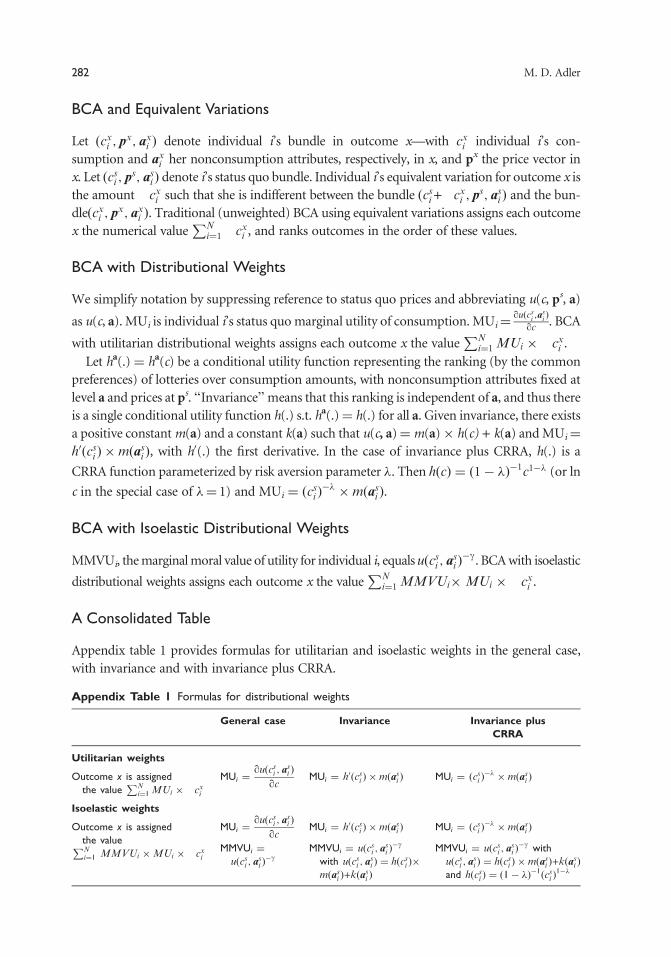