Embed Size (px)
Citation preview
Benefits of Centralized Materials
Management: A Case Study in the
Direct Selling Industry
J. Janicka
S. Strydom
Degree of Master Thesis (1yr)
Stockholm, Sweden June 2013
Benefits of Centralized Materials Management: A Case Study in
the Direct Selling Industry
Authors
Jana Janicka
(+46) 0722820539
Stephanie Strydom
(+46) 0707301560
Degree of Master Thesis (1yr): Project Management and Operational Development
Royal Institute of Technology, Stockholm, Sweden, June 2013
Summary
It has often been cited that the competitiveness of an organization’s supply chain can be
improved through better coordination of the material, information and financial flows. In
Oriflame Cosmetics, it is believed that better coordination of material flow can be
achieved through centralizing the management of raw materials and components, which
is currently being done in isolation by the various factories supplying Oriflame with
finished goods. This case study therefore investigates the benefits for Oriflame in
centralizing materials management, specifically the planning and ordering functions.
To support the research question, the present situation and the associated problems were
investigated first. This was followed by an investigation into a centralized materials
management scenario. A list of potential benefits was developed, based on data collected
through interviews with stakeholders at Oriflame, a survey and consultation of relevant
literature, company documents and databases.
The research question was further supported through quantification of two of the
potential benefits using data from a real case from one of Oriflame’s product categories –
fragrances. Monte Carlo simulations were performed to quantify the cost and inventory
savings of a centralized materials planning and ordering strategy for multi-sourced
fragrances. The results proved the possibility exists to achieve mean cost savings ranging
from 24.0 % to 20.6 %, and while optimizing costs, inventory savings were usually, but
not always achieved, with median savings of 61.0 % to 71.9 %.
It is believed that the overall findings of this case study can support management facing
the centralization decision – both in Oriflame and other fast-moving consumer goods
companies in similar positions.
i
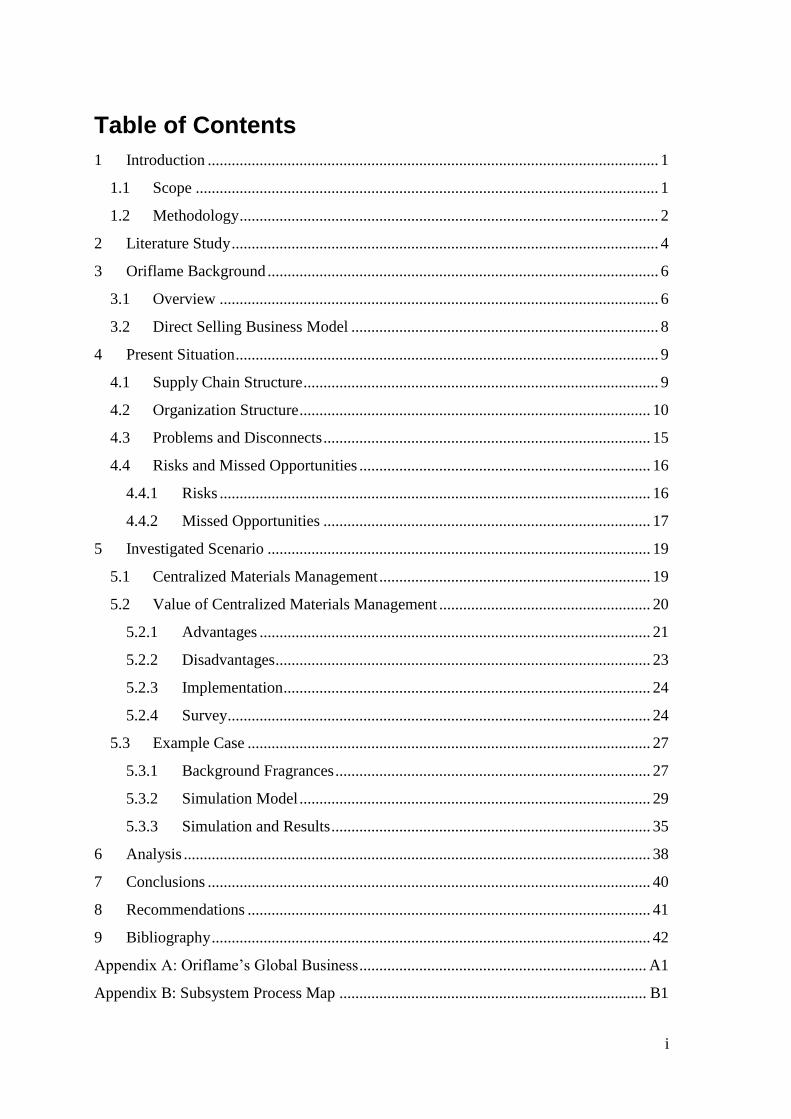
Table of Contents
1 Introduction ................................................................................................................. 1
1.1 Scope .................................................................................................................... 1
1.2 Methodology ......................................................................................................... 2
2 Literature Study ........................................................................................................... 4
3 Oriflame Background .................................................................................................. 6
3.1 Overview .............................................................................................................. 6
3.2 Direct Selling Business Model ............................................................................. 8
4 Present Situation .......................................................................................................... 9
4.1 Supply Chain Structure ......................................................................................... 9
4.2 Organization Structure ........................................................................................ 10
4.3 Problems and Disconnects .................................................................................. 15
4.4 Risks and Missed Opportunities ......................................................................... 16
4.4.1 Risks ............................................................................................................ 16
4.4.2 Missed Opportunities .................................................................................. 17
5 Investigated Scenario ................................................................................................ 19
5.1 Centralized Materials Management .................................................................... 19
5.2 Value of Centralized Materials Management ..................................................... 20
5.2.1 Advantages .................................................................................................. 21
5.2.2 Disadvantages .............................................................................................. 23
5.2.3 Implementation ............................................................................................ 24
5.2.4 Survey .......................................................................................................... 24
5.3 Example Case ..................................................................................................... 27
5.3.1 Background Fragrances ............................................................................... 27
5.3.2 Simulation Model ........................................................................................ 29
5.3.3 Simulation and Results ................................................................................ 35
6 Analysis ..................................................................................................................... 38
7 Conclusions ............................................................................................................... 40
8 Recommendations ..................................................................................................... 41
9 Bibliography .............................................................................................................. 42
Appendix A: Oriflame’s Global Business ........................................................................ A1
Appendix B: Subsystem Process Map ............................................................................. B1

ii
Appendix C: Survey ......................................................................................................... C1
Appendix D: Worked Example ........................................................................................ D1
iii
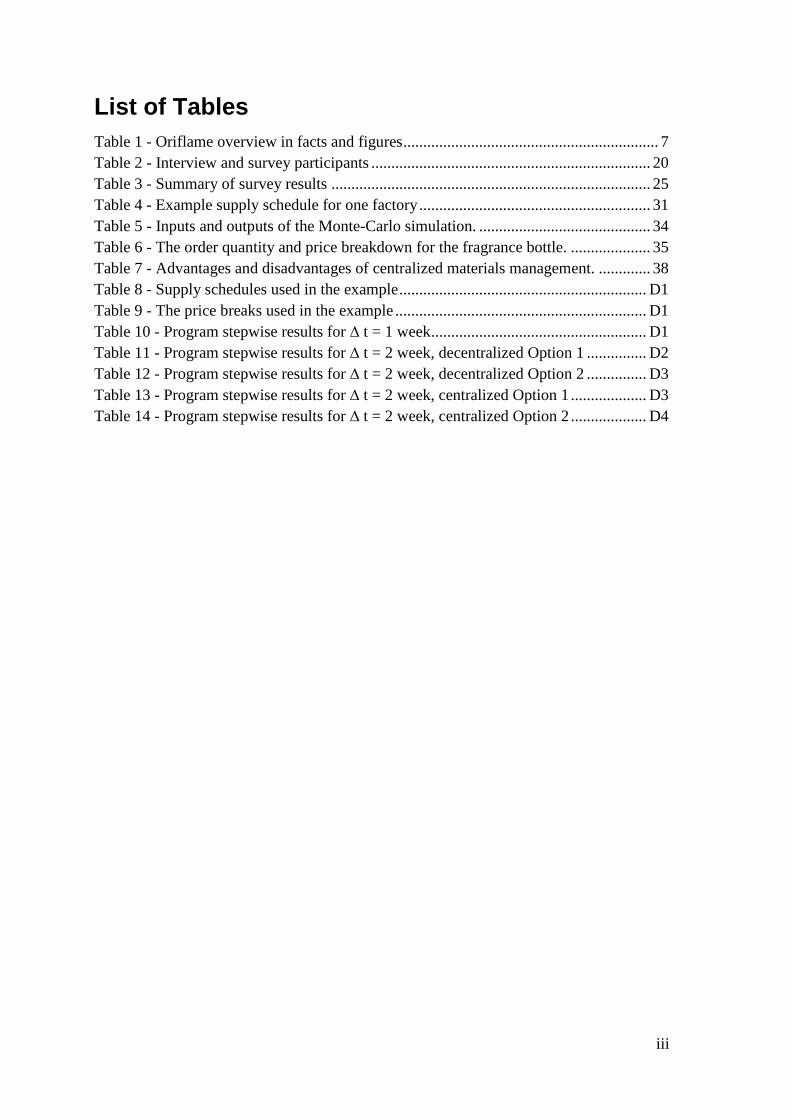
List of Tables
Table 1 - Oriflame overview in facts and figures ................................................................ 7
Table 2 - Interview and survey participants ...................................................................... 20
Table 3 - Summary of survey results ................................................................................ 25
Table 4 - Example supply schedule for one factory .......................................................... 31
Table 5 - Inputs and outputs of the Monte-Carlo simulation. ........................................... 34
Table 6 - The order quantity and price breakdown for the fragrance bottle. .................... 35
Table 7 - Advantages and disadvantages of centralized materials management. ............. 38
Table 8 - Supply schedules used in the example .............................................................. D1
Table 9 - The price breaks used in the example ............................................................... D1
Table 10 - Program stepwise results for ∆ t = 1 week ...................................................... D1
Table 11 - Program stepwise results for ∆ t = 2 week, decentralized Option 1 ............... D2
Table 12 - Program stepwise results for ∆ t = 2 week, decentralized Option 2 ............... D3
Table 13 - Program stepwise results for ∆ t = 2 week, centralized Option 1 ................... D3
Table 14 - Program stepwise results for ∆ t = 2 week, centralized Option 2 ................... D4
iv
List of Figures
Figure 1 - Research methodology. ...................................................................................... 3
Figure 2 - Oriflame business overview ............................................................................... 7
Figure 3 - Oriflame's supply chain. ..................................................................................... 9
Figure 4 - Product volumes produced by external factories. ............................................. 10
Figure 5 - Oriflame’s operations. ...................................................................................... 11
Figure 6 - Supply schedule structure ................................................................................. 12
Figure 7 - Horizontal view of the product supply subsystem. .......................................... 14
Figure 8 - Oriflame's current approach to materials management. ................................... 15
Figure 9 - Multi-sourced products volumes. ..................................................................... 18
Figure 10 - Multi-product materials. ................................................................................. 18
Figure 11 - Simplified model for centralized materials management. .............................. 19
Figure 12 - Detailed graph of survey results. .................................................................... 25
Figure 13 - Simplified model of the fragrance category's supply chain ............................ 28
Figure 14 - Simulation explanation. .................................................................................. 30
Figure 15 - Distribution of the number of orders per product received by INTRF ........... 31
Figure 16 - Distribution of the number of orders per product received by NRDME. ....... 32
Figure 17 - The distribution of the order quantities received by INTRF. ......................... 32
Figure 18 - The distribution of the order quantities received by NRDME ....................... 33
Figure 19 - An example of TBOs for NRDME. ................................................................ 33
Figure 20 - Histogram of the order quantity price breaks fragrance bottles ..................... 35
Figure 21 - Relative cost savings distribution. .................................................................. 36
Figure 22 - Relative inventory savings distribution. ......................................................... 37
v
List of Abbreviations
The abbreviations used in this report.
BOM: Bill of Materials
CIS: Commonwealth of Independent States
EMEA: Europe, Middle East and Africa
ERP: Enterprise Resource Planning
FG: Finished Goods
GSO: Global Support Office
MOQ: Minimum Order Quantity
MRP: Material Requirements Planning
MRP II: Manufacturing Resources Planning
NPD: New Product Development
SCM: Supply Chain Management
UFR: Unit Fill Rate
WFDSA: World Federation of Direct Selling Associations
vi
Glossary
The accepted definitions in this report:
Bulk: The contents of the packaging, e.g. the perfume inside the bottle.
Component: That what is used to contain and package the bulk of the product.
Materials: In this study the word materials always refers to the raw materials and
components that are converted into finished goods.
Material flow: In this study material flow is only used in the narrow sense to refer to the
flow of raw materials and components into the factories. The outward flow is generally
not referred to.
Materials management: In this study the term materials management is taken to mean
the planning and purchasing of materials.
Minimum Order Quantity (MOQ): In this study MOQ only refers to the minimum
order quantity requirement set by the supplier of goods (either materials or finished
goods). However, in Oriflame this term is used also to refer to the varying order
quantities associated with different price breaks.
Multi-product materials: Is used in this study to refer to materials that are used in more
than one product.
Multi-sourced product: In this study is used to refer to a product code that is produced
in more than one factory.
Pricing: Is used to refer to high-level price negotiations of raw material and components
on an aggregated annual volume. It is also used in the broader sense to refer to
establishing the framework agreement with materials suppliers.
Purchasing: Is used to refer to the actual act of ordering materials, it includes deciding to
act on or change the planned material flow into the factory.
Planning: Is used to refer to the planning of material flow into the factory, it includes
planning what, when and how much to order.
Product code: Each unique product has a product code, and thus the term product code
is used to refer to a unique product.
Finished goods: The final product that remains after raw materials and components have
passed through conversion processes.
Factory: The term factory is used to describe finished goods suppliers. They convert raw
materials and components into finished goods, through mixing, filling and packaging
processes. Therefore the terms filler, finished good supplier and factory is used
interchangeably. In some instances the word site is also used to refer to the factory.
vii
R: Statistical computing software.
Raw materials: Is the basic materials used in producing the bulk of the products.
Supplier: The term supplier refers to the raw materials and components suppliers. When
referring to finished goods suppliers, it is explicitly stated or clear from the context.
Supply schedule: The schedule that indicates the weeks in which finished goods should
be delivered.
Unit Fill Rate (UFR): The rate at which product orders are fulfilled.
1
1 Introduction
This study was conducted by two Master’s students at Oriflame Cosmetics at the Global
Support Office (GSO) in Stockholm under the supervision of the Strategic Planning Manager.
Oriflame Cosmetics is the 9th largest direct selling company in the world with annual sales of
around €1.5 billion (Oriflame Cosmetics, 2012). In addition to skin care, color cosmetics,
fragrances, personal and hair care and accessories, Oriflame added wellness to their product
offerings in recent years. With an independent sales force of approximately 3.4 million
consultants, Oriflame beauty products reach 60 markets around the world (Oriflame
Cosmetics, 2012).
Direct selling of beauty products is a fast paced and competitive industry. Product offerings
must be new, innovative and seasonal. Oriflame, for example, releases a new product
catalogue every 3 weeks, i.e. 17 catalogues a year, in which approximately 50% of products
are newly developed each year (Internal document, 2009). The direct selling business model
faces several challenges such as retail competition, difficult demand forecasting and frequent
product changes. Under these conditions, companies are forced to look inwards to their supply
chains and operations, and through Supply Chain Management (SCM) gain a competitive
advantage. Improving competitiveness of the supply chain can be achieved through two broad
means: better integration of the organization involved, and better coordination of materials,
information and financial flows (Lee & Ng, 1998), (Stadtler & Kilger, 2005). The possibility
exists for Oriflame to become more competitive through SCM, by improved coordination of
the planning and purchasing of raw materials and components.
For Oriflame, a step towards improved coordination involves centralizing materials
management, i.e. centralizing the planning and the decision making power of the purchasing
of raw materials and components from suppliers. The current situation in Oriflame is that
materials supplier selection and pricing negotiations are done centrally at GSO, but the
planning and purchasing of raw materials and components are done in isolation by the various
factories supplying Oriflame with finished goods. This approach leads to missed business
opportunities, and various other problems.
Many opinions exist in the organization on the potential benefits of centralization, but no
structured investigation has previously been performed. The prime goal of this case study is to
investigate what are the benefits for Oriflame in centralized materials management. The
eventual aim of this case study is to generate knowledge on the subject and supply
management with insight into the centralization of materials management decision.
1.1 Scope
This study is a case study conducted at Oriflame Cosmetics. This case study is done in the
direct selling industry; however the results may be applicable to other fast moving consumer
goods companies considering centralizing the management of materials for various factories.
2
To answer our research question: “What are the benefits for Oriflame in centralized materials
management?”, a high-level study of the present situation at Oriflame with regards to
materials management was conducted, followed by a high-level study of the advantages and
disadvantages of an alternative materials management strategy, namely centralization. Two
perceived and quantifiable benefits were further investigated through simulations, and the
simulations were limited to data from one of Oriflame’s product categories – fragrances. The
simulation results are believed to be of interest beyond this category. Whilst validating the
benefit for Oriflame in centralized materials management for multi-sourced products, it
cannot be taken for granted that the simulation results would be the same for other companies,
since it is dependent on unique business data.
1.2 Methodology
This research project was started with a review of the literature and literature findings are
summarized in the next section. The field work was carried out at Oriflame Cosmetics in
Stockholm over a 10 week period. Since the case study was only conducted at one
organization, we have attempted to get the input from a wide array of sources, through several
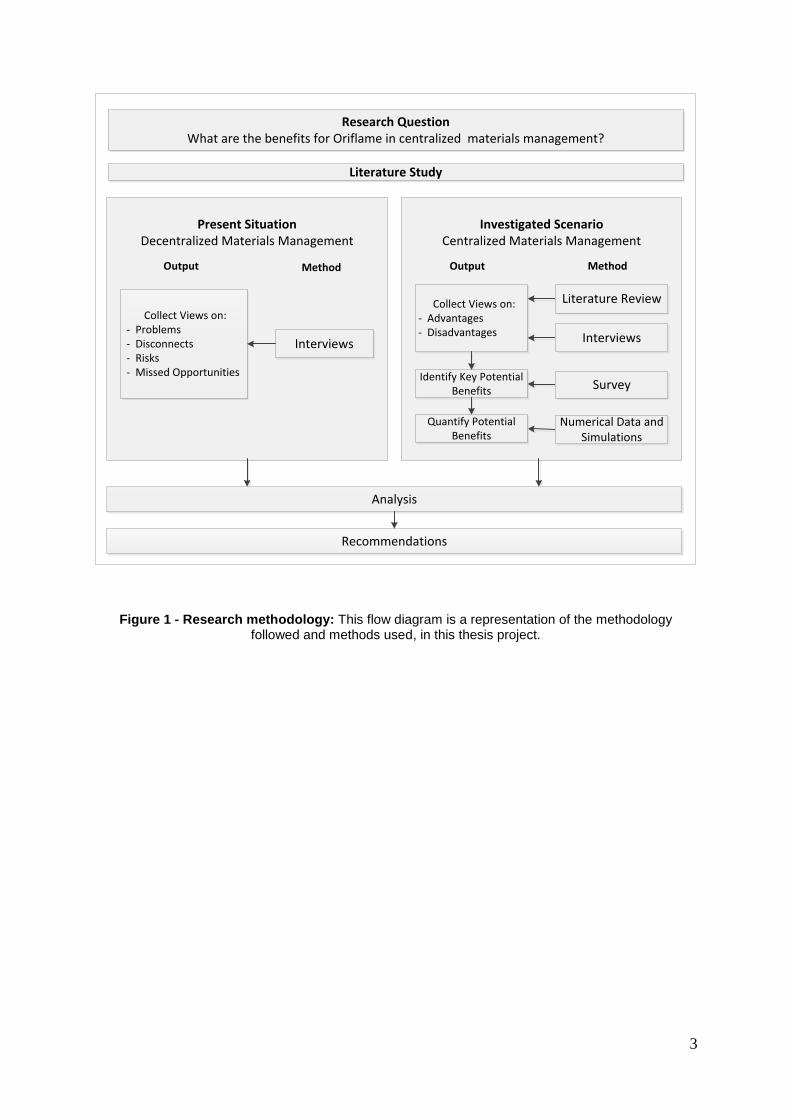
different means to ensure broad coverage of the topics under investigation. The methodology
used in this study is shown in Figure 1 and the different means of data collection are
explained in the subsequent paragraphs.
The data collection for this investigation was conducted first of all by interviewing employees
within the global operations division at Oriflame Cosmetics. We interviewed people from
several different functions and different hierarchy levels. The interviews were semi-structured
to allow for ideas and views to flow and develop. The interviews were recorded as well as
noted down, and transcripts were produced directly following the interviews. In addition to
interviewing, direct observations were made around different groups and departments, to gain
further insight into the different materials management practices that were being used.
Historic data, including company presentations and reports, were consulted to deepen our
understandings for the nature of the problem under investigation.
To substantiate our research questions and to obtain data from the multiple levels that was
required we opted for survey based research. The survey was an “exploratory” type survey,
with the main objective of helping us gain a better understanding for, and measure, the
concepts of interest (Malhotra & Grover, 1998).
Lastly, quantitative data was collected from the company’s various information systems and
used in general data analysis and in Monte Carlo simulations.
3
Present SituationDecentralized Materials Management
Investigated ScenarioCentralized Materials Management
Collect Views on: - Problems - Disconnects - Risks - Missed Opportunities
Analysis
Interviews
Recommendations
Collect Views on: - Advantages - Disadvantages
Identify Key Potential Benefits
Quantify Potential Benefits
Literature Review
Interviews
Survey
Numerical Data and Simulations
Research QuestionWhat are the benefits for Oriflame in centralized materials management?
Literature Study
Method MethodOutputOutput
Figure 1 - Research methodology: This flow diagram is a representation of the methodology followed and methods used, in this thesis project.
4
2 Literature Study
The field of Materials Management has been given considerable attention in the literature and
in practice, with the realization of the relative magnitude of the monetary investments tied up
in materials (Bhat, 2009:8), (Sadiwala & Sadiwala, 2007). The view of the Materials
Management function changed from that of being a cost center to being viewed as a profit
center, posing opportunities of reducing costs and increasing cash flow (Bhat, 2009:9).
Several textbooks have been written on the topic and a notable amount of them were
published in India (Bhat, 2009), (Sadiwala & Sadiwala, 2007), (Gopalakrishnan &
Sundaresan, 2006), (Gopalakrishnan, 2005).
When referring to the field of Materials Management, the literature generally refers to an
over-arching, centralized function responsible for all activities relating to materials. Materials
often include raw materials, components, spare parts and other items (Bhat, 2009).
Gloplakrishnan & Sundaresan (2006) describes it as follows:
“The function responsible for the coordination of planning, sourcing, purchasing,
moving, storing, preserving and controlling materials in an optimum manner so as to
provide a pre-determined service to the customers at a minimum cost.”
Materials Management has also been the topic of several research projects, such as Ondiek
(2009) that analyzed the attention and recognition that Kenyan firms are giving to Materials
Management. The research presented findings such as that Kenyan firms spend on average
56% of their annual sales turnover on materials and materials related costs.
Asaolu, et al. (2012) examined the effect of Materials Management on the profitability of
Nigerian food and beverage manufacturing firms by means of a case study in the bottling
industry. They concluded that there is a significant relationship between effiecient Materials
Management and a firm’s profitability, and that it can result in cost savings and increased
profitability.
This study differs from previous work in that it only focusses on certain aspects of Materials
Management, namely the planning and purchasing functions mentioned in Gloplakrishnan &
Sundaresan’s definition above. Further, this study is only concerned with the management of
raw materials and components used in the manufacturing of finished goods. This narrowed
definition is what is referred to when the term “materials management” is used in this paper. It
is worth noting that Materials Management in the broad sense, assumes centralized functions,
opposed to our study that is concerned with centralizing the planning and purchasing of
materials for various factories, both internal and external to the organization.
A review of the literature on the benefits of centralizing (specifically) the planning and
purchasing of materials resulted in the following findings:
The centralization of the purchasing function is a topic that has been extensively covered in
the literature. The main benefits mentioned are that it allows businesses to take advantage of
synergy opportunities between different sites of the organization (Rozemeijer, 2000). For
5
many organizations synergies exist in cost savings, both in the form of lower prices due to
economies of scale and other savings such as more efficient resource utilisation (Rozemeijer,
2000).
Munson (2007:119) presents a list of the advantages and disadvantages of centralized
purchasing compiled from both the researcher’s original ideas and concepts presented in
various other sources. The literature often cites quantity discounts as the primary advantage of
centralized purchasing (Karijalainen, 2011), (Munson & Hu, 2010).
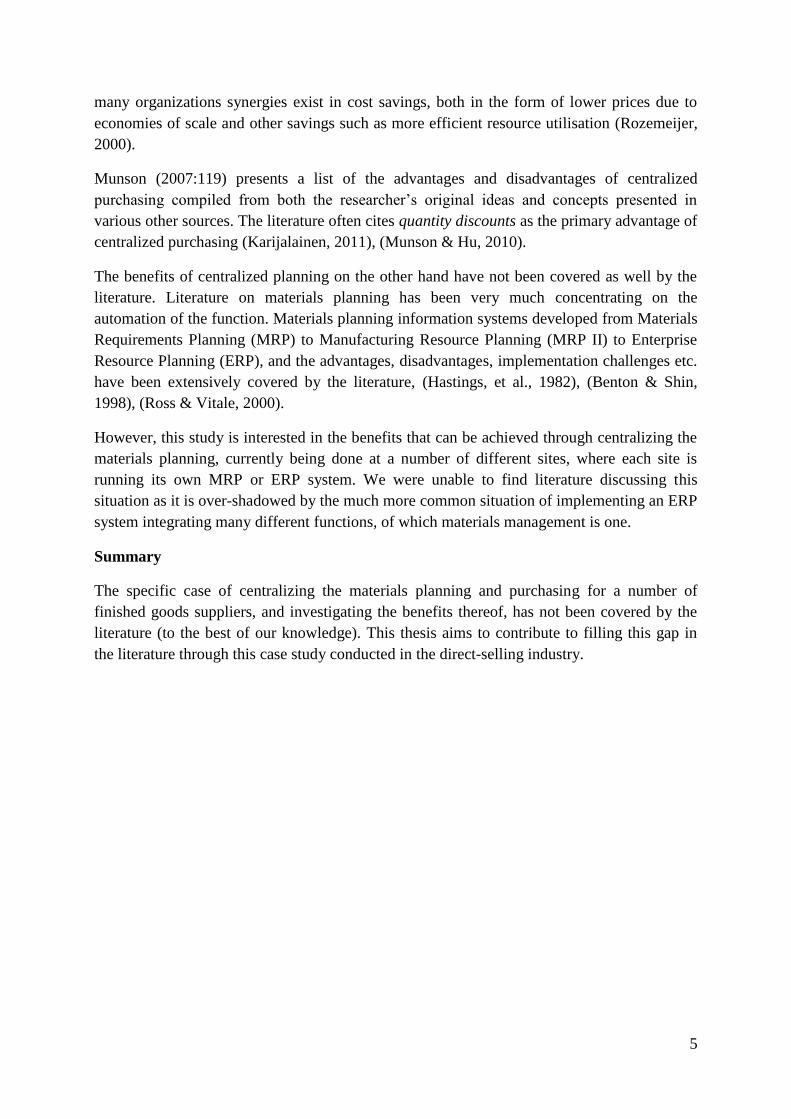
The benefits of centralized planning on the other hand have not been covered as well by the
literature. Literature on materials planning has been very much concentrating on the
automation of the function. Materials planning information systems developed from Materials
Requirements Planning (MRP) to Manufacturing Resource Planning (MRP II) to Enterprise
Resource Planning (ERP), and the advantages, disadvantages, implementation challenges etc.
have been extensively covered by the literature, (Hastings, et al., 1982), (Benton & Shin,
1998), (Ross & Vitale, 2000).
However, this study is interested in the benefits that can be achieved through centralizing the
materials planning, currently being done at a number of different sites, where each site is
running its own MRP or ERP system. We were unable to find literature discussing this
situation as it is over-shadowed by the much more common situation of implementing an ERP
system integrating many different functions, of which materials management is one.
Summary
The specific case of centralizing the materials planning and purchasing for a number of
finished goods suppliers, and investigating the benefits thereof, has not been covered by the
literature (to the best of our knowledge). This thesis aims to contribute to filling this gap in
the literature through this case study conducted in the direct-selling industry.
6
3 Oriflame Background
The aim of this section is to provide an overview of Oriflame, their global operations and the
direct selling industry.
3.1 Overview
Oriflame Cosmetics was founded in 1967 in Sweden by Jonas and Robert af Jochnick and
Bengt Hellsten, and has since grown into an international direct selling cosmetics company.
They are currently present in over 60 markets, and have approximately 3.4 million
independent consultants.
The consultants who market Oriflame’s products with the aid of frequently distributed
catalogues, are offered earning and training opportunities, and an attractive success plan,
rewarding well performing consultants. Product offerings, which draw inspiration from the
natural beauty of Sweden, include skin care, color cosmetics, fragrances, personal and hair
care, accessories and wellness.
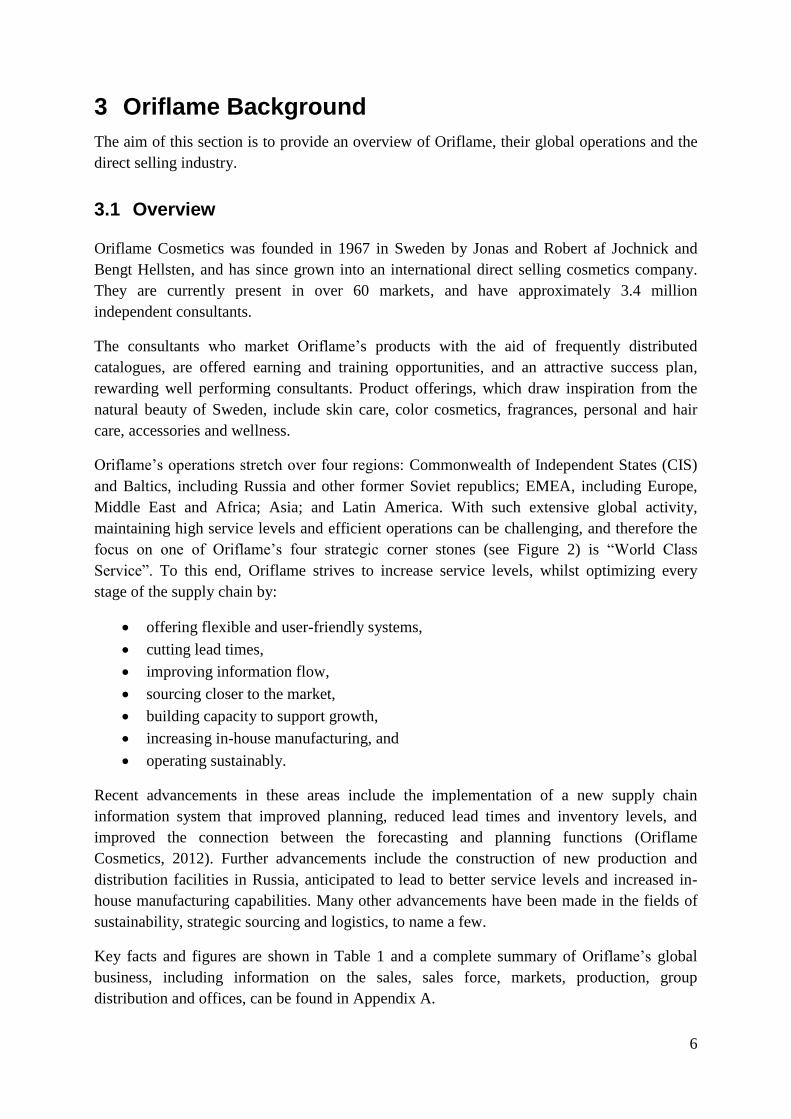
Oriflame’s operations stretch over four regions: Commonwealth of Independent States (CIS)
and Baltics, including Russia and other former Soviet republics; EMEA, including Europe,
Middle East and Africa; Asia; and Latin America. With such extensive global activity,
maintaining high service levels and efficient operations can be challenging, and therefore the
focus on one of Oriflame’s four strategic corner stones (see Figure 2) is “World Class
Service”. To this end, Oriflame strives to increase service levels, whilst optimizing every
stage of the supply chain by:
offering flexible and user-friendly systems,
cutting lead times,
improving information flow,
sourcing closer to the market,
building capacity to support growth,
increasing in-house manufacturing, and
operating sustainably.
Recent advancements in these areas include the implementation of a new supply chain
information system that improved planning, reduced lead times and inventory levels, and
improved the connection between the forecasting and planning functions (Oriflame
Cosmetics, 2012). Further advancements include the construction of new production and
distribution facilities in Russia, anticipated to lead to better service levels and increased in-
house manufacturing capabilities. Many other advancements have been made in the fields of
sustainability, strategic sourcing and logistics, to name a few.
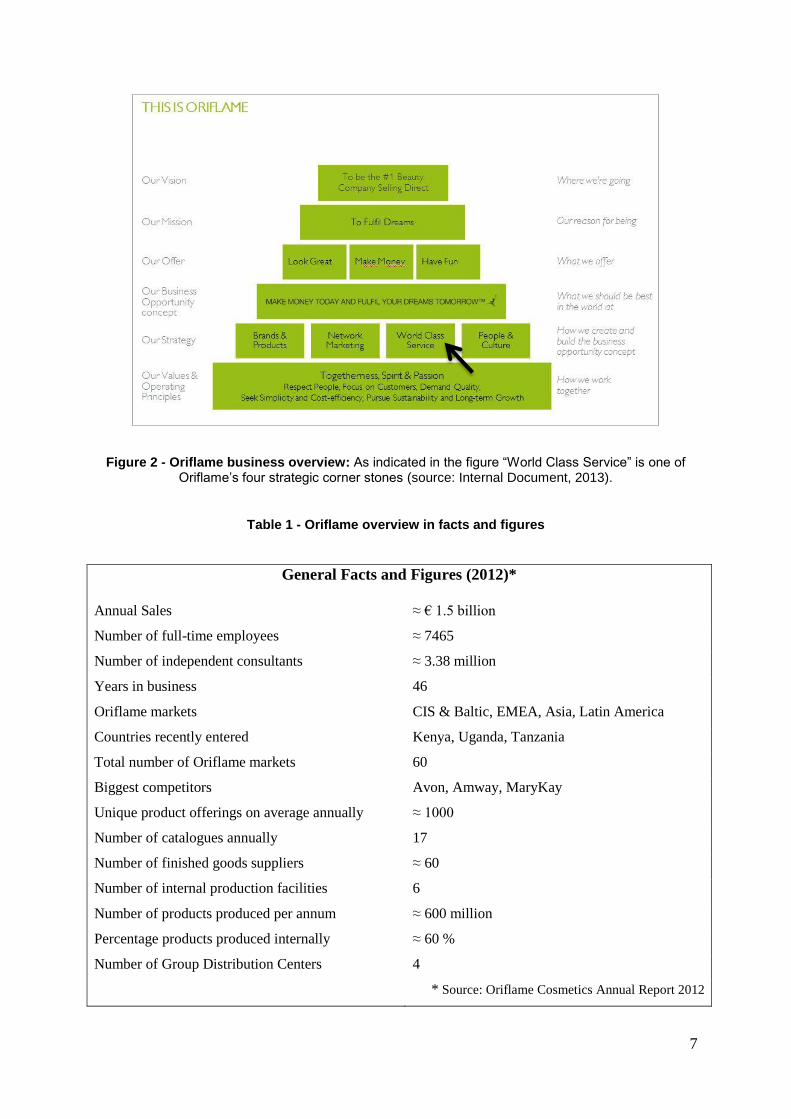
Key facts and figures are shown in Table 1 and a complete summary of Oriflame’s global
business, including information on the sales, sales force, markets, production, group
distribution and offices, can be found in Appendix A.
7
Figure 2 - Oriflame business overview: As indicated in the figure “World Class Service” is one of Oriflame’s four strategic corner stones (source: Internal Document, 2013).
Table 1 - Oriflame overview in facts and figures
General Facts and Figures (2012)*
Annual Sales ≈ € 1.5 billion
Number of full-time employees ≈ 7465
Number of independent consultants ≈ 3.38 million
Years in business 46
Oriflame markets CIS & Baltic, EMEA, Asia, Latin America
Countries recently entered Kenya, Uganda, Tanzania
Total number of Oriflame markets 60
Biggest competitors Avon, Amway, MaryKay
Unique product offerings on average annually ≈ 1000
Number of catalogues annually 17
Number of finished goods suppliers ≈ 60
Number of internal production facilities 6
Number of products produced per annum ≈ 600 million
Percentage products produced internally ≈ 60 %
Number of Group Distribution Centers 4
* Source: Oriflame Cosmetics Annual Report 2012
8
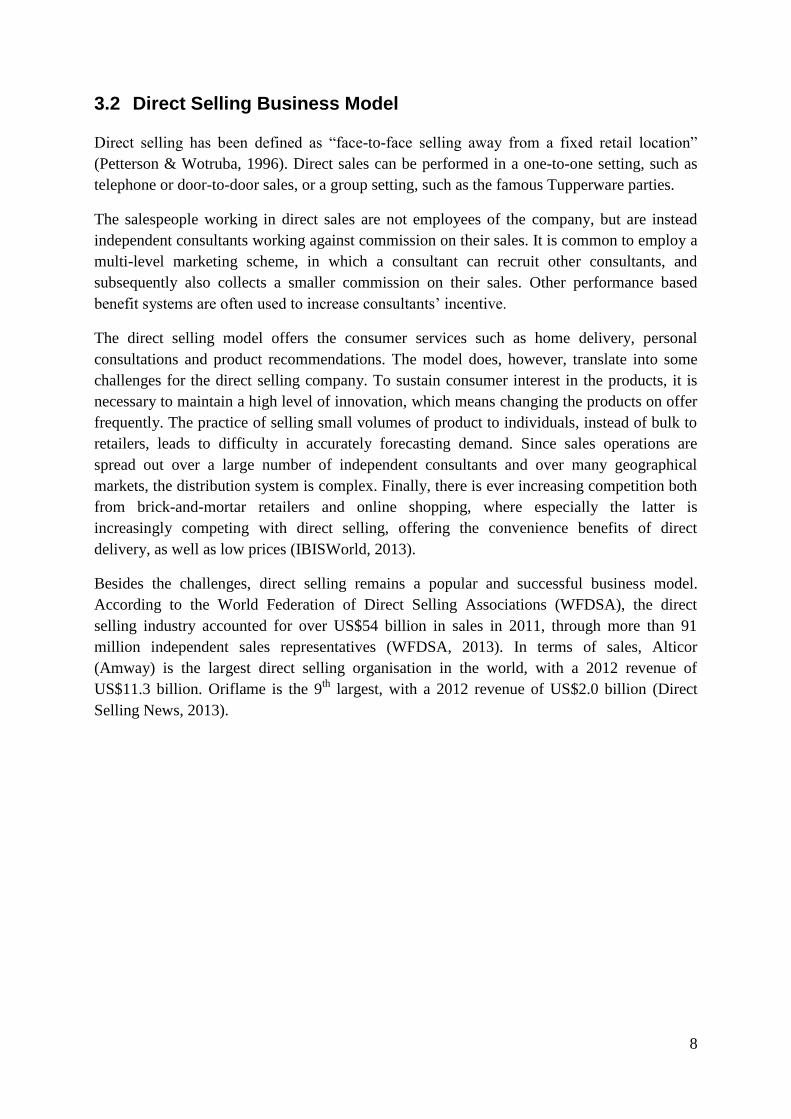
3.2 Direct Selling Business Model
Direct selling has been defined as “face-to-face selling away from a fixed retail location”
(Petterson & Wotruba, 1996). Direct sales can be performed in a one-to-one setting, such as
telephone or door-to-door sales, or a group setting, such as the famous Tupperware parties.
The salespeople working in direct sales are not employees of the company, but are instead
independent consultants working against commission on their sales. It is common to employ a
multi-level marketing scheme, in which a consultant can recruit other consultants, and
subsequently also collects a smaller commission on their sales. Other performance based
benefit systems are often used to increase consultants’ incentive.
The direct selling model offers the consumer services such as home delivery, personal
consultations and product recommendations. The model does, however, translate into some
challenges for the direct selling company. To sustain consumer interest in the products, it is
necessary to maintain a high level of innovation, which means changing the products on offer
frequently. The practice of selling small volumes of product to individuals, instead of bulk to
retailers, leads to difficulty in accurately forecasting demand. Since sales operations are
spread out over a large number of independent consultants and over many geographical
markets, the distribution system is complex. Finally, there is ever increasing competition both
from brick-and-mortar retailers and online shopping, where especially the latter is
increasingly competing with direct selling, offering the convenience benefits of direct
delivery, as well as low prices (IBISWorld, 2013).
Besides the challenges, direct selling remains a popular and successful business model.
According to the World Federation of Direct Selling Associations (WFDSA), the direct
selling industry accounted for over US$54 billion in sales in 2011, through more than 91
million independent sales representatives (WFDSA, 2013). In terms of sales, Alticor
(Amway) is the largest direct selling organisation in the world, with a 2012 revenue of
US$11.3 billion. Oriflame is the 9th
largest, with a 2012 revenue of US$2.0 billion (Direct
Selling News, 2013).
9
4 Present Situation
With the aim to investigate the benefits of centralizing the management of raw materials and
components, the current state of operations was first investigated. The supply chain and
organization structure is presented first, followed by a discussion on the problems and
disconnects associated with the present situation which was the result of several semi-
structured interviews conducted with Oriflame employees. Lastly the risks and missed
business opportunities Oriflame is facing with the current materials management strategy is
discussed in Section 4.4
4.1 Supply Chain Structure
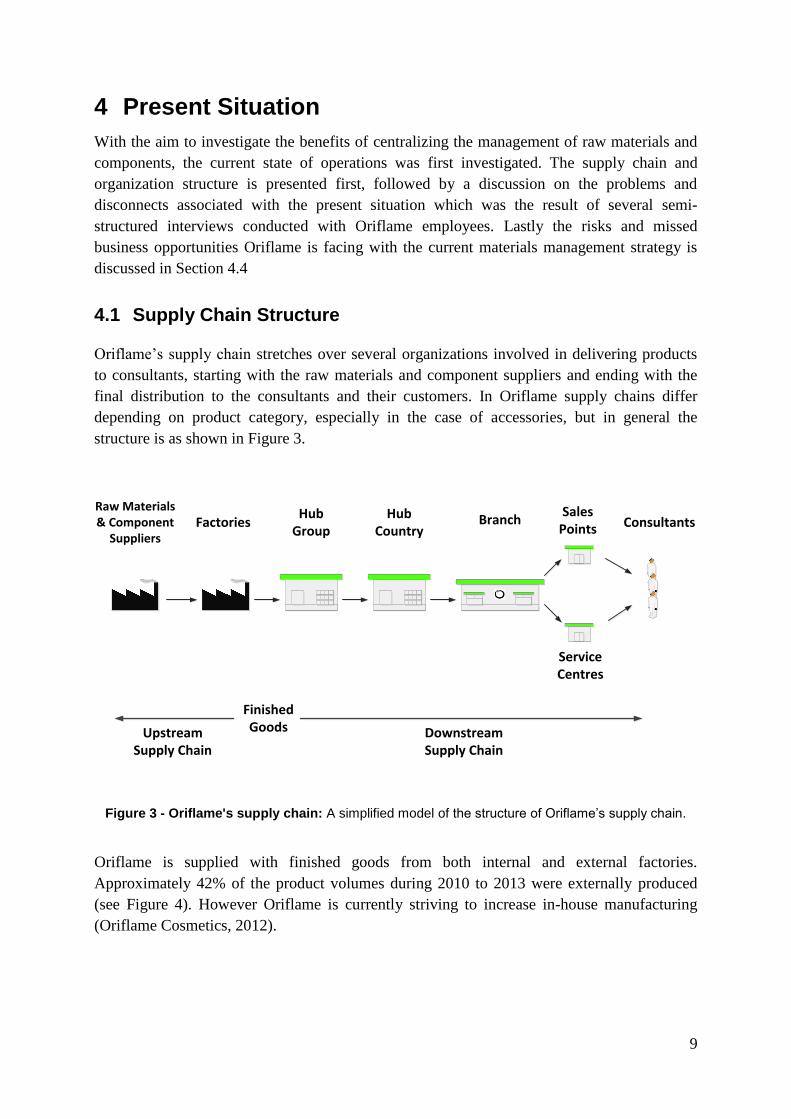
Oriflame’s supply chain stretches over several organizations involved in delivering products
to consultants, starting with the raw materials and component suppliers and ending with the
final distribution to the consultants and their customers. In Oriflame supply chains differ
depending on product category, especially in the case of accessories, but in general the
structure is as shown in Figure 3.
Raw Materials & Component
SuppliersFactories
Hub Group
Hub Country
BranchSales
Points Consultants
Service Centres
Finished GoodsUpstream
Supply ChainDownstream Supply Chain
Figure 3 - Oriflame's supply chain: A simplified model of the structure of Oriflame’s supply chain.
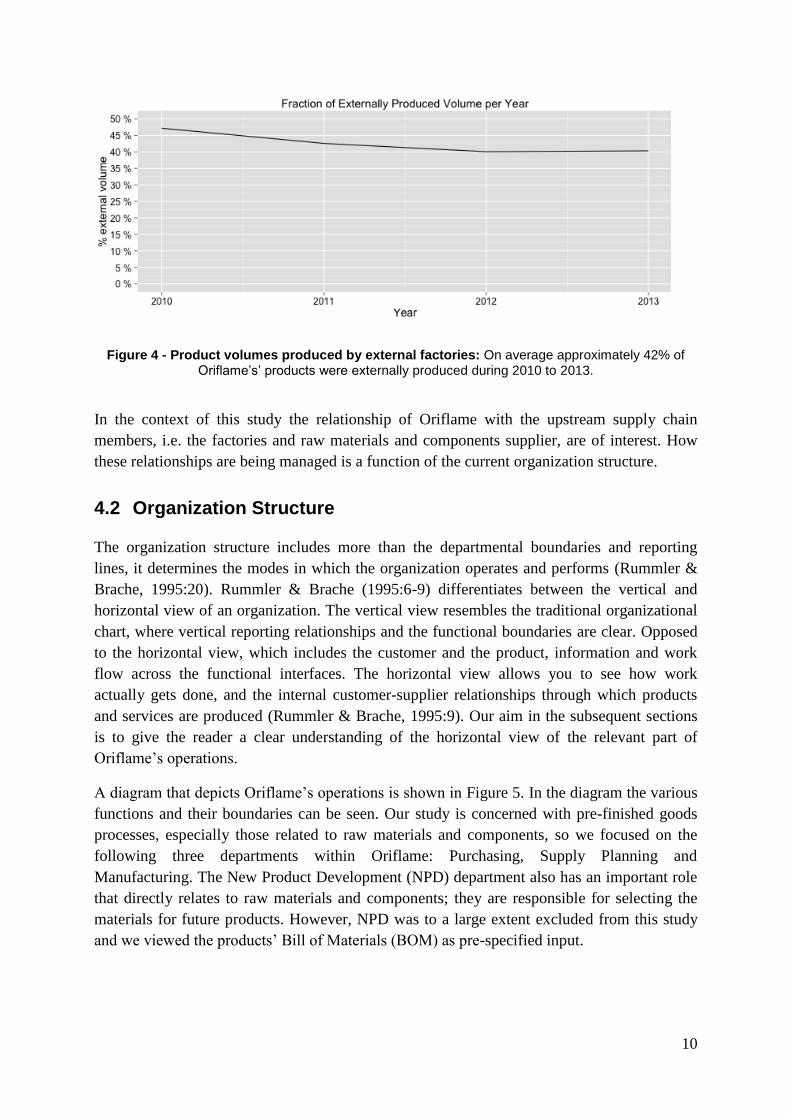
Oriflame is supplied with finished goods from both internal and external factories.
Approximately 42% of the product volumes during 2010 to 2013 were externally produced
(see Figure 4). However Oriflame is currently striving to increase in-house manufacturing
(Oriflame Cosmetics, 2012).
10
Figure 4 - Product volumes produced by external factories: On average approximately 42% of Oriflame’s’ products were externally produced during 2010 to 2013.
In the context of this study the relationship of Oriflame with the upstream supply chain
members, i.e. the factories and raw materials and components supplier, are of interest. How
these relationships are being managed is a function of the current organization structure.
4.2 Organization Structure
The organization structure includes more than the departmental boundaries and reporting
lines, it determines the modes in which the organization operates and performs (Rummler &
Brache, 1995:20). Rummler & Brache (1995:6-9) differentiates between the vertical and
horizontal view of an organization. The vertical view resembles the traditional organizational
chart, where vertical reporting relationships and the functional boundaries are clear. Opposed
to the horizontal view, which includes the customer and the product, information and work
flow across the functional interfaces. The horizontal view allows you to see how work
actually gets done, and the internal customer-supplier relationships through which products
and services are produced (Rummler & Brache, 1995:9). Our aim in the subsequent sections
is to give the reader a clear understanding of the horizontal view of the relevant part of
Oriflame’s operations.
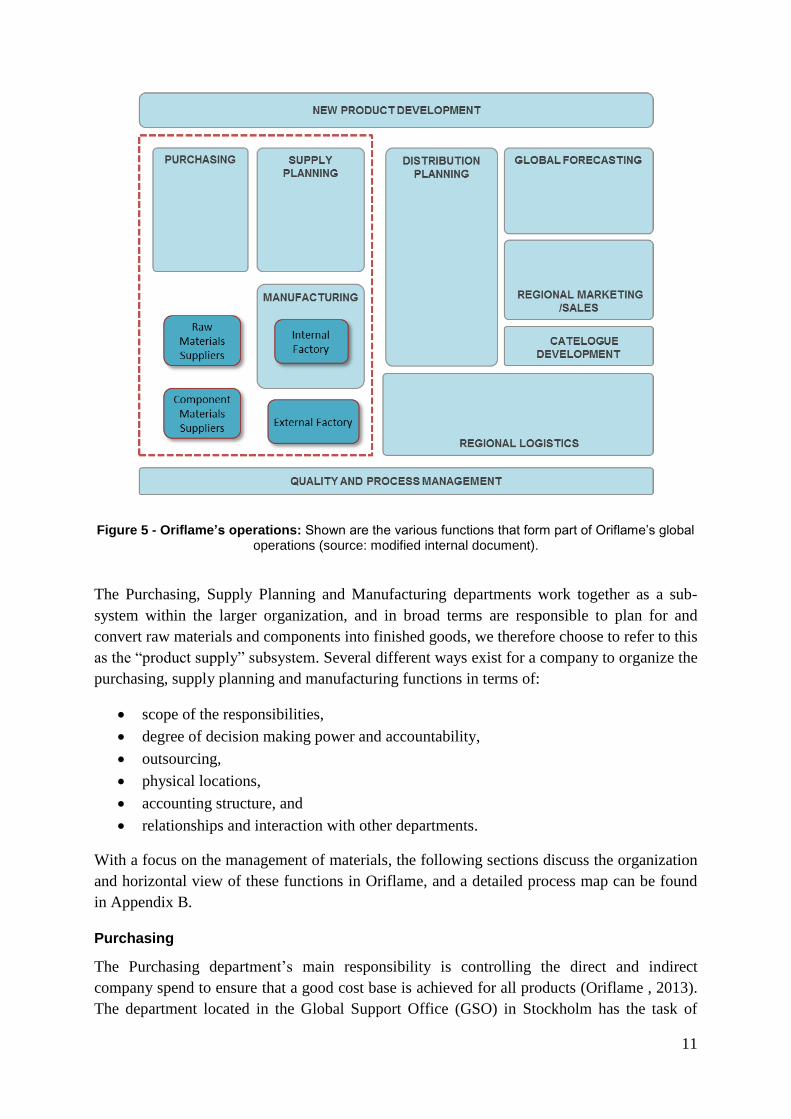
A diagram that depicts Oriflame’s operations is shown in Figure 5. In the diagram the various
functions and their boundaries can be seen. Our study is concerned with pre-finished goods
processes, especially those related to raw materials and components, so we focused on the
following three departments within Oriflame: Purchasing, Supply Planning and
Manufacturing. The New Product Development (NPD) department also has an important role
that directly relates to raw materials and components; they are responsible for selecting the
materials for future products. However, NPD was to a large extent excluded from this study
and we viewed the products’ Bill of Materials (BOM) as pre-specified input.
11
Figure 5 - Oriflame’s operations: Shown are the various functions that form part of Oriflame’s global operations (source: modified internal document).
The Purchasing, Supply Planning and Manufacturing departments work together as a sub-
system within the larger organization, and in broad terms are responsible to plan for and
convert raw materials and components into finished goods, we therefore choose to refer to this
as the “product supply” subsystem. Several different ways exist for a company to organize the
purchasing, supply planning and manufacturing functions in terms of:
scope of the responsibilities,
degree of decision making power and accountability,
outsourcing,
physical locations,
accounting structure, and
relationships and interaction with other departments.
With a focus on the management of materials, the following sections discuss the organization
and horizontal view of these functions in Oriflame, and a detailed process map can be found
in Appendix B.
Purchasing
The Purchasing department’s main responsibility is controlling the direct and indirect
company spend to ensure that a good cost base is achieved for all products (Oriflame , 2013).
The department located in the Global Support Office (GSO) in Stockholm has the task of
12
evaluating and selecting suppliers (both for finished goods and materials) and negotiating
prices and contracts.
When it comes to raw materials and components the Purchasing department has a functional
configuration described by Munson & Hu (2010) as Centralized pricing with decentralized
purchasing (Scenario 2). In this scenario, price and contract negotiations for materials are
performed at a central point, in Oriflame’s case at the GSO, but the ordering of materials are
done at each local site.
Supply Planning
Supply Planning is done centrally at the GSO. The function involves managing the flow of
finished goods to balance the hub inventories in order to meet the demand from the markets
and end customers. Maintaining high Unit Fill Rates (UFR), i.e. the rates at which product
orders are fulfilled, is a prime objective for Supply Planning.
It is Supply Planning’s task to actively manage the finished goods supply situation and any
problems that might arise. They manage the relationships with the finished goods suppliers
and serve as a point of contact with Oriflame. Supply Planning rarely deals directly with raw
materials and components suppliers, since their prime concern is the finished goods.
Supply Planning share supply schedules on a weekly basis with the factories via an online
portal, which is referred to as the Supply Chain Portal. The supply schedules show the
finished goods needs for an 8 month period. We briefly discuss the supply schedules since it
provides background knowledge for the simulations presented in Section 5.3.
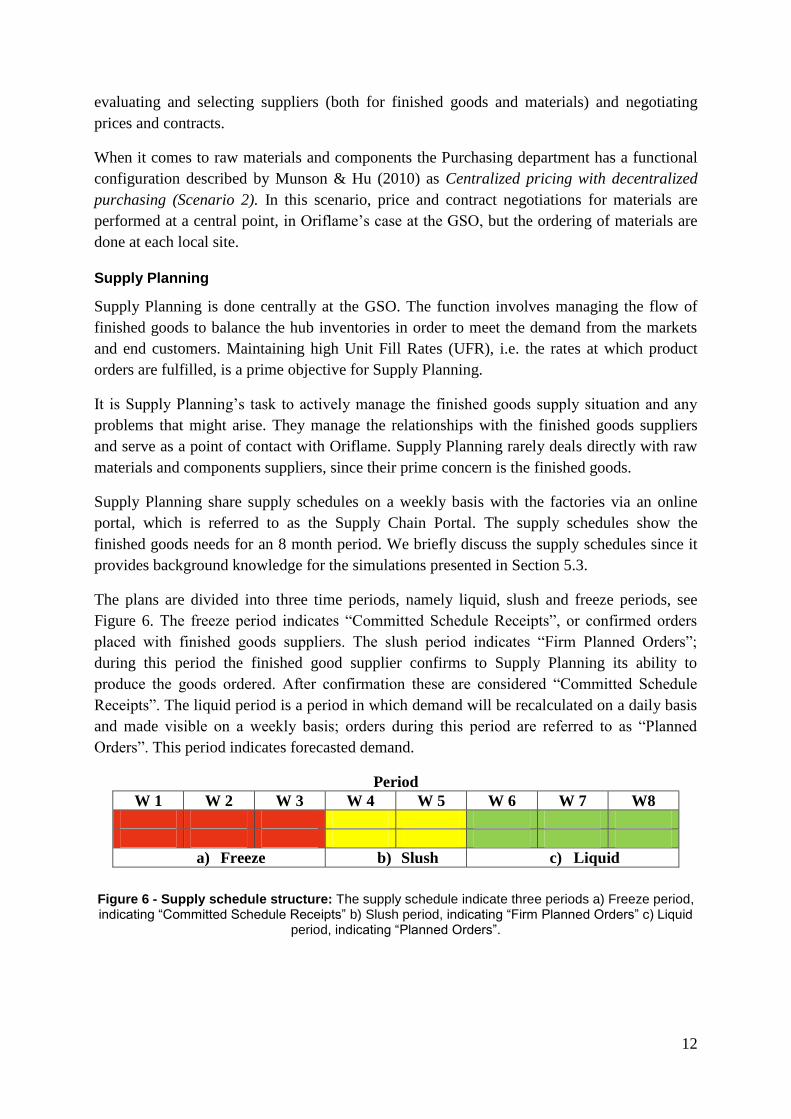
The plans are divided into three time periods, namely liquid, slush and freeze periods, see
Figure 6. The freeze period indicates “Committed Schedule Receipts”, or confirmed orders
placed with finished goods suppliers. The slush period indicates “Firm Planned Orders”;
during this period the finished good supplier confirms to Supply Planning its ability to
produce the goods ordered. After confirmation these are considered “Committed Schedule
Receipts”. The liquid period is a period in which demand will be recalculated on a daily basis
and made visible on a weekly basis; orders during this period are referred to as “Planned
Orders”. This period indicates forecasted demand.
Period
W 1 W 2 W 3 W 4 W 5 W 6 W 7 W8
a) Freeze b) Slush c) Liquid
Figure 6 - Supply schedule structure: The supply schedule indicate three periods a) Freeze period, indicating “Committed Schedule Receipts” b) Slush period, indicating “Firm Planned Orders” c) Liquid
period, indicating “Planned Orders”.
13
Manufacturing
Oriflame currently has six internal factories, with an additional two under construction, and
numerous external factories. Oriflame purchases finished goods from these factories, which in
all cases are treated as separate legal entities. It is the responsibility of the finished goods
supplier to manage their own facilities. It is also their responsibility to plan for and order the
raw materials and components needed to produce the finished goods according to the
“Committed Schedule Receipts” indicated in the supply schedules.
The Operational Service Agreement with the factories specifically states that the finished
goods suppliers are responsible to “ensure that the production capacity and the component
availability are optimized to ensure the highest UFRs to Oriflame” (Internal Document,
2013). It further requires the factories to manage materials flow “so as to ensure smooth
operation and delivery of finished products in time and in full as to the plan”.
It can thus be said that materials planning and purchasing is currently decentralized in
Oriflame. The cost of the finished goods includes both the cost of the materials and the cost of
the services involved in producing the products, often referred to as the conversion costs.
In a broad sense the factories are concerned with materials planning and purchasing, and
production planning. Materials planning and purchasing are closely linked; planning the flow
of materials into the factory involves planning what and how much to order, and when to
place orders so that deliveries are coordinated and on-time. To accomplish these tasks, the
factories are aided by Enterprise Resource Planning (ERP) systems, such as Fourth Shift or
Jeeves. Typically the Materials Requirement Planning (MRP) or Manufacturing Resources
Planning (MRP II) modules of the ERP system are used to aid manufacturing companies in
managing the material flow.
The MRP module takes various factors into consideration, such as inventory status, shelf-
lives, lot sizes, lead times etc., in order to develop a Recommended Production Schedule and
a Recommended Purchasing Schedule.
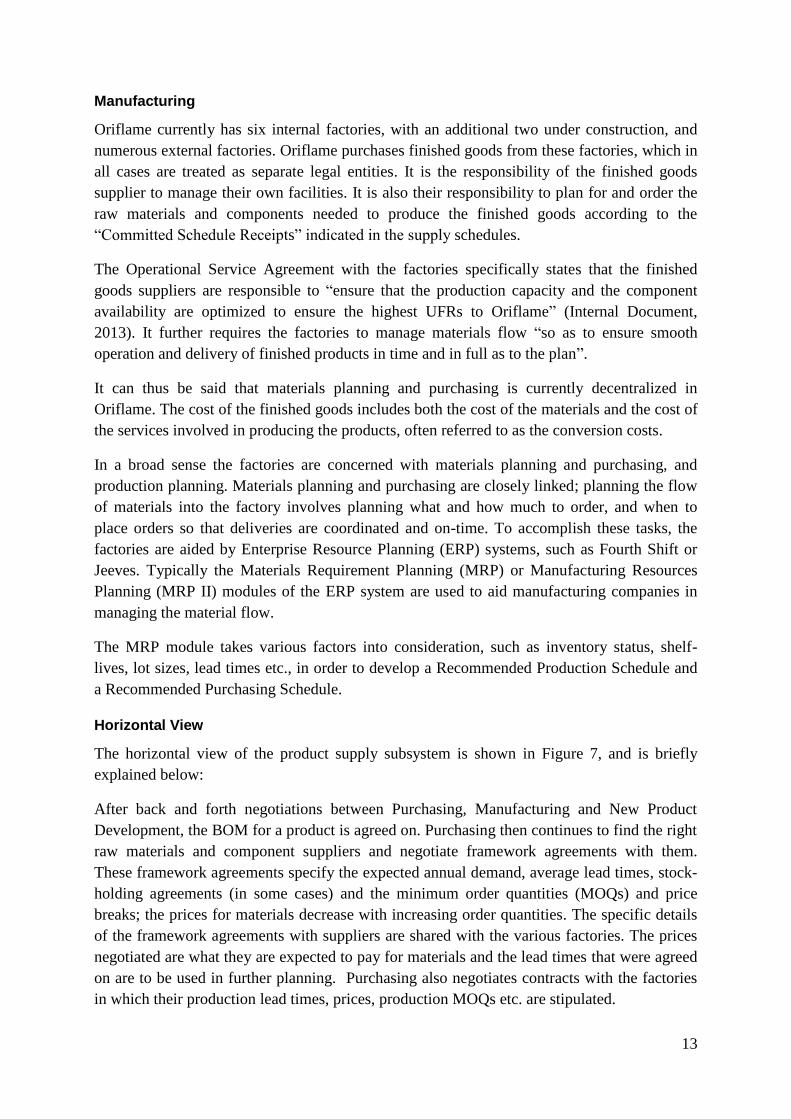
Horizontal View
The horizontal view of the product supply subsystem is shown in Figure 7, and is briefly
explained below:
After back and forth negotiations between Purchasing, Manufacturing and New Product
Development, the BOM for a product is agreed on. Purchasing then continues to find the right
raw materials and component suppliers and negotiate framework agreements with them.
These framework agreements specify the expected annual demand, average lead times, stock-
holding agreements (in some cases) and the minimum order quantities (MOQs) and price
breaks; the prices for materials decrease with increasing order quantities. The specific details
of the framework agreements with suppliers are shared with the various factories. The prices
negotiated are what they are expected to pay for materials and the lead times that were agreed
on are to be used in further planning. Purchasing also negotiates contracts with the factories
in which their production lead times, prices, production MOQs etc. are stipulated.
14
After the framework agreement is shared with the factories, the decision making power of
what materials to order when, is with them. On a weekly basis the eight month forecasted
demands for finished goods are shared by Supply Planning with the factories. The information
shared offers no commitment for future orders, but serves the purpose of assisting the
factories in planning and decision making. However, Oriflame is liable for materials ordered,
12 week forward cover, during the slush and liquid period according to the Operational
Agreement. Forecasted demands are also sent to the materials suppliers to assist them in their
planning. This is an attempt to reduce lead times, and thus to make the supply chain more
responsive and reliable.
Purchasing
Manufacturing
Internal Factories
External Factories
wh
at FG
s are req
uired
, by w
hen
.
Raw Materials & Components
Suppliers
what is needed, by when
Framework Agreements
suppliers, lead time, M
OQ & price
breakdowns
BOM
NPD
- BOM: Bill of Materials- MOQ: Minimum Order Quantity- NPD: New Product Development Department- FG: Finished Goods
Supply Planning
Finished Goods Supply Plan
materials finished goods
foreca
st
forecast
Figure 7 - Horizontal view of the product supply subsystem: The horizontal view shows the flow of materials and information across the functional boundaries.
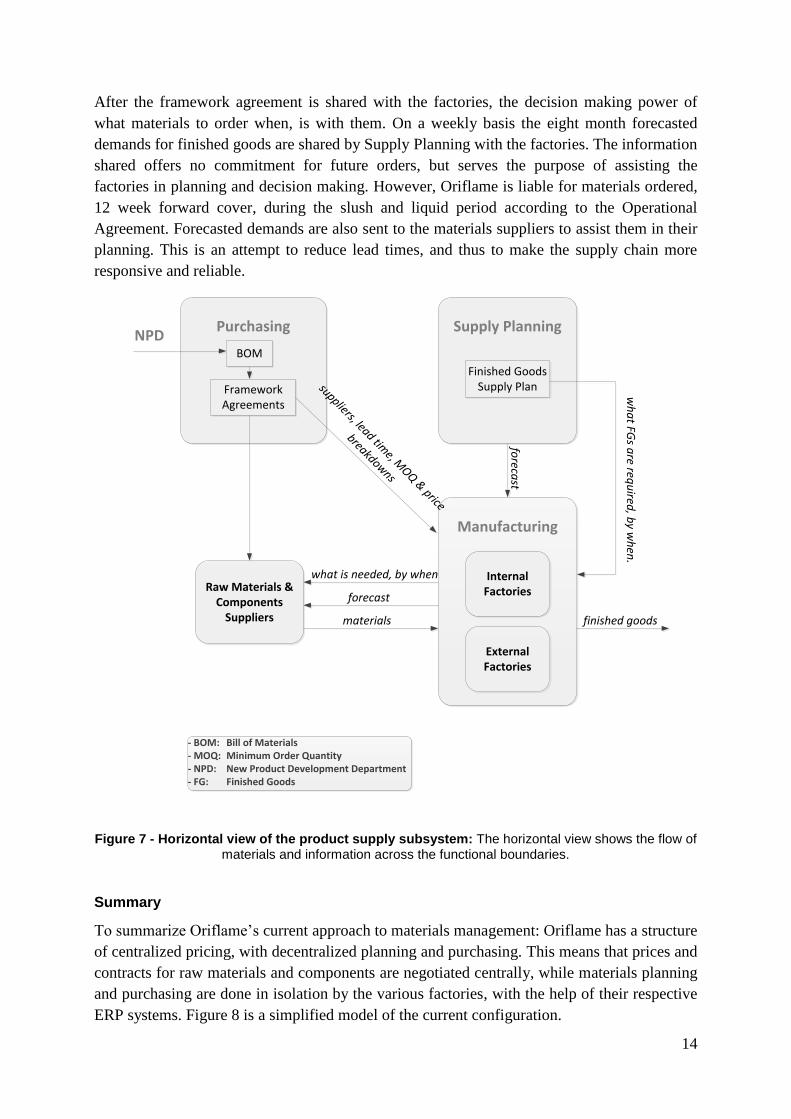
Summary
To summarize Oriflame’s current approach to materials management: Oriflame has a structure
of centralized pricing, with decentralized planning and purchasing. This means that prices and
contracts for raw materials and components are negotiated centrally, while materials planning
and purchasing are done in isolation by the various factories, with the help of their respective
ERP systems. Figure 8 is a simplified model of the current configuration.
15
ERP
ERP
Factory 1
Factory 2
Raw Materials and Components
SuppliersOriflame
material orders
material ordersFG orders
FG orders
materials
materials
Figure 8 - Oriflame's current approach to materials management: The current configuration includes centralized pricing, and decentralized planning and ordering of materials.
4.3 Problems and Disconnects
Several semi-structured interviews were conducted with members of each of the three
departments, Purchasing, Supply Planning and Manufacturing, to gain an understanding for
the major problems and disconnects in this decentralized approach to planning and purchasing
of materials.
Standardized Processes and Agreements
A recurring problem mentioned by all the departments interviewed, was the lack of
standardized processes and agreements. In some cases standardized processes existed, but it is
unknown if it was being followed, because processes to enable follow up and feedback were
not installed. The following problem areas were mentioned:
No standardized process exists for sharing the forecasts with the raw materials and
component suppliers. Even though it is required of the factories to share the forecast,
there is little following up if this is actually being done in the intended way.
No standardized process exists for prioritizing which factory receives materials when
only a limited amount of materials are available from the supplier, and more than one
factory has placed an order for it.
The agreements with the materials suppliers lack the requirement to manage the orders
they receive from factories as Oriflame orders; instead they are probably managed as
orders from individual organizations. It is to a large extent unknown if the materials
suppliers try to optimize and group Oriflame orders.
No standardized process exists to ensure that the dependent processes receive the new
information when agreements with suppliers are changed or updated, e.g. Supply
Planning needs to be informed when a supplier’s agreed lead time change.
Visibility and Feedback
The current decentralized approach to materials planning and purchasing leads to the problem
that information regarding the upstream part of the supply chain becomes invisible or difficult
to access for other stakeholders in the organization. This has a detrimental effect on decision
making and material and product flow coordination. Specific problem areas referred to during
interview sessions include:
16
Lack of transparency of all the factors contributing to the final costs of finished goods.
Lack of feedback regarding whether original commitments and contracts made with
suppliers are being met.
Lack of knowledge of the reasoning behind materials purchasing decisions.
Lack of visibility and difficulty in accessing the inventory level statuses of raw
materials and components at the factories on a regular basis.
Responsiveness
Purchasing owns the relationships with the suppliers, but it is Manufacturing that deals with
the suppliers on a day-to-day basis. Purchasing holds the decision making power of selecting
suppliers, and thus when Manufacturing experiences problems with the suppliers, this
information is often escalated to Purchasing. In turn this creates a lot of back and forth
communication in attempts to solve the problems. This deteriorates responsiveness to problem
solving and might lead to knowledge being lost as it travels across the functional boundaries.
4.4 Risks and Missed Opportunities
The problems and disconnects discussed in the previous section are all associated with
Oriflame’s decentralized approach to planning and purchasing materials, but most points
mentioned can be improved on without major changes to the current organization structure.
However, the business risks and missed opportunities make it worth challenging the current
structure. The risks and missed opportunities were collected through conversations with
different stakeholders. We also took into consideration the Operational Service Agreement
Oriflame has with its finished goods suppliers.
4.4.1 Risks
Each factory supplying Oriflame with finished goods are a separate legal entity, thus
especially in the case of the external suppliers, their interest lies in managing their own costs
and risks. However they make decisions that can affect Oriflame, for example in the two
situations described below:
Situation 1
Should we align our production MOQ with the MOQs of expensive materials, instead of with
the actual capacity of our production lines? In doing so we avoid receiving finished goods
orders below the materials MOQs, which leads to increased inventories and reductions in our
cash flow?
The factories, especially the external factories, have a strong incentive to align their
production MOQs with the MOQs of expensive materials. The current decentralized approach
to materials management requires the finished goods suppliers to buy the materials, thus
reducing their immediate cash flows. The factories can protect themselves in some part from
this risk by ensuring all materials are converted to finished goods through aligning the
respective MOQs.
17
This has an adverse effect on Oriflame’s business, since it forces them to order a certain
quantity of finished goods that is not necessarily aligned with actual demand.
Situation 2
Should we just order the MOQ to meet confirmed orders (Committed Schedule Receipts) or
use the forecast to order larger quantities and get lower unit prices (according to the
agreement these larger quantities should not exceed 12 weeks forward cover of Planned
Orders). Larger order quantities reduces our cash flow, but also increases “smooth operation
and delivery of finished products in time and in full as to the plan” which is a requirement of
the operational agreement.
Risk homeostasis theory states that they are likely to adjust their behavior and decisions in
response to the level of risk they perceive. Thus if the factories are confident in their own
production lead times, they will delay ordering of materials until finished goods orders are
confirmed. They might feel protected from the risk of supplier delivering later than the
specified lead times, since Oriflame’s Purchasing department selected the suppliers and
negotiated lead times.
Further, inventory levels are one of the Key Performance Indices (KPIs) for the factories. So
again they might perceive the risk too high, to act on forecasted demand and risk ending up
with large amounts of stocks in inventory, which also reduces their cash flow.
The suppliers decision to act on confirmed orders and not on the forecast, could lead to bad
business for Oriflame, since they are missing out on quantity discounts – lowering the profit
margin of the finished products.
4.4.2 Missed Opportunities
Missed opportunities we define as instances where Oriflame is not taking advantage of
possibilities to be more economically efficient in the materials management of their current
product portfolio. We identified two such instances relating to economies of scale for multi-
sourced products and multi-product materials, and they are briefly discussed below.
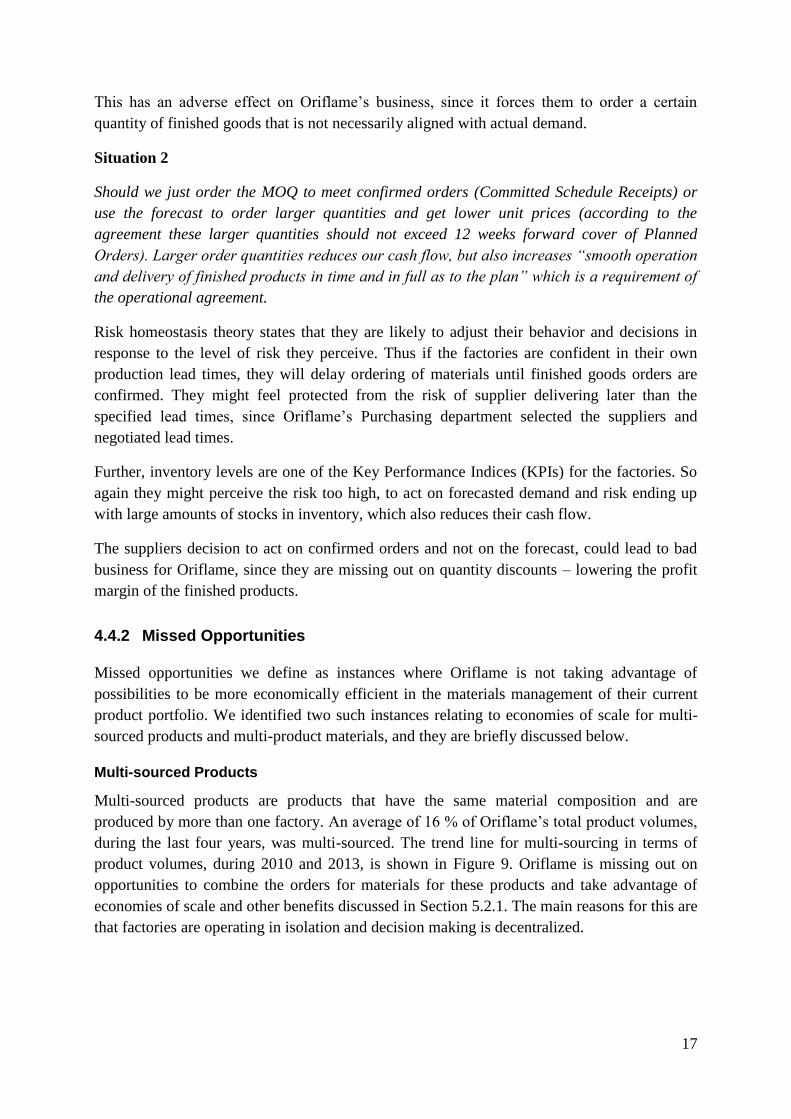
Multi-sourced Products
Multi-sourced products are products that have the same material composition and are
produced by more than one factory. An average of 16 % of Oriflame’s total product volumes,
during the last four years, was multi-sourced. The trend line for multi-sourcing in terms of
product volumes, during 2010 and 2013, is shown in Figure 9. Oriflame is missing out on
opportunities to combine the orders for materials for these products and take advantage of
economies of scale and other benefits discussed in Section 5.2.1. The main reasons for this are
that factories are operating in isolation and decision making is decentralized.
18
Figure 9 - Multi-sourced products volumes: The figure shows the percentage of product volumes that were multi-sourced during 2010 – 2013.
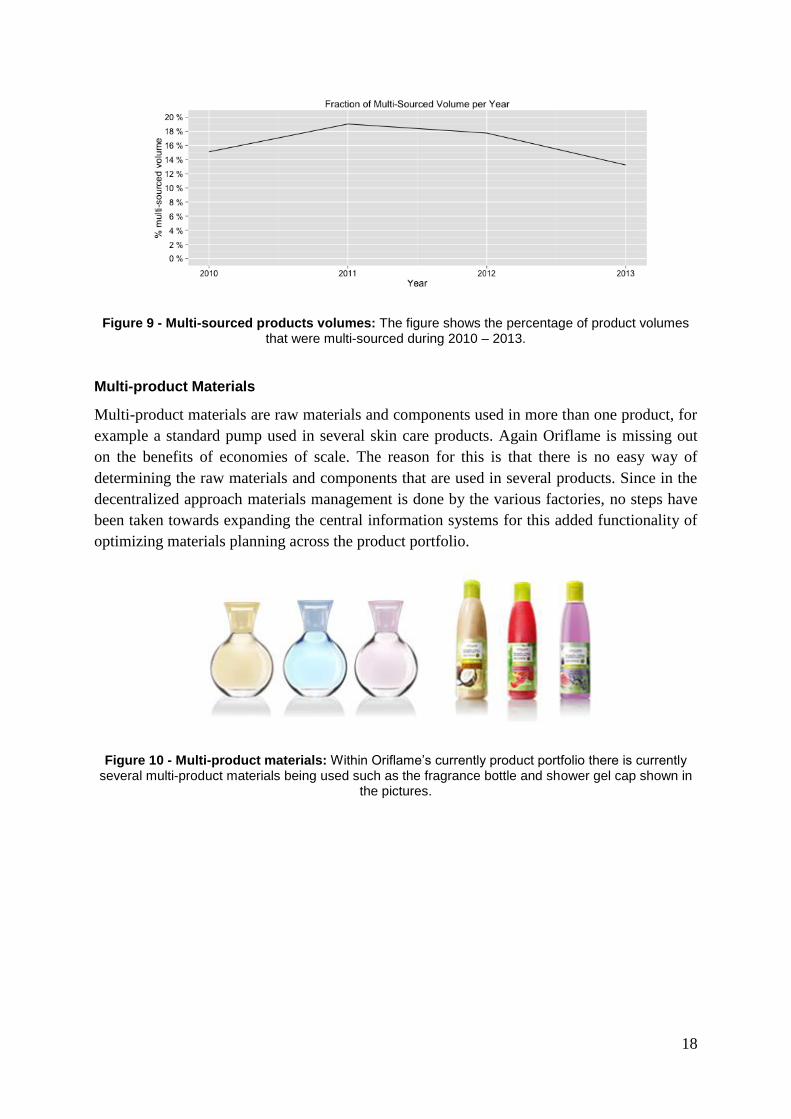
Multi-product Materials
Multi-product materials are raw materials and components used in more than one product, for
example a standard pump used in several skin care products. Again Oriflame is missing out
on the benefits of economies of scale. The reason for this is that there is no easy way of
determining the raw materials and components that are used in several products. Since in the
decentralized approach materials management is done by the various factories, no steps have
been taken towards expanding the central information systems for this added functionality of
optimizing materials planning across the product portfolio.
Figure 10 - Multi-product materials: Within Oriflame’s currently product portfolio there is currently several multi-product materials being used such as the fragrance bottle and shower gel cap shown in
the pictures.
19
5 Investigated Scenario
In the previous section we investigated Oriflame’s current approach to materials management.
It deepened our understanding of the problem under investigation and justified our study into
the benefits for Oriflame in centralized materials management that is the focus of this chapter.
To summarize the finding from the previous section: Oriflame currently has a centralized
pricing and a decentralized planning and purchasing configuration. In this chapter we will
investigate a completely centralized model. A centralized model of materials management
means that the decision making power of the pricing, planning and purchasing of raw
materials and components are located in one place and the various units are served, in terms
of information, from this central point. Since pricing and contract negotiations are already
centralized in Oriflame, we only directed our efforts towards materials planning and
purchasing. More details on this model are presented in Section 5.1.
In Section 5.2 we investigate the value for Oriflame of centralized materials management. We
not only investigate the advantages, but also the disadvantages, to put things into perspective.
We followed a structured methodology and used various methods including semi-structured
interviews and a survey.
Finally in Section 5.3 an example case is presented where we support our research question
through quantification of two potential benefits with centralization identified during the
survey. A Monte Carlo simulation model was designed based on an example case, which was
limited to one product category, namely fragrances.
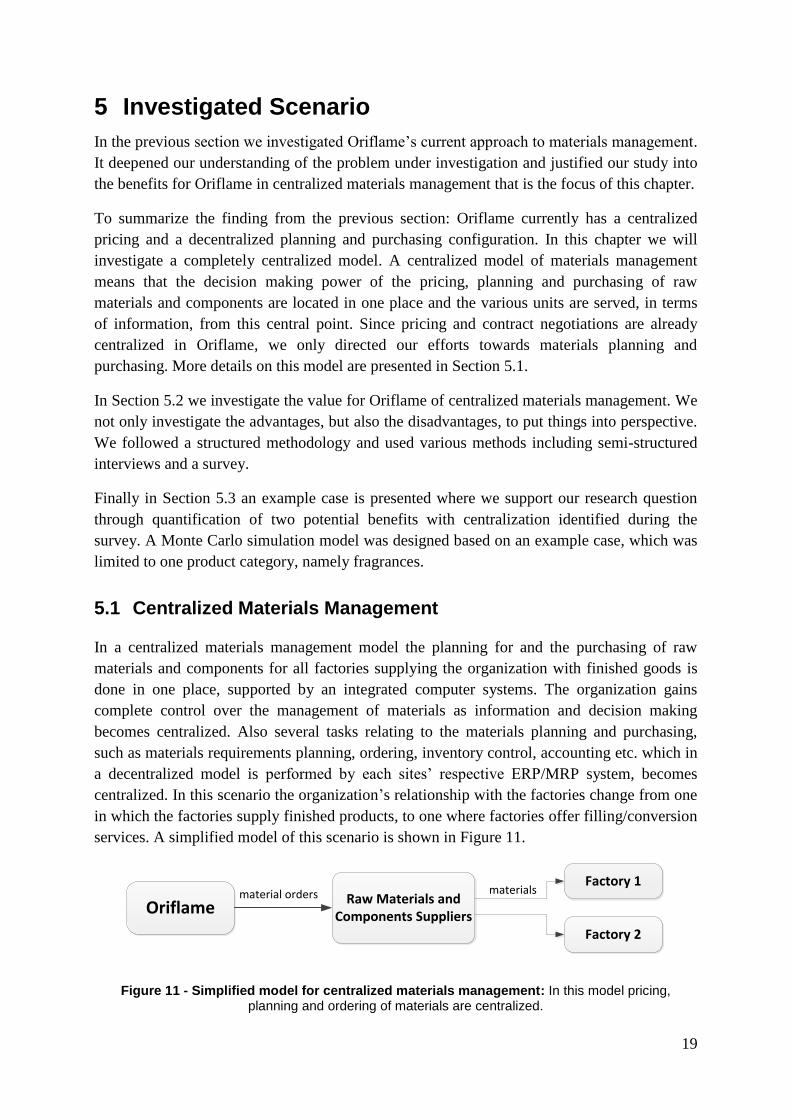
5.1 Centralized Materials Management
In a centralized materials management model the planning for and the purchasing of raw
materials and components for all factories supplying the organization with finished goods is
done in one place, supported by an integrated computer systems. The organization gains
complete control over the management of materials as information and decision making
becomes centralized. Also several tasks relating to the materials planning and purchasing,
such as materials requirements planning, ordering, inventory control, accounting etc. which in
a decentralized model is performed by each sites’ respective ERP/MRP system, becomes
centralized. In this scenario the organization’s relationship with the factories change from one
in which the factories supply finished products, to one where factories offer filling/conversion
services. A simplified model of this scenario is shown in Figure 11.
Oriflame Raw Materials and
Components Suppliers
Factory 1
Factory 2
material orders materials
Figure 11 - Simplified model for centralized materials management: In this model pricing, planning and ordering of materials are centralized.
20
While the concept of centralized materials management is clear and easy to understand,
making the shift from decentralized to centralized is a complex tasks that involves
organization restructuring, business process reengineering, implementation of advanced
information systems, migration of large amounts of data, changes in supplier relationships and
agreements and securing the right competences. These are important aspects that a business
must consider for its own unique position, but the focus of the subsequent sections are on the
inherent advantages and disadvantages of such a model. The implementation challenges are
only briefly discussed in Section 5.2.3.
5.2 Value of Centralized Materials Management
Moving towards a centralized materials management structure is worth considering as
organizations are becoming more sophisticated in their management of their operations and
supply chains. Technological advancements such as the internet and complex information
systems are making it possible to coordinate materials, information and financial flows across
the organization and supply chain, and to help organizations become more efficient and
competitive in the long run.
To determine the advantages and disadvantages associated with centralized materials
management the following methodology was followed:
1. Interviews were conducted with 14 stakeholders (see Table 2) belonging to Oriflame’s
Global Supply Department to gather their views on the advantages and disadvantages
with this scenario.
2. Literature was consulted on the topic.
3. A survey was developed, listing the advantages gathered, and stakeholders (see Table
2) were asked to rank the value of the respective advantages on a qualitative scale.
4. The results of the survey were analyzed and the highest valued advantages were
identified.
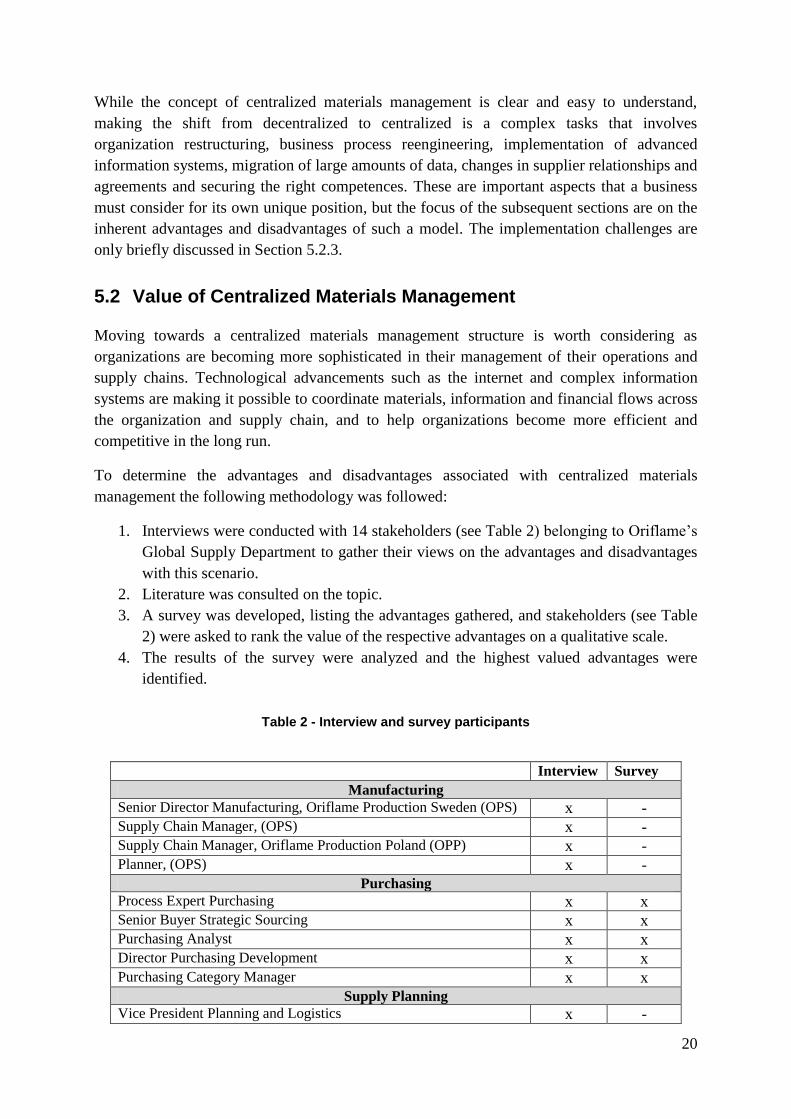
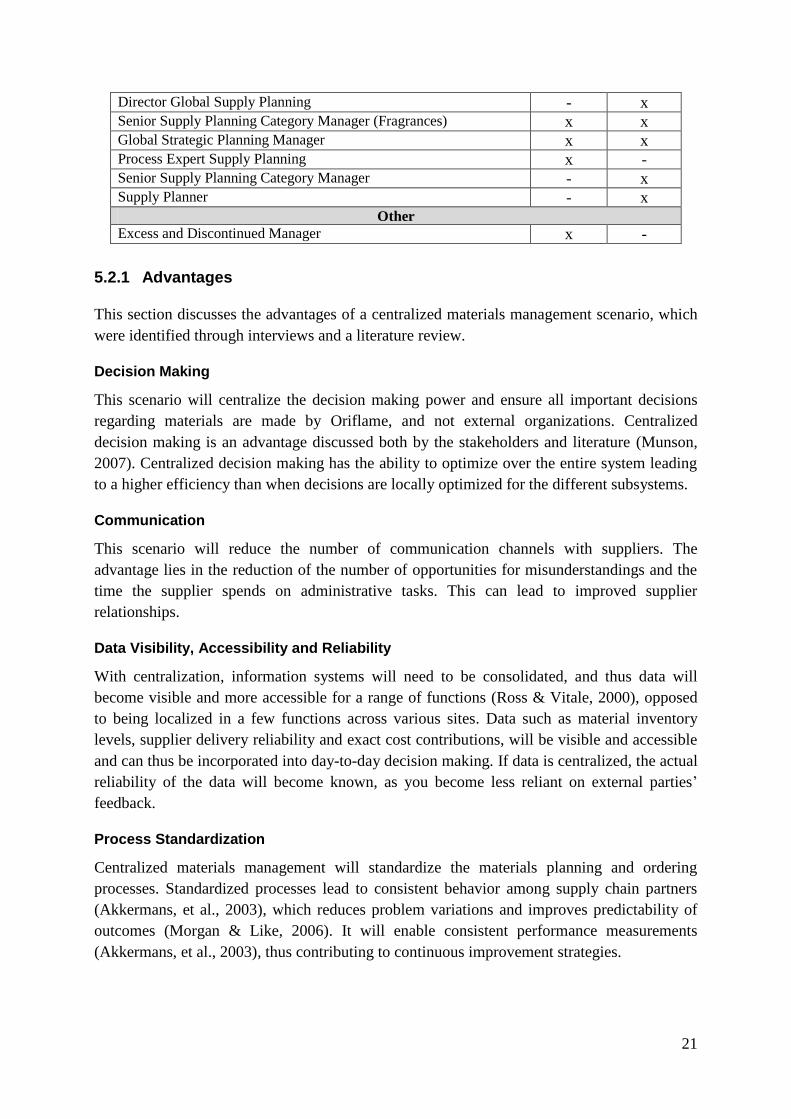
Table 2 - Interview and survey participants
Interview Survey
Manufacturing Senior Director Manufacturing, Oriflame Production Sweden (OPS) x - Supply Chain Manager, (OPS) x - Supply Chain Manager, Oriflame Production Poland (OPP) x - Planner, (OPS) x -
Purchasing Process Expert Purchasing x x Senior Buyer Strategic Sourcing x x Purchasing Analyst x x Director Purchasing Development x x Purchasing Category Manager x x
Supply Planning Vice President Planning and Logistics x -
21
Director Global Supply Planning - x Senior Supply Planning Category Manager (Fragrances) x x Global Strategic Planning Manager x x Process Expert Supply Planning x - Senior Supply Planning Category Manager - x Supply Planner - x
Other Excess and Discontinued Manager x -
5.2.1 Advantages
This section discusses the advantages of a centralized materials management scenario, which
were identified through interviews and a literature review.
Decision Making
This scenario will centralize the decision making power and ensure all important decisions
regarding materials are made by Oriflame, and not external organizations. Centralized
decision making is an advantage discussed both by the stakeholders and literature (Munson,
2007). Centralized decision making has the ability to optimize over the entire system leading
to a higher efficiency than when decisions are locally optimized for the different subsystems.
Communication
This scenario will reduce the number of communication channels with suppliers. The
advantage lies in the reduction of the number of opportunities for misunderstandings and the
time the supplier spends on administrative tasks. This can lead to improved supplier
relationships.
Data Visibility, Accessibility and Reliability
With centralization, information systems will need to be consolidated, and thus data will
become visible and more accessible for a range of functions (Ross & Vitale, 2000), opposed
to being localized in a few functions across various sites. Data such as material inventory
levels, supplier delivery reliability and exact cost contributions, will be visible and accessible
and can thus be incorporated into day-to-day decision making. If data is centralized, the actual
reliability of the data will become known, as you become less reliant on external parties’
feedback.
Process Standardization
Centralized materials management will standardize the materials planning and ordering
processes. Standardized processes lead to consistent behavior among supply chain partners
(Akkermans, et al., 2003), which reduces problem variations and improves predictability of
outcomes (Morgan & Like, 2006). It will enable consistent performance measurements
(Akkermans, et al., 2003), thus contributing to continuous improvement strategies.
22
Cost Control
Centralized materials management will allow for tighter cost control. With the planning and
ordering centralized, the cost contributing factors in the conversion of raw materials and
components into finished goods can be better monitored and controlled.
Economies of Scale
An advantage often cited by the literature and mentioned by the stakeholders is economies of
scale (Munson, 2007), (Karijalainen, 2011). For Oriflame centralized materials management
can allow economies of scale both in the case of combined ordering (discussed in the next
section) and multi-product materials planning and purchasing.
Further, a central database with all Bill of Materials (BOM) data, including data on multi-
product components and raw materials, will enable grouping of requirements across the
portfolio, and taking advantage of economies of scale, leading to cost savings.
Combined Orders
For products that are multi-sourced (which means more than one factory produces it),
centralized materials management will enable combined ordering of materials. This will lead
to several advantages, discussed below:
Inventory and Cost savings: Instead of each factory ordering the minimum order
quantity (MOQ), when their actual need is below this quantity, orders from factories
can be combined to reduce each factory’s excess quantity. This leads to inventory and
cost savings and a reduction in inventory levels. Combining order quantities will also
in some cases lead to achieving a higher order quantity level with a better price break,
thus reducing per-unit costs.
Risk pooling: Each order for materials has a certain associated risk, one such risk is
the risk in variability of anticipated demand. When orders are combined this risk is
shared amongst the factories. Risk pooling can also lead to a reduction in inventory
levels. Risk pooling is cited as an advantage of centralized purchasing by Munson
(2007).
Increased flexibility: The risk associated with the variability of anticipated demand is
further reduced with the increased flexibility achieved through combined ordering.
Combined ordering will allow delaying the decision making point of the exact
distribution of the ordered materials to the relevant factories. The decision making
point can be delayed by the raw material and component’s production lead time.
Lead time reduction: Combined ordering can lead to a reduction in lead times, since
combined ordering will allow the supplier to better plan its production schedule and
run longer batches. This will also lead to fewer production set ups, thus saving time.
In general reduced inventory levels lead to a reduction in obsolesces and increased cash flow.
23
Support Other Projects
Centralized materials management and its associated benefits will support current projects
running in the organization. One such project is Right Sourcing, a project that aims to through
structured performance measurement and evaluation aid the Purchasing department with
future supplier selection. Centralized materials management will ensure that knowledge of
supplier reliability, flexibility and responsiveness are closer to the decision making source, i.e.
Purchasing, and not dispersed across numerous sites.
Future Strategies
Centralized materials management is a stepping stone for future strategies, for example
developing a world class system, that can coordinate planning and aid decision making across
the organization and supply chain as a whole.
5.2.2 Disadvantages
This section discusses the disadvantages of a centralized materials management scenario,
which were identified through interviews and a literature review.
Responsibility and Accountability
Centralization means that the responsibility and accountability of materials management is not
located with the factories. Thus the factories’ incentive to be proactive and accommodating
when deliveries become late decreases - in the case of the external suppliers. Losing control
of purchasing decisions can also lead to frustration for local management (Arnold, 1999),
(Matthyssens & Faes, 1996).
Speed and Responsiveness
The speed and the responsiveness with which the factories deal with problems might decrease
(Munson, 2007). In the centralized model, all the responsibility and decision making power
regarding materials management is located centrally, issues that before could have been
solved between the factories and suppliers, might now need to be escalated to a middleman.
Unique Requirements
Centralization might lead to a lack of recognition of the unique operational requirements of
each factory (Munson, 2007), and also decrease the utilization of the localized knowledge and
expertise existing at these sites.
Realizing Benefits
Realizing the benefits of combined ordering might be impossible if coordination cannot be
achieved, which is dependent on various factors such as: the product type and if it is multi-
sourced, materials requirements, supply schedule, lead time etc. Especially supplier lead time
could add extra complexity if factories are geographically far apart.
24
5.2.3 Implementation
The complexities and challenges in implementing centralized materials management is worth
briefly discussing, as it was a subject often mentioned during the interviews with
stakeholders.
Shifting from a decentralized to a centralized model would be a major change in the way
Oriflame does business today. Two major factors involved in centralization are: restructuring
of the organization and the successful implementation of sophisticated information systems.
Restructuring
Centralization will directly affect various departments in the organization, notably:
Manufacturing, Supply Planning and Purchasing, and organizational restructuring will be
needed. Redeployment of people (Siriginidi, 2000) and new expertise and resources will be
required for implementation.
Relationships with the finished goods suppliers will drastically change, and new types of
contracts and agreements will have to be negotiated.
Systems
To achieve centralization, the need exists for extending or complimenting the current central
ERP system and managing interfaces with systems currently used at local sites. Both the
selection and implementation of such systems are important, complex and high-stake
processes, and are topics well covered by the literature (Siriginidi, 2000), (Chang, et al.,
2002), (Ross & Vitale, 2000), (Bingi, et al., 1999).
The critical issues affecting implementation often mentioned are:
implementation cost,
implementation time,
employee morale,
top management commitment, and
expertise and human resource requirements.
5.2.4 Survey
A survey was developed after initial interviews and review of the literature on the potential
advantages and disadvantages of centralized materials management. This survey was pre-
tested with the key stakeholders in order to give them a chance to give their opinion on the
questions and possibly request some changes, as suggested by Eisenhardt (1989). After it was
finalized, it was distributed amongst the stakeholders. The finalized document is presented in
Appendix C.
The survey aimed to gather the opinions of Oriflame employees on the value of potential
advantages of centralized materials management. The survey asked the employees to rank the
25
value of the benefit described on a scale of 1 to 5, where 1 indicated very little value and 5,
great value.
The results of the survey are shown in Table 3 and a detailed graphical representation in
Figure 12. The results are ranked from the highest valued to least valued advantage Oriflame
employees foresee with a centralized materials management scenario. Both the sum of the
total count and the average rating are shown in the table. More detailed discussion of the
results follows.
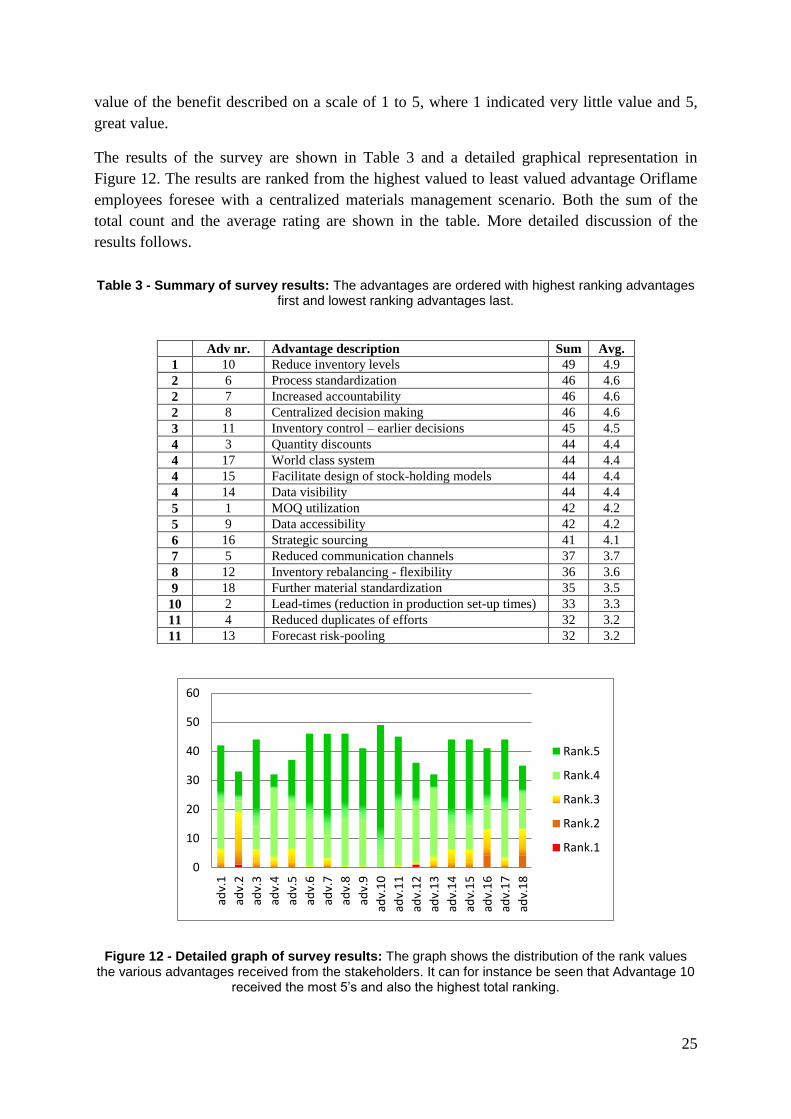
Table 3 - Summary of survey results: The advantages are ordered with highest ranking advantages first and lowest ranking advantages last.
Adv nr. Advantage description Sum Avg.
1 10 Reduce inventory levels 49 4.9
2 6 Process standardization 46 4.6
2 7 Increased accountability 46 4.6
2 8 Centralized decision making 46 4.6
3 11 Inventory control – earlier decisions 45 4.5
4 3 Quantity discounts 44 4.4
4 17 World class system 44 4.4
4 15 Facilitate design of stock-holding models 44 4.4
4 14 Data visibility 44 4.4
5 1 MOQ utilization 42 4.2
5 9 Data accessibility 42 4.2
6 16 Strategic sourcing 41 4.1
7 5 Reduced communication channels 37 3.7
8 12 Inventory rebalancing - flexibility 36 3.6
9 18 Further material standardization 35 3.5
10 2 Lead-times (reduction in production set-up times) 33 3.3
11 4 Reduced duplicates of efforts 32 3.2
11 13 Forecast risk-pooling 32 3.2
Figure 12 - Detailed graph of survey results: The graph shows the distribution of the rank values the various advantages received from the stakeholders. It can for instance be seen that Advantage 10
received the most 5’s and also the highest total ranking.
0
10
20
30
40
50
60
adv.
1
adv.
2
adv.
3
adv.
4
adv.
5
adv.
6
adv.
7
adv.
8
adv.
9
adv.
10
adv.
11
adv.
12
adv.
13
adv.
14
adv.
15
adv.
16
adv.
17
adv.
18
Rank.5
Rank.4
Rank.3
Rank.2
Rank.1
26
Results Discussion
The main observation from the results is that Oriflame employees foresee great value in
centralized materials management across the board, as all advantages scored above 3 on
average. Both immediate and long-term benefits are valued.
The survey further revealed that Advantage 10 - reduced inventory levels due to risk-pooling
and better MOQ utilization (that can be achieved through combined ordering for multi-
sourced products), are the highest valued advantages stakeholders foresee with centralized
materials management.
In joint second place were three non-tangible advantages relating to business processes,
namely: process standardization, centralized decision making and increased accountability.
This is in line with the findings from the interview stage, and that there was a lack of
standardization within the area of material management, discussed in the previous chapter.
The survey results confirm that besides operational advantages, there is value in centralized
materials management as it is a key step towards developing a world class system that
coordinates the supply chain as a whole (Advantage 17) and aiding in designing appropriate
inventory models (Advantage 15). This could be a reflection of Oriflame employees’ interest
in long-term strategies and vision for the organization.
On average the stakeholders interviewed value improvements such as “Reduction in
duplication of effort” and “Lead-time reduction due to fewer production set-up times” less, as
these improvements can primarily be achieved at external organizations (i.e. materials
suppliers and external factories).
27
5.3 Example Case
To support our research question “What are the benefits for Oriflame in centralized materials
management”, we attempted to quantify two of the potential benefits of centralized materials
management through Monte Carlo simulations. The benefits we investigated relate to the
combined ordering of materials for multi-sourced products, which were identified as one of
the missed opportunities associated with Oriflame’s current materials management strategy in
Section 4.4.2. The benefit of inventory reductions that can possibly be achieved through such
a combined ordering strategy were highly valued by stakeholders in the survey, see Section
5.2.4, and received the highest ranking. The other benefit investigated is potential cost savings
that can be achieved through the same strategy.
For the purpose of the simulations, we limited the scope of this advanced study to Oriflame’s
fragrance category, and data from week 32:2012 to week 6:2013 were used in the simulation
model. The simulation model was implemented in statistical computing software called “R”
(R Foundation for Statistical Computing, 2005) and plots were created with “ggplot2”
(Wickham, 2009).
The aim of the simulation model was to quantify the potential cost savings and inventory
savings of a centralized materials planning and ordering strategy for multi-sourced fragrances.
To this end, both a centralized and a decentralized purchasing scenario were simulated and
compared. Further details of the simulation are presented in Section 5.3.2.
The results of the simulations are summarized in Section 5.3.3. A manually worked out
example of the simulations are shown in Appendix D, but first the background of the
fragrance category is presented in the next section.
5.3.1 Background Fragrances
The fragrance category is one of Oriflame’s six product categories. The fragrance category
generated over € 300 million in sales in 2012, which is a contribution of 20 % to Oriflame’s
total sales (Oriflame Cosmetics, 2012).
Oriflame currently has two primary suppliers of fragrances; one located in Sweden and the
other in the Ukraine. These suppliers convert raw materials and components into finished
goods, through mixing, filling and packaging processes. We use the terms filler, finished good
supplier and factory interchangeably in this study.
The factory in Sweden (hereafter referred to as NRDME) was bought by Oriflame in 2003. It
specializes in the manufacturing of personal and hair care products and fragrances. Over 250
products are filled in this factory and the total capacity is over 100 million units (Oriflame
Cosmetics, 2012).
The factory in the Ukraine (hereafter referred to as INTRF) is external to Oriflame. Oriflame
first commissioned INTRF for the production of fragrances in August 2012.
28
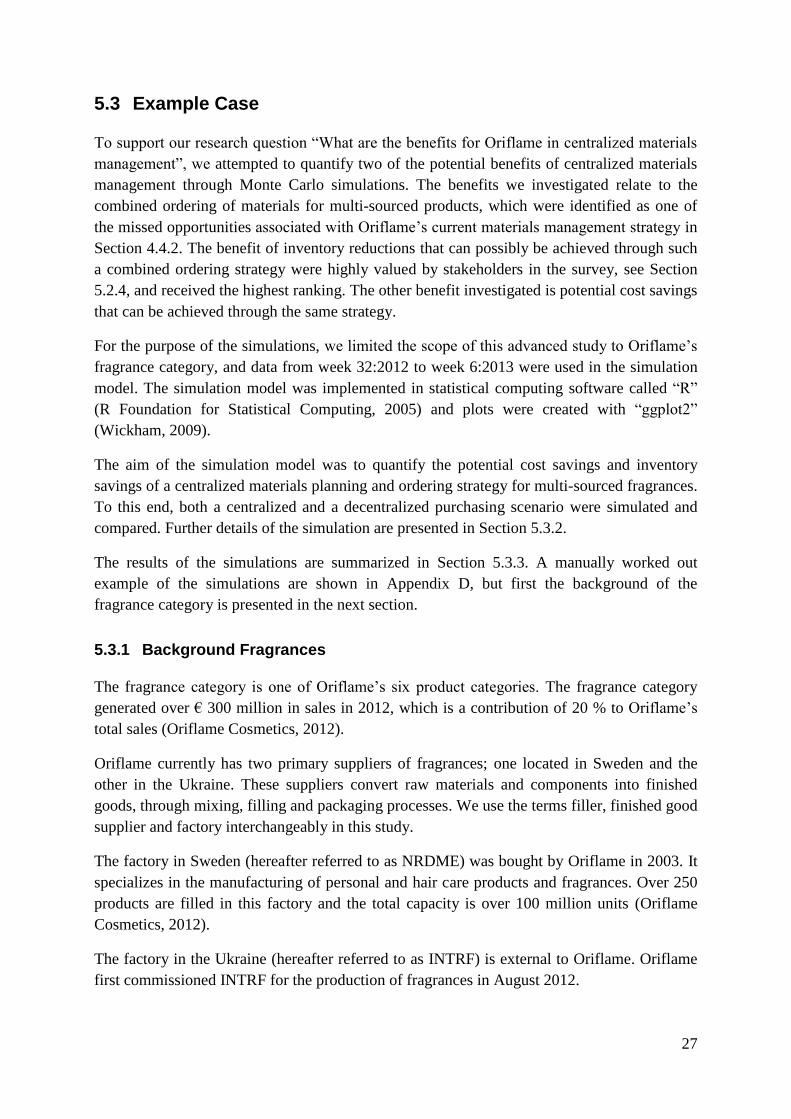
A simplified model of the fragrance category’s supply chain is shown in Figure 13. As shown
in the model, there are two factories, one internal and one external, producing fragrances for
Oriflame. Both are supplied with raw materials and components from the same suppliers. It is
believed that in general orders for raw materials and components from the two factories are
treated as separate orders at the suppliers. Lastly, the finished goods produced by each factory
are destined for different markets.
Raw Materials & Component
Suppliers
Finished GoodsUpstream
Supply ChainDownstream Supply Chain
INTRF
NRDME
CIS Markets
Other Markets
Figure 13 - Simplified model of the fragrance category's supply chain: Two factories are producing the same products; both are supplied from the same raw materials and components
suppliers.
During the period of August 2012 to August 2013, out of a total of 103 fragrance product
codes, 241 were multi-sourced i.e. produced by both NRDME and INTRF. Accordingly 13%
of total volumes were externally produced.
NRDME and INTRF are operating in isolation. Every week each factory receives an updated
supply schedule via the Supply Chain Portal (described in Section 4.2). The supply schedule
indicates “Committed Schedule Receipts” or confirmed orders for subsequent weeks. Each
factory operates its own ERP system, running its own MRP modules, which determines the
time-phased material requirements and ordering schedules to meet the supply schedule. When
ordering materials there are certain price breaks associated with order quantities; per unit
costs decrease with increasing quantities. The term minimum order quantity (MOQ) is used
for the lowest order quantity accepted, and this is set by the supplier to ensure the order
quantity justifies overheads and production set-up to remain profitable.
It is believed that this decentralized approach and purchasing requirements give rise to the
following sub-optimal scenario: factories order the MOQ when their materials requirements
are less leading to unnecessary inventory and spend.
If the ordering of materials could be combined, such as in a centralized materials management
scenario, it will lead to larger order quantities being achieved. This could lead to lower per-
unit costs and possibly result in lowering inventory levels.
1 Only including fragrances packaged in bottles, i.e. excluding vials, aerosols etc.
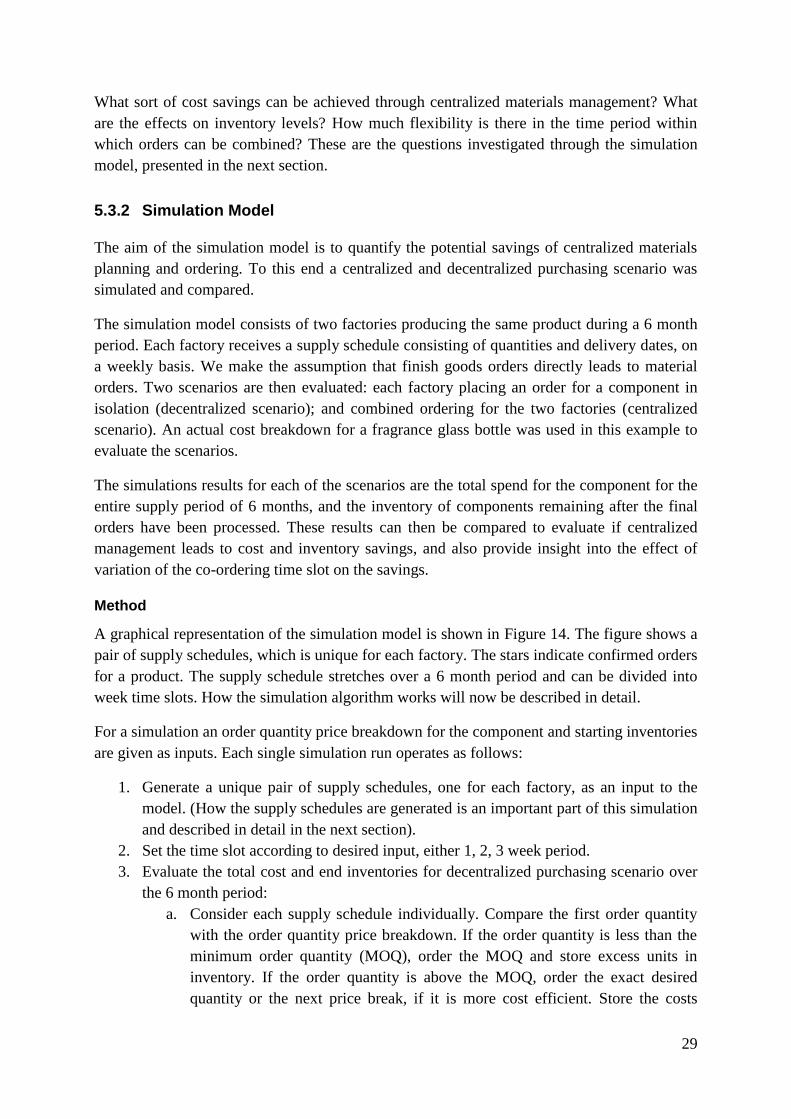
29
What sort of cost savings can be achieved through centralized materials management? What
are the effects on inventory levels? How much flexibility is there in the time period within
which orders can be combined? These are the questions investigated through the simulation
model, presented in the next section.
5.3.2 Simulation Model
The aim of the simulation model is to quantify the potential savings of centralized materials
planning and ordering. To this end a centralized and decentralized purchasing scenario was
simulated and compared.
The simulation model consists of two factories producing the same product during a 6 month
period. Each factory receives a supply schedule consisting of quantities and delivery dates, on
a weekly basis. We make the assumption that finish goods orders directly leads to material
orders. Two scenarios are then evaluated: each factory placing an order for a component in
isolation (decentralized scenario); and combined ordering for the two factories (centralized
scenario). An actual cost breakdown for a fragrance glass bottle was used in this example to
evaluate the scenarios.
The simulations results for each of the scenarios are the total spend for the component for the
entire supply period of 6 months, and the inventory of components remaining after the final
orders have been processed. These results can then be compared to evaluate if centralized
management leads to cost and inventory savings, and also provide insight into the effect of
variation of the co-ordering time slot on the savings.
Method
A graphical representation of the simulation model is shown in Figure 14. The figure shows a
pair of supply schedules, which is unique for each factory. The stars indicate confirmed orders
for a product. The supply schedule stretches over a 6 month period and can be divided into
week time slots. How the simulation algorithm works will now be described in detail.
For a simulation an order quantity price breakdown for the component and starting inventories
are given as inputs. Each single simulation run operates as follows:
1. Generate a unique pair of supply schedules, one for each factory, as an input to the
model. (How the supply schedules are generated is an important part of this simulation
and described in detail in the next section).
2. Set the time slot according to desired input, either 1, 2, 3 week period.
3. Evaluate the total cost and end inventories for decentralized purchasing scenario over
the 6 month period:
a. Consider each supply schedule individually. Compare the first order quantity
with the order quantity price breakdown. If the order quantity is less than the
minimum order quantity (MOQ), order the MOQ and store excess units in
inventory. If the order quantity is above the MOQ, order the exact desired
quantity or the next price break, if it is more cost efficient. Store the costs
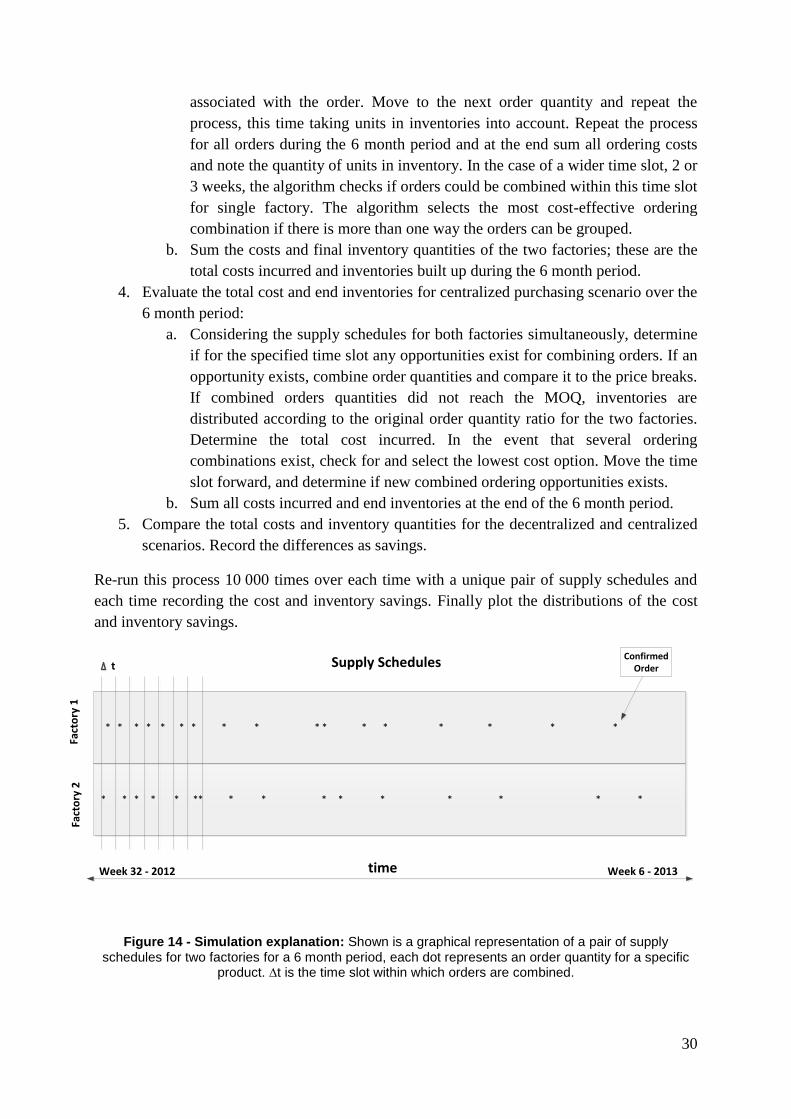
30
associated with the order. Move to the next order quantity and repeat the
process, this time taking units in inventories into account. Repeat the process
for all orders during the 6 month period and at the end sum all ordering costs
and note the quantity of units in inventory. In the case of a wider time slot, 2 or
3 weeks, the algorithm checks if orders could be combined within this time slot
for single factory. The algorithm selects the most cost-effective ordering
combination if there is more than one way the orders can be grouped.
b. Sum the costs and final inventory quantities of the two factories; these are the
total costs incurred and inventories built up during the 6 month period.
4. Evaluate the total cost and end inventories for centralized purchasing scenario over the
6 month period:
a. Considering the supply schedules for both factories simultaneously, determine
if for the specified time slot any opportunities exist for combining orders. If an
opportunity exists, combine order quantities and compare it to the price breaks.
If combined orders quantities did not reach the MOQ, inventories are
distributed according to the original order quantity ratio for the two factories.
Determine the total cost incurred. In the event that several ordering
combinations exist, check for and select the lowest cost option. Move the time
slot forward, and determine if new combined ordering opportunities exists.
b. Sum all costs incurred and end inventories at the end of the 6 month period.
5. Compare the total costs and inventory quantities for the decentralized and centralized
scenarios. Record the differences as savings.
Re-run this process 10 000 times over each time with a unique pair of supply schedules and
each time recording the cost and inventory savings. Finally plot the distributions of the cost
and inventory savings.
* * * * * ** * * * * * * * * *
* * * * * * * * * * * * * * * * *
Fact
ory
1Fa
cto
ry 2
t
time
Supply Schedules
Week 32 - 2012 Week 6 - 2013
Confirmed Order
Figure 14 - Simulation explanation: Shown is a graphical representation of a pair of supply schedules for two factories for a 6 month period, each dot represents an order quantity for a specific
product. ∆t is the time slot within which orders are combined.
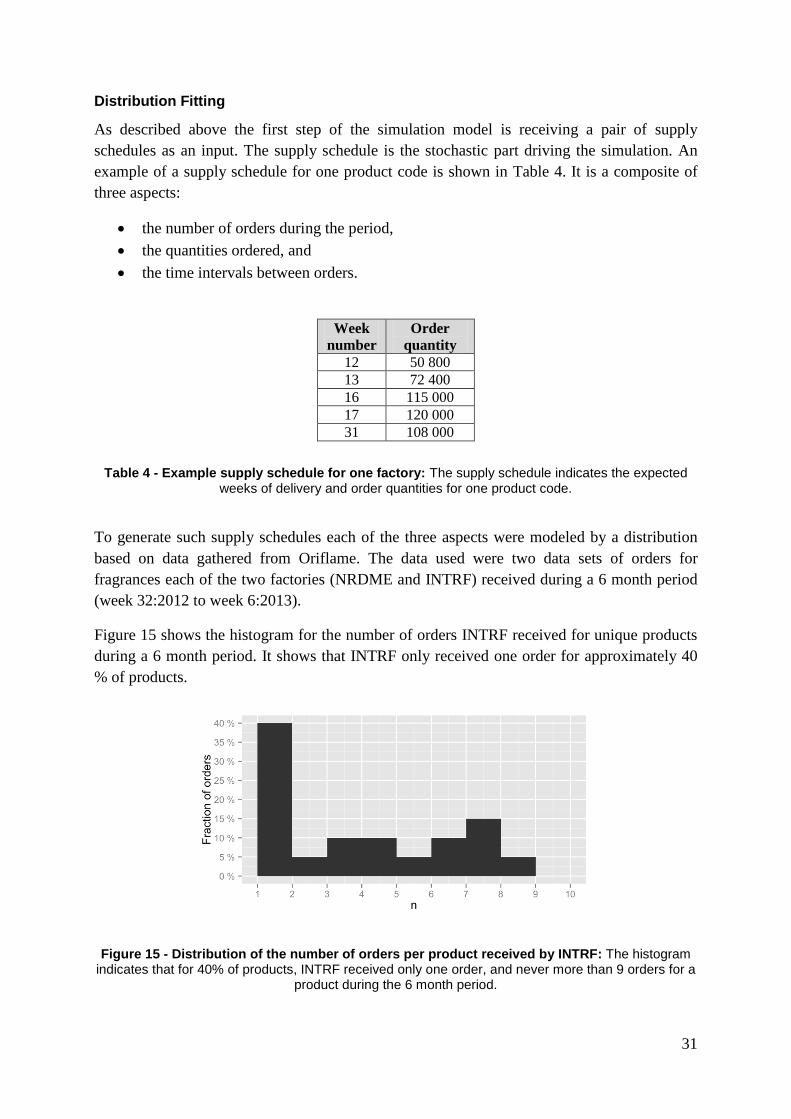
31
Distribution Fitting
As described above the first step of the simulation model is receiving a pair of supply
schedules as an input. The supply schedule is the stochastic part driving the simulation. An
example of a supply schedule for one product code is shown in Table 4. It is a composite of
three aspects:
the number of orders during the period,
the quantities ordered, and
the time intervals between orders.
Week
number
Order
quantity
12 50 800
13 72 400
16 115 000
17 120 000
31 108 000
Table 4 - Example supply schedule for one factory: The supply schedule indicates the expected weeks of delivery and order quantities for one product code.
To generate such supply schedules each of the three aspects were modeled by a distribution
based on data gathered from Oriflame. The data used were two data sets of orders for
fragrances each of the two factories (NRDME and INTRF) received during a 6 month period
(week 32:2012 to week 6:2013).
Figure 15 shows the histogram for the number of orders INTRF received for unique products
during a 6 month period. It shows that INTRF only received one order for approximately 40
% of products.
Figure 15 - Distribution of the number of orders per product received by INTRF: The histogram indicates that for 40% of products, INTRF received only one order, and never more than 9 orders for a
product during the 6 month period.
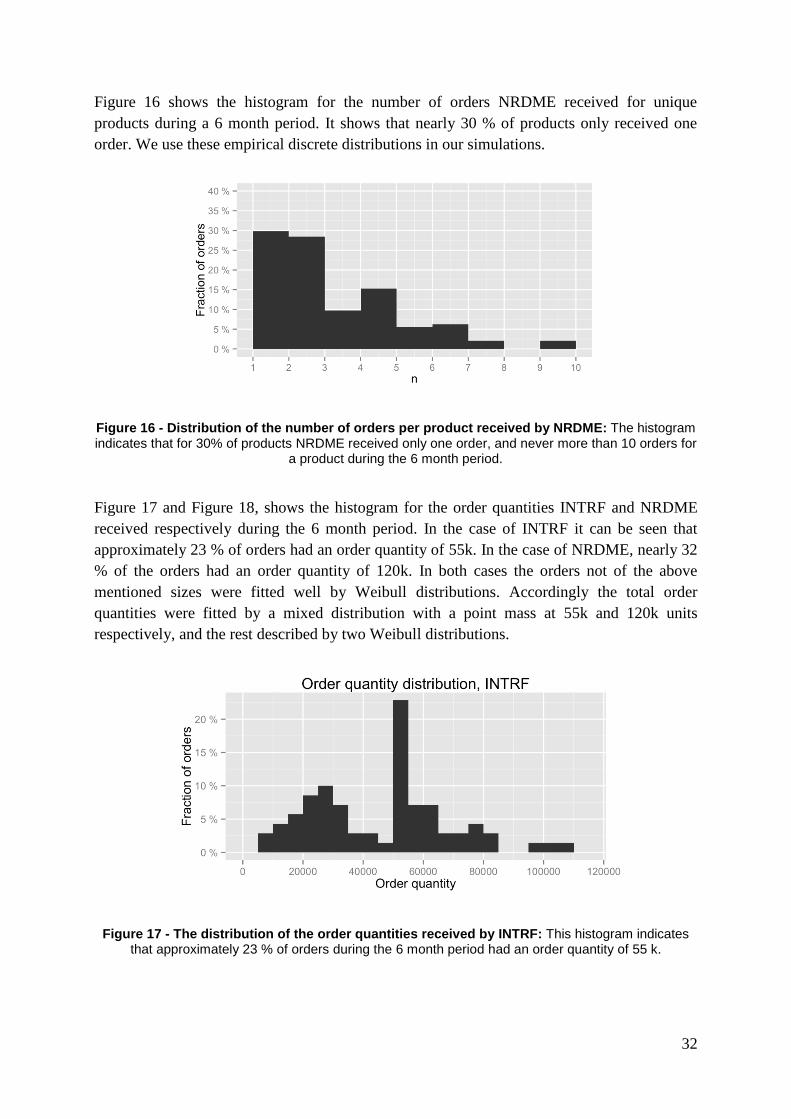
32
Figure 16 shows the histogram for the number of orders NRDME received for unique
products during a 6 month period. It shows that nearly 30 % of products only received one
order. We use these empirical discrete distributions in our simulations.
Figure 16 - Distribution of the number of orders per product received by NRDME: The histogram indicates that for 30% of products NRDME received only one order, and never more than 10 orders for
a product during the 6 month period.
Figure 17 and Figure 18, shows the histogram for the order quantities INTRF and NRDME
received respectively during the 6 month period. In the case of INTRF it can be seen that
approximately 23 % of orders had an order quantity of 55k. In the case of NRDME, nearly 32
% of the orders had an order quantity of 120k. In both cases the orders not of the above
mentioned sizes were fitted well by Weibull distributions. Accordingly the total order
quantities were fitted by a mixed distribution with a point mass at 55k and 120k units
respectively, and the rest described by two Weibull distributions.
Figure 17 - The distribution of the order quantities received by INTRF: This histogram indicates that approximately 23 % of orders during the 6 month period had an order quantity of 55 k.
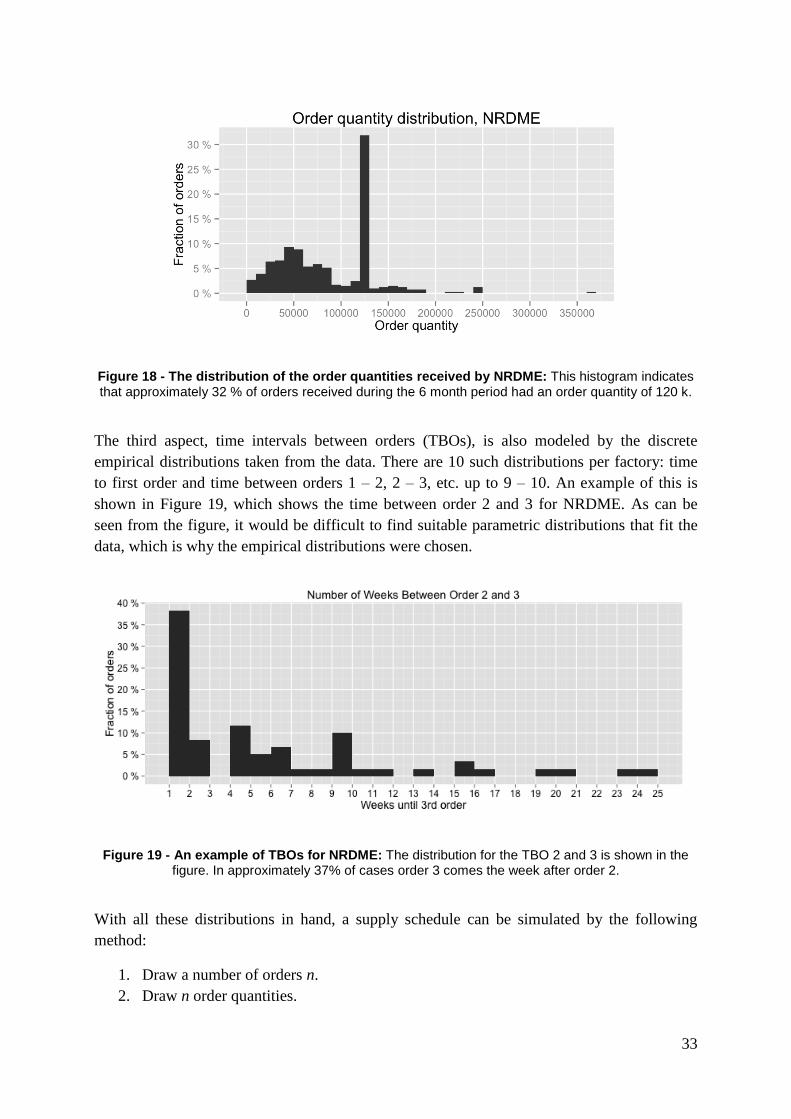
33
Figure 18 - The distribution of the order quantities received by NRDME: This histogram indicates that approximately 32 % of orders received during the 6 month period had an order quantity of 120 k.
The third aspect, time intervals between orders (TBOs), is also modeled by the discrete
empirical distributions taken from the data. There are 10 such distributions per factory: time
to first order and time between orders 1 – 2, 2 – 3, etc. up to 9 – 10. An example of this is
shown in Figure 19, which shows the time between order 2 and 3 for NRDME. As can be
seen from the figure, it would be difficult to find suitable parametric distributions that fit the
data, which is why the empirical distributions were chosen.
Figure 19 - An example of TBOs for NRDME: The distribution for the TBO 2 and 3 is shown in the figure. In approximately 37% of cases order 3 comes the week after order 2.
With all these distributions in hand, a supply schedule can be simulated by the following
method:
1. Draw a number of orders n.
2. Draw n order quantities.
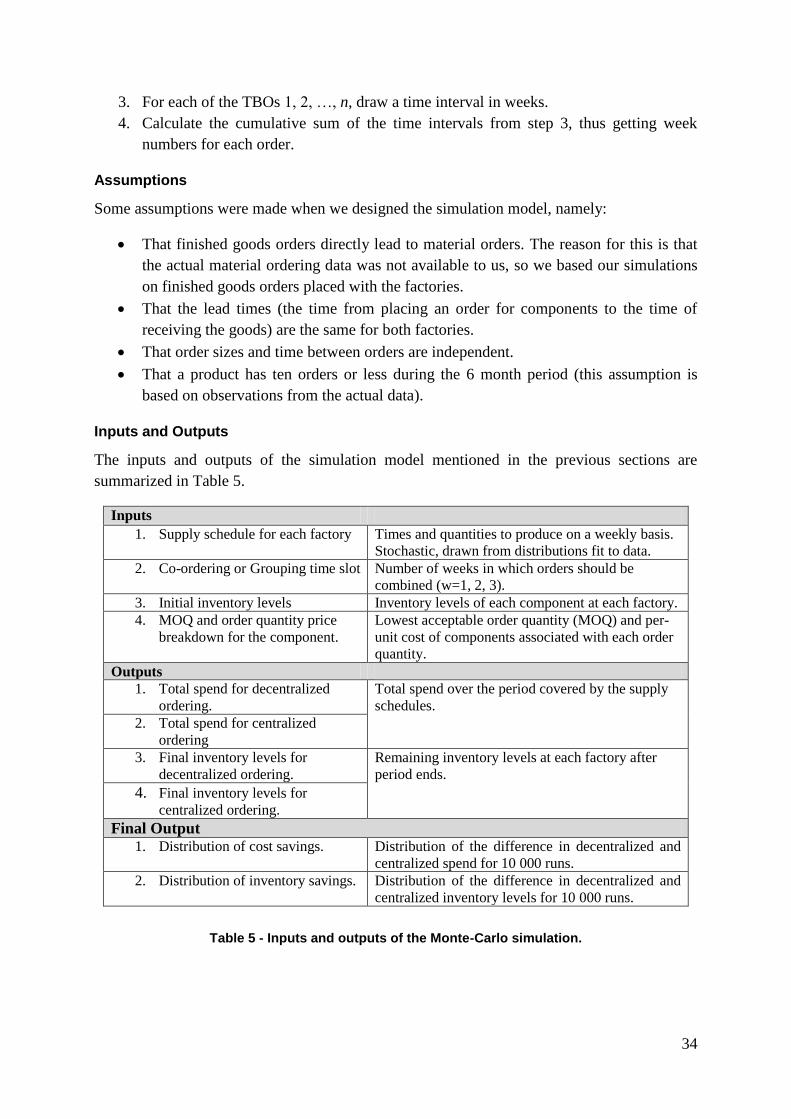
34
3. For each of the TBOs 1, 2, …, n, draw a time interval in weeks.
4. Calculate the cumulative sum of the time intervals from step 3, thus getting week
numbers for each order.
Assumptions
Some assumptions were made when we designed the simulation model, namely:
That finished goods orders directly lead to material orders. The reason for this is that
the actual material ordering data was not available to us, so we based our simulations
on finished goods orders placed with the factories.
That the lead times (the time from placing an order for components to the time of
receiving the goods) are the same for both factories.
That order sizes and time between orders are independent.
That a product has ten orders or less during the 6 month period (this assumption is
based on observations from the actual data).
Inputs and Outputs
The inputs and outputs of the simulation model mentioned in the previous sections are
summarized in Table 5.
Inputs 1. Supply schedule for each factory Times and quantities to produce on a weekly basis.
Stochastic, drawn from distributions fit to data.
2. Co-ordering or Grouping time slot Number of weeks in which orders should be
combined (w=1, 2, 3).
3. Initial inventory levels Inventory levels of each component at each factory.
4. MOQ and order quantity price
breakdown for the component.
Lowest acceptable order quantity (MOQ) and per-
unit cost of components associated with each order
quantity.
Outputs
1. Total spend for decentralized
ordering.
Total spend over the period covered by the supply
schedules.
2. Total spend for centralized
ordering
3. Final inventory levels for
decentralized ordering.
Remaining inventory levels at each factory after
period ends.
4. Final inventory levels for
centralized ordering.
Final Output 1. Distribution of cost savings. Distribution of the difference in decentralized and
centralized spend for 10 000 runs.
2. Distribution of inventory savings. Distribution of the difference in decentralized and
centralized inventory levels for 10 000 runs.
Table 5 - Inputs and outputs of the Monte-Carlo simulation.
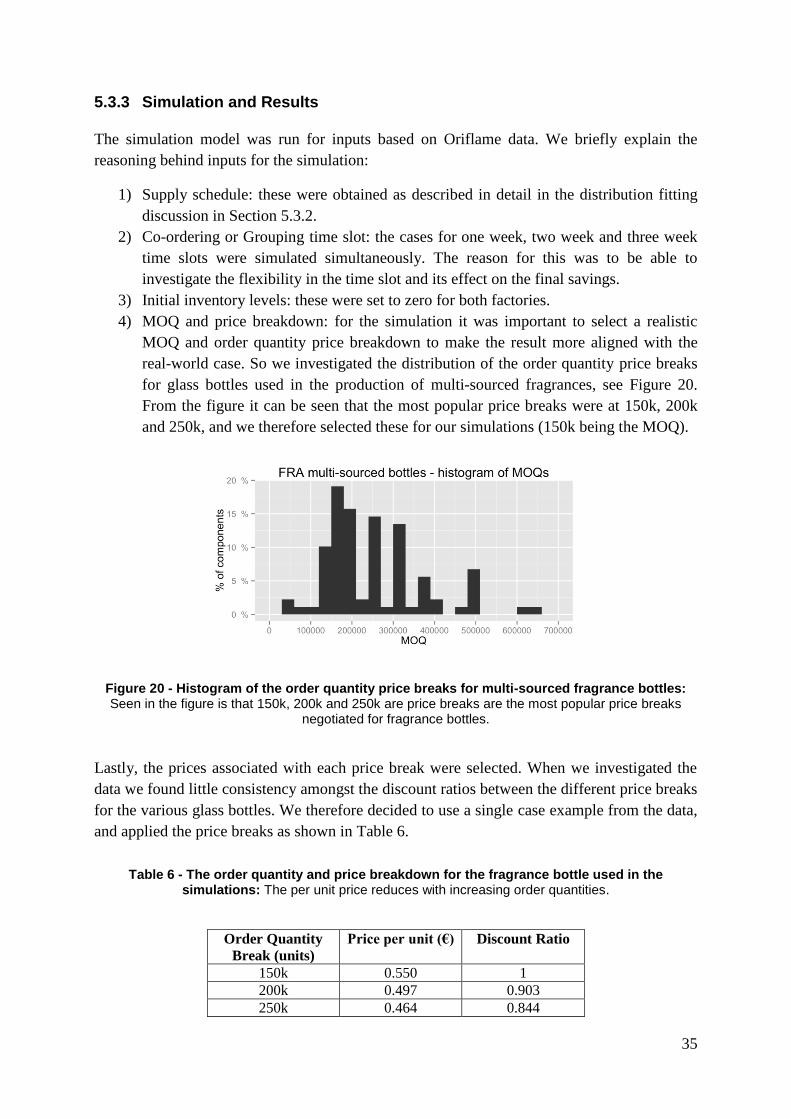
35
5.3.3 Simulation and Results
The simulation model was run for inputs based on Oriflame data. We briefly explain the
reasoning behind inputs for the simulation:
1) Supply schedule: these were obtained as described in detail in the distribution fitting
discussion in Section 5.3.2.
2) Co-ordering or Grouping time slot: the cases for one week, two week and three week
time slots were simulated simultaneously. The reason for this was to be able to
investigate the flexibility in the time slot and its effect on the final savings.
3) Initial inventory levels: these were set to zero for both factories.
4) MOQ and price breakdown: for the simulation it was important to select a realistic
MOQ and order quantity price breakdown to make the result more aligned with the
real-world case. So we investigated the distribution of the order quantity price breaks
for glass bottles used in the production of multi-sourced fragrances, see Figure 20.
From the figure it can be seen that the most popular price breaks were at 150k, 200k
and 250k, and we therefore selected these for our simulations (150k being the MOQ).
Figure 20 - Histogram of the order quantity price breaks for multi-sourced fragrance bottles: Seen in the figure is that 150k, 200k and 250k are price breaks are the most popular price breaks
negotiated for fragrance bottles.
Lastly, the prices associated with each price break were selected. When we investigated the
data we found little consistency amongst the discount ratios between the different price breaks
for the various glass bottles. We therefore decided to use a single case example from the data,
and applied the price breaks as shown in Table 6.
Table 6 - The order quantity and price breakdown for the fragrance bottle used in the simulations: The per unit price reduces with increasing order quantities.
Order Quantity
Break (units)
Price per unit (€) Discount Ratio
150k 0.550 1
200k 0.497 0.903
250k 0.464 0.844
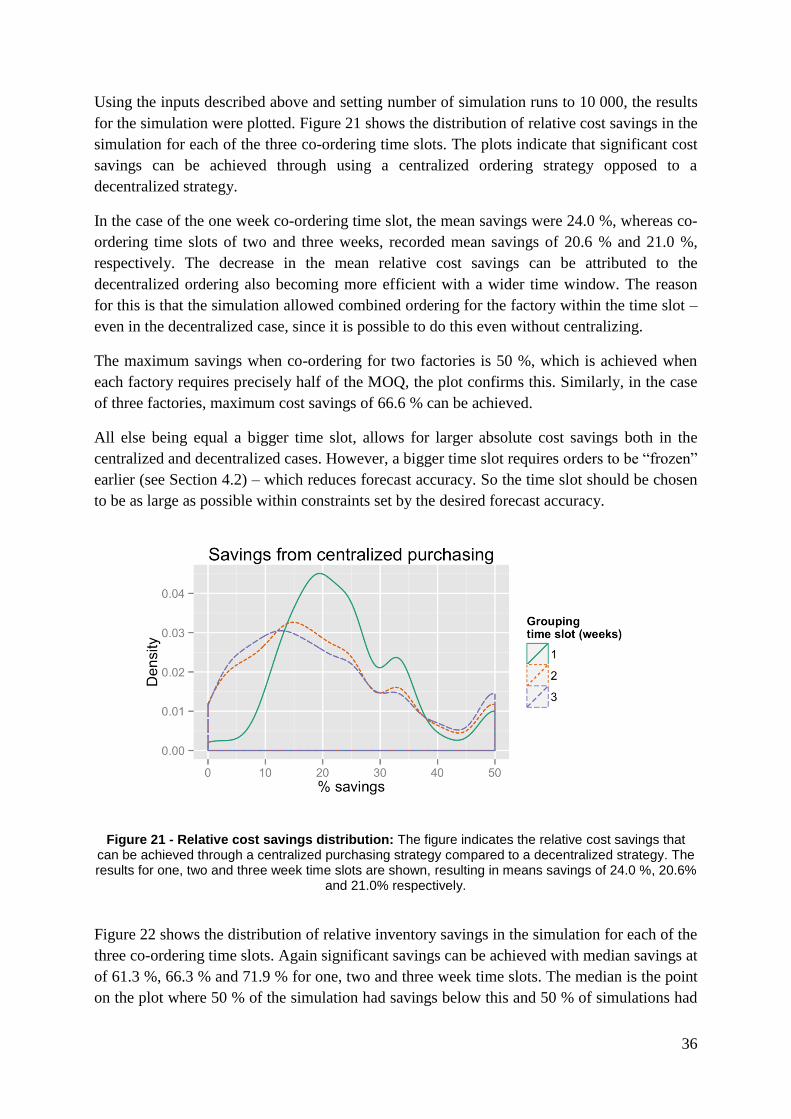
36
Using the inputs described above and setting number of simulation runs to 10 000, the results
for the simulation were plotted. Figure 21 shows the distribution of relative cost savings in the
simulation for each of the three co-ordering time slots. The plots indicate that significant cost
savings can be achieved through using a centralized ordering strategy opposed to a
decentralized strategy.
In the case of the one week co-ordering time slot, the mean savings were 24.0 %, whereas co-
ordering time slots of two and three weeks, recorded mean savings of 20.6 % and 21.0 %,
respectively. The decrease in the mean relative cost savings can be attributed to the
decentralized ordering also becoming more efficient with a wider time window. The reason
for this is that the simulation allowed combined ordering for the factory within the time slot –
even in the decentralized case, since it is possible to do this even without centralizing.
The maximum savings when co-ordering for two factories is 50 %, which is achieved when
each factory requires precisely half of the MOQ, the plot confirms this. Similarly, in the case
of three factories, maximum cost savings of 66.6 % can be achieved.
All else being equal a bigger time slot, allows for larger absolute cost savings both in the
centralized and decentralized cases. However, a bigger time slot requires orders to be “frozen”
earlier (see Section 4.2) – which reduces forecast accuracy. So the time slot should be chosen
to be as large as possible within constraints set by the desired forecast accuracy.
Figure 21 - Relative cost savings distribution: The figure indicates the relative cost savings that can be achieved through a centralized purchasing strategy compared to a decentralized strategy. The results for one, two and three week time slots are shown, resulting in means savings of 24.0 %, 20.6%
and 21.0% respectively.
Figure 22 shows the distribution of relative inventory savings in the simulation for each of the
three co-ordering time slots. Again significant savings can be achieved with median savings at
of 61.3 %, 66.3 % and 71.9 % for one, two and three week time slots. The median is the point
on the plot where 50 % of the simulation had savings below this and 50 % of simulations had
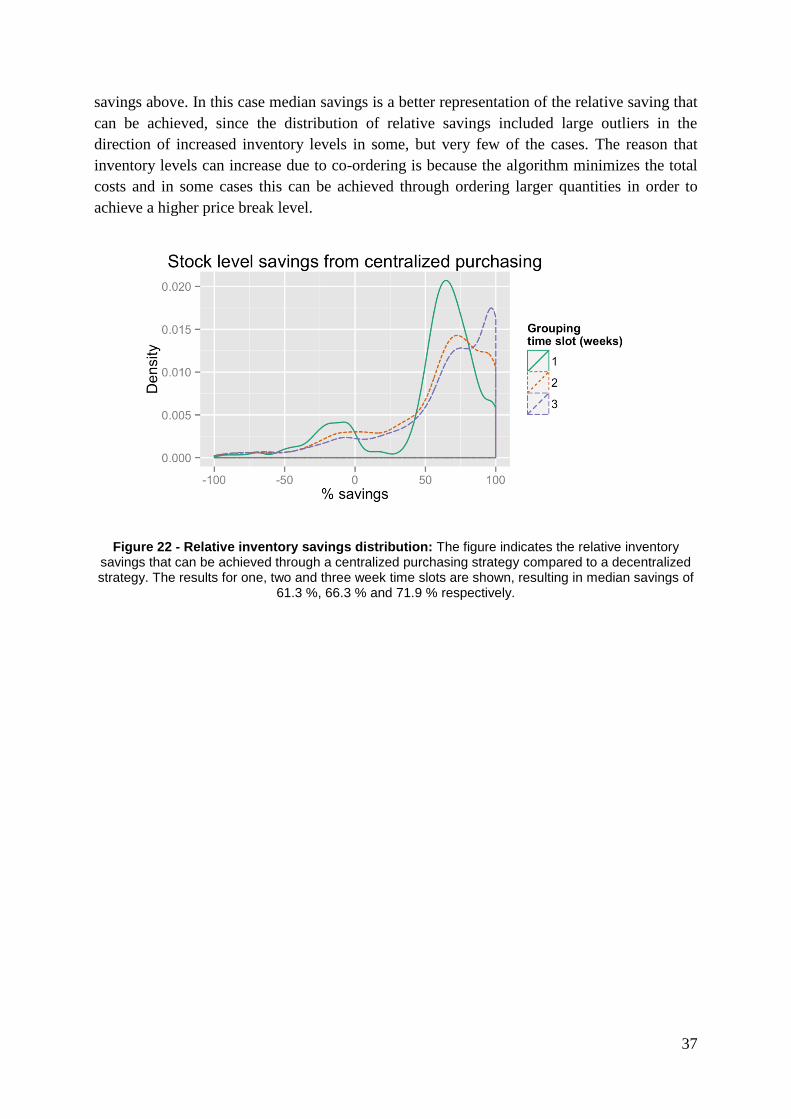
37
savings above. In this case median savings is a better representation of the relative saving that
can be achieved, since the distribution of relative savings included large outliers in the
direction of increased inventory levels in some, but very few of the cases. The reason that
inventory levels can increase due to co-ordering is because the algorithm minimizes the total
costs and in some cases this can be achieved through ordering larger quantities in order to
achieve a higher price break level.
Figure 22 - Relative inventory savings distribution: The figure indicates the relative inventory savings that can be achieved through a centralized purchasing strategy compared to a decentralized strategy. The results for one, two and three week time slots are shown, resulting in median savings of
61.3 %, 66.3 % and 71.9 % respectively.
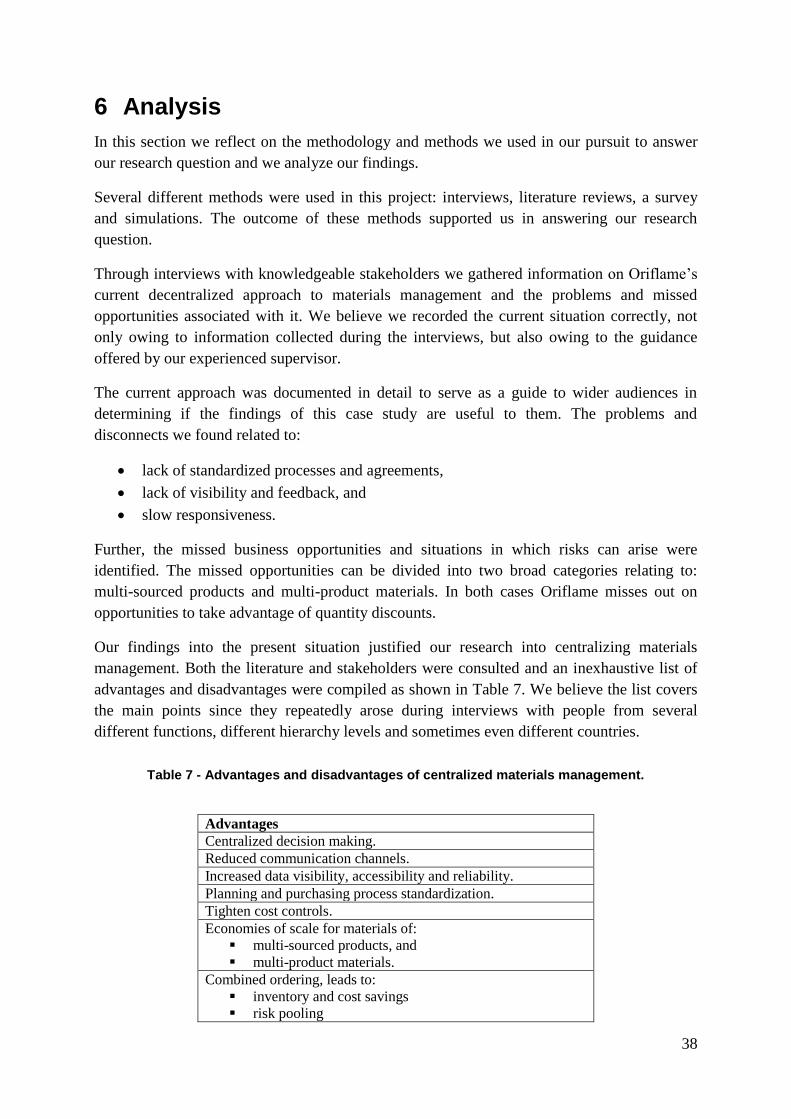
38
6 Analysis
In this section we reflect on the methodology and methods we used in our pursuit to answer
our research question and we analyze our findings.
Several different methods were used in this project: interviews, literature reviews, a survey
and simulations. The outcome of these methods supported us in answering our research
question.
Through interviews with knowledgeable stakeholders we gathered information on Oriflame’s
current decentralized approach to materials management and the problems and missed
opportunities associated with it. We believe we recorded the current situation correctly, not
only owing to information collected during the interviews, but also owing to the guidance
offered by our experienced supervisor.
The current approach was documented in detail to serve as a guide to wider audiences in
determining if the findings of this case study are useful to them. The problems and
disconnects we found related to:
lack of standardized processes and agreements,
lack of visibility and feedback, and
slow responsiveness.
Further, the missed business opportunities and situations in which risks can arise were
identified. The missed opportunities can be divided into two broad categories relating to:
multi-sourced products and multi-product materials. In both cases Oriflame misses out on
opportunities to take advantage of quantity discounts.
Our findings into the present situation justified our research into centralizing materials
management. Both the literature and stakeholders were consulted and an inexhaustive list of
advantages and disadvantages were compiled as shown in Table 7. We believe the list covers
the main points since they repeatedly arose during interviews with people from several
different functions, different hierarchy levels and sometimes even different countries.
Table 7 - Advantages and disadvantages of centralized materials management.
Advantages
Centralized decision making.
Reduced communication channels.
Increased data visibility, accessibility and reliability.
Planning and purchasing process standardization.
Tighten cost controls.
Economies of scale for materials of:
multi-sourced products, and
multi-product materials.
Combined ordering, leads to:
inventory and cost savings
risk pooling
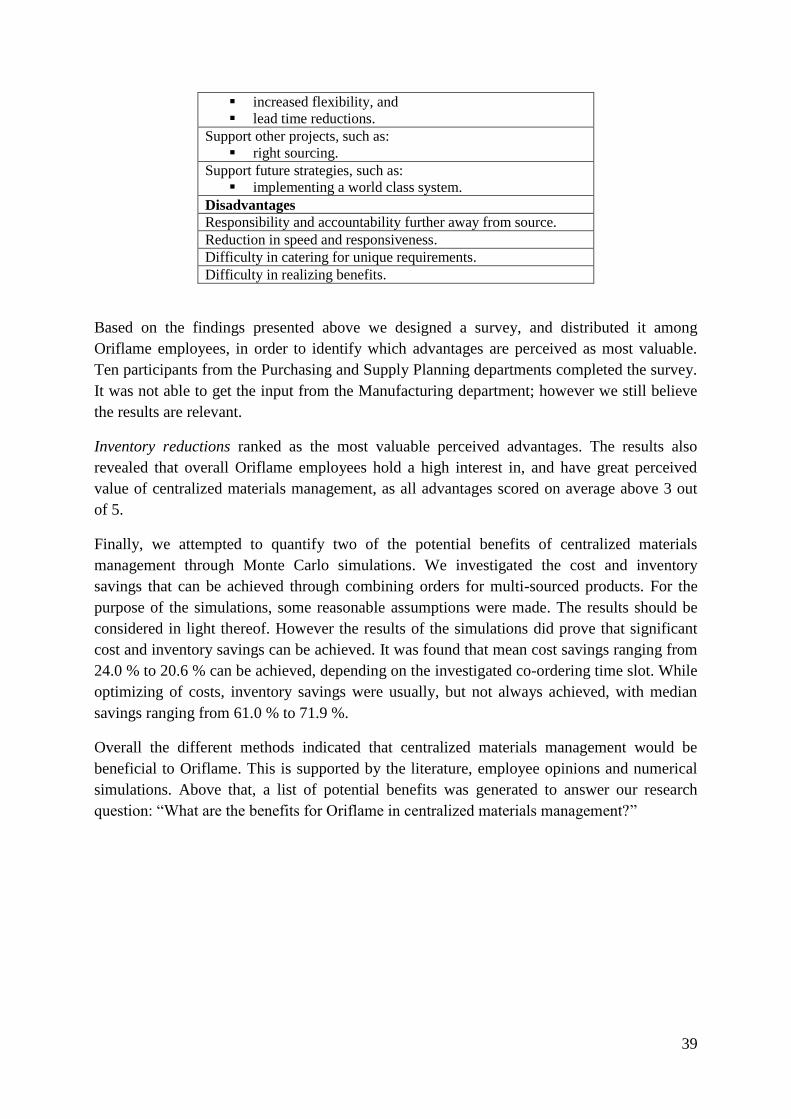
39
increased flexibility, and
lead time reductions.
Support other projects, such as:
right sourcing.
Support future strategies, such as:
implementing a world class system.
Disadvantages
Responsibility and accountability further away from source.
Reduction in speed and responsiveness.
Difficulty in catering for unique requirements.
Difficulty in realizing benefits.
Based on the findings presented above we designed a survey, and distributed it among
Oriflame employees, in order to identify which advantages are perceived as most valuable.
Ten participants from the Purchasing and Supply Planning departments completed the survey.
It was not able to get the input from the Manufacturing department; however we still believe
the results are relevant.
Inventory reductions ranked as the most valuable perceived advantages. The results also
revealed that overall Oriflame employees hold a high interest in, and have great perceived
value of centralized materials management, as all advantages scored on average above 3 out
of 5.
Finally, we attempted to quantify two of the potential benefits of centralized materials
management through Monte Carlo simulations. We investigated the cost and inventory
savings that can be achieved through combining orders for multi-sourced products. For the
purpose of the simulations, some reasonable assumptions were made. The results should be
considered in light thereof. However the results of the simulations did prove that significant
cost and inventory savings can be achieved. It was found that mean cost savings ranging from
24.0 % to 20.6 % can be achieved, depending on the investigated co-ordering time slot. While
optimizing of costs, inventory savings were usually, but not always achieved, with median
savings ranging from 61.0 % to 71.9 %.
Overall the different methods indicated that centralized materials management would be
beneficial to Oriflame. This is supported by the literature, employee opinions and numerical
simulations. Above that, a list of potential benefits was generated to answer our research
question: “What are the benefits for Oriflame in centralized materials management?”
40
7 Conclusions
The goal of this case study was to investigate what are the benefits for Oriflame in centralized
materials management. Through interviewing key stakeholders and consulting the literature
we generated a list of potential benefits. A survey, distributed among Oriflame employees,
revealed that they perceive inventory reduction as the highest valued benefit that can be
achieved through centralization. Based on the overall results of the survey we concluded that
Oriflame employees hold a high interest in, and have great perceived value of centralized
materials management.
The eventual aim was to generate knowledge on the subject of centralized materials
management and supply management with insight into the centralization of materials
management decision. We therefore not only investigated the advantages and disadvantages
of centralization, but also the problems, risks and missed business opportunities of Oriflame’s
current decentralized approach.
Monte Carlo simulations were performed to quantify the cost and inventory savings of a
centralized materials planning and ordering strategy for multi-sourced fragrances. It was
found that mean cost savings ranging from 24.0 % to 20.6 % can be achieved, depending on
the co-ordering time slot. While optimizing of costs, inventory savings were usually, but not
always achieved, with median savings of 61.0 % to 71.9 %.
Overall this study concluded that that centralized materials management would be beneficial
to Oriflame and a list of possible benefits was presented.
41
8 Recommendations
Based on our study the following recommendations can be made to Oriflame. Centralized
materials management is the key to achieving better material and information flow in the
upstream supply chain. Without centralization it is unlikely that major, long-term, sustainable
improvements in materials planning and purchasing can be achieved. Today there are many
internal stakeholders that foresee great value in centralization.
The interviews however brought to light several problems and disconnects, such as non-
standardized processes, which can be addressed immediately, without centralization, and lead
to improvements in the current management of materials.
In our study only the benefits of combined ordering for multi-sourced fragrance products were
investigated in a quantitative manner. This could be followed up with a broader investigation
over the entire product portfolio to gain insights into the overall cost and inventory savings
that can be achieved.
Lastly, we recommend that Oriflame should conduct a proper investigation into the
implementation of centralized materials management considering both organizational
restructure and systems implementation.
42
9 Bibliography
Akkermans, H. A., Bogerd, P., Yucesan, E. & van Wassenhove, L. N., 2003. The impact of
ERP on supply chain management: Exploratory findings from a European Delphi study.
EuropeanJournal for Operational Research, Volume 146, p. 284–301.
Arnold, U., 1999. Organization of global sourcing: ways towards an optimal degree.
European Journal of Purchasing & Supply Management, Volume 5, pp. 167-174.
Asaolu, T. O., Agorzie, C. J. & Unam, J. M., 2012. Materials Management: An Effective Tool
for Optimizing Profitability in the Nigerian Food and Beverage Manufacturing Industry.
Journal of Emerging Trends in Economics and Management Sciences, 3(1), pp. 25-31.
Benton, W. C. & Shin, H., 1998. Manufacturing planning and control: The evolution of MRP
and JIT. European Journal of Operations Research, Volume 110, pp. 411-440.
Bhat, K. S., 2009. Materials Management. 4 ed. Mumbai: Himalaya Publishing House.
Bingi, P., Godla, J. K. & Sharma, M. K., 1999. Critical Issues Affecting ERP Implmentation.
Informtion Systems Management, 16(3), pp. 7-14.
Chang, J., Chou, D. C. & Yen, D. C., 2002. A synergic analysis for Web-based enterprise.
Computer Standards and Interfaces, Volume 24, pp. 337-346.
Direct Selling News, 2013. Direct Selling News. [Online]
Available at:
http://directsellingnews.com/index.php/view/2012_dsn_global_100_list#.UYliyLVTCr0
[Accessed 08 05 2013].
Eisenhardt, K. M., 1989. Building Theories from Case Study Research.. Academy of
Management Review, 14(4), pp. 532-550.
Gopalakrishnan, P., 2005. Handbook of Materials Management. 1 ed. New Dehli: Prentice-
Hall of India Private Limited.
Gopalakrishnan, P. & Sundaresan, M., 2006. Materials Management - An Integrated
Approach.. New Dehli: Prentice-Hall of India.
Hastings, N. A. J., Marshall, P. & Willis, R. J., 1982. Schedule Based M.R.P.: An Integrated
Approach to Production Scheduling and Material Requirements Planning. The Journal of the
Operational Research Society, 33(11), pp. 1021-1029.
IBISWorld, 2013. Direct Selling Companies Market Research Report | NAICS 45439 |, s.l.:
IBISWorld.
Karijalainen, K., 2011. Estimating the cost effects of purchasing centralization—Empirical
evidence from framework agreements in the public sector. The Journal of Purchasing and
Supply Management, Volume 17, pp. 87-97.
43
Lee, H. L. & Ng, S. M., 1998. Preface to Global Supply Chain and Technology Management.
Global supply and Technology Manageemnt, POMS series in technology and operations
management, Volume 1, pp. 1-3.
Malhotra, M. K. & Grover, V., 1998. An Assessment of Survey Research in PM: from
constructs to theory.. Journal of Operations Management, 16(117), pp. 407-425.
Matthyssens, P. & Faes, W., 1996. Purchasing Coordination in Multiplant companies.
University of Karlsruhe, IMP Conference (12th): Interaction, Relationships And Networks..
Morgan, J. M. & Like, J. K., 2006. Book Review: The Toyota Product Development System.
Target Volume, 22(4), pp. 51 - 52.
Munson, C. L., 2007. The appeal of partially centralised purchasing policies. International
Journal Procurement Management, Volume 1, pp. 117-143.
Munson, C. L. & Hu, J., 2010. Incorporating quanity discounts and their inventory impacts
into the centralized purchasing decision. European Journal of Operational Research, Volume
201, pp. 581-592.
Ondiek, G. O., 2009. Assessment of Materials Management in the Kenyan Manufaturing
Firms - Exploratory Survey of Manufacturing Firms based in Nairobi.. Journal of Social
Sciences, 22(8).
Oriflame , 2013. Oriflame - Global Supply. [Online]
Available at: http://corporate.oriflame.com/About_Oriflame/Global-Operations/Global-
Supply/
[Accessed 09 05 2013].
Oriflame Cosmetics, 2012. Oriflame - Annual Report, s.l.: Oriflame Cosmetics.
Petterson, R. A. & Wotruba, T. R., 1996. What is direct selling? - Definition, Perspectives and
Research Agenda. Journal of Personal Selling and Sales Management, 16(4), pp. 1 - 16.
R Foundation for Statistical Computing, 2005. The R Project for Statistical Computing.
[Online]
Available at: http://www.R-project.org <http://www.r-project.org/
[Accessed 20 May 2013].
Ross, J. W. & Vitale, M. R., 2000. The ERP Revolution: Surviving vs. Thriving. Information
Systems Frontiers, 2(2), pp. 233-241.
Rozemeijer, F., 2000. How to manage corporate purchasing synergy in a decentralised.
European Journal of Purchasing & Supply Management, Volume 6, pp. 5-12.
Rummler, G. A. & Brache, A. P., 1995. Improving Performance: How to Manage the White
Space on the Organization Chart. 2nd ed. San Francisco: Jossey-Bass.
44
Sadiwala , C. M. & Sadiwala, R. C., 2007. Materials and Financial Management. 1 ed. New
Dehli: New Age International Pvt Ltd Publishers.
Siriginidi, S. R., 2000. Enterprise Resource Planning in Reengineering Business.. Business
Process Management Journal, 6(5), pp. 376-391.
Stadtler, H. & Kilger, C., 2005. Supply Chain Management and Advanced Planning:
Concepts, Models, Software and Case Studies. 3 ed. Berlin: Springer.
WFDSA, 2013. What is direct selling?. [Online]
Available at: http://www.wfdsa.org/about_dir_sell/index.cfm?fa=whatisds
[Accessed 08 05 2013].
Wickham, H., 2009. ggplot2: elegant graphics for data analysis.. New York: Springer.
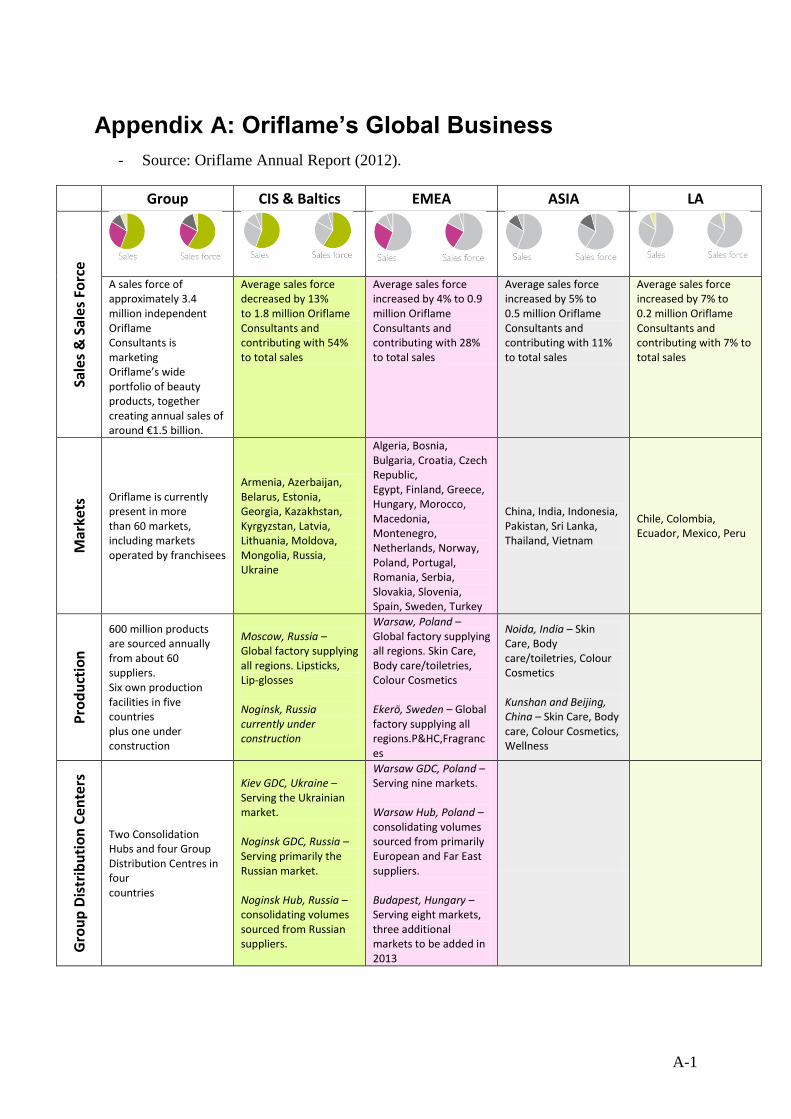
A-1
Appendix A: Oriflame’s Global Business
- Source: Oriflame Annual Report (2012).
Group CIS & Baltics EMEA ASIA LA
Sale
s &
Sal
es F
orc
e
A sales force of approximately 3.4 million independent Oriflame Consultants is marketing Oriflame’s wide portfolio of beauty products, together creating annual sales of around €1.5 billion.
Average sales force decreased by 13% to 1.8 million Oriflame Consultants and contributing with 54% to total sales
Average sales force increased by 4% to 0.9 million Oriflame Consultants and contributing with 28% to total sales
Average sales force increased by 5% to 0.5 million Oriflame Consultants and contributing with 11% to total sales
Average sales force increased by 7% to 0.2 million Oriflame Consultants and contributing with 7% to total sales
Mar
kets
Oriflame is currently present in more than 60 markets, including markets operated by franchisees
Armenia, Azerbaijan, Belarus, Estonia, Georgia, Kazakhstan, Kyrgyzstan, Latvia, Lithuania, Moldova, Mongolia, Russia, Ukraine
Algeria, Bosnia, Bulgaria, Croatia, Czech Republic, Egypt, Finland, Greece, Hungary, Morocco, Macedonia, Montenegro, Netherlands, Norway, Poland, Portugal, Romania, Serbia, Slovakia, Slovenia, Spain, Sweden, Turkey
China, India, Indonesia, Pakistan, Sri Lanka, Thailand, Vietnam
Chile, Colombia, Ecuador, Mexico, Peru
Pro
du
ctio
n
600 million products are sourced annually from about 60 suppliers. Six own production facilities in five countries plus one under construction
Moscow, Russia – Global factory supplying all regions. Lipsticks, Lip-glosses Noginsk, Russia currently under construction
Warsaw, Poland – Global factory supplying all regions. Skin Care, Body care/toiletries, Colour Cosmetics Ekerö, Sweden – Global factory supplying all regions.P&HC,Fragrances
Noida, India – Skin Care, Body care/toiletries, Colour Cosmetics Kunshan and Beijing, China – Skin Care, Body care, Colour Cosmetics, Wellness
Gro
up
Dis
trib
uti
on
Ce
nte
rs
Two Consolidation Hubs and four Group Distribution Centres in four countries
Kiev GDC, Ukraine – Serving the Ukrainian market. Noginsk GDC, Russia – Serving primarily the Russian market. Noginsk Hub, Russia – consolidating volumes sourced from Russian suppliers.
Warsaw GDC, Poland – Serving nine markets. Warsaw Hub, Poland – consolidating volumes sourced from primarily European and Far East suppliers. Budapest, Hungary – Serving eight markets, three additional markets to be added in 2013
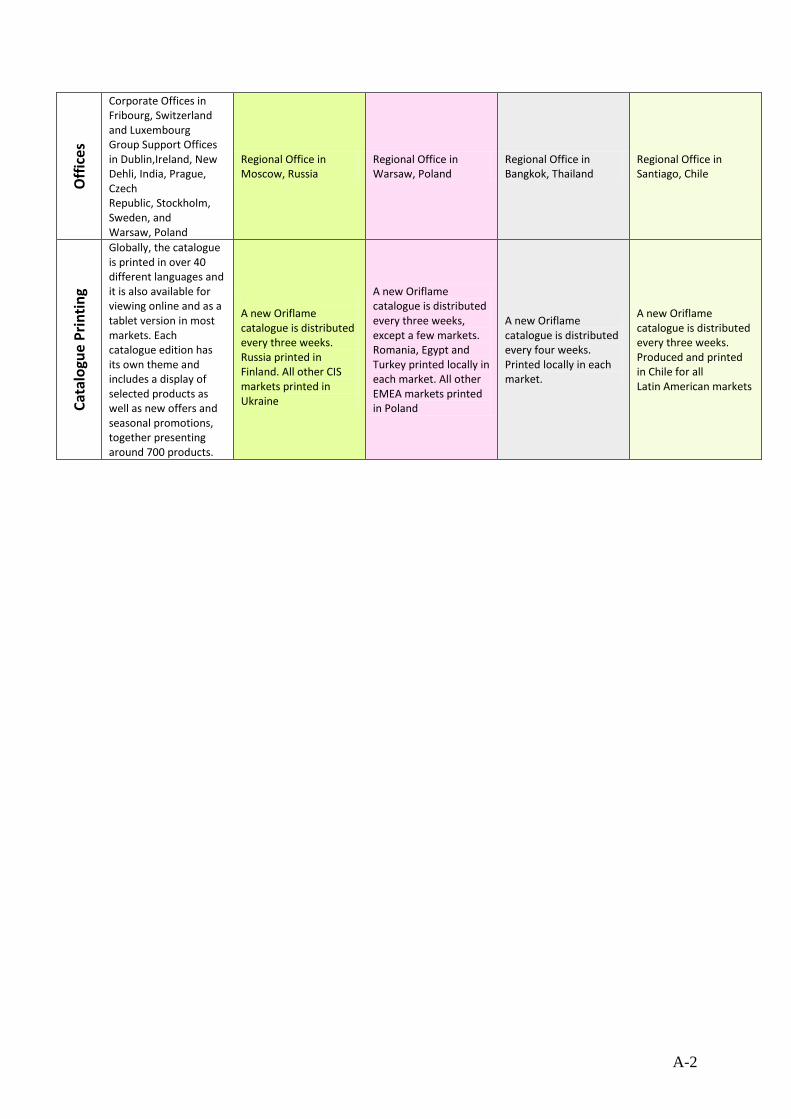
A-2
Off
ice
s
Corporate Offices in Fribourg, Switzerland and Luxembourg Group Support Offices in Dublin,Ireland, New Dehli, India, Prague, Czech Republic, Stockholm, Sweden, and Warsaw, Poland
Regional Office in Moscow, Russia
Regional Office in Warsaw, Poland
Regional Office in Bangkok, Thailand
Regional Office in Santiago, Chile
Cat
alo
gue
Pri
nti
ng
Globally, the catalogue is printed in over 40 different languages and it is also available for viewing online and as a tablet version in most markets. Each catalogue edition has its own theme and includes a display of selected products as well as new offers and seasonal promotions, together presenting around 700 products.
A new Oriflame catalogue is distributed every three weeks. Russia printed in Finland. All other CIS markets printed in Ukraine
A new Oriflame catalogue is distributed every three weeks, except a few markets. Romania, Egypt and Turkey printed locally in each market. All other EMEA markets printed in Poland
A new Oriflame catalogue is distributed every four weeks. Printed locally in each market.
A new Oriflame catalogue is distributed every three weeks. Produced and printed in Chile for all Latin American markets
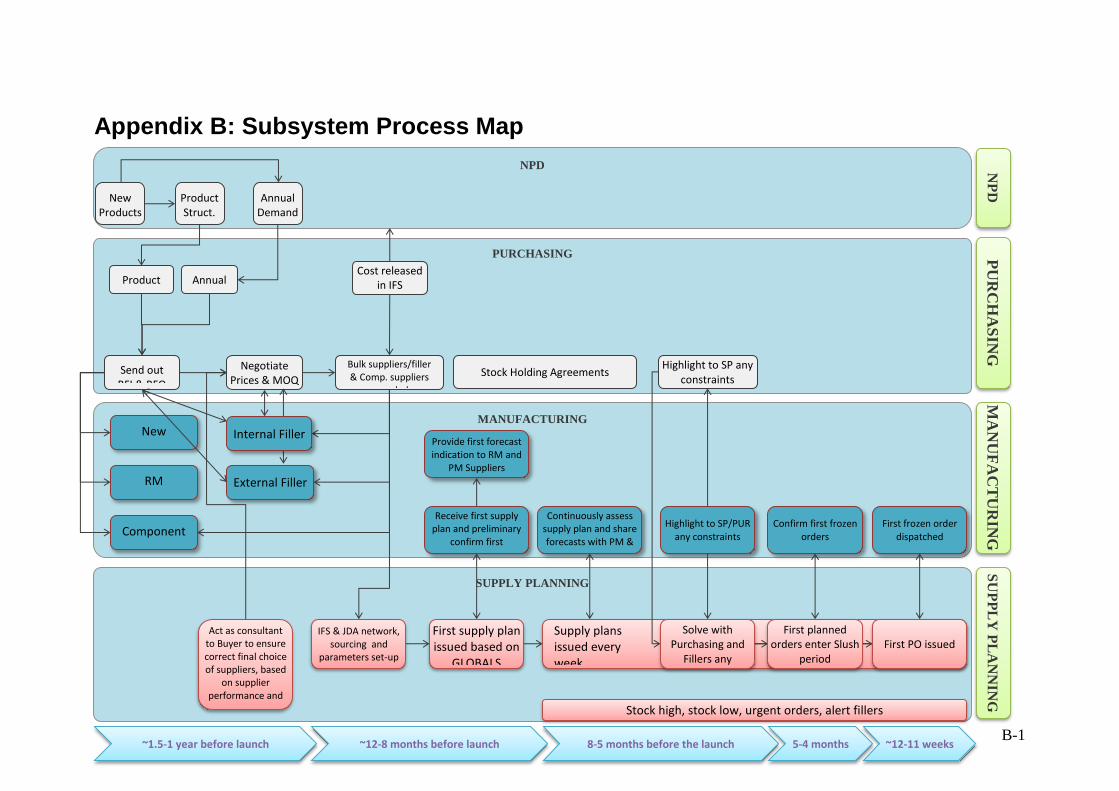
B-1
Appendix B: Subsystem Process Map
NPD
PURCHASING
MANUFACTURING
SUPPLY PLANNING
Send out RFI & RFQ
Product Struct.
Annual Demand
Annual Volume
Product Struct.
New Suppliers
Component Suppliers
RM Suppliers
New Products
External Filler
Cost released in IFS
~1.5-1 year before launch 8-5 months before the launch
Negotiate Prices & MOQ
Bulk suppliers/filler & Comp. suppliers
awarded
Internal Filler
~12-8 months before launch
IFS & JDA network, sourcing and
parameters set-up
First supply plan issued based on
GLOBALS
Act as consultant to Buyer to ensure correct final choice of suppliers, based
on supplier performance and
SP parameters
Receive first supply plan and preliminary
confirm first production week
Provide first forecast indication to RM and
PM Suppliers
Stock Holding Agreements
Highlight to SP/PUR any constraints
Confirm first frozen orders
Highlight to SP any constraints
PU
RC
HA
SIN
G
MA
NU
FA
CT
UR
ING
S
UP
PL
Y P
LA
NN
ING
N
PD
Continuously assess supply plan and share forecasts with PM &
RM suppliers
~12-11 weeks 5-4 months
First frozen order dispatched
Supply plans issued every week
Stock high, stock low, urgent orders, alert fillers
Solve with Purchasing and
Fillers any constraints
First planned orders enter Slush
period First PO issued
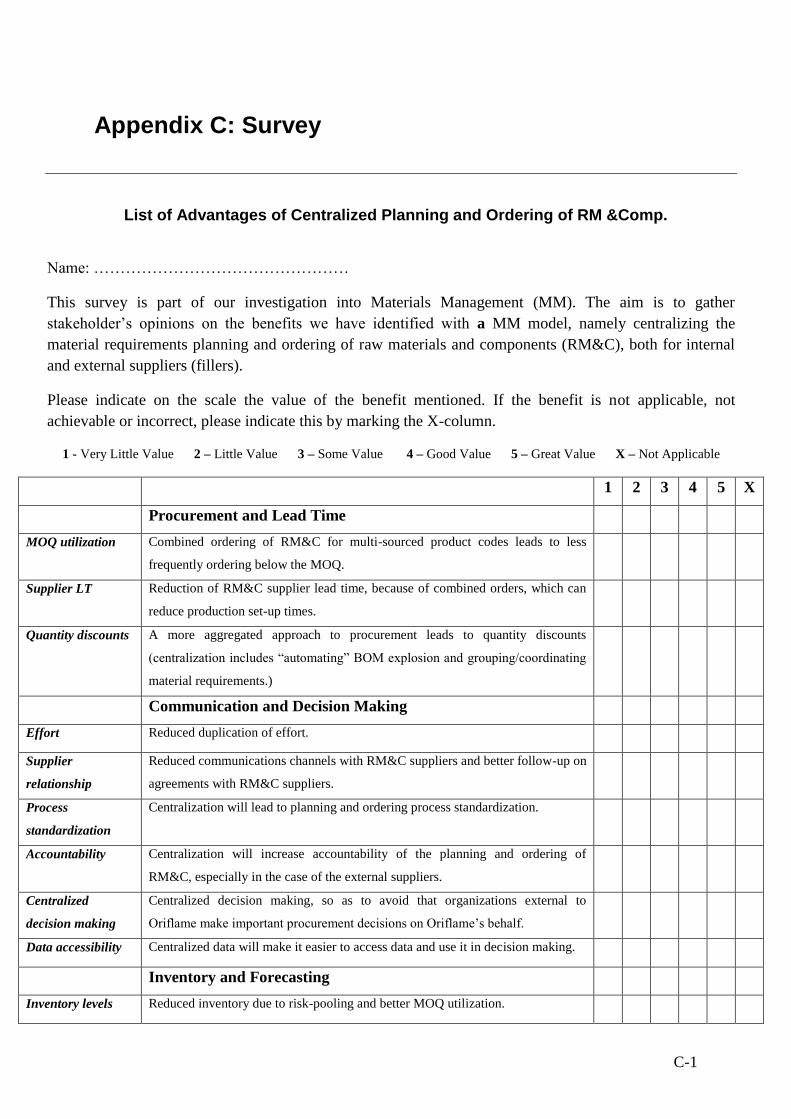
C-1
Appendix C: Survey
List of Advantages of Centralized Planning and Ordering of RM &Comp.
Name: …………………………………………
This survey is part of our investigation into Materials Management (MM). The aim is to gather
stakeholder’s opinions on the benefits we have identified with a MM model, namely centralizing the
material requirements planning and ordering of raw materials and components (RM&C), both for internal
and external suppliers (fillers).
Please indicate on the scale the value of the benefit mentioned. If the benefit is not applicable, not
achievable or incorrect, please indicate this by marking the X-column.
1 - Very Little Value 2 – Little Value 3 – Some Value 4 – Good Value 5 – Great Value X – Not Applicable
1 2 3 4 5 X
Procurement and Lead Time
MOQ utilization Combined ordering of RM&C for multi-sourced product codes leads to less
frequently ordering below the MOQ.
Supplier LT Reduction of RM&C supplier lead time, because of combined orders, which can
reduce production set-up times.
Quantity discounts A more aggregated approach to procurement leads to quantity discounts
(centralization includes “automating” BOM explosion and grouping/coordinating
material requirements.)
Communication and Decision Making
Effort Reduced duplication of effort.
Supplier
relationship
Reduced communications channels with RM&C suppliers and better follow-up on
agreements with RM&C suppliers.
Process
standardization
Centralization will lead to planning and ordering process standardization.
Accountability Centralization will increase accountability of the planning and ordering of
RM&C, especially in the case of the external suppliers.
Centralized
decision making
Centralized decision making, so as to avoid that organizations external to
Oriflame make important procurement decisions on Oriflame’s behalf.
Data accessibility Centralized data will make it easier to access data and use it in decision making.
Inventory and Forecasting
Inventory levels Reduced inventory due to risk-pooling and better MOQ utilization.
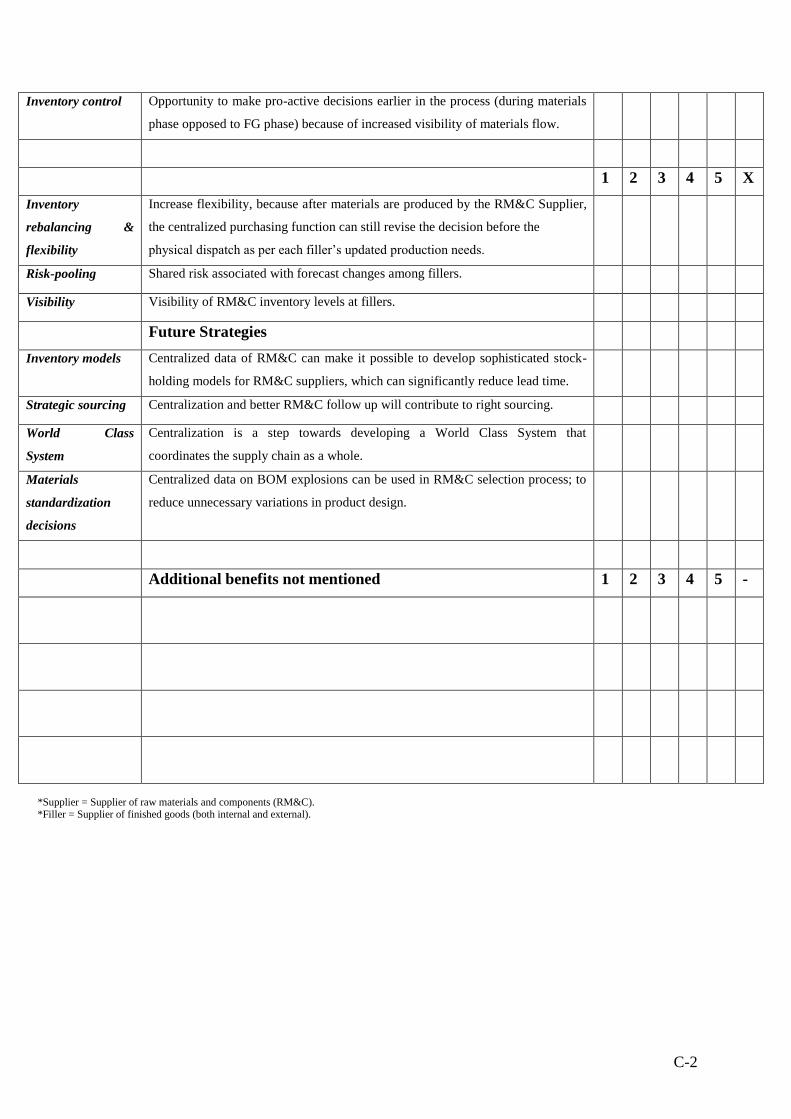
C-2
Inventory control Opportunity to make pro-active decisions earlier in the process (during materials
phase opposed to FG phase) because of increased visibility of materials flow.
1 2 3 4 5 X
Inventory
rebalancing &
flexibility
Increase flexibility, because after materials are produced by the RM&C Supplier,
the centralized purchasing function can still revise the decision before the
physical dispatch as per each filler’s updated production needs.
Risk-pooling Shared risk associated with forecast changes among fillers.
Visibility Visibility of RM&C inventory levels at fillers.
Future Strategies
Inventory models Centralized data of RM&C can make it possible to develop sophisticated stock-
holding models for RM&C suppliers, which can significantly reduce lead time.
Strategic sourcing Centralization and better RM&C follow up will contribute to right sourcing.
World Class
System
Centralization is a step towards developing a World Class System that
coordinates the supply chain as a whole.
Materials
standardization
decisions
Centralized data on BOM explosions can be used in RM&C selection process; to
reduce unnecessary variations in product design.
Additional benefits not mentioned 1 2 3 4 5 -
*Supplier = Supplier of raw materials and components (RM&C). *Filler = Supplier of finished goods (both internal and external).
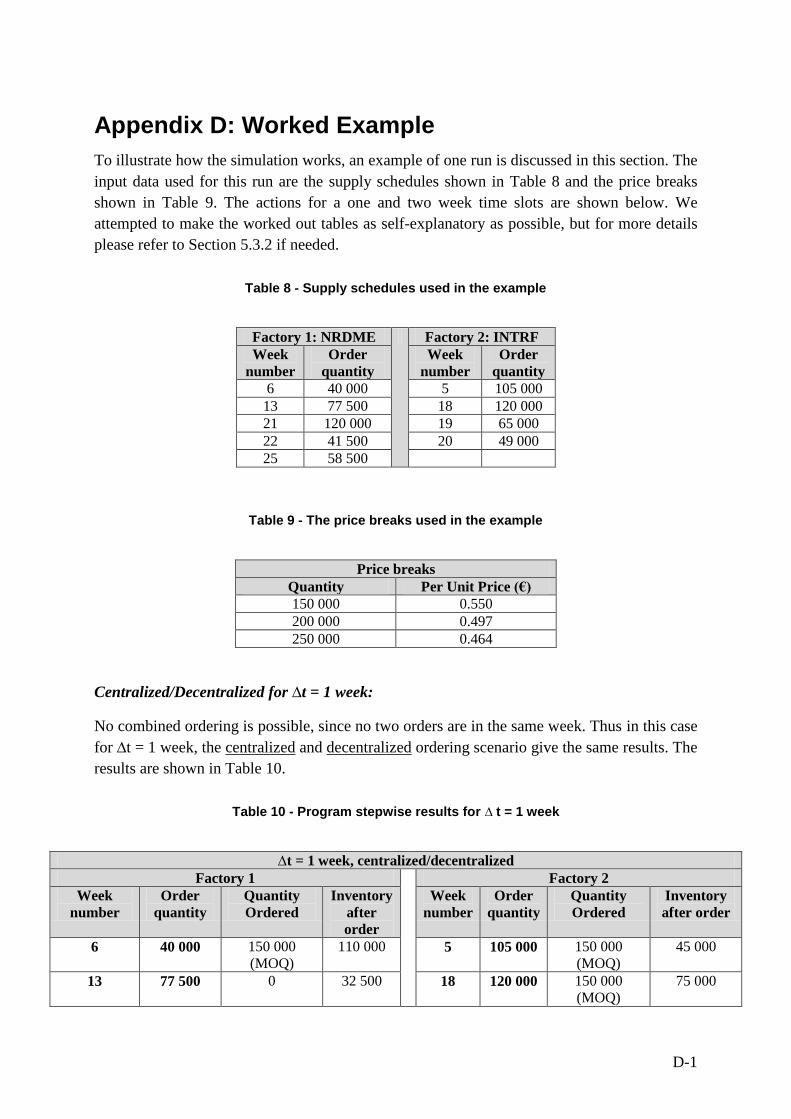
D-1
Appendix D: Worked Example
To illustrate how the simulation works, an example of one run is discussed in this section. The
input data used for this run are the supply schedules shown in Table 8 and the price breaks
shown in Table 9. The actions for a one and two week time slots are shown below. We
attempted to make the worked out tables as self-explanatory as possible, but for more details
please refer to Section 5.3.2 if needed.
Table 8 - Supply schedules used in the example
Factory 1: NRDME Factory 2: INTRF
Week
number
Order
quantity
Week
number
Order
quantity
6 40 000 5 105 000
13 77 500 18 120 000
21 120 000 19 65 000
22 41 500 20 49 000
25 58 500
Table 9 - The price breaks used in the example
Price breaks
Quantity Per Unit Price (€)
150 000 0.550
200 000 0.497
250 000 0.464
Centralized/Decentralized for ∆t = 1 week:
No combined ordering is possible, since no two orders are in the same week. Thus in this case
for ∆t = 1 week, the centralized and decentralized ordering scenario give the same results. The
results are shown in Table 10.
Table 10 - Program stepwise results for ∆ t = 1 week
∆t = 1 week, centralized/decentralized
Factory 1 Factory 2
Week
number
Order
quantity
Quantity
Ordered
Inventory
after
order
Week
number
Order
quantity
Quantity
Ordered
Inventory
after order
6 40 000 150 000
(MOQ)
110 000 5 105 000 150 000
(MOQ)
45 000
13 77 500 0 32 500 18 120 000 150 000
(MOQ)
75 000
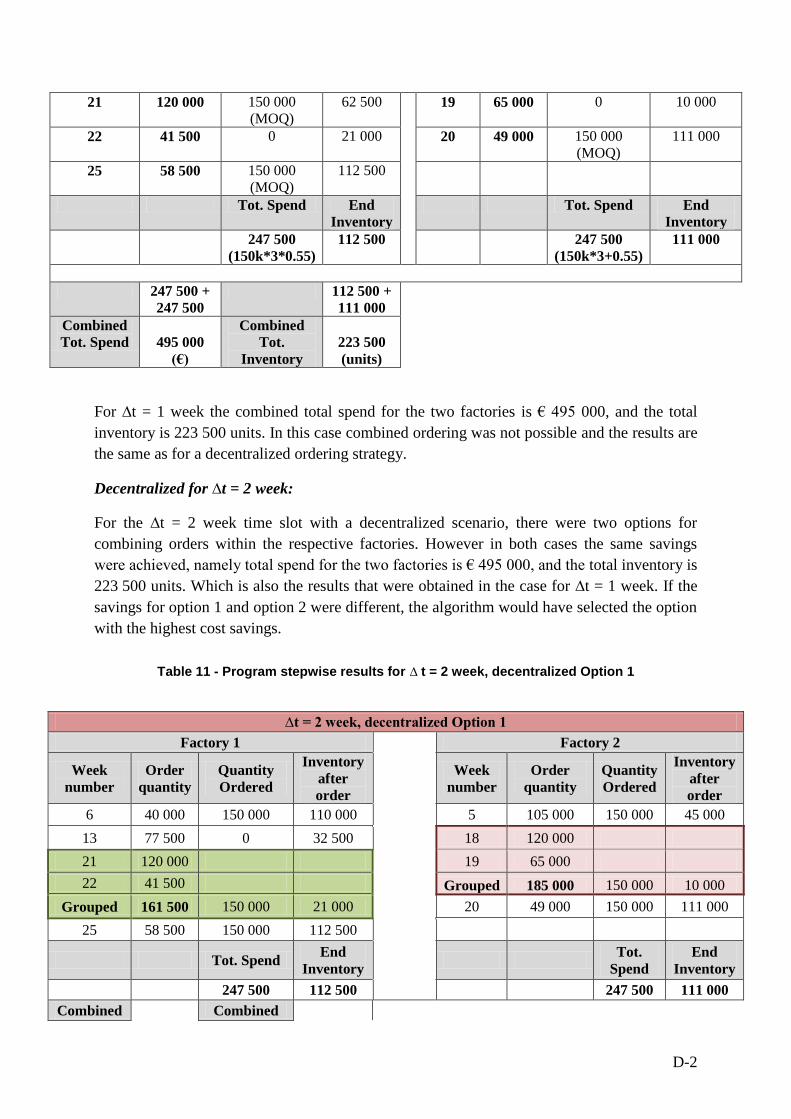
D-2
21 120 000 150 000
(MOQ)
62 500 19 65 000 0 10 000
22 41 500 0 21 000 20 49 000 150 000
(MOQ)
111 000
25 58 500 150 000
(MOQ)
112 500
Tot. Spend End
Inventory
Tot. Spend End
Inventory
247 500
(150k*3*0.55)
112 500 247 500
(150k*3+0.55)
111 000
247 500 +
247 500
112 500 +
111 000
Combined
Tot. Spend
495 000
(€)
Combined
Tot.
Inventory
223 500
(units)
For ∆t = 1 week the combined total spend for the two factories is € 495 000, and the total
inventory is 223 500 units. In this case combined ordering was not possible and the results are
the same as for a decentralized ordering strategy.
Decentralized for ∆t = 2 week:
For the ∆t = 2 week time slot with a decentralized scenario, there were two options for
combining orders within the respective factories. However in both cases the same savings
were achieved, namely total spend for the two factories is € 495 000, and the total inventory is
223 500 units. Which is also the results that were obtained in the case for ∆t = 1 week. If the
savings for option 1 and option 2 were different, the algorithm would have selected the option
with the highest cost savings.
Table 11 - Program stepwise results for ∆ t = 2 week, decentralized Option 1
∆t = 2 week, decentralized Option 1
Factory 1
Factory 2
Week
number
Order
quantity
Quantity
Ordered
Inventory
after
order
Week
number
Order
quantity
Quantity
Ordered
Inventory
after
order
6 40 000 150 000 110 000 5 105 000 150 000 45 000
13 77 500 0 32 500 18 120 000
21 120 000 19 65 000
22 41 500 Grouped 185 000 150 000 10 000
Grouped 161 500 150 000 21 000 20 49 000 150 000 111 000
25 58 500 150 000 112 500
Tot. Spend End
Inventory
Tot.
Spend
End
Inventory
247 500 112 500 247 500 111 000
Combined Combined
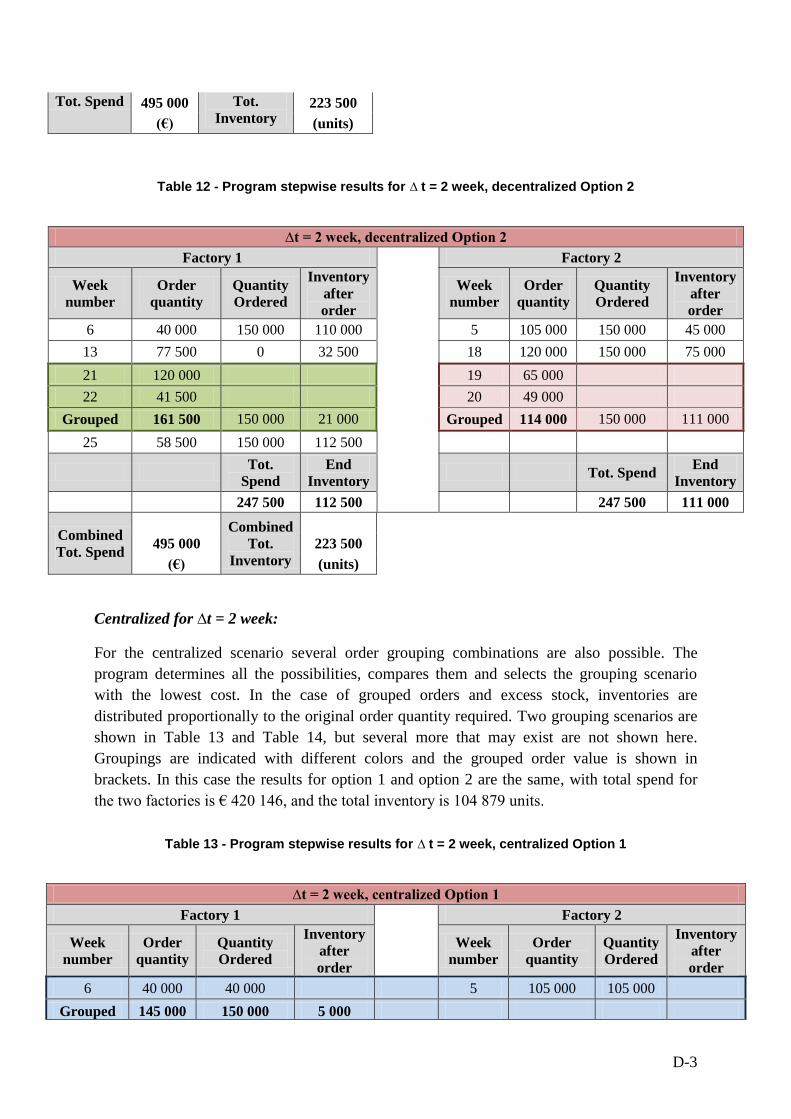
D-3
Tot. Spend 495 000 Tot.
Inventory 223 500
(€) (units)
Table 12 - Program stepwise results for ∆ t = 2 week, decentralized Option 2
∆t = 2 week, decentralized Option 2
Factory 1
Factory 2
Week
number
Order
quantity
Quantity
Ordered
Inventory
after
order
Week
number
Order
quantity
Quantity
Ordered
Inventory
after
order
6 40 000 150 000 110 000 5 105 000 150 000 45 000
13 77 500 0 32 500 18 120 000 150 000 75 000
21 120 000 19 65 000
22 41 500 20 49 000
Grouped 161 500 150 000 21 000 Grouped 114 000 150 000 111 000
25 58 500 150 000 112 500
Tot.
Spend
End
Inventory Tot. Spend
End
Inventory
247 500 112 500 247 500 111 000
Combined
Tot. Spend
Combined
Tot.
Inventory
495 000 223 500
(€) (units)
Centralized for ∆t = 2 week:
For the centralized scenario several order grouping combinations are also possible. The
program determines all the possibilities, compares them and selects the grouping scenario
with the lowest cost. In the case of grouped orders and excess stock, inventories are
distributed proportionally to the original order quantity required. Two grouping scenarios are
shown in Table 13 and Table 14, but several more that may exist are not shown here.
Groupings are indicated with different colors and the grouped order value is shown in
brackets. In this case the results for option 1 and option 2 are the same, with total spend for
the two factories is € 420 146, and the total inventory is 104 879 units.
Table 13 - Program stepwise results for ∆ t = 2 week, centralized Option 1
∆t = 2 week, centralized Option 1
Factory 1 Factory 2
Week
number
Order
quantity
Quantity
Ordered
Inventory
after
order
Week
number
Order
quantity
Quantity
Ordered
Inventory
after
order
6 40 000 40 000 5 105 000 105 000
Grouped 145 000 150 000 5 000
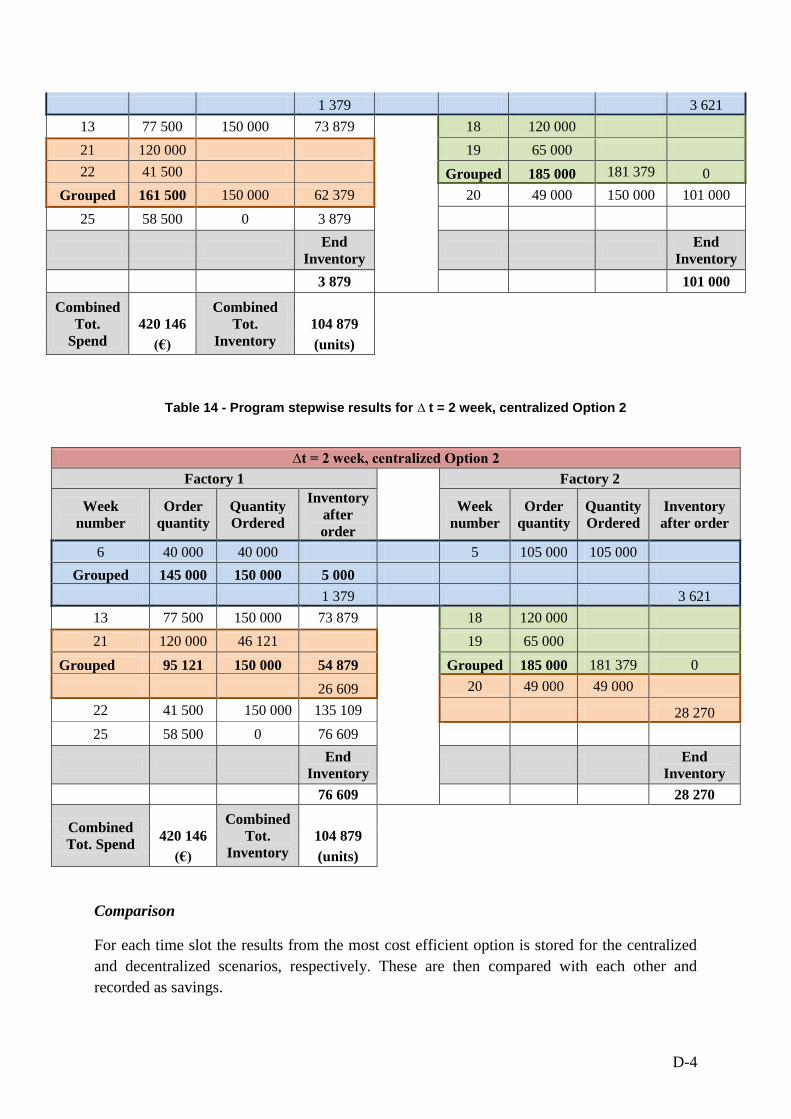
D-4
1 379 3 621
13 77 500 150 000 73 879
18 120 000
21 120 000
19 65 000
22 41 500 Grouped 185 000 181 379 0
Grouped 161 500 150 000 62 379 20 49 000 150 000 101 000
25 58 500 0 3 879
End
Inventory
End
Inventory
3 879 101 000
Combined
Tot.
Spend
Combined
Tot.
Inventory
420 146 104 879
(€) (units)
Table 14 - Program stepwise results for ∆ t = 2 week, centralized Option 2
∆t = 2 week, centralized Option 2
Factory 1 Factory 2
Week
number
Order
quantity
Quantity
Ordered
Inventory
after
order
Week
number
Order
quantity
Quantity
Ordered
Inventory
after order
6 40 000 40 000 5 105 000 105 000
Grouped 145 000 150 000 5 000
1 379 3 621
13 77 500 150 000 73 879
18 120 000
21 120 000 46 121
19 65 000
Grouped 95 121 150 000 54 879 Grouped 185 000 181 379 0
26 609 20 49 000 49 000
22 41 500 150 000 135 109 28 270
25 58 500 0 76 609
End
Inventory
End
Inventory
76 609 28 270
Combined
Tot. Spend
Combined
Tot.
Inventory
420 146 104 879
(€) (units)
Comparison
For each time slot the results from the most cost efficient option is stored for the centralized
and decentralized scenarios, respectively. These are then compared with each other and
recorded as savings.
D-5
Runs
The simulation completes these actions 10 000 times, each time with a different supply
schedule for each factory. The results are stored each time, and the final results are presented
in graphs, indicating % savings in terms of spend and inventory, that can be expected with
centralized materials management.