Embed Size (px)
Citation preview
i
Benefits of Coastal Shipping: Scope for Sea Change in Domestic Freight Transportation in
India
Lavanya Ravikanth Anneboina Research Consultant, Madras School of Economics
[email protected]; [email protected]
and
K. S. Kavi Kumar Professor, Madras School of Economics
ii
WORKING PAPER 147/2016
June 2016
Price : Rs. 35
MADRAS SCHOOL OF ECONOMICS
Gandhi Mandapam Road
Chennai 600 025 India
Phone: 2230 0304/2230 0307/2235 2157
Fax : 2235 4847/2235 2155
Email : [email protected]
Website: www.mse.ac.in
iii
Benefits of Coastal Shipping: Scope for Sea Change in Domestic Freight
Transportation in India
Lavanya Ravikanth Anneboina and K. S. Kavi Kumar
Abstract
The share of coastal shipping in the modal mix of domestic freight transportation in India is currently very low despite it being more cost-effective, fuel-efficient and environment-friendly compared to other modes of transportation. This paper estimates the benefits of coastal shipping, which are simply the costs avoided by transporting goods via sea as opposed to transporting them by road or rail. The economic, environmental and social benefits of coastal shipping are valued in the range of Rs. 16 – 64 billion per annum in 2012-13 prices. In physical terms, greenhouse gas emissions reductions amount to between 1 – 22 lakh tonnes of carbon per annum. The lower- and upper-bound values in the range represent cost savings (or emissions reductions) with respect to rail and road transport respectively. The results indicate that the country would stand to gain from a modal shift in freight transportation from road and rail transport to coastal shipping. Keywords: Coastal shipping; Freight transport; Cost savings; Transport
policy JEL Codes: L91; Q57; R40
iv
ACKNOWLEDGEMENT
This work was undertaken as part of the project, „Linking Coastal Zone Management to Ecosystem Services in India‟, funded by NCSCM, Chennai. The authors acknowledge the useful comments provided by the review committee consisting of Prof. R. Ramesh, Prof. B. R. Subramanian, Prof. D. Chandramohan, Prof. R. Maria Saleth, Dr. Ahana Lakshmi, Dr. D. Asir Ramesh and Dr. Purvaja Ramachandran at the meeting held on 24th June 2015 at NCSCM, Chennai. The authors also gratefully acknowledge the support received from the partner institutions of the project – NCSCM and Goa University at various stages of the study.
Lavanya Ravikanth Anneboina
K. S. Kavi Kumar
1
INTRODUCTION
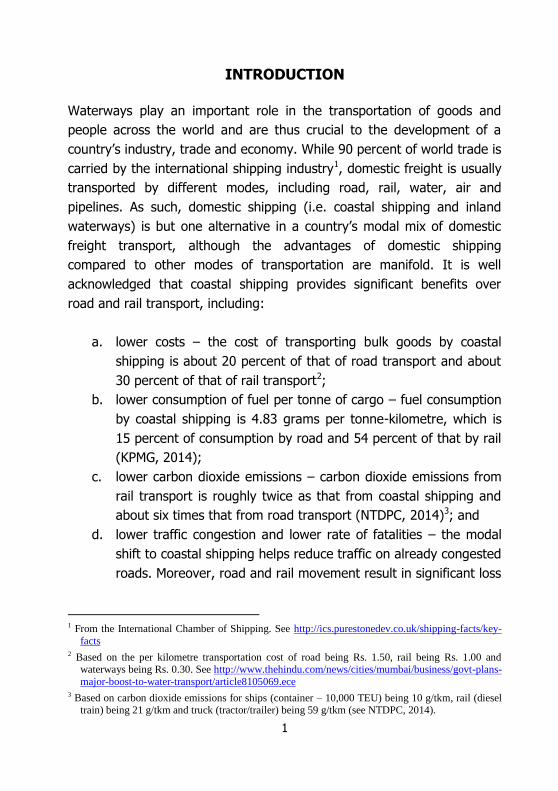
Waterways play an important role in the transportation of goods and
people across the world and are thus crucial to the development of a
country‟s industry, trade and economy. While 90 percent of world trade is
carried by the international shipping industry1, domestic freight is usually
transported by different modes, including road, rail, water, air and
pipelines. As such, domestic shipping (i.e. coastal shipping and inland
waterways) is but one alternative in a country‟s modal mix of domestic
freight transport, although the advantages of domestic shipping
compared to other modes of transportation are manifold. It is well
acknowledged that coastal shipping provides significant benefits over
road and rail transport, including:
a. lower costs – the cost of transporting bulk goods by coastal
shipping is about 20 percent of that of road transport and about
30 percent of that of rail transport2;
b. lower consumption of fuel per tonne of cargo – fuel consumption
by coastal shipping is 4.83 grams per tonne-kilometre, which is
15 percent of consumption by road and 54 percent of that by rail
(KPMG, 2014);
c. lower carbon dioxide emissions – carbon dioxide emissions from
rail transport is roughly twice as that from coastal shipping and
about six times that from road transport (NTDPC, 2014)3; and
d. lower traffic congestion and lower rate of fatalities – the modal
shift to coastal shipping helps reduce traffic on already congested
roads. Moreover, road and rail movement result in significant loss
1 From the International Chamber of Shipping. See http://ics.purestonedev.co.uk/shipping-facts/key-
facts 2 Based on the per kilometre transportation cost of road being Rs. 1.50, rail being Rs. 1.00 and
waterways being Rs. 0.30. See http://www.thehindu.com/news/cities/mumbai/business/govt-plans-
major-boost-to-water-transport/article8105069.ece 3 Based on carbon dioxide emissions for ships (container – 10,000 TEU) being 10 g/tkm, rail (diesel
train) being 21 g/tkm and truck (tractor/trailer) being 59 g/tkm (see NTDPC, 2014).
2
of lives in India. It was estimated that one life was lost in a road
accident every 3.7 minutes in India in 20114.
Despite being a cost-effective, fuel-efficient and environment-friendly
mode of transportation, domestic shipping has a significantly lower share
in the modal mix of domestic freight transport in India compared to other
developed and emerging countries. Coastal shipping accounts for only 7
percent of freight transport in India, whereas the share of coastal
shipping in Japan and the EU is roughly five to six times higher, and the
same is about seven times higher in China, a fellow developing country
(see Figure 1). The share of coastal shipping in the USA is slightly lower
than that of India, however the share of inland waterways is significantly
higher in the USA (9 percent) compared to India (0.3 percent). The
share of freight transport by inland waterways is even higher in China at
15 percent. Water-based transportation of domestic freight, comprising
of both coastal shipping and inland waterways, is approximately nine
times higher in China, six times higher in the EU, five times higher in
Japan and twice as high in the USA compared to India.
4 From ‘Road accidents in India: Issues & dimensions’, Ministry of Road Transport and Highways,
Government of India. See http://www.unescap.org/sites/default/files/2.12.India_.pdf
3
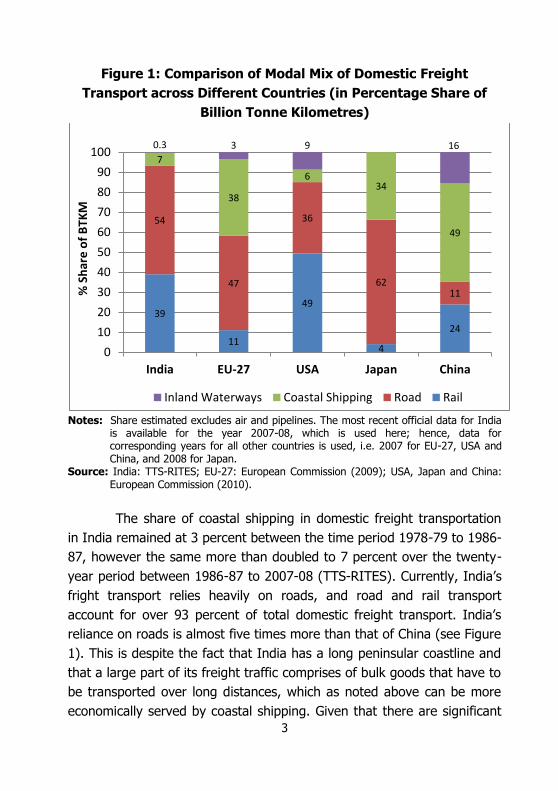
Figure 1: Comparison of Modal Mix of Domestic Freight
Transport across Different Countries (in Percentage Share of
Billion Tonne Kilometres)
Notes: Share estimated excludes air and pipelines. The most recent official data for India
is available for the year 2007-08, which is used here; hence, data for corresponding years for all other countries is used, i.e. 2007 for EU-27, USA and China, and 2008 for Japan.
Source: India: TTS-RITES; EU-27: European Commission (2009); USA, Japan and China: European Commission (2010).
The share of coastal shipping in domestic freight transportation
in India remained at 3 percent between the time period 1978-79 to 1986-
87, however the same more than doubled to 7 percent over the twenty-
year period between 1986-87 to 2007-08 (TTS-RITES). Currently, India‟s
fright transport relies heavily on roads, and road and rail transport
account for over 93 percent of total domestic freight transport. India‟s
reliance on roads is almost five times more than that of China (see Figure
1). This is despite the fact that India has a long peninsular coastline and
that a large part of its freight traffic comprises of bulk goods that have to
be transported over long distances, which as noted above can be more
economically served by coastal shipping. Given that there are significant
39
11
49
4
24
54
47
36
62 11
7
38
6 34
49
0.3 3 9 16
0
10
20
30
40
50
60
70
80
90
100
India EU-27 USA Japan China
% S
har
e o
f B
TKM
Inland Waterways Coastal Shipping Road Rail
4
gains to be had in terms of costs saved and damages avoided by
transporting goods via sea rather than by other (land-based) modes of
transportation, the aim of this paper is to estimate the benefits of coastal
shipping in India in terms of the economic and environmental costs saved
with respect to road and rail transport. Large cost savings would imply
that the country would benefit from a modal shift in domestic freight
transportation, i.e. from road and rail transport to coastal shipping. This
would in turn lead to an increase in the share of coastal shipping in the
country‟s modal mix of domestic freight transportation. Thus, this paper
analyses the benefits of coastal shipping as a potentially suitable
alternative mode of domestic freight transportation in India. The rest of
the paper is organised as follows: section 2 discusses the methodology
used to estimate the benefits of coastal shipping in India; section 3
discusses the data used in the analysis; and the final section discusses
the results, and concludes.
METHODOLOGY
The benefits of coastal shipping are valued by using the avoided cost
method, which estimates the costs of transportation that would have
been incurred in the absence of the sea (and thus, in the absence of
coastal shipping). In other words, the benefits of coastal shipping are the
costs avoided by transporting goods via sea as opposed to transporting
them by alternative modes of land–based transportation such as road or
rail.
The benefits of coastal shipping as an alternative means of
transportation are estimated in the following manner –
∑ (( ) ( )) (1)
where,
VSi are the benefits of coastal shipping, S, in terms of the costs saved with respect to i, the alternate mode of transportation;
5
i is the mode of transport other than shipping. Only the two major modes
of freight transportation namely road and rail transport are
considered as alternatives in this exercise;
z represents a pair of maritime zones across which goods are
transported, from one zone to another. There are twelve maritime zones and forty eight pairs of maritime zones over which goods
have been transported in 2012-13 (more on this in the next section);
j is the type of commodity being transported across maritime zones (e.g.
Petroleum Oil and Lubricants (POL), cement etc.). Transportation costs tend to vary by the type of commodity being transported both
within and across the different modes of transportation, which is taken into account here. Moreover, different commodities are
transported via specific routes only depending on the demand and
supply of the same;
k is the category of cost being estimated. Economic and environmental
costs are considered in this exercise;
D is the distance in km between a representative port in one maritime
zone and another. Note that transportation routes and thus distances will vary by the different modes of transportation for the
same z;
C is the cost in Rupees per tonne-km by commodity. Costs vary not only by the type of commodity being transported but also by the distance
travelled in some cases (road transport) as well as other specifics of the route (type of terrain- ghat/plain, type of road- national
highway/other, type of track- single line/double line etc.) and the
mode of transportation itself (whether diesel or electric traction etc.; more on this in the subsequent section); and
T is the tonnes of goods of various kinds that are transported by coastal shipping between the different maritime zones.
Looking at the right hand side of equation (1), the first part
estimates what it would cost to transport goods actually transported by
coastal shipping by another mode of transportation, and the second part
estimates what it costs when they are transported by coastal shipping.
6
Thus, the difference between the two are the costs saved by transporting
goods via coastal shipping compared to another mode of transportation,
i.e. the benefit derived. Since costs saved over two alternate modes of
transportation, namely road and rail, are estimated, two values for Vsi are
obtained which gives a range of values for the benefits of coastal
shipping.
DATA
The Planning Commission‟s Total Transport System Study (TTS-RITES)
has worked out the economic and environmental costs (in terms of
Rupees per Tonne-Km) incurred by different modes of transport including
coastal shipping, road transport (highways) and rail transport. The
economic costs of transportation comprise of fixed capital costs (including
ground facilities, ports, highways, tracks, terminals, workshops etc.),
moving capital costs (including rolling stock, vehicles, vessels, trains,
equipment at terminals and workshops etc.) and operating and
maintenance costs (including fuel expenses, repair and maintenance,
running costs, salaries, insurance etc.). Economic costs are nothing but
the financial costs that have been adjusted for transfer payments, taxes
and subsidies using a shadow pricing factor. Economic costs for coastal
shipping are only available for commodities commonly transported by this
means of transportation. These include iron ore, POL (product and
crude), coal, cement and others (including containers). Thus, although
economic costs for railways, primarily, and road transport are available
for commodities other than those listed above, averages over respective
commodity groups have been taken to represent the commodity-wise
economic costs as per the coastal shipping classification of commodities.
For railways, TTS-RITES also estimated economic costs on the basis of
the type of terrain (whether traversing a plain section or a ghat section),
type of train traction (whether diesel or electric) and the type of railway
line (whether single or double). For the purpose of this study average
values over all these categories have been used for each commodity
group due to lack of information on the specifics of each journey. For
7
road transport, other than the usual commodity-wise cost estimates,
TTS-RITES also estimated costs on the basis of terrain (whether plain,
rolling or hilly), road type (national highway, state highway or major
district road) and the number of lanes (single, double, four, intermediate
and four lane expressway). In addition economic costs were also
estimated on the basis of the distance travelled (i.e. distance slab-wise
cost). Since almost all road journeys across maritime zones involve travel
on national highways, commodity-specific economic costs for national
highways (averaged across the other two categories- terrain and number
of lanes) that corresponded to the distance range in question (i.e. range
into which the actual road-distances between representative ports falls
into) were used for the analysis. All unit costs as reported in TTS-RITES
correspond to 2007-08 prices and were converted to 2012-13 prices
using a GDP deflator (annual percentage, base year is 2004-05), data for
which was obtained from the World Bank‟s World Development Indicators
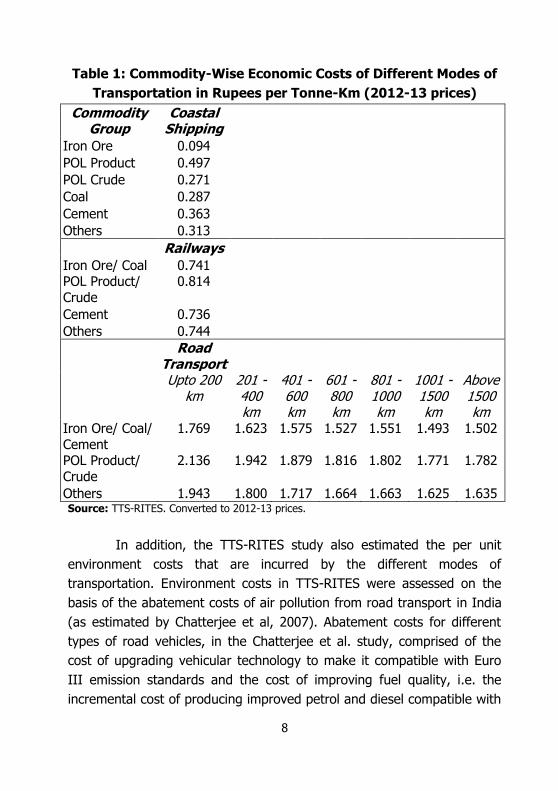
Database (available online). The commodity-wise economic costs of the
three modes of transportation considered in this analysis are presented in
Table 1. It is evident that the unit economic costs of road transport are
the highest and those of coastal shipping, the smallest, across all
commodity groups.
8
Table 1: Commodity-Wise Economic Costs of Different Modes of
Transportation in Rupees per Tonne-Km (2012-13 prices)
Commodity Group
Coastal Shipping
Iron Ore 0.094 POL Product 0.497
POL Crude 0.271
Coal 0.287
Cement 0.363 Others 0.313
Railways
Iron Ore/ Coal 0.741 POL Product/
Crude
0.814
Cement 0.736
Others 0.744
Road Transport
Upto 200 km
201 - 400 km
401 - 600 km
601 - 800 km
801 - 1000 km
1001 - 1500 km
Above 1500 km
Iron Ore/ Coal/
Cement
1.769 1.623 1.575 1.527 1.551 1.493 1.502
POL Product/
Crude
2.136 1.942 1.879 1.816 1.802 1.771 1.782
Others 1.943 1.800 1.717 1.664 1.663 1.625 1.635 Source: TTS-RITES. Converted to 2012-13 prices.
In addition, the TTS-RITES study also estimated the per unit
environment costs that are incurred by the different modes of
transportation. Environment costs in TTS-RITES were assessed on the
basis of the abatement costs of air pollution from road transport in India
(as estimated by Chatterjee et al, 2007). Abatement costs for different
types of road vehicles, in the Chatterjee et al. study, comprised of the
cost of upgrading vehicular technology to make it compatible with Euro
III emission standards and the cost of improving fuel quality, i.e. the
incremental cost of producing improved petrol and diesel compatible with
9
Euro norms (as reported in the Mashelkar Committee Report, 2002).
TTS-RITES used an annualised incremental cost of upgrading road
vehicular technology of Rs. 17,212.50 per vehicle and an average
incremental cost of improving fuel of Rs. 1.80 per litre to estimate the
abatement cost per tonne-km for road freight transport. The abatement
cost for railways and coastal shipping was arrived at in proportion to fuel
consumption under these sectors. A fuel consumption norm of 2.54 litres
per thousand GTKM under rail and 0.00216 litres per TKM under coastal
shipping were adopted.
The environment costs estimated by TTS-RITES represent the
costs of air pollution abatement; they do not include Greenhouse gas
(GHG) emission costs of the different modes of transportation. It is
important to include the latter in the environmental cost calculations to
evaluate the GHG emission reduction benefits under coastal shipping as
against other modes of transportation. The per unit GHG emissions costs
for the different modes of freight transportation were computed by
multiplying the estimates of GHG emissions per useful distance travelled
for each mode of freight transportation, measured in grams of carbon
dioxide equivalent per tonne-kilometre obtained from IPCC-AR5
(Schlӧmer et al., 2014), with the Social Cost of Carbon (SCC)5 for India,
estimated by Nordhaus (2011) and measured in Rupees per tonne of
carbon dioxide. Note that the GHG emissions per tonne-kilometre
estimates of the different modes of freight transport from IPCC-AR5 are
based on the currently commercially available transport technologies
world over and therefore they represent average global values (i.e. they
are not India-specific).
The per unit environmental costs, comprising of both the air
pollution abatement costs as well as the GHG emission costs, for the
different modes of transportation that were used in this study are
5 SCC is the estimated monetised value of damages caused by an additional tonne of CO2 emissions
or its equivalent released into the atmosphere. Economists and climate scientists often consider SCC as an underestimated value of the damages caused as a result of climate change impacts.
10
presented in Table 2. Note that both the environmental costs for railways
represent average values of diesel traction and electric traction. Given
that the proportion of freight transported by diesel traction as opposed to
electric traction is not known, this is a reasonable assumption.
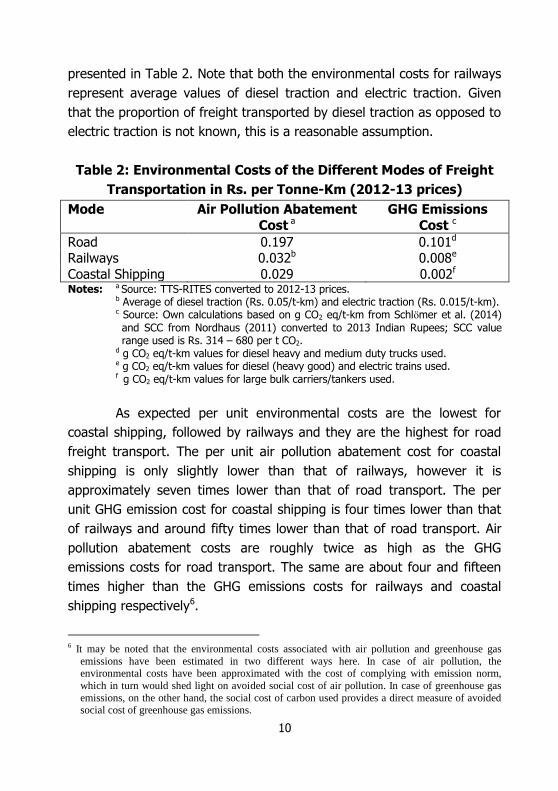
Table 2: Environmental Costs of the Different Modes of Freight
Transportation in Rs. per Tonne-Km (2012-13 prices)
Mode Air Pollution Abatement
Cost a GHG Emissions
Cost c
Road 0.197 0.101d
Railways 0.032b 0.008e
Coastal Shipping 0.029 0.002f
Notes: a Source: TTS-RITES converted to 2012-13 prices. b Average of diesel traction (Rs. 0.05/t-km) and electric traction (Rs. 0.015/t-km).
c Source: Own calculations based on g CO2 eq/t-km from Schlӧmer et al. (2014)
and SCC from Nordhaus (2011) converted to 2013 Indian Rupees; SCC value range used is Rs. 314 – 680 per t CO2.
d g CO2 eq/t-km values for diesel heavy and medium duty trucks used. e g CO2 eq/t-km values for diesel (heavy good) and electric trains used. f g CO2 eq/t-km values for large bulk carriers/tankers used.
As expected per unit environmental costs are the lowest for
coastal shipping, followed by railways and they are the highest for road
freight transport. The per unit air pollution abatement cost for coastal
shipping is only slightly lower than that of railways, however it is
approximately seven times lower than that of road transport. The per
unit GHG emission cost for coastal shipping is four times lower than that
of railways and around fifty times lower than that of road transport. Air
pollution abatement costs are roughly twice as high as the GHG
emissions costs for road transport. The same are about four and fifteen
times higher than the GHG emissions costs for railways and coastal
shipping respectively6.
6 It may be noted that the environmental costs associated with air pollution and greenhouse gas
emissions have been estimated in two different ways here. In case of air pollution, the environmental costs have been approximated with the cost of complying with emission norm,
which in turn would shed light on avoided social cost of air pollution. In case of greenhouse gas
emissions, on the other hand, the social cost of carbon used provides a direct measure of avoided social cost of greenhouse gas emissions.
11
Note that the environment costs are not commodity-specific and
hence the environment cost for each mode of transportation is added to
the commodity-wise economic costs (the same value for all commodity
groups) to arrive at the commodity-wise total costs for each mode of
transportation.
Data on the commodity-wise quantity of goods transported
across the maritime zones of India (TSzj in equation (1)) come from the
annual publication „Statistics of the Inland Coasting Trade Consignments
of India‟ (DGCI&S, 2012-13). This publication divides up the Indian coast
into twelve maritime zones with each of the coastal States forming one
zone each, the Islands of Andaman and Nicobar and Lakshadweep
forming two additional zones and the Union Territory of Puducherry
forming one additional zone, which gives a total of twelve zones in all.
The publication gives information on the quantity of each commodity that
was transported from one zone to another across all twelve zones but
does not specify which port within each zone the goods were transported
from and to. All commodities were grouped into the five major
commodity groups for which unit cost estimates for the coastal shipping
sector exist (as discussed above) and quantities thereof that were
transported across the different maritime zones were aggregated. Note
that quantity units varied according to the commodity in question and
therefore all units were converted to tonnes using commodity-specific
conversion factor units from the TTS-RITES study (Special Report 1) to
enable such aggregation across commodities.
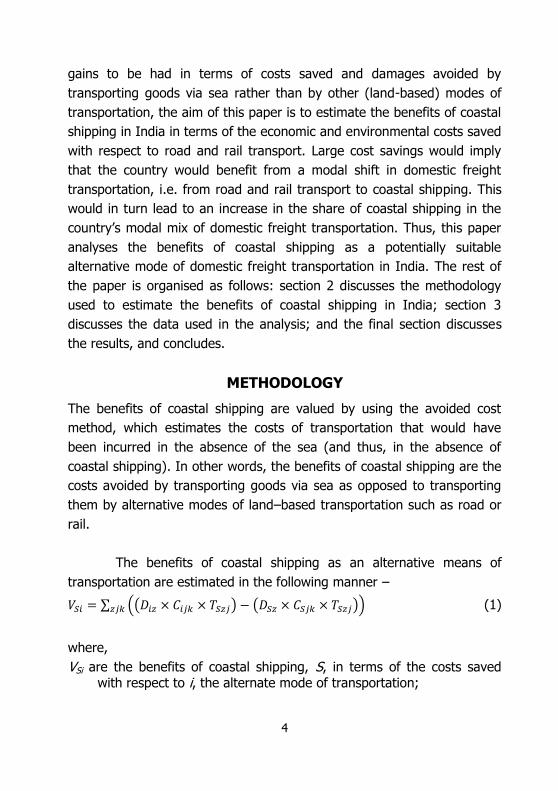
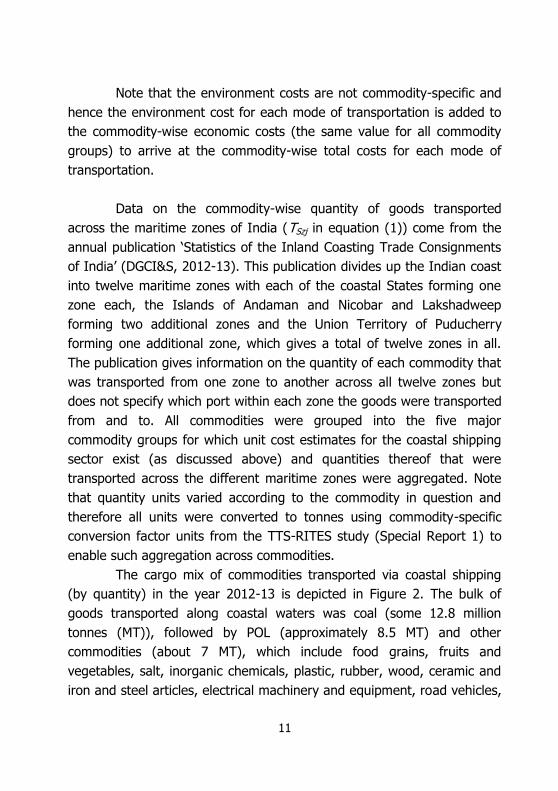
The cargo mix of commodities transported via coastal shipping
(by quantity) in the year 2012-13 is depicted in Figure 2. The bulk of
goods transported along coastal waters was coal (some 12.8 million
tonnes (MT)), followed by POL (approximately 8.5 MT) and other
commodities (about 7 MT), which include food grains, fruits and
vegetables, salt, inorganic chemicals, plastic, rubber, wood, ceramic and
iron and steel articles, electrical machinery and equipment, road vehicles,
12
boats and barges, parts of aircrafts, among others. The total quantity of
goods transported was roughly 30.8 MT in 2012-13.
Figure 2: Cargo Mix of Commodities on Coastal Shipping (by
weight) in 2012-13
Source: DGCI&S (2012-13).
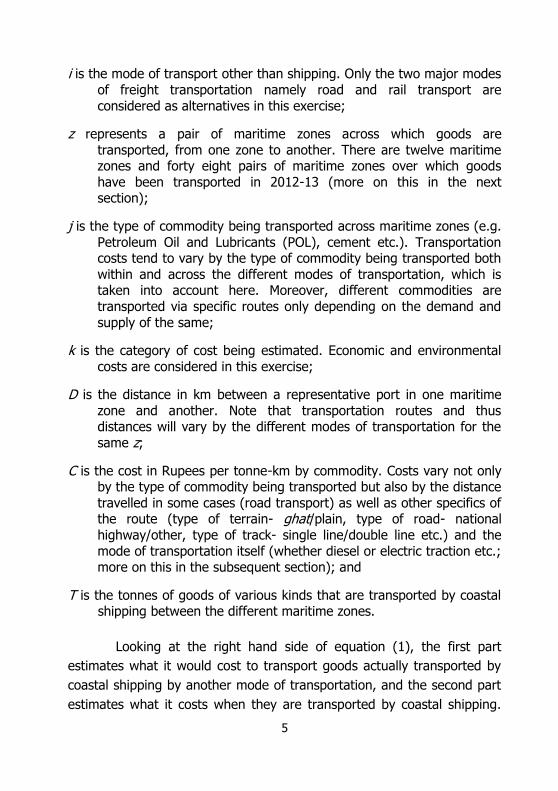
In terms of the quantity of total goods that were sent outwards
from each maritime zone to the others, Gujarat transported the highest
quantity of goods transported during 2012-13, followed by West Bengal,
Odisha and Andhra Pradesh (see Figure 3). Goa, Puducherry and
Andaman and Nicobar Islands transported less than twenty thousand
tonnes each and were thus excluded from the figure below.
Lakshadweep did not transport any goods to other maritime zones during
this period.
IRON ORE 5%
POL PRODUCT
19% POL CRUDE
8%
COAL 42%
CEMENT 3%
OTHERS 23%
13
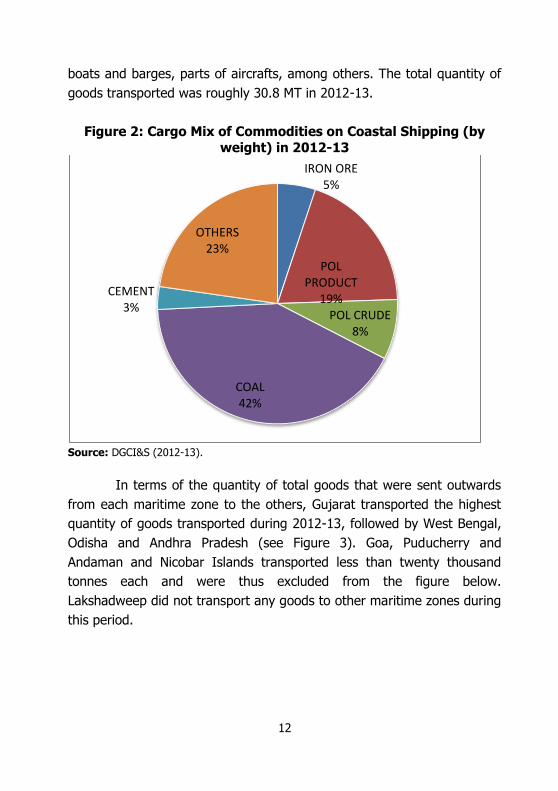
Figure 3: Commodity-Wise Quantity of Goods Sent by Maritime
Zone via Coastal Shipping in 2012-13
Source: DGCI&S (2012-13).
Figure 3 also shows that the highest quantity of POL product and
cement that was transported was sent from Gujarat (almost 4.3 and 0.9
MT respectively); the highest quantity of Coal transported was sent from
Odisha (approximately 6.2 MT) followed by West Bengal and Andhra
Pradesh (about 2.8 MT each); the highest quantity of POL crude
transported was sent from Maharashtra (close to 2.3 MT); the highest
quantity of Iron ore transported was sent from Andhra Pradesh (almost
1.2 MT); and, the highest quantity of other goods transported to other
maritime zones was sent from West Bengal (about 3.8 MT).
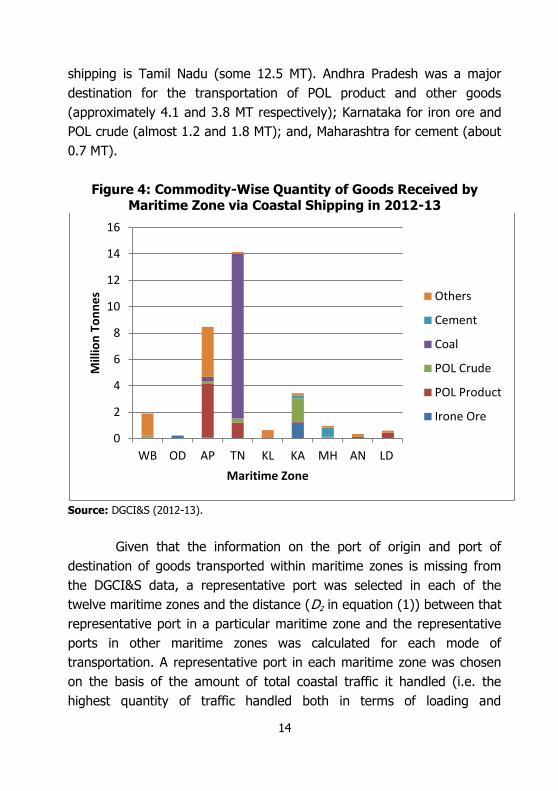
Looking at the maritime zone that received the highest quantity
of goods that were transported via coastal shipping, Tamil Nadu received
close to 14 MT of goods, which is significantly higher than the quantity of
goods received by any other maritime zone via coastal shipping (Figure
4). No goods at all were shipped to Gujarat, Goa and Puducherry in
2012-13. The destination for almost all of the coal transported via coastal
0
1
2
3
4
5
6
7
8
WB OD AP TN KL KA MH GJ
Mill
ion
To
nn
es
Maritime Zone
Others
Cement
Coal
POL Crude
POL Product
Irone Ore
14
shipping is Tamil Nadu (some 12.5 MT). Andhra Pradesh was a major
destination for the transportation of POL product and other goods
(approximately 4.1 and 3.8 MT respectively); Karnataka for iron ore and
POL crude (almost 1.2 and 1.8 MT); and, Maharashtra for cement (about
0.7 MT).
Figure 4: Commodity-Wise Quantity of Goods Received by Maritime Zone via Coastal Shipping in 2012-13
Source: DGCI&S (2012-13).
Given that the information on the port of origin and port of
destination of goods transported within maritime zones is missing from
the DGCI&S data, a representative port was selected in each of the
twelve maritime zones and the distance (Dz in equation (1)) between that
representative port in a particular maritime zone and the representative
ports in other maritime zones was calculated for each mode of
transportation. A representative port in each maritime zone was chosen
on the basis of the amount of total coastal traffic it handled (i.e. the
highest quantity of traffic handled both in terms of loading and
0
2
4
6
8
10
12
14
16
WB OD AP TN KL KA MH AN LD
Mill
ion
To
nn
es
Maritime Zone
Others
Cement
Coal
POL Crude
POL Product
Irone Ore
15
unloading) among all major, intermediate and minor ports during the
year 2012-13 (MoS, 2014; Tables 2-4). Naturally major ports handle
more coastal traffic (in terms of quantity of goods) than minor ports and
they were the natural choice of representative ports in maritime zones. If
there is more than one major port in a particular maritime zone then the
one that handled the highest tonnage of traffic was chosen as the
representative port in that zone. In some cases, goods were transported
internally within maritime zones (for e.g., in West Bengal, Andhra
Pradesh and Tamil Nadu), thus, a second representative port was
chosen, again on the basis of the quantity of coastal traffic handled by
the port as well as its distance to the first representative port. That is,
the port farthest to the first representative port was chosen since goods
travelling short distances within a maritime zone are unlikely to be
transported via shipping. Note however that inter-maritime zone
transport distances are based on distances between the first
representative ports chosen in each maritime zone. The representative
ports selected in each maritime zone are listed below in Table 3.
16
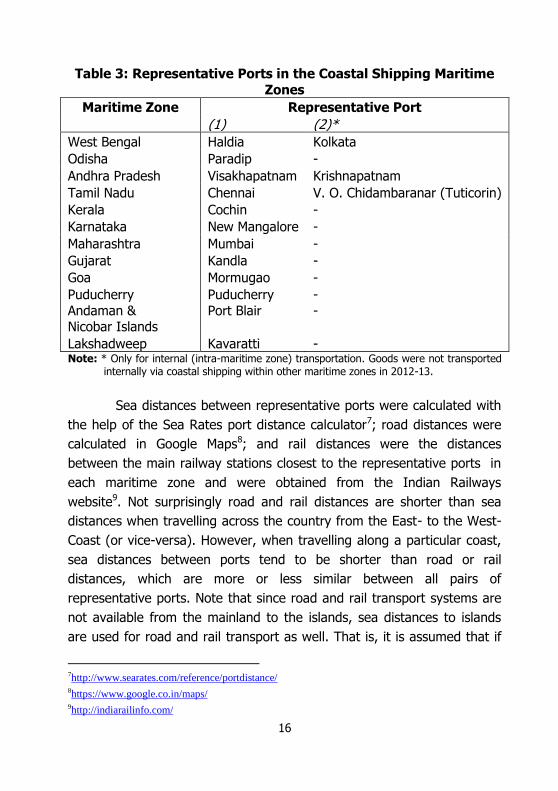
Table 3: Representative Ports in the Coastal Shipping Maritime
Zones
Maritime Zone Representative Port
(1) (2)*
West Bengal Haldia Kolkata
Odisha Paradip -
Andhra Pradesh Visakhapatnam Krishnapatnam
Tamil Nadu Chennai V. O. Chidambaranar (Tuticorin)
Kerala Cochin -
Karnataka New Mangalore -
Maharashtra Mumbai -
Gujarat Kandla -
Goa Mormugao -
Puducherry Puducherry -
Andaman & Nicobar Islands
Port Blair -
Lakshadweep Kavaratti - Note: * Only for internal (intra-maritime zone) transportation. Goods were not transported
internally via coastal shipping within other maritime zones in 2012-13.
Sea distances between representative ports were calculated with
the help of the Sea Rates port distance calculator7; road distances were
calculated in Google Maps8; and rail distances were the distances
between the main railway stations closest to the representative ports in
each maritime zone and were obtained from the Indian Railways
website9. Not surprisingly road and rail distances are shorter than sea
distances when travelling across the country from the East- to the West-
Coast (or vice-versa). However, when travelling along a particular coast,
sea distances between ports tend to be shorter than road or rail
distances, which are more or less similar between all pairs of
representative ports. Note that since road and rail transport systems are
not available from the mainland to the islands, sea distances to islands
are used for road and rail transport as well. That is, it is assumed that if
7http://www.searates.com/reference/portdistance/ 8https://www.google.co.in/maps/ 9http://indiarailinfo.com/
17
there was a road between the mainland and a particular island, the
distance between the two would be the same as that of the sea route
distance.
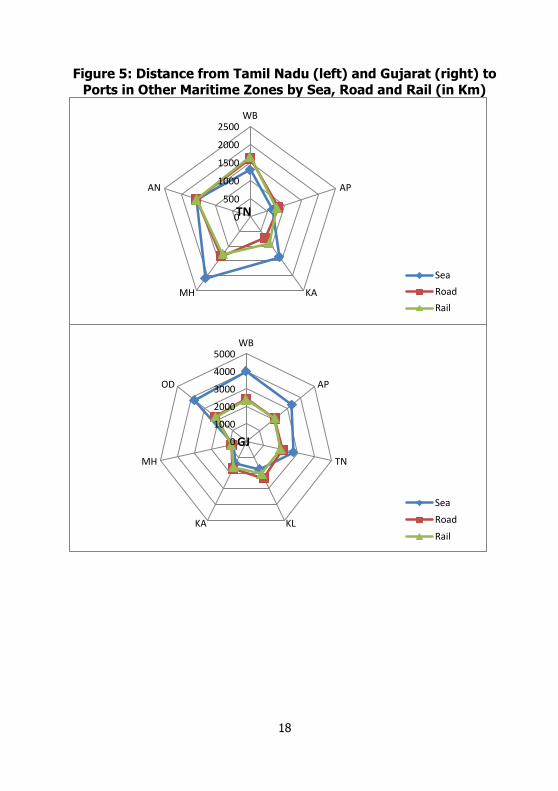
By way of an example, Figure 5 shows the distances from
Chennai port in Tamil Nadu (left graph) and Kandla port in Gujarat (right
graph) to representative ports in other maritime zones by the three
modes of transportation. In both cases it is apparent that sea distances
are longer than road or rail distances when travelling to zones on the
opposite coast but they are shorter than road or rail distances when
travelling to destinations along the same coast as the port of origin.
Naturally sea, road and rail distances to Port Blair in the Andaman and
Nicobar Islands from Chennai port are exactly the same since sea
distance was assumed for the road and rail distances as well. The
difference between road and rail distances is also negligible for almost all
pairs of journeys in both graphs.
18
Figure 5: Distance from Tamil Nadu (left) and Gujarat (right) to
Ports in Other Maritime Zones by Sea, Road and Rail (in Km)
0
500
1000
1500
2000
2500WB
AP
KAMH
AN
Sea
Road
Rail
TN
0
1000
2000
3000
4000
5000WB
AP
TN
KLKA
MH
OD
Sea
Road
Rail
GJ
19
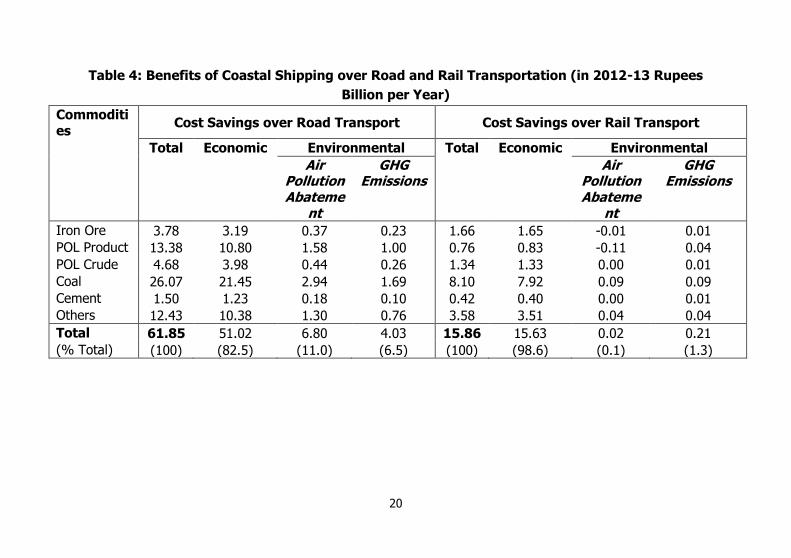
RESULTS AND DISCUSSION
The benefits of coastal shipping as estimated by equation (1) above are
presented in Table 4. Since the costs saved by transporting goods via
coastal shipping as opposed to transporting goods by the two alternative
modes of transportation, namely road and rail, were both calculated, a
range of cost savings values were obtained. The value range for the total
benefits of coastal shipping is Rs. 16 – 62 billion (in 2012-13 prices). The
value at the lower end of the range corresponds to the total costs saved
in relation to rail transport and the value at the higher end of the range
corresponds to the total costs saved vis-a-vis road transport. In other
words, transporting goods via road is the most costly mode of
transportation. Note that total costs saved are nothing but a sum of the
economic and environmental costs saved. The environmental benefits of
coastal shipping, including savings in terms of both air pollution
abatement and GHG emissions reductions, amount to approximately Rs.
0.2 – 11 billion. In physical terms, GHG emissions reductions are
estimated in the range of 1.2 – 22.1 lakh tonnes of carbon for the year
2012-13. Environmental costs saved by coastal shipping account for a
modest 1.4 percent of total costs saved over rail transport, however they
account for a significant 18 percent of total costs saved over road
transport. There are GHG emissions reduction gains to be had by
transporting all major commodities by coastal shipping as opposed to
road and rail transport. Similarly, there are air pollution abatement
savings to be had by transporting all major commodities by coastal
shipping as opposed to road transport. However it seems to have been
cheaper to transport iron ore and POL product by rail rather than by
coastal shipping as indicated by the negative sign on the air pollution
abatement cost saving estimates of those two commodities. In other
words, the benefits foregone by transporting iron ore and POL product by
coastal shipping instead of rail amounts to about Rs. 0.12 billion in 2012-
13.
20
Table 4: Benefits of Coastal Shipping over Road and Rail Transportation (in 2012-13 Rupees
Billion per Year)
Commoditi
es Cost Savings over Road Transport Cost Savings over Rail Transport
Total Economic Environmental Total Economic Environmental
Air Pollution Abateme
nt
GHG Emissions
Air Pollution Abateme
nt
GHG Emissions
Iron Ore 3.78 3.19 0.37 0.23 1.66 1.65 -0.01 0.01
POL Product 13.38 10.80 1.58 1.00 0.76 0.83 -0.11 0.04
POL Crude 4.68 3.98 0.44 0.26 1.34 1.33 0.00 0.01
Coal 26.07 21.45 2.94 1.69 8.10 7.92 0.09 0.09
Cement 1.50 1.23 0.18 0.10 0.42 0.40 0.00 0.01
Others 12.43 10.38 1.30 0.76 3.58 3.51 0.04 0.04
Total 61.85 51.02 6.80 4.03 15.86 15.63 0.02 0.21
(% Total) (100) (82.5) (11.0) (6.5) (100) (98.6) (0.1) (1.3)
21
It is important to note that coastal shipping does not provide
„end-to-end‟ connectivity, i.e. it cannot be solely relied upon to transport
goods from the starting location to the final destination. Therefore, the
coastal shipping costs in reality may include some additional costs that
are incurred as a result of the movement of goods from the port to the
final destination, presumably through links to road and rail networks.
These additional „last mile connectivity‟ costs incurred by the coastal
shipping sector are not accounted for in this analysis and hence the cost
savings presented in Table 4 may be seen as overestimates.
In addition to the economic and environmental benefits of
coastal shipping, there are other social benefits of transporting goods by
sea rather than by land. Transporting goods by sea as opposed to roads
would lead to less congestion on roads by freight traffic, which would in
turn lead to free movement of passenger traffic and subsequently a
reduction in passenger travel times. Moreover, as noted in the
introduction, road accidents are a common occurrence in India leading to
significant losses in terms of human fatalities, injuries to people and
damage to property. Thus, a modal shift from road to sea transport
would lead to a reduction in the number of accidents occurring on roads
and a consequent reduction in the economic loss to society.
The TTS-RITES study presented some estimates of unit accident
costs for road and rail transport borrowing these values from AITD
(2002), which estimated accident cost as the sum of real resource costs,
such as vehicle damage, medical expenditure, police costs and the
discounted value of the victim‟s future output. In addition, the AITD
study also accounted for the pain, grief and suffering of those involved in
road accidents by valuing these intangible costs by the willingness to pay
approach. The unit accident costs based on the above approach and
adjusted to 2012-13 prices are Rs. 0.061 per tonne-km for road transport
and Rs. 0.001 per tonne-km for rail transport.
22
The total cost savings values in Table 4 are an underestimate of
the true value of the benefits of coastal shipping due to the non-inclusion
of social costs of transportation as discussed above. However the unit
road and rail accident costs (as estimated by the AITD study) as a
proportion of total resource costs may be used to scale the cost savings
estimates upwards to at least partially account for the social benefits
derived from transporting goods via sea as opposed to land. This leads to
an estimate of Rs. 16 – 64 billion (2012-13 prices). Since rail accident
costs are negligible, the benefit derived from a modal shift from sea to
rail (i.e. a change in the lower-bound estimate) is insignificant. The
inclusion of road accident costs leads to an increase in the benefits of
coastal shipping vis-a-vis road transport to the tune of Rs. 2 billion. Note
that accident costs for coastal shipping are not readily available so they
have been assumed as zero here although this may not be the case in
reality. Having said that, the number of road accidents far outweigh the
number of shipping accidents in India in any given year, however in
some cases the latter may cause greater and often more sudden damage
or distress. It is also important to note that all the monetary values
derived above pertain to the quantity of goods transported via coastal
shipping in the year 2012-13. In other words, if the amount of goods
transported via sea as opposed to land changes, the monetary values
would also change accordingly.
As noted in the introduction, only 7 percent of total domestic
freight is transported by sea in India. The share of coastal shipping in the
overall domestic cargo movement is significantly lower than that of road
and rail (54 and 39 percent respectively). Insufficient infrastructure and
the absence of favourable policies are largely responsible for the low
share of coastal shipping in domestic freight transportation in India. In
particular, the following bottlenecks in the coastal shipping sector have
been identified by KPMG (2014) (see also Sundar and Jaswal, 2007):
23
a. The provision of concessional freight fares by the railways on the
transportation of large volumes of goods over long distances
gives tough competition to coastal shipping;
b. The absence of concessional and long-duration finance for the
acquisition of coastal vessels creates significant debt servicing
burden on ship owners. The typical interest rate charged to ship
owners is between 12-14 percent annually for an average period
of seven years. This makes coastal freight uncompetitive vis-a-vis
road and rail freight as ship owners are forced to pass on the
effects of high financing costs to the end users;
c. High operating costs in coastal shipping as a result of high
duties/taxes on bunker fuel and the high manning scale of
coastal vessels may render coastal shipping uncompetitive vis-a-
vis road and rail transportation; and
d. Inadequate facilities at ports for coastal vessels including the
absence of dedicated berths for coastal shipping, leading to long
waiting times at major ports, and the absence of quality handling
facilities at minor ports, poses challenges to coastal vessel
operators and may even lead to an increase in the costs of
coastal shipping. Moreover, connectivity between the hinterland
and minor ports is not as strong as it is for major ports.
If some or all of the bottlenecks in the coastal shipping sector are
eliminated, the share of coastal shipping in the overall domestic cargo
movement would rise from its current level of 7 percent. It was noted in
the introduction that the share of coastal shipping in domestic freight
transportation in India increased from 3 percent in 1986-87 to 7 percent
in 2007-08 (TTS-RITES). Assuming that the rise in the share of coastal
shipping in the future, due to the absence of bottlenecks in the coastal
shipping sector, is similar to its growth rate in the past twenty years or
so, a doubling of the share of coastal shipping (i.e. 14 percent) could be
24
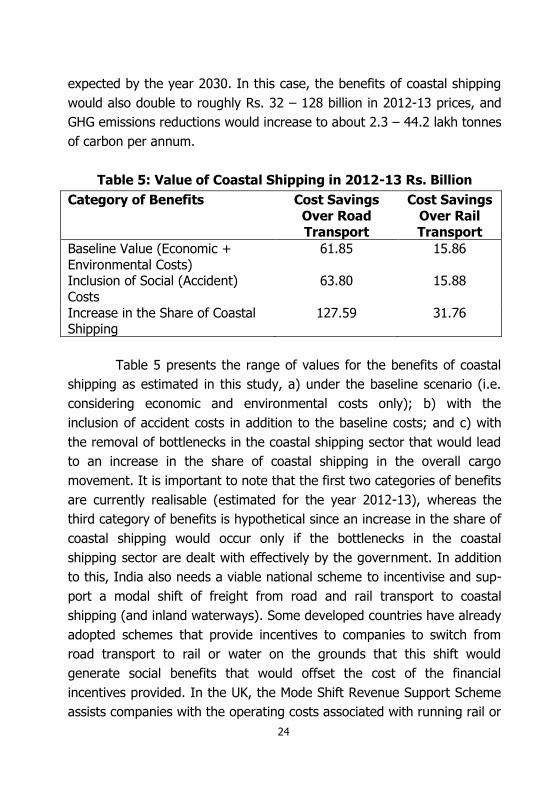
expected by the year 2030. In this case, the benefits of coastal shipping
would also double to roughly Rs. 32 – 128 billion in 2012-13 prices, and
GHG emissions reductions would increase to about 2.3 – 44.2 lakh tonnes
of carbon per annum.
Table 5: Value of Coastal Shipping in 2012-13 Rs. Billion
Category of Benefits
Cost Savings
Over Road
Transport
Cost Savings
Over Rail
Transport
Baseline Value (Economic +
Environmental Costs)
61.85 15.86
Inclusion of Social (Accident)
Costs
63.80 15.88
Increase in the Share of Coastal Shipping
127.59 31.76
Table 5 presents the range of values for the benefits of coastal
shipping as estimated in this study, a) under the baseline scenario (i.e.
considering economic and environmental costs only); b) with the
inclusion of accident costs in addition to the baseline costs; and c) with
the removal of bottlenecks in the coastal shipping sector that would lead
to an increase in the share of coastal shipping in the overall cargo
movement. It is important to note that the first two categories of benefits
are currently realisable (estimated for the year 2012-13), whereas the
third category of benefits is hypothetical since an increase in the share of
coastal shipping would occur only if the bottlenecks in the coastal
shipping sector are dealt with effectively by the government. In addition
to this, India also needs a viable national scheme to incentivise and sup-
port a modal shift of freight from road and rail transport to coastal
shipping (and inland waterways). Some developed countries have already
adopted schemes that provide incentives to companies to switch from
road transport to rail or water on the grounds that this shift would
generate social benefits that would offset the cost of the financial
incentives provided. In the UK, the Mode Shift Revenue Support Scheme
assists companies with the operating costs associated with running rail or
25
inland water freight transport instead of road, where the former modes
of transportation are more expensive than road transport10. The
European Union‟s Marco Polo Programme, which is currently the largest
and most comprehensive modal shift programme in the world, is
designed to ease road congestion and its attendant pollution by providing
companies with financial support to shift freight from roads to greener
modes of transportation like railways, sea-routes and inland waterways11.
The state government of Kerala, as part of its effort to decongest roads,
has initiated a scheme to divert cargo from roads to coastal shipping
wherein an incentive of Rs. 1 per tonne per kilometre is provided to both
shippers and ship owners for cargo transported along its coast (MoS,
2014). The target is to divert at least 20 percent of the cargo currently
moved by road to coastal shipping by 2015 and 40 percent by 2020. At
the national-level, government and policy makers are increasingly
deliberating the need to promote coastal shipping in India (NTDPC, 2014;
MoS, 2014). The Ministry of Shipping recently released a „vision
document‟ for Coastal Shipping, Tourism and Regional Development that
sets the goal of increasing the share of coastal shipping in India‟s modal
cargo mix from 7 percent to 10 percent by 2019-2020 through subsidies
and the promotion of cruise tourism12. Consequently, the ministry has
taken several initiatives that include tax exemption on bunker fuels,
service tax parity with other modes of transportation, relaxed cabotage
for special vessels, development of new ports etc. to encourage the
transportation of goods by coastal shipping13. This is a step in the right
direction and continued effort in terms of both infrastructure
development and the creation of favourable policies (particularly an
incentive scheme for a modal shift to water transportation) may lead to
coastal shipping becoming a feasible and preferred alternative mode of
10 See the Guide to Mode Shift Revenue Support Scheme, Department of Transport, London (April
2015) for more details – https://www.gov.uk/government/publications/mode-shift-revenue-support-msrs-scheme-2015-to-2020
11 See http://ec.europa.eu/transport/marcopolo/ for more information. 12 See http://pibmumbai.gov.in/scripts/detail.asp?releaseId=E2015PR2194 13 See http://pib.nic.in/newsite/PrintRelease.aspx?relid=134023 for more information.
26
freight transportation in India in the long-run. The analysis presented in
this study makes a strong case for why this would be beneficial to the
country.
27
REFERENCES
AITD (2002), “Environmental and Social Sustainability of Transport –
Comparative Study of Rail and Road”, Asian Institute of
Transport Development.
Chatterjee, S., K. K. Dhavala, and M. N. Murty, (2007), “Estimating Cost
of Air Pollution Abatement for Road Transport in India: Case Studies of Andhra Pradesh and Himachal Pradesh”, Economic and Political Weekly, 42(36): 3662-3668.
DGCI&S (2012-13), Statistics of the Inland Coasting Trade Consignments of India, Directorate General of Commercial Intelligence and
Statistics, Ministry of Commerce and Industry, Government of India.
European Commission (2009, 2010), EU Energy and Transport in Figures,
Statistical Pocketbook, European Union.
KPMG (2014), “All aboard! Insights into India‟s Maritime Community”,
KPMG India.
Mashelkar Committee Report (2002), “Report of the Expert Committee on
Auto Fuel Policy Report”, Chairman: R. A. Mashelkar, Government of India.
MoS (2014), “Report of the Committee on Standards for Coastal and
Inland Vessels; Sea Limits for Inland Vessels; and Incentive Schemes for Modal Shift of Cargo from Road/Rail to Waterways”,
Ministry of Shipping, Government of India.
Nordhaus, W. D. (2011), “Estimates of the Social Cost of Carbon:
Background and Results from the RICE-2011 Model”, National
Bureau of Economic Research, Working Paper 17540.
NTDPC (2014), India Transport Report: Moving India to 2032, National
Transport Development Policy Committee, Planning Commission, Government of India.
Schlömer S., T. Bruckner, L. Fulton, E. Hertwich, A. McKinnon, D. Perczyk, J. Roy, R. Schaeffer, R. Sims, P. Smith, and R. Wiser
(2014), “Annex III: Technology-Specific Cost and Performance
28
Parameters”, In: Climate Change 2014: Mitigation of Climate Change, Contribution of Working Group III to the Fifth Assessment Report of the Intergovernmental Panel on Climate
Change [Edenhofer, O., R. Pichs-Madruga, Y. Sokona, E. Farahani, S. Kadner, K. Seyboth, A. Adler, I. Baum, S. Brunner,
P. Eickemeier, B. Kriemann, J. Savolainen, S. Schlömer, C. von
Stechow, T. Zwickel and J.C. Minx (eds.)], Cambridge University Press, Cambridge, United Kingdom and New York, NY, USA.
Sundar, S. and P. Jaswal, (2007), “Bottlenecks in the Growth of Coastal Shipping”, India Resident Mission Policy Brief No. 14, Asian
Development Bank, New Delhi.
TTS-RITES (year unspecified), Total Transport System Study on Traffic Flows and Modal Costs (Highways, Railways, Airways and Coastal Shipping), Planning Commission, Government of India. http://planningcommission.gov.in/reports/genrep/index.php?rept
s=rites.html
MSE Monographs * Monograph 23/2012
Green Economy – Indian PerspectiveK.S. Kavikumar, Ramprasad Sengupta, Maria Saleth, K.R.Ashok and R.Balasubramanian
* Monograph 24/2013Estimation and Forecast of Wood Demand and Supply in TamilanduK.S. Kavi Kumar, Brinda Viswanathan and Zareena Begum I
* Monograph 25/2013Enumeration of Crafts Persons in IndiaBrinda Viswanathan
* Monograph 26/2013Medical Tourism in India: Progress, Opportunities and ChallengesK.R.Shanmugam
* Monograph 27/2014Appraisal of Priority Sector Lending by Commercial Banks in IndiaC. Bhujanga Rao
* Monograph 28/2014Fiscal Instruments for Climate Friendly Industrial Development in Tamil NaduD.K. Srivastava, K.R. Shanmugam, K.S. Kavi Kumar and Madhuri Saripalle
* Monograph 29/2014Prevalence of Undernutrition and Evidence on Interventions: Challenges for IndiaBrinda Viswanathan.
* Monograph 30/2014Counting The Poor: Measurement And Other IssuesC. Rangarajan and S. Mahendra Dev
* Monograph 31/2015
Technology and Economy for National Development: Technology Leads to Nonlinear Growth
Dr. A. P. J. Abdul Kalam, Former President of India
* Monograph 32/2015
India and the International Financial System
Raghuram Rajan
* Mongraph 33/2015
Fourteenth Finance Commission: Continuity, Change and Way Forward
Y.V. Reddy
* Mongraph 34/2015
Farm Production Diversity, Household Dietary Diversity and Women's BMI: A Study of Rural Indian Farm Households
Brinda Viswanathan