Embed Size (px)
Citation preview
Mathematical Biosciences 258 (2014) 11–18
Contents lists available at ScienceDirect
Mathematical Biosciences
journal homepage: www.elsevier.com/locate/mbs
Benefits of hepatitis C virus treatment: A balance of preventing onward
transmission and re-infection
A.S. de Vos a,∗, M.E.E. Kretzschmar a,b
a Julius Center, University Medical Center Utrecht, Utrecht, The Netherlandsb Centre for Infectious Disease Control, RIVM, Bilthoven, The Netherlands
a r t i c l e i n f o
Article history:
Received 26 January 2014
Revised 9 September 2014
Accepted 13 September 2014
Available online xxx
Keywords:
Hepatitis C virus
Injecting drugs
Treatment as prevention
Mathematical modelling
Epidemiology
a b s t r a c t
By treating HCV-infected injecting drug users (IDUs), we may prevent infections to other IDUs. Curing pref-
erentially individuals who most often share injecting equipment has the advantage of preventing more
infections. However, such high risk behavior IDUs are also more likely to become re-infected. We have
created a model that can inform us about most efficient HCV treatment policy; the expected benefits per
treatment of one HCV-infected IDU are calculated, defined as a decrease in the number of chronic HCV infec-
tions. This includes the probability that the cured IDU remains uninfected, and the number of new infections
prevented both directly and indirectly in further infection generations. We explore analytically how these
benefits depend on the syringe sharing frequency of the cured IDU.
We find that whom to best cure is determined by the prevalence of HCV contamination among exchanged
syringes within the IDU population. Treating lowest risk IDUs is most beneficial above a certain prevalence
of contamination, since the term for re-infection dominates the equation in this domain. At lower prevalence
treating highest risk IDUs is most beneficial, since here the term for prevention dominates. In a much simplified
model the threshold between domains is found at exactly 50% HCV prevalence. The threshold value is lowered
when taking HCV induced mortality or increased infectiousness during an acute stage of infection into
account. It is increased when taking into account treatment duration, or when HCV-treatment is combined
with intervention that reduces the syringe sharing rate of the cured IDU.
© 2014 Elsevier Inc. All rights reserved.
1
i
t
9
p
i
m
t
p
i
a
t
w
b
a
a
w
i
o
t
t
c
i
t
f
e
I
h
0
. Introduction
By sharing of contaminated needles and syringes, blood-borne
nfections are spread among injecting drug users (IDUs). Especially
ransmission of hepatitis C virus (HCV) via this route is likely: 50–
0% prevalence within IDU populations is common [1]. In order to
revent the severe liver disease that can result from long term HCV
nfection, infected individuals may be cured by use of antiviral treat-
ent [2]. Additional motivation for treatment is that it may prevent
ransmission of HCV to other IDUs, a concept known as treatment as
revention [3].
In this light, models have been set up to project the expected
mpact of HCV treatment of IDUs, taking herd immunity effects into
ccount. Such studies explored the impact of differing levels of HCV
reatment coverage, for specific settings and within specified time-
indows, on HCV prevalence [4–7] or HCV related costs [8]. It has
een noted that the benefits of treatment may be impacted by who
∗ Corresponding author. Tel.: +31 887568644/624161015;
E-mail address: [email protected], [email protected] (A.S. de Vos).
2
2
s
ttp://dx.doi.org/10.1016/j.mbs.2014.09.006
025-5564/© 2014 Elsevier Inc. All rights reserved.
re treated; ex-IDUs or current IDUs [8], those who are or those who
re not also on methadone maintenance therapy [9,10].
The potential for preventing infections to other IDUs is greatest
hen curing individuals who often share their injecting equipment,
.e. high risk IDUs. However, such IDUs also have a greater probability
f becoming re-infected with HCV, which limits the benefits of their
reatment both for themselves and for the population.
Here we aim to answer more in general as to which IDUs are best
argeted for HCV treatment, from a public health perspective. We cal-
ulated the benefits per treated IDU, defined as the expected decrease
n the number of chronic infections within the IDU population. Both
he risk for re-infection and the potential for preventing onward in-
ection are captured in this single measure. This allowed us to explore
xplicitly how these benefits depend on the risk level of the treated
DU, in combination with other variables such as HCV prevalence.
. Methods for obtaining the benefits
.1. The model
Our model describes the expected time spent within different
tates of HCV infection (uninfected, acutely infected, chronically
12 A.S. de Vos, M.E.E. Kretzschmar / Mathematical Biosciences 258 (2014) 11–18
UninfectedAcutely infected
Chronically infected
Under treatment
(1-d)θ
dθ
λ
μμ μ+μc μ
s
(1-s)
recruitment
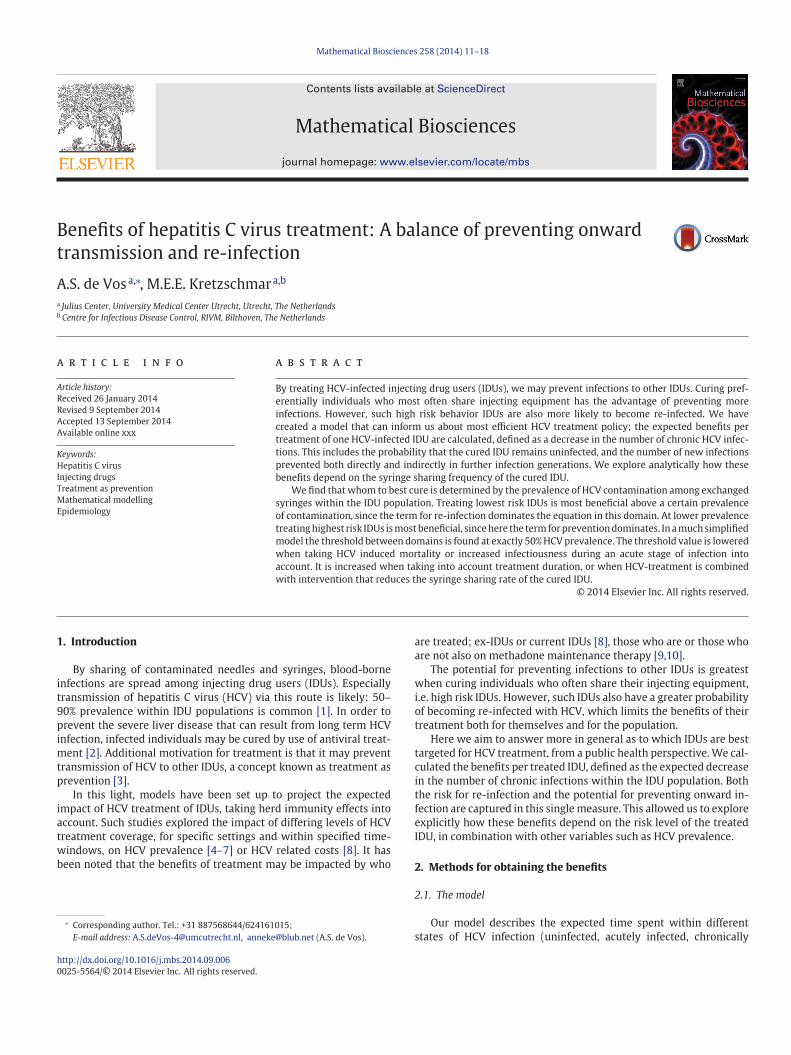
Fig. 1. A model of hepatitis C virus treatment for injecting drug users. The blue arrows
indicate per month probabilities to transition between states. The dark red arrow indi-
cates the act of starting treatment. The light purple arrows indicate the state transition
probabilities at the end of treatment, which lasts v months. (For interpretation of the
references to color in this figure legend, the reader is referred to the web version of
this article.)
Table 1
Parameters and their values as used for the numerical results
Parameter Baseline value (alternativea) Description
θ 0.33 per month Loss rate of HCV acute status
d 0.26 Probability of clearing HCV
pC 0.05 per syringe Infectiousness chronic HCV
pA 0.05 (0.5a) per syringe Infectiousness acute HCV
μ 0.0083 per month Death and stop injecting rate
μc 0 (0.002a) per month Additional HCV induced mortality
v 0 (12a) months Treatment duration
s 1 Treatment success probability
a Alternative values to show parameter effects, Figs. 4, 6 and 5 respectively.
W
s
d
a
1
s
w
I
g
p
i
H
s
m
t
o
u
T
o
3
3
b
s
t
s
s
i
c
W
g
H
b
o
u
i
w
T
infected, under treatment) for an IDU, as influenced by treatment for
HCV (see Fig. 1). Within first period of acute infection, individuals may
clear HCV naturally. Only with long term chronic infection individual
health is seriously compromised. Therefore we calculate the benefits
of treating one chronically HCV infected IDU, B, defined as a reduc-
tion in the number of chronic HCV infections that would have other-
wise occurred at any point in time, over the complete transmission
chain.
For this calculation we assume equilibrium conditions, that is we
consider a population with a stable HCV prevalence, as well as a stable
distribution of risk behavior (frequency of sharing syringes) of IDUs.
Here we focus on the curing of one individual in an infinitely large
population, i.e. curing of this one IDU does not change the fractions
infected with HCV.
We distinguish between direct (Section 3.1) and indirect
(Section 3.2) benefits of curing. The direct effects consist of the prob-
ability for the treated IDU (the index) to become cured, minus their
probability for chronic re-infection. We also include in the direct ef-
fects the prevention of b0 secondary infections otherwise produced by
the index. In a first step for calculating the indirect effects of curing, we
consider one IDU who is not infected by the index as a consequence of
curing. The benefits of preventing this secondary case may be undone
when this IDU acquires chronic infection from sharing syringes with
other IDUs. By preventing this IDU from being infected by the index,
however, we also prevent a number b̃o of onward infections further
down the transmission chain.
The direct effects of curing can be calculated knowing only the risk
of the cured index. The indirect effects depend on the syringe sharing
frequency of those not being infected, which in turn depends on the
population risk distribution. In Section 3.4, for the simplifying case
of a homogeneous population, we derive an explicit formula for the
total benefits B.
In Section 3.5 we show the existence of a threshold in vi-
ral prevalence, which fully determines who should be treated to
maximize B. In Section 3.6 we take into account treatment du-
ration and the treatment success rate. In Section 3.7 we extend
the model with HCV induced mortality and behavioral change by
intervention.
2.2. Definitions
In our calculations, notation is as follows: r is the risk of the treated
index IDU, in syringes borrowed and lent out to other IDUs each
month. Of syringes borrowed by the index, a proportion ma carry
acute infection, a proportion mc carry chronic infection. These pro-
portions follow from the prevalence among IDUs. When the index
borrows at random,
ma =∑∞
r̂=0 fr̂ r̂Ar̂∑∞r̂=0 fr̂ r̂
and mc =∑∞
r̂=0 fr̂ r̂Cr̂∑∞r̂=0 fr̂ r̂
,
with fr̂ representing the number of IDUs with risk r̂, and Ar̂ and Cr̂ re-
spectively the acute and chronic HCV prevalence among these IDUs.
e define total prevalence among syringes m = ma + mc. As we as-
ume all IDUs to borrow and lend out syringes equally, ma and mc
escribe also the probabilities for an IDU borrowing a syringe to be
cutely or chronically infected respectively. Therefore, a proportion
− m of those borrowing syringes from the index will be uninfected.
We define pc, the probability of becoming infected when using a
yringe contaminated by a chronically infected IDU, and pa, the same
hen using a syringe previously used by an acutely infected IDU.
ndividuals move out of the acute HCV phase with rate θ , where d
ives the proportion of these infections being cleared and 1 − d the
roportion of infections leading to chronic HCV. μ is the death or stop
njecting rate, μc the additional death rate experienced by chronically
CV infected IDUs.
Treatment lasts for a fixed time, v, in months. Immediately upon
tarting treatment the IDU is no longer infectious, but during treat-
ent the IDU cannot be re-infected. With s we denote the probability
hat treatment is successful in clearing HCV. We explore the effects
f treating the index once.
The model is represented in Fig. 1. Numerical results were obtained
sing Mathematica version 7. Parameter values are given in Table 1.
hese parameter values were based on published literature, as previ-
usly described and used in [11].
. Calculation of the benefits
.1. Direct benefits
For clarity of the model exposition, we first assume treatment to
e instantaneous and always successful, i.e. v = 0 and s = 1, and we
et μc = 0, HCV infection does not cause mortality.
To compute the number of infections prevented, we need to know
he impact of curing on the time individuals spend in the different
tates: uninfected u, acutely infected a and chronically infected c re-
pectively. Individuals move through these different states as shown
n Fig. 1. Starting uninfected an individual can become infected, yet
ome back into the uninfected state after clearing an acute infection.
e denote the probability for this to happen by g and we get
= λ
λ + μ
dθ
θ + μ.
ere the force of infection λ is assumed to be constant and given
y λ = r(pama + pcmc). The process of re-infection and clearing can
ccur unlimited number of times. The expected number of times the
ninfected state is reached for an individual starting uninfected is
=∞∑
i=0
gi = 1
1 − g.
We denote by Tij the time spent in state j when starting in state i
ith i, j = u, a, c. We get
uu = 1
λ + μ
1
1 − g
Tua = 1
θ + μ
λ
λ + μ
1
1 − g= λ
θ + μTuu
A.S. de Vos, M.E.E. Kretzschmar / Mathematical Biosciences 258 (2014) 11–18 13
D
a
e
T
t
v
i
b
t
c
g
c
D
o
(
I
b
c
a
b
3
i
r
f
o
i
b
w
i
l
f
(
a
t
t
I
i
c
b
w
a
o
f
b
3
f
i
t
b
B
T
t
t
b
p
w
λ
l
m
a
t
d
3
v
b
i
b
w
d
g
B
m
t
p
B
F
e
Tuc = 1
μ
(1 − d)θ
θ + μ
λ
λ + μ
1
1 − g= (1 − d)θ
θ + μ
λ
μTuu
Tau = dθ
θ + μTuu
Taa = 1
θ + μ+ dθ
θ + μTua
Tac = 1
μ
(1 − d)θ
θ + μ+ dθ
θ + μTuc
Tcc = 1
μ= Tuu + Tua + Tuc = Tau + Taa + Tac.
ue to the Markov property of the model, the number of infections
n individual in a given state will cause is simply proportional to the
xpected remaining life-time spend in the acute and chronic states.
o compute the number of secondary infections prevented by curing
he index, we subtract the number of infections caused by an indi-
idual who is not yet (but may become) infected from the number of
nfections caused by a chronically infected individual:
o = r(1 − m)(pcTcc − (paTua + pcTuc)).
For computing the benefits we are only interested in those infec-
ions that would have become chronic, since those that are cleared
ause no disease. The probability of an infection to become chronic is
iven by
= (1 − d)θ
θ + μ.
ue to curing the index will not be chronically infected for a fraction
f his remaining injecting life-time
Tcc − Tuc)μ = 1 − (1 − d)θ
θ + μ
λ
λ + μ
1
1 − g= 1 − cλTuu.
n other words, we lower the number of chronic infections by 1,
ut chronic re-infection cancels out this benefit with probabilityλ
λ+μ1
1−g = cλTuu. We now define the direct benefits of curing bd
s:
d = 1 − cλTuu + cbo.
.2. Indirect benefits
We first consider one individual who was not infected due to the
ndex not being infectious, and who shares syringes with frequency
˜. The number of infections b̃o that are prevented by this, within one
urther infection generation, is obtained by subtracting the number
f infections caused by an IDU starting in the uninfected state from
nfections caused if this IDU were acutely infected:
˜o = r̃(1 − m)(paTaa + pcTac − (paTua + pcTuc))
ith risk r substituted by risk r̃ within λ in Tij.
When not infected by the index, an IDU may still become chron-
cally infected by borrowing syringes from other IDUs. The fraction
ifetime with chronic infection prevented due to not becoming in-
ected by the index is given by:
Tac − Tuc)μ = (1 − d)θ
θ + μ
1
1 − g− (1 − d)θ
θ + μ
λ
λ + μ
1
1 − g
= c − cλ(Tuu − Tau),
gain with r replaced by r̃ within λ in Tij. The above equation describes
he probability that by not being infected by the index, chronic infec-
ion is averted for the remaining lifetime, rather than merely delayed.
nfection would have turned chronic with probability c. By not be-
ng infected by the index, the individual will be at risk for obtaining
hronic infection from others for an additional time Tuu − Tau.
We define the indirect benefits of one IDU not being infected b̃d:
˜d = −cλ(Tuu − Tau)+ cb̃o,
here in λ and in Tij, r̃ replaces r. Note that while the probability of
cquiring chronic infection from others is included here, prevention
f chronic infection acquired from the index was already accounted
or in bd, and is therefore not repeated here. Again we only count as
eneficial those prevented infections that would have turned chronic.
.3. A homogeneous population at equilibrium
To obtain the full benefits B of curing one IDU, we need to account
or the benefits b̃d from any IDU not infected due to curing of the
ndex, over all further infection generations. These will depend on
he risk of the IDUs that borrow from the index, and the risk of those
orrowing from these IDUs in turn, etc. To enable full calculation of
therefore, we need to fully define the population risk structure.
o demonstrate the method, we consider here the simplest situation,
hat is we assume a homogeneous population with all IDUs except the
reated index engaging in risk r̃. With U, A and C representing num-
ers of uninfected, acutely and chronically infected IDUs respectively,
opulation change is described by:
dU
dt= μ(U + A + C)− λU + dθA − μU
dA
dt= +λU − θA − μA
dC
dt= (1 − d)θA − μC
ith
= r̃paA
U + A + C+ r̃pc
C
U + A + C.
Setting the above differential equations to 0, we find that in equi-
ibrium
a = A
U + A + C= μ(r̃(paμ + pc(1 − d)θ)− μθ − μ2)
r̃(paμ + pc(1 − d)θ)(μ + (1 − d)θ)
mc = C
U + A + C= (1 − d)θ
μma
m = ma + mc = 1 − μ(μ + θ)
r̃(paμ + pc(1 − d)θ).
Note that in this homogeneous population only, HCV prevalence
mong syringes equals HCV prevalence among IDUs. From this equa-
ion for m at equilibrium we derive r̃ (see Fig. 2). This allows us to
erive the total benefits B, as shown below.
.4. The full benefits
We designate the IDUs whose infection by the index has been pre-
ented as generation 1; furthermore we denote IDUs whose infection
y an individual in generation i has been prevented as generation
+ 1 for all i ≥ 1. The number of IDUs in each generation hence equals
ob̃i−1o . Multiplying this by the indirect benefits per prevented case, b̃d,
e obtain the indirect benefits per generation. The sum of these in-
irect benefits over all generations, together with the direct benefits,
ives us the full benefits:
= bd + bob̃d
i=∞∑
i=1
b̃o
i−1 = bd + bob̃d
1
1 − b̃o
.
Using the above equilibrium conditions on ma and mc for the ho-
ogeneous population, we find that b̃o = 1 − m, equal to the frac-
ion of uninfected syringes (or IDUs). This is clearly < 1 when HCV is
resent in the population, ensuring convergence of the total benefits
. In Fig. 2 we show bd and B for a fully homogeneous population, in
ig. 3 we vary risk of the treated index.
B remains bounded also for any risk heterogeneous population at
quilibrium, even though for highest risk IDUs possibly b̃o > 1. In the
14 A.S. de Vos, M.E.E. Kretzschmar / Mathematical Biosciences 258 (2014) 11–18
0.0 0.2 0.4 0.6 0.8 1.00
1
2
3
4
0
1
2
3
4
prevalence among syringes m
decr
ease
in c
hron
ic in
fect
ions
syri
nges
sha
red
direct benefits bd full benefits B r
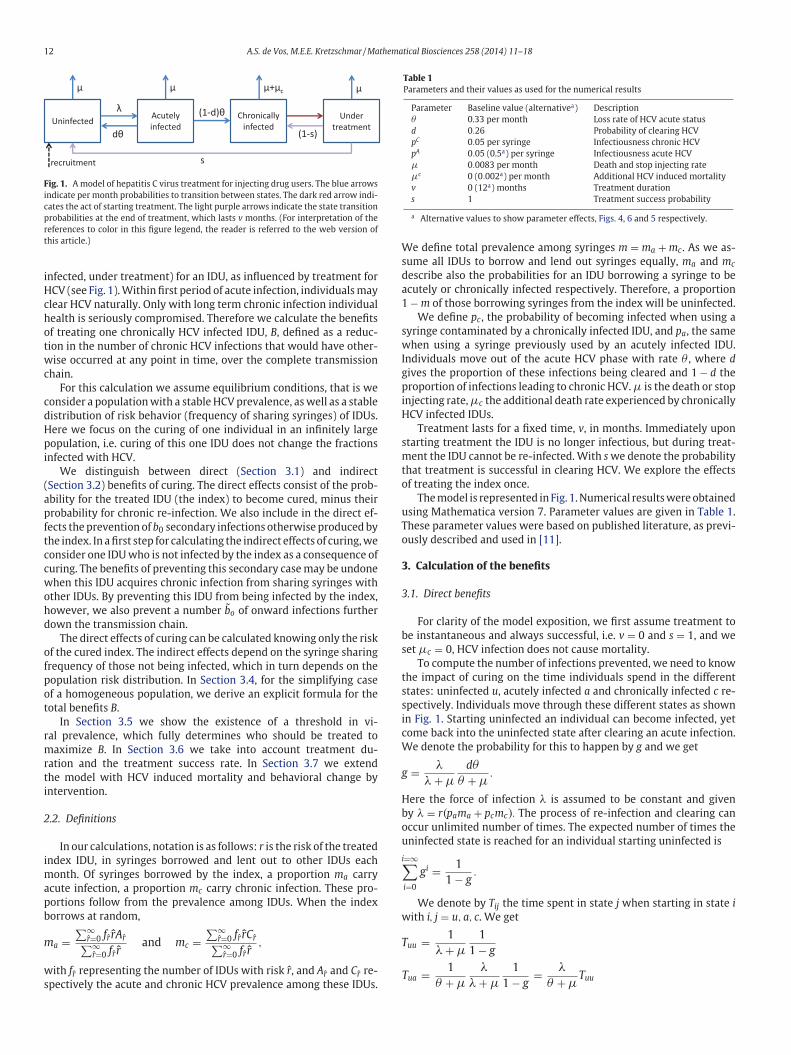
Fig. 2. Benefits of curing one IDU in a homogeneous population. We assume a homogeneous population in which all IDUs, including the treated index, share r̃. syringes per month,
resulting in equilibrium HCV prevalence m. Solid black line: direct benefits bd of curing one IDU. This includes curing the one IDU (minus their probability for chronic re-infection),
and the number of IDUs that would have otherwise been chronically infected by this IDU. Dotted black line: total effects of curing one IDU. This additionally includes that those
not infected by the cured IDU do not infect others, etc., but also the fact that these IDUs may still become chronically infected by sharing with other IDUs. We find that the direct
benefits bd are an underestimate of the full benefits B when m < 0.5, but an overestimate when m > 0.5.
0.0 0.2 0.4 0.6 0.8 1.00
1
2
3
4
decr
ease
in c
hron
ic in
fect
ions
prevalence among syringes m
r = 0 (ex − IDU) r = 0.5 r = 1direct benefits bd full benefits B
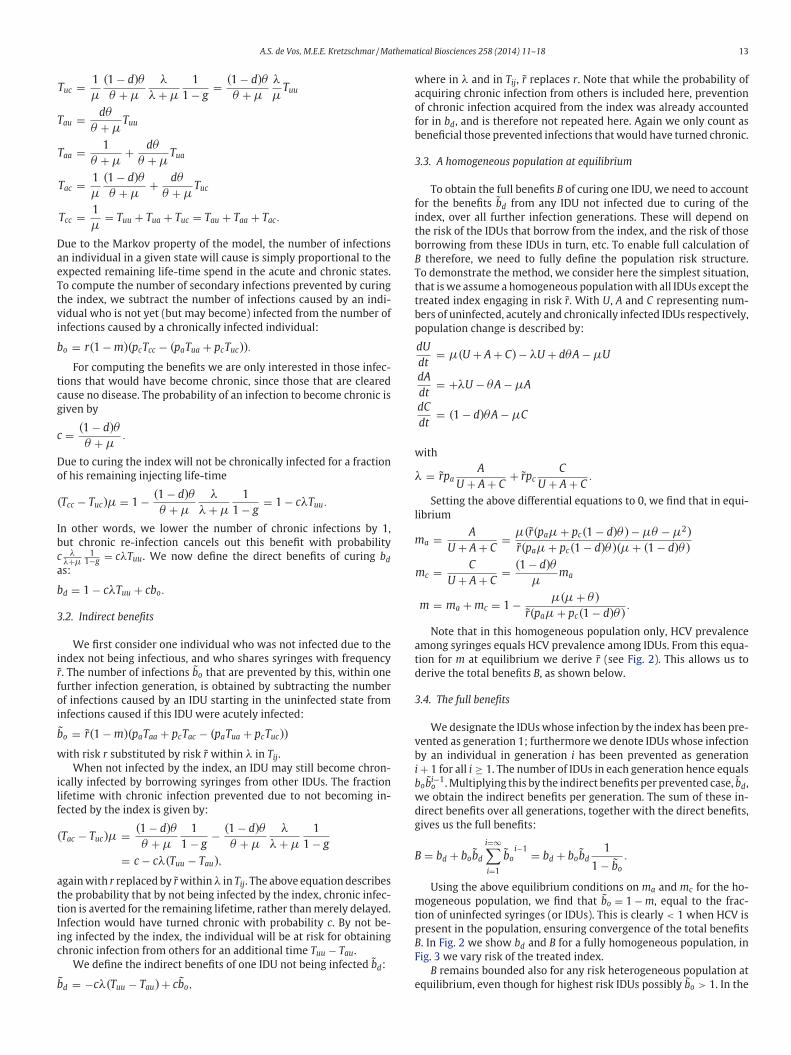
Fig. 3. Benefits of curing one IDU. Solid lines: direct benefits bd of curing one IDU who shares r syringes per month. Dotted lines: total effects of curing one IDU, B, assuming a
homogeneous population in which all IDUs apart from the treated index share r̃. syringes per month, resulting in equilibrium HCV prevalence m. We find that the benefits (both
direct and full) increase with risk of the index r when m < 0.5, but decrease with risk r when m > 0.5.
3
d
b
W
i
a
b
f
i
endemic steady state, an average newly infected individual causes on
average one new infection before clearing infection or dying. Given
also the possibility, when not infected through transmission from the
index, for infection by others instead, b̃o for the average prevented
case must be < 1.
Note that since our formulae presume a stable HCV prevalence,
outside of equilibrium conditions our calculations are not valid. For
example, with lower than equilibrium prevalence, an average b̃o > 1
is likely. In this case, for proper calculation of B, we should incorpo-
rate how b̃o decreases over time as prevalence increases toward the
equilibrium. Therefore, at lower than equilibrium prevalence, our cal-
culation of B (ignoring prevalence change) would actually represent
an overestimate and upper bound of the total decrease in the number
of chronic HCV infections resulting from curing one IDU.
r.5. A threshold determining whom to treat
When chronic and acute infectiousness are equal, pa = pc = p, the
irect benefits bd simplify to:
d = crpTuu(1 − 2m)+ 1.
e see that bd = 1 for m = 0.5 regardless of r. rpTuu is monotonically
ncreasing with risk r so that we can conclude that for m < 0.5 bd is
n increasing function of r. That is, if we wish to maximize the direct
enefits we target treatment to those with highest risk. Conversely,
or m > 0.5 risk of re-infection outweighs the potential to prevent
nfection to others, we find that curing of those with lowest risk will
esult in largest benefit.
A.S. de Vos, M.E.E. Kretzschmar / Mathematical Biosciences 258 (2014) 11–18 15
0.0 0.2 0.4 0.6 0.8 1.00
1
2
3
4
prevalence among syringes m
decr
ease
in c
hron
ic in
fect
ions
r = 0 (ex − IDU) r = 0.5 r = 1direct benefits bd full benefits B
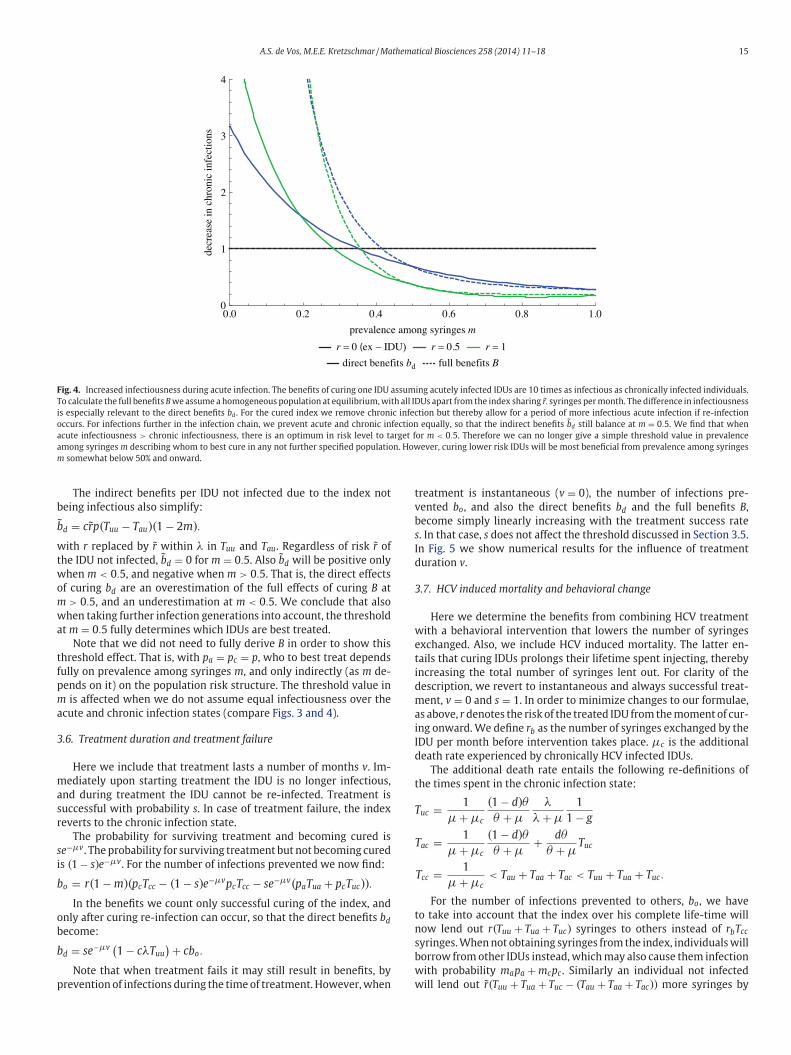
Fig. 4. Increased infectiousness during acute infection. The benefits of curing one IDU assuming acutely infected IDUs are 10 times as infectious as chronically infected individuals.
To calculate the full benefits B we assume a homogeneous population at equilibrium, with all IDUs apart from the index sharing r̃. syringes per month. The difference in infectiousness
is especially relevant to the direct benefits bd . For the cured index we remove chronic infection but thereby allow for a period of more infectious acute infection if re-infection
occurs. For infections further in the infection chain, we prevent acute and chronic infection equally, so that the indirect benefits b̃d still balance at m = 0.5. We find that when
acute infectiousness > chronic infectiousness, there is an optimum in risk level to target for m < 0.5. Therefore we can no longer give a simple threshold value in prevalence
among syringes m describing whom to best cure in any not further specified population. However, curing lower risk IDUs will be most beneficial from prevalence among syringes
m somewhat below 50% and onward.
b
b
w
t
w
o
m
w
a
t
f
p
m
a
3
m
a
s
r
s
i
b
o
b
b
p
t
v
b
s
I
d
3
w
e
t
i
d
m
a
i
I
d
t
T
t
n
s
b
w
w
The indirect benefits per IDU not infected due to the index not
eing infectious also simplify:
˜d = cr̃p(Tuu − Tau)(1 − 2m).
ith r replaced by r̃ within λ in Tuu and Tau. Regardless of risk r̃ of
he IDU not infected, b̃d = 0 for m = 0.5. Also b̃d will be positive only
hen m < 0.5, and negative when m > 0.5. That is, the direct effects
f curing bd are an overestimation of the full effects of curing B at
> 0.5, and an underestimation at m < 0.5. We conclude that also
hen taking further infection generations into account, the threshold
t m = 0.5 fully determines which IDUs are best treated.
Note that we did not need to fully derive B in order to show this
hreshold effect. That is, with pa = pc = p, who to best treat depends
ully on prevalence among syringes m, and only indirectly (as m de-
ends on it) on the population risk structure. The threshold value in
is affected when we do not assume equal infectiousness over the
cute and chronic infection states (compare Figs. 3 and 4).
.6. Treatment duration and treatment failure
Here we include that treatment lasts a number of months v. Im-
ediately upon starting treatment the IDU is no longer infectious,
nd during treatment the IDU cannot be re-infected. Treatment is
uccessful with probability s. In case of treatment failure, the index
everts to the chronic infection state.
The probability for surviving treatment and becoming cured is
e−μv. The probability for surviving treatment but not becoming cured
s (1 − s)e−μv. For the number of infections prevented we now find:
o = r(1 − m)(pcTcc − (1 − s)e−μvpcTcc − se−μv(paTua + pcTuc)).
In the benefits we count only successful curing of the index, and
nly after curing re-infection can occur, so that the direct benefits bd
ecome:
d = se−μv(1 − cλTuu
) + cbo.
Note that when treatment fails it may still result in benefits, by
revention of infections during the time of treatment. However, when
reatment is instantaneous (v = 0), the number of infections pre-
ented bo, and also the direct benefits bd and the full benefits B,
ecome simply linearly increasing with the treatment success rate
. In that case, s does not affect the threshold discussed in Section 3.5.
n Fig. 5 we show numerical results for the influence of treatment
uration v.
.7. HCV induced mortality and behavioral change
Here we determine the benefits from combining HCV treatment
ith a behavioral intervention that lowers the number of syringes
xchanged. Also, we include HCV induced mortality. The latter en-
ails that curing IDUs prolongs their lifetime spent injecting, thereby
ncreasing the total number of syringes lent out. For clarity of the
escription, we revert to instantaneous and always successful treat-
ent, v = 0 and s = 1. In order to minimize changes to our formulae,
s above, r denotes the risk of the treated IDU from the moment of cur-
ng onward. We define rb as the number of syringes exchanged by the
DU per month before intervention takes place. μc is the additional
eath rate experienced by chronically HCV infected IDUs.
The additional death rate entails the following re-definitions of
he times spent in the chronic infection state:
uc = 1
μ + μc
(1 − d)θ
θ + μ
λ
λ + μ
1
1 − g
Tac = 1
μ + μc
(1 − d)θ
θ + μ+ dθ
θ + μTuc
Tcc = 1
μ + μc< Tau + Taa + Tac < Tuu + Tua + Tuc.
For the number of infections prevented to others, bo, we have
o take into account that the index over his complete life-time will
ow lend out r(Tuu + Tua + Tuc) syringes to others instead of rbTcc
yringes. When not obtaining syringes from the index, individuals will
orrow from other IDUs instead, which may also cause them infection
ith probability mapa + mcpc. Similarly an individual not infected
ill lend out r̃(Tuu + Tua + Tuc − (Tau + Taa + Tac)) more syringes by
16 A.S. de Vos, M.E.E. Kretzschmar / Mathematical Biosciences 258 (2014) 11–18
0.0 0.2 0.4 0.6 0.8 1.00
1
2
3
4
decr
ease
in c
hron
ic in
fect
ions
prevalence among syringes m
r = 0 (ex − IDU) r = 0.5 r = 1direct benefits bd full benefits B
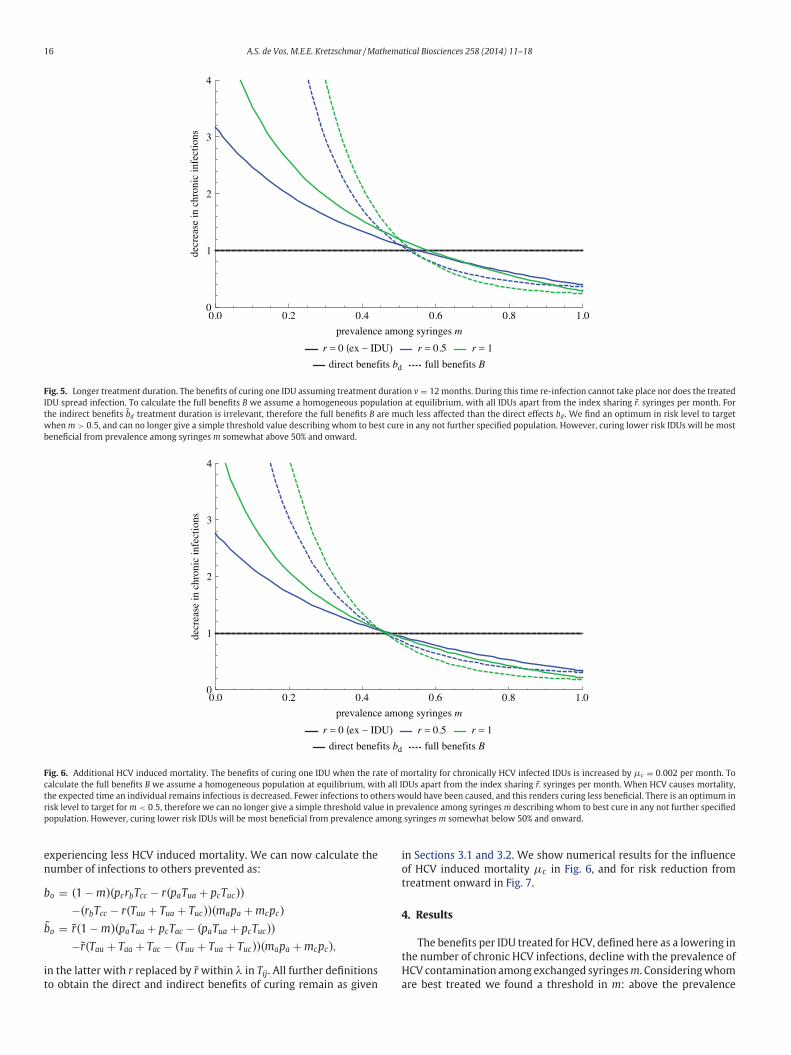
Fig. 5. Longer treatment duration. The benefits of curing one IDU assuming treatment duration v = 12 months. During this time re-infection cannot take place nor does the treated
IDU spread infection. To calculate the full benefits B we assume a homogeneous population at equilibrium, with all IDUs apart from the index sharing r̃. syringes per month. For
the indirect benefits b̃d treatment duration is irrelevant, therefore the full benefits B are much less affected than the direct effects bd . We find an optimum in risk level to target
when m > 0.5, and can no longer give a simple threshold value describing whom to best cure in any not further specified population. However, curing lower risk IDUs will be most
beneficial from prevalence among syringes m somewhat above 50% and onward.
0.0 0.2 0.4 0.6 0.8 1.00
1
2
3
4
decr
ease
in c
hron
ic in
fect
ions
prevalence among syringes m
r = 0 (ex − IDU) r = 0.5 r = 1direct benefits bd full benefits B
Fig. 6. Additional HCV induced mortality. The benefits of curing one IDU when the rate of mortality for chronically HCV infected IDUs is increased by μc = 0.002 per month. To
calculate the full benefits B we assume a homogeneous population at equilibrium, with all IDUs apart from the index sharing r̃. syringes per month. When HCV causes mortality,
the expected time an individual remains infectious is decreased. Fewer infections to others would have been caused, and this renders curing less beneficial. There is an optimum in
risk level to target for m < 0.5, therefore we can no longer give a simple threshold value in prevalence among syringes m describing whom to best cure in any not further specified
population. However, curing lower risk IDUs will be most beneficial from prevalence among syringes m somewhat below 50% and onward.
i
o
t
4
t
H
a
experiencing less HCV induced mortality. We can now calculate the
number of infections to others prevented as:
bo = (1 − m)(pcrbTcc − r(paTua + pcTuc))
−(rbTcc − r(Tuu + Tua + Tuc))(mapa + mcpc)
b̃o = r̃(1 − m)(paTaa + pcTac − (paTua + pcTuc))
−r̃(Tau + Taa + Tac − (Tuu + Tua + Tuc))(mapa + mcpc),
in the latter with r replaced by r̃ within λ in Tij. All further definitions
to obtain the direct and indirect benefits of curing remain as given
n Sections 3.1 and 3.2. We show numerical results for the influence
f HCV induced mortality μc in Fig. 6, and for risk reduction from
reatment onward in Fig. 7.
. Results
The benefits per IDU treated for HCV, defined here as a lowering in
he number of chronic HCV infections, decline with the prevalence of
CV contamination among exchanged syringes m. Considering whom
re best treated we found a threshold in m: above the prevalence
A.S. de Vos, M.E.E. Kretzschmar / Mathematical Biosciences 258 (2014) 11–18 17
0.0 0.2 0.4 0.6 0.8 1.00
1
2
3
4
5
6
decr
ease
in c
hron
ic in
fect
ions
0.0 0.2 0.4 0.6 0.8 1.00
1
2
3
4
5
6
decr
ease
in c
hron
ic in
fect
ions
prevalence among syringes m
absolute risk reduction of 0.5 rb = 0.5 rb = 1 without behaviour change
prevalence among syringes m
rb = 0.5 rb = 1 without behaviour changefull risk reduction
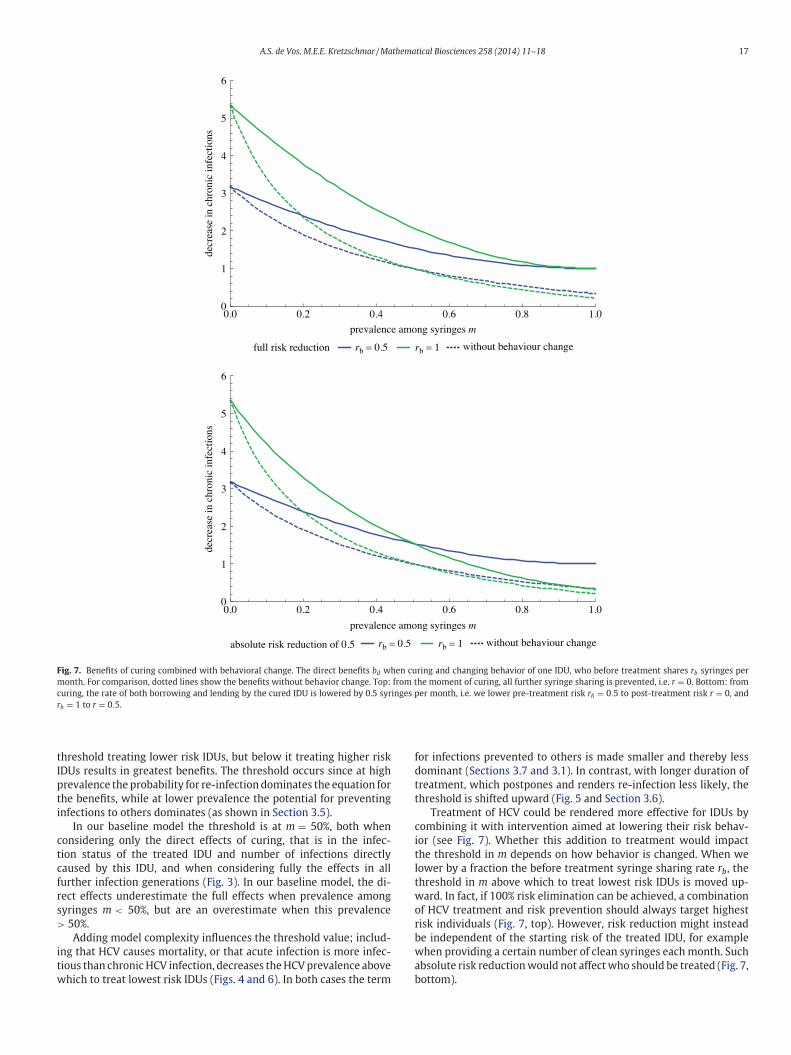
Fig. 7. Benefits of curing combined with behavioral change. The direct benefits bd when curing and changing behavior of one IDU, who before treatment shares rb syringes per
month. For comparison, dotted lines show the benefits without behavior change. Top: from the moment of curing, all further syringe sharing is prevented, i.e. r = 0. Bottom: from
curing, the rate of both borrowing and lending by the cured IDU is lowered by 0.5 syringes per month, i.e. we lower pre-treatment risk rb = 0.5 to post-treatment risk r = 0, and
rb = 1 to r = 0.5.
t
I
p
t
i
c
t
c
f
r
s
>
i
t
w
f
d
t
t
c
i
t
l
t
w
o
r
b
w
a
b
hreshold treating lower risk IDUs, but below it treating higher risk
DUs results in greatest benefits. The threshold occurs since at high
revalence the probability for re-infection dominates the equation for
he benefits, while at lower prevalence the potential for preventing
nfections to others dominates (as shown in Section 3.5).
In our baseline model the threshold is at m = 50%, both when
onsidering only the direct effects of curing, that is in the infec-
ion status of the treated IDU and number of infections directly
aused by this IDU, and when considering fully the effects in all
urther infection generations (Fig. 3). In our baseline model, the di-
ect effects underestimate the full effects when prevalence among
yringes m < 50%, but are an overestimate when this prevalence
50%.
Adding model complexity influences the threshold value; includ-
ng that HCV causes mortality, or that acute infection is more infec-
ious than chronic HCV infection, decreases the HCV prevalence above
hich to treat lowest risk IDUs (Figs. 4 and 6). In both cases the term
or infections prevented to others is made smaller and thereby less
ominant (Sections 3.7 and 3.1). In contrast, with longer duration of
reatment, which postpones and renders re-infection less likely, the
hreshold is shifted upward (Fig. 5 and Section 3.6).
Treatment of HCV could be rendered more effective for IDUs by
ombining it with intervention aimed at lowering their risk behav-
or (see Fig. 7). Whether this addition to treatment would impact
he threshold in m depends on how behavior is changed. When we
ower by a fraction the before treatment syringe sharing rate rb, the
hreshold in m above which to treat lowest risk IDUs is moved up-
ard. In fact, if 100% risk elimination can be achieved, a combination
f HCV treatment and risk prevention should always target highest
isk individuals (Fig. 7, top). However, risk reduction might instead
e independent of the starting risk of the treated IDU, for example
hen providing a certain number of clean syringes each month. Such
bsolute risk reduction would not affect who should be treated (Fig. 7,
ottom).
18 A.S. de Vos, M.E.E. Kretzschmar / Mathematical Biosciences 258 (2014) 11–18
r
a
d
t
a
i
t
w
t
o
a
m
p
6
t
A
n
c
R
[
[
[
567–574.
5. Discussion and Conclusions
Our aim was to answer, from a public health perspective, as to
which IDUs are best treated for HCV infection. We used a simple model
in order to gain a most general answer and greatest understanding of
the factors determining this question. Our model lacks certain aspects
of reality however, which should be considered before implementing
targeting of HCV treatment by risk behavior.
In particular, we did not perform a proper cost effectiveness study
of the alternative treatment strategies. In cost-effectiveness studies,
benefits and costs that are expected later in time are usually dis-
counted, since they are less certain [12]. We assumed a steady state
situation and counted equally infections occurring at any point in
time after treatment. However, we did distinguish direct and indirect
benefits of intervention, with the indirect benefits mostly accruing
later in time. Discounting of future effects could shift the prevalence
threshold relating whom to cure somewhat, but in general consider-
ation of only the direct or the full benefits led to the same treatment
policy advice.
We focused on risk behavior only. In reality there will be other in-
dividual factors of relevance for the expected benefits from treatment,
such as possible HIV co-infection, age or time since HCV infection. For
example, treatment at old age would prevent fewer infections to oth-
ers, and could be too late to stop liver damage. Including age or time
since infection would invalidate the Markov assumption on which
our formulae are based, and therefore require a more complicated
type of model to study.
In the present model, a case of re-infection after treatment is no
different from one of first time infection; it should be treated equally.
In reality, occurrence of re-infection might be used as an indication
for an IDU’s risk behavior, informing the decision of future treatment.
Our calculations assumed the curing of a single IDU in an in-
finitely large population, and are therefore not valid when curing
a substantial fraction of all infected IDUs. Curing of multiple IDUs
would (temporarily) lower HCV prevalence, and the consequent time-
dependence would render analytic derivation such as presented here
much more complicated. By continually curing a constant fraction of
infected IDUs, a new equilibrium would eventually be reached. To de-
termine who are best cured in this situation, our method is adapted
by simply considering the new stable proportion of syringes m that
would then carry infection.
The benefits from curing specific numbers of IDUs over specific
time-windows have been studied numerically, including for situa-
tions with changing prevalence over time [4–10]. With our method,
however, we could gain enhanced understanding of how to optimize
the HCV treatment benefits, and draw more generalized conclusions.
In particular, we could study separately the impact of behavioral
and prevalence parameters. We could distinguish parameter domains
where HCV treatment benefits are increasing with risk behavior of the
treated IDU from circumstances under which these benefits are de-
creasing with risk.
Based on our model results, we recommend that HCV treat-
ment policy should be informed by prevalence of HCV contamina-
tion among exchanged syringes, m, within an IDU population. This
prevalence among syringes might for example be measured from sy-
inge exchange facilities [13]. For the present analysis however, we
ssumed proportionate mixing. When IDUs do not borrow at ran-
om, they do not all experience the same probability to lend from or
o someone HCV infected, i.e. m could be related to risk level. Then
lso, prevalence among syringes would not equal m.
Since those who share syringes most often are most likely to be
nfected, syringes from infected IDUs are over-represented among
he population of exchanged syringes, i.e. prevalence among syringes
ill be higher than prevalence among IDUs. In future work we plan
o explore the relationship between the two types of prevalence. In
rder to better inform treatment policy, we will also make use of
numerical method for obtaining the benefits B, which allows for
ore complicated model assumptions, including separate mixing and
artial immunity.
. Funding
This work was supported by ZonMW, the Netherlands organisa-
ion for health research and development [125020005].
cknowledgments
This study was conducted at the Utrecht Centre for Infection Dy-
amics (UCID). We thank one anonymous reviewer for very helpful
omments.
eferences
[1] H. Hagan, D.C. Des Jarlais, HIV and HCV infection among injecting drug users, Mt.
Sinai J. Med. 67 (2000) 423–428.
[2] L.M. Hagan, R.F. Schinazi, Best strategies for global HCV eradication, Liver Int. 33(2013) 68–79.
[3] B. Malhotra (Ed.), The Strategic Use of Antiretrovirals for Treatment and Preven-tion of HIV Infection: 2nd Expert Panel Meeting Meeting Report. WHO/HIV/2013.
[4] N.K. Martin, P. Vickerman, G.R. Foster, S.J. Hutchinson, D.J. Goldberg, M. Hickman,Can antiviral therapy for hepatitis C reduce the prevalence of HCV among injecting
drug user populations? A modeling analysis of its prevention utility, J. Hepatol.
54 (2011) 1137–1144.[5] N.K. Martin, A.B. Pitcher, P. Vickerman, A. Vassall, M. Hickman, Optimal control
of hepatitis C antiviral treatment programme delivery for prevention amongst apopulation of injecting drug users, PLoS One 6 (2011) e22309.
[6] M.E. Hellard, R. Jenkinson, P. Higgs, M.A. Stoové, R. Sacks-Davis, J. Gold, M.Hickman, P. Vickerman, N.K. Martin, Modelling antiviral treatment to prevent
hepatitis C infection among people who inject drugs in Victoria, Med. J. Aust. 196
(2012) 638–641.[7] N. Durier, C. Nguyen, L.J. White, Treatment of hepatitis C as prevention: A modeling
case study in Vietnam, PLoS One 7 (2012) e34548.[8] N.K. Martin, P. Vickerman, A. Miners, G.R. Foster, S.J. Hutchinson, D.J. Goldberg, M.
Hickman, Cost-effectiveness of hepatitis C virus antiviral treatment for injectiondrug user populations, Hepatology 55 (2012) 49–57.
[9] I. Zeiler, T. Langlands, J.M. Murray, A. Ritter, Optimal targeting of Hepatitis C
virus treatment among injecting drug users to those not enrolled in methadonemaintenance programs, Drug Alcohol Depend. 110 (2010) 228–233.
[10] P. Vickerman, N. Martin, M. Hickman, Can Hepatitis C virus treatment be used asa prevention strategy? Additional model projections for Australia and elsewhere,
Drug Alcohol Depend. 113 (2011) 83–85.11] A.S. de Vos, J.J. van der Helm, M. Prins, M.E. Kretzschmar, Determinants of persis-
tent spread of HIV in HCV-infected populations of injecting drug users, Epidemics
4 (2012) 57–67.12] A. Oliver, A normative perspective on discounting health outcomes, J. Health Serv.
Res. Policy 18 (2013) 186–189.13] E.H. Kaplan, R. Heimer, A circulation theory of needle exchange, AIDS 8 (1994)


![Sofosbuvir/Velpatasvir for the treatment of Hepatitis C...regimen for the treatment of chronic hepatitis C (HCV) genotypes 1-6 in adults. [1] Velpatasvir is a NS5A inhibitor, preventing](https://img.pdfslide.net/doc/110x75/5e5eb3646cbcfe3c9334a7a8/sofosbuvirvelpatasvir-for-the-treatment-of-hepatitis-c-regimen-for-the-treatment.jpg)