Embed Size (px)
DESCRIPTION
Benefits of p -Cycles in a Mixed Protection and Restoration Approach. Fran ç ois Blouin, Anthony Sack, Wayne D. Grover, Hadi Nasrallah. October 21, 2003. Fourth International Workshop on the Design of Reliable Communication Networks (DRCN 2003) 19-22 October 2003 - Banff, Alberta, Canada. - PowerPoint PPT Presentation
Citation preview
Benefits of p-Cycles in a Mixed Protection and Restoration Approach DRCN 2003 1
Benefits of p-Cycles in a Mixed Protection and Restoration Approach
François Blouin, Anthony Sack, Wayne D. Grover, Hadi Nasrallah
Fourth International Workshop on the Design of Reliable Communication Networks (DRCN 2003)19-22 October 2003 - Banff, Alberta, Canada
October 21, 2003
Benefits of p-Cycles in a Mixed Protection and Restoration Approach DRCN 2003 2
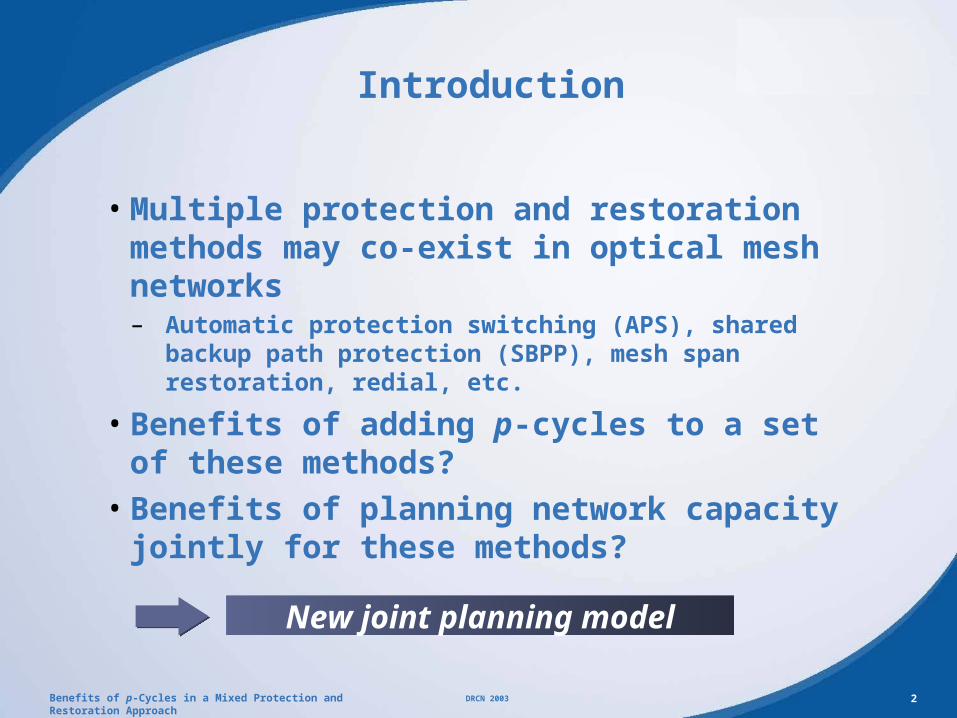
Introduction
• Multiple protection and restoration methods may co-exist in optical mesh networks– Automatic protection switching (APS), shared backup path
protection (SBPP), mesh span restoration, redial, etc.
• Benefits of adding p-cycles to a set of these methods?• Benefits of planning network capacity jointly
for these methods?
New joint planning model
Benefits of p-Cycles in a Mixed Protection and Restoration Approach DRCN 2003 3
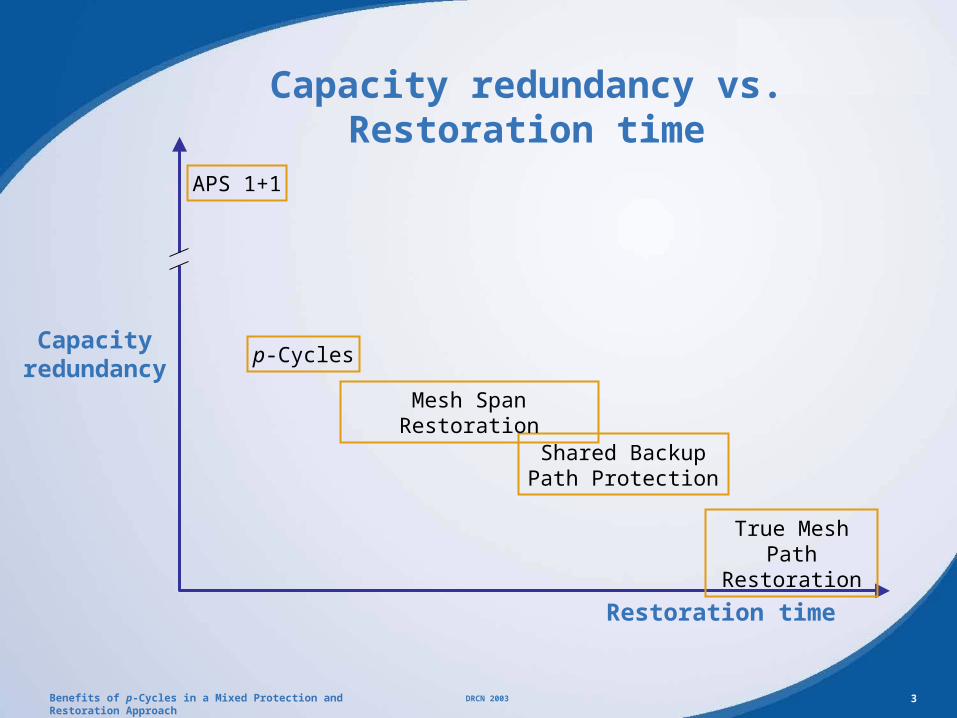
Capacity redundancy vs. Restoration time
Restoration time
Capacity redundancy
APS 1+1
p-Cycles
Shared Backup Path Protection
True Mesh Path Restoration
Mesh Span Restoration
Benefits of p-Cycles in a Mixed Protection and Restoration Approach DRCN 2003 4
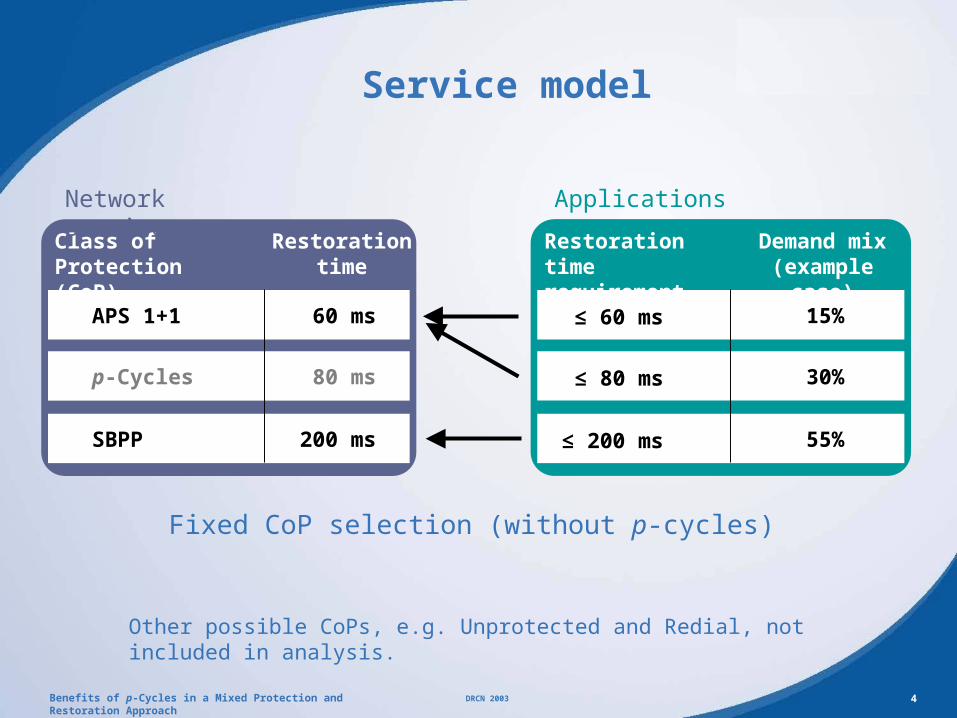
Fixed CoP selection (without p-cycles)
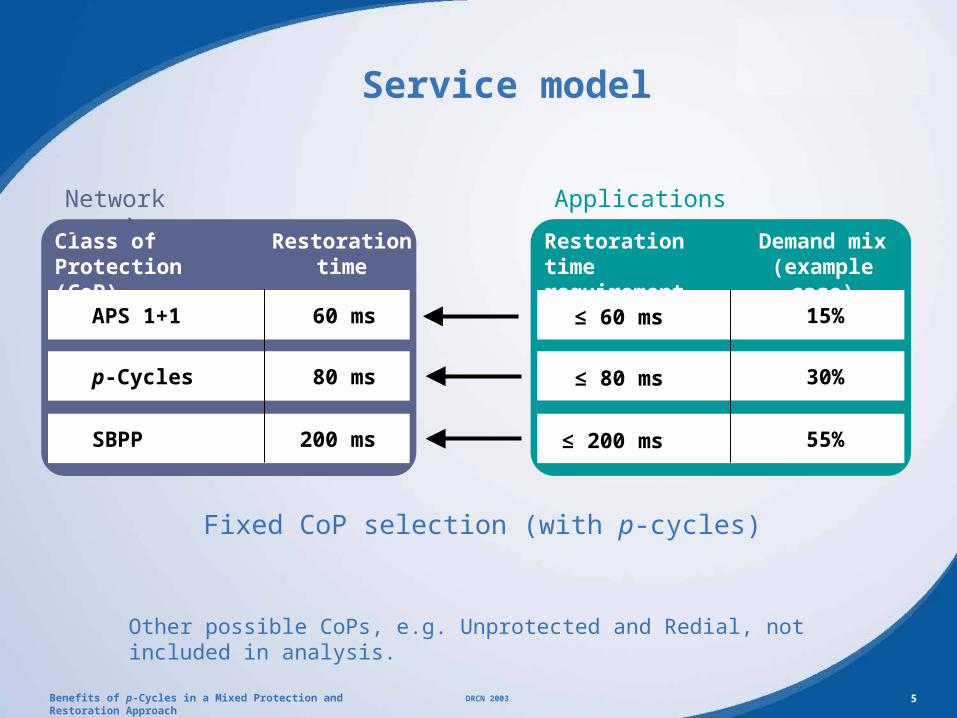
Service model
Other possible CoPs, e.g. Unprotected and Redial, not included in analysis.
Class of Protection (CoP)
APS 1+1 60 ms
Restoration time
p-Cycles 80 ms
SBPP 200 ms
Network services
Restoration time requirement
15%
Demand mix (example case)
30%
55%
Applications
≤ 60 ms
≤ 80 ms
≤ 200 ms
Benefits of p-Cycles in a Mixed Protection and Restoration Approach DRCN 2003 5
Fixed CoP selection (with p-cycles)
Service model
Other possible CoPs, e.g. Unprotected and Redial, not included in analysis.
Class of Protection (CoP)
APS 1+1 60 ms
Restoration time
p-Cycles 80 ms
SBPP 200 ms
Network services
Restoration time requirement
15%
Demand mix (example case)
30%
55%
Applications
≤ 60 ms
≤ 80 ms
≤ 200 ms
Benefits of p-Cycles in a Mixed Protection and Restoration Approach DRCN 2003 6
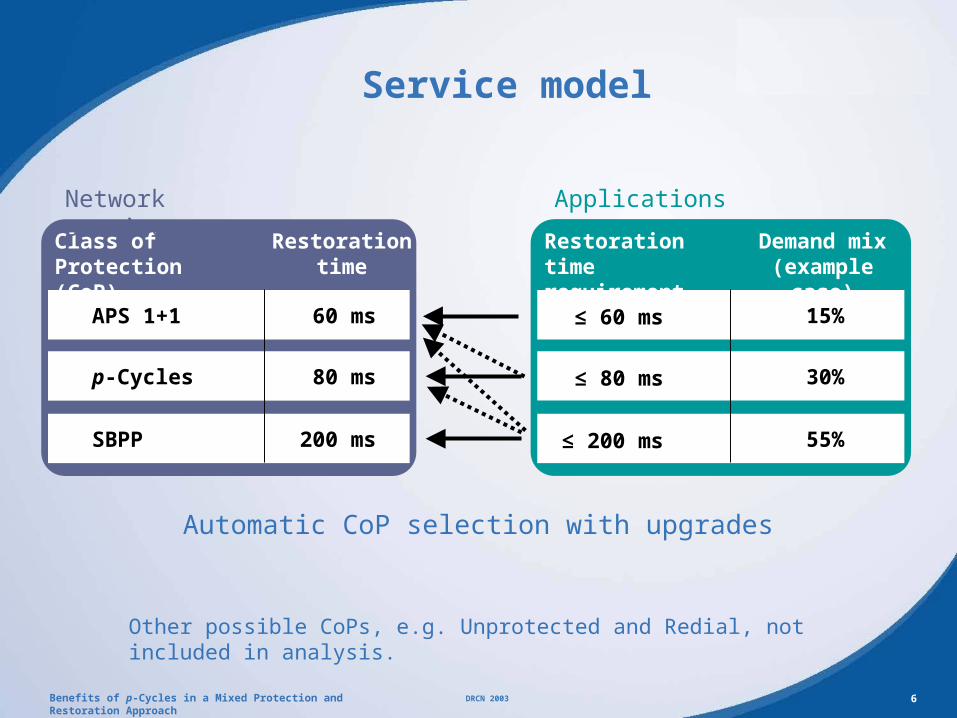
Automatic CoP selection with upgrades
Service model
Other possible CoPs, e.g. Unprotected and Redial, not included in analysis.
Class of Protection (CoP)
APS 1+1 60 ms
Restoration time
p-Cycles 80 ms
SBPP 200 ms
Network services
Restoration time requirement
15%
Demand mix (example case)
30%
55%
Applications
≤ 60 ms
≤ 80 ms
≤ 200 ms
Benefits of p-Cycles in a Mixed Protection and Restoration Approach DRCN 2003 7
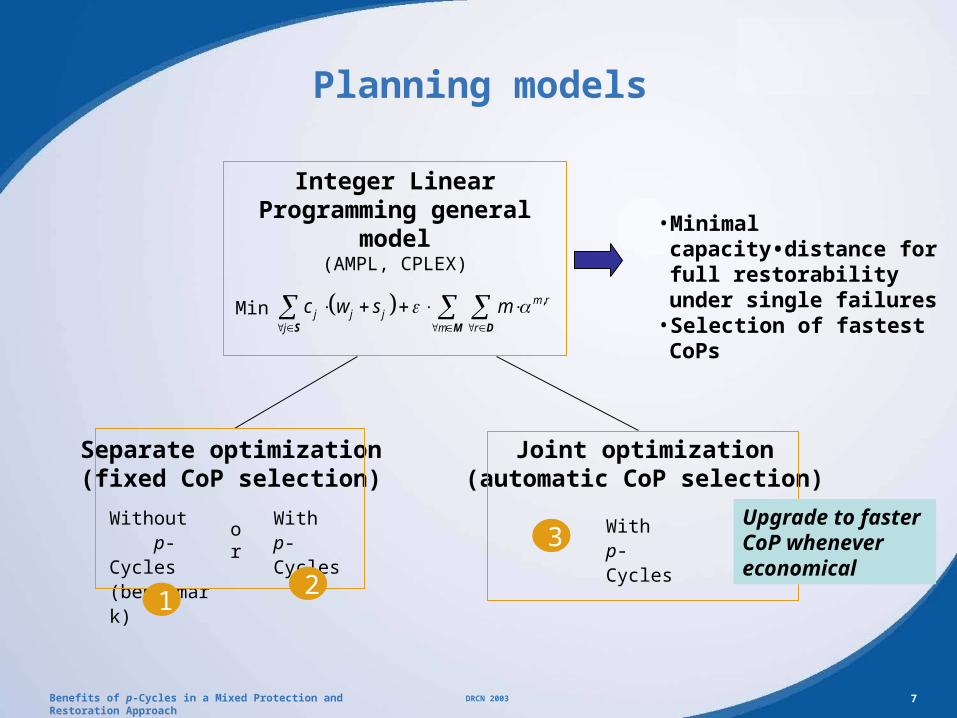
Planning models
Integer Linear Programming general model
(AMPL, CPLEX)• Minimal capacity•distance
for full restorability under single failures
• Selection of fastest CoPs
Separate optimization(fixed CoP selection)
Joint optimization(automatic CoP selection)
,m rj j j
j m r
c w s m
S M D
Withp-Cycles
Without p-Cycles(benchmark)
or
Min
Upgrade to faster CoP whenever economical
12
3 Withp-Cycles
Benefits of p-Cycles in a Mixed Protection and Restoration Approach DRCN 2003 8
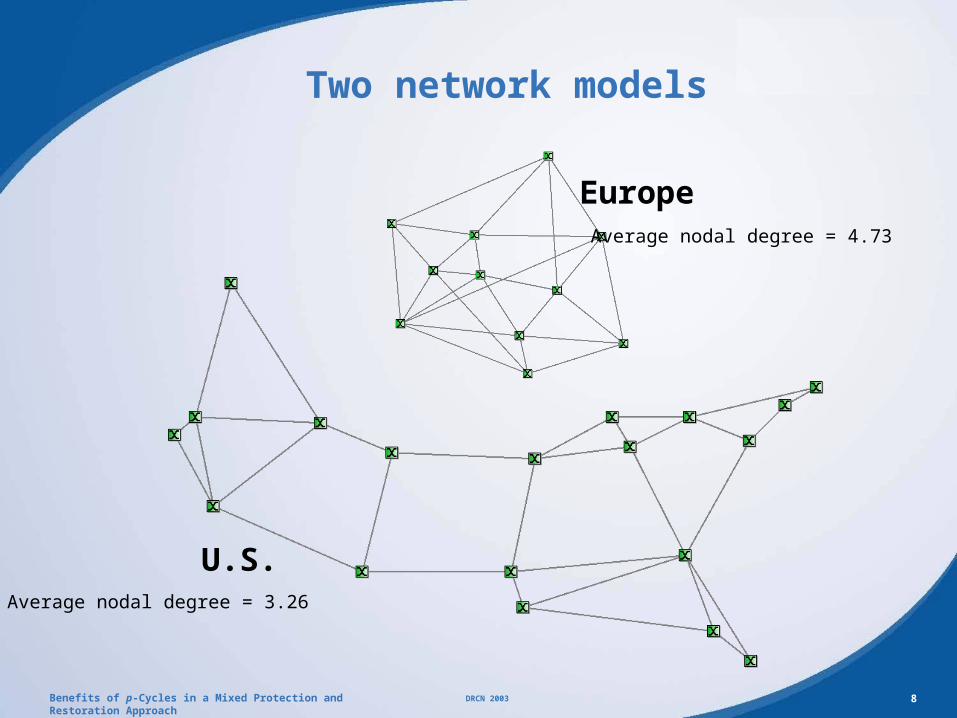
Two network models
U.S.
EuropeAverage nodal degree = 4.73
Average nodal degree = 3.26
Benefits of p-Cycles in a Mixed Protection and Restoration Approach DRCN 2003 9
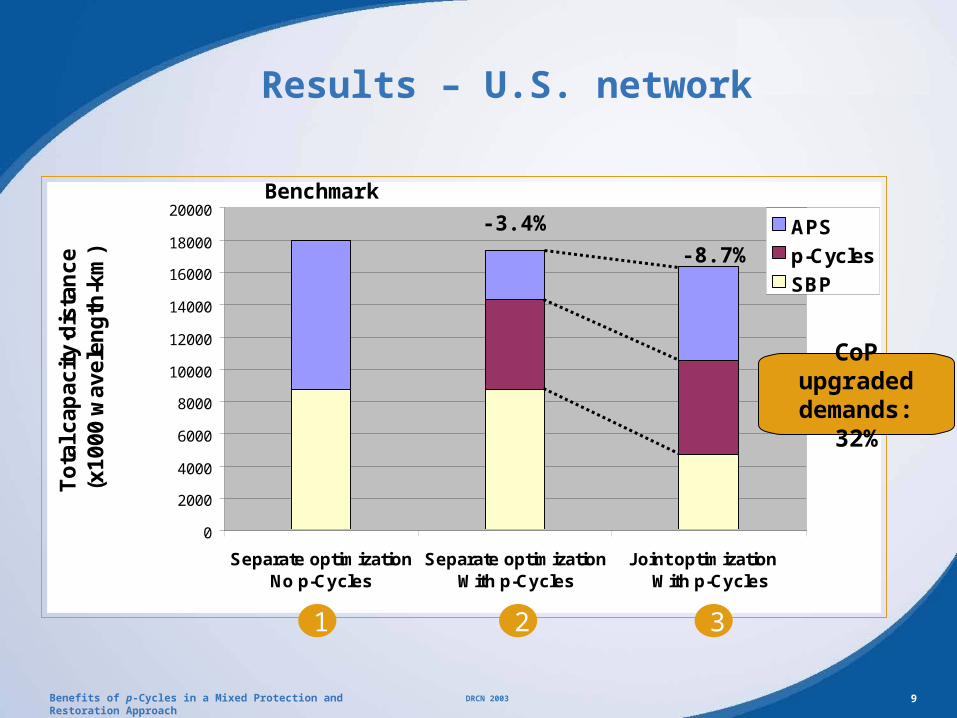
0
2000
4000
6000
8000
10000
12000
14000
16000
18000
20000
Separate optimizationNo p-Cycles
Separate optimizationWith p-Cycles
Joint optimization With p-Cycles
To
tal c
ap
ac
ity
·dis
tan
ce
(x
10
00
wa
ve
len
gth
-km
)
APS
p-Cycles
SBP
Results – U.S. network
Benchmark
-3.4%
-8.7%
CoP upgraded demands:
32%
1 2 3
Benefits of p-Cycles in a Mixed Protection and Restoration Approach DRCN 2003 10
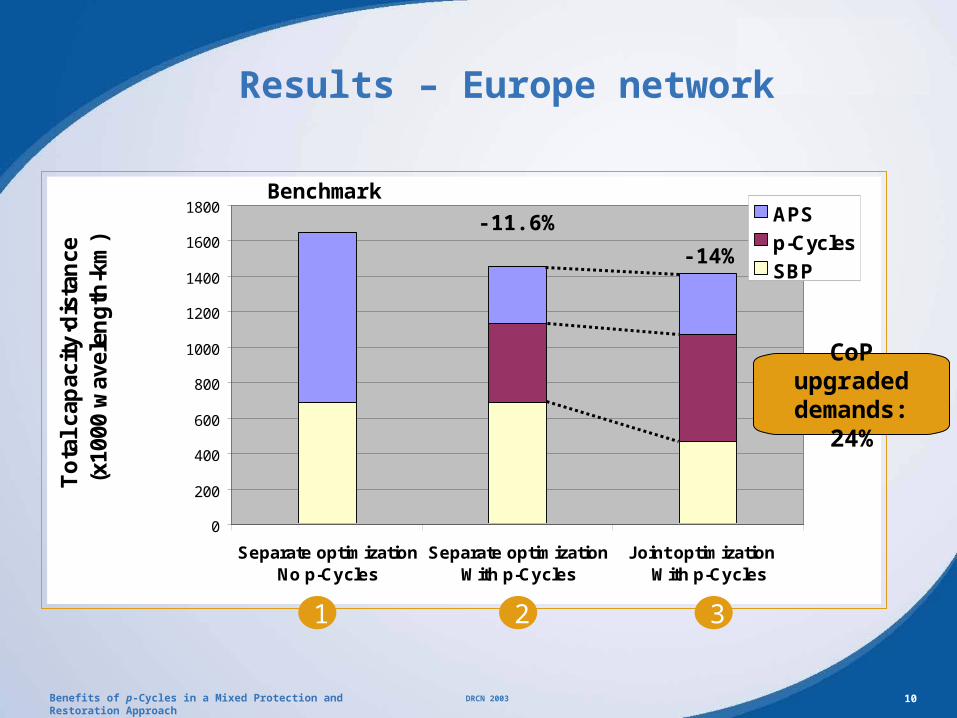
0
200
400
600
800
1000
1200
1400
1600
1800
Separate optimizationNo p-Cycles
Separate optimizationWith p-Cycles
Joint optimization With p-Cycles
To
tal
cap
acit
y·d
ista
nce
(x1
000
wav
elen
gth
-km
)
APS
p-Cycles
SBP
Results – Europe network
-11.6%
-14%
Benchmark
CoP upgraded demands:
24%
1 2 3

Benefits of p-Cycles in a Mixed Protection and Restoration Approach DRCN 2003 11
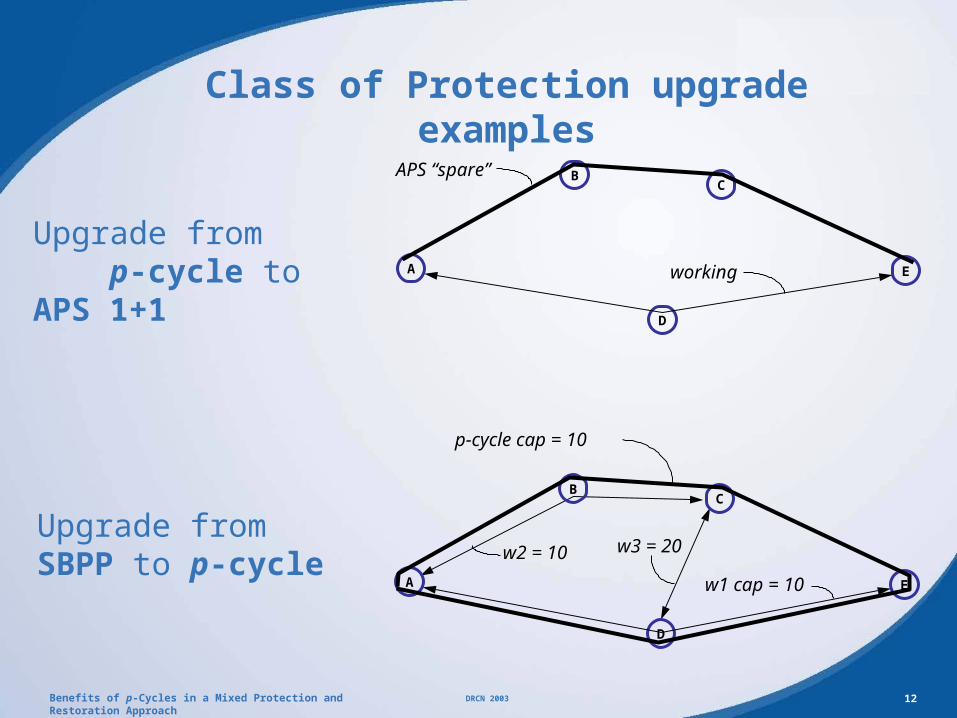
Class of Protection upgrade examples
Upgrade from p-cycle to APS 1+1
Upgrade from SBPP to p-cycle
working
p-cycle
A
CB
D
E
Benefits of p-Cycles in a Mixed Protection and Restoration Approach DRCN 2003 12
Class of Protection upgrade examples
Upgrade from p-cycle to APS 1+1
Upgrade from SBPP to p-cycle
working
p-cycle cap = 10
A
CB
D
E
APS “spare”
w1 cap = 10
w2 = 10
A
CB
D
E
w3 = 20
Benefits of p-Cycles in a Mixed Protection and Restoration Approach DRCN 2003 13
Conclusions
• p-Cycles could replace APS 1+1 for some traffic demands– where slight restoration time penalty is acceptable
Benefits of p-Cycles in a Mixed Protection and Restoration Approach DRCN 2003 14
Conclusions
• p-Cycles could replace APS 1+1 for some traffic demands– where slight restoration time penalty is acceptable
• New capacity planning model allowing automatic selection of protection & restoration method– Upgrade demand to faster CoP whenever economical
Benefits of p-Cycles in a Mixed Protection and Restoration Approach DRCN 2003 15
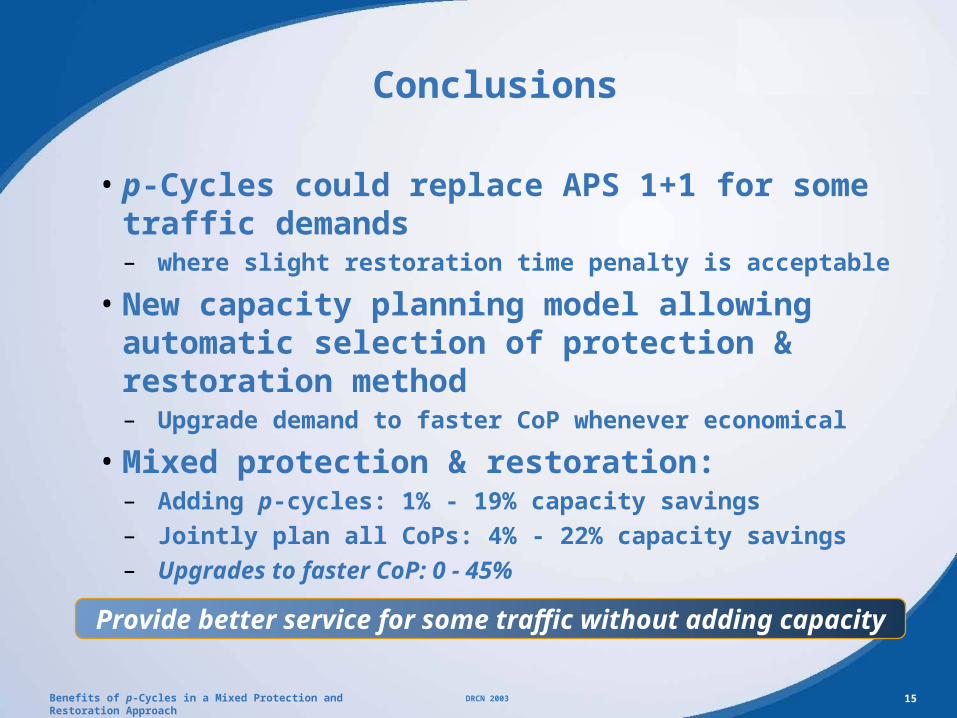
Conclusions
• p-Cycles could replace APS 1+1 for some traffic demands– where slight restoration time penalty is acceptable
• New capacity planning model allowing automatic selection of protection & restoration method– Upgrade demand to faster CoP whenever economical
• Mixed protection & restoration:– Adding p-cycles: 1% - 19% capacity savings– Jointly plan all CoPs: 4% - 22% capacity savings– Upgrades to faster CoP: 0 - 45%
Provide better service for some traffic without adding capacity

Benefits of p-Cycles in a Mixed Protection and Restoration Approach DRCN 2003 16
Thank you