Embed Size (px)
Citation preview

Benefits of thermodynamic and
microstructure simulations towards
reliable continuous casting of steels
M. Apel1), B. Böttger1), D.G. Eskin 3), B. Santillana2)
1) Access, Aachen, Germany
2) Tata Steel RD&T, POBox 10000, 1970CA, IJmuiden, The Netherlands
3) BCAST, Brunel University, Uxbridge UB8 3PH, U.K.
2
Outline
• Background and industrial application
• Microstructure differences
• MICRESS results
• Unexpected “peritectic solidification” and Cp
3
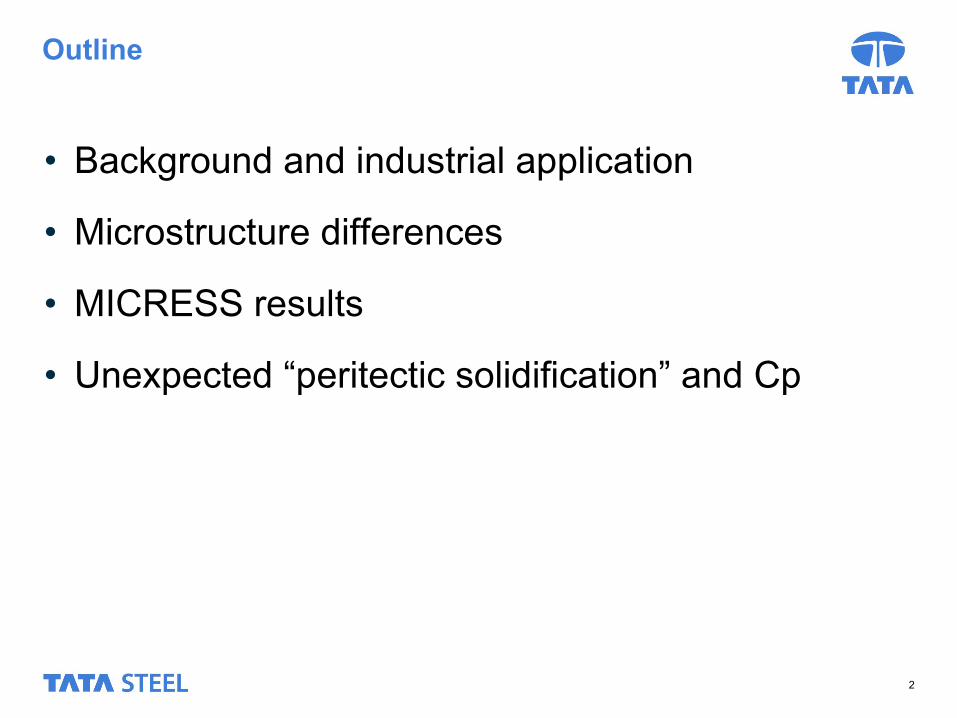
Breakouts!!!!
• Solidified shell bursts open
• Lost Production (24 hours)
• Machine damage
• Loss of over 200 K-euro's
• Safety

4
The iceberg…
Breakouts
A few…
Cracks
Few more…
Solidification issues
Plenty…

5
Solidification issues
Mechanical
Chemical
Thermal
?? Combined with
high heat
extraction???
ZDT, ZST,
LIT,
DCP???
Micro/macr
osegregatio
n,peritectic
solidificatio
n???
Critical
stresses &
strains???

6
Alloy compositions:
LCAK HSLA LR-HSLA
Steel grade
(in 0,001 %) min aim max
C 25 45 60
Mn 170 220 270
N (ppm) 50
Al soluble 20 35 55
Nb 5
Ti 10
V 5
Ca (ppm) 20 60
Steel grade
(in 0,001%) min aim max
C 25 45 60
Mn 725 800 875
N (ppm) 110 130 150
Al soluble 15 30 55
Nb 10 13 16
Ti 10
V 119 130 141
Ca (ppm) 20 60
Steel grade
(in 0,001%) min aim max
C 25 45 60
Mn 725 800 875
N (ppm) 80 100
Al soluble 15 30 55
Nb 10 13 16
Ti 10
V 40
Ca (ppm) 20 60
cracking! not
cracking! cracking!
Why?
Problem

7
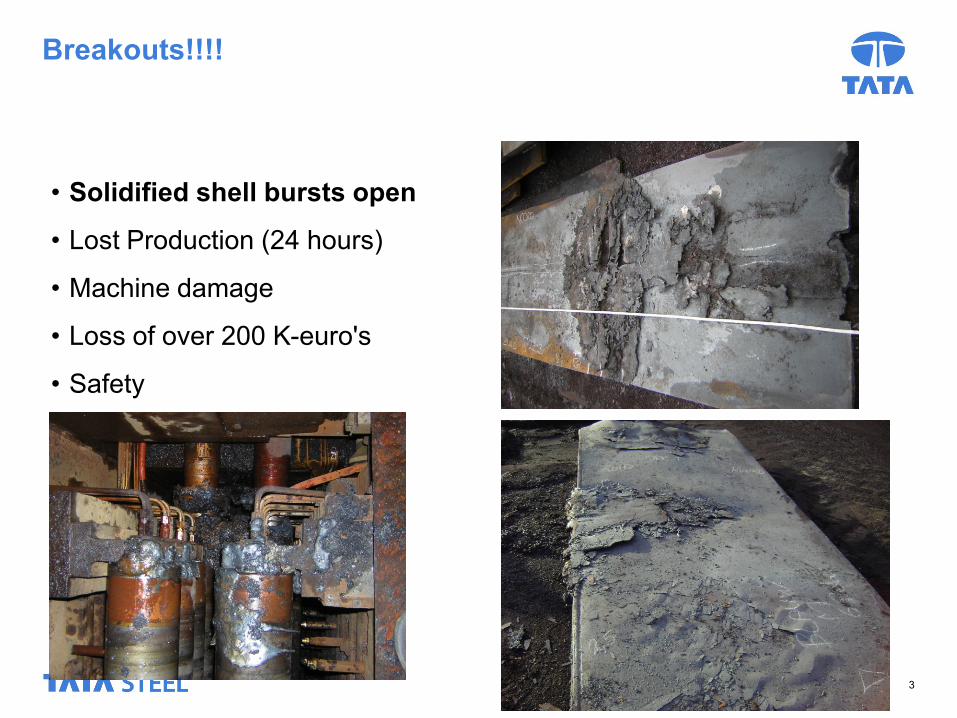
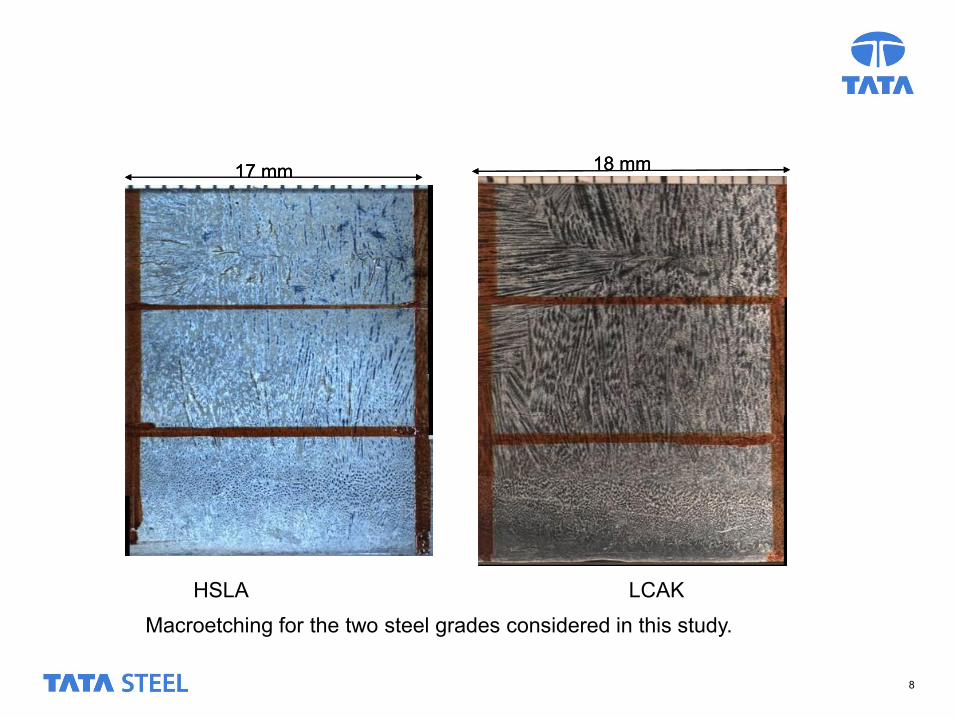
Macrostructure (same heat transfer conditions)
HSLA LCAK
Macroetching for the two steel grades considered in this study.
8
17 mm17 mm 18 mm18 mm
HSLA LCAK
Macroetching for the two steel grades considered in this study.

9
Primary Dendrite Arm Spacing
0
20
40
60
80
100
120
140
160
180
0 2 4 6 8 10 12
Distance from slab surface (mm)
Me
asu
red
PD
AS
(u
m)
HSLA
LCAK
10
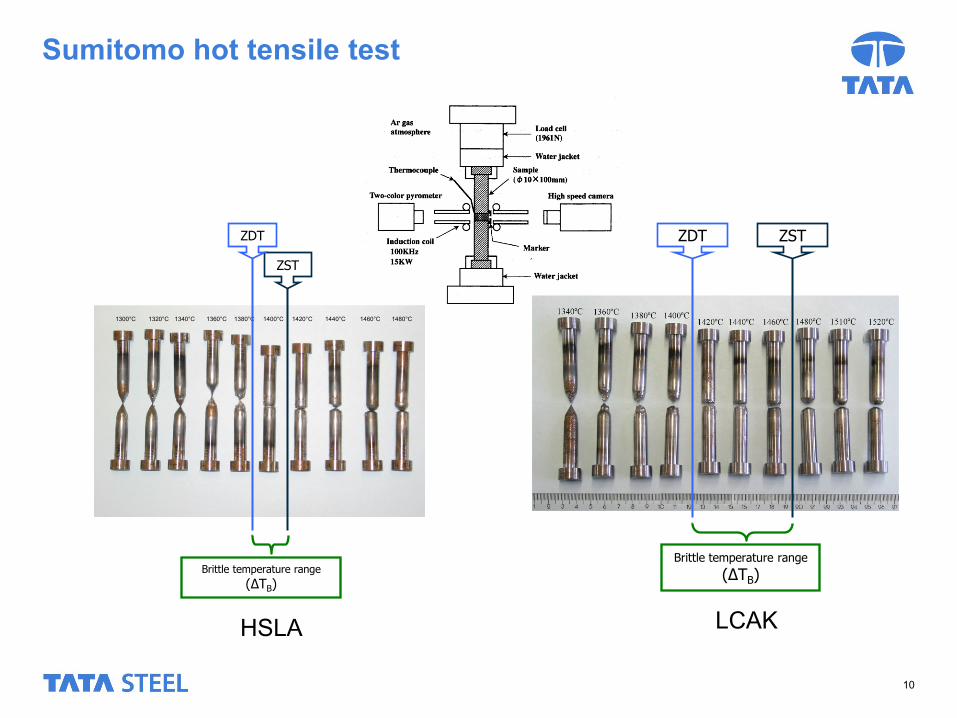
Sumitomo hot tensile test
ZST ZDT
Brittle temperature range
(ΔTB)
FV85 Hot Tensile Tests
1320°C 1340°C 1360°C 1380°C 1400°C 1440°C1300°C 1460°C 1480°C1420°C
FV85 Hot Tensile Tests
1320°C 1340°C 1360°C 1380°C 1400°C 1440°C1300°C 1460°C 1480°C1420°C
ZST
ZDT
Brittle temperature range
(ΔTB)
HSLA LCAK

11
Aims of this project
• Perform Phase Field Simulations of microstructure
formation of the first solid shell under “Continuous
casting conditions”
• Quantify simulated solidification microstructure
• Find out whether the observed differences of the
cracking risk can be understood via the chemical
composition

12
Comparison LCAK and HSLA (same heat transfer conditions)
HSLA is finer and more equiaxed!
LCAK (Fe-C-Mn), r0=0.065 µm, σ=10 %*r0, N=108
HSLA (Fe-C-Mn-N-Nb-V), r0=0.065 µm, σ=10 %*r0, N=108

13
Comparison LCAK and HSLA:
Carbon composition distribution at 0.4s LCAK (Fe-C-Mn), r0=0.065 µm, σ=10 %*r0, N=107
HSLA (Fe-C-Mn-N-Nb-V), r0=0.065 µm, σ=10 %*r0, N=107
HSLA is finer, more equiaxed
and has a wider solidification range

14
LCAK vs HSLA at same heat transfer conditions
• The difference between LCAK and the HSLA steels is the as-cast
structure
• LCAK has a coarser structure and tends to form more columnar
dendrites than the HSLA
• Finer grains, more equiaxed & thinner dendrites exhibit more isotropic
and uniform mechanical properties =>less tendency for hot tearing
formation and decreased macrosegregation.
• Coarser structure also exhibits a wider BTR (also shown in the SMI hot
tensile tests)
15
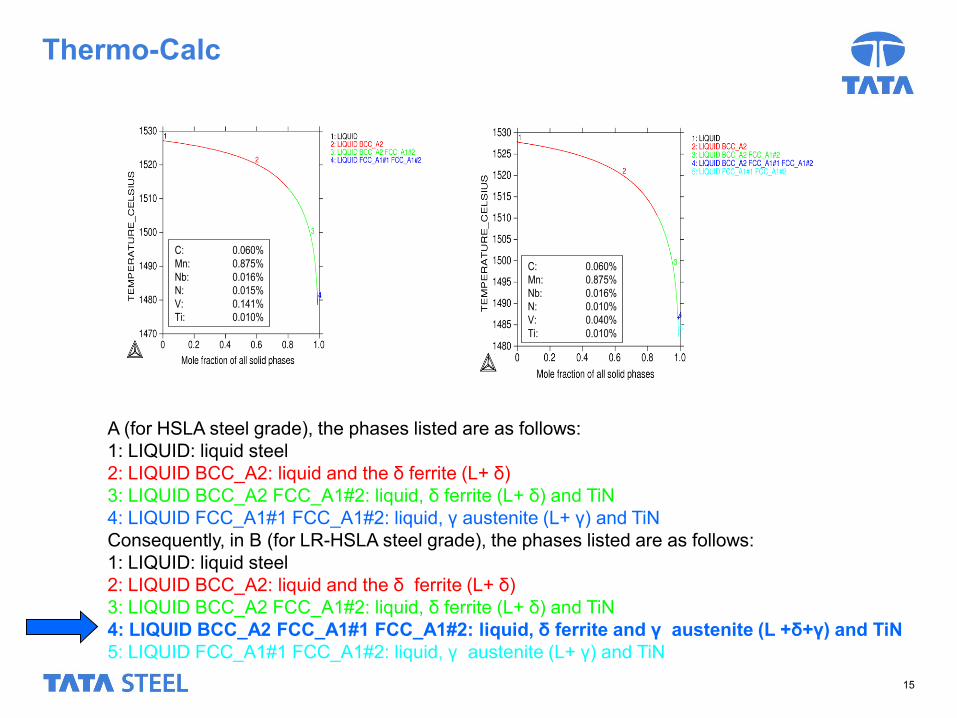
Thermo-Calc
C: 0.060%
Mn: 0.875%
Nb: 0.016%
N: 0.015%
V: 0.141%
Ti: 0.010%
C: 0.060%
Mn: 0.875%
Nb: 0.016%
N: 0.015%
V: 0.141%
Ti: 0.010%
C: 0.060%
Mn: 0.875%
Nb: 0.016%
N: 0.010%
V: 0.040%
Ti: 0.010%
C: 0.060%
Mn: 0.875%
Nb: 0.016%
N: 0.010%
V: 0.040%
Ti: 0.010%
A: FV85 B: FV83
Figure 1. Scheil calculations for FV83 and FV85 considering the maximum values for the
compositions.
A (for HSLA steel grade), the phases listed are as follows:
1: LIQUID: liquid steel
2: LIQUID BCC_A2: liquid and the δ ferrite (L+ δ)
3: LIQUID BCC_A2 FCC_A1#2: liquid, δ ferrite (L+ δ) and TiN
4: LIQUID FCC_A1#1 FCC_A1#2: liquid, γ austenite (L+ γ) and TiN
Consequently, in B (for LR-HSLA steel grade), the phases listed are as follows:
1: LIQUID: liquid steel
2: LIQUID BCC_A2: liquid and the δ ferrite (L+ δ)
3: LIQUID BCC_A2 FCC_A1#2: liquid, δ ferrite (L+ δ) and TiN
4: LIQUID BCC_A2 FCC_A1#1 FCC_A1#2: liquid, δ ferrite and γ austenite (L +δ+γ) and TiN
5: LIQUID FCC_A1#1 FCC_A1#2: liquid, γ austenite (L+ γ) and TiN

16
Carbon potential-Ferrite potential
• The actual peritectic covers the range Cd to CL, but regarding
“peritectic grades” prone to defects the “peritectic” range is:
• Cδ < Cp < Cγ
• with the proximity to Cδ (left hand /low C extremity) being considered
particularly important.
1350
1370
1390
1410
1430
1450
1470
1490
1510
1530
1550
0 0.1 0.2 0.3 0.4 0.5 0.6 0.7
Composition (wt% C)
Tem
pera
ture
(ºC
)
δδ+γ
δ+L
γ γ+L
LδP
LP
L2γ2
Cδ
δ1
CLCγ
γ1
1350
1370
1390
1410
1430
1450
1470
1490
1510
1530
1550
0 0.1 0.2 0.3 0.4 0.5 0.6 0.7
Composition (wt% C)
Tem
pera
ture
(ºC
)
δδ+γ
δ+L
γ γ+L
LδP
LP
L2γ2
Cδ
δ1
CLCγ
γ1
Reaction:
L
Transformations:
LL
Figure 1. Schematic Fe-C phase diagram showing the peritectic reaction and transformation
[7]
17
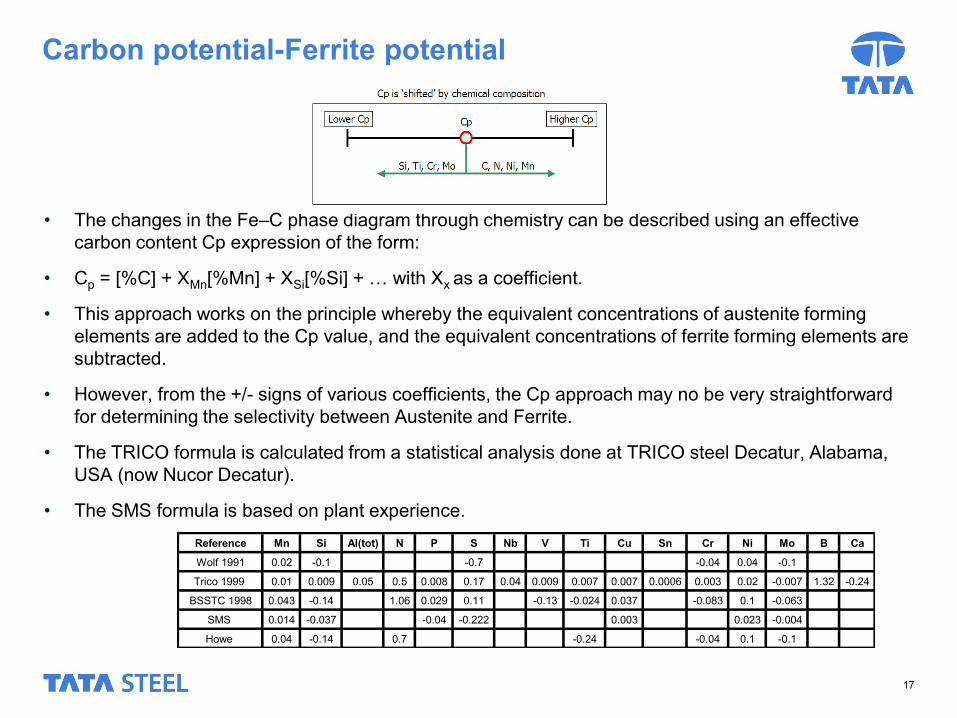
Carbon potential-Ferrite potential
• The changes in the Fe–C phase diagram through chemistry can be described using an effective
carbon content Cp expression of the form:
• Cp = [%C] + XMn[%Mn] + XSi[%Si] + … with Xx as a coefficient.
• This approach works on the principle whereby the equivalent concentrations of austenite forming
elements are added to the Cp value, and the equivalent concentrations of ferrite forming elements are
subtracted.
• However, from the +/- signs of various coefficients, the Cp approach may no be very straightforward
for determining the selectivity between Austenite and Ferrite.
• The TRICO formula is calculated from a statistical analysis done at TRICO steel Decatur, Alabama,
USA (now Nucor Decatur).
• The SMS formula is based on plant experience.
Reference Mn Si Al(tot) N P S Nb V Ti Cu Sn Cr Ni Mo B Ca
Wolf 1991 0.02 -0.1 -0.7 -0.04 0.04 -0.1
Trico 1999 0.01 0.009 0.05 0.5 0.008 0.17 0.04 0.009 0.007 0.007 0.0006 0.003 0.02 -0.007 1.32 -0.24
BSSTC 1998 0.043 -0.14 1.06 0.029 0.11 -0.13 -0.024 0.037 -0.083 0.1 -0.063
SMS 0.014 -0.037 -0.04 -0.222 0.003 0.023 -0.004
Howe 0.04 -0.14 0.7 -0.24 -0.04 0.1 -0.1

18
BS-STC & Howe formulae
BS STC
0.02
0.04
0.06
0.08
0.1
0.12
0.14
0.16
0.18
0.2
0 500 1000 1500 2000 2500 3000 3500 4000 4500 5000 5500 6000 6500 7000 7500
Ladle
Cp
No BO's FV83
No BO's FV85
NO BO's F12L
No BO's FN 80
No BO's FN 81
BO's
upper limit
lower limit
BS STC
0.02
0.04
0.06
0.08
0.1
0.12
0.14
6000 6250 6500 6750 7000 7250 7500
Ladle
Cp
No BO's FV83
No BO's FV85
BO's
upper limit
lower limit
A: Cp for all the ladles from 1st January 2009
up to 31st December 2010.
B: Ladles corresponding to FV83 and FV85
Figure 1. Carbon potential calculated with BS STC formula.
Howe
0.02
0.04
0.06
0.08
0.1
0.12
0.14
0 500 1000 1500 2000 2500 3000 3500 4000 4500 5000 5500 6000 6500 7000 7500
Ladle
Cp
No BO's FV83
No BO's FV85
NO BO's F12L
No BO's FN 80
No BO's FN 81
BO's
upper limit
lower limit
Howe
0.02
0.04
0.06
0.08
0.1
0.12
0.14
6000 6250 6500 6750 7000 7250 7500
Ladle
Cp
No BO's FV83
No BO's FV85
BO's
upper limit
lower limit
A: Cp for all the ladles from 1st January 2009
up to 31st December 2010.
B: Ladles corresponding to FV83 and FV85
Figure 1. Carbon potential calculated with A. Howe formula.
LR-HSLA
HSLA

19
Wolf formula & Blazek limits
Wolf
0.02
0.04
0.06
0.08
0.1
0.12
0.14
0 500 1000 1500 2000 2500 3000 3500 4000 4500 5000 5500 6000 6500 7000 7500
Ladle
Cp
No BO's FV83
No BO's FV85
NO BO's F12L
No BO's FN 80
No BO's FN 81
BO's
upper limit
lower limit
Wolf
0.02
0.04
0.06
0.08
0.1
0.12
0.14
6000 6250 6500 6750 7000 7250 7500
Ladle
Cp
No BO's FV83
No BO's FV85
BO's
upper limit
lower limit
A: Cp for all the ladles from 1st January 2009
up to 31st December 2010.
B: Ladles corresponding to FV83 and FV85
Figure 1. Carbon potential calculated with Wolf formula.
LC
AK
Cδ
LC
AK
Cγ
MA
Cδ
MA
Cγ
MA
2 Cδ
MA
2 Cγ
LR
-HS
LA
Cδ
LR
-HS
LA
Cγ
HS
LA
Cδ
HS
LA
Cγ
0
0.02
0.04
0.06
0.08
0.1
0.12
0.14
0.16
0.18
0.2
Peri
tecti
c r
an
ge (
Cp
)
LCAK Cδ
LCAKCγ
MA Cδ
MA Cγ
MA2 Cδ
MA2 Cγ
LR-HSLA Cδ
LR-HSLA Cγ
HSLA Cδ
HSLA Cγ

20
CONCLUSIONS
• LCAK is more sensitive to cracking because the microstructure is
coarse
• LR-HSLA may have cracking issues because is “almost” a peritectic
grade so may have late peritectic solidification…
• Next step: DSC-DTA
• Aims of the project achieved!
Perform Phase Field Simulations of microstructure formation of the first solid
shell under “Continuous casting conditions”
Quantify simulated solidification microstructure
Find out whether the observed differences of the cracking risk can be
understood via the chemical composition
• Next step: other steel grades to simulate

Thank you for your attention
Questions???
? ? ? ?
?
? ?
?
?
?
?
?
?