Embed Size (px)
Citation preview

Benefits of Wetland Buffers: A Study of Functions, Values and Size
prepared for the
Minnehaha Creek Watershed District
December 6, 2001
by
651 Hale Avenue North Oakdale, MN 55128

1
For questions regarding this report, please contact: Gary Oberts Emmons and Olivier Resources, Inc. 651 Hale Ave. N Oakdale, MN 55128 [email protected] or Andrea Plevan [email protected]
1
BENEFITS OF WETLAND BUFFERS: A STUDY OF FUNCTIONS, VALUES AND SIZE
Prepared for the Minnehaha Creek Watershed District By Emmons and Olivier Resources, Inc.
December 6, 2001 1. CONDUCT OF STUDY The objective of this study is to supplement and update previous work of the Watershed District to define the benefits of establishing wetland buffers. The District’s effort to adopt a buffer rule (Rule M) indicates its interest in preserving the existing functions and values of wetlands within the District by incorporating an effective pre-treatment system up-gradient of all wetlands. This approach has the added biological benefit of accrued vegetation and open space. This study draws on previous District studies, and supplements them with a broad search for new research and regulatory (ordinance) approaches listed in Appendix A. Because of the limited scope of the study, EOR did not re-visit specific studies within previous large-scale literature reviews. Rather, it used the results of these reviews and added new information. Limits on the amount of information presented in other literature reviews were a detriment to in-depth analysis, but enough commonalities exist in the information to draw conclusions and make recommendations for the MCWD to consider. The study team did not feel constrained by the current approach espoused in Rule M, but rather saw its role as presenting scientific information that the Board needs to make its decisions. The findings indicate that the District is not going beyond routine resource management in its attempt to protect wetlands. Appendix A shows the 41 reports that were reviewed for this study. Some of the large literature reviews contained over one hundred articles. Overall, approximately 350 pieces of information were reviewed directly or via literature summaries for this study. 2. MAJOR FINDINGS The most significant findings that resulted from this study follow. These findings reflect the consensus among a substantial number of technical literature sources, publications, and regulatory materials that were surveyed as part of this study.
1) Although the level of protection should vary by importance of the wetland, buffers surrounding all wetlands are universally supported not only for the protection of wetlands and the benefits they provide, but also for the functions and values that buffers possess as vegetative areas.

2
2) The functions and values of wetland buffers are numerous, and include water quality protection (erosion control and sediment, nutrient, biological and toxics removal), hydrologic event modification, groundwater interaction, aquatic and wildlife habitat protection, minimization of human impact, aesthetics/open space, recreation, and environmental education.
3) To obtain the maximum long-term effectiveness from buffer areas, sheet flow must be maintained, vegetation must be kept healthy, and incursions from urbanization must be kept to a minimum.
4) Buffers less than 50’ are marginally effective in protecting wetlands. 5) Most recommended minimum widths of buffer zones vary by function, but
generally adhere to the following:
Function Special Features Recommended Minimum Width
(feet) Sediment reduction Steep slopes (5-15%) and/or
sensitive wetland 100
Sediment reduction Shallow slopes (<5%) or low quality wetland
50
Sediment reduction Slopes over 15% Consider buffer width additions with each 1%
increase in slope Phosphorus reduction Steep slope 100 Phosphorus reduction Shallow slope 50 Nitrogen (nitrate) reduction
Focus on shallow groundwater flow
100
Biological contaminant and pesticide reduction
50
Wildlife habitat and corridor protection
Unthreatened species 100
Wildlife habitat and corridor protection
Rare, threatened or endangered species
200-300
Wildlife habitat and corridor protection
Maintenance of species diversity
50 in rural area 100 in urban area
Minimize the negative impact of human pressures
50
Flood control Variable, depending upon
elevation of flood waters and
potential damages

3
6) The “best” vegetation for buffer areas is a mix of trees, shrubs and ground-cover, although any of these individually will provide some benefit.
7) The relationship of buffer width to water quality improvement is not linear; that is, at the small end of buffer width, slight increases in width may yield large increases in water quality, whereas increases in buffer size at the large end of the scale do not necessarily yield similarly large water quality benefits.
8) Wetland buffers should be part of an effective watershed-wide surface water management program that includes runoff and pollution prevention, installation of BMPs (best management practices), and waste management.
3. FUNCTIONS AND VALUES ASSESSMENT OF WETLAND BUFFERS Essentially all of the literature reviewed on wetland buffers praises the numerous functions they play and values they offer (Appendix B, Table B1). This is, of course, in addition to its primary role in buffering valuable wetlands from the effects of urbanization, intense agriculture and any other activity within the watershed that generates or adds to runoff. A definition that captures the essence of the role of wetland buffers comes from Todd (2000), who states that buffers “…serve as transition zones between the terrestrial and aquatic ecosystems, linking land and water on a given site or property, and linking landscapes together in a watershed.” The following section summarizes findings for a number of different functions and values associated with wetland buffers. It should be noted that the database specifically addressing buffers for wetlands is not as large as that addressing “riparian” areas. However, many of the conclusions can be readily applied to wetlands because they are not receiving-water specific. That is, for example, the ability of a buffer to remove sediment as it flows through, or to infiltrate water, or to provide habitat is not a function of the riparian area it borders, but more a function of its vegetative character next to a resource of interest. 3.1 Hydrology Wetlands occur in the landscape at low spots where water gathers or at spots where groundwater is impeded from moving further downward because of an impermeable layer in the soil. The many hydrologic functions and values of wetlands are related to their ability to absorb, treat and transmit water that flows through them. The “sponge” effect of wetlands allows them to accept runoff, store it for a while, allow particles to drop out of suspension or filter through vegetation, allow it to soak into the ground, give it a chance to be absorbed and transpired by vegetation, or simply to evaporate. Wetland types of all kinds perform these many functions to some degree, which is why even “marginal” wetlands are important to preserve and to protect with some type of buffer. The many water quality improvements that result from these hydrologic functions are discussed in the next section.

4
Buffer areas surrounding wetlands supplement the wetland’s ability to perform these functions by dissipating the runoff water energy flowing into the wetland, pre-treating the load that the runoff carries and transforming a portion of the flow from surface water to groundwater. Buffer areas also can provide additional capacity for storage of water once the wetland it surrounds has filled. All of these functions become increasingly important as the landscape changes from undeveloped to developed, and runoff increases in volume but finds fewer places to accumulate harmlessly. One of the most important hydrologic values of a buffer is its ability to provide an area for surface water and groundwater interaction. This occurs in two ways. First, as water flows across a buffer, it infiltrates through the vegetation, reducing the volume of runoff reaching the wetland. Secondly, as excess water is stored in the wetland, water levels rise and expand over the buffer area, thus presenting more surface area and another opportunity for water to soak into the ground. In both cases, the recharged shallow groundwater typically reverses flow and discharges later as surface water. The water quality value of this will be discussed in the next section, but the quantity values are reduction in total runoff volume and shallow groundwater recharge/discharge. Buffers underlain by impermeable clay soils may not be able to offer the groundwater component of this overall treatment scheme. This should not, however, eliminate these areas from consideration because of the numerous other benefits that result on the ground surface. In parts of the drainage system that are storm-sewered, drain-tiled or channelized, runoff might occur in such a way that buffers are by-passed. That is, a storm sewer or drain tile can discharge directly into a wetland, or a channel can cut directly through a buffer. Some consideration needs to occur in these situations for how to take advantage of the buffer area. Options include re-orienting the flow such that the inflow discharges up-gradient of the buffer, or simply allowing the buffer to be part of the storage/treatment system as the increased volume within the wetland rises. By far the best manner to treat runoff in a buffer is to spread it out such that sheet flow occurs uniformly across the buffer’s vegetation. Realistically, however, this is not always possible to accomplish, especially when development has occurred and the drainage system has been installed without this approach in mind. The District is encouraged to consider the benefits of retrofitting buffers in all instances when redevelopment presents the opportunity. 3.2 Water Quality Because of their location within a watershed, wetlands act as collection points for runoff and all of the material it carries with it, including those things that can be considered “pollution”. To preserve the naturally cleansing capabilities of wetlands, some pre-treatment is needed so that the natural wetland functions are not overwhelmed. Buffer areas can play a non-structural role in pre-treatment simply by their inherent nature as a place for water to filter, soak in, contact soil and be taken up by vegetation. The discussion that follows summarizes information on the effectiveness of these processes for different pollutants under different physical settings. The information used to develop this section is summarized in Appendix B (Table B2).

5
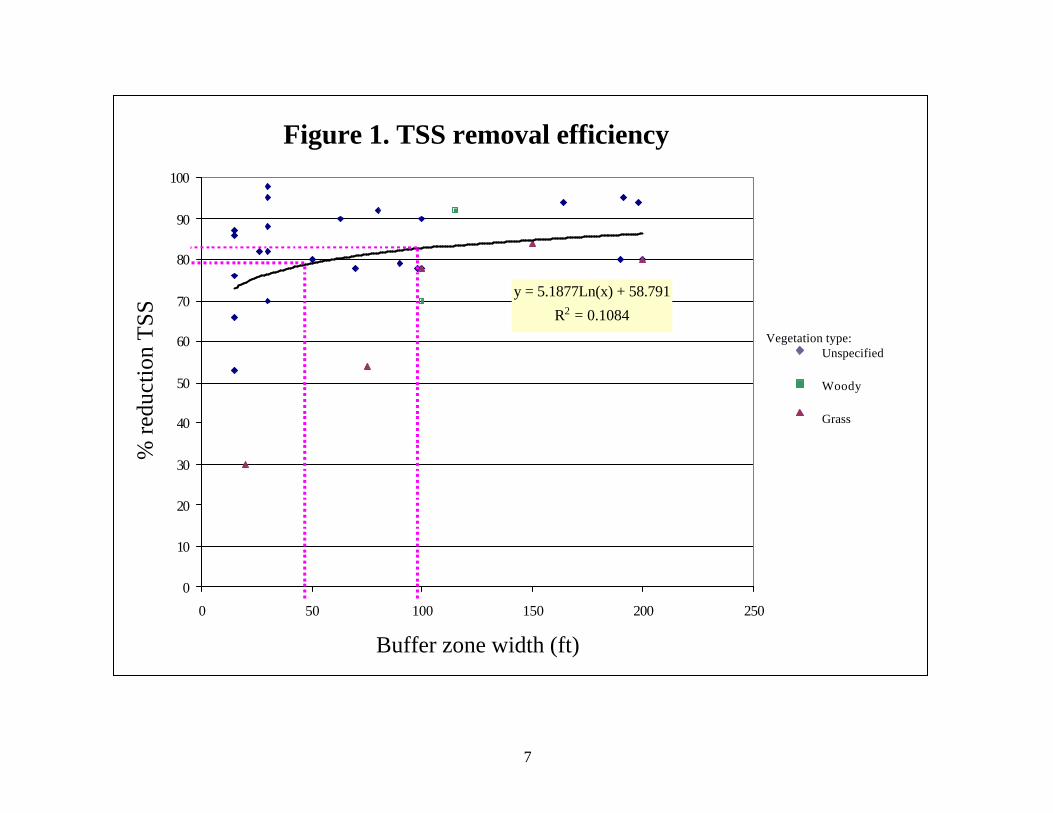
Solids Vegetation can play a major role in filtering organic and inorganic solids, and the pollutants that travel with them, from runoff. Filtration through groundcover, accumulated detritus, and various exposed parts of the plant or tree occurs as these obstacles get in the way of moving particles. Vegetation also reduces the energy of flow, thus slowing water down, spreading flow out and allowing gravity to settle particles too heavy to move at a reduced energy level. This energy reduction also cuts the erosive potential of runoff. Table B2 lists the specific study results that pertain to solids, primarily as total suspended solids (TSS) reduction. Although most of the findings pertain to TSS, some of the reports note that bedload reductions are assumed to equal or exceed suspended solids reductions because of the higher mass of bedload. The reports from which information in the table was derived seem to reach a consensus that “good” solids reduction begins with a buffer width of about 50’. TSS is the subject of many of the research studies performed on buffers. Unfortunately, many of the details of the studies are not listed in the research reports or in the large literature reviews. Most research reports the results of a single buffer width, rather than a series of different widths, all of which are evaluated. The significance of stating that a certain width is “good” or “best” dwindles when it is not compared in the same study with another width or set of widths. Nonetheless, there is some consistency in the findings and some support for recommending a minimum wetland buffer width of 50’ for shallow slopes (<5%) and 100’ for steep slopes (5-15%). Slopes over 15% seem to be the basis for suggestions that additional width is needed. The District should consider if it wishes to pursue this approach, and what slope it would consider as a base for addition of extra buffer width. Values mentioned in the literature vary from 2’/1% increase (Castelle and Johnson, 2000; Wenger, 1999) to 4’/1% increase (Fairfax County, 2000) Figure 1 is a compilation of study results showing TSS reduction as a function of buffer width and type of buffer, if known. Each of the points is a single data reference taken from a large literature review or directly from a research report. Even though there is substantial variation in the data, the graphic indicates that TSS reductions of 70% and more begin to occur with certainty when buffer widths reach 50’. The graphic also shows that the lower limit of 70% occurs for every instance when 100’ of buffer is in place. The graphic illustrates a point made in several of the literature reports, that being that the relationship of buffer width to water quality improvement is not linear, so even large increases in buffer size do not necessarily yield similar water quality benefits. The 100’ line seems to be the bottom width for which 80-100% removal occurs. Even a doubling to 200’ does not appreciably increase the water quality benefit. The dashed lines in Figure 1 show that for a condition reflective of the statistically “best” line (recall a previous statement about the data variability), a doubling of the buffer from 50’ to 100’ would reduce the TSS load another 3-4%, but it does raise the assurance of low values above the 70% mark. This indicates that a high priority on sediment reduction would favor the high end of the range, but a lower priority might not justify the cost of
6
doubling the width. The graphic also indicates that two low values occur for grassed buffers in the 0-50’ and 50-100’ ranges. Statistical deductions cannot be drawn from this, but intuitive results support a mix of vegetation, including groundcovers, shrubs and trees. This mix breaks rainfall energy, provides good rooting and soil binding, and spreads flow out, plus provides the stem density in the grass part of the buffer that Vough et al. (1999) found helps remove TSS and TP. A final point on solids removal is that there are a number of different pollutants that are associated with solids. Later discussion of specific pollutants will clarify this, but pollutants such as particulate nutrients, heavy metals and oxygen-demanding substances move with, and settle with solids.
7
Figure 1. TSS removal efficiency
y = 5.1877Ln(x) + 58.791
R2 = 0.1084
0
10
20
30
40
50
60
70
80
90
100
0 50 100 150 200 250
Buffer zone width (ft)
% re
duct
ion
TSS
Unspecified
Woody
Grass
Vegetation type:

8
Phosphorus The reduction of phosphorus and nitrogen makes for an interesting discussion relative to buffer performance because of the different bio-physical nature of their reduction processes. Phosphorus reduction reported in literature focuses on total phosphorus (TP), which is the sum of particulate and dissolved sources. Unfortunately, a distinction in this study cannot be made about each of the components, but some general conclusions are possible. The principal process involved in phosphorus reduction is particulate filtering of organic material (ex., grass, leaves, woody debris). Soluble forms of phosphorus also adsorb to particulates and settle with then. Eventually the solid organic material breaks down, sorption bonds break and soluble phosphorus becomes mobile, at which point it can soak into the soil, be taken up by vegetation or flow away. Because there is a limit on the number of sites available in the soil column for adsorption of phosphorus, a condition of export might occur when soil saturation occurs, thus reducing the “permanent” reduction in TP associated with a particular buffer area. However, the simple delay caused by the buffer as the transition from particulate to soluble phosphorus occurs serves to dampen the impact on downstream water bodies through the slow release. Summary information in Table B2 indicates that the effectiveness of buffers for phosphorus removal is a function of both width and slope. In shallow slope situations, a 50’ buffer seems to be sufficient, but as slope increases, a wider buffer (100’) seems to be warranted. Figure 2 summarizes the data in Table B2, and shows some similarities to the behavior of solids shown in Figure 1. This should come as no surprise given the previous discussion on phosphorus and organic debris. Figure 2 shows that 50’ again marks the transition between relatively low TP removal and (with a few exceptions) higher removals (>65%). The dashed lines also show that doubling the width will likely result in an increase of about 10% in the amount of TP removed. Again, if phosphorus is not a major concern, an increase from 50’ to 100’ might not be economically justifiable; however, in areas draining to sensitive waters where wetland and buffer treatment are used as BMPs, this could be a worthwhile expense. Following the TSS guideline for slope (<5%, 5-15%, >15%) could assist in making the judgment on how wide to construct a particular buffer. As with Figure 1, the TP graphic does not give much insight into the grass versus shrub versus forest choice. A mix of vegetative choices is again recommended to maximize the level of treatment. Note that a single negative value derived in a study by Yu et al., 1992 is not contained in Figure 2. The number was left out because it does not contribute to the District’s goal of examining how buffer widths contribute to positive pollutant reduction. In this sense, the data point is an outlier, but it is mentioned here for the District to be aware that there are occasions when buffers, or any treatment system, might release some of the material that it has collected. This is especially true of phosphorus because of its tendency to transform from highly particulate to soluble forms as organic debris breaks down and as oxygen conditions change.

9
Figure 2. TP removal efficiencies
y = 13.988Ln(x) + 10.048
R2 = 0.2785
0102030405060708090
100
0 50 100 150 200
Buffer zone width (ft)
% r
educ
tion
TP
Unspecified
Woody
Grass
Vegetation type:
10
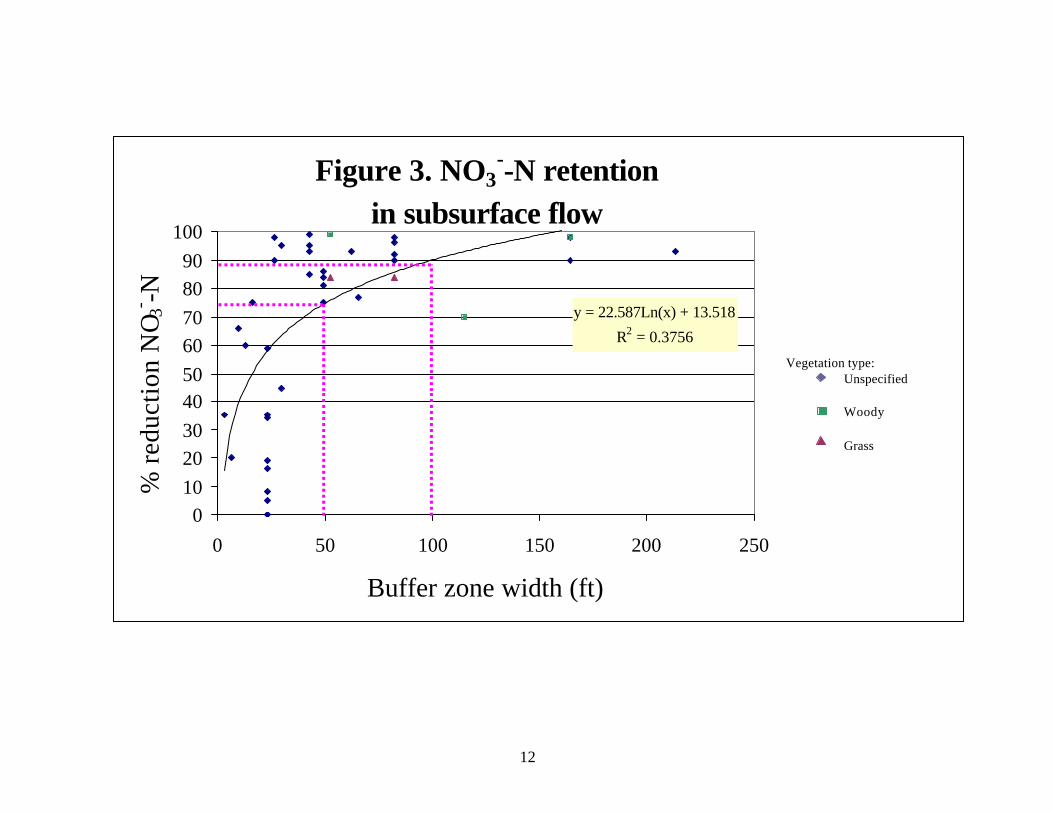
Nitrogen Nitrogen removal studies related to buffers address mostly nitrate. Although some other nitrogen constituents are reported in Table B2, the predominant species studied is nitrate. Nitrate removal in buffers occurs mostly in the sub-soil, where anaerobic bacteria transform, or denitrify, nitrate to nitrogen gas. This is a permanent removal, since the gas then escapes through the soil voids. The presence of moisture and lack of oxygen, aided by high groundwater, assists in the denitrification process. Some additional nitrogen removal occurs as particulate organic nitrogen is filtered through the buffer vegetation and as various soluble forms of nitrogen are taken up as a nutrient by vegetation. Table B2 reflects the very high level of nitrate removal that can occur in wetland buffers. It is important to remember that because denitrification is a sub-soil process, that sufficient space and proper conditions need to be in place for the process to proceed at its optimum pace. Therefore, a buffer width of 100’ is recommended by most authors who were reviewed. Figure 3 illustrates the removal of subsurface nitrate as a function of buffer width, and Figure 4 presents similar findings for surface flow. Because of the denitrification process, the difference in width becomes more important with nitrate than with the other pollutants that are discussed. Although Figure 3 shows that substantial subsurface nitrate reduction can occur in buffers less than 50’, consistent reductions over 75% are virtually assured over 50’ and rise to the 90%+ range when 100’ of buffer are provided. Surface nitrate removal (Figure 4) shows a similar pattern to all of the other contaminant removal versus buffer width relationships, however overall removal seems to be less in the lower buffer width range. As explained above, nitrate is a soluble transition product that is best reduced under anaerobic conditions in the soil. Surface reductions come mostly from infiltration, which becomes more of a factor for wider buffers. The increase in surface nitrate removal with an increase from 50’ to 100’ is about 15%, similar to the subsurface change, but in a lower range. Because the subsurface removal process of denitrification works so well in wetland buffer areas and provides a permanent release of nitrogen to the atmosphere, a width of 100’ is recommended as a minimum to promote infiltration and adequate flow distance to allow proper denitrification. Some data for other forms of nitrogen is also reported in Table B2. Ammonium (NH4
+) and Total Kjeldahl Nitrogen (TKN – the sum of organic nitrogen and ammonium) were evaluated in a few of the studies. In most of the instances reported, these forms of nitrogen are readily transformed (decomposition, nitrification) into nitrate by the time the buffer area is reached such that the studies focused more on nitrate behavior. However, there are instances reported in Wenger (1999) where TKN and NH4
+ decrease through the buffer as nitrate increases. This occurs because the inflow levels of these constituents are likely high and enough oxygen is available to result in a nitrifying condition. In most cases, however, the inflow of nitrate is usually high and denitrification, as described above, occurs. In other instances reported in Clausen et al (2000) and Wenger (1999), the buffer is of sufficient length (100’ and 164’, respectively) that both processes appear to

11
exist, and substantial reductions in all forms of nitrogen occur. Please note that some of the nitrogen data reported in Table B2 is for total nitrogen (TN). In these cases, it is not possible to draw conclusions about specific types of nitrogen. However, it can be seen quite clearly that good TN removals occur whenever adequate buffer areas are available. Recent attention by the U.S. EPA on the need for Mississippi River Basin nitrogen reduction could indicate a need within the watershed to focus some attention on nitrogen reduction. Providing wetland buffers could be a valuable tool in the movement to achieve that goal. A final note on nutrients, maintaining a healthy vegetated buffer strip will assure that there is a continual demand for nutrients to support the growth of the vegetation. Although “permanent” nutrient removal by vegetative uptake is rare in the long-term, buffer vegetation can tie-up nutrients in plant material for long periods of time and slowly release it over its lifetime. Truly permanent nutrient removal can be achieved only through nitrogen gas escape, harvesting and removal, or deep burial in the soil column.
12
Figure 3. NO3--N retention
in subsurface flow
y = 22.587Ln(x) + 13.518
R2 = 0.3756
0102030405060708090
100
0 50 100 150 200 250
Buffer zone width (ft)
% re
duct
ion
NO 3
- -N
Unspecified
Woody
Grass
Vegetation type:

13
Figure 4. NO3--N retention in surface flow
y = 24.604Ln(x) - 31.902
R2 = 0.4509
0
10
20
30
40
50
60
70
80
90
100
0 50 100 150 200
Buffer zone width (ft)
% r
educ
tion
nit
rate
Unspecified
Woody
Grass
Vegetation type:

14
Biological Pollutants There are limited literature values reported for biological contaminants, including bacteria, oxygen-demanding substances and animal waste from agricultural activities. The easiest way to get an impression of the removal of some of these contaminants by buffers is to associate the contaminant with its closest physical form, and follow the previous discussions on removal efficiencies. For example, feedlot runoff containing a large amount of nitrogen-soaked organic waste would be filtered and the dissolved nitrogen would soak into the ground or be taken up by the vegetation according to the previously discussed processes. Biochemical oxygen demand (BOD) and chemical oxygen demand (COD) for filter strips in an urban area followed sediment behavior very closely, indicating a physical make-up that was largely particulate in character. Fecal coliform, on the other hand, cannot be closely associated with other pollutants covered previously. The single piece of data presented in Table B2 shows a coliform removal of 60% associated with a 98’ grassed buffer strip. Findings associated with this one study cannot be extrapolated with any certainty. Heavy Metals The overall effectiveness of buffers is validated in Table B2 by some additional numbers for heavy metals (ex., lead-Pb, zinc-Zn). The data on heavy metals is fairly consistent with the known behavior of metals to associate with the particulates that move with runoff. Although a certain portion of metals is certainly in the soluble form, in nonpoint source runoff, it has been well documented that metals removal follows solids removal patterns. 3.3 Habitat The second major function and value of wetland buffers is the benefit that accrues for both aquatic and wildlife habitat. The vegetated uplands adjacent to wetlands are considered one of the richest zones for aquatic organisms, mammals and birds (Castelle et al., 1992). This occurs because there is an overlap of ecological zones between upland and aquatic habitats, where species from both zones use the buffers. This “edge effect”, as described in numerous pieces of ecological research, is one of the principal reasons for preserving buffer areas near water resource features. The direct aquatic habitat benefits occur when there is some standing water associated with the wetland being buffered, even if the water is seasonal. However, any process that cleans runoff on its way to any receiving water does benefit aquatic life. Wildlife habitat improvements associated with wetland buffers include corridor extension/connection, breeding and nesting cover, food sources, roosting sites, shading of water to lower temperatures, predator protection, and shelter from cold and hot temperatures. Habitat improvement is clearly an area where bigger is better relative to buffer width. The large number of birds, amphibians, reptiles and mammals potentially using wetland and buffer transition areas in the western metro area are listed in Appendix C.

15
As development pushes ever outward, two things that quickly occur are the severing of wildlife corridors and the isolation of individual islands of habitat. Wetland buffers can help to maintain or re-establish these corridors that wildlife need for protection during their movement. Educational information distributed by NEMO (the Nonpoint Education for Municipal Officials) program indicates that it is not only the total acreage, but also the amount of connected and large-tract habitat that is important in off-setting the fragmentation that occurs in both urban and farmed areas. Buffer width to accommodate corridor maintenance was among the highest recommended in the literature reviewed. Although an absolute minimum of 50’ is recommended by many authors, they consistently urge that more be set aside, with several suggesting up to 600’. The high end of this range will be difficult to achieve in an urban setting, but some foresight while development proceeds outward could result in open space or park development that accommodates these larger widths and connects corridors within the watershed. The studies again mention that a mix of trees, shrub and groundcover best serves the multiple needs of assorted wildlife. One of the most significant benefits of buffer areas near any standing water is the ability to shade the water and keep the temperature down during the summer. This can best be done by mature stands of trees, but can also be accomplished on a smaller, local scale by shrubs and tall ground vegetation that shades water as it flows through. Buffer areas can serve this function by taking in warm runoff water and cooling it as it flows through vegetation. Additional benefits of cooling are that water will hold more oxygen at lower temperatures and more desirable aquatic life thrives in cooler water. One final point is that buffers can serve to eliminate the inexact measurement of where a wetland actually ends and upland begins, if such a point is not immediately clear. Adding a buffer area lessens the importance of the line and allows for some transition to occur. This does not to minimize, however, the importance of establishing a line for purposes of defining buffer width. 3.4 Human Impact The proximity of any water related landscape feature tends to raise land values and attract people. Although this appreciation of water related features is positive, the pressure that humans and their activities place on the features is not. Among the impacts that increased human encroachment places on wetlands are native vegetation cutting to increase lawn size, debris dumping, domestic animal predation, trampling, increased noise and light, and recreation vehicle use. Although difficult to quantify, many of the reviewed reports indicate that human separation distance from wetlands should be in the 50’ to 300’ range to minimize these impacts. A study in Washington State (Castelle et al., 1992) found that 95% of buffers less than 50’ saw direct adverse results from human impact, whereas only 35% of those over 50’ experienced a similar adverse impact. This distance can ideally be used to establish a buffer from which numerous benefits can accrue.

16
3.5 Quality of Life Perhaps the most difficult values to quantify for wetlands and the space that surrounds them is the increase in the quality of life that results from their presence. The aesthetic and open space value is something that people seek out. The recreation value of walking through a wetland area, or pursuing a wetland-reared bird or animal to hunt or photograph is hard to assess in monetary terms. The educational value gained by studying how nature works through water resources is equally tough to quantify. Yet in all of these cases, we know there is some intrinsic value that derives from our association with wetlands, and therefore dictates that we do our best to protect them. Buffers not only perform this protective function, but they also add to all of the quality of life benefits associated with the wetland itself. 4. MANAGEMENT APPROACH The material presented thus far lays the framework for some discussion on management approaches for the Watershed District that builds upon its previous work. The District’s establishment of buffer areas around all wetlands is supported by this study. It is a common practice to protect wetlands with buffers as part of a comprehensive surface water management plan. The use of buffers as a non-structural BMP will likely negate the need for more expensive structural approaches that could impact the environment more. The inclusion of wetland buffers as part of a comprehensive surface water plan is an approach endorsed by many of the reports that were reviewed for this study. This approach also supports the way in which the District has conducted its activities for many years. The importance of wetlands in water movement and treatment cannot be emphasized enough. Any enhancement that can be made to assure their continued existence and functionality is warranted as part of good overall watershed management that supports low impact development and promotion of infiltration techniques. The width of the protective buffers is variable in the literature for different functions and values, but there are consensus widths as identified in the Major Findings section at the beginning of this report. The matter of application according to size will require some thought by the District. A simple calculation of buffer area versus protected wetland for the one acre wetland shows that a 25’ buffer is about one-half the total area of the wetland (0.5 acre), a 50’ buffer is about equal (1.0 acre) and a 100’ buffer about 2.5 times the area (2.5 acres). The District might want to think about using a width determination based upon the Hennepin Conservation District’s wetland functions and values study currently underway for the MCWD. This inventory will give the District a firm basis for assessing the functions and values of each wetland within the District. The District could establish a minimum that would apply to all wetlands, and then customize additions to the base according to functions, values, and perhaps wetland size. This would also allow changes

17
to be made to adjust for such factors as steep slopes, poor soils, encroaching land uses or extreme sensitivity. Variances in the buffer approach could still be made for economic hardship or unusual circumstances, and flexibility could be introduced through buffer averaging, clustering or conservation easements, provided the health of the buffer and the wetland it protects are assured. The District must remain vigilant, however, to assure that lower value wetlands are not discarded as resources of no value. Even the most highly impacted wetlands perform a valuable watershed function. These wetlands also offer the most promising sites for retrofits and wetland reclamation, and possible wetland banking credits. The nature of buffer area vegetation is something to consider. Although many of the reviewed reports stressed the need to retain forests as the primary buffer vegetation, they also stressed the need to keep the buffers diverse. It seems that the ideal mix would include trees, shrubs and groundcover that would provide several layers of protection. Some authors have proposed an outward transition from the wetland, starting with trees closest to the wetland, then moving to shrubs, and groundcover as the outer zone. This approach allows for some filtration of runoff prior to its movement deeper into the buffer, with infiltration and nutrient uptake enhanced by shrub and tree roots as the buffer approaches the wetland. Each vegetative type has its own beneficial character. For example: grass has a high stem density effective in filtering; trees stabilize soil and dissipate rainfall energy; and shrubs behave similar to trees. All of the vegetative types provide habitat. A suggestion for the groundcover portion of any buffer is that native prairie planting be considered. The deep roots, hardiness, aesthetic appeal, unique habitat character and filtering excellence all make prairies an ideal vegetative ecosystem to introduce as a wetland buffer. Maintenance of buffer areas is essential to their proper long-term operation. Special attention should be paid to keeping runoff over the buffer in sheet flow, removing accumulations of pollutants, keeping vegetation healthy and keeping soils as pervious as they can be. An annual maintenance program for buffer areas would help to assure their continued success as an integral part of the overall watershed management program. As a final note, the surest way for the Watershed District to document the effectiveness of its buffer approach is to conduct monitoring to see what the approach actually accomplishes. In addition to straightforward water quality and quantity monitoring, the District could sponsor different buffer configurations and vegetative mixes to see what works best under differing circumstances. Perhaps an LCMR or Metro Council MEP grant proposal could supplement District funds for such an effort.

18
5. RECOMMENDATIONS
1) All wetlands within the Minnehaha Creek Watershed District should receive some level of buffer protection. The level of protection should be based upon the wetland functions and values inventory currently being conducted by the Hennepin Conservation District.
2) The use of wetland buffers should be considered as an integral part of the
District’s overall surface and groundwater management plan, and its efforts to meet its water-related resource protection responsibilities.
3) The determination of buffer widths on individual wetlands should be based on
the following minimum guidelines: - 50 - 100’ for overall water quality protection - 50 - 200’ for habitat protection and species diversity - 50’ for reduction of human impact - Use of the high end of the range for sensitive wetlands, steep slopes and
surrounding land use that could adversely impact the wetland - Add buffer width to off-set the adverse impacts of slope, poor soils,
human land use pressures, or to add extra protection for sensitive aquatic or wildlife.
4) Flexibility in application of buffer requirements can be achieved through
averaging, clustering credits, variances and conservation easements, provided the health of the wetland and buffer are assured.
5) A vegetative mix of trees, shrubs and groundcover are recommended, with care
taken to assure that runoff through buffers occurs as sheet flow and vegetation is kept healthy to maintain its physical filtering and chemical uptake characteristics.

19
APPENDIX A – LIST OF REFERENCES Addy, K.L., A.J. Gold, P.M. Groffman, and P.A. Jacinthe, 1999. Ground water nitrate
removal in subsoil of forested and mowed riparian buffer zones. Journal of Environmental Quality 28:962-970.
American Society of Civil Engineers, 2001. Guide for BMP Selection in Urban Developed Areas. ASCE Urban Water Infrastructure Management Committee’s Task Committee for Evaluating BMPs. (City of) Amherst, New Hampshire, 2001. Amherst Wetland Buffers. Website at www.ultranet.com/~harts/acc/wetlands4.shtml Brown’s Creek Watershed District, 2001. Second Generation Watershed Management Plan. Burt, T.P., L.S. Matchett, K.W.T. Goulding, C.P. Webster, and N.E. Haycock, 1999.
Denitrification in riparian buffer zones: the role of floodplain hydrology. Hydrological Processes 13:1451-1463.
Castelle, A. Y. and A. W. Johnson, 2000. Riparian Vegetation Effectiveness. National Council for Air and Stream Improvement (NCASI), Triangle Park, N.C., Technical Bulletin No. 799, 26 p., February 2000. Castelle, A. J., A.W. Johnson, and C. Conolly, 1994. Wetland and Stream Buffer Size Requirements – A Review. Journal of Environmental Quality, 23:878-882. (contains 39 scientific references) Castelle, A. J., C. Conolly, M. Emers, E. D. Metz, S. Meyer, M. Witter, S. Mauermann,
T. Erickson, and S. S. Cooke, 1992. Wetland Buffers: Use and Effectiveness. Washington State Department of Ecology, Shorelands and Coastal Zone Management Program, Olympia, WA, February 1992, 171 p. (contains 126 scientific and survey references)
Center for Watershed Protection, 2001. Fact Sheet Series. Available from website at www.stormwatercenter.net including: - Aquatic Buffers Fact Sheet: Buffer Zones - Stormwater Management Fact Sheet: Grassed Filter Strip - Model Ordinance: Buffers - Model Ordinance: Rhode Island Coastal Zone Program

20
Center for Watershed Protection, 1994. Watershed Protection Techniques, Technical
Note 14, Vol. 1, No. 1, Feb 1994: Summary of: Sweeney, B.W, 1993. Effects of streamside vegetation on macroinvertebrate communities of White Clay Creek in Eastern North America. Proceedings of Academy of Natural Sciences of Philadelphia (144)-291-340.
Clausen, J.C., K. Guillard, C.M. Sigmund, and K.M. Dors, 2000. Water quality changes
from riparian buffer restoration in Connecticut. Journal of Environmental Quality 29:1751-1761.
Environment Canada, 1997. Considerations When Working Around Wetlands. 9 p.,
Available from website at www.on.ec.gc.ca/glimr/data/working-wetlands/considerations.html Findlay, C. S. and J. Houlahan, 1997. Anthropogenic Correlates of Species Richness In Southeastern Ontario Wetlands. Conservation Biology, 11(4):1000-1009. Haycock, N.E., and G. Pinay, 1993. Groundwater Nitrate Dynamics in Grass and Poplar
Vegetated Riparian Buffer Strips During the Winter. Journal of Environmental Quality 22:273-278.
Hefting, M.M. and J.J.M. de Klein, 1998. Nitrogen Removal in Buffer Strips Along a
Lowland Stream in the Netherlands: A Pilot Study. Environmental Pollution 102(S1):521-526.
Hunter Wetlands Research, 2001. The Functions and Width of Wetland Buffers. Hunter Wetlands Research Group, Australia, available from website at www.hunterwetlands.com.au/buffer1.html Illinois Groundwater Consortium, 1995. Artificial Wetlands Are Working to Reduce Nitrogen Pollution. Groundwater Bulletin No. 2, Winter 1995/96, 2p. Available from website at www.siu.edu/worda/igc/wetland_buffers.html Iowa State University – University Extension, 1997. Buffer Strip Design, Establishment And Maintenance. Stewards of Our Streams, PM 1626b, 6 p. Low Impact Development Center, 1999. Low-Impact Development Design Strategies: An Integrated Design Approach – Filter Strips and Vegetated Buffers. Prepared For Prince George’s County, June 1999, pp. 4-12 to 4-14. Mander, U., T. Oja, and K. Lohmus, 1999. Nutrient transformation in riparian buffer
zones: modeling approach. In Ecosystems and Sustainable Development II. (Eds. J.L. Uso and C.A. Brebbia) Southampton, UK: WIT Press.

21
Minnesota Pollution Control Agency, 2000. Protecting Water Quality in Urban Areas: Best Management Practices for Dealing with Storm Water Runoff from Urban, Suburban and Developing Areas of Minnesota. Prepared by the MPCA, March 1, 2000, pp. 4.21-1 to 4.21-4, and 4.61-1 to 4.61-5. (State of) Minnesota Storm-Water Advisory Group, 1997. Storm-Water and Wetlands: Planning and Evaluation Guidelines for Addressing Potential Impacts of Urban Storm-Water and Snow-Melt Runoff on Wetlands. Printed by the Minnesota Pollution Control Agency, June 1997, 113 p. National Arbor Day Foundation, 2000. Conference Notes – Buffers: Commonsense Conservation for Urbanizing Landscapes. May 9-11, 2000, Nebraska City, Nebraska. Articles include: - “Conservation Buffers to Protect Aquatic Resources” by A. H. Todd - “Suburban Stream Hydrology and Stormwater Quality” by R. R. Horner - “Conservation Buffers to Enhance the Human Environment: Economic
Benefits” by A. Lipkis - “Design Principles for Conservation Buffers to Accommodate Wildlife in
Urbanizing Landscapes” by C. W. Johnson - “Restoring Conservation Buffers in Urbanizing Landscapes” by J. M. Patchett - “Conservation Buffer Maintenance and Access Management” by D. C. Outen - “Environmental Quality Corridors in Fairfax County, VA” – hand-out - “Trees in the Riparian Zone” – hand-out, Tree City USA, Bulletin No. 40, J.R.
Fazio (ed.) , 1999 NEMO (Nonpoint Education for Municipal Officials), 2001a. Carving Up the Landscape. NEMO Fact Sheet #10, available from website at www.NEMO.uconn.edu NEMO, 2001b. Addressing Imperviousness in Plans, Site Design and Land Use Regulations. Technical Paper Number 1, Univ. of Connecticut Extension, 10 p. Osborne, L. L. and D. A. Kovacic, 1993. Riparian Vegetated Buffer Strips in Water- Quality Restoration and Stream Management. Freshwater Biology, 29, 243-258. Schueler, T., 1995. The Architecture of Stream Buffers. Center for Watershed Protection, Watershed Protection Techniques, 1(4):155-165. Snyder, N.J., S. Mostaghimi, D.F. Berry, R.B. Reneau, S. Hong, P.W. McClellan, and
E.P. Smith, 1998. Impact of Riparian Forest Buffers on Agricultural Nonpoint Source Pollution. Journal of the American Water Resources Association 34(2):385-395.

22
U.S. Environmental Protection Agency, 2001. Model Ordinances to Protect Local Resources: Aquatic Buffers. EPA Office of Water, 17 p. Vought, L. B.M., J. Dahl, C.L. Pedersen, and J.O. Lacoursiere,. 1994. Nutrient
Retention in Riparian Ecotones. Ambio 23(6):342-348. (contains 9 scientific references, used in nitrate efficiency graph)
Wenger, S., 1999. A Review of the Scientific Literature on Riparian Buffer Width, Extent
and Vegetation. Office of Public Service and Outreach, Institute of Ecology, University of Georgia, Athens, 59 p. (contains 140 scientific references)
Yu, S., M. Kasnick, and M. Byrne, 1992. A Level Spreader/Vegetative Buffer Strip System for Urban Stormwater Management in “Integrated Stormwater Management, R. Field et al., eds. Lewis Publishers, Boca Raton, FL, pp. 93-104.
23
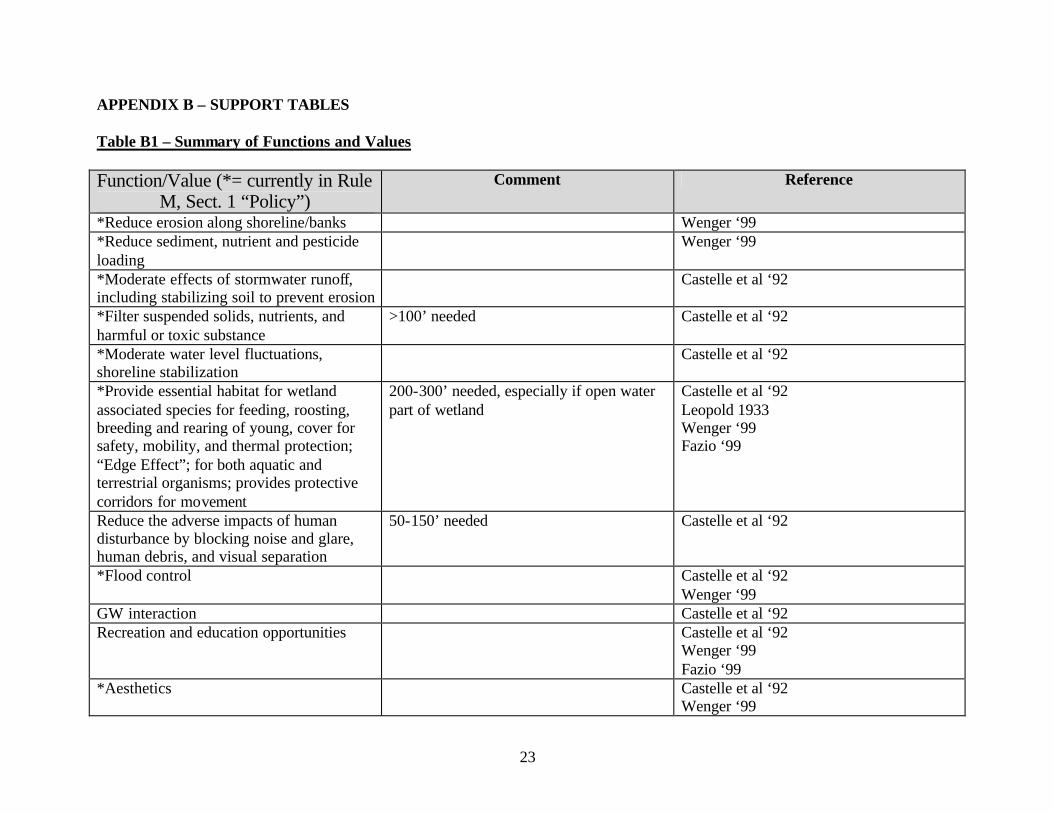
APPENDIX B – SUPPORT TABLES Table B1 – Summary of Functions and Values Function/Value (*= currently in Rule
M, Sect. 1 “Policy”) Comment Reference
*Reduce erosion along shoreline/banks Wenger ‘99 *Reduce sediment, nutrient and pesticide loading
Wenger ‘99
*Moderate effects of stormwater runoff, including stabilizing soil to prevent erosion
Castelle et al ‘92
*Filter suspended solids, nutrients, and harmful or toxic substance
>100’ needed Castelle et al ‘92
*Moderate water level fluctuations, shoreline stabilization
Castelle et al ‘92
*Provide essential habitat for wetland associated species for feeding, roosting, breeding and rearing of young, cover for safety, mobility, and thermal protection; “Edge Effect”; for both aquatic and terrestrial organisms; provides protective corridors for movement
200-300’ needed, especially if open water part of wetland
Castelle et al ‘92 Leopold 1933 Wenger ‘99 Fazio ‘99
Reduce the adverse impacts of human disturbance by blocking noise and glare, human debris, and visual separation
50-150’ needed Castelle et al ‘92
*Flood control Castelle et al ‘92 Wenger ‘99
GW interaction Castelle et al ‘92 Recreation and education opportunities Castelle et al ‘92
Wenger ‘99 Fazio ‘99
*Aesthetics Castelle et al ‘92 Wenger ‘99

24
Function/Value (*= currently in Rule
M, Sect. 1 “Policy”) Comment Reference
Lit. review on human impact reduction - 50’ for hardwood swamp near low
intensity LU (ag, low density residential, recreation)
- 100’ ditto for high intensity - must be > 50’ and not on
residential lot to have LT sustainability
To negate effects of human impact; greatest protection from steeply sloping (?) buffers with dense shrub understories
Castelle et al ‘92
*Literature review on species diversity Min. 50’ needed for good habitat preservation for birds; 75’ for “game” bird and deer; most birds and mammals assoc. with wetlands lives within 600’
Castelle et al ‘92
*Moderation of in-stream temperatures Rule M, Section 1 *Maintenance of property values Rule M, Section 1 Bird screening 40-100m (132-330’) Water and Rivers Commission, East Perth,
Western Australia *Maintain biodiversity in so. Ontario wetlands
Need 1-2km (3280-6560’) Findlay and Houlahan, 1997

25
Function/Value (*= currently in Rule
M, Sect. 1 “Policy”) Comment Reference
*Literature review of shading effects Relative benefit of buffer shading for stream function of species composition, age of stand, density of vegetation; summary shows finding by one study that >30 m (100’) needed to provide shading similar to old-growth stand, while another says 12m (40’) all that is needed following logging while another reports that 15m (50’) provides 85% of max shade for small streams and another found 90% of max angular canopy density can be achieved with a 17m (56’) buffer
Castelle and Johnson 2000
Literature review of slope factors - references USDA recommendations for 3-8m (10-26’) buffer next to pastures up to 30% slope; 23-92m (76-304’) for livestock feedlots and liquid waste treatment on 2-6% slopes
- other sources min. 8m (26’) plus 0.6m (2’) additional for each 1% slope to max. 70m (231’) or 15m (50’) base plus 6m (20’) for each 5% increase in slope
Castelle and Johnson 2000

26
Table B2. Summary of Water Quality Findings for Buffers.
Specific Condition Water Quality/Quantity Improvement** Reference Buffer width - 15’ for short-term* - 100’ for long-term - >100’ for steep slopes * “An absolute minimum width would be 30 feet” referring to riparian zones
Sediment reduction Wenger ‘99
Ditto for sediment control to get most particulate P
P reduction – short-term, with long-term benefits limited Wenger ‘99
100’good, 150’ best N reduction (nitrate) – especially near wetlands that are sites of high denitrification
Wenger ‘99
- 35-100’ native forested trees along streams
- 300’
- Aquatic habitat maintenance, temp. control - protecting diverse terrestrial riparian wildlife
Wenger ‘99
Best water quality protection from dense vegetation and slopes <15%
Castelle et al ‘92
Literature report on sediment removal - 100’-200’ width needed for 2% slope - 80’ from livestock feedlot - 200’ grass swale buffer - 98’ in logging area
- 90-95% sediment reduction - 92% reduction - 80% total suspended solids (TSS) reduction, ditto total lead
(TPb) - 75-80% TSS reduction and protection of aquatic life
Castelle et al ‘92
Value of vegetation Wetland grasses can take up 80% of available P; plus heavy metals (HMs) (no % reported); keeps shaded to limit algal blooms that lead to anaerobic release of polls
Castelle et al ‘92

27
Specific Condition Water Quality/Quantity Improvement Reference
Literature reports on nutrient reduction - 300-860’ buffers at feedlots on slopes
from 0.5-4% - 62’ coastal Maryland - 75’ No. Carolina regulation - 1:1 buffer to animal waste area
- 80% removal of nutrients, solids and oxygen-demanding
substances - 80% P, 89% N - “inadequate” for filtering residential development - 90-100% animal waste reduction
Castelle et al ‘92
Literature review – fecal coliform; 98’ clean grass strip
60% fecal coliform reduction Castelle et al ‘92
Literature review – temperature - 50’ tree buffer (width need decreases
with increasing tree height) - 98’ in logging area - 73’ in logging area
- provides 85% of maximum shade for small streams - keep temp within 1 degree Celsius of former ambient
temperature - “ample” to maintain pre- logging temps
Castelle et al ‘92
Literature review for TSS - TSS reductions of 53-98% on widths of 15-200’ - agricultural reductions from feedlots and fertilized
croplands for 15’ (66-81% reduction) and 30’ (82-91%) buffers; on other ag studies found 70’ strip at 78% reduction, 90’ at 93% both with slopes ~4%, and single event 30’ at 99%; for 164’ buffer study 94% reduction but 90% trapped in the first 62’ at 5% slope; long-term study data shows that buffers of 98-328’ needed > saw 84-90% reduction but 50% of sediment traveled more than 328’ into the study buffer
- several logging studies showed need at least 98’ of buffer to protect stream; basis for 25’ + 2’/1% slope formula
- for sediment recommend a min. of 30’ and suggest 100’
Wenger ‘99

28
Specific Condition Water Quality/Quantity Improvement Reference
Literature review for nutrients - Scandanavian studies showed > 66% reduction in P from 26’, 95% from 52.5’, 67% from 66’, 81% from 92’
- Studies above for sediment also looked at P and found from 15’ buffer 18-72% reduction, and from 30’ 46-79%
- 164’ buffer removed 84%TP and 73% DP, another for 69’ buffer 67% TP and 69% DP
- 83% TP average removal from cropped buffers of 89’ and 69’
- 66-98’ buffers can remove nearly 100% of nitrate (in one study but others not so sure)
- Table 3 > 15’ from 0-67% and 30’ from 48-74% TN but nitrate removals not good (not reported); 70’ reduced TKN by 67% and NH4
+ by 71% but increased nitrate (not reported); author felt 118’ needed to “adequately” protect water quality
- Sweden 20% nitrate reduction for 26’ buffer and 50% for 52’ > concluded need 10-20 m (33-66’) to retain “major part” of P and N
- Coastal Plain study saw 99% nitrate red for 52.5’ and No. Car. study for 20’ grass and 43-59’ of grass-forested buffers had 50% TN and nitrate reduction
- Another Coastal Plain study of 164’ buffer saw 79% nitrate reduction in surface flow, 78% in NH4 and 86% in particulate organic N, and 90-99% decrease in shallow groundwater BUT saw increase in NH4
+ and organic N in groundwater under buffered area
- General conclusion that nitrate substantially removed in groundwater through buffer areas (80+%) for widths of 66-102’; some have found greatest removal in first 33’, with some getting 100% removal in first 66’
Wenger ‘99

29
Specific Condition Water Quality/Quantity Improvement Reference
(continued) - 78-99% reduction of nitrate in shallow groundwater under buffers 16-60m (53-198’)
- British study > 66’ poplar buffer reduced subsurface nitrate 99%, and a 52.5’ grass did 84-100% depending upon initial concentration
- reference uptake independent of temperature and occurs even in cold weather; helped by high groundwater table (anaerobic condition) > rate of removal function of time spent in or under buffer, need to promote infiltration to get best nitrate removals in soil
Literature review for pesticides - Southeast U.S. study concludes “Generally speaking, buffer strips of 49’ or larger are effective in minimizing pesticide contamination of stream flow.” ; should apply similarly for effect on wetlands
Wenger, 1999
“Filter strip” type of buffer - at 20’ grass strip, TSS 20-40% TP >20% TN >20% Trace metals 20-40% BOD/COD 20%
- at 100’ forested strip, TSS 60-80% TP 40-60% TN 40-60% Trace metals associated with particulates >80% BOD/COD 60-80%
ASCE, 2001 (based on Schueler ’87 work)
Wetland use for nitrate removal - 1 acre of wetland buffer per 20-40 can remove substantial amount of nitrate and P
Illinois Groundwater Consortium Winter ‘95/96
Urban study of vegetated filter strip from large parking lot
- 75’ > 54% TSS, (-)27% NO3-, (-)25% TP, (-)16%
Extractable Pb, 47% Extractable Zn - 150’ > 84% TSS, 20% NO3
- , 40% TP, 50% Pb, 55% Zn
Yu et al, 1992 (ref in Stormwatercenter.com)

30
Specific Condition Water Quality/Quantity Improvement Reference
Literature review with silviculture focus - 61m (200’) grassey swale removed 80% TSS in Northwest U.S.
- 30m (100’) ditto removed 75-80% between logging activ and wetland
- for 0-18m (60’) widths on 7-12% slopes no diff in vegetation filter strips beyond 9.1m (30’) where 85% TSS removal, ditto on slope angle increases after 3.1m (10’)
- Width not reported but on 4% slope reduced N and P by 84% and 83%, and another study by 89% and 80% in riparian forest and major pathway for N was subsurface
- another study 99% removal in 10m (33’) mixed herbaceous and forested buffer
- 80% of “excess” P and 89% of “excess” N removed in first 19m (63’) Maryland buffer (no details)
- 30m (100’) buffer reduced sol nut levels “far below drinking water standards”
Castelle and Johnson 2000
Literature review of nutrients - TP in surface flow range of 16.5’- 165’ > 50-85% - TP subsurface 63 and 165’ > 33 and –114% - nitrate surface range 16.5-165’ > 54-98% - nitrate subsurface range 33-165’ > 10-100%
Osborne and Kovacic ‘93
From upland to stream: Upland agricultural field, then woodland, hill, wetlands, stream
Groundwater nitrate decreased – - 45% less in forested hill than upland ag field - 16-70% less at wetland edge than upland field - no trends in DP or NH4
+
Snyder et al. 1998
Paired watershed study, corn fields, buffer of restored woody/grass (35m wide)
- overland flow: restoration of buffer sig decreased TKN (70%), nitrate (83%), NH4
+ (25%), TP (73%), and TSS (92%) - groundwater: nitrate decreased by 70% in restored area, TP increased by 122%, TKN and NH4
+ no change
Clausen et al. 2000
Forested vs. mowed buffer, poorly drained soils
-no significant diff between forested and mowed, however substantial groundwater nitrate removal in both
Addy et al. 1999

31
Specific Condition Water Quality/Quantity Improvement Reference
Buffer is wet meadow then alder stand; 2 sites: A – unpolluted watershed, 31m wide; and B – downhill of a pig slurry application field, 51m wide
A – 67% N, 81% P removal B – 96% N, 97% P removal (not clear if it’s particulate or dissolved P, or species of N)
Mander et al. 1999
Grassland (25m wide) vs. alder thicket (45 – 55m wide)
Groundwater nitrate reductions: in forest transect average concentration dropped from 6.26 to 0.15 mg N/l (98%); in grassland dropped from 12.2 to 1.92 mg N/l (84%)
Hefting and de Klein 1998
100m wide buffer strip, unimproved pasture and narrow section of scrub vegetation, clayey alluvium above a gravel layer
-10% nitrate removed, but denitrification potential high - nitrate lost rapidly from water moving through alluvium, but most of nitrate bypasses the buffer due to low permeability of alluvium
Burt et al. 1999
Comparison between wooded (poplar) riparian zone and a grass vegetated zone in winter months; both 16m wide, (although not clear, might be up to 26m wide)
- poplar site: 99% groundwater nitrate retention, linearly dependent on load rate - grass: 84% retained - assumed it’s all denitrification (little plant uptake in winter); lower in grass site possibly due to carbon limitation of denitrifying bacteria, more available carbon in poplar site from litter degradation -nitrate retention at maximum in first few meters of both riparian systems
Haycock and Pinay 1993
Illinois agricultural area, corn-soybean rotation field; 3 treatment schemes are row crops to stream bank, riparian forest (16m), reed canary grass (39m); examined groundwater
- higher DP and TP in forest than in crop or grass buffers; higher P in forest than in upland crop (temporary P sink?) - lower nitrate in all buffer strips than in upland crops; lower nitrate in forested than in grass strip in shallow groundwater
Osborne and Kovacic 1993
Rural Pennsylvania, second growth forest vs. grassy meadows.
Riparian forest: wider channels, more benthic habitat, more woody debris, greater organic material retention, cooler temps
Sweeney 1993

32
Specific Condition Water Quality/Quantity Improvement Reference
Grass slope vs. brush/grass hillside vs. beech forest.
- Brush/grass strips significantly higher % reduction DP and TP, maybe rela ted to stem density (TP average % reductions – grass pasture 22%, brush/grass 44%, beech forest 15%); no significant differences in nitrate or TN retention; unclear if surface or subsurface flows
Vought et al. 1994
** BOD = biochemical oxygen demand NO3
- = nitrate COD = chemical oxygen demand P = phosphorus DP = dissolved phosphorus Pb = lead HM = heavy metal T__ = total constituent M = meter = 3.28 feet TKN = total Kjeldahl nitrogen = organic N + ammonia N = nitrogen TSS = total suspended solids NH4
+ = ammonium Zn = zinc

33
APPENDIX C – SPECIES LISTS FOR WESTERN METRO AREA Birds, Amphibians and Retiles, and Mammals

34
Loons and Grebes Red-throated Loon Gavia stellata u mPacific Loon Gavia pacifica u mCommon Loon Gavia immer l nmPied-billed Grebe Podilymbus podiceps l nm ÅHorned Grebe Podiceps auritus p m ÅRed-necked Grebe Podiceps grisegena l nm ÅEared Grebe Podiceps nigricollis p m ÅWestern Grebe Aechmophrus occidentalis l nm ÅClark's Grebe Aechmophrus clarkii u m Å
Pelicans and American White Pelican Pelecanus erythrorhynchos p m ÅCormorants Double-crested Cormorant Phalacrocorax auritus l nm ÅBitterns, Herons, American Bittern Botaurus lentiginosus p nm Å Å Åand Egrets Least Bittern Ixobrychus exilis p nm Å Å Å
Great Blue Heron Ardea herodias c nm Å Å ÅGreat Egret Casmerodius albus c nm Å Å ÅSnowy Egret Egretta thula u m Å Å ÅLittle Blue Heron Egretta caerulea u nm Å Å ÅCattle Egret Bubulcus ibis u m Å Å ÅGreen Heron Butorides striatus c nm Å Å ÅBlack-crowned Night-Heron Nycticorax nycticorax l nm Å Å ÅYellow-crowned Night-Heron Nycticorax violaceus u nm Å Å Å
Vultures Turkey Vulture Cathartes aura c mSwans, Geese, Greater White-fronted Goose Anser albifrons p m Åand Ducks Snow Goose Chen caerulescens l m Å
Ross's Goose Chen rossii u m ÅCanada Goose Branta canadensis c nm ÅMute Swan Cygnus olor u m ÅTrumpeter Swan Cygnus buccinator u m ÅTundra Swan Cygnus columbianus u m ÅWood Duck Aix sponsa c nm Å ÅGadwall Anas strepera l nm ÅAmerican Wigeon Anas americana l m ÅAmerican Black Duck Anas rubripes u m ÅMallard Anas platyrhynchos c nm ÅBlue-winged Teal Anas discors c nm ÅCinnamon Teal Anas cyanoptera u m ÅNorthern Shoveler Anas clypeata l nm ÅNorthern Pintail Anas acuta l nm ÅGreen-winged Teal Anas crecca l nm ÅCanvasback Aythya valisineria l m ÅRedhead Aythya americana l nm ÅRing-necked Duck Aythya collaris l nm ÅGreater Scaup Aythya marila l m ÅLesser Scaup Aythya affinis l m ÅHarlequin Duck Histrionicus histrionicus u m ÅSurf Scoter Melanitta perspicillata u m ÅWhite-winged Scoter Melanitta fusca u m ÅBlack Scoter Melanitta nigra u m ÅOldsquaw Clangula hyemalis u m ÅBufflehead Bucephala albeola l m ÅCommon Goldeneye Bucephala clangula p m ÅHooded Merganser Lophodytes cucullatus l nm ÅCommon Merganser Mergus merganser l m ÅRed-breasted Merganser Mergus serrator u m ÅRuddy Duck Oxyura jamaicensis l nm Å
Bird List For Western Twin Cities Area
Family Common Name Scientific Name Occurrence Status Forested Wetlands
Non-forested Wetlands Riverine Wetlands

35
Ospreys, Eagles, Osprey Pandion haliaetus l nm Å Å ÅHarriers and Hawks Bald Eagle Haliaeetus leucocephalus c nm Å Å Å
Northern Harrier Circus cyaneus l nm Å Sharp-shinned Hawk Accipiter striatus l mCooper's Hawk Accipiter cooperi l nmNorthern Goshawk Accipiter gentilis u mRed-shouldered Hawk Buteo lineatus l nm ÅBroad-winged Hawk Buteo playtypterus l nmSwainson's Hawk Buteo swainsoni u mRed-tailed Hawk Buteo jamaicensis c nmFerruginous Hawk Buteo regalis u mRough-legged Hawk Buteo lagopus p mGolden Eagle Aquila chrysaetos u mAmerican Kestrel Falco sparverius l nmMerlin Falco columbarius u mGyrfalcon Falco rusticolus u mPeregrine Falcon Falco peregrinus p nmPrairie Falcon Falco mexicanus u m
Partriges, Pheasants, Gray Partridge Peridix perdix l rGrouse, Turkeys, Ring-necked Pheasant Phaisanus colchicus c rand Quails Ruffed Grouse Bonasa umbellus u r
Wild Turkey Meleagris gallopavo c rRailes, Coots Yellow Rail Coturnicops noveboracensis p m Å Åand Cranes Virginia Rail Rallus limicola l nm Å Å
Sora Porzana carolina l nm Å ÅCommon Moorhen Gallinula chloropus l nm Å ÅAmerican Coot Fulica americana l nm ÅSandhill Crane Grus canadensis p m Å
Plovers and Avocets Black-bellied Plover Pluvialis squatarola u m Å ÅLesser Golden-Plover Pluvialis dominica u m Å ÅSemipalmated Plover Charadrius semipalmatus u m Å ÅPiping Plover Charadrius melodus u m Å ÅKilldeer Charadrius vociferus c nmAmerican Avocet Recurvirostra americana u m Å Å
Sandpipers, Godwits, Greater Yellowlegs Tringa melanoleuca u m Å ÅSnipes, Woodcocks Lesser Yellowlegs Tringa flavipes c m Å Åand Phalaropes Solitary Sandpiper Tringa solitaria u m Å Å
Willet Catoptrophorus semipalmatus u m Å ÅSpotted Sandpiper Actitis macularia c nm Å ÅUpland Sandpiper Bartramia longicauda p nm Whimbrel Numenius phaeopus u m Å ÅHudsonian Godwit Limosa haemastica u m Å ÅMarbled Godwit Limosa fedoa u m Ruddy Turnstone Arenaria interpres u m Å ÅRed Knot Calidris canutus u m Å ÅSanderling Calidris alba u m Å ÅSemipalmated Sandpiper Calidris pusilla c m Å ÅLeast Sandpiper Calidris minutilla l m Å ÅWhite-rumped Sandpiper Calidris fuscicollis u m Å ÅBaird's Sandpiper Calidris bairdii u m Å ÅPectoral Sandpiper Calidris melanotos p m Å ÅDunlin Calidris alpina u m Å ÅStilt Sandpiper Calidris himantopus u m Å ÅBuff-breasted Sandpiper Tryngites subruficollis u m Å ÅShort-billed Dowitcher Limnodromus griseus u m Å ÅLong-billed Dowitcher Limnodromus scolopaceus u m Å ÅCommon Snipe Gallinago gallinago c nm Å Å ÅAmerican Woodcock Scolopax minor l nm Å ÅWilson's Phalarope Phalaropus tricolor l m Å ÅRed-necked Phalarope Phalaropus lobatus u m Å Å
Family Common Name Scientific Name Occurrence Status Forested Wetlands
Non-forested Wetlands Riverine Wetlands

36
Gulls and Terns Parasitic Jaeger Stercorarius parasiticus u m Å ÅFranklin's Gull Larus pipixcan p m Å ÅLittle Gull Larus minutus p m Å ÅBonaparte's Gull Larus philadelphia p m Å ÅRing-billed Gull Larus delawarensis p nm Å ÅHerring Gull Larus argentatus u m Å ÅThayer's Gull Larus thayeri u m Å ÅIceland Gull Larus glaucoides u m Å ÅLesser Black-backed Gull Larus fuscus u m Å ÅGlaucous Gull Larus hyperboreus u m Å ÅGreat Black-backed Gull Larus marinus u m Å ÅCaspian Tern Sterna caspia p m Å ÅCommon Tern Sterna hirundo p m Å ÅForster's Tern Sterna forsteri l nm Å ÅBlack Tern Childonias niger l nm Å Å
Pigeons and Doves Rock Dove Columbia livia c rMourning Dove Zenaida macroura c m
Cuckoos Black-billed Cuckoo Coccyzus erythropthalmus l nmYellow-billed Cuckoo Coccyzus americanus l nm
Owls Eastern Screech-Owl Ottus asio l rGreat Horned Owl Bubo virginianus c rSnowy Owl Nyctea scandiaca p mBarred Owl Strix varia l rLong-eared Owl Asio otus p m
Goatsuckers Common Nighthawk Chordeiles minor l nmWhip-poor-will Caprimulgus vociferus l nm
Swifts and Chimney Swift Chaetura pelagica l nmHummingbirds Ruby-throated Hummingbird Archilochus colubris l nmKingfishers Belted Kingfisher Ceryle alcyon c nm Å Å ÅWoodpeckers Red-headed Woodpecker Melanerpes erythrocephalus p nm
Red-bellied Woodpecker Melanerpes carolinus l r ÅYellow-bellied Sapsucker Sphytrapicus varius l m ÅDowny Woodpecker Picoides pubescens c r ÅHairy Woodpecker Picoides villosus c r ÅThree-toed Woodpecker Picoides tridactylus u mNorthern Flicker Colaptes auratus c nmPileated Woodpecker Dryocopus pileatus c r Å
Flycatchers Olive-sided Flycatcher Contopus borealis u mEastern Wood-Pewee Contopus virens c nmAcadian Flycatcher Empidonax virescens u nm ÅAlder Flycatcher Empidonax alnorum u mWillow Flycatcher Empidonax trailii l nmLeast Flycatcher Empidonax minimus c nmEastern Phoebe Sayornis nigricans I nmGreat Crested Flycatcher Myiarchus critinus c nmWestern Kingbird Tyrannus verticalis u nmEastern Kingbird Tyrannus tyrannus c nm
Jays, Magpies, Blue Jay Cyanatta cristata c rand Crows Black-billed Magpie Pica pica u m
American Crow Corvus brachyrhynchos c rCommon Raven Corvus corax p m
Larks and Swallows Horned Lark Eremophila alpestris l nmPurple Martin Progne subis l nmTree Swallow Tachycineta bicolor c nm ÅN. Rough-winged Swallow Stelgidopteryx serripennis l nm ÅBank Swallow Riparia riparia c nm ÅCliff Swallow Hirundo pyrrhonota c nm ÅBarn Swallow Hirundo rustica c nm
Chickadees and Titmice Black-capped Chickadee Parus artricapillus c rTufted Titmouse Parus bicolor u m
Status Forested Wetlands
Non-forested Wetlands Riverine Wetlands Family Common Name Scientific Name Occurrence

37
Nuthatches and Red-breasted Nuthatch Sitta canadensis p rCreepers White-breasted Nuthatch Sitta carolinensis c r
Brown Creeper Certhia americana p nmHouse Wren Troglodytes aedon c nmWinter Wren Troglodytes troglodytes u m ÅSedge Wren Cistothorus platensis l nm ÅMarsh Wren Cistothorus palustris l nm Å
Kinglets, Gnatcatchers, Golden-crowned Kinglet Regulus satrapa u mand Thrushes Ruby-crowned Kinglet Regulus calendula u m
Blue-gray Gnatcatcher Polioptila caerulea p m ÅEastern Bluebird Sialia sialis l nm Mountain Bluebird Sialia currucoides u mTownsend's Solitaire Myadestes townsendi u mVeery Catharus fuscescens p mnGray-cheeked Thrush Catharus minimus u mSwainson's Thrush Catharus ustulatus u mHermit Thrush Catharus guttatus u mWood Thrush Hylocichla mustelina p mnAmerican Robin Turdus migratorius c mVaried Thrush Ixoreus naevius u m
Catbirds, Mockingbirds, Gray Catbird Dumetella carolinensis c nmand Thrashers Northern Mockingbird Mimus polyglottos u m
Brown Thrasher Toxostoma rufum l nmStarlings and Vireos European Starling Sturnus vulgaris c rPipets, Waxwings, Water Pipit Anthus spinoletta u m Å and Shrikes Bohemian Waxwing Bombycilla garrulus u m
Loggerhead Shrike Lanius ludovicianus p nmNorthern Shrike Lanius excubitor p mBell's Vireo Vireo bellii u mnYellow-throated Vireo Vireo flavifrons l nmWarbling Vireo Vireo gilvus l nmPhiladelphia Vireo Vireo philadelphicus u mRed-eyed Vireo Vireo olivaceus c nmCedar Waxwing Bombycilla cedrorum c m
Family Common Name Scientific Name Occurrence Status Forested Wetlands
Non-forested Wetlands Riverine Wetlands

38
Warblers and Tanagers Blue-winged Warbler Vemivora pinus p mnGolden-winged Warbler Vermivora chrysoptera u mTennessee Warbler Vermivora peregrina l mOrange-crowned Warbler Vermivora celata p mNashville Warbler Vermivora ruficapilla p mNorthern Parula Parula americana u mYellow Warbler Dendroica petechia c nmChestnut-sided Warbler Dendroica pensylvanica p mMagnolia Warbler Dendroica magnolia p mCape May Warbler Dendroica tigrina u mBlack-throated Blue Warbler Dendroica caerulescens u mYellow-rumped Warbler Dendroica coronata l mBlack-throated Green Warbler Dendroica virens u mBlackburnian Warbler Dendroica fusca p mPine Warbler Dendroica pinus u mPalm Warbler Dendroica palmarum l mBay-breasted Warbler Dendroica castanea u mBlackpoll Warbler Dendroica striata p mCerulean Warbler Dendroica cerulea p mBlack-and-white Warbler Mniotilta varia l mAmerican Redstart Setophaga ruticilla c mnProthonotary Warbler Protonotaria citrea u mnWorm-eating Warbler Helmitheros vermivorus u mOvenbird Seiurus aurocapillus l mnNorthern Waterthrush Seiurus noveboracensis u m ÅLouisiana Waterthrush Seiurus motacilla u mn Å ÅKentucky Warbler Oporornis formosus u mConnecticut Warbler Oporonis agilis u mMourning Warbler Oporonis philadelphia u mCommon Yellowthroat Geothylpis trichas l nmHooded Warbler Wilsonia citrina u mWilson's Warbler Wilsonia pusilla p mCanada Warbler Wilsonia canadensis p mYellow-breasted Chat Icteria virens u mSummer Tanager Piranga rubra u mScarlet Tanager Pirango olivacea l nmWestern Tanager Piranga ludoviciana u m
Towhees and Sparrows Rufous-sided Towhee Pipilo erythrophtalmus u mGreen-tailed Towhee Pipilo chlorurus u mAmerican Tree Sparrow Spizella arborea l mChipping Sparrow Spizella passerina c nmClay-colored Sparrow Spizella pallida l nmField Sparrow Spizella pusilla l nmVesper Sparrow Pooecetes gramineus l nmLark Sparrow Chondestes grammacus u mnSavannah Sparrow Passerculus sandwichensis l nmGrasshopper Sparrow Ammondramus savannarum l nmHenslow's Sparrow Ammondramus henslowii u mLe Conte's Sparrow Ammodramus leconteii u m ÅSharp-tailed Sparrow Ammodramus caudacutus u m ÅFox Sparrow Passerella iliaca p mSong Sparrow Melospiza melodia c nmLincoln's Sparrow Melospiza lincolnii u mSwamp Sparrow Melospiza georgiana l mn ÅWhite-throated Sparrow Zonotrichia albicollis l mHarris's Sparrow Zonotrichia querula p mWhite-crowned Sparrow Zonotrichia albicollis p mDark-eyed Junco Junco hyemalis l m
Status Forested Wetlands
Non-forested Wetlands Riverine Wetlands Family Common Name Scientific Name Occurrence

39
Grosbeaks and Snow Bunting Plectrophenax nivalis p mBuntings Northern Cardinal Cardinalis cardinalis c r
Rose-breasted Grosbeak Pheucticus ludovicianus c nmBlue Grosbeak Guiraca caerulea u mIndigo Bunting Passerina cyanea l nmDickcissel Spiza americana p nm
Longspurs and Bobolink Dolichonyx oryzivorus l nmBlackbirds Lapland Longspur Calcarius lapponicus u m
Smith's Longspur Calcarius pictus u mChestnut-collared Longspur Calcaris ornatus u mRed-winged Blackbird Agelaius phoeniceus c nm ÅEastern Meadowlark Sturnella magna p nmWestern Meadowlark Sturnella neglecta l nmYellow-headed Blackbird Xanthocephalus xanthocephalus l nm ÅRusty Blackbird Euphagus carolinus u mBrewer's Blackbird Euphagus cyanocephalus l nmCommon Grackle Quiscalus quiscula l nmBrown-headed Cowbird Molothrus ater l nmOrchard Oriole Icterus spurius p nmNorthern Oriole Icterus galbula l nm
Finches Pine Grosbeak Pinicola enucleator u mEvening Grossbeak Carpodacus vespertinus u mPurple Finch Carpodacus purpureus p mPine Siskin Carduelis pinus u mnHouse Finch Carpodacus mexicanus l rAmerican Goldfinch Carduelis tristis c mnHouse Sparrow Passer domesticus c r
Occurrence Statusu=Unlikely m= Migrantp= Possible nm= Nesting migrantl= Likely r= residentc= Confirmed
Family Common Name Scientific Name Occurrence Status Forested Wetlands
Non-forested Wetlands Riverine Wetlands

40
Marsupials Opossum Didelphis virginiana lInsectivores Masked Shrew Sorex cinereus l
Short-tailed Shrew Blarina brevicauda lMoles Eastern Mole Scalopus aquaticus lBats Little Brown Bat Myotis lucifugus l
Keen's Myotis Myotis keenii pSilver-haired Bat Lasionycteris noctivagans pEastern Pipistrelle Pipistrellus subflavus pBig Brown Bat Eptesicus fuscus lRed Bat Lasiurus borealis lHoary Bat Lasiurus cinereus l
Lagomorphs Eastern Cottontail Sylvilagus floridanus lWhite-Tailed Jackrabbit Lepus townsendii l
Rodents Woodchuck Marmota monax lEastern Chipmunk Tamias striatus cThirteen-lined Ground Squirrel Spermophilis tridecemlineatus lFranklin's Ground Squirrel Spermophilis franklinii lGray Squirrel Sciurus carolinensis cFox Squirrel Sciurus niger lRed Squirrel Tamiasciurus hudsonicus lSouthern Flying Squirrel Glaucomy volans lNorthern Pocket Gopher Thomomys talpoides pPlains Pocket Gopher Geomys bursarius lBeaver Castor canadensis c Å Å ÅDeer Mouse Peromyscus maniculatus lWhite-footed Mouse Peromyscus leucopus lMeadow Vole Microtus pennsylvanicus cPrairie Vole Microtus ochrogaster pHouse Mouse Mus musculus lMuskrat Ondatra zibethica l Å Å ÅMeadow Jumping Mouse Zapus hudsonius l
Carnivores Red Fox Vulpes vulpes cGray Fox Urocyon cinereoargenteus lCoyote Canis latrans cRaccoon Procyon lotor cErmine Mustela erminea lLeast Weasel Mustela nivalis pLong-tailed Weasel Mustela frenata lMink Mustela vison l Å Å ÅBadger Taxidea taxus pStriped Skunk Mephitis mephitis l
Ungulates White-tailed Deer Odocoileus virginianus c
Occurrence Evidence Codeu=Unlikely s= Sightedp= Possible h=Heardl= Likely t= Tracksc= Confirmed r= Remnants
Mammal List For Western Twin Cities Area
Scientific Name OccurrenceFloodplain
Forest
Non-forested Floodplain
Forest Riverine
Deep Water Marsh / Shallow
LakeCommon Name
41
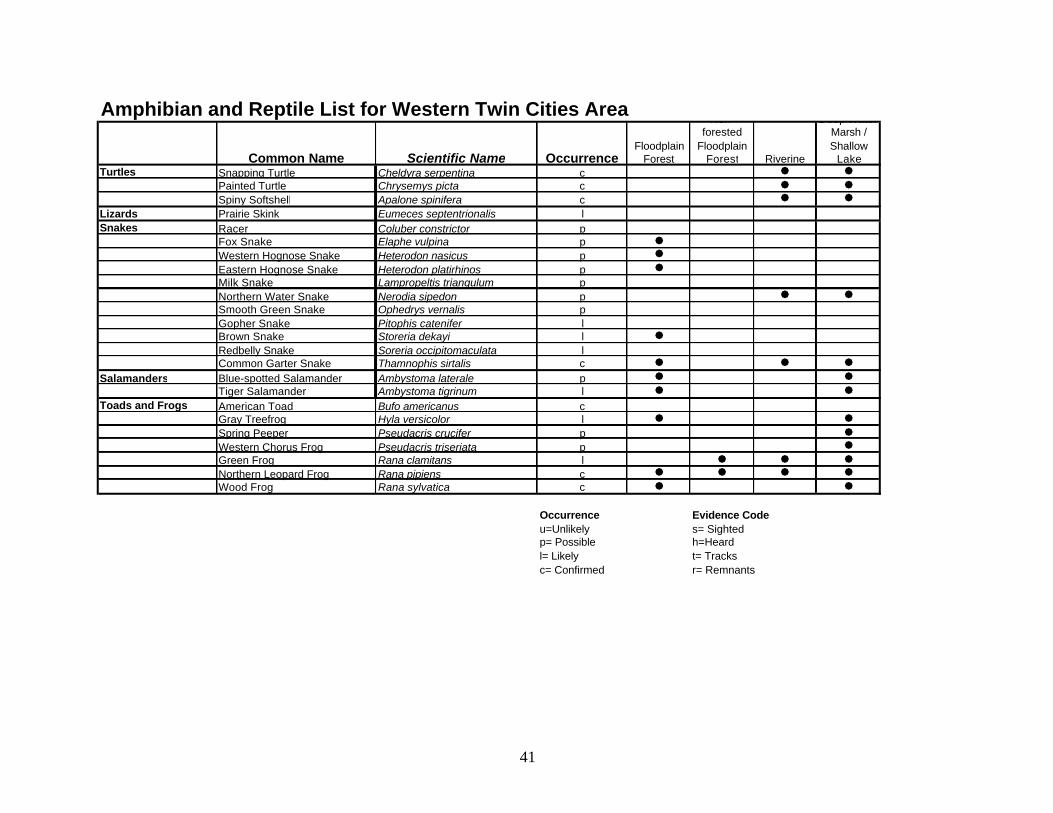
Turtles Snapping Turtle Cheldyra serpentina c Å ÅPainted Turtle Chrysemys picta c Å ÅSpiny Softshell Apalone spinifera c Å Å
Lizards Prairie Skink Eumeces septentrionalis lSnakes Racer Coluber constrictor p
Fox Snake Elaphe vulpina p ÅWestern Hognose Snake Heterodon nasicus p ÅEastern Hognose Snake Heterodon platirhinos p ÅMilk Snake Lampropeltis triangulum pNorthern Water Snake Nerodia sipedon p Å ÅSmooth Green Snake Ophedrys vernalis p Gopher Snake Pitophis catenifer lBrown Snake Storeria dekayi l ÅRedbelly Snake Soreria occipitomaculata lCommon Garter Snake Thamnophis sirtalis c Å Å Å
Salamanders Blue-spotted Salamander Ambystoma laterale p Å ÅTiger Salamander Ambystoma tigrinum l Å Å
Toads and Frogs American Toad Bufo americanus c Gray Treefrog Hyla versicolor l Å ÅSpring Peeper Pseudacris crucifer p ÅWestern Chorus Frog Pseudacris triseriata p ÅGreen Frog Rana clamitans l Å Å ÅNorthern Leopard Frog Rana pipiens c Å Å Å ÅWood Frog Rana sylvatica c Å Å
Occurrence Evidence Codeu=Unlikely s= Sightedp= Possible h=Heardl= Likely t= Tracksc= Confirmed r= Remnants
Scientific Name OccurrenceFloodplain
Forest
Non-forested
Floodplain Forest Riverine
Deep Water Marsh / Shallow
LakeCommon Name
Amphibian and Reptile List for Western Twin Cities Area