Embed Size (px)
Citation preview

Bengaluru Road Safety &Injury Prevention Programme:
Injury snapshots and activityprofile - 2009
National Institute of Mental Health & Neuro SciencesDepartment of Epidemiology
WHO Collaborating Centre for Injury Prevention and Safety Promotion
Bengaluru – 560 029, India


i
Bengaluru Road Safetyand
Injury Prevention Programme:Injury snapshots andActivity report 2009
NATIONAL INSTITUTE OF MENTAL HEALTH &NEURO SCIENCES
Department of EpidemiologyWHO Collaborating Centre for Injury Prevention and Safety Promotion
Bengaluru – 560 029, India

ii BRSIPP 2009
Title: Bengaluru Road safety and Injury Prevention Programme: Injury snapshots and Activity profile 2010
Copyright: NIMHANS
ISBN no: 81 - 86427 - 00 - X
Year of publication: 2010
Key words:
Injury; surveillance; Data; Mortality; Morbidity; Disability: Road Traffic Injury; Suicide; Burns;Poisoning; Injury Prevention and Care: Capacity strengthening; policy and Programme
Suggested citation:
Gururaj G and Bengaluru Injury surveillance collaborators group. Bengaluru Road safety and InjuryPrevention Programme: Injury snapshots and Activity profile 2010. National Institute of MentalHealth and Neuro Sciences, Publication No 72, Bengaluru, 2010
(For details, contact any of the Nodal Officers or Programme Co-ordinator)
Address for Correspondence:
Dr. G. GururajProgramme CoordinatorProfessor & HeadDepartment of EpidemiologyWHO Collaborating Centre for Injury Prevention and Safety PromotionNIMHANS, Bengaluru - 29Email: [email protected]; [email protected]
For further details about the programme, contact any of the programme nodal officers or –
Dr. G. GururajProgramme CoordinatorProfessor & HeadDepartment of EpidemiologyWHO Collaborating Centre for Injury Prevention and Safety PromotionNIMHANS, Bengaluru - 29Email: [email protected]

iii
Nodal Officers
N. D. Birje (Bangalore city police-traffic), V. Ramaiah (Bangalore city police-Law and
Order), Nitin Hegde (BMTC), Dr. Alfred C Roy and Dr. Niranjan (Bangalore Baptist Hospital),
Dr. Amarnath (Bowring & Lady Curzon Hospital), Dr. Rizwan Ali Khan (D.G. Hospital),
Dr. Ajith Benidict Rayan (HOSMAT Hospital), Dr. Manjunath B (Jayanagar General Hospital),
Dr. Harsha J. N (KR Hospital), Dr. Devaraj (Kemepegowda Institute of Medical Sciences),
Dr. Mali Manjunath (M. S. Ramaiah Medical College and Hospitals), Dr. Ramireddy, and
Dr.Sudharshini (Mallige Medical Centre), Dr. Rajeev Mathew (Sagar Hospitals),
Dr. Prabhakar ( Sanjay Gandhi Institue of Trauma and Orthopaedics), Dr. Mabel Vasnaik
(St. John's Medical College & Hospital), Dr. Mallikarjun V. Abdulpur (St. Martha's Hospital),
Dr. Riyaz Basha (Victoria Hospital), Dr. Ramesh and Dr. Muralidhar (Employee State
Insurance Model Hospital (ESI), Rajajinagar), Dr. Muralikumar (Chinmaya Mission
Hospital), Dr. Nithya A. (Suguna Hospital), Dr. Sathish Kumar (Vydehi institute of medical
science), Dr. Srividya V (Rajarajeshwari Medical College and Hospital), Dr. Nina Laxmikanth
(Columbia Asia Hospital), Dr. Mohd. Irshad Ahmed (Ambedkar Medical College and
Hospital), Dr. Ashok J and Dr. Venkatesh (Siddhartha Academy of Higher Education),
Gp. Capt. M. Shukla (Command Hospital, Airforce), Dr. Anjan Reddy (MVJ Medical Hospital
and Research Hospital), Dr. Sateesh V. L and Dr. Girish N. Rao (National Institute of Mental
health and Neurosciences).
iv BRSIPP 2009
Partners in Programme
State Crime Records Bureau: Sri. Sanjay Sahay, IPS, Inspector General of Police
Bengaluru City Police
Sri. Shankar Bidari, IPS Commissioner of Police, Bengaluru City
Sri. Praveen Sood, IPS Additional Commissioner of Police (Traffic and Road Safety)
Sri M.N. Reddi, IPS Formerly Additional Commissioner of Police (Traffic and Security)
Sri. M.R. Pujar, IPS Additional Commissioner of Police (Law and Order)
Sri. Panduranga Rane, IPS Deputy Commissioner of Police (Traffic West)
Sri. B. A. Muthanna, IPS Deputy Commissioner of Police (Traffic East)
Sri. Shivakumar, IPS Deputy Commissioner of Police (West)
Sri. B. K. Singh, IPS Deputy Commissioner of Police (Admin)
Sri. M. Chandrashekar, IPS Deputy Commissioner of Police (EAST)
Sri. T.G.Krishna Bhatta, IPS Deputy Commissioner of Police (South)
Sri. B.N.S.Reddy, IPS Deputy Commissioner of Police (South East)
Sri. H.S.Revanna, IPS Deputy Commissioner of Police (North)
Sri. G.Ramesh, IPS Deputy Commissioner of Police (Central)
Sri. Basavaraju Malagathi, IPS Deputy Commissioner of Police (North East)
Sri. N. D. Birje, Nodal Officer and Assistant Commissioner of Police (Traffic & Planning)
Sri. S. A. Pasha, Assistant Commissioner of Police, Traffic Training Institute, Bangalore
Sri. V. Ramaiah, Nodal Officer (law and order) and Deputy Commissioner of Police, Public Relations Officer
Sri Raghuveer, Assistant Commissioner of Police (Control room),
Sri. Byrappa, Sri. Kulkarni, Sri. Vijaykumar: Traffic Training Institute
City Crime Record Bureau: Sri. Vijaya Kumar, Assistant Commissioner of Police, Smt. Girija, Inspector ofPolice, Mr. Venkatarao , Sub Inspector, Sri. Mohemmed Sajjad Khan, Police Sub Inspector, Smt. Lalitha,Mr. Pradeepkumar, Mr. Ravi, Mr. Prasanna
All the staff from Traffic and Law and Order stations of Bengaluru
Tumkur District
Dr. Harsha, IPS Superintendent of Police,
Sri. Nagarajaiah Assistant Sub Inspector, Sri. Narasimhaiah (Head Constable),Sri. Chandrashekar (Head Constable)
All the staff from Police Department in Tumkur
Bengaluru Metropolitan Transport Corporation
Sri. Syed Zameer Pasha, Managing DirectorSri. K. S. Vishwanath, Chief Traffic ManagerSri. Nitin Hegde, Nodal Officer and Divisional Traffic Officer (Accident)Sri Shankara Bharathi, Assistant Traffic SuperintendentSmt. Mahadevamma, Smt. Komala, Smt. Anitha, Smt. Vinutha
Karnataka State Road Transport Corporation
Sri. Gowrav Guptha, Managing Director,Sri. Dastagir Shariff, Chief Traffic Manager,Sri. M. A. Saleem, Security and Vigilance officer,

v
Bruhat Bengaluru Mahanagara Palike
Dr. K. H. Govindaraju, Joint Commissioner HealthDr. L. T. Gayathri, Chief Health OfficerDr. Shivakumar, Dr. Manoranjan Hegde, Range Medical OfficersSri. B. Shankarappa, Jt. Director (Statistics)Mr. Narayanaswamy, Formerly Jt. Director (Statistics)Sri. Srinivasamurthy, Asst Statistical Officer, and staff
Bangalore Baptist Hospital
Dr. Alex Thomas, Medical SuperintendentDr. Santhosh Benjamin, Fmr Medical SuperintendentDr. Alfred C Roy and Dr. Niranjan, Nodal OfficersAll Casualty Medical Officers, Nursing Staff and others in Emergency Department
Bowring & Lady Curzon Hospital
Dr. H. Satishchandra, Medical SuperintendentDr. Rajanna, Resident Medical OfficerDr. Amarnath, Nodal OfficerCasualty Medical Officers - Dr. Venkata Rajamma, Dr. Prasanna Kumar, Dr. Sreedhar, Dr. Bhanumurthy, Dr.Sudha, Dr. Vasanthakumar, Dr. Suresh, Dr. Harish, Dr. Banu, Dr. Shatrunjayan, Dr. Sridhar, Dr. Shankar K.N,Dr. Lokesh G. Dr. Aravind, Dr. Dhananjaya, Dr. Hina Kaleel, Dr. Shivashankar N.A. Dr. Keshavamurthy, Dr.Sashan kumar, Dr. Nasrulla Babajan, Dr. Roopagovindagowder, Dr. Anilkumar K.C. Dr. Mohd Mujthaba,Dr. H.M. Srikanth, Dr. Radha K.R., Dr. Prasannakumar, Dr. Keshavamurthy.Staff Nurses - Smt. Gangarathna, Mrs. T. Selvi, Smt. Gowramma, Smt. BenithaMedical records section - Mr. Raju, Mr. Nagaraja, Mr. Siraj and Mr. Nagaraj
D.G. Hospital
Dr. Ramesh H. D, ChairmanDr. Rizwan Ali Khan, Nodal OfficerCasualty Medical Officers - Dr. Ashok Shroff and Dr. Vishvas
HOSMAT Hospital
Dr. Thomas Chandy, Medical DirectorDr. Ajith Benidict Rayan, Nodal officerCasualty Medical Officers - Dr. Bhavani Shankar, Dr. Chetan Ray, Dr. Swapnil, Dr. Karthik, Dr. SwaminathNursing Staff: Mrs. Valsala, Mrs. Bindu, Sri. Vidya, Sri. Laju, Sri. Majish, Sri. Antoinet, Smt. Anuradha,Sri. PintoMedical Records - Mr. Sugirth Raj
Jayanagar General Hospital
Dr. Nagaraj K, Medical SuperintendentDr. Kishore C. Kumtakar, Resident Medical OfficerDr. Manjunath B, Nodal Officer and Professor of OrthopaedicsCasualty Medical Officers - Dr. Srinivas, Dr. Kiran Kumar, Dr. Pushparaj, Dr. Pappu Vitalachar, Dr. Prameela,Dr. Sandya, Dr. Geetha, Dr.Revanna, Dr. Raghunandan, Dr. Thimmappa, Dr. Pushparaj, Dr. Rajkumar,Dr. Kirankumar, Dr. Ramadevi, Dr. Rudrappa, Dr. Thayamma, Dr. P. Pramila, Dr. Geetha, Dr. M. Manjunath,Dr. L. Revanna, Dr. Sathya, Dr. Sandhya, Dr. Pappuvittalachar, Dr. Vidya, Dr. Rajesh, Dr. BabuRao,Dr. Divakar, Dr. Saroja, Dr. C. G. ShridharNursing Staff - Smt. Sheela, Smt. Elicieda, Smt. Jayalakshmi, Mr. PerumalaOther staff - Mrs. Geetha and Mrs. Pattar
KR Hospital
Dr. Hariprasad, Medical SuperintendentDr. Harsha J. N, Nodal Officer and Casualty Medical Officer

vi BRSIPP 2009
Kempegowda Institute of Medical Sciences and Research Centre
Dr. (Capt) Venkatesh, DirectorDr. M. K. Sudarshan, Dean and PrincipalDr. Anjanappa T. H, Medical SuperintendentDr. Ramachandra A, Formerly Administrative Medical OfficerDr. Devaraj, Nodal OfficerCasualty Medical Officers - Dr. Ramesh, Dr. Shankar, Dr. Roopak, Dr. Prasanna KumarMedical Records - Mr. E. Selwyn Jebasingh and Mr. LingappaDepartment of Community medicine, Dr. Ashwath Narayana D. H.
M. S. Ramaiah Medical College and Hospitals
Dr. S. Kumar, Dean and PrincipalDr. Sundaresh, Medical Director, M S Ramaiah Medical Teaching HospitalDr. Naresh Shetty, Medical Director, M S Ramaiah Memorial HospitalDr.Narendranath, Joint Medical Director, M S Ramaiah Memorial HospitalDr. Mali Manjunath, Nodal officerDepartment of Community medicine-Dr. Pruthvish, Dr. Suryanarayana S. P.Dr. Aruna Ramesh, Chief of Emergency ServicesCasualty Medical Officer - Dr. Satish Varma, Dr. Gopalappa, Dr. Anand Kumar C.Medical Records - Mrs. Wilbert Mary, Mrs. Padma, Mrs. Margaret Rosy, Mrs. Shyamala
Mallige Medical Centre
Dr. Sriram, Medical Director,Dr. Ramireddy, and Dr. Sudharshini, Nodal Officers,
Mallya Hospital
Comm. Indru Wadwani PresidentDr. Preethi Adoni, Medical SuperintendentCasualty Medical Officer- Dr. Sunil Kumar
Manipal Hospital
Mr. Rajan Padukone, Chief Executive OfficerDr. Sudarshan Ballal, Medical DirectorDr. Nagendra Swamy, Chief Operating Officer
Sagar Hospital
Dr. Hemachandra Sagar, ChairmanDr. Rajeev Mathew, Nodal OfficerCasualty Medical Officer - Dr. Dayananda, Dr. MuraliMedical Records Officer, Mr. W. Wellesly Stephen Sis. Mangala, Mr. Kumar
Sanjay Gandhi Institute of Trauma Care and Orthopaedics
Dr. K. Chandra shekara Naik, DirectorDr. Prabhakar, Nodal OfficerDr. Shivalingaiah, Resident Medical OfficerMedical records Department - Mr. Agilasithan, Mr. Yashvanth, Smt. Meera and Mr. Dhananjaya
Sparsh Hospital
Dr. Sharan Patil, Medical DirectorDr. Yohannan John, Director of Medical Services

vii
St. John’s Medical College & Hospital
Fr.Lawrence D.Souza, DirectorDr. Georgr D'souza, Medical SuperintendentDr. Prem Pais, DeanDr. Mabel Vasnaik, Nodal OfficerEmergency Department: Dr. Babu Palatti, Dr. Varghese, Dr.Shakunthala, Dr AnithaDepartment of Community Medicine - Dr. Arvind K, Dr. Bobby Joseph, Dr. Shilpa R.Medical Records Department - Mrs. Irine Jacob, Sr. Reeta
St. Martha’s Hospital
Surg.Cmde. A J Moraes, Medical SuperintendentSr. Dr. Teresita Fmr Medical SuperintendentDr. Mallikarjun V. Abdulpur, Nodal OfficerDr. Shashikanth, Legal Medical OfficerCasualty Medical Officers - Dr. Farid, Dr. Gopalaiah, Dr. Lucy Nora, Dr. Pai A GMedical Records Oofficer, Mr. Anthony
St. Philomena's Hospital
Dr. Shankar Prasad, Medical Superintendent,Casualty Medical Officer - Dr. Ramesh, Dr. Toby, Dr. Deepanjali, Dr. Subbalakshmi, Dr. Farah, Dr. Anusha,Dr. Sameer, Dr. Jayanand,Medical Records Officer, Mr. GeorgeNursing Staff - Sr. Mary Stella, Mini, Shashikala, Bincy, Honey, Teena, Monisha, Princy, Tintu, Rintu, Sumithra,Kathrine, Marcel
Victoria Hospital
Dr. Subhash G. T, Dean and DirectorDr. Tilak B. G, Medical SuperintendentDr. Shankarappa, Formerly Medical SuperintendentDr. Kantaraj J, Resident Medical OfficerDr. Riyaz Basha, Nodal OfficerCasualty Medical Officers - Dr. Rajareddy, Dr. Sankanal, Dr. Siddeshwar, Dr.B.Vishwanath, Dr. Cheluvanarayana,Dr. A.Vishwanath, Dr. Vijayashree, Dr.Thyagaraj, Dr. Shivakumar, Dr. Varalakshmi, Dr. B. Ramesh, Dr. R.Ramesh,Dr.Sathyanarayana, Dr. Pushpa, Dr. Manjula, Dr. Satish S.R., Dr. Mohankumar, Dr.Madhusudana Das,Dr. Priyadarshini, Dr. Pradeep, Dr. Rashmi, Dr. Shivanna, Dr.Shivakumar, Dr. Shailaja, Dr. Santhosh,Dr. Jagadish
Dr. Vasantha Kamat, Professor and Head, Department of MedicineDr. Shivaswamy, Professor and Head, Department of SurgeryDr. Nanjundappa, Professor and Head, Department of Orthopaedics
Employee State Insurance Model Hospital (ESI), Rajajinagar
Dr. Khokar, Medical SuperintendentDr. Padma Khokar, Dr. Malagi, Additional Medical SuperintendentsR. Kesavan, RegistrarCasualty Medical Officers -Dr. Rajeev Shetty, Dr. P. Selvakumar, Dr. Ramesh, Dr.Dhananjay S., Dr. RaghavendraB., Dr. Ravishankar M., Dr. Roopa B.N.Dr. Pankaj M.Deshmane, Dr. Prashanth B., Dr. Raghvendra G.Nursing Staff - Sri. Robinson P.M., Smt. Muttamma T.
Employee State Insurance (ESI)
Dr. Rehimmunnisa, DirectorDr.Gangadhara Swamy, Deputy Director

viii BRSIPP 2009
Chinmaya Mission Hospital
Dr. M.R. Chandrashekar, DirectorDr. A.S. Ramachandraiah, Resident Medical OfficerDr. Muralikumar, Nodal OfficerCasualty Medical Officer - Dr.A. Sathya DeviMedical Records Officer, Smt.Devaki,Staff Nurses - Shashikala, Suja, Rekha,Sony, Berly, Bincy, Geethu
Suguna Hospital
Dr. Ravindra, DirectorDr. Ranganath, Medical SuperintendentDr. Nithya A, AdministratorCasualty Medical Officer- Dr. Krishnaswamy
Vydehi institute of medical science
Dr. D. V. Chalapathy, Medical SuperintendentDr. Sandhya Belawadi, Principal and DeanDr. Sathish Kumar, Nodal OfficerDr. Jagadish, Professor and Head of Forensic Sciences
Rajarajeshwari Medical College and Hospital
Dr. Ramachandra, DirectorDr.Govindaraju K. M, Medical SuperintendentDr. Srividya V, Nodal OfficerCasualty Medical Offcier- Dr. P. LakshminarayanDepartment of Community Medicine - Dr. Shashikala M., Dr. K. JayanthkumarPublic Relation Officer-Sri. Hariharan
Columbia Asia Hospital
Dr. Suresh VaradarajuluDr. Aravind KasaragodDr. Nina Laxmikanth, Nodal OfficerDr. Ceema Sam, Dr. NischalMedical Records Supervisor, Mr. Yadunandana H.L.
Ambedkar Medical College and Hospital
Dr. S.V. Divakar, Medical SuperintendentDr. Mohd. Irshad Ahmed, Nodal Officer
Command Hospital, Airforce, Bangalore
Commandant AVM A.K. BehlSenior Registrar, Air Cmdr. R.R. NandaChief Co-ordinating Officer, Air Cmdr. A.K. PatraNodal Officer - Gp. Capt. M. ShuklaCasualty Medical Officers - Sqn. Ldr. N. Subramanyam, Wg. Cdr. A Mukherjee
MVJ Medical College and Research Hospital, Bangalore
Dr. T. Rajeshwari, Dean and DirectorDr. Mohan Rao, Executive DirectorDr. Vevai, Medical SuperintendentDr. Anjan Reddy, Chief CMO

ix
RURAL CENTERES
Siddartha Academy of Higher Education (Deemed to be University)
Dr. Shivaprasad, Director & ChancellorDr. Krishnamurthy K. A, Vice-ChancellorDr. Sudarshan H. P, RegistrarDr. Sreenivasamurthy, PrincipalDr. Ramesh Rao, Medical SuperintendentDr. Ashok J and Dr. Venkatesh, Nodal Officers and Dept of Community medicineCasulaty Medical Officers - Dr. Thimmaraju, Dr. Sreenath, Dr.MuddukrishnaProfessor & Head Dept. of Community Medicine, Dr. Rajanna M. S.
District Hospital, Tumkur
Dr. Sreedhara Murthy, District Health and Family Welfare OfficerDr. Pratap Surya, District SurgeonDr. Rangaswamy, Resident Medical Officer
Co-ordinating Centre: National Institute of Mental Health and Neuro Sciences
Dr. S. K. Shankar, Director / Vice ChancellorDr. Nagaraja D, Formerly Director / Vice ChancellorDr. B. N. Gangadhar, Medical SuperintendentDr. Sateesh V. L, Nodal Officer and Resident Medical OfficerDr. G Gururaj, Programme Coordinator
Department of EpidemiologyDr. Girish N Rao, Dr. Kavita RMr. Manjunath D. P., Mr. Girish B. G., Mr. Chandrashekara R.Mr. Basavaraju K.S, Mr. Lokesh M., Mr. Chandrashekar, Mr. Venkataramanappa, Mr. Ravichandra,Mr. Damodhara, Mr. Sombamadiah, Mr. Chandramohana, Ms. Manjula
Department of Neuro SurgeryDr. Indira Devi, Dr. Chandramouli, Dr. Sampath, and all units staff
Casualty Medical OfficersDr. Chandrashekharan, Dr. Muralidhara K., Dr. Neetha Nagaraj, Dr.Asgaribanu, Dr. Sridhara,Dr. Yashoda, Dr. Amit Acharya
Medical Records Department Mr. Pulla Reddy, Mr. Vivekappa, Mr. Nanjappachar, Mrs. Maria A.
And all other staff working in emergency rooms - medical record divisions of hospitals, Bengaluru MetropolitanTransport Corporation and in all police stations of Bengaluru city

x BRSIPP 2009
Table of Contents
Table of Contents xList of Abbreviations xiForeword xiiMessages xiii-xviiiAcknowledgements xixExecutive Summary xx
Section A: Understanding Injury & Programme descriptionA1. Introduction 2A 2. Understanding Injuries Is The Basis For Preventive Strategies 4A3. Injury In India 5A4 Injury In Karnataka 7A5. Underreporting Of Injuries 7A6. Information Requirements For Injury Prevention And Control 11A7. A Surveillance Approach 11
Bengaluru Road Safety And Injury Prevention Programme 12A8. Goals, Purpose And Objectives 12A9. Preparatory Phase (March – June 2007) 12A10. Focus Of Surveillance 13A11. Surveillance Mechanisms 13A12. Implementation Phase (June 2007 - June 2008) 17A13. Review Phase (June 2008 - December 2008) 18
Section B: Data and InformationThe City of Bengaluru 20B1. Injury deaths 21B2. Urban injuries 22B3. Rural Injuries 26B4. RTIs and suicides are major injury causes 27B5. Injuries affect young people 28B6. Injury deaths are distributed in phases 29B7. Road crashes, deaths and hospitalisations 29B8. Risk factor information 36B9. Solutions and strategies for road safety 42B10 Falls 43B11. Suicides 44B12. Burns and Fire Injuries 45B13. Poisoning 47B14. Animal Bites 47B15. Assault / Violence 49B16. Prehospital Care 50B17. Nature Of Injuries 54B18. Management And Outcome: 55
Section C: Profile of activitiesC1. Injury: Addressing the problem 57C2. Activity Profile of 2009 58Sustainability issues 64The way forward 65References 67Annexure - I 69Annexure - II 70

xi
List of Abbreviations
BRSIPP : Bengaluru Road Safety and Injury Prevetion Programme
CMO : Casualty Medical Officer
CC : Co-ordinating Centre
CCRB : City Crime Records Bureau
CDs : Communicable Diseases
ER : Emergency Room
FIR : First Information Report
HICs : High Income Countries
ICD : International Classification of Diseases
ICECI : International Classification of External Causes of Injuries
ICMR : Indian Council of Medical Research
IPC : Indian Penal Code
LMICs : Low and Middle Income Countries
MCCD : Medical Certification of Cause of Death
MLC : Medico-Legal Case
NCRB : National Crime Records Bureau
NIMHANS : National Institute of Mental Health & Neuro Sciences
NCDs : Non-Communicable Diseases
NGO : Non-Governmental Organization
OTC : Over The Counter
RMO : Resident Medical Officer
RTI : Road Traffic Injury
WHO : World Health Organization

xii BRSIPP 2009
Foreword
With increasing number of deaths and hospitalisations due to injuries inrecent years, the burden of injuries has been increasing significantly inBengaluru and other cities. The growth of Bengaluru in recent years and itstransformation as an international hub of activities has brought in hugechanges in our lives. Amidst these changes, safety on our roads, at homesand in work places has become an important issue for planners andpolicymakers. Hundreds of people are injured on our roads, at homes and in workplaces of Bengaluru everyday. There is a human face and a family behind every injury and death. The pain and agony of the sufferingfamilies goes beyond words.
Young people are becoming victims of road accidents at their formative and productive years of their life.With travel becoming an essential need for today's life, current efforts in addressing road safety are in earlystages. We need to build robust programmes based on scientific evidence to reduce this human suffering.Even though we have the knowledge and technology, our combined efforts are still far from satisfactory inaddressing this man made disaster.
I am happy to note that the Bengaluru Road safety and Injury Prevention Programme has progressedsatisfactorily in 2009. This has been possible due to the cooperation and support from all partners in theprogramme. Data for the year 2009 has once again confirmed that nearly 5,000 persons die and more than100,000 are hospitalized due to injuries every year in Bengaluru alone. From a phase of surveillance, it ismoving to the stage of programme development, and this year has seen a number of evidence and needbased activities. Road traffic injuries have seen a slight decline this year and we need to keep this momentumongoing and strong. We are aware that even with existing knowledge, there are several interventions,which, if properly implemented can save "lives and limbs".
Need for good-quality information does not require further emphasis. Robust and meaningful programmescan only be developed based on a good understanding of the current situation and identifying areas whereinterventions can be effective. Data plays a crucial role in monitoring and evaluation of activities as we goalong. A real change should be an actual decline in reduction of deaths and injuries. It is likely thatdecisions made in the absence of reliable data can only be adhoc and crisis oriented. All our programmesneeds to be sustained to make them effective in the long run.
The Bengaluru Road safety and Injury Prevention Programme has shown that it is possible to develop gooddata and lay a solid foundation for present and future activities. Political /administrative support andparticipation of institutions is crucial to develop these programmes further. I hope this collaborative programmewith involvement of hospitals, police, transport and legal sectors will make a dent in our rising injury graphand benefit the society. I wish the programme all success and strongly hope that this initiative will beconsidered in other parts of India as well.
Prof. S.K.ShankarDirector / Vice-chancellor, NIMHANS, Bengaluru.

xiii
Message
Bangalore city is known for its salubrious climate and pleasing environs. Several factors have resulted inmaking Bangalore the fastest growing metropolis in the country. This rapid pace of growth and developmenthas brought with it several challenges. Amidst the demographic and epidemiological transition, the newerchallenge is to understand the burden and impact of injuries. Studies reveal that an estimated 5,000 peopledie due to different types of injuries in Bangalore city: nearly one fifth of them due to Road traffic injuriesalone. It is indeed alarming that 20 times this number seek medical care.
The Bangalore Road Safety and Injury Prevention programme is a unique collaborative activity by NIMHANSwith Bangalore city police, 30 Hospitals, Transport department and NGO's. I am very happy to note thatactivities have been going on systematically for the last two years. On the occasion of 2nd stake holder'smeeting, I would like to compliment and congratulate all the partners in the initiative. On behalf of theGovernment of Karnataka, I would like to assure of the fullest and complete co-operation to undertakefocused and specific interventions in the city for preventing deaths and injures. I am sure the Bangaloremodel of injury surveillance would be replicable across not just our state of Karnataka but across the entirecountry.
(Dr. V.S. Acharya)
Dated: 22-02-2010

xiv BRSIPP 2009
MESSAGE
During the last two to three decades, India is going through a process of rapid motorisation. Bangalore citywith its 251akh two-wheeler population, contributing to nearly three-fourths of the total vehicular load, isthe highest compared to any other city in India. It is thus imperative that we need to make the roads safeparticularly to the Vulnerable Road Users. It is rather unfortunate that nearly 1000 people die due to roadtraffic injuries in Bangalore and majority are either pedestrians or two wheeler users. Thousands more areinjured and become disabled.
A key solution to this human made disaster is making the public transportation systems more robust andreliable. The transport department and the public sector transport corporations in Karnataka have launchednew initiatives in this regard. While we try to enhance and improve services there is a need to understandand evaluate the impact of these measures. I am extremely happy that Bangalore Road safety and Injuryprevention programme is bringing out the report for the year 2009. I am sure the suggestions andrecommendations of the data analysed from hospitals, police and BMTC will be very resourceful.
I would also like to take this occasion, when all the partners of the Bangalore Road Safety and Injurysurveillance programme are meeting, to convey my heartiest compliments for being involved in this veryimportant issue in the city of Bangalore. I am sure the daylong deliberations would be highly productiveand useful to plan and implement innovative solutions.
(R. Ashoka)
R. ASHOKA
Minister for TransportNo: Tm/O/Sms/136/2010
Telephone: Off:22253835 22033234
Room No. 317, 3rd FloorVidhana Soudha,
Bangalore
Dated: 26-02-2010

xv
MESSAGE
Over the last few decades there have been fundamental changes in diseasepatterns among the people of Member States of the WHO South-East AsiaRegion due to rapid urbanization and economic growth. The pattern ofmortality and morbidity with regards to communicable and noncommunicablediseases has changed. From being largely linked to infectious diseases earlier,it is now mainly related to noncommunicable diseases as well as injuries andviolence. Road traffic injuries have emerged as one of the leading causes ofdeath and disability in most countries of the Region.
World Health Organization estimates predict that road traffic injury will increase from being the ninthleading cause of death globally in 2004 to be the fifth leading cause of death by 2030.
Road traffic injuries are one of the fastest growing epidemics in the South-East Asia Region, and more than285 000 people are dying on the roads every year. The trend in road traffic deaths has also been on anupward spiral in recent years. Most of those killed on the roads in accidents are young and aged between 15and 44 years, thus corresponding to the most economically productive segment of the population. Hence,road traffic injuries lead to a colossal economic burden at both the family and community levels on MemberStates of the Region.
Almost three quarters of all road traffic deaths in South-East Asia occur among the most vulnerable roadusers, i.e., pedestrians, motorcyclists and cyclists. The rapid growth of motorized two-wheelers in theRegion is a major risk factor in road traffic injuries. These two critical issues should be prioritized duringpolicy decisions on road safety.
Although primary prevention is a far better option to address the huge toll from road traffic injuries thanother measures, only a few Member States in the Region have specific preventive measures on road trafficinjuries in place. Measures that will reduce injuries and contribute to a healthier future may include appropriateland use planning, setting safety standards for vehicles, designing infrastructure keeping the protection ofpedestrians and motorcyclists in mind, promoting safe public transport, and campaigning for the improvementof personal behaviour on roads. To realize this goal and implement these measures it is imperative todevelop and sustain strong intersectoral partnerships and collaboration.
To meet the challenge of the rapidly growing road traffic injuries, The WHO South East Asia RegionalOffice has supported trainings in injury surveillance, injury epidemiology, prevention and care, and roadsafety planning. This meeting is a very important effort to strengthen our workforce against RTI. Themeeting should focus on actions , based on data collected from different sources.
I look forward to the outcome of this meeting and assure you that WHO will continue assistance andcollaboration.
Dr Chamaiparn SantikarnRegional Advisor, Disability,
Injury Prevention and Rehabilitation, WHO/SEARO

xvi BRSIPP 2009
MESSAGE
Urbanisation, motorisation, industrialisation, infrastructure development arebecoming hallmarks of our growth and development in recent years. Indiancities are growing in a fast and unplanned manner and this is having a majorimpact on people' lives. Bengaluru city is no exception to this change andvisible changes are occurring all around us. Amidst these changes, safety ofpeople has become an important issue for planners and policymakers. In allour cities and in rural areas, road traffic accidents, stress related suicides and other injuries have become amajor public health problem and has been a matter of concern for all. Hundreds of people are killed andinjured on our roads, at homes and in workplaces of our cities on a daily basis. This human tragedy needsto be addressed by all stakeholders in growth and development, on a regular and continuous basis.
Unfortunately, in majority of the cases, young people in their formative and productive years of life are thevictims. The untimely death or hospitalisation of young people brings huge suffering to their families.Majority of these injuries can be prevented, if we aim at developing a proper understanding of injury profilesand patterns in our society, we need to address gaps in our information systems, develop mechanisms forprevention, trauma care and rehabilitation along with building robust policies and programmes for future.All concerned departments of police, transport, urban and rural development, health, law, information andbroadcasting, and others need to develop joint and coordinated mechanisms to address the problem.
I am happy to note that the Bengaluru Road safety and Injury Prevention Programme initiated in 2008 hasbeen working towards road safety and injury prevention on a scientific and systematic approach with allpartners in the city. Bruhat Bengaluru Mahanagara Palike is the central agency for all development andinfrastructure activities in the city and needs to include safety of people on roads, at homes, in schools andin work places.
The 2009 and 2010 programme reports, fact sheets, public health alerts, and strategy documents preparedfor the programme will help BBMP, Police, Transport, Urban Development and other city agencies to givedue importance for road safety and injury prevention initiatives. We are making efforts to give importancefor safety in all our activities.
The Bengaluru Road Safety and Injury Prevention Programme has shown that it is possible to develop gooddata and provide scientific basis for robust current and future interventions. I strongly hope that thiscollaborative programme with involvement of BBMP, police, transport, all major hospitals and other partnerswill be able to develop scientific and systematic road safety and injury prevention programmes to save ouryoung people. I take this opportunity to wish the programme all success and will be happy to extend allpossible support in its future activities.
Govinda Raju K H(IAS, Special Commissioner), BBMP, Bangalore.

xvii
MESSAGE
India and China have the largest number of deaths and injuries related to
road traffic accidents. More than 1,00,000 people die and 10,00,000 lget
injured on the roads every year in India. Unfortunately these incidents have
not attracted adequate amount of attention from policy makers and
enforcement agencies. Every time a person is dead or injured it leaves behind
pain and sufferings for the entire family. Unabated vehicular growth,
infrastructure enhancement and changing life styles have aggravated matters for the worse. Majority of
these deaths and injuries are preventable, if, road safety is given due importance in all our policies and
programmes. Also, the policies and programmes have to be based on scientifically collected data, evidence
and research.
Bangalore Road Safety and injury prevention programme initiated in 2008 an example of fruitful cooperation
between traffic police and medical fraternity.
This programme has two important elements; firstly, it uses information and data to plan and develop
activities. Secondly, it works with all stakeholders to develop and support interventions of all partners.
Bengaluru City Traffic Police are a major partner in this programme, by facilitating information development
and using information in all our activities. Year 2009 and 2010 programme reports, fact sheets, public
health alerts and strategy documents will help Police, Transport, Urban Development and other city agencies
to give importance for road safety and injury prevention. Fatalities on roads in Bangalore City have seen a
significant decline in past two years and we need to continue with this to reduce them further. A welcome
development would be a similar decline in number of injuries, primarily due to our interventions.
The Bangalore Road Safety and injury Prevention Programme has shown that it is possible to develop good
data and lay a good foundation for present and future activities. Despite limitations in resources and
manpower, we are giving major importance for road safety in both B-Trac 2010 and all other activities.
I hope this collaborative programme with involvement of traffic police and all major hospitals and other
stake holders will be able to develop scientific and systematic road safety and injury prevention programmes
to save young lives in the years to come. I also wish that similar programmes come up in other parts of
India. I wish the programme all success and will be happy to extend all possible support for the programme.
Mr. Praveen Sood, IPS,Addl. Commissioner of Police,
Traffic Bangalore City

xviii BRSIPP 2009
MESSAGE
At the outset, I extend my warm greetings and it gives me great pleasure to share my views in the Road
safety and Injury Surveillance Report being brought out by NIMHANS.
An efficient transport system is the first step in the direction of building a stable and secure State contributing
towards economic and cultural ties. Roads and Transport System not only binds people but also plays a
crucial role in nation building process.
Road safety is a process and transport department is a major partner in this process. The transport department
is building driving tracks in all its regional transport offices to ensure objectivity in testing driving licence
aspirants.
The Transport Department aims to establish the following:
Institute of Drivers Training & Research (IDTR) to impart scientific training especially to drivers
transporting hazardous goods to ensure Road Safety.
Automated vehicle testing centre for issue of fitness certificate to vehicles.
Electronic driving track for stringent testing before issue of driving licences.
Networking of emission testing centres to monitor air and noise pollution for cleaner and greener
environment.
These developments would yield the desired results if civil infrastructure, like wide Roads, multi-lane roads
with dividers, safe pedestrian crosses & improvement in public transport are also brought about by other
departments. We in the department, place road safety high on our agenda and wish to undertake all activities
for saving lives and prevent injuries.
We extend our whole hearted co-operation to the Bangalore Road safety and Injury Prevention Programme,
initiated by NIMHANS along with all other partners.
Bhaskar Rao, IPS,Commissioner for Transport & Road Safety,
Government of Karnataka

xix
Acknowledgements
The Bengaluru Road Safety and Injury Prevention Programme is a large collaborative and partnership
programme with the participation of Bengaluru city police, 30 leading hospitals, Bengaluru Metropolitan
Transport Corporation, Bruhat Bengaluru Mahanagara Palike and NGO's. Nearly 500 people from all these
organisations have taken keen interest and participated in several activities during 2008 and 2009. Listing
all individual names will run into several pages, but we would like to place our immense gratitude to all for
building this partnership programme. Specially, thanks to all heads of institutions and nodal officers for
taking leadership role in their respective organisations.
Thanks to Prof. D. Nagaraja, Former Director / Vice Chancellor and Prof.S.K.Shankar, Director/Vice
Chancellor of NIMHANS for extending all support and encouragement along with taking keen interest in
the programme.
Sincere thanks to World Health Organisation, India country office and Indian Council of Medical Research
(Department of Health Research, Ministry of Health and family welfare, Government of India) for facilitating
Phase 1 of the programme. We are thankful to Dr. Bela Shah, Deputy Director General, Indian Council of
Medical research and Dr. J S. Thakur, Cluster focal person for NCDs in WHO, India office, for all help and
support in developing the programme. Our sincere thanks to Dr.Margie Peden, Coordinator, Department of
Violence and Injury Prevention, World Health organisation, Geneva, and, Dr. Ann Dellinger of the
Epidemiology Division of Centre for Disease Control and prevention, Atlanta, USA for all support and
encouragement.
We are immensely thankful to Sri. Sanjay Sahay, IGP, State Crime Records Bureau, Sri. Shankar Bidari,
Commissioner of Police; Sri Praveen Sood and Sri. M.R. Pujar - Additional Commissioners of Police,
Sri. Bhaskar Rao - Commissioner for Transport ; Sri Govinda Raju, Special Commissioner of BBMP; Sri.
Zameer pasha, Managing Director of BMTC for all help and support. We thank all their staff for taking
keen interest in all activities under the programme.
Special thanks to all our field coordinators (Sri. Manjunath and Sri. Lokesh) and all our field research
officers spending tireless hours in police stations and casualty departments of hospitals in facilitating data
collection. Sincere thanks to my colleagues Dr. Girish N Rao and Dr. G. Kavita Rajesh for all help from the
beginning of the programme. Thanks to Sri. Girish BG and Sri.Chandrashekar for efficient data management
and analysis.

xx BRSIPP 2009
Executive Summary
The city of Bengaluru has changed phenomenally during the last decade. The "peaceful and cosy Bengaluru"
of 90's has changed to a "Bruhat Bengaluru" in 2010, embracing a population of more than 8 million into
its day to day activities. As a senior citizen remarked "the city is a living testimony to what technological
and socioeconomic changes can make for a one time peaceful city". The city takes pride in many positive
developments of education, information technology, raising living standards, vibrancy and hope for millions.
At the same time, the dark side of this growth and development are also serious issues for city planners and
administrators.
With marginal and gradual decline of communicable and infectious diseases, injuries, hitherto, referred to
as accidents, have emerged as a major public health problem in the country. Injuries have only moved from
fifth or third pages of our newspapers to the front page. All television channels continuously beam episode
after episode of violence and injury throughout the day; most of the times, the "Breaking news" is nothing
but deaths and injuries among people. Even though there is regular public outrage on these issues, injuries
are only increasing day after day. Commonly, these are considered as accidents, events due to bad times, or
simply act of fate. High Income Countries (HICs) of the world had similar understanding of injuries and
were doing, what we are doing today in 1960’s and 70’s. Research, knowledge, evidence and data changed
this understanding and resulted in significant changes in the way problems were addressed. Today, it is well
acknowledged that injuries are predictable and preventable.
This knowledge and information came from years of research that resulted in a better understanding of
injury phenomenon in terms of burden, characteristics, causes, risk factors, determinants, impact and
outcome. Surveillance is one such activity that will help in recognizing the burden of injuries, identifying
broad risk factors and causes, prioritizing activities, monitoring and evaluating interventions, capacity
development, and stimulating further research. Even though India has considerable experience in
Communicable Disease (CD) surveillance, Injury and Road Traffic Injury surveillance are new and its
importance is only recently gaining recognition.
Bengaluru Road Safety and Injury Prevention Programme is a collaborative programme between National
Institute of Mental Health & Neuro Sciences, Bengaluru City Police, 30 leading health care institutions,
Bengaluru Metropolitan Transport Corporation, Bruhat Bengaluru Mahanagara Palike and was facilitated
by Indian Council of Medical Research and WHO, India office in 2008. The programme aims at reducing /
preventing injuries, improving trauma care and strengthening rehabilitation services using a surveillance
approach.
The programme started in 2008 began on a surveillance basis, and has become an ongoing and a continuous
activity. In 2008, the major focus was on developing systematic mechanisms for uniform and standardised

xxi
data collection from all partner institutions. This phase streamlined number of discrepancies and a systematic
approach was developed. Surveillance was developed with available resources and within existing systems
along with appropriate strengthening at different levels.
Information gathered during 2009 reveals that - nearly 4,500 individuals died and more than 100,000 were
hospitalised due to an injury in the city. Majority of those killed and injured were in younger age groups of
16 to 45 years and predominantly men. Road traffic injuries and suicides are two major injury problems in
the city of Bengaluru. Pedestrians, two wheeler riders and pillions, and pedal cyclists were involved in
greater numbers. Suicides were commonly due to consumption of organophosphorus compounds and drugs,
occurring at a time when the person was alone and at home. Burns, poisoning, falls were other major
injuries responsible for deaths and hospitalisations. Trauma care was found to be inadequate and poor
requiring immediate strengthening.
In 2009, the major emphasis was on application and utilisation of data to develop programmes, and to
provide inputs for policies and programmes. Systematic applications of data can always make a difference
to strengthen activities. Number of inputs has been provided for regulatory, engineering, educational and
other activities during 2009. Discussions with policymakers and professionals have indicated that the data
developed will be useful to develop new activities as well as monitor existing programmes.
It is hoped that 2010 will see a combination of data gathering and data application and also development
of focussed activities. Plans are already afoot in this direction. Using surveillance as the first level of
activity, additional research activities such as trauma registries, risk factors studies, and multidisciplinary
crash and injury investigations are being considered. Capacity development of all sectors related to road
safety and injury prevention along with other focussed interventions are planned for 2010 and the coming
years. Injury/RTI surveillance data will be a useful tool in the prioritisation process, resource allocation,
and monitoring ongoing activities. There are several opportunities to develop and use data to develop
scientific programmes for injury prevention and control. It is hoped that this experience and learning will
help professionals across the country to initiate activities for road safety and injury prevention on a scientific
basis using evidence based approaches. Recognition of the problem, administrative support, training of
personnel, monitoring and regular feedback, availability of resources and, most importantly, cooperation
of all partners will be the building blocks for our future activities.
Preventing road crashes, suicides and other injuries requires a "proactive approach" rather than a "reactive
approach". It requires action to be taken by police, transport, health, urban - rural development, land
development authorities, product and vehicle manufacturers, civic authorities, NGOs, public, media and
others to see that these injuries do not occur; even if it occurs, it should not lead to deaths and disabilities.
Information - data - and evidence is a powerful tool in this process to bring people together for collective
actions.

xxii BRSIPP 2009

1
Section AUnderstanding Injury & Programme description
Bengaluru Road Safety and Injury Prevention Programme is a collaborative
programme between 30 hospitals, Bengaluru City Police, Bengaluru
Metropolitan Transport Corporation, Bruhat Bengaluru Mahanagara Palike
and was facilitated by Indian Council of Medical Research and WHO, India
office in 2008. The programme is coordinated by the WHO Collaborating
Centre and the department of Epidemiology at NIMHANS. The programme
aims at reducing / preventing road traffic injuries, suicides and other
injuries, improving trauma care and strengthening rehabilitation services
using a surveillance approach.

2 BRSIPP 2009
The “Incredible India” is on the move and changingat a fast pace. In recent years, we have witnessed anincrease in motorization, industrialization,migration, urbanization and feeling the impact ofoverall globalisation. The influence of print andvisual media is also much larger today, comparedto the past. Consequently, our life styles along withhabits and value systems are changing fast.
This change has seen a decline of somecommunicable diseases, while Noncommunicablediseases and injuries are on the increase. In thischanging scenario, Injury and violence is a leadingcause of death and disability. This change is palpableacross the country and Bengaluru is no exception tothis change.
Everyday, we read, listen or witness, injuries in ourday to day lives. Over time, it has moved from 5th to3rd to 1st page of our newspapers. Some days, it isnot uncommon to see the entire page of ournewspapers filled with news about injury andviolence. On television channels, even on prime time,injury and violence has occupied the centre stage.Many times, the “Breaking News” is only deaths dueto road crashes, suicides, mass burns and bloodloaded violence. It has become common to see bloodand broken limbs on our roads, at homes or in workplaces. No single day passes in our lives withoutinjuries making a direct or indirect appearance.
Naturally so, because, Injuries are common and affectall people, more so the productive age groups andsections of our society. Road traffic injuries, falls,burns, poisoning, occupational / work relatedinjuries, suicides, violence / assault and animal bitesare all common injuries. Individuals in 5-44 yearsand men are affected most. Greater vulnerability isseen among people in middle and lower incomestrata of society and injuries make them poorerfurther due to its economic impact and lack of accessto quality care. The maximum brunt of injuries isfelt by the health sector as it has to provide care foraffected individuals and families. As India is yet torecognise injury and violence as a public healthproblem, there are no visible policies andprogrammes to effectively address this problem. Injuryprevention and control in India is publicly glaring,
A1. Introductionpolitically invisible and professionally missing.
It is only recently, injuries are acknowledged as amajor killer in our society, more through mediaand occasionally (now becoming frequent) inprofessional circles. Systematic and scientific effortsin injury prevention and control are yet to begin.Among several injuries, Road traffic Injuries (RTIs)and suicides have been recognised as major injuryproblems. As injuries are linked to number ofsociocultural issues and happen at individual andfamily level, they are treated as individual issues.As police and judiciary are involved, they areconsidered as police and legal problems. Sinceeveryone uses roads and vehicles, they have becomeroad and transport problems. With its relation toinfrastructure development and expansion, they areurban problems. Despite the health sector bearingthe maximum impact due to policies andprogrammes of other sectors, they are still notconsidered as public health problems.
While injuries have declined in many developed partsof the world, it has been steadily rising in India. Theneed to adopt and suitably modify lessons from HICsis crucial for injury prevention and control in India toavoid repetition of mistakes and to make appropriatedecisions by recognition of principles. The last fourdecades of research and policy developments acrossthe world have shown that injuries are predictable,preventable, and needs a systems approach. Due tonon-recognition of the problem and absence ofcoordinated, integrated and intersectoral approaches,injury prevention and control is at cross roads andwithout direction in India.
Recognition of the problem requires good quality,reliable and representative information; and this isvital to formulate injury prevention programmes. Injuryprevention and control should be evidence based anddata driven. However, in India, comprehensiveinformation is often lacking or, at best, patchy. Thoughpolice data on injuries are available to a limitedextent, health sector information has been totallymissing. Further, even the collected information isnot systematically and scientifically analysed todevelop a better understanding of injury pattern,profile and determinants. The available data are not

3
aptly utilized in policy and programme development.Nevertheless, the scenario has begun to change andtime is appropriate to give a major push and directionfor this area.
There have been several initiatives at different levelsin India to address the growing problem, and someof this is happening in the area of road safety.International and national developments have pavedthe way for this change. The World report on RoadTraffic Injury Prevention (1), World report onViolence & Health (2) and few national reports(3, 4, 5) have brought to light a number of activitiesto be undertaken for control of injuries. Road Trafficinjury surveillance initiatives in 2007 / 08 in selectcities of India on a pilot basis by the Indian Councilof Medical Research (6), activities in suicide andviolence prevention, an active judiciary and NGOnetwork, report of the National Commission onFarmers (http://krishakayog.gov.in/) and Preventionof Domestic Violence Act (http://ncw.nic.in/DomesticViolenceBill2005.pdf) are some examples.Although road safety has been acknowledged as animportant issue in many states and cities, other safetyissues like home safety, work safety, safety aspectsat public places etc. have not been given dueimportance and also need to be addressed.
With this in view, the present Bengaluru Road safetyand Injury Prevention programme was initiated in2008 to develop systematic activities in prevention,trauma care and rehabilitation programme for RTIsand other injuries based on data and evidence.
A 1.1 Injuries are biomechanical innature and not accidents
Historically, injuries have always been referred to asaccidents and the term “accident” implies theinevitable nature of the event and connotes thatnothing can be done about it. ‘Injury’ by definitionmeans that there is a body lesion due to an externalcause, either intentional or unintentional, resultingfrom a sudden exposure to energy (mechanical,electrical, thermal, chemical or radiant) generatedby agent - host and environmental interaction (9).When this generated energy is transferred and exceedsthe physiological tolerance of an individual it leadsto tissue damage. Apart from this, injury can alsooccur due to the sudden withdrawal of a vital
requirement of the body like oxygen in case ofdrowning, asphyxiation etc. In short, injury is thedamage caused to the body due to a rapid and suddenexposure to energy beyond his / her tolerance levels.It is an acute event, occurs in varying severities andwith chances of repeated occurrence. Prevention ofinjuries is possible by acting on one or all three areasof this interaction and thus can be modified,predicted, and prevented.
A 1.2 Injuries can be classifiedFirstly, injuries are classified as intentional,unintentional and undetermined injuries, based onintent of injury occurrence. Unintentional injuriesare also referred to as accidental injuries though notreally accidental in nature, while intentional injuriesare self-inflicted or caused by others. The latterinclude suicides, homicides, injuries due to violenceagainst women, children and elderly, those due towars, riots and conflicts, etc.,
A second common method of classifying injuries isaccording to the mechanism which caused the injury,like road traffic crashes, poisoning, falls, fires/burns,drowning, fall of external objects and others.
A third method of classifying injuries is according toplace of occurrence like road injuries, home injuries,sports injuries and work related injuries based onplace of occurrence of injury.
The fourth method is based on anatomical types andlocation of injuries depending on body organs injuredlike head injuries, facial injuries, injury to long bonesetc. The nature and type of injuries are documentedas fractures, contusions, haemorrhage for care andmanagement.
International Classification of Diseases (11) andInternational Classification of External Causes of Injuries(12) are commonly used for systematic and scientificclassification of injuries all over the world. A particularclassification chosen is primarily determined by thepurpose of a (or more) programme(s), research focusand availability of resources. Commonly, the first threemethods (viz., intent, mechanism, and place) arepreferred for prevention, as changes can be made inproducts and environment, and injury occurrence canbe prevented for future.

4 BRSIPP 2009
Historically, in 1970, William Haddon Jr., proposeda matrix for consideration of all factors involved ininjury causation at different time periods and atvarious levels (13). This involved identifying whatcan be done for people, products and the environmentbefore injury, during an injury and after its occurrence(Table 1). This concept has revolutionized injuryprevention since 1970s all over the world, and canbe used to analyze any type of injury, identifyinterventions that might prevent such an event fromhappening again or reducing the harm done.
Injuries occur due to a combination of agent, host,vector and environment factors. The epidemiologicaltriad of agent, host and environment has been usedin our understanding of communicable diseasesearlier, and injuries too have similar dimensions likeany other public health problem. There is a clearneed to understand injury mechanisms to developintervention programmes.
A2. Understanding injuries is the basis forpreventive strategies
HOSTRider
VECTORMotorcycle
AGENTCollision (mechanical
force or energy)
ENVIRONMENTSlippery roadway
Ref.: 14
Some of the professional concerns that have been raised about lay beliefs in the field of modern injurycontrol have not held up to scientific scrutiny. One example has to do with the word “accident”. For thelast few decades of the twentieth century, national and international safety advocates lamented the public’spersistent use of that term.The magnitude of the automotive injury problem in the pediatric population remains as great as it islargely because of the perpetuation of a societal ethic that automotive injuries are accidents. The wordaccident suggests that the injury event was determined by fate and, therefore, was unpredictable andunavoidable [Rosenberg, Rodriguez, & Chobra 1990, p.1086].The most important reason for this delay in the use of science to control injuries, and one which persiststo some degree even today, is the sense of fatalism towards trauma. Injuries are still called accidents….[Rivara, 2001, p.3].
The term accident has been banned by the U.S. National Highway Traffic Safety Administration(National Highway Traffic safety Administration, 1997), as well as the British Medical Journal (Davis
& Pless, 2001). At meetings of injury control professionals, audiences have been known to hiss, if aninvited speaker from another field inadvertently included the word in his or her remarks. In 1996, I
addressed this issue by fielding a national random-digit-dialled telephone survey that assessed adult ininterpretation of the word accident.Eighty-three percent of respondents associated preventability with
the term (Girasek, 1999). Scores of studies have now established that most adults believe a majority ofaccidents and injuries are preventable (Chiappone & Kroes, 1979; Colver, Hutchinson, & Judson, 1982;
Duan, 2004; Green, 1997; Hooper, Coggan, & Adams, 2003; Hu, Wesson, Parkin, & Rootman, 1996;Roberts, Smith, & Bryce, 1995).
Reproduced from 10.
Figure 1: Epidemiological model of an injurycaused by a motorcycle collision
Table 1 shows the case of an injury to a motorcyclerider involved in a motorcycle collision. Here, thehost is the rider, vector is a motorcycle, agent is themechanical force or energy and environment is theroad. Similarly, in an act of interpersonal domesticviolence in which a man causes injury to his wife,the host is the injured person, the agent is the energy(physical assault), the vector is also the personinflicting injury and, the environment include

5
domestic situation and societal norms and valuesthat allow for such behaviours to occur.
Using a model of this type helps in identifying factorsinvolved in an injury. This would help policymakers,professionals, product manufacturers and others toidentify situations and target interventions to preventsuch injuries from happening in the future or reducethe harm done when they happen. For instance, inthe first example, there may be factors about the rider,the motorcycle or the road that contributed to thecrash. One or more of these can be changed in orderto prevent such incidents in the future. Interventionsthat might be done by thinking about these elements.These can include implementing helmet & drink drivelaws, reducing speeds, increasing visibility of two-wheelers and/or riders, strengthening brake & lightsystems, improving pre hospital & emergency careand overall safety improvement of roads and others.
Table 1: Example of Haddon’s matrix asapplied to two wheeler road traffic injury
Human Vehicle Environment
Pre-event Increaseawarenessabout helmetwearing, drinkdriving, safedriving, etc.
Increasevisibility ofvehicle
Implementsafety featureson roads
Event Early transferto hospitaland requiredcare
Better brakingsystems of twowheelers
Crashprotectiveroad sidestationaryobjects
Post-event
Rehabilitateand improvehealth careservices
Improve safetytechnologiesand compo-nents
Facilities forearly rescueof injuredpersons
Use of injury spectrum is another useful method tounderstand injuries. This method (figure 2) maps aninjury over time, starting with its exposure, followedby the event, through the occurrence of injury timefinally resulting in disability or death. Understandingthis time spectrum can help in developinginterventions that can either prevent injury or lessenthe impact of injury.
Figure 2: The injury spectrum
Based on this understanding, injury prevention andcontrol is broadly classified as primary prevention,secondary prevention and tertiary prevention. Primaryprevention involves preventing the event fromoccurring or preventing it from leading to injuries.This involves taking all necessary steps to see thatinjuries do not happen and includes all activitiesthat are done to make people, products and theirenvironment safer. Secondary prevention involvesearly diagnosis and appropriate management of aninjury. Most of the times health professionals areinvolved in providing care and services for injuredpeople. This includes all activities right fromapplication of basic first aid at the place of injuryto stopping an injury from having seriousconsequences. Tertiary prevention aims at improvingthe final outcome and involves preventingfurther complications through rehabilitationprogrammes.
A3. Injury in IndiaThe National Crime Records Bureau (NCRB) atnational level (15), state crime records bureau atthe state level, district and city bureaus at districtand city levels, respectively, are designated officialagencies in India for collecting, compiling anddisseminating injury data in India. Since majority ofinjuries and injury deaths are considered as medicolegal events, they are commonly reported to police.
A 3.1 National reportsAs per NCRB 2008 nearly 485,008 injury deaths and2.4 million injuries were reported in India in 2008.
RTIs and suicides, being 2 major injuries, accountedfor 118,239 and 125,017 deaths, respectively.Southern Indian states reported higher number ofdeaths, reasons for which can be several varyingfrom increased occurrence to better reporting systemsand reasons are not clearly delineated.
A 3.2 Million Death studyThe million death study report based on the specialsurvey of deaths carried out under SampleRegistration System (SRS) provides comprehensivedetails of deaths in India (16). The causes, based on

6 BRSIPP 2009
State RateGoa 20.3Haryana 19.6Tamil Nadu 19.2Andhra Pradesh 17.2Karnataka 15.3Chandigarh 13.6Chhattisgarh 13.6Sikkim 13.2Rajasthan 12.9Delhi 12.2Himachal Pradesh 12.1Maharashtra 12.1Kerala 11.5Gujarat 11.3Uttaranchal 11.2
State RateMadhya Pradesh 10.8Arunachal Pradesh 10.4Mizoram 8.0Jammu & Kashmir 7.8Orissa 7.8Punjab 7.7Uttar Pradesh 6.3Tripura 6.3Meghalaya 5.8Assam 5.7West Bengal 5.4Nagaland 5.3Jharkhand 5.2Manipur 5.0Bihar 3.7
Figure 3: State wise distribution of RTIs in India, 2008(Rate / 100,000 population; National average 10.8/ population)
Figure 4: State wise distribution of Suicides in India, 2008National Average - 10.8/100,000 population
State Rate/100,000Sikkim 48.2Kerala 25Tamil Nadu 21.7Tripura 21.3Karnataka 21.2Chhattisgarh 20.8Goa 17.5Andhra Pradesh 17.4West Bengal 16.8Maharashtra 13.4Orissa 12.2Haryana 11.1Gujarat 10.9Madhya Pradesh 10.9Assam 9.9
State Rate/100,000Himachal Pradesh 9.6Arunachal Pradesh 9.1Rajasthan 7.9Chandigarh 7.7Delhi 7.6Mizoram 4.2Meghalaya 3.3Punjab 3.3Jharkhand 3Jammu & Kashmir 2.5Uttar Pradesh 2.1Uttaranchal 2Nagaland 1.9Manipur 1.3Bihar 1.1
Verbal autopsy techniques referred to as “RHIME” orRepresentative, Re-sampled, Routine HouseholdInterview of Mortality with Medical Evaluationmethod adapted a well defined and establishedmethodology. The assignment of cause of death wasdone through a process of medical evaluation bytwo independent trained physicians.
In total, NCDs were the leading causes of death inthe country for 42% of all deaths. Communicablediseases, maternal, perinatal and nutritionalconstituted 38% of the deaths. Injuries, of bothintentional and unintentional types, contributefor a total of 10 % of deaths. Several ill-definedcauses for which causes were difficult to determineaccount for 10% of deaths. Injuries are one amongthe top ten leading causes of death, with similar
number of deaths in both urban and rural areas,even though specific conditions vary.
An interesting finding from the study is the highdeaths due to injuries in the younger age group of15-24 years. Deaths in this age group are due toroad traffic injuries, intentional self-harm and otherun-intentional injuries. Every 3rd death in this agegroup is due to an injury. Motor vehicle crashes werehigh among men, while suicides were more amongwomen.
A 3.3 WHO estimatesAs per the Global Burden of Disease study report,there were 1,117,000 deaths due to injuries in Indiacontributing for an estimated 10.8% of deaths in2005 ( 17 ). It is estimated that RTIs and suicides

7
contributed for 202000 and 188000 deaths,respectively. Nearly 66.7% of deaths occurred inyounger age groups, predominantly among men.
A 3.4 Independent studiesA recent national review (17) has estimated that amillion injury deaths and 30 million hospitalizationsoccur every year. The review highlighted andestimated that in 2005, 8, 50,000 (nearly a million)persons lost their lives and 17,000,000 hospitalized(Figure 5). If unchecked, numbers are likely toincrease to 1,200,000 deaths and 24,000,000hospitalizations of serious injuries by 2015. Roadtraffic Injuries, suicides, burns, poisoning, violenceare all major causes of deaths and disabilities. Recentstudies (18,19,20) using verbal autopsy methods haveshown that injury deaths contribute for 13–18% oftotal deaths varying from place to place.
India: A National Perspective” (17). In Bengaluru,few studies have been undertaken by NIMHANS onepidemiological, preventive and public health aspectsof road traffic injuries, brain injuries, suicides andviolence (www.nimhans.kar.nic.in/epidem/WHO).In New Delhi, TRIPP at IIT has made significantcontributions in road safety and transportmanagement (http://web.iitd.ac.in/~tripp/). Fewmedical colleges and engineering and transportdepartments have also undertaken studies in theirrespective areas of interest. Individual researchershave also undertaken studies on Road traffic Injuries(20, 21), suicides (23) and violence (24). A fewnational studies and surveys have been carried outby Ministries (25). Studies and reports available fromindependent agencies like WHO, World Bank,IndiaClen, NGO’s and other agencies have addedsubstantial information. However, these have beenstand alone - one time studies and provided usefulinformation for policy making process and torecommend interventions. Regular, continuous andtimely information has not been available for anyIndian city or for the country. The Bangalore Roadsafety and Injury Prevention Programme is thefirst of its kind being undertaken in India . Detailsof the programme are available at http://www.nimhans.kar.nic.in/epidemiology/bisp/sr1.pdfand in the recently published report from IndianCouncil of Medical Research (6).
Deaths (1)
Serious Injuries (20)
Minor Injuries (50)
8,50,000 (upto 10,00,000)
17,000,000 (upto 20,00,000)
42,500,000 (upto 50,00,000)
Figure 5: India Injury Pyramid, 2005
Limited studies have been undertaken in recent yearsby individual researchers. A summary of Indianstudies is available in the report entitled “Injuries in
A4. Injury in KarnatakaAs per data from NCRB, a total of 12,222 suicides and 8,814 RTI deaths followed by 1,844 homicidal deathswere reported for the year 2008 in Karnataka. In the same year, 184,226 persons were injured as per policereports with a ratio of nearly 1:6.
A5. Underreporting of InjuriesInjuries are underreported in all parts of the world(26) due to several reasons. In India, while officialstatistics are able to capture large majority of deaths,non-fatal injuries of various severities are highlyunderreported. For each death from injury, there aremany more injures that result in hospitalization,treatment in emergency departments or treatmentby practitioners in formal and/or informal healthsectors. Data from HICs & studies from India
indicate that for every person killed by injury,approximately 30 persons are hospitalized androughly 50 - 100 more are treated in hospital emer-gency rooms (1, 17). Studies in Bengaluru andHaryana have shown that injury problems are muchhigher in the community than officially reportedfigures (26, 27). Thus, it is essential to realise thatin the country, number of deaths due to injuries couldbe much higher than official figures.

8 BRSIPP 2009
Ref
: htt
p://
cghr
.org
/pub
licat
ions
/FIN
AL%
20R
EPO
RT-M
illon
% 2
0Dea
th%
20st
udy%
2020
01-2
003%
20-p
hase
%20
1.pd
f
Ran
k<
11-
40-
45-
1415
-24
25-6
970
+A
ll A
ges
1 2 3 4 5 6 7 8 9 10
Peri
nata
lco
ndit
ions
(49
.2)
Res
pira
tory
infe
ctio
n (2
0.5)
Dia
rrhe
al d
isea
ses
(9.0
)
Oth
er i
nfec
tiou
s an
dpa
rasi
tic
dise
ases
(7.9
)
Con
geni
tal
anom
alie
s (3
.4)
III
defi
ned
cond
itio
ns (
2.9)
Nut
riti
onal
defi
cien
cies
(1.
8)
Uni
nten
tion
alin
juri
es:
Oth
er (
1.5)
Mal
aria
(0.
9)
Feve
r of
unk
now
nor
igin
(0.
9)
Dia
rrhe
aldi
seas
es (
22.0
)
Res
pira
tory
Infe
ctio
ns 2
1.4)
Oth
er i
nfec
tiou
s an
dpa
rasi
tic
dise
ases
(15
.5)
Uni
nten
tion
alin
juri
es:
Oth
er (
9.3)
Mal
aria
(6.
6)
III
defi
ned
cond
itio
ns (
5.3)
Nut
riti
onal
defi
cien
cies
(4.
3)
Feve
r of
Unk
now
nO
rigi
n (3
.1)
Con
geni
tal
Ano
mal
ies
(1.9
)
Dig
esti
veD
isea
ses
(1.6
)
Peri
nata
lco
ndit
ions
(36
.9)
Res
pira
tory
infe
ctio
ns (
20.7
)
Dia
rrhe
aldi
seas
es (
12.3
)
Oth
er i
nfec
tiou
s an
dpa
rasi
tic
dise
ases
(9.8
)
Ill-
defi
ned
cond
itio
ns (
3.5)
Uni
nten
tion
alin
juri
es:
Oth
er (
3.4)
Con
geni
tal
anom
alie
s (3
.0)
Nut
riti
onal
defi
cien
cies
(2.
4)
Mal
aria
(2.
4)
Feve
r of
unk
now
nor
igin
(1.
5)
Uni
nten
tion
alin
juri
es:
Oth
er(1
9.4
)
Dia
rrhe
al d
isea
ses
(15
.2)
Oth
er i
nfec
tiou
s an
dpa
rasi
tic
dise
ases
(13
,5)
Res
pira
tory
infe
ctio
ns (
8.4)
Mal
aria
(8.
1)
Ill-
defi
ned
cond
itio
ns (
5.4)
Mot
or v
ehic
leac
cide
nts
(5.3
)
Mal
igna
nt a
nd o
ther
neop
lasm
s (3
.8)
Dig
esti
ve d
isea
ses
(2.9
)
Feve
r of
unk
now
nor
igin
(2.
5)
Uni
nten
tion
alin
juri
es:
Oth
er(1
4.7
)
Inte
ntio
nal
self
-har
m (
14.3
)
Mot
or v
ehic
leac
cide
nts
:; ;
;,(1
2.4
)
Ill-
defi
ned
cond
itio
ns (
7.2)
Car
diov
ascu
lar
dise
ases
(6.
3)
Tube
rcul
osis
(6.0
)
Oth
er i
nfec
tiou
s an
dpa
rasi
tic
dise
ases
(5.2
)
Dia
rrhe
al d
isea
ses
(5.1
)
Mal
aria
(4.
8)
Mat
ern
alco
ndit
ions
(-)
Car
diov
ascu
lar
dise
ases
(26
.3)
Tube
rcul
osis
(11
.4)
CO
PD,
asth
ma,
oth
erre
spir
ator
y di
seas
es(1
0.1
)
Mal
igna
nt a
nd o
ther
neop
lasm
s (7
.8)
Dig
esti
ve d
isea
ses
(6.1
)
Uni
nten
tion
alin
juri
es:
Oth
er (
5.0)
Ill-
defi
ned
cond
itio
ns (
4.8)
Dia
rrhe
aldi
seas
es (
4.0)
Inte
ntio
nal
self
-har
m (
3.3)
Mal
aria
(2.
4)
Car
diov
ascu
lar
dise
ases
(26
.5)
CO
PD,
asth
ma,
oth
erre
spir
ator
y di
seas
es(1
5.7
)
Seni
lity
(13.
1)
Dia
rrhe
al d
isea
ses
(7.3
)
Mal
igna
nt a
nd o
ther
neop
lasm
s (4
.6)
Tube
rcul
osis
(4.
5)
Ill-
defi
ned
cond
itio
ns (
4.4)
Uni
nten
tion
alin
juri
es:
Oth
er (
3.7)
Res
pira
tory
infe
ctio
ns (
3.4)
Feve
r of
unk
now
nor
igin
(2.
8)
Car
diov
ascu
lar
dise
ases
(20
.3)
CO
PD,
asth
ma,
oth
erre
spir
ator
y di
seas
es(9
.3)
Tube
rcul
osis
(7.
1)
Dia
rrhe
al d
isea
ses
(6.7
)
Peri
nata
l co
ndit
ions
(6.4
)
Res
pira
tory
infe
ctio
ns (
5.4)
Mal
igna
nt a
nd o
ther
neop
lasm
s (5
.4)
Uni
nten
tion
alin
juri
es:
Oth
er (
5.2)
Ill-
defi
ned
cond
itio
ns (
4.6)
Seni
lity
(4.0
)
Tab
le 2
: To
p 1
0 c
au
ses
of
dea
th b
y A
ge
Gro
up
s in
In
dia
: M
ale

9
Ref
: htt
p://
cghr
.org
/pub
licat
ions
/FIN
AL%
20R
EPO
RT-M
illon
% 2
0Dea
th%
20st
udy%
2020
01-2
003%
20-p
hase
%20
1.pd
f
Ran
k<
11-
40-
45-
1415
-24
25-6
970
+A
ll A
ges
1 2 3 4 5 6 7 8 9 10
Peri
nata
lco
ndit
ions
(43
.1)
Res
pira
tory
infe
ctio
n (2
3.3)
Dia
rrhe
alD
isea
ses
(10.
6)
Oth
er i
nfec
tiou
s an
dpa
rasi
tic
dise
ases
(8.8
)
III
defi
ned
cond
itio
ns (
3.2)
Con
geni
tal
anom
alie
s (2
.8)
Nut
riti
onal
defi
cien
cies
(2.
3)
Uni
nten
tion
alin
juri
es:
Oth
er (
1.3)
Mal
aria
(1.
3)
Feve
r of
unk
now
nor
igin
(0.
9)
Dia
rrhe
aldi
seas
es (
25.2
)
Res
pira
tory
Infe
ctio
ns (
23.3
)
Oth
er i
nfec
tiou
s an
dpa
rasi
tic
dise
ases
(16
.2)
Mal
aria
(6.
6)
Uni
nten
tion
alin
juri
es:
Oth
er (
6.2)
Nut
riti
onal
defi
cien
cies
(5.
1)
III
defi
ned
cond
itio
ns (
3.9)
Feve
r of
Unk
now
nO
rigi
n (3
.1)
Dig
esti
ve d
isea
ses
(1.8
)
Con
geni
tal
anom
alie
s (1
.3)
Peri
nata
lco
ndit
ions
(29
.2)
Res
pira
tory
infe
ctio
ns (
23.3
)
Dia
rrhe
al d
isea
ses
(15
.3)
Oth
er i
nfec
tiou
s an
dpa
rasi
tic
dise
ases
(11
.2)
Ill-
defi
ned
cond
itio
ns (
3.4)
Nut
riti
onal
defi
cien
cies
(3.
2)
Mal
aria
(3.
0)
Uni
nten
tion
alin
juri
es:
Oth
er (
2.9)
Con
geni
tal
anom
alie
s (2
.3)
Feve
r of
unk
now
nor
igin
(1.
6)
Dia
rrhe
al d
isea
ses
(19
.6)
Oth
er i
nfec
tiou
s an
dpa
rasi
tic
dise
ases
(16
.7)
Uni
nten
tion
alin
juri
es:
Oth
er (
12.0
)
Res
pira
tory
infe
ctio
ns (
11.1
)
Mal
aria
(10
.7)
Ill-
defi
ned
cond
itio
ns (
4.6)
Feve
r of
unk
now
nor
igin
(3.
3)
Dig
esti
ve d
isea
ses
(2.8
)
Mot
or v
ehic
leac
cide
nts
(2.1
)
Mal
igna
nt a
nd o
ther
neop
lasm
s (2
.0)
Inte
ntio
nal
self
-har
m (
16.9
)
Mat
ern
alco
ndit
ions
(12
.6)
Uni
nten
tion
alin
juri
es:
Oth
er (
9.1)
Tube
rcul
osis
(7.
5)
Ill-
defi
ned
cond
itio
ns(7
.2)
Dia
rrhe
al d
isea
ses
(7.2
)
Car
diov
ascu
lar
dise
ases
(6.
3)
Mal
aria
(4.
6)
Oth
er i
nfec
tiou
s an
dpa
rasi
tic
dise
ases
(4.4
)
Mot
or v
ehic
leac
cide
nts
(1.7
)
Car
diov
ascu
lar
dise
ases
(22
.5)
Mal
igna
nt a
nd o
ther
neop
lasm
s (1
1.8)
CO
PD,
asth
ma,
oth
erre
spir
ator
y di
seas
es(1
0.4
)
Tube
rcul
osis
(8.
3)
Dia
rrhe
al d
isea
ses
(6.6
)
Ill-
defi
ned
cond
itio
ns (
6.0)
Uni
nten
tion
alin
juri
es:
Oth
er (
4.1)
Dig
esti
ve d
isea
ses
(3.5
)
Mal
aria
(3.
4)
Inte
ntio
nal
self
-har
m (
2.6)
Car
diov
ascu
lar
dise
ases
(24
.8)
Seni
lity
(18.
4)
CO
PD,
asth
ma,
oth
erre
spir
ator
y di
seas
es(1
2.4
)
Dia
rrhe
al d
isea
ses
(9.8
)
Uni
nten
tion
alin
juri
es:
Oth
er (
4.6)
Ill-
defi
ned
cond
itio
ns (
4.5)
Feve
r of
unk
now
nor
igin
(3.
9)
Mal
igna
nt a
nd o
ther
neop
lasm
s (3
.5)
Res
pira
tory
infe
ctio
ns (
3.4)
Tube
rcul
osis
(2.
6)
Car
diov
ascu
lar
dise
ases
(16
.9)
Dia
rrhe
al d
isea
ses
(9.9
)
CO
PD,
asth
ma,
oth
erre
spir
ator
y di
seas
es(8
.0)
Res
pira
tory
infe
ctio
ns (
7.1)
Seni
lity
(6.5
)
Peri
nata
l co
ndit
ions
(6.2
)
Mal
igna
nt a
nd o
ther
neop
lasm
s (6
.0)
Ill-
defi
ned
cond
itio
ns (
5.0)
Tube
rcul
osis
(4.
7)
Uni
nten
tion
alin
juri
es:
Oth
er (
4.5)
Tab
le 3
:To
p 1
0 c
au
ses
of
dea
th b
y A
ge
Gro
up
s in
In
dia
: Fe
male

10 BRSIPP 2009
Ref
: htt
p://
cghr
.org
/pub
licat
ions
/FIN
AL%
20R
EPO
RT-M
illon
% 2
0Dea
th%
20st
udy%
2020
01-2
003%
20-p
hase
%20
1.pd
f
Ran
k<
11-
40-
45-
1415
-24
25-6
970
+A
ll A
ges
1 2 3 4 5 6 7 8 9 10
Peri
nata
lco
ndit
ions
(46
.3)
Res
pira
tory
infe
ctio
n (2
1.8)
Dia
rrhe
aldi
seas
es (
9.7)
Oth
er i
nfec
tiou
s an
dpa
rasi
tic
dise
ases
(8.3
)
Con
geni
tal
anom
alie
s (3
.1)
III
defi
ned
cond
itio
ns (
3.0)
Nut
riti
onal
defi
cien
cies
(2.
0)
Uni
nten
tion
alin
juri
es:
Oth
er (
1.4)
Mal
aria
(1.
1)
Feve
r of
unk
now
nor
igin
(0.
9)
Dia
rrhe
aldi
seas
es (
23.8
)
Res
pira
tory
Infe
ctio
ns (
22.5
)
Oth
er i
nfec
tiou
s an
dpa
rasi
tic
dise
ases
(15
.9)
Uni
nten
tion
alin
juri
es:
Oth
er (
7.5)
Mal
aria
(6.
6)
Nut
riti
onal
Def
icie
ncie
s (4
.8)
III
defi
ned
cond
itio
ns (
4.5)
Feve
r of
Unk
now
nor
igin
(3.
1)
Dig
esti
ve d
isea
ses
(1.7
)
Con
geni
tal
anom
alie
s (1
.5)
Peri
nata
lco
ndit
ions
(33
.1)
Res
pira
tory
infe
ctio
ns (
22.0
)
Dia
rrhe
aldi
seas
es (
13.8
)
Oth
er i
nfec
tiou
s an
dpa
rasi
tic
dise
ases
(10
.5)
Ill-
defi
ned
cond
itio
ns (
3.4)
Uni
nten
tion
alin
juri
es:
Oth
er (
3.2)
Nut
riti
onal
defi
cien
cies
(2.
8)
Mal
aria
(2.
7)
Con
geni
tal
anom
alie
s (2
.7)
Feve
r of
unk
now
nor
igin
(1.
5)
Dia
rrhe
aldi
seas
es (
17.4
)
Uni
nten
tion
alin
juri
es:
Oth
er(1
5.7
)
Oth
er i
nfec
tiou
s an
dpa
rasi
tic
dise
ases
(15
.1)
Res
pira
tory
infe
ctio
ns (
9.7)
Mal
aria
(9.
4)
Ill-
defi
ned
cond
itio
ns (
5.0)
Mot
or v
ehic
leac
cide
nts
(3.7
)
Mal
igna
nt a
nd o
ther
neop
lasm
s (2
.9)
Dig
esti
ve d
isea
ses
(2.9
)
Feve
r of
unk
now
nor
igin
(2.
9)
Inte
ntio
nal
self
-har
m (
15.6
)
Uni
nten
tion
alin
juri
es:
Oth
er(1
1. 8
)
Ill-
defi
ned
cond
itio
ns (
7.2)
Mot
or v
ehic
leac
cide
nts
(6.9
)
Tube
rcul
osis
(6.
8)
Mat
ern
alco
ndit
ions
(6.
5)
Car
diov
ascu
lar
dise
ases
(6.
3)
Dia
rrhe
aldi
seas
es (
6.2)
Oth
er i
nfec
tiou
san
d pa
rasi
tic
dise
ases
(4.
8)
Mal
aria
(4.
7)
Car
diov
ascu
lar
dise
ases
(24
.8)
CO
PD,
asth
ma,
oth
erre
spir
ator
y di
seas
es(1
0.2
)
Tube
rcul
osis
(10
.1)
Mal
igna
nt a
nd o
ther
neop
lasm
s (9
.4)
Ill-
defi
ned
cond
itio
ns (
5.3)
Dig
esti
ve d
isea
ses;
(5'1
>
Dia
rrhe
al d
isea
ses
(5.0
)
Uni
nten
tion
alin
juri
es:
Oth
er (
4.6)
Inte
ntio
nal
self
-har
m '
(3.
0)
Mal
aria
(2.
8)
Car
diov
ascu
lar
dise
ases
(25
.7)
Seni
lity
(15.
7)
CO
PD,
asth
ma,
oth
erre
spir
ator
y di
seas
es(1
4.1
)
Dia
rrhe
al d
isea
ses
(8.5
)
Ill-
defi
ned
cond
itio
ns (
4.4)
Mal
igna
nt a
nd o
ther
neop
lasm
s (4
.1)
Uni
nten
tion
alin
juri
es:
Oth
er (
4.1)
Tube
rcul
osis
(3.
6)
Res
pira
tory
infe
ctio
ns (
3.4)
Feve
r of
unk
now
nor
igin
(3.
3)
Car
diov
ascu
lar
dise
ases
(18
.8)
CO
PD,
asth
ma,
oth
erre
spir
ator
y di
seas
es(8
.7)
Dia
rrhe
al d
isea
ses
(8.1
)
Peri
nata
lco
ndit
ions
(6.
3)
Res
pira
tory
infe
ctio
ns (
6.2)
Tube
rcul
osis
(6.
0)
Mal
igna
nt a
nd o
ther
neop
lasm
s (5
.7)
Seni
lity
(5.1
)
Uni
nten
tion
alin
juri
es:
Oth
er (
4.9)
Ill-
defi
ned
cond
itio
ns (
4.8)
Tab
le 4
: To
p 1
0 c
au
ses
of
dea
th b
y A
ge
Gro
up
s in
In
dia
; Pe
rso
n
11
A6. Information requirements for injuryprevention and control
Information available through national reportsindicates the number of fatal and nonfatal injuries,age – sex profiles, state and city wise distribution,education and occupation levels, road user categoriesfor RTIs and a vague distribution of causes.Information reported is based on informationreceived from different places. Detailed examinationinto some of this data reveals that much of therequired information (especially with causes or riskfactors) is unavailable or remains unclassified.
In India, as RTIs and other injuries are medico legalevents, a lot of information is collected in detail aspart of routine police investigation. However, thecollected information is not used for prevention andcontrol, but more for administrative and legalpurposes. Numbers are also collected by differentagencies like transport department, City Corporation
and others for their own use. In addition, totalinformation is not available in the public domainfor researchers and policy analysts. Thus, informationis piecemeal, fragmented and not integrated.
To formulate effective injury prevention and control(IPC) programmes, information is required on whattypes of injuries are occurring? Who are the affectedpeople? What are their characteristics? Where areinjuries occurring? How are injuries occurring? Whatare the risk factors and causes? What are the agent– host – environment factors that can be modified?and other detailed information. This is a similarunderstanding developed for many other publichealth problems like malaria, tuberculosis, HIV/Aidsand others. This will facilitate designing programmesfor prevention, improving trauma care andrehabilitation in IPC activities.
A7. A Surveillance approach“Surveillance” is a public health activity, referringto ongoing, continuous and systematic collection,analysis, interpretation and dissemination of healthinformation (14). Injury surveillance, in a similarcontext refers to collection, analysis, interpretationand dissemination of injury data with the overallaim of developing policies and programmes foreffective prevention and control of injuries. It includesgathering information on individual cases orassembling information from records, analyzing andinterpreting information, reporting and providingfeedback into programmes. Surveillance is acontinuous activity with an inbuilt feedbackmechanism and an action component. It helps inrecognising existing and changing burden andpattern of injuries, identifying new / emergingproblems, prioritising and selecting interventions andmeasuring the impact of interventions in a timelymanner. Surveillance data can be a meaningful inputto several programmes and activities of variousministries, government departments, healthprofessionals, transport, police, NGOs, and all othersinterested in injury prevention.
Importance of injury surveillanceReliable information on the burden, pattern, trendsand causes of injuries are required to developsystematic policies, programmes and interventions.In India, lack of reliable information on injury burden& impact has been one of the major barriers forabsence of systematic programmes for injuryprevention and control. Consequently, ad hoc, andat times, unscientific interventions are proposed andimplemented, and so far, these have not made anysignificant change. Injury problem has not beendefined due to absence of systematic information.Systematic activities like allocation of resources,human resource and capacity development,systematic efforts for care and management, injuryprevention interventions, and others have not receivedmuch importance. Hence, injuries have been aclearly neglected problem and a hidden epidemicfor many decades, even though evidence exists thatthe burden is huge (17).
Surveillance generates data that helps inunderstanding the:
Magnitude of the problem and itscharacteristics

12 BRSIPP 2009
Changing trendsPopulations at riskGeneral and select risk factors, andImpact of interventions
Local, regional and national injury surveillancesystems can provide data required for planning anddelivering effective injury prevention programmesto communities and to the country at large. It willhelp planners and administrators to take appropriateaction on a continuous and regular basis. Further, ithelps societies to advocate for positive changes thatare required for safety of everyone.
Often, it is thought that RTI / Injury surveillancerequires building entirely new systems involvinghuge resources. This is not true. Alternatively,it can be built within existing systems usingavailable resources. The existing systemsand methods can be improved, strengthenedand utilized to develop information that isrequired for injury prevention and controlprogrammes.
Any surveillance programme has to be operationaland sustainable, and hence, should be
SimpleAcceptableSensitiveReliableRepresentativeSustainableTimelyCost effective and, most importantly,UsefulIt is crucial to highlight that injury surveillanceprovides broad and specific information(depending on the extent and depth ofsurveillance) and should be supplemented withdata from focussed, targeted and specificstudies (like trauma registries, risk factorstudies etc.) to obtain further insights. Thus,injury surveillance is often the first step in thelarger information systems.The essence of surveillance is to collect smallquantities of good, reliable and usefulinformation (by well defined methods) andapply it to develop policies, programmes andinterventions.
Bengaluru Road safety and InjuryPrevention ProgrammeDetails of the surveillance programme undertaken in 2007 – 08 have been reported earlier and are availableat http://www.nimhans.kar.nic.in/epidemiology/bisp/sr1.pdf and only salient points are highlighted below.
A8. Goals, purpose and objectivesThe overall goal of BRSIPP is to achieve a reductionin injury (RTI and others) deaths, hospitalisationsand disabilities in Bengaluru.
The purpose and objectives of Bengaluru Injury /Road traffic Injury Surveillance Programme are to:
Collect and analyse data from selected
participating health care institutions, policesources and transport sector on specific aspectsof RTIs, sucides and other injuries.Facilitate application and utilization of datafor planning and implementing interventionprogrammes through various policies andprogrammes.
A9. Preparatory Phase (March – June 2007)Stake holder’s involvementAll stakeholders in injury prevention and controlincluding ministries of health, police, transport,urban and rural development, social welfare,
education, industries and commerce, media, NGOsand others need to be involved in surveillance,prevention and control activities. In Bengaluru,stakeholders from - Police (Traffic, Crime and Law

13
and Order), Health (Directorate of Health Services,Directorate of Medical Education, officials fromIntegrated Disease Surveillance Programme and allhospital administrators), Heads of major hospitals(Directors, Chief Executive Officers, Senioradministrators), Transport (transport departmentand Bengaluru Metropolitan TransportCorporation), Bruhat Bengaluru MahanagaraPalike, social welfare, urban development, NationalHighway Authority and Non-GovernmentalOrganizations working with injury issues were
contacted, sensitised and involved in theprogramme.
As it is an inter-sectoral and coordinated activity,stake holders contribution in terms of need for data,what type of data is required, how will it be collected, steps involved in the development and mechanismsof data collection and utilisation - application werediscussed in preliminary discussions during themeeting. The roles and responsibilities were specifiedand agreed upon by all stake holders.
A10. Focus of surveillanceUnder the present programme, data is being collectedon Road traffic injuries, falls, burns, poisoning,suicides and assault/violence. While the focus is onall injury causes, the major thrust is on road trafficinjuries and suicides as identified by stakeholders. Itwas decided to include occupational and otherinjuries in later stages of the programme.
Designing and building a surveillance system
1. Identifystakeholders
2. Define systemobjectives
3. Define“ a case ”
4. Identifydata sources
5. Assess availableresources
6. Inform and involvestakeholders
7. Definedata needs
8. Collect data
9. Establish a dataprocessing system
10. Design anddistribute reports
11. Train staff andactivate system
12. Monitor andevaluate
Ref.: 14
A11. Surveillance MechanismsThe different agencies collecting injury relatedinformation in the city of Bengaluru are police,hospitals, transport, city corporation vital registrydivision, and NGOs. Accordingly, these sources arestrengthened and are being used to collect data on aregular basis. The sources of data under the presentprogramme include police records for RTI and otherinjury mortality information - BMTC data for fatalbus crashes - vital division records for deaths in thecity for injury mortality information – and hospitaldata for nonfatal injuries.
Figure 6: Sources of information for injury
BRSIPP
Policesources
Transportsector
Vital DeathRegistration
UrbanHospitals
RuralHospitals

14 BRSIPP 2009
A11.1. Data on fatal injuriesData on injury mortality is collected from policesources as previous studies had shown that majorityof deaths are reported to police. Bengaluru City Policecollect information on various aspects of RTIs andother injuries (any unnatural death) under the“medico-legal” rubric. All deaths due to road crashes,suicides, homicides and other unnatural (suspicious)deaths are considered medico-legal and police areentrusted with the primary responsibility ofdocumenting information. Information is based onthe formats provided by NCRB. A review of the roadcrash death and other injury death records revealedthat large body of information is collected on everycase and processed as per administrative and legalrequirements.
The review of police information system revealed:Lack of a uniform reporting format for injuriesInformation systems are piecemeal andfragmentaryDifferent types of records received from casualtyrooms of hospitals for reporting injuries topolice (along with duplication of work)Manual handling of dataFrequent transfer of Officials and personnelLack of analysis of dataAbsence of linkage of records between policeand healthAbsence of a centralized agency to process,analyse and utilize dataAbsence of systematic reporting to concernedstakeholders, society at large and others, andMedico legal problems of a continuousnature.
A major limitation of this approach has been thatinformation on preventive aspects that can be helpfulfor planners and policymakers are not clearlyavailable. Secondly, the collected data is notcompiled and analyzed systematically at the city orstate level. Thirdly, information is distributed acrossthe 39 traffic and 106 law and order police stationsof the city and is not available in any systematicformat in a central place for examination. Fourthly,information is not brought to the attention of allstakeholders and is not applied for programmes. Aspecified format was developed based on review ofrecords, piloted in few stations, and has been widelyadapted in the programme.
A11.2. Data on nonfatal injuries fromhospitals
Since hospitals and health professionals (doctors,nurses, specialists, technicians, medical recordstaff, etc.,) provide care for injured persons acrossthe city and round-the-clock, information isgathered in medical records as per the practicesfollowed by individual hospitals. An inventory offew hospitals prior to the beginning of thesurveillance programme revealed that themethods, practices and procedures varied fromhospital to hospital. The way information isrecorded is often dependant on practice of thedoctor and huge variations and discrepancies areseen. A review of the system indicated thatinformation is not collected on injury nature,causes, situation, circumstances, and use ofprotective equipments or pre-hospital care details,except the source of referral. The diagnostic andmanagement details are written in detail todocument care for patients. There is no centralagency or organization within the health sectorthat collects information from all the hospitals,analyses and processes data and brings it on acommon format to develop interventionprogrammes. As there was no uniformity, it wasdecided in the stakeholders meeting that allhospitals will adopt a system of documentinginformation in a uniform manner using a commonformat of “Emergency Trauma Care Record”,supplemented by training and sensitisationprogrammes.
A11.3. Selection of surveillance sitesAs per the decision in the stakeholders reviewmeeting it was decided that injury death informationwill be extracted from 39 traffic as all RTI deathsare reported to police authorities on a regular basissoon after the occurrence of an event. In addition,data from BBMP and BMTC crashes are collectedseparately and pooled together to make finalconclusions. For nonfatal injuries, data is beingcollected from 30 urban hospitals and 1 rural hospitaland it was estimated that these hospitals would covernearly 60-70% of injury registrations andhospitalisations. The hospitals were chosen basedon the criteria of geographical coverage, availabilityof round the clock trauma care, location of thehospitals and willingness to participate. Participationis purely voluntary in the programme (Fig. 7).

15
Figure 7: Map of Bengaluru showing the location of various partner hospitals and
Traffic Police Stations
Limitations of Health Sector InformationRudimentary information systems on RTIs and other injuriesNo uniform data formats in the hospitalsThe death certificate does not mention injury as associate or antecedent condition, evenwhen injury has been cause of death; injury deaths are reported to police separatelyInformation on injury patterns, profile and causes not availableData on pre-hospital care factors not elicitedData on injury care and disability details are not available, analyzed or reportedHospitals do not use ICD-10 classification or the ICECI classificatory systemsOverburdened and overstretched emergency staff in hospitals (more so in public sectorhospitals)Injury surveillance system is absent in the countryNo information system with in the health sectorLack of resources (money, manpower, time and other facilities)Very few hospital based studies
A11.4 Inventory of hospitals andscoping study
To identify the caseload in emergency rooms,type and nature of personnel available, type ofdocuments maintained, information flow and otheraspects, a scoping study was undertaken in thebeginning. The study highlighted that variouscategories of personnel were available in institutionsdepending on the type of organization. Commonly,in medical college teaching hospitals - casualtymedical officers, nurses, residents, postgraduatestudents, interns and medical record personnel workround the clock to provide care for patients. In otherhospitals, primarily of a private nature, casualty
medical officers and nurses are the only routinepersonnel.
A11.5 Time of data collectionFor injury deaths, the point of information collectionwas the individual police stations (35 traffic and103 law and order) and the first information report,summary sheet and available extracts were chosenas the source of information. At present, nodocuments are being reviewed by the centralteam.
In the hospitals, data was collected from casualtydepartments, as it is the first point of contact for

16 BRSIPP 2009
Details of road traffic deaths (where, who, howand selected risk factors)Details of other types of injury and deaths(intent, place, type),Pre-hospital care (first aid, transport, referral)Management and outcome
It was decided to focus on core data elements withscope for expansion in due course of time. Theresponsibility of identifying personnel to completethe surveillance form was left to individualhospitals. An operation-training manual (availableon request) was developed for training of allinvolved personnel from police and health. Themanual included description of purpose ofcollecting information, various variables – briefdescription – coding patterns - methods of fillingup of the forms. The collected and analyzedinformation should be able to unravel injurycharacteristics and dimensions and, help indeveloping intervention programmes.
A11.7 Pilot studyA pilot study was undertaken in both police stationsand hospitals over a one month period to examinefeasibility, identify problems, find remedial solutionsand develop logistics for future work. The pilot studyshowed that it is possible and feasible to transferand collect data in a uniform format. Trained stafffrom NIMHANS did data collection during thisphase. On an average, it took 3 - 5 minutes tocomplete a form depending on the experience of theperson filling up the proforma.
Following the pilot phase, the findings were discussedwith stakeholders and nodal officers. The proformawas revised accordingly. The revised police andhospital format was accepted as the core data elementform with provision for addition of information atlater stages of the programme.
injury patients. Data is collected in the form of an“Emergency Trauma Care Record”. It was also agreedthat data would be collected uniformly in a standardformat along with training of all involved personnel.Information was collected as part of the history takingprocess or soon after treatment procedures werecompleted.
The review of the existing hospital informationsystem revealed that:
Information collected in detail on patient careand managementInformation collection depends on attendingphysicianDifferent types of records maintained incasualty rooms with duplication of work( number of records maintained for injuriesvaried from 1 – 15 across hospitals)No central processing of data even in hospitalsAbsence of systematic reporting to any agency,as there is no designated agencyLack of a uniform reporting format forinjuriesTransfer and turnover of staff at repeat, regularand frequent intervalsMedico legal problems of a continuousnatureReluctance on the part of some hospitals toundertake shared responsibility. Informationis piecemeal and fragmentaryNo information on preventive aspects
A11.6 Focus of information collectionAny injury surveillance programme should outlinecore data for the programme and include optionalitems depending on the need. The focus ofinformation gathering was on
Basic identification and brief socio-demographic detailsInformation on Injury and death (place, type,activity, intent)

17
A12.Implementation Phase(June 2007 - June 2008)
Information was collected from Police, transport,city corporation and hospital sources from January- December 2007 (police and transport) and April2007- 2008 (hospitals), respectively, by combinationof different methods. Overall mortality information(all cause deaths) was also collected from the vitalstatistics division of Bengaluru Mahanagara Palikefor the year 2005 (latest year for which data wasavailable). Injury mortality information was collectedfrom police sources. Since the transport departmentcollects data from most of the fatal and serious non-fatal road traffic injuries and since the focus isdifferent, it was collected separately, even thoughsome of it is captured in police records. Morbiditydata was captured from emergency rooms of 25participating hospitals. During the 1 year period datawas collected from 4334 injury deaths and 68498non-fatal injuries. Details are available at http://www.nimhans.kar.nic.in/epidemiology/bisp/sr1.pdfand in the report (28). The type and volume of datathat was collected has been discussed in our previousreport (28).
A12.1. Training of Police and healthpersonnel
In the beginning, the field officers from NIMHANSwere trained in data collection. These people hadbasic qualifications in sociology, social work, ruraldevelopment, or in other areas and had prior researchexperience in health. Gradually, the CC staffs werewithdrawn encouraging institutions to take up theactivity on their own.
In the police department, the writers of policestations were invited for training programmes.Since capacity development is a systematic activity,repeat programmes were done to improve contentsand quality of data. The training focussed onunderstanding contents of proforma, definitions used,method of entering and coding, checking forcompleteness and other aspects.
In the hospitals, training of casualty staff (casualtymedical officers, nursing personnel and medicalrecords staff) was crucial to ensure completeness,coverage and uniformity in data collection. It was
essential to do this in a phased manner, as therewere large numbers of people to be trained (due tofrequent change of personnel). The training focussedon purpose of the programme, persons responsiblefor data collection, nature of information beingcollected, coding patterns, and ensuring safety ofcompleted forms to be collected. Training was alsooffered to different personnel depending on rolesand responsibilities of the personnel. In the ruralareas, staffs from district hospital and SiddharthaMedical College hospital were trained on thevarious aspects of the programme in a similarmanner. Series of training programmes have beenconducted under the programme for both police andhospital staff.
Consensus was reached on many of the items andmethodology of data collection - pooling - transfer -analysis - reporting and feedback of the programme.
The training was held in the local language and ina simple way using local examples and colloquialterms. Several questions that came up were answeredand changes incorporated.
A12.2. Data collection logisticsWith continuation of activities, all hospitals haveprinted their own forms with their names and logoin duplicate carbon copy formats (essential to notethat ER departments have not been computerised inany hospital). With the evolution of the programme,it is proposed to shift from paper-based forms toonline transmission depending upon the availabilityof computer facilities. In the hospitals, informationis being collected from injury patients in emergencyrooms. It was agreed that data would be collectedin casualty departments soon after completingtreatment procedures or as part of history takingprocess. Different modalities of operations wereevolved in different situations.
From the police records and primarily from FIRs,the station staff completed the forms soon afterinvestigations were completed or during the courseof investigation. These trained staff send thecompleted forms to the nodal officer in police

18 BRSIPP 2009
A13. Review Phase(June 2008 - December 2008)
After the initial implementation of programme forone year different aspects were reviewed with allinstitutions and stake holders on various aspects.Many practical solutions were developed to overcomeproblems. Hospitals were encouraged to implementthe programme with involvement of local staff. Theprogress during this time could be termed as mixed,as some improved, while few did not evince keeninterest. The activities with traffic police and fewhospitals improved due to interest and leadership bythe department. The sustenance of interest was also
due to the fact that they could use data for improvinglocal activities. Many changes were made based onfeedback from participating institutions. The revisedprogramme has been implemented from Jan 2009.It is important to note that institutions wereencouraged to strengthen and sustain the programmeon their own. Hence, the data reported in the nextsections are not comprehensive and total, thus, onlyindicating profile and pattern and any extrapolationmade has to be done with caution.
department, who in turn, send all completed formsto the CC on a monthly basis. The forms reach theCC before 10th of every month for computerisation.Quality control mechanisms have been establishedthrough cross checks, sampling records for reliabilityand validity checks, and for completeness.
A12.3. Data management stepsAll collected forms are checked by the CC staff forcompleteness, coverage and quality. The CC staffmakes random checks and check the process. Anydeficiencies observed are brought to the notice ofconcerned authorities for immediate corrections.Quality control at different stages of data collection,transfer and entry is crucial to obtain quality dataunder the surveillance programme.
A team of data manager and data entry operatorwas constituted in the beginning and trained in allaspects. A data entry format on EPI INFO windowsversion 3.3 was developed, tested and used for dataentry and analysis purposes.
A12.4. Data pooling from othersourcesIn addition to information collected from police andhospital sources, data is also collected from the statisticsdivision of health dept of BBMP, transport department,NGOs, and others for a comprehensive examination ofinjury scenario in the city of Bengaluru.
A12.5. Monitoring and Feedback stepsInbuilt mechanisms through internal verifications,record reviews, weekly meetings of project team,checking all records for completeness and quality have
been developed to ensure systematic monitoring ofthe programme. Meeting with all nodal officers oncein 3 months helped in reviewing progress, identifyingremedial measures for problems, ensured bettercooperation, and to work out future steps.
Continuous contact of the CC staff with all institutionswas an inbuilt activity under the programme.Periodical visits and communication on a regularbasis was undertaken to ensure completion of allactivities as per time schedule. The programmecoordinator and the team visit police and hospitaldepartments at periodical intervals and discussionsare held with nodal officers, ER staff, medical recordstaff and hospital administrators.
A12.6 Sharing and disseminating ofinformation
As surveillance is an ongoing continuous activity, theanalyzed data has to be shared with all the partners,and hence, feedback becomes a regular feature of theprogramme. All reports are developed, circulated anddisseminated under the title of "Bengaluru Road safetyand Injury Prevention Programme" .Individualinstitutions are provided with their respective datafor the previous 3 months (on a CD) on a regularbasis. Member institutions are encouraged to examine,use and develop reports for their institutional activities.Data is constantly reviewed in the nodal officersmeeting and used in all training programmes.Information has been made available to memberinstitutions as and when required. Mechanisms havebeen evolved to ensure that all partnering institutionshave access to data at any time.

19
Section B:
Data and Information
The data collected from different sources in 2009 has been presented in
this section. The purpose of this section is not to describe the epidemiology
of RTIs and other injuries, but to highlight the type of data that will be
available in a surveillance programme. The data description highlights
the current profile and patterns of RTIs and other injuries, and provides
directions for linking number of other activities. This approach should
help in deciding usefulness of surveillance activities. The nature and
depth of analysis can be decided based on specific inputs and requirements
for programmes.

20 BRSIPP 2009
The City of BengaluruThe city of Bengaluru is a recognizable landmarkon the national and global map for its technological,educational and economic growth. The city ofBengaluru, as per the boundaries delineated by BBMPwas identified for the programme and a brief profileof the city is given in Table 5.
What changed in Bengaluru in 2009
The city of Bengaluru moved ahead in several areas.Some important changes that are of relevance toinjuries are highlighted below as illustrativeexamples.
In the year 2009, the city added 348,707vehicles onto its roads. Among them, 233,699were two wheelers, 122,910 were cars and othervehicles like buses, trucks etc., accounted forthe rest.The BMTC added 571 new buses, increasingits total fleet strength to 5344. Correspondingly,the trips and schedules increased by 9%. Thesystem transports approximately 40, 00,000people every day, an increase of 2% comparedwith 2008.A few infrastructure projects were completedand opened for public. Important among them
Table 5: Bengaluru City – A Socio Demographic Profile – update in select areas andshow 2008 and 2009 together
SI. No Parameters 20091 Area 800 sq. kms 1
2 Population 7 million 1
2 Density 2980/sq.km 2
3 Contribution to Karnataka state population 11%4 Sex Ratio (Females/1000 males) 915 3
5 Life expectancy at birth 64.2 years6 Crude birth rate/1000 19.1 2
7 Crude death rate/1000 7.2 2
8 Decennial growth rate 1.3%9 Total number of slums 733 4
10 Total population in slums 4,30,501 5
11 Slum population% 10 2
12 Socially disadvantaged population (%) 4013 Literacy rate% 83.91 6
14 Total number of schools and colleges 7674 7
15 Total number of factories 6024 8
16 Total number of police stations 142 9
17 Total number of hospitals (including public, private hospitals & nursing homes) 572 10
18 Total number of Drug stores 4445 11
19 Total number of General practitioners H” 5000 10
20 Total length of roads 1500 kms 1
21 Total number of police personnel (traffic) 3,10222 Total number of police personnel (law and order) 11,90823 Total number of registered vehicles 3.4 million 12
24 Number of alcohol selling outlets (CL-2, 4, 5, 6, 6A, 7, 9, 14 & 15) Licensees H” 2400 13
25 Indian Made Liquor sold for the year 2007 – 2008 325.48 lakh CBs 13
26 Total revenue from IML & Beer Rs.3478cr 13
Source:1 http://www.bmponline.org2 www.bangaloreit.com3 http://www.experiencefestival.com/slum4 http://www.hindu.com/2007/04/28/stories/
2007042802250200.htm5 www.censusindia.com6 www.des.kar.nic.in7 Karnataka Education Departments
8 Small, Medium and Large scale industries Corporation9 BCP Bengaluru City Police10 KSPCB Karnataka State Pollution Control Board11 Karnataka state Drugs control General12 www.rto.kar.nic.in/bng-veh-stat.htm13 Karnataka State Beverages Corporation Limited
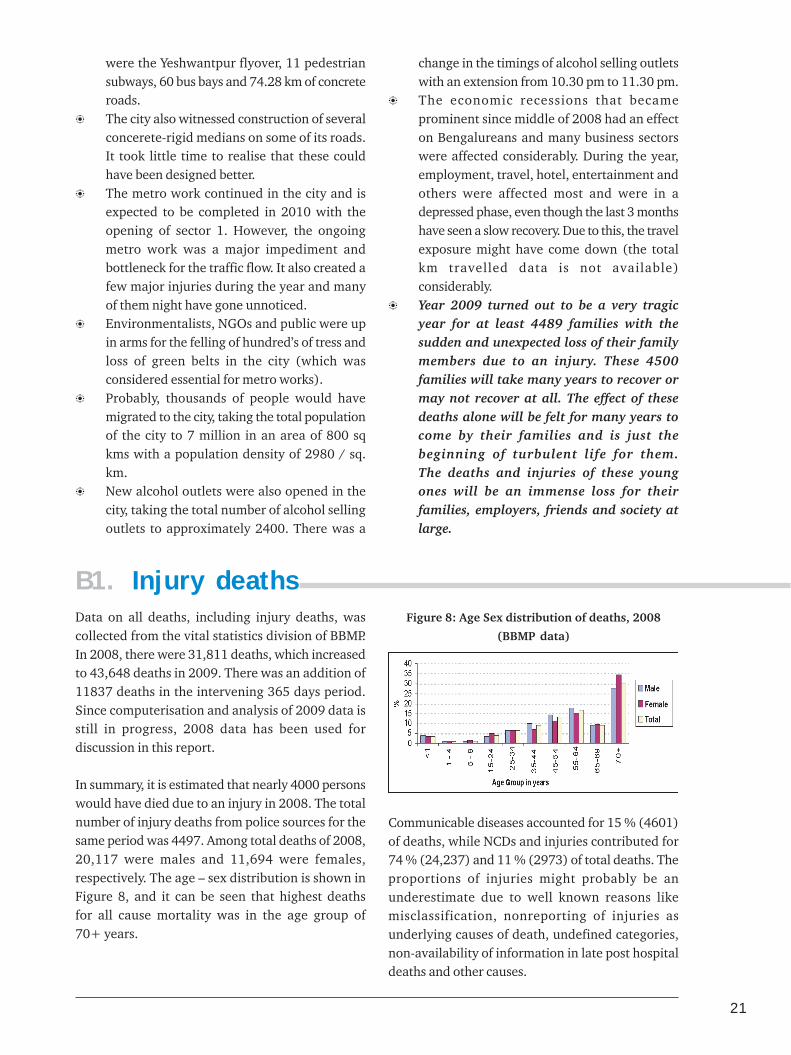
21
were the Yeshwantpur flyover, 11 pedestriansubways, 60 bus bays and 74.28 km of concreteroads.The city also witnessed construction of severalconcerete-rigid medians on some of its roads.It took little time to realise that these couldhave been designed better.The metro work continued in the city and isexpected to be completed in 2010 with theopening of sector 1. However, the ongoingmetro work was a major impediment andbottleneck for the traffic flow. It also created afew major injuries during the year and manyof them night have gone unnoticed.Environmentalists, NGOs and public were upin arms for the felling of hundred’s of tress andloss of green belts in the city (which wasconsidered essential for metro works).Probably, thousands of people would havemigrated to the city, taking the total populationof the city to 7 million in an area of 800 sqkms with a population density of 2980 / sq.km.New alcohol outlets were also opened in thecity, taking the total number of alcohol sellingoutlets to approximately 2400. There was a
change in the timings of alcohol selling outletswith an extension from 10.30 pm to 11.30 pm.The economic recessions that becameprominent since middle of 2008 had an effecton Bengalureans and many business sectorswere affected considerably. During the year,employment, travel, hotel, entertainment andothers were affected most and were in adepressed phase, even though the last 3 monthshave seen a slow recovery. Due to this, the travelexposure might have come down (the totalkm travelled data is not available)considerably.Year 2009 turned out to be a very tragicyear for at least 4489 families with thesudden and unexpected loss of their familymembers due to an injury. These 4500families will take many years to recover ormay not recover at all. The effect of thesedeaths alone will be felt for many years tocome by their families and is just thebeginning of turbulent life for them.The deaths and injuries of these youngones will be an immense loss for theirfamilies, employers, friends and society atlarge.
B1. Injury deathsData on all deaths, including injury deaths, wascollected from the vital statistics division of BBMP.In 2008, there were 31,811 deaths, which increasedto 43,648 deaths in 2009. There was an addition of11837 deaths in the intervening 365 days period.Since computerisation and analysis of 2009 data isstill in progress, 2008 data has been used fordiscussion in this report.
In summary, it is estimated that nearly 4000 personswould have died due to an injury in 2008. The totalnumber of injury deaths from police sources for thesame period was 4497. Among total deaths of 2008,20,117 were males and 11,694 were females,respectively. The age – sex distribution is shown inFigure 8, and it can be seen that highest deathsfor all cause mortality was in the age group of70+ years.
Figure 8: Age Sex distribution of deaths, 2008
(BBMP data)
Communicable diseases accounted for 15 % (4601)of deaths, while NCDs and injuries contributed for74 % (24,237) and 11 % (2973) of total deaths. Theproportions of injuries might probably be anunderestimate due to well known reasons likemisclassification, nonreporting of injuries asunderlying causes of death, undefined categories,non-availability of information in late post hospitaldeaths and other causes.

22 BRSIPP 2009
Figure 9: Major causes of death, 2008 TTTTTable 6: Table 6: Table 6: Table 6: Table 6: Top 10 causes of death in Bengaluruop 10 causes of death in Bengaluruop 10 causes of death in Bengaluruop 10 causes of death in Bengaluruop 10 causes of death in Bengaluru
SrSrSrSrSr..... Cause of DeathCause of DeathCause of DeathCause of DeathCause of Death Number ofNumber ofNumber ofNumber ofNumber ofN oN oN oN oN o DeathsDeathsDeathsDeathsDeaths
1 Ischemic Heart Disease 50152 Neoplasm 32703 Injury 29734 Diabetes mellitus 24835 Respiratory Diseases 23206 Hypertensive disease 19727 Liver Diseases 16088 Cerebrovascular diseases 16039 Tuberculosis 1329
10 Pulmonary heart Disease 1238
11 Other causes 8000
Detailed analysis was performed to identify top 15leading causes of death in different age groups andboth sexes. Tables 7,8,9 indicate that
Injuries are leading cause of death in youngerage groups of 15-44 years.Traffic crashes are the leading cause of deathin 25-34 yrs age groups.Burns are the foremost cause among womenin 15 – 34 yrs age groups.Intentional self harm accounted for 9.35%deaths in 25-34yrs.
Comparison of injury causes between police and vitalstatistics division data showed major differences,reflecting information gathering practices. Transportaccidents were higher in BBMP data ( based on deathcertificates), while suicides were more in police data.Our previous research in suicides has shown thatsuicidal deaths are not properly documented inhospital deaths for medico legal reasons. Similarly,some unspecified and unclassified deaths are includedin police sources as suicides. If RTIs are theunderlying cause of death, they are not documentedin death certificates. This shows that there isconsiderable scope for improving vital statistics databased on death registration systems.
Injuries9.4%
CommunicableDiseases
14.5%
Non communicableDiseases
76.1%
Specific analysis of injury deaths revealed thatmore than two thirds of injury deaths (64.4 %)occurred in 15 – 44 years, with variation asper causes. Proportionately, more injury deathsoccurred among women in the 15 – 34 yrs agegroup, with preponderance of males in later agegroups.
Figure 10: Age sex distribution of
injury deaths, 2008
The top 10 conditions that lead to death in 2008 aregiven in Table 6. Examination of contribution ofinjury causes for deaths revealed that injuriesoccupied the 3rd leading condition for deaths.Disaggregated data showed that traffic accident,burns, suicides and other injury causes occupied 10th,12th, 15th and 17th rank, respectively. In total, RTIsand suicides accounted for 2.9% and 2 % of totaldeaths, respectively.
B2. Urban injuriesAfter intense data gathering activities in 2008, 2009was devoted primarily for review, streamlining andconsolidation of activities in all institutions. Afterthe stake holder’s consultation meeting on Jan 28,2009, all partners were encouraged to discuss withtheir heads of institutions and colleagues to improveand strengthen mechanisms for data collection.Consequently, data collection continued at different
points of time and data on nonfatal injuries is notavailable from all institutions uniformly for theentire 12 month period in a uniform manner. In2010, the mechanisms have been strengthened inall partner hospitals and 8 new partner institutionshave joined the programme. Hence, the data onnonfatal injuries indicates only the broad trendsand patterns.
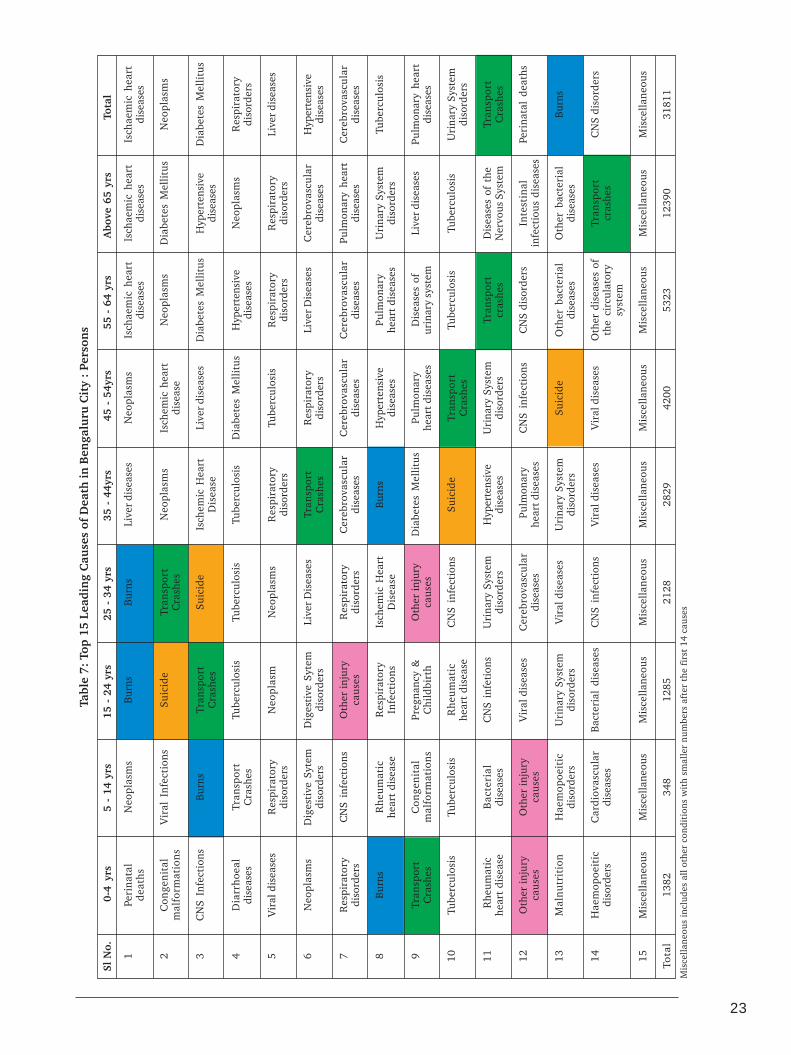
23
Sl N
o.0-
4 yr
s5
- 14
yrs
15 -
24
yrs
25 -
34
yrs
35 -
44y
rs45
- 5
4yrs
55 -
64
yrs
Abo
ve 6
5 yr
sTo
tal
1 2 3 4 5 6 7 8 9 10 11 12 13 14 15
Tota
l
Peri
nata
lde
aths
Con
geni
tal
mal
form
atio
ns
CN
S In
fect
ions
Dia
rrho
eal
dise
ases
Vir
al d
isea
ses
Neo
plas
ms
Res
pira
tory
diso
rder
s
Bur
ns
Tran
spor
tC
rash
es
Tube
rcul
osis
Rhe
umat
iche
art
dise
ase
Oth
er in
jury
caus
es
Mal
nutr
itio
n
Hae
mop
oeit
icdi
sord
ers
Mis
cella
neou
s
1382
Tabl
e 7:
Top
15
Lead
ing
Cau
ses
of D
eath
in B
enga
luru
Cit
y :
Pers
ons
Neo
plas
ms
Vir
al I
nfec
tion
s
Bur
ns
Tran
spor
tC
rash
es
Res
pira
tory
diso
rder
s
Dig
esti
ve S
ytem
diso
rder
s
CN
S in
fect
ions
Rhe
umat
iche
art
dise
ase
Con
geni
tal
mal
form
atio
ns
Tube
rcul
osis
Bac
teri
aldi
seas
es
Oth
er in
jury
caus
es
Hae
mop
oeit
icdi
sord
ers
Car
diov
ascu
lar
dise
ases
Mis
cella
neou
s
348
Bur
ns
Suic
ide
Tran
spor
tC
rash
es
Tube
rcul
osis
Neo
plas
m
Dig
esti
ve S
ytem
diso
rder
s
Oth
er in
jury
caus
es
Res
pira
tory
Infe
ctio
ns
Preg
nanc
y &
Chi
ldbi
rth
Rhe
umat
iche
art
dise
ase
CN
S in
feti
ons
Vir
al d
isea
ses
Uri
nary
Sys
tem
diso
rder
s
Bac
teri
al d
isea
ses
Mis
cella
neou
s
1285
Bur
ns
Tran
spor
tC
rash
es
Suic
ide
Tube
rcul
osis
Neo
plas
ms
Live
r D
isea
ses
Res
pira
tory
diso
rder
s
Isch
emic
Hea
rtD
isea
se
Oth
er in
jury
caus
es
CN
S in
fect
ions
Uri
nary
Sys
tem
diso
rder
s
Cer
ebro
vasc
ular
dise
ases
Vir
al d
isea
ses
CN
S in
fect
ions
Mis
cella
neou
s
2128
Live
r di
seas
es
Neo
plas
ms
Isch
emic
Hea
rtD
isea
se
Tube
rcul
osis
Res
pira
tory
diso
rder
s
Tran
spor
tC
rash
es
Cer
ebro
vasc
ular
dise
ases
Bur
ns
Dia
bete
s M
ellit
us
Suic
ide
Hyp
erte
nsiv
edi
seas
es
Pul
mon
ary
hear
t dis
ease
s
Uri
nary
Sys
tem
diso
rder
s
Vir
al d
isea
ses
Mis
cella
neou
s
2829
Neo
plas
ms
Isch
emic
hea
rtdi
seas
e
Live
r di
seas
es
Dia
bete
s M
ellit
us
Tube
rcul
osis
Res
pira
tory
diso
rder
s
Cer
ebro
vasc
ular
dise
ases
Hyp
erte
nsiv
edi
seas
es
Pulm
onar
yhe
art d
isea
ses
Tran
spor
tC
rash
es
Uri
nary
Sys
tem
diso
rder
s
CN
S in
fect
ions
Suic
ide
Vir
al d
isea
ses
Mis
cella
neou
s
4200
Isch
aem
ic h
eart
dise
ases
Neo
plas
ms
Dia
bete
s M
ellit
us
Hyp
erte
nsiv
edi
seas
es
Res
pira
tory
diso
rder
s
Live
r D
isea
ses
Cer
ebro
vasc
ular
dise
ases
Pulm
onar
yhe
art
dise
ases
Dis
ease
s of
urin
ary
syst
em
Tube
rcul
osis
Tran
spor
tcr
ashe
s
CN
S di
sord
ers
Oth
er b
acte
rial
dise
ases
Oth
er d
isea
ses
ofth
e ci
rcul
ator
ysy
stem
Mis
cella
neou
s
5323
Isch
aem
ic h
eart
dise
ases
Dia
bete
s M
ellit
us
Hyp
erte
nsiv
edi
seas
es
Neo
plas
ms
Res
pira
tory
diso
rder
s
Cer
ebro
vasc
ular
dise
ases
Pulm
onar
y he
art
dise
ases
Uri
nary
Sys
tem
diso
rder
s
Live
r di
seas
es
Tube
rcul
osis
Dis
ease
s of
the
Ner
vous
Sys
tem
Inte
stin
alin
fect
ious
dis
ease
s
Oth
er b
acte
rial
dise
ases
Tran
spor
tcr
ashe
s
Mis
cella
neou
s
1239
0
Isch
aem
ic h
eart
dise
ases
Neo
plas
ms
Dia
bete
s M
ellit
us
Res
pira
tory
diso
rder
s
Live
r di
seas
es
Hyp
erte
nsiv
edi
seas
es
Cer
ebro
vasc
ular
dise
ases
Tube
rcul
osis
Pulm
onar
y he
art
dise
ases
Uri
nary
Sys
tem
diso
rder
s
Tran
spor
tC
rash
es
Peri
nata
l de
aths
Bur
ns
CN
S di
sord
ers
Mis
cella
neou
s
3181
1
Mis
cella
neou
s in
clud
es a
ll ot
her
cond
itio
ns w
ith
smal
ler
num
bers
aft
er t
he f
irst
14
caus
es

24 BRSIPP 2009
Sl N
o.0-
4 yr
s5
- 14
yrs
15 -
24
yrs
25 -
34
yrs
35 -
44y
rs45
- 5
4yrs
55 -
64
yrs
Abo
ve 6
5 yr
sTo
tal
1 2 3 4 5 6 7 8 9 10 11 12 13 14 15
Tota
l
Peri
nata
lde
aths
Con
geni
tal
mal
form
atio
ns
Dia
rrho
eal
dise
ases
Neo
plas
ms
Vir
al d
isea
ses
CN
S in
fect
ions
Res
pira
tory
Dis
ease
s
Bur
ns
Oth
er d
isea
ses
ofth
e ne
rvou
ssy
stem
Tube
rcul
osis
Tran
spor
t cr
ashe
s
Rhe
umat
ic H
eart
Dis
ease
Hae
mop
oeit
icD
isor
ders
Oth
er in
jury
caus
es
Mis
cella
neou
s
861
Tabl
e 8:
Top
15
Lead
ing
Cau
ses
of D
eath
in B
enga
luru
Cit
y :
Mal
es
Neo
plas
ms
Vir
al d
isea
ses
CN
S In
fect
ions
Bur
ns
Tran
spor
t cr
ashe
s
Res
pira
tory
dise
ases
Oth
er C
NS
dise
ases
Con
geni
tal
mal
form
atio
ns
Bac
teri
al d
isea
ses
Oth
er I
njur
yca
uses
Rhe
umat
icH
eart
Dis
ease
Tube
rcul
osis
Dig
esti
vedi
sord
ers
Hae
mop
oeit
icdi
sord
ers
Mis
cella
neou
s
182
Tran
spor
tcr
ashe
s
Suic
ide
Bur
ns
Tube
rcul
osis
Neo
plas
ms
Oth
er I
njur
yC
ause
s
Dig
esti
ve S
yste
mD
isor
ders
Rhe
umat
icH
eart
Dis
ease
Res
pira
tory
Dis
ease
s
Vir
al d
isea
ses
Dis
ease
s of
urin
ary
syst
em
CN
S in
fect
ions
Oth
er b
acte
rial
dise
ases
Oth
er C
NS
dise
ases
Mis
cela
neou
s
676
Tran
spor
tcr
ashe
s
Suic
ide
Tube
rcul
osis
Live
r D
isea
ses
Bur
ns
Isch
aem
ic h
eart
dise
ases
Neo
plas
ms
Oth
er I
njur
yca
uses
Uri
nary
Sys
tem
dior
ders
Cer
ebro
vasc
ular
dise
ases
CN
S In
fect
ions
Pneu
mon
ia
Vir
al d
isea
ses
Oth
er C
NS
dise
ases
Mis
cella
neou
s
1348
Live
rD
isea
ses
Isch
aem
ic h
eart
dise
ases
Tube
rcul
osis
Tran
spor
t cr
ashe
s
Neo
plas
ms
Cer
ebro
vasc
ular
dise
ases
Dia
bete
s M
ellit
us
Suic
ide
Hyp
erte
nsiv
edi
seas
es
Oth
er I
njur
yC
ause
s
Pulm
onar
y H
eart
Dis
ease
Uri
nary
Sys
tem
Dis
orde
rs
Bur
ns
Vir
al d
isea
ses
Mis
cella
neou
s
1995
Isch
aem
ic h
eart
dise
ases
Live
r D
isea
ses
Neo
plas
ms
Tube
rcul
osis
Dia
bete
s M
ellit
us
Cer
ebro
vasc
ular
dise
ases
Tran
spor
t cr
ashe
s
Hyp
erte
nsiv
edi
seas
es
Pulm
onar
yH
eart
Dis
ease
Uri
nary
Sys
tem
Dis
orde
rs
Low
er r
espi
rato
rydi
seas
es
Suic
ide
Oth
er I
njur
yca
uses
Pneu
mon
ia
Mis
cella
neou
s
2886
Isch
aem
ic h
eart
dise
ases
Neo
plas
ms
Dia
bete
s M
ellit
us
Live
r D
isea
ses
Hyp
erte
nsiv
edi
seas
es
Cer
ebro
vasc
ular
dise
ases
Pulm
onar
yH
eart
Dis
ease
Tube
rcul
osis
Low
er r
espi
rato
rydi
seas
es
Uri
nary
sys
tem
diso
rder
s
Tran
spor
t cr
ashe
s
Pneu
mon
ia
Oth
er d
isea
ses
ofth
e ne
rvou
s sy
stem
Oth
er b
acte
rial
dise
ases
Mis
cella
neou
s
3181
Isch
aem
ic h
eart
dise
ases
Dia
bete
s M
ellit
us
Neo
plas
ms
Hyp
erte
nsiv
edi
seas
es
Cer
ebro
vasc
ular
dise
ases
Low
er r
espi
rato
rydi
seas
es
Pulm
onar
y H
eart
Dis
ease
Uri
nary
Sys
tem
Dis
orde
rs
Live
r D
isea
ses
Pneu
mon
ia
Tube
rcul
osis
Oth
er C
NS
dise
ases
Tran
spor
t cr
ashe
s
Oth
er b
acte
rial
dise
ases
Mis
cella
neou
s
7305
Isch
aem
ic h
eart
dise
ases
Neo
plas
ms
Dia
bete
s M
ellit
us
Live
r D
isea
ses
Hyp
erte
nsiv
edi
seas
es
Cer
ebro
vasc
ular
dise
ases
Tube
rcul
osis
Pulm
onar
yH
eart
Dis
ease
Tran
spor
t cr
ashe
s
Low
er r
espi
rato
rydi
seas
es
Uri
nary
Sys
tem
Dis
orde
rs
Peri
nata
l D
eath
s
Suic
ide
Oth
er in
jury
caus
es
Mis
cella
neou
s
2011
7

25
Sl N
o.0-
4 yr
s5
- 14
yrs
15 -
24
yrs
25 -
34
yrs
35 -
44y
rs45
- 5
4yrs
55 -
64
yrs
Abo
ve 6
5 yr
sTo
tal
1 2 3 4 5 6 7 8 9 10 11 12 13 14 15
Tota
l
Peri
nata
l de
aths
Con
geni
tal
mal
form
atio
ns
Dia
rrho
eal
Dis
ease
s
CN
S in
fect
ions
Vir
al d
isea
ses
Bur
ns
Neo
plas
ms
Oth
er C
NS
dise
ases
Pneu
mon
ia
Tran
spor
t cr
ashe
s
Oth
er I
njur
yca
uses
Tube
rcul
osis
Mal
nutr
itio
n
Rhe
umat
ic H
eart
Dis
ease
Mis
cella
neou
s
521
Tabl
e 9:
Top
15
Lead
ing
Cau
ses
of D
eath
in B
enga
luru
Cit
y :
Fem
ales
Vir
al d
isea
ses
Bur
ns
Neo
plas
ms
Tran
spor
t cr
ashe
s
Dia
rrho
eal
Dis
ease
s
Rhe
umat
icH
eart
Dis
ease
Tube
rcul
osis
Oth
er C
NS
Dis
ease
s
Pneu
mon
ia
Hae
mop
oeit
icD
isor
ders
Con
geni
tal
mal
form
atio
ns
Oth
er b
acte
rial
dise
ases
CN
S in
fect
ions
Mal
aria
Mis
cella
neou
s
Bur
ns
Suic
ide
Mat
erna
l D
eath
s
Tube
rcul
osis
Res
pira
tory
Dis
ease
s
Neo
plas
ms
Live
r D
isea
ses
Rhe
umat
icH
eart
Dis
ease
Tran
spor
t cr
ashe
s
Uri
nary
Sys
tem
Dis
orde
rs
Hae
mop
oeit
icD
isor
ders
Vir
al d
isea
ses
Oth
er I
njur
yC
ause
s
Oth
er b
acte
rial
dise
ases
Mis
cella
neou
s
609
Bur
ns
Suic
ide
Neo
plas
m
Tube
rcul
osis
Res
pira
tory
Dis
ease
s
Mat
erna
l D
eath
s
Isch
aem
ic h
eart
dise
ases
Rhe
umat
iche
art
Dis
ease
Pneu
mon
ia
Dia
bete
s M
ellit
us
Cer
ebro
vasc
ular
dise
ases
Live
r D
isea
ses
Vir
al d
isea
ses
Hae
mop
oeit
icD
isor
ders
Mis
cella
neou
s
780
Neo
plas
ms
Bur
ns
Tube
rcul
osis
Isch
emic
hea
rtdi
seas
es
Live
r D
isea
ses
Dia
bete
s M
ellit
us
Vir
al d
isea
ses
Pneu
mon
ia
Oth
er b
acte
rial
dise
ases
Cer
ebro
vasc
ular
dise
ases
Hyp
erte
nsiv
edi
seas
es
Pulm
onar
y H
eart
Dis
ease
Rhe
umat
ic H
eart
Dis
ease
Uri
nary
Sys
tem
diso
rder
s
Mis
cella
neou
s
727
Neo
plas
ms
Isch
aem
ic h
eart
dise
ases
Dia
bete
s M
ellit
us
Hyp
erte
nsiv
edi
seas
es
Live
r D
isea
ses
Tube
rcul
osis
Cer
ebro
vasc
ular
dise
ases
Pulm
onar
yH
eart
Dis
ease
Uri
nary
Syt
emD
isor
ders
Low
er r
espi
rato
rydi
seas
es
Vir
al d
isea
ses
Bur
ns
Oth
er b
acte
rial
dise
ases
Oth
er C
NS
Dis
ease
s
Mis
cella
neou
s
1314
Neo
plas
ms
Isch
aem
ic h
eart
dise
ases
Dia
bete
s M
ellit
us
Hyp
erte
nsiv
edi
seas
es
Cer
ebro
vasc
ular
dise
ases
Uri
nary
Sys
tem
Dis
orde
rs
Mal
ign
ant
neop
lasm
s of
geni
tour
inar
yor
gan
s
Pulm
onar
y he
art
Dis
ease
Tube
rcul
osis
Low
er r
espi
rato
rydi
seas
es
Live
r D
isea
ses
Pneu
mon
ia
Oth
er b
acte
rial
dise
ases
Oth
er C
ircu
lato
rydi
sord
ers
Mis
cella
neou
s
1663
Isch
aem
ic h
eart
dise
ases
Dia
bete
s M
ellit
us
Hyp
erte
nsiv
edi
seas
es
Neo
plas
ms
Cer
ebro
vasc
ular
dise
ases
Low
er r
espi
rato
rydi
seas
es
Pulm
onar
y H
eart
Dis
ease
Uri
nary
Sys
tem
Dis
orde
rs
Pneu
mon
ia
Oth
er C
NS
Dis
ease
s
Live
r D
isea
ses
Tube
rcul
osis
Dia
rrho
eal
Dis
ease
s
Hae
mop
oeit
icD
isor
ders
Mis
cella
neou
s
5085
Isch
aem
ic h
eart
dise
ases
Neo
plas
ms
Dia
bete
s m
ellit
us
Hyp
erte
nsiv
edi
seas
es
Bur
ns
Cer
ebro
vasc
ular
dise
ases
Pulm
onar
y he
art
Dis
ease
Uri
nary
Sys
tem
Dis
orde
rs
Tube
rcul
osis
Low
er r
espi
rato
rydi
seas
es
Peri
nata
l D
eath
s
Live
r D
isea
ses
Suic
ide
Pneu
mon
ia
Mis
cella
neou
s
1169
4

26 BRSIPP 2009
Figure 11: Comparison of injury deaths using different information sources, 2008
Road accidents19.24%
Poisoning0.07%
Suicides52.79%
Drowning0.69%
Assualt / Homicides5.85%
Other accidental deaths21.37%
Transport Accidents30.84%
Falls1.58%
Burns29.43%
Poisoning1.78%
Suicide21.43%
Assault1.45%
Complications ofMedical or Surgical care
0.07%
Other Injuries13.42%
Police data BBMP data
Deaths (1)
Serious Injuries (20)
Minor Injuries (50)
5000
1,00,000
2,50,0000
Deaths (1)
Serious Injuries (20)
Minor Injuries (50)
1500
30,000
75,000
B3. Rural Injuries
In 2009, there were 4489 injury deaths registeredwith police and 34225 persons were registered instudy centres. With an underreporting of 10 % forinjury deaths, it can be concluded that nearly 5000injury deaths would have occurred in the city during2009. Using conservative figures of 1:20:50, fordeaths to serious injuries to mild injuries in 2009,there were estimated 5000 injury deaths (policedata), nearly 1,00,000 serious and 2,50,000 mildinjuries.
Figure 12: Bengaluru Injury Pyramid, 2009
Brief profile of TumkurTumkur is one of the 27 administrative districts ofKarnataka state, located North-west of Bangaloreat a distance of about 70 kms. The district is boundedby Mandya District in the South; Chitradurga andHassan districts in the West; Chikkamangalore inthe Northeast and Ananthapura District of AndhraPradesh state in the Southeast direction. Tumkur townis the administrative head quarter of the district andis a centre for commercial, business and educationalactivities. It is home to Tumkur University, fourEngineering and a Medical college and otherinstitutions of importance. The district is famousfor its iron ores. It has a population of 2.5million.
The rural component of Road safety and Injuryprevention programme is being carried out inTumkur with the participation of District police,District hospital and Sree Siddhartha MedicalCollege. In 2009, the district police registered a totalof 1309 Injury deaths. Among them, 435 deaths weredue to road crashes, 366 were suicidal deaths and371 were due to other unnatural causes. With a 10% underreporting as seen from earlier studies, it isestimated that there will be 1500 injury deaths in
the district. Injuries are one of the top leading causesof death in this district with a population ofapproximately 2.6 million. Males and femalesaccounted for 770 and 539 deaths, respectively, andonce again, highest number of deaths occurred in15- 44 yrs age group.
In the same period, the medical college hospitalregistered 2165 injured persons in the ER. Usingconservative estimates as reported in earlier sections,it is estimated that there would be 1500 deaths(police data), 30,000 hospitalisations (26180) and75000 minor injuries in 2009. Further details onprofile and pattern of injuries in rural area areprovided in different sections of the report and inthe fact sheet.
Figure 13: Rural Injury pyramid, 2009

27
B4. RTIs and suicides are major injury causesAmong the various causes of injuries, RTIs are aleading cause of deaths and hospitalisations. RTIsaccounted for 31% of deaths as per data of vitalstatistics division, 20% as per police records and62.7% of hospitalisations in Bangalore. In the ruralarea the contribution was 34.4% and 51.5 %,respectively (Fig. 14).
Suicides or Deliberate self harm was the secondleading cause with 1325 deaths (CCRB data) and1509 hospital contacts. The intent is thedifferentiating factor between natural, suicidal andhomicidal deaths and requires skills withinvestigative agencies and systematic documentationand review of events prior to death.
Burns can be accidental, suicidal or homicidal andonce again requires a careful scrutiny of intent. As
per data in table 9, burns were the leading cause ofmortality among women in 15- 24yrs and 25 – 34yrs age groups (BBMP data).
Poisoning due to a variety of substances (commonones being Organophosphorus compounds anddrugs) is a common contributor for suicides. It isimportant to differentiate the intent here to separatesuicidal and accidental (occasional homicidalones).
Even though work related / occupational injuriesare quite common, their contributions for deaths werenot exactly available in the official reports.
There were no major disasters that contributedfor deaths and injuries during the year 2009 in thecity.
Figure 14: Comparison of the distribution of causes of injury deaths in urban and rural areas 2009
RuralUrban
Poisoning14.96%
Drowning13.06%
Hanging12.51%Work place injury
0.55%
Others14.89%
Road Traffic Injury34.44%
Fall2.14%
Assault/Violence0.08%
Burns7.36%
Transport Accidents30.84%
Falls1.58%
Burns29.43%
Poisoning1.78%
Suicide21.43%
Assault1.45%
Complications ofMedical or Surgical care
0.07%
Other Injuries13.42%
Fatal Injuries
Road trafficinjury
62.70%
Fall17.30%
Assault7.40%
Poisoning4.20%
Animal bites4%
Fall of object1.80%
Others2.70%
Road traffic injury51.50%
Animal bites4.70%
Fall of object2.00%
Others3.20% Fall
5.00%
Assault19.40%
Burns2.20%
Poisoning12.00%
Non-fatal Injuries

28 BRSIPP 2009
B5. Injuries affect young peopleIn comparison to communicable diseases whichprimarily affect children, and NCDs affecting latemiddle aged and elderly people, injuries are a problemof young people. Sixty five percent of deaths (BBMP)and 66.9 % of hospitalisations occurred in the agegroup of 15 – 44 years. Men accounted for 64.17% ofdeaths and 79.9 % of hospitalisations, while womencontributed for 35.83% deaths and 20.1.% ofhospitalisations, respectively. In rural areas, thedistribution was almost similar with increasedoccurrence among men and in younger age groups.There are several reasons for preponderance of injuriesamong young people and in men and are linked tosocial, cultural, psychological, biological,
environmental, product / vehicle related reasons. Therisk taking nature of young people coupled with typeof products and vehicles and the environment theyare use add for their injury predilection.
Irrespective of data sources, nature of injuries, or injurycauses, the data highlight that young people in 15 –44 years are affected most in injuries (Fig. 15). This is a major difference in comparisonwith causes of deaths and hospitalisations. This isalso a specific reason as to why road safety and injuryprevention should be given importance as youngpeople are most vital for any family and any society.
Figure 15: Age -sex distribution of injuries (%)
Fatal InjuriesUrban Rural
Suicide Burns
Non-fatal InjuriesUrban Rural
Road Traffic InjuriesFatal Non-Fatal

29
Usually, injuries follow a trimodal distribution, withdeaths occurring soon after a crash or an injury, fewduring transfer to hospital and others after admissionto the hospital. Some deaths occur as latecomplications of injury after discharge from thehospital. The precise proportion of these deaths varyas per cause and are influenced by many factors likeage , sex, nature and type of injury, availability ofcare, level of safety policies and a number of otherfactors.
Data from rural part of surveillance programme inTumkur revealed that almost half of the deathsoccurred at the injury/crash site.
Among RTI deaths in Bengaluru, 38 % of victims diedat the crash site, 11 % during transport to hospital and51 % in the hospital. Less than a % died soon afterdischarge. Among BMTC crashes, nearly half (45.4%)died at the spot, 7.4% before reaching hospital and47.2% in the hospital. In rural areas, nearly half diedat site soon after injury (Fig. 16).
B6. Injury deaths are distributed in phases
Figure 16: Place of Death (%)
RTI deaths in Bengaluru Injury Deaths in Tumkur BMTC crashes
On thespot45.4
On theway to
hospital7.4
In the hospital47.2
At injurysite53.1
During transport to hospital16.6
In thehospital
11.3
Afterdischarge
19At crashsite38
During transport to hospital11
In thehospital
51
In 2009, there were 754 road deaths as reported bypolice sources. Discrepancies in deaths between policesources and BBMP vital statistics division sourcescould probably be due to different data sources andmethods of reporting. Attempts will be made towardsreconciliation of these differences in the year 2010. Itis known that late deaths that occur due tocomplications of RTIs are neither reported in policeor vital statistics reports as the associated or underlyingcauses of injury deaths are not mentioned in both.These deaths would have occurred beyond the 30 dayreporting time required for RTIs as per legaldefinitions. A study undertaken by NIMHANS onTraumatic Brain Injuries in 2005 revealed that 13%of brain injuries (mostly due to RTIs) had died within12 months of hospital discharge (based on domiciliaryfollow up visits) (29). Applying these figures for theyear 2009, it is estimated that the city would have anestimated 852 deaths due to RTIs.
With regard to nonfatal injuries, data was availablefrom 21207 hospital contact RTI patients. The data
collection from 3 large hospitals was limited in 2009due to administrative and resource contacts and thesame 3 hospitals contributed nearly 18,000 RTIpatients in 2008. With the assumption that probablysame number of patients would have sought care in2009 ( with variations, of course), the estimatednumbers would be in the range of 40,000 RTI patientsin 2009 due to RTIs in the city of Bengaluru.
The situation in rural areas could be far moredifferent due to poor documentation of events. InTumkur district, there were 435 reported deaths due
B7. Road crashes, deaths and hospitalisations
Figure 17 : Trend of Road deaths in Bengaluru

30 BRSIPP 2009
to RTIs in 2009. Using similar methods of estimation,it is estimated that the district would have witnessednearly 500 deaths and 10,000 hospital contacts dueto road crashes in 2009.
For the 2nd consecutive year, the city recorded adecline in registered RTI deaths from 961 in 2007 to754 in 2009. Reasons for this could be several andidentifying them would be guesswork as relativecontributions are difficult to establish. Somecontributing factors could be increasing enforcementfrom city police, increasing traffic congestion dueto addition of 348,707 vehicles, separation of trafficin roads with new medians (however, there werenot many crashes in these areas earlier also), ongoinginfrastructure expansion and traffic blocks due tometro works in many parts of city ,or could simplybe a partial effect of economic recession (it isacknowledged that economic recession reduces riskof exposure as people travel less during these times.Apart from increasing enforcement (greatercommitment and training of all police personnel),there were no other visible interventions in the cityin the year. The trends need to be observed for thecoming years to make clear conclusions.
B7.1. Crashes had a pattern as perlocations
The city has 39 police station subdivisions spreadover an area of 800 sq. km. Data revealed thathighest number of fatal crashes occurred in 10 areas,accounting for 48% of total fatal RTIs. Thedistribution was similar across months and, in all12 months, these top 10 areas remained high in theranking (Fig. 18 and Table 10).
Further analysis revealed that within each of theseareas, specific roads which are connecting tonational or state highways accounted for 54% offatal crashes. In the case of Madivala with 55 deaths,Hosur road had recorded 32 deaths. Similarly, inByatarayanapura, of the 53 deaths, 28 deaths wereon Mysore road. In Yelahanka, 23 of the 39 deathswere on Bellary road. All these roads in the aboveexamples are entry and exit stretches of nationaland state highways with greater movement of goodsvehicles, traffic and people. In all other areas, RTIswere spread out in different locations, moving fromplace to place in a non-random method (Fig. 18).
The surveillance data using epidemiological analysishas identified geographical areas with high fatalcrashes. Further analysis is required to see anyspecific clustering of crashes on these roads as theaverage length of each road in city boundary limitsis 20 ( +/- 5) kms. Most of the people killed onthese roads were pedestrians and two wheeler driversand were hit by buses or trucks. Microanalysis ofcrash patterns will be taken up in these 10 areasduring 2010 on a prospective basis.
While accident black spots are generally knownto shift from location to location over time, areawide traffic calming measures need to beconsidered by authorities. In general, it needs tobe seen whether a combination of engineering /traffic calming measures, increased enforcement,stationing of ambulance at strategic locations,combined with greater road safety awareness inthese areas will help reducing crashes. Somepossible options include traffic separation, saferfootpaths and crossing facilities, increasing roadand vehicle visibility, speed control, augmentedprogrammes on drink drive - helmets andseatbelts, placement of ambulances at strategiclocations and others. All these can be includedand developed as “Area wise traffic and road safetyprogrammes “with integration of activities.
B7.2. Vulnerable road users areaffected most
Findings from different studies in India have indicatedthat pedestrians, two wheeler drivers and pillionsand bicyclists are involved in large number of crashesin India (3,4,5). Data from BRSIPP once againconfirm this finding for Bengaluru. In 2009, 350pedestrians, 198 two wheeler riders, 92 two wheelerpillions and 36 bicyclists lost their lives in crashes.These 3 groups, in total, contributed for76 % of total road deaths. Figure 19 shows therelative contributions of different road user categoriesin urban and rural areas for both fatal and non-fatal RTIs.
Among nonfatal injuries, the distribution remainedsimilar with the vulnerable road users accountingfor 81.3% of total hospital registrations due to RTIs.The distribution across hospitals was differentdepending on the total volume of trauma patients.

31
In the nearby rural area of Tumkur, crashes thoughlesser in numbers, resulted in greater number ofdeaths among VRUs. Nearly, 121 pedestrians, 110two wheeler drivers, 36 pillions and 16 bicyclistswere killed in crashes. The hospital data also showed
similar distribution with a preponderance of deathsand injuries among VRUs.
Integrated strategies for reducing deaths andinjuries among VRUs need to be considered byauthorities.
Figure 18a: Fatal crashes in different traffic police station limits, 2009
Figure 18b: Distribution of Fatal RTIs along with approximate speed limits

32 BRSIPP 2009
Sl N
oA
rea
Tota
lD
eath
s20
08
Tota
lD
eath
s20
09M
ajor
Roa
ds
Tota
lPe
dest
rian
sTw
oW
heel
ers
Cyc
list
sC
arD
rive
rsLo
rry
Dri
vers
Oth
ers
1B
yata
raya
napu
ra4
85
6M
ysor
e R
oad
28
23
24
10
44
Ken
geri
Rin
g R
oad
5N
ice
Roa
d6
80Fe
et R
oad
4O
ther
s1
32
Mad
ival
a5
65
5H
osur
Roa
d3
22
82
33
10
0R
ing
Roa
d1
3O
ther
s1
03
K.R
. Pur
am9
84
0O
ld M
adra
s R
oad
12
12
24
12
01
Rin
g R
oad
11
ITPL
Roa
d3
Oth
ers
14
4Ye
laha
nka
45
39
Bel
lary
Roa
d2
32
01
22
20
3D
odda
balla
pur
Roa
d9
Oth
ers
75
Elec
tron
ic C
ity
37
Hos
ur R
oad
18
19
12
22
02
Kon
ena
Agr
ahar
a ga
te6
Oth
ers
13
6Ye
shw
anta
pura
49
30
Tum
kur
Roa
d1
11
51
30
02
Jala
halli
7H
MT
Mai
n R
oad
5O
ther
s7
7D
evan
ahal
li2
8B
ella
ry R
oad
19
15
10
01
11
Oth
ers
98
Peen
ya5
02
5Tu
mku
r R
oad
12
71
13
00
4H
esar
agha
tta
Roa
d3
Oth
ers
10
9B
anas
awad
i3
22
4R
ing
Roa
d7
13
81
00
2O
ld M
adra
s R
oad
4O
ther
s1
31
0M
ico
Layo
ut2
62
4B
anne
rgha
tta
Roa
d8
11
92
10
1B
TM L
ayou
t5
Hos
ur R
oad
3O
ther
s8
Tabl
e 10
: L
ocat
ion
of
cras
hes
in
hig
h r
isk
area
s of
Ban
galo
re

33
Figure 19: Road User categories in RTI deaths and injuries (%), 2009
UrbanFatal Non-fatal
RuralFatal Non-fatal

34 BRSIPP 2009
Figure 21 : Pedestrian Crash location (%)
Urban Rural
Figure 22 : Pedestrian activity at the time of crash (%)
Urban Rural
B7.3. Crash patterns, characteristicsand impact determine outcome
B7.3.1 Pedestrian crashesThe presence of heterogeneous traffic environmentresults in a variety of crashes in both urban andrural areas. Examination of crash patterns amongpedestrians reveal that in both urban and rural areasand among fatal and nonfatal crashes, collision ofpedestrians with two wheelers was the commonestpattern. Heavy vehicles like buses and trucks had
Figure 20 : Colliding vehicle with Pedestrians (%)
Fatal Non-Fatal
Cycle, 0.6Unknown
7.2
4 Wheeler, 7.1
2 wheeler46.6
Autorikshaw, 10
Car, 12.9Jeep, 0.7Van, 2.4
Truck, 4.2Bus, 7.2
Tractor, 1.1
2 wheeler21.5
4 wheeler30.6
Auto, 3.3Bus, 5
Car, 5
Jeep, 1.7
Tractor, 8.3
Truck, 6.6
Unknow, 18.2
Unknown, 3.6 4 wheeler, 4.1
2 wheeler58.5
Autorikshaw, 11.8
Car, 11.3
Jeep, 0.5
Van, 0.5
Truck, 6.7
Bus, 2.6Tractor, 0.5
collided 1/3rd of urban and 1/5th of rural crashesthat resulted in deaths. 1/4th of fatal crashes weredue to involvement of two wheeler vehicles. Carswere significantly higher in urban areas (24% v/s5%). However, in nearly half of nonfatal RTIs, twowheelers were commonly involved. Further, majorityof deaths occurred when crashes took place onstraight roads while the person was walking orcrossing the road (figure 20, 21 & 22) combinedwith greater speeds. The outcome will be negativein majority of crashes.
Urban
Fatal Non-Fatal
Rural
Car23
Bus20
Lorry, 14
Auto6
2 Wheeler24
Others, 3
Van, 8 Unknown, 2

35
B7.3.2 Two wheeler crashesSimilarly, two wheeler crashes involved collision withheavy and medium sized vehicles in 52% of urbandeaths, while, the same was nearly 60% in ruralcrashes. The involvement of two wheeler vehicles
was correspondingly higher in nonfatal injuries asshown in figure 23. Most of the two wheeler crashesoccurred on straight roads in urban areas, whilethis was not clearly known in rural areas (figure 24& 25).
Figure 23 : Colliding vehicle with two wheelers (%)
Fatal Non-FatalUrban
Fatal Non-FatalRural
Figure 24 : Two wheeler Crash location (%)
Urban Rural
Figure 25 : Two wheeler driving manoeuvre at crash time (%)
Urban Rural
Car, 12.95
Bus, 14.75
Lorry, 25.54
2 wheeler, 11.87
unknown vehicle, 25.54
Van, 6.47
Others, 2.82 Cycle, 0.4
Car, 14.8
Jeep, 0.8
Van, 2.7
Truck, 8.1
Bus, 6.2
Tractor, 1.6
Crane, 0.14 wheeler, 12.5
Animal drawnvehicle, 0.1
2 wheeler40
Autorikshaw, 8.4
2 wheeler, 28.08
4 wheeler43.84
Auto, 4.79
Bus, 2.05
Others, 1.36
Tractor, 2.74
Truck, 13.7
Unknown, 3.42Cycle, 1
Unknown, 3.4
Jeep, 2.4
Van, 2.4
Truck, 11.7
Bus, 7.8
Tractor, 4.4
4 wheeler, 1.5Animal drawn
vehicle, 2
2 wheeler38
Autorikshaw12.2
Car, 13.2

36 BRSIPP 2009
B8.1 HelmetsTwo wheelers have increased significantly on theroads of Bengaluru in the last decade (Fig. 27).Increase in two wheeler vehicles are primarily dueto its ease of driving, easy availability, greater incomelevels of people, media promotion and inability toafford cars. Among two wheeler riders, injury tohead and face was seen in 79% and 28% of deathsrespectively, while 80% and 26 % of pillions hadsimilar injuries. Injuries to brain and facial organs
B8. Risk factor informationare a common cause of deaths within this group.
Figure 26: Fatal and non-fatal crashes (resulting in serious injuries) invloving BMTC buses, 2000-2009
Fatal Non-fatal
These observations clearly indicate that safety ofVRUs should be given importance on Indian roads.Even as the proportion of car users continues toincrease, two wheelers are still going to occupy thetop slot in MV registrations for many more years tocome with the current rate of economic growth.Walking and cycling will remain important andessential modes of travel and safety and health ofthese groups needs to be ensured. The safety of thesegroups should be seen as vital in urban roads, onhighways and in rural parts of India. Road / vehiclesafety aspects and enforcement of road safetyregulations need to be given high importance apartfrom targeted education of these groups.
B7.4. Safety of Public Transport systems
Amidst a large number of vehicles on the streets ofBengaluru, Public and private buses play a crucialrole in transport of people and goods both withinand outside the city. The Bangalore MetropolitanTransport Corporation plays a central role andtransports millions of people every day.
In 2008, the available data was collected from BMTCrecords and a preliminary survey was completed.
Based on the findings of the study, a preliminaryreport was submitted along with recommendationsfor improving safety scenario.
In 2009, data collection mechanisms werestrengthened and improved. The data collection wasundertaken comprehensively for the period2007 – 09 and a total of 293 records were analysed.Data collection was done by a trained researchofficer from the CC as staff was not available withinBMTC for this activity. A redesigned and validatedproforma was finalised in consultation with BMTCstaff. Data was collected from available records andeach record was totally reviewed in a systematicway and specific information was transferred to theforms. The collected data was analysed usingEPI – INFO. The trend of BMTC fatal bus crashes isshown in Figure 26.
A comprehensive report highlighting the crashpatterns of BMTC buses has been completed and ispending acceptance and approval by the authorities(available on request). The report has severalrecommendations aimed at improving safetyperformance of buses.
Figure 27: Growth of Two-wheelers in Bengaluru

37
Use of helmets is an established method for reducingbrain injury related deaths and injuries. A helmetprimarily reduces the impact of the collision andthereby consequent injury to the brain by (30)
Acting as a mechanical barrier between theskull and the impacting object.Reducing the deceleration of the skull, andhence the brain movement.Providing a cushioning effect through thepadding thermocole lining which absorbs theimpact and brings the head to a halt slowly.Spreading the force of the impact to a largerarea so that energy is distributed through theouter shell of a helmet.The shell also protects against penetration ofthe skull by any sharp pointed objects.Keeping the helmet on the head in a crashthrough chinstraps.
Figure 28 : Two-wheeler deaths in
Bangalore (1996-2009)
Karnataka introduced partial helmet legislation (inselect cities and only for riders) on November 6,2006. The Karnataka Motor Vehicles rules, 1989Rule: 230 stipulates that every person while drivingor riding a motor cycle of any type, that is to say,motor-cycles, scooters and mopeds shall wearprotective headgear of such quality which will reducehead injuries to riders of two-wheeler resulting fromhead impacts. In addition, it also highlights thathelmets should confirm to standards and should alsocarry reflective tapes of 2 x 13cms to increasevisibility.
Our data show that the current use of helmets withinthe city has gone up from less than 10 %prelegislation to between 60 – 70 % post legislation.The usage rates vary in different parts of the cityand also according to day and time and are subjectto levels of enforcement. The usage rates in
peripheral parts of city ( on ring roads, residentialareas, on highways ), during weekends, at night timesare low compared to central – business areas due tovarying levels of enforcement (Fig. 29).
Figure 29: Helmet usage among fatal and
non-fatal RTIs
Examining helmet use rates among dead and injuredpeople, though not a good measure, still indicatesand helps in establishing the efficacy andeffectiveness of helmets among those with differentlevels of injury severity. Data showed that amongthe killed and hospitalised, only 44% and 51% hadworn helmets at the time of crash. Among the fatalRTIs in Tumkur district, only 8 % of the two wheelerriders had used helmets. More data is required ontype, nature and wearing pattern to clearlyunderstand people’s practices and helps in educationprogrammes. Recently, an independent study on“prevalence of non-standard helmet use “has beencompleted and data analysis is in progress.
Enforcement by police for violator’s not using helmetshas been stepped up in the last 2 years as indicatedby the number of people booked for violations (Fig.30). The number of people booked for not wearinghelmets has remained around 2,00,000 cases peryear along with an increase in fine amount in recentdays from Rs.100 to Rs.500 in the same period.
Figure 30: Cases Booked by the Bangalore city
police for not using helmets

38 BRSIPP 2009
There is need to strengthen helmet legislation andenforcement for all riders in the city and state toderive good protection from helmets. Targetededucation of road users with increased enforcementwill strengthen the helmet usage practice. Researchis underway to make helmets more convenient andeasy to use at Indian Institute of Technology in NewDelhi.
B8.2 Drinking and drivingAlcohol consumption, even in relatively smallamounts, increases the risk of being involved incrashes. People under alcohol influence not only injurethemselves, but are likely to injure and kill others.Alcohol is also a major risk factor for falls, suicides,violence, child abuse, and others. Consumption ofalcohol leads to poor judgment, slow reaction,delayed reflexes, poor visual attention, impropercoordination, difficulties in identifying dangers on
roads, and thus affects driving performance. Alcoholbrings in a pseudo euphoric effect making the personless inhibitive, consequently resulting in higherspeeds and non-adherence to safe behaviour onroads. Studies have shown that the severity andimpact of injuries are higher, deaths are more, anddisabilities are greater when alcohol is involved incrashes (31)
As per the Central Motor Vehicles Act, 1988 Sec 185:Whoever, while driving, or attempting to drive, amotor vehicle, has in his blood, alcohol exceeding30 mg. per 100 ml. of blood detected in a test by abreathalyser, or is under this influence of a drug tosuch an extent as to be incapable of exercising propercontrol over the vehicle, shall be punishable for thefirst offence with imprisonment for a term whichmay extend to six months, or with fine which mayextend to Rs.2000, or with both; and for a second or
Figure 31: Alcohol use among Fatal and Non-fatal RTIs, 2009
Fatal Non-fatal
Fatal Non-fatal
Urban
Yes, 3.74%
No, 47.33%
Not known48.93%
Injured, 22.08%
Counterpart1.58%
Both, 0.16%No, 76.18%
Rural
Yes, 16.67%
No, 30.95%
Not known52.38%
Injured, 20.49%
Both, 1.95%No
63.41%
Counterpart1.95%
Unknown, 12.20%
Figure 32: Alcohol from previous studies Figure 33: Trend of Drunken Driving cases bookedby the Bangalore City Police

39
Recommendations of 2008 National Consultation onreducing drinking & driving in India
Capacity strengthening of policy makersStrengthening data collection systemsUp scaling enforcement activitiesRevision of existing lawsGuidelines for drivers and service industryUniform guidelines on age, timing and locationScreening for alcohol in emergency rooms ofhospitalsMandatory testing in fatal crashesCo-ordinated activitiesFormulating policies and programmes
It is important to target implementation andenforcement of drink drive laws at
males in 18 - 45 years,teenage drivers,two wheeler - car - heavy vehicle drivers andthose driving during 8 p.m. - 12 midnightperipheral, outer city areas and on highways.
B8.3 Seat belt useCar drivers and passengers can get injured in crashesas the driver may collide with vehicle in front, mayhit a stationary object, may be hit by vehicles fromback or may suddenly apply brakes in traffic. In allthese crashes, the driver and passengers are thrownforwards or in other directions and can sustaininjuries to head, chest and abdominal organs. A seatbelt is a safety harness designed to keep the occupantof a vehicle inside the vehicle and in place byreducing / minimizing rapid movements that occursoon after a crash. Seat belts reduce injuries bystopping the driver from hitting interior objects andpassengers in the cars and by preventing the driver /passenger from being thrown out of the vehicle. Seatbelts also distribute the forces of rapid decelerationover larger and stronger parts of the body, such asthe chest, hips, and shoulders. The seat belt slowdown the body movement by stretching slightly andholds the occupant in the same position by keeping
subsequent offence, if committed within three yearsof the commission of the previous similar offence,with imprisonment for a term which may extend totwo years, or with fine which may extend to Rs.3000,or with both.
Data from BRSIPP show that, among road deathsthat occurred in 2009, 4% of road crashes were linkedto alcohol use among the dead person. In 5 % ofcases alcohol involvement was found in the driverof the colliding vehicle (Fig. 31). There could be agross underreporting of alcohol involvement in roaddeaths as alcohol levels are not measured in eachand every case. Similarly, among hospitalisedindividuals, alcohol was seen in 22 % of injuredpersons. This is an improvement from nil recordingin 2008 to selective documentation (probably due totraining of people in police and hospitals). However,this data is still inaccurate as previous studies haveshown that nearly a third of crashes occur during 8pm – 6 am, and a third of these are linked to alcohol(Fig. 32) (32). The presence of alcohol in both policeand medical records are underreported due to severalreasons, with prominent ones being medico legalbarriers and issues linked to compensation. If alcoholis involved in crashes, and if police and doctorsdocument the same, the courts often ask for evidenceas physical certification is not accepted as evidence.As blood and breath alcohol tests are not routinelydone in both, police and doctors cannot provideevidence and hence, do not document the same.Further, families do not receive any compensation ifthere is alcohol involvement. Thus, in order to helpfamilies of injured and killed, alcohol is not routinelyentered into records. This calls for changes in legalsystem to allow documentation and to delink thesame from legal issues and to encourage mandatorydocumentation in records. In the rural area thealcohol use among those fatally injured was nearly2% but the alcohol use in the driver of the collidingvehicle was 17%.
The implementation of drink driving laws has beenstepped up since 2007 as seen by increasing numberof convictions in this period (Fig. 33). The numberof convictions has gone up from 27644 in 2007 to33241 in 2009. Despite the increase in enforcement,it is well acknowledged that drinking and drivingstill remains a major problem.
Figure 34: Growth of Motorcars in Bengaluru

40 BRSIPP 2009
him / her in their seat and hence, will not be thrownaround during a crash (33).
stricter enforcements and systematic educationprogrammes to increase seat belt use.
B8.4 SpeedFigure 35: Seat Belt Use among Fatal and
Non-fatal RTIS in Bengaluru
Figure 36: Trend of Seat belt cases
booked by the Bangalore city police
The Central Motor Vehicles rules, 1989 as amendedby The Central Motor Vehicles (first amendment) rules2003 stipulates that all cars manufactured after 1998shall be fitted with seatbelt and should be in conformitywith AIS:005-2000 and AIS:015_2000 specifications.However, as in other areas, enforcement is left withstates and enforcement has been far from satisfactory.The status of implementation of seat belt law revealsthat only few have been penalized for not wearingseat belts and the fine is just Rs.100.
Despite the availability of seat belts in India for sometime, the usage has been abysmally low. There areno population based surveys done till date to see theuse, but is estimated to be less than 10 %. No effortshave been made for education of car drivers, evenwhen seat belts are available. Data from BRSIPPreveal that among the fatal RTIs, none of the cardrivers were wearing seat belts at the time of crash.Among those hospitalised, 21.9% of car drivers and11.7% of the car occupants were wearing the seatbelt.
The enforcement of seat belt laws has recently gainedmomentum in Bangalore. The number of casesbooked for not wearing seatbelts has increased from636 In 2007 to 780 by 2009. There is a need for
Figure 37: Effect of Speed
Excessive speed and associated behaviours likeovertaking (from wrong direction) are key riskfactors in road crashes. Generally crashes occurringat higher speeds, result in greater generation andtransfer of mechanical energy to the affected person;when this exceeds the physiological tolerance of theindividual, it results in damage to body organs. Thelevel of damage to the body is influenced by theshape and rigidity of the colliding object along withvelocity of the impact. Every increase in mean speedlevels by 5% leads to approximately a 10% increasein all injury crashes and a 20% increase in fatalcrashes (Fig. 37) (34).
Some common reasons for increasing speeds are -covering the required distance in shorter period oftime, increasing productivity and greater returns,fun and pleasure seeking, good condition of roads,availability of fast moving vehicles, false perceptionson safety, traffic conditions, enforcement practiceson speed limits and knowledge and practice of roadusers. Young drivers are more likely to speed andend up in crashes, resulting in more deaths andhospitalisations.
The BRSIPP data has not included measurement ofspeeds and linkage to crashes, as it is only asurveillance programme and not a crash analysisstudy. Our efforts to identify this in police recordshave had limited success. However, a few datapointers indicate the presence and association ofspeed as a major factor.

41
Anecdotal reports and media news itemscovered soon after a crash indicate thatmajority of crashes occurred when movingvehicles were in high speed.Most of the deaths occurred in peripheral partsof city, ring roads and on highways, where roadsare in good condition and high speeds arecommon.91% of crashes occurred on straight roads andmajority of these were separated roads.89% of deaths occurred when visibility wasgood.8% were head on collisions and 19% were rearend collisions.
The condition of vehicles was not known asthis data comes from motor vehicle inspectionsafter crash.
The IMV act has stipulations on speed managementand implementation of these has been poor due tolack of resources and technology with enforcementagencies.
Experience of many countries indicate that mobilityand safety needs to go together to save lives of people.Classifying roads based on purpose and fixingappropriate speed limits, appropriate and visiblesignage’s, staggering traffic flow, speed warning
THE MOTOR VEHICLES ACT, 1988
NOTIFICATION
No. TRD 16 TDK 2005, Bangalore, dated 10th May, 2005
Karnataka Gazette, Extraordinary No. 1042, dated 28-5-2005
In exercise of the powers conferred by sub-section (2) of Section 112 of the Motor Vehicles Act, 1988(Central Act 59 of 1988), the Government of Karnataka – is satisfied that it is necessary to restrictthe speed of motor vehicles specified in column (2), of the table below in the interest of public safetyor convenience or because of the nature of the road or bridge hereby fixes the maximum andminimum speed limits specified in column (3) thereof.
Sl. No. Class of Motor Vehicle Maximum speed per hour in km.(1) (2) (3)
Near Ghat In the city All otherEducational Roads limits of placesInstitutions Bangalore,
Mysore,Mangalore,Hubli-Dharwad,Belgaum andGulbarga
1. If all the wheels of thevehicles are fitted withpneumatic tyres and theVehicle is not drawing a(a) Motor-car 25 40 40 70 to 90 on
NationalHighways
(b) Motor-cycle 25 40 40 50
(c) Autorickshaw 25 30 30 40
(d) Light Motor Vehicle other than a transport vehicle 25 40 40 60
(e) Light Motor Vehicle arid, a transport vehicle 25 40 40 60
(f) Medium or Heavy Passenger Motor Vehicle 15 35 35 60
(g) Medium or Heavy Goods vehicles 15 35 35 60

42 BRSIPP 2009
Figure 38: Trend of Overspeeding cases booked bythe Bangalore City police
Figure 39: Fine collected Under the Indian MotorVehicle Act by the Bangalore City Police
B9. Solutions and strategies for road safetyFor a long time, it was believed that road crashesand injuries are accidents and hence, cannot bereduced. Years of research and implementation ofsafety programmes demonstrated that it is possibleto reduce road crashes. With improvements inunderstanding human behaviour and the way peoplebehave on roads and in vehicles, a safe systemsapproach has evolved in recent years. Severalcountermeasures in road engineering, safe design ofroads and highways, vehicle safety, increasedenforcement of helmet - drink drive - seat belts- childrestraints laws , effective speed managementstrategies, adequate trauma care and others haveplayed a key role in road crashes. These have beenput in place through engineering, legislation andenforcement, education and timely trauma carestrategies in different ways. The past few years havealso shown what works and what does not work inroad safety.
Need for revision of IMV Act.Under the Indian Motor Vehicles Act of 1988, severalroad safety laws have been formulated and areimplemented at the local levels by police andtransport authorities. These were formulated severalyears back, when transport scenario was different.With increase in road crashes and addition of hugenumber of vehicles, there is need for revision.Recognising this need, recently the Ministry of Roadtransport and highways is in the process of revisingthese laws and the process has been set in motion.
There is need to modify / amend regulations in theareas of driver licensing systems, age of driving,speeding, use of helmets, dangerous driving, racingon roads, drinking and driving, Use of drugs anddriving, use of seat belts, use of cell phones whiledriving, child restraints, visibility, obeying trafficrules, carrying excess people on vehicles, disabilities
signs, speed controlled elevated pedestrian crossingfacilities, speed humps at strategic locations,restricting speeds at entrance and exit to heavy trafficgenerators, developing roundabouts, separation ofvulnerable road users through fencing, medians,footpath etc., monitoring speeds through speedcameras are some examples in managing speeds.Several intelligent transport systems incorporatingelements of speed control and adaptation in differentsettings have been seen in many parts of world.Combined with enforcement strategies likeformulating road rules and speed limitations, use ofspeed cameras, automated enforcement systems,appropriate penalties for violations and others arehighly effective. Increasing public awareness and
improving compliance towards speed restrictions isan important activity, requiring education to publicthrough campaigns and public educationprogrammes on speed reduction.
Despite limitations of resources, the city police havestepped up enforcement as seen by an increase inbooking violators in different places. With the helpof interceptors and speed surveillance cameras incertain locations, 2009 saw an increase in catchingviolators to the tune of 55189 Offences. Manyengineering technologies in both vehicles androads can pay greater dividend bringingautomatic compliance from the road users (Figs. 38and 39).

43
and driving, health status of drivers, fatigue andsleeplessness, emergency care, safety rights ofpedestrians and crash (accident) reporting andinvestigation systems.
Specifically with regard to road safety, there is anurgent need to revise laws in conformity with nationalrequirements and based on international experiences.These revisions need to keep in mind the possiblechanges likely to occur in the coming years with inbuiltprovisions for periodical amendments.
With the data available from BRSIPP and othernational studies, inputs have been provided for theexpert committee to facilitate required changes. Theset of recommendations and the proposal submittedis given in annexures 2.
Most importantly, since the laws and revisions areintended to make people safe and reduce road deathsand injuries, it is essential to monitor and evaluatethe impact of these laws in the coming days.
B10. FallsEstimated deaths: 500; serious injuries:10,000
Falls commonly occur in homes, schools, constructionsites, roads, public places, and are an importantcause of deaths and disabilities. A “fall at aconstruction site” can result in instantaneous deathfor the worker, while a “simple fall from a chair”can turn out to be a life long disabling condition forthe injured person.
In 2008, there were 147 fall deaths as permortality data from the vital statistics divisionof BBMP. Many of these deaths occurred in15-34 yrs age group and males predominatedfemales. Actual numbers could be higher asonly smaller number of institutions could havereported precise cause of deaths.The number of fall deaths as per CCRB reportsfor the year 2009 was 93. Once again, thesenumbers could be much higher as onlyunnatural and medico legal cases are reportedto CCRB. In the same year, there were 5837patients brought to hospitals due to fall injury.
In both fatal and non-fatal injuries, males accountedfor 80% of falls (ratio of 4:1 between men andwomen). In the non-fatal injuries, women in younger(<15 yrs) and elderly age groups were representedin higher numbers compared to men. Nearly 24.3%and 10.5%of the hospitalisations were in childrenand elderly respectively (Fig 40).
The data from hospitals indicate that home (44%)was the commonest place of occurrence of fallsfollowed by roads (23%). Almost half (51%) of thepatients who sustained falls had a moderate to severe
type of injury. Majority of these patients (87%) wereeither admitted for medical and surgical care orreferred to another centre for treatment.
Figure 40 : Age Sex distribution of Falls -Non-fatal
Dr. Pallavi Sarji, in her M.D., thesis at the M.S.Ramaiah Medical college, observed that falls werethe highest among the very young (<4 yrs and veryold (>75 yrs). 25% of the child hood injuries werefalls, with the common place of occurrence beinghome followed by schools. (35)
In another study on domestic injuries by Dr. Ashokfor his M.D., in community Medicine, observed thatfalls (39.5%) were the most common cause ofdomestic injuries followed by burns. The age groupof 15 – 44 yrs was involved in maximum number ofdomestic injuries. Slippery floors were found morein households reporting these accidents. (36)
Prevention of falls requires in-depth analyticalresearch to clearly delineate individual –environmental and responsible product role inunderstanding risk factors. Improving awarenesslevels among household members, eliminatingslippery floors and improving health of elderly canreduce falls among elderly, while better supervisionof children by parents can help children.

44 BRSIPP 2009
B11. SuicidesEstimated deaths: 2,500; attemptedsuicides: 25,000
Information on Intentional self harm or suicides datawas collected from BBMP vital statistics division,office of the city crime records bureau and fromparticipating hospitals.
In 2007, there were 2429 completed suicides asregistered by police and 5328 attempted suicidesregistered in 21 hospitals. After excluding undefinedcategories the ratio of completed to attemptedsuicides was found to be 1: 6.
In 2009, there were 2374 completed suicides as perCCRB data and included hanging and poisoning.Even though data is received from CCRB, theclassification based on intent and mechanisms arenot scientifically done and there are some observeddiscrepancies in total numbers. Detailed data onsuicidal deaths was not available from police recordsdue to administrative and procedural difficulties.
Using figures from previous population based surveys,it is estimated that the city has on an average 2500completed suicides and 25,000 attempted suicides.Number of persons harbouring suicidal ideations islikely to be much larger and can only be guestimates.
The available data provided from 1703 attemptedsuicides is a reflection of profile and patterns andcaution has to be exercised in extrapolating thesefigures to the larger population.
Nearly 78% of attempted suicides occured inyounger age groups of 15-39 years. Womenoutnumbered men in early age groups of15-29 years (Fig 41).
Figure 41 : Age Sex distribution of attempted
suicides
Nearly 85 % of attempted suicides were firstrecognised by family members and werebrought to hospitals.More than 90 % of suicides were amongresidents of the city.Using education and occupation as proxyindicators, it was observed that 2 / 3rd ofsuicides occurred in poor and middle incomehouseholds.One out of 2 suicidal attempts occurred during6 pm – 6 am in the city.Students, housewives, manual labourers,business employees and professional groupswere seen in 15.9%, 4.9%, 30 %, 10 % and12 % of the categories.Every alternate attempt occurred amongmarried households and one in three were inunmarried groups.
Figure 42 : Place of attempted suicides (%)
Home was the commonest place of suicidesand ¾ of the suicides were attempted at home.The next common place was roads (Fig. 42).The intent, though difficult to establish in abusy casualty setting revealed that 80 % ofattempts were clearly intentional in nature.Commonest method of suicidal attempt wasconsumption of organophosphorus compoundsand over the counter drugs, as they were withineasy reach of individual. Our previous studieshave indicated that they were purchased by theindividual earlier.A history of alcohol consumption in theindividual or among spouses / parents waspresent in 9% of the attempted suicides(definitely much higher).
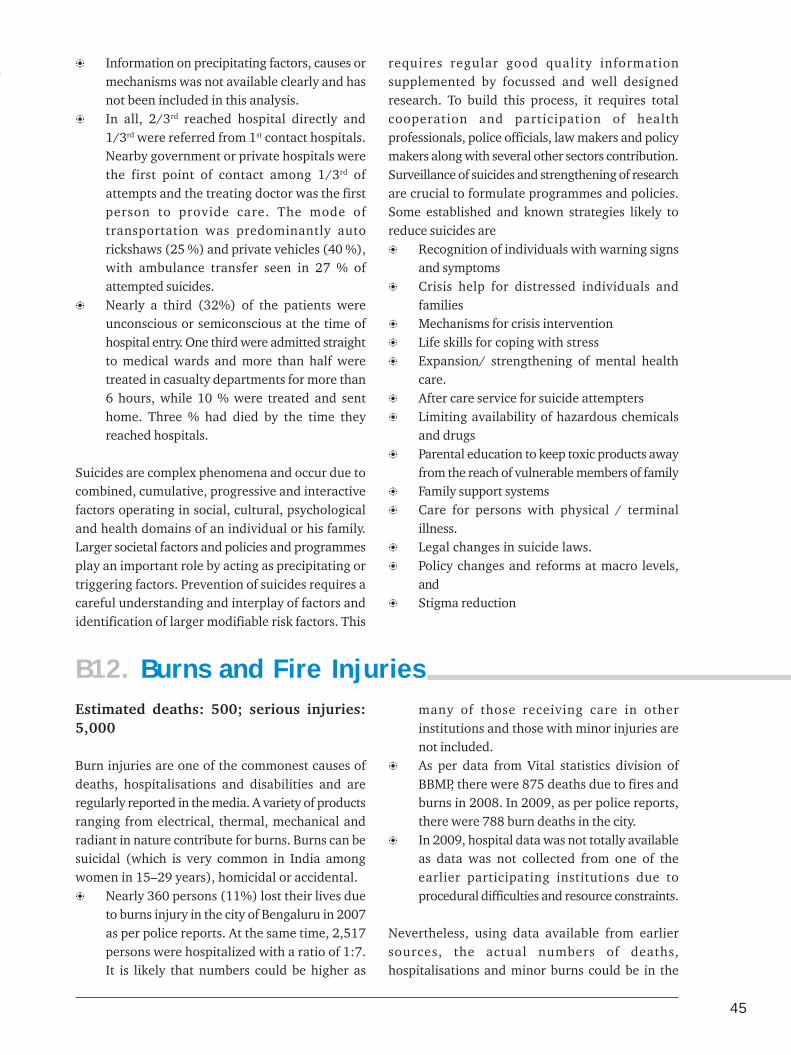
45
Information on precipitating factors, causes ormechanisms was not available clearly and hasnot been included in this analysis.In all, 2/3rd reached hospital directly and1/3rd were referred from 1st contact hospitals.Nearby government or private hospitals werethe first point of contact among 1/3rd ofattempts and the treating doctor was the firstperson to provide care. The mode oftransportation was predominantly autorickshaws (25 %) and private vehicles (40 %),with ambulance transfer seen in 27 % ofattempted suicides.Nearly a third (32%) of the patients wereunconscious or semiconscious at the time ofhospital entry. One third were admitted straightto medical wards and more than half weretreated in casualty departments for more than6 hours, while 10 % were treated and senthome. Three % had died by the time theyreached hospitals.
Suicides are complex phenomena and occur due tocombined, cumulative, progressive and interactivefactors operating in social, cultural, psychologicaland health domains of an individual or his family.Larger societal factors and policies and programmesplay an important role by acting as precipitating ortriggering factors. Prevention of suicides requires acareful understanding and interplay of factors andidentification of larger modifiable risk factors. This
requires regular good quality informationsupplemented by focussed and well designedresearch. To build this process, it requires totalcooperation and participation of healthprofessionals, police officials, law makers and policymakers along with several other sectors contribution.Surveillance of suicides and strengthening of researchare crucial to formulate programmes and policies.Some established and known strategies likely toreduce suicides are
Recognition of individuals with warning signsand symptomsCrisis help for distressed individuals andfamiliesMechanisms for crisis interventionLife skills for coping with stressExpansion/ strengthening of mental healthcare.After care service for suicide attemptersLimiting availability of hazardous chemicalsand drugsParental education to keep toxic products awayfrom the reach of vulnerable members of familyFamily support systemsCare for persons with physical / terminalillness.Legal changes in suicide laws.Policy changes and reforms at macro levels,andStigma reduction
B12. Burns and Fire InjuriesEstimated deaths: 500; serious injuries:5,000
Burn injuries are one of the commonest causes ofdeaths, hospitalisations and disabilities and areregularly reported in the media. A variety of productsranging from electrical, thermal, mechanical andradiant in nature contribute for burns. Burns can besuicidal (which is very common in India amongwomen in 15–29 years), homicidal or accidental.
Nearly 360 persons (11%) lost their lives dueto burns injury in the city of Bengaluru in 2007as per police reports. At the same time, 2,517persons were hospitalized with a ratio of 1:7.It is likely that numbers could be higher as
many of those receiving care in otherinstitutions and those with minor injuries arenot included.As per data from Vital statistics division ofBBMP, there were 875 deaths due to fires andburns in 2008. In 2009, as per police reports,there were 788 burn deaths in the city.In 2009, hospital data was not totally availableas data was not collected from one of theearlier participating institutions due toprocedural difficulties and resource constraints.
Nevertheless, using data available from earliersources, the actual numbers of deaths,hospitalisations and minor burns could be in the

46 BRSIPP 2009
Figure 43: Age-sex distribution of Burn injuries (%)
Non-fatal (2009)Fatal (2008)
ratio of 1: 10: 30 with about 500 deaths, 5,000hospitalisations and 15 – 20, 000 minor burns.Victoria hospital, an exclusive burns managementcentre with Bangalore Medical research Instituteregistered 815 Deaths, 1566 hospitalisations and1911 minor injuries during Jan 1 – Dec 31, 2009( personal communication) . Among the total, 1/3rd
were suicidal, 6% homicidal and 60% reported it tobe accidental in nature. Two thirds of injured andkilled persons were brought or reported by familymembers.
Dated 12th Feb 2010 - DH
Data from the previous report (28) indicated thatburn related deaths were
High in the younger age groups of 16-40 years,with one fifth each occurring in 21-25 and 26-30 years (Figure 36). Interestingly, ¼ of burndeaths occurred in less than 20 years age group.Women were overrepresented in 15–25 yearsin both fatal and non-fatal burn injuries. Themale to female distribution was 2:1 in the totalseries, while it was 1:2 among those in youngerage groups. This phenomenon has beenreported by many Indian studies and causesare primarily attributed to cultural issues.Three fourths of burn deaths and injuriesoccurred at home and remaining were seen inindustrial areas and other places.Majority of the burns were reported as stovebursts, and accidental burns and had occurredinside the house. Kerosene stoves, gas cylinders,oil lamps, cooking materials and hot liquidswere the primary agents responsible for burninjuries. The causes of burns were not clearlyknown in majority of the instances.
Once again, understanding the epidemiologicalcharacteristics of burns injuries is crucial to identifywhat needs to be addressed for prevention. In 2010,it is proposed to set up a Burns Registry in one of theleading centres. Improving socioeconomic conditionsof households, making available safer stoves, safeelectricity connections and electrical products, familyeducation programmes are likely to help burnsinjuries.

47
B13. PoisoningEstimated deaths: 500; serious injuries:10,000
Poisoning is one of the commonest injury causes fordeaths and hospitalisations. Many cases of accidentalpoisoning due to food, alcohol and others arefrequently reported in the media. As a variety oforganophosphorus compounds, Over The Counter
(OTC) medicines, household products and otherdangerous chemicals are easily available, avulnerable person can easily commit acts ofpoisoning; important to note that poisoning can besuicidal, accidental and homicidal in nature. Causesof poisoning are unclear even at national level asthere are no large scale studies.
Figure 44: Age-sex distribution of Fatal & Non-fatal poisoning
Non-fatal (2009)Fatal (2008)
In Bengaluru, nearly 300 people (9% of totaldeaths) lost their lives due to a poisoning actduring 2007, while 10% of those hospitalizeddue to an injury were due to poisoning. Amongthem, 75% were men and 25% were women.Highest number of poisoning deaths was seenin 21-30 years (36%), while poisoning amongteenagers in 16-20 years was 13%. Among thenon-fatal poisoning cases 60% were in the agegroup of 16–34 years. In similarity to burns,in both fatal and non-fatal poisoning injuries,there were more women in the younger agegroups (16–34 years) as seen in Figure 44.
Summary data available from CCRB sourcesin the city, indicate that there were 349poisoning deaths and most of these weresuicidal (80%) with homicidal and accidentalpoisoning being about 1-2% and 18-19%respectively.Hospital data was available in 1406 (4.2%)instances of poisoning and indicates thatamong 82% of these cases, these wereconsumed with suicidal intent. Only 11.4% ofthem were unintentional and most of these wereamong children (<14 yrs).
B14. Animal Bites(contributed by Dr.Ashwath Narayana from one of the partnerinstitutions, KIMS)
Animal bites are a common problem and all hospitalsprovide care for injured persons. Among them, Rabiesis 100 % fatal but is preventable by timely postexposure rabies prophylaxis (local treatment ofwounds, administration of anti rabies vaccines and
vaccines and local infiltration of rabiesimmunoglobulin in WHO category III exposures).An estimated 20,000 human rabies deaths and 17.4million animal bite cases occur in India every year.Dogs continue to be a major source (96 %) of

48 BRSIPP 2009
infection in India. The dog census in Bangalore cityrevealed that there were 320,000 dogs (180,000 strayand 140,000 pet dogs) in BBMP area. During thecurrent year, nearly 17,000 victims sought treatmentfor animal bite in different health care settings underBBMP (Table 12). Majority of animal bite victimsvisiting BBMP hospitals for post exposure prophylaxiswere children and belonged to lower socio-economicclass.
There is apparent reduction in number of humanrabies deaths reported at Epidemic diseases hospital(EDH) in Bangalore (Fig. 45). This may be due toavailability of modern rabies immunobiologicals,both in Government & private sector for treatment ofanimal bites. BBMP is providing rabies vaccines byintradermal route and Equine rabies Immunoglobulinsfree of cost to bite victims. In addition, BBMP isimplementing animal birth control (ABC) programmefor controlling the dog population.
Table 12: Animal bite cases reported at Bruhat
Bangalore Mahanagara Palike Hospitals
Year No. of animal bite cases
reported at BBMP hospitals
2003-04 22,912
2004-05 32,967
2005-06 28,006
2006-07 17,798
2007-08 21,121
2008-09 13,833
2009-10 (up to Dec. 09 16,584
Source: Pilot project office, BBMP, Bangalore.
FFFFFigure 45: Tigure 45: Tigure 45: Tigure 45: Tigure 45: Trend of Rabies cases inrend of Rabies cases inrend of Rabies cases inrend of Rabies cases inrend of Rabies cases in
BangaloreBangaloreBangaloreBangaloreBangalore
The anti rabies clinic, run by Department ofCommunity Medicine, Kempegowda Institute ofMedical Sciences (KIMS) is a referral centre formanagement of animal bite cases in the city ofBangalore. Nearly 2000 cases are seen annually
(Table 13). The centre undertakes epidemiologicalstudies, clinical trials and is also the registered officeof Association for Prevention & control of Rabies inIndia (APCRI) & The Rabies in Asia (RIA) Foundation
Table 13: Animal bite cases reported at the
Anti-rabies clinic, KIMS Hospital
YEAR TOTAL
2005 1585
2006 1912
2007 1996
2008 1976
2009 1979
Source: Anti rabies clinic, KIMS hospital, Bangalore.
Figure 46: Age Sex distribution of the
Animal bites cases
Figure 47: Place of Occurrence of Animal bite cases
Children < 15 years (37.4 % ) , and within them in5 - 9 year years ( 15.2 % ) were bitten by dogs to agreater extent. The overall male to female ratio was3: 1. While nearly one fourth of the cases (72.6%)were from within Bangalore, nearly two thirds ofthem were bitten (62.0%) on the road (Fig. 47).More than half of the bites occurred when the personwas either walking (47.9%) or standing (4.8%) onthe road and one fifth (20.0%) were playing whenthe bite occurred. Bites were frequently on Lowerlimbs (51.7%) and Upper limbs (27%) (Fig 48).
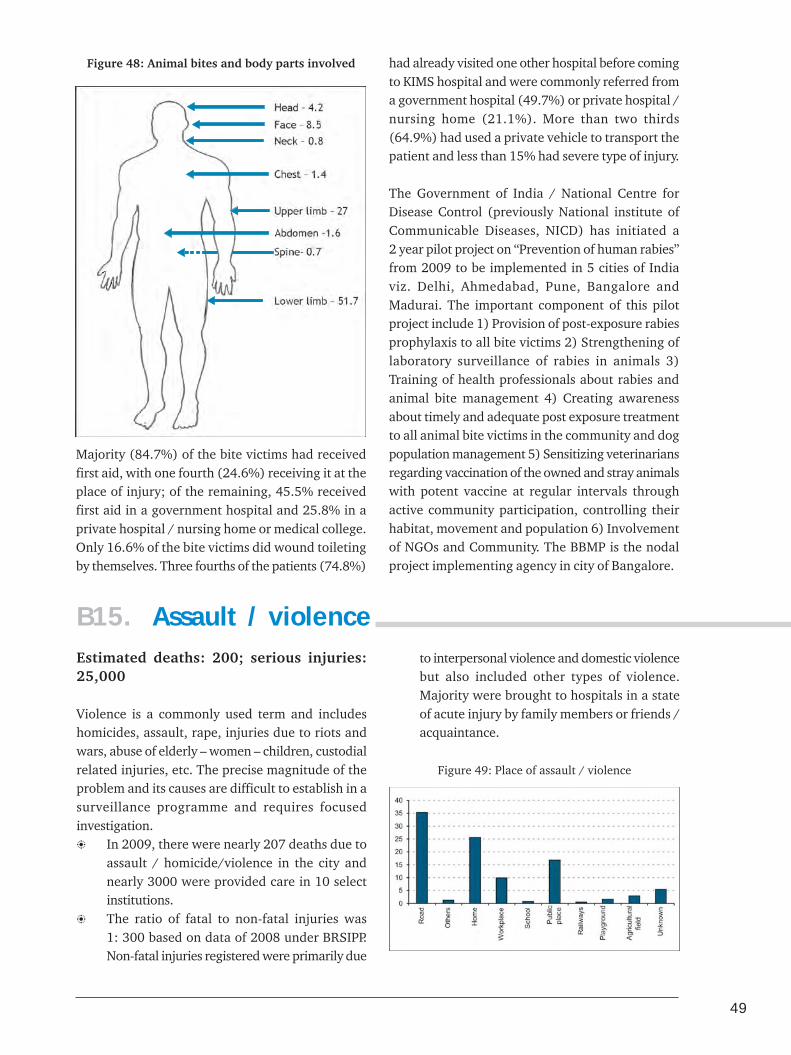
49
Figure 48: Animal bites and body parts involved
Majority (84.7%) of the bite victims had receivedfirst aid, with one fourth (24.6%) receiving it at theplace of injury; of the remaining, 45.5% receivedfirst aid in a government hospital and 25.8% in aprivate hospital / nursing home or medical college.Only 16.6% of the bite victims did wound toiletingby themselves. Three fourths of the patients (74.8%)
had already visited one other hospital before comingto KIMS hospital and were commonly referred froma government hospital (49.7%) or private hospital /nursing home (21.1%). More than two thirds(64.9%) had used a private vehicle to transport thepatient and less than 15% had severe type of injury.
The Government of India / National Centre forDisease Control (previously National institute ofCommunicable Diseases, NICD) has initiated a2 year pilot project on “Prevention of human rabies”from 2009 to be implemented in 5 cities of Indiaviz. Delhi, Ahmedabad, Pune, Bangalore andMadurai. The important component of this pilotproject include 1) Provision of post-exposure rabiesprophylaxis to all bite victims 2) Strengthening oflaboratory surveillance of rabies in animals 3)Training of health professionals about rabies andanimal bite management 4) Creating awarenessabout timely and adequate post exposure treatmentto all animal bite victims in the community and dogpopulation management 5) Sensitizing veterinariansregarding vaccination of the owned and stray animalswith potent vaccine at regular intervals throughactive community participation, controlling theirhabitat, movement and population 6) Involvementof NGOs and Community. The BBMP is the nodalproject implementing agency in city of Bangalore.
B15. Assault / violenceEstimated deaths: 200; serious injuries:25,000
Violence is a commonly used term and includeshomicides, assault, rape, injuries due to riots andwars, abuse of elderly – women – children, custodialrelated injuries, etc. The precise magnitude of theproblem and its causes are difficult to establish in asurveillance programme and requires focusedinvestigation.
In 2009, there were nearly 207 deaths due toassault / homicide/violence in the city andnearly 3000 were provided care in 10 selectinstitutions.The ratio of fatal to non-fatal injuries was1: 300 based on data of 2008 under BRSIPP.Non-fatal injuries registered were primarily due
to interpersonal violence and domestic violencebut also included other types of violence.Majority were brought to hospitals in a stateof acute injury by family members or friends /acquaintance.
Figure 49: Place of assault / violence

50 BRSIPP 2009
Assault /Violence was most commonly observed inthe 20 – 34 yrs age group. Beyond the age of 30,violence was committed more against women as theinjury cases were more among women as comparedto men. Majority of the assault cases brought to thepartner institutions were conscious (89%). Less than
5% of the cases were unconscious and only less than1% were brought dead to the casualty. Almost halfof the patients (58%) had mild injuries and 42%had moderate to severe injuries. Almost ¾ of theassault cases were either admitted for further careor referred to other institutions.
Vanitha Sahaya vani is an exclusive helpline runby Bangalore City Police to help women indistress. The agency can be contacted at"22943225" from any telephone and people alsohave direct access. The centre is run byprofessional staff offering services to needywomen in crisis situations. During April 2008 -March 2009, the centre received 1135 calls andmore than half (770) were provided support ontelephone helplines. Based on the nature of calls,the callers are also referred to Family Counsellingcentre (1066), police help, legal counseling andshort stay homes. Majority of the calls are relatedto Marital disharmony, dowry harassment,alcoholic problem in spouses, financial issues andother issues.Source: Personal communication : "VanithaSahaya Vani"
"Makkala Sahaya vani" is a telephone service forhelping children in crisis and distress, withsupport provided by trained staff. The helplinecan be contacted at "22943224", 24 × 7. DuringJan-Dec 2009, the centre received 11,094 callsfrom children/ parents for a number of reasons.Nearly 156 children were rescued, 131 missingchildren were traced, 200 were providedemotional support and 374 were referred forshelter, school and hostel facilities. Directtelephone interventions were provided for 207children. About one - fourth of callers hadcontacted the centre after the first call.Source: Personal communication, "MakkalaSahaya vani"
"Hiriyara Sahaya vani" is a telephone service for helping the elderly population in distress. The Serviceis provided by trained counselors. In the year 2009, the helpline had received 9823 calls from Elders inDistress. About 372 complaints were registered, 238 complaints resolved. Many of the calls were fromelderly people to seek information (5881) which was provided to them satisfactorily.Source: Personal communication, "Hiriyara Sahaya vani"
B16. Prehospital CareGood surveillance programmes can often reflect thestatus of trauma care services and identify areas ofstrengthening. Previous studies in Bengaluru havebeen limited and examined the pre hospital care inroad traffic injuries, traumatic Brain injuries andsuicides (37,38). However, these studies have beenisolated, stand alone and not continuous in nature.In a surveillance programme, examination of thesefactors can reveal the changing patterns and identifycritical elements, helping in prioritization and policysetting process.
Trauma care issues included under surveillance were
- availability of first aid, mode of transportation,time interval between injury occurrence to reachingone of the study hospitals, referral patterns andnumber of hospital contacts before reaching adefinitive hospital. While these formed a set of vitalfactors contributing for availability, accessibility andaffordability of emergency and pre-hospital care, thequality of care neither received nor provided wereincluded. It is also essential to highlight that this isan examination of pooled data and variations mightoccur with data of individual hospitals dependingon the nature (public – private; apex – primary, etc.,)of institutions.

51
B16.1. First aid servicesThe provision of first aid to an injured person dependson place of injury, nature and severity of injury alongwith availability of first aid facilities. As there areno specified first responders, people in the vicinityare the first responders, who often make the decisionof what should be done. Secondly, it depends on theknowledge and practice of these responders and whatthey do. Commonly, in a road crash, the scenario ismore of confusion, altercation and fights amongpeople rather than shifting the person to the nearestsite of care (In India, it is common to see peoplefighting, beating up the driver, setting the vehicleon fire, etc.,). Thirdly, it also rests with the existingmedico legal practices in the society as it is commonto see people lying unattended for fear of later legalcomplications or police enquiries among public (Thehon. Supreme court has ruled that people attendingto road crash victim need not be involved at laterstages).
The definition of first aid varies in the local contextand in the present study even care in a first contacthospital was considered as first aid as this was thefirst available care. In totality, nearly one fifth (20%)of fatal and non-fatally injured persons received sometype of first aid. However, the number of personsreceiving first aid soon after a fatal injury variedfrom 10–50% depending on the type of injury. Innon-fatal injuries, the numbers were slightly higherranging from 24% to 65%.
The place of delivery of first aid is crucial as itdepends on the practice of “save and stabilize” or“scoop and run”. People generally do not wait for anambulance even if it is a severe or fatal injury. Less
than 2% of non-fatal injuries received first aid atinjury site. This was quite high in case of burns goingupto 25% patients receiving some first aid at theinjury site. This indicates the presence of a “scoopand run” practice as injured were taken to nearbyhospitals by those present at the site of injury. NearbyGovernment / public hospitals was the most commonplace of providing first aid in nearly 50% of injuries(Table 15). This was closely followed by Privatehealth care institutions like private hospitals andnursing homes. The involvement of generalpractitioners and common responders like police wasless than 1% in the series.
Who delivers first aid is an important aspect as whatis delivered depends on the knowledge and skills ofthe person and the extent he/she goes in translatingthat knowledge to action. In the present study, asmany people received their first aid in public orprivate hospitals, it was commonly the doctor ornurse involved in delivery of first aid care. Morethan 90% of first aid deliverers were doctors,followed closely by nurses.
B16.2. Mode of transportationMode of transportation of an injured person is criticalas the aim is to reach the nearest health care centrein the safest possible way within a short period oftime. In the rural areas, data from non-fatal injuriesrevealed that the commonest transportation vehiclewas private means of transport through privatevehicles (cars or taxis) or a 3 wheeled auto rickshawin 66% and 14% of cases, respectively. Governmentand Police vehicles extended support by transportingabout 4% of injured persons in urban areas. Transferwas predominantly through Auto rickshaw and
Injury At injured Nearby Nearby Pvt. Medical Pvt. clinic Police General OthersCause site Govt. hospital / college Practitioner
hospital Nursinghome
Road trafficinjury 0.93 56.25 39.09 2.73 0.93 0.02 0.01 0.03
Fall 0.60 47.39 47.50 3.01 1.41 0.05 0.00 0.05
Poisoning 1.11 26.00 66.44 3.56 2.67 0.00 0.22 0.00
Burns 25.00 0.00 75.00 0.00 0.00 0.00 0.00 0.00
Hanging 0.00 38.46 61.54 0.00 0.00 0.00 0.00 0.00
Table 15: Place of first aid for injured persons (%)

52 BRSIPP 2009
private vehicles for nearly three fourth of injuredpatients. Ambulances were mainly seen ininterhospital referrals.
Figure 50: Mode of Transportation (2009)
Figure 51: Time interval between time of injury and
registration, (all injuries)
Urban
Rural
B16.3. Time intervalThe time of death among fatal injuries depends onseverity of impact and availability of care. In bothurban and rural areas, nearly 50% of fatal injurieswere brought to hospitals is less than I hour; however,this also included those who had died on the spot/atinjury site and those dying on the way to hospital.Among the rest, 13% of urban and 10% of ruralpatients reached in less than 3 hours. The remaining40% of those who died in urban areas and 35% ofrural cases died in the hospital and were broughtbeyond 3 hours. Interesting to note that ¼th of thosewho died in urban and 16% in rural had reached ahospital beyond 24 hours after injury. Many of thesedeaths occurred after the patient had contacted otherhospitals, prior to reaching a definitive studyhospital. Data was to be interpreted cautiously asquality of care has not been included in the presentanalysis.
B16.4. Source of referalThe source of referral indicates the place of firstcontact highlighting the possibility of strengtheningservices across different institutions. Among fatalinjuries, the referral to the final hospital was mainlyfrom Government (54%) and private hospitals (22%).In contrast, overall 53% of injured persons reached ahospital on their own and this was the most commonpractice in assault / violence (72%), attemptedsuicides (60%), and accidental poisoning (62%);nearly half (47%) of injured persons in a RTI alsoreached directly on their own. Government hospitalsand private hospitals referred 22% and 18% of injuredpersons, respectively. The referral from privateteaching hospitals was less as the available facilitiesare comparatively better in these hospitals.
It is a common practice in Bengaluru to see patientsbeing referred from one hospital to another for anumber of reasons. Some of the common reasonsare type – nature – severity of injuries (polytraumapatients and those seriously injured are referreddepending on availability of specialties), nature ofhospital (public or private), availability of facilitiesin health care institutions and affordability of care(expenses depend on nature of hospital, injurymanagement practices and ability of patients andtheir families to pay along with availability of

53
insurance with people). In the present programme,it was observed that among fatal injuries, 70% ofpatients visited more than 1 hospital. Among thosevisiting more than 1 hospital it varied from 50% forfall related injuries to 13% in burn injuries. In non-fatal injuries, more than 90% visited at least 1 otherhospital. The smaller number in burn injuries isprimarily because exclusive burns care andmanagement is available in one of the larger publicsector hospital. Among non-fatal injuries, since thefirst contact hospital was chosen the numbers werearound 10%, but majority were referred from thesehospitals to other hospitals.
The fact that two thirds of injury deaths occurred inhospitals and that poor services in terms of first aid,frequent referrals, delayed time intervals andtransportation problems highlight the need forimproving trauma care services in the city. Thisrequires a set of combined activities and has beendiscussed in the accompanying series on emergencyand trauma care. Some activities likely to benefittowards improving trauma care services.
1. At the city level, a working group should beestablished by the Ministry of Health andDirectorate of Health services to coordinate –guide – supervise – and monitor all traumarelated activities. The group should includepolicy makers, public health specialists, traumaprofessionals and clinical specialists.
2. All hospital Directors and administrators in thecity should be sensitized on the need forbuilding effective trauma care systems andimproving quality of care at reasonable costswith a focus on essential components.
3. In rural areas, all medical and supportivepersonnel working in district and Taluka levelhospitals should be trained in basic aspects oftrauma care along with managing lesscomplicated injuries.
4. A hospital inventory of all public and privatehospitals needs to be undertaken to assess theexisting facilities and resources in individualinstitutions. Areas of strengthening have to beidentified for improving facilities, whereverrequired.
5. Basic first aid training should be provided forpossible first aid responders like police, health,drivers, and teachers who can respond toemergencies any time. These personnel shouldbe able to assess scene and patient, providefirst aid, call for help and arrange safetransportation.
6. All casualty medical officers and nurses shouldbe trained in Basic Trauma Care and shouldreceive periodical training in management ofcomplex injuries connected with brain, chest-abdominal organs, burns and poisoning.
7. A single system number for ambulance serviceshould be available for the entire city which iseasy to recall. Ambulances should be availableat free of cost to all individuals in need of care.
8. Trauma registries should be established in allmedical college hospitals.
9. CME programmes on trauma care and relatedaspects can be undertaken by medical collegeteaching hospitals or professional bodies orIndian medical Association at periodicalintervals with its availability to all interestedprofessionals.
10. Public awareness programmes for immediateand early transfer of patients to nearest hospitalshould be encouraged.
In summary, emergency and trauma care needsserious attention of planners , policy makers andprofessionals. The current efforts are fragmented andrequire clear direction through policies andprogrammes addressing several areas in totality. Theneed of the hour is to develop mechanisms foravailability of care to all, irrespective of their abilityto pay. Simple and effective prehospital care andtrauma systems that are available to every injuredperson and to all sections of society will be far moreeffective in the long run than high tech servicesrequired for few. Minimum standards and guidelinesfor care of the injured needs to be developed acrossthe country. What is required In Indian cities andvillages should be driven by data and evidence andpilot demonstration programmes and not just byindividual experiences alone.

54 BRSIPP 2009
B17. Nature of injuriesOrganization and delivery of trauma care servicesdepends on number of factors like nature – type –severity of injury, availability of facilities andresources and ability of people to pay for care. Headinjury was the commonest cause of death in 80% ofroad crashes, while injury to chest and abdominalregions were documented in 1.8% of deaths. Amongnon-fatal injuries, injuries to head/face, upper limband lower limb were present in 82%, 17% and 25%of crashes, respectively (Figure 52a,b & c). Neitherdetailed anatomical injury nor clinical diagnosis orautopsy findings was included in the programme.
The present programme adapted a very common andsimple method of classification to assess injuryseverity. Being a surveillance programme, it wasdecided to include this practical method as traumacare physicians in some hospitals were not familiarwith scientific methods of injury severity assessment
like AIS, IIS, GCS, GOS, TRISS or other methods. Inaddition, detailed documentation and severityascertainment of each injury was not done; formedico-legal purposes, detailed description ofinjuries was done separately.
The injury severity was considered mild (only ERcare), moderate (requiring hospital stay up to 6 hoursand needed X-rays, blood or IV transfusion, expertconsultation etc.,) and severe ( direct admission from
Fatal Non-FatalHead - 79.2
Face - 24.5
Neck -9.4
Chest - 18.7
Upper limb - 27.1
Abdomen - 18
Spine - 7.6
Lower limb -41.4
Head - 33
Face - 19.40
Neck - 1.60
Chest - 3.3
Upper limb - 16.9
Abdomen - 1.3
Spine - 1.70
Lower limb - 25
Figure 52 a: Body Parts injured in RTIs
Head - 75.7
Face - 18.2
Neck - 3.4
Chest - 3.6
Upper limb - 12
Abdomen - 2.4
Spine - 0.9
Lower limb - 6
Head - 73.2
Face - 12.6
Neck - 2.9
Chest - 1.7
Upper limb - 8.10
Abdomen - 0.7
Spine - 5.7
Lower limb - 9.5
Figure 52 b: Body Parts injured in Assault/violence
Figure 52c: Body Parts injured in Falls
casualty and intensive management) based on thisoperational definition. It was observed that 40 % ofinjuries were mild in nature. One third of RTIs andless than 10% of burns, poisoning and attemptedsuicides were considered mild injuries. Most of theRTIs, burn injuries, drowning, attempted suicidesand falls were moderate to severe in nature (Table),indicating the need for comprehensive and integratedmanagement approaches. The proportion of severeinjuries was more in rural areas, probably due todelays in reaching hospitals. This also reflects thatminor injuries can be provided care in nearby healthcentres or general practitioners.

55
Table 16: Severity of injuries in ER facilities (2009) (%)
Urban Rural Urban Rural Urban RuralAssault 57.8 56.1 34.9 40.5 7.3 3.5
Burns 18.2 26.7 27.3 53.3 54.6 20
Fall 48.8 34.2 38.8 35.5 12.4 30.3
Poisoning 23.4 18.4 50.1 46.1 26.6 35.5
Road traffic injury 41.0 42.6 46.2 39 12.8 18.5
Suicide 23.7 16.7 49.5 46.0 26.7 37.3
Total 41.6 42.0 44.9 40.3 13.4 17.7
INJURYCAUSE Mild Moderate Severe
B18. Management and OutcomeThe status of injured person at the time of reachinghospital reflects severity of injury and the need forhospital preparedness to manage such patients. Thenumber of patients brought dead was less than 1%in the series. Every tenth patient with a poisoning –drowning – attempted suicide was in an unconsciousstate at hospital entry time. Although the proportionof brought dead cases was less than 0.5% , nearly10% of the cases were brought in an unconscious orsemiconscious state. Overall, 83% were consciousat the time of hospital entry. Among road trafficinjuries, one out of 8–10 patients were insemiconscious or unconscious state, necessitating theneed for intense management and the need to deliverefficient care.
Information on the managerial practices of injuriesrevealed that nearly one fourth were provided careand discharged home with advice on follow-up, whilemore than half were admitted for further medicaland or surgical lines of management. The admissionrates were highest for burns, falls, RTIs andattempted suicides. Those treated in ER and furtherreferral was high for RTIs and falls. Sixteen percentof patients were referred to another hospital fornumber of reasons like patient choices, lack of
facilities (bed, investigation, manpower, etc.,),affordability, and at times included medico legalreasons as well.
Figure 53: Mode of management
Urban Rural
The outcome of injuries was assessed at the end ofER stay and may not be truly indicative of realoutcome as those admitted and intervened were notfollowed-up in the programme. However, it shedslight on issues like care patterns and limitations.Majority improved in their vital status and gotstabilized after reaching casualty, but required furthercare and management. Nearly 2% of patients diedin ER and combined with those brought dead, thetotal number of deaths at ER was 3%. Highestnumber of deaths was seen among those with burnsand drowning, while the status of nearly 40% withpoisoning, attempted suicides deteriorated indicatingneed for aggressive management.

56 BRSIPP 2009
Section C:
Profile of activities
Feedback and action are two essential components of any surveillance
programme. This section broadly highlights the process of data
application and utilisation for number of activities under the
programme. Surveillance may or may not exactly pinpoint the precise
interventions to be implemented, but provides directions for capacity
strengthening, strengthening policies and programmes ,
implementation of general or specific activities and continued
research for developing interventions. At present, there is no defined
agency or a mechanism for road safety and injury prevention and
control activities in Bengaluru or India; however, opportunities exist
(and needs to be developed) for strengthening existing activities and
developing new programmes.

57
C1. Injury: Addressing the problemC1.1 Injuries are a neglected issue and
needs systematic approachesEven though injuries are a major public healthproblem, efforts to address it through an intersectoraland evidence based approach are yet to begin. Somedevelopments have begun in road safety in recentyears and others are yet to be recognized. Eventhough suicides have been recognised, systematicintegrated efforts are not in place to addressthe problem. Other injury problems like burns,poisoning, occupational injuries, violence and othershave not received any attention. This hidden andunanswered epidemic needs to be given importanceat all levels of policy making and implementation.Nearly a million people die of injuries in India everyyear. Data from BRSIPP has revealed that nearly4500 persons die every year, more than 1,00,000are hospitalized and the impact is huge in a city likeBengaluru. Today, knowledge and experience existsto address the problem.
C1.2. Injuries are a public healthproblem
The present programme is the first systematic effortto build a surveillance activity with existing datasources to recognise and understand the problem.The health sector bears the maximum impact interms of providing care and services for injuredpersons. Apart from huge costs, the impact on youngminds and bodies are phenomenal. The psychosocialand economic consequences have not been measured.
In a “do nothing” scenario or if the present scenariocontinues, Injuries will result in an estimated loss of10,000 lives, 2,00,000 hospitalizations and 50,000persons with disabilities every year by 2015 inBengaluru(17). These numbers are conservativeestimates and are likely to be influenced by manyfactors.Despite the enormity of the problem, there hasbeen a glaring absence of institutional mechanismsand injury prevention policies at the ground level.
C1.3. Young people should not die dueto preventable injuries
Data presented in this report as well as in 2009clearly indicate that 70 – 80 % of injuries occuramong young people, majority being men. This
pattern remains similar across injuries. Withchanging patterns, women will be affected more aschanges in life styles will increase the problem. Theage of 15 – 35 years is the most crucial age of anindividual with children and parents building theirdreams, aspirations and ambitions. Loss of lives,broken skulls and fractured limbs at this stage canentirely pull back families and result in life longnegative life styles. In few of our earlier studies (39)it is seen that people develop many negative life styles(alcohol, depression, violence, etc.,) following theloss of their near and dear ones. The loss of younglives due to an injury should be a wake–up call forall concerned and realistic programmes should bein place. This human tragedy due to a human disasterneeds to be stopped.
C1.4. Injuries have huge economicimpact
With guestimates in operation, considering that aRs.1,00,000 compensation is given to all deaths(Whether it reaches all those affected is to be seento be believed), and minimum Rs.25,000 for injured,the economic losses per year are equivalent toRs. 2,950,000,000 in just Bengaluru alone. This apartfrom the huge losses, families and individuals incurfor direct and indirect medical costs. Many familiessell their assets, make loans, pawn their propertyand make emergency arrangements. At the nationallevel, it is estimated that Rs.55,000 crores are theannual economic losses due to Road Traffic Injuriesalone. If all injuries and both direct and indirecteconomic losses are considered, the losses will bearound 3 – 5 % of GDP.
C.1.5. Information systems and existinggaps
Any prevention and control programme needs agood foundation to work through policies andprogrammes; such programmes obviously needgood quality and reliable information. The injuryinformation system till date in the country and inBengaluru has been fragmented and patchy withdifferent systems operating in their individual waysas per their administrative and legal requirements.Four common sources of injury information arepolice, corporation vital registration sources,

58 BRSIPP 2009
transport and health. Police data is the only sourceof injury information and even this is of limited valuefor policies and programmes. The data is notcomprehensive, quality is moderate, not analysedand disseminated, and utilized by all stake holdersat local levels (city or state). Even though healthsector provides care for number of patients inindividual hospitals, there has been no injury
information system in health sector. Further, eachhospital follows its own individual practices. In theabsence of timely and scientific information, it hasnot been possible to develop – implement – monitorand evaluate any systematic policies andprogrammes. There is need for building properinformation systems, research, and surveillance
The Bangalore Road traffic injury/injury surveillanceprogramme was started in April 2007 and formalactivities began in 2008. The details of theprogramme are provided in the present report andalso in the earlier report entitled “Bangalore RoadTraffic injury/injury surveillance programme: afeasibility study” published in January 2009. Thedata collection activities during the period Jan 2009– December 2009 are presented in earlier sectionsof this report. In 2009, the major emphasis was oninputs for policies and programmes along withcontinuation of data gathering and pooling. Thefollowing sections provide various activitiesundertaken by the partners in the programme duringthe year 2009 using data from the programme.
1. January - Stake holders Consultation:The year started with a stake holder’s consultationmeeting on 28 January 2009 under the BangaloreRoad safety and injury Prevention Programme withthe participation of more than 250 members fromall partner agencies. During the meeting, thefeasibility report, set of 10 fact sheets and 5 publichealth alerts were released. Various activitiesundertaken in 2008 were reviewed and steps to betaken for further improvement were identified. Theburden and impact of road traffic injuries, suicides
C2. Activity Profile of 2009
and other injuries, presentation on current initiativesby different sectors and need for scientific approachesto prevention and control were discussed. Followingthis, discussions by the CC with individualstakeholders continued at periodical intervals.Several areas have been strengthened in theintervening period.
2. Data Collection ActivitiesIn 2009, data collection continued with the Citytraffic police department to on road deaths inthe city. The earlier data collection format wasmodified to make it more specific and focused.The form remains uniform for all the 39 policestations of the City and is completed by writersand assistant writers in all stations. Thecompleted forms are sent to the nodal officerbefore 10th of every month and transferred tocoordinating centres for data entry andcomputerization activities. Data collection wasnot continuous with the law and order divisionof city police due to procedural issues.The Bangalore Metropolitan TransportCorporation extended all support for datacollection on involvement of public transportBMTC buses in road crashes. The format ofdata collection was revised and finalized inconsultation with the organisation. Datacollection was undertaken by the CC Staff on aregular basis once a month in the revised formatand computerized.Data collection continued in all the partnerhospitals on a regular day to day basis. Theforms are printed by the Institutions with theirname and logo, completed by existing staff andcollected once a month by the CC staff forcomputerization. Based on review and feedback, the format was revised and data

59
collection is done by the team of causalitymedical officers and nurses soon aftercompleting treatment procedures. To examinethe possibility of the system running on its own,data collection by CC staff was withdrawn andhospitals were encouraged to continue on theirown. However, regular monthly monitoringcontinued with feedback to hospitaladministrators and doctors.
Due to administrative procedures and otherunanticipated problems, data collection could notbe undertaken without supervision for in- betweenperiods in Victoria hospital, Bowring hospital,Jayanagar General Hospital, St. John MedicalCollege Hospital, Manipal Hospital, Malya Hospitaland two other small hospitals. However, efforts werecontinued to develop mechanisms for data collectionactivities.
3. Training and Capacity building activitiesSeries of Capacity building activities were conductedon a regular basis throughout the year. Theseprogrammes focussed on sensitisation of participants,review of activities, problems in data collection andmanagement, opportunities for improvement andstrengthening, feed back on completed forms andmonitoring mechanisms. Apart from focussing ondata collection, it also included developing evidencebased approaches for road safety and injuryprevention by identifying new activities that couldbe undertaken.
March: Discussions were held with Staff ofBMTC personnel and data collection for theyear 2008 was initiated in a systematic way inMarch 2008.It was also planned to undertakea survey on attitude and practices of driversworking with BMTC in the city. The role ofmanagements and drivers in road safety washighlighted.
June: An orientation cum training programmewas held for medical officers, nurses andmedical records officers of KempegowdaInstitute of Medical Sciences on 18th June 2009.The data collected from the Institute was sharedwith the members and their role andcontribution was highlighted. Specific activitiesthat could be undertaken and advantages to
the hospital were discussed, includingimproving emergency care and teaching ofmedical students.
June: The writers and assistant writers of all39 police stations were trained in datacollection activities on 8th June 2009. Theimportance of timely data collection and theneed for focussing on completeness, coverageand quality was highlighted.
June 2009: The nodal officer meeting washeld on 12 June 2009 at NIMHANS to discussvarious aspects of programmes which wasattended by 20 members. Data of last 6 monthswas reviewed and priority areas of action wereidentified.

60 BRSIPP 2009
October: An orientation programme for theadministrators of newly introduced hospitalswas held on 31 October 2009 at NIMHANS.
November: The training programme for thenodal officers from all the 8 new hospitals wasundertaken on 26th November 2009. Theprogramme highlighted the need forinvolvement of institutions in road safety andinjury prevention and importance of datacollection to formulate scientific programmes.The various steps and procedures involved inthe programme were highlighted forparticipants. All new hospitals have printedtheir own forms and activities are in progress.
A review meeting of the programme was heldat MS Ramaiah Institute of Medical Scienceswith around 40 participating members and theadministration. Data collected from thehospital was provided as feedback and newareas of activities were identified.
June – December 2009: The Bangalore CityPolice in a unique approach organized acontinuous training programme for all middleand junior level officers on integrated approachto traffic management and road safety fromJune 2009. A total of 52 sessions were held,and each programme was over 2 days for abatch of 60 – 70 officers. The trainees includedPolice Sub Inspectors (240), Assistant Subinspectors (325), Head constables and policeconstables (2100) of the Traffic Wing of theBangalore City Police. The road safety sessionsfocused on overview of the Bengaluru Injurysurveillance programme, importance andburden of RTIs as a public health problem,
salient findings from the first phase of theprogramme based on data collected from policeand hospitals, existing laws related to roadsafety (provisions under the Indian MotorVehicle Act, 2002, other relevant Indian PenalCode provisions for road safety, Judicialpronouncements), importance of systematicenforcement and aspects related to pre-hospitalcare (principles and appropriate practices offirst aid, safe transportation of the crashvictim). The crucial role of the traffic police inimplementation of road safety measuresparticularly for prevention of road deaths andinjuries was highlighted. The need for auniform, visible, random, continuous, ongoingenforcement / implementation programme wasemphasized.
December 2009: Similarly, a 3 dayorientation cum training programme for roadengineers working in BBMP was conductedduring 14th to 16th December 2009 highlightingthe engineering approaches on Road Safety. Theobjectives of the deliberations were to sensitizethe staff regarding concerns, concepts andprinciples of road safety and identify possiblemechanisms for making roads safe. The scopeof BBMP engineering department wasidentified to be to ensure safety of people onroad, at home, all public places and in workplaces through safe design, maintenanceand operation of roads, ensuring strictimplementation of regulations in all places,developing mechanisms for monitoring ofongoing activities, evaluating safety in termsof reduction in deaths and injuries, undertakingjoint analysis and interpretation, and supportinginterventions to be implemented by police,transport, health and others.

61
4. Inputs to policies and programmes:During the year the data collected under theprogramme was shared with several stake holdersat National, State and City levels to strengthen roadsafety components.
August 2009: Inputs were provided for theroad safety programme organized by ShellIndia and GRSP to strengthen fleet safetyprogramme in Bangalore. Specific data oninvolvement of fleets as available from theBRSIPP was developed under this activity.h t t p : / / w w w. g r s p r o a d s a f e t y. o r g /?pageid=27#project_93
August 2009: Inputs were provided to “AbideBangalore” for consideration, recognition andinclusion of road safety in all development andinfrastructure expansion activities in the cityof Bangalore www.abidebengaluru.in
August 2009: Inputs were provided for thetechnical team of the National High Wayauthority of India to strengthen road safety onNational and State Highways. The NHAI inits attempt to strengthen road safety is in theprocess of constituting a road safety cell andinformation collection was identified as a keyactivity. The methodology and data from theprogramme was provided to identify specificfactors of road safety on high ways. It wassuggested to include pilot studies collectingminimal data from all fatal crashes occurringon National Highways in 2010.-www.nhai.org
November 2009: Even though the NationalDisaster Management Authority of India hasdeveloped number of measures aimed at
disaster mitigation of management, road safetywas not included in the same. Efforts weremade by the CC to integrate road safety withother disasters as the principles of management,through policies and programmes remainequally important. Need to ensure safety ofchildren through comprehensive school safetyprogramme has been highlighted.http://ndma.gov.in/
Considering the inadequacies in road crash andsuicide information, technical report wassubmitted to National Crime Records Bureauand State Crime Records Bureau to strengthendata collection mechanisms for fatal roadcrashes. Since , the FIR format and summaryformat are used for online data transmission,opportunities exist for data strengtheningactivities.
Considering the significant hardshipsexperienced by trauma patients in terms of theirability to pay in hospitals, the data related totrauma care and outcome was provided to the

62 BRSIPP 2009
expert committee constituted to developmechanisms for free treatment of injuredpersons.
In a significant development, the Ministry ofRoad Transport and Highways, established anexpert committee under the chairmanship ofMs.S. Sundar to suggest revisions for IndianMotor Vehicles Act of 1988. Even though thisissue was discussed in our nodal officers metingand was identified as a critical need, thisprovided an opportunity for providing inputsto strengthen the legislative aspects of roadsafety. The data available under theprogramme was analysed in different ways andlist of recommendations were submitted to theChairman and members of the expertcommittee. (Annexure 2) details therecommendations submitted on behalf of theprogramme. Further, some members of thecommittee were met individually to highlightimportance of revisions and doing it based ondata and evidence. - http://morth.nic.in/index2.asp?sublinkid=460&langid=2
September 2009: In a significant programme,the transport department of Government ofKarnataka in collaboration with MS RamaiahInstitute of Medical Sciences, initiated theprogramme on “Adolescents and Road safety”in Bangalore on September 7, 2009. The dataavailable in the programme specifically foryoung children in 10-20 years of age group
was provided and discussed. The programmeis likely to get expanded in the City and theentire state. The comprehensive school safetyprogramme is under development inconsultation with the Department ofcommunity medicine at MS Ramaiah MedicalCollege and initial activities are under progress.
5. Campaigns and awareness programmesUnder the programme,inputs were provided fornumber of ongoing initiatives that were aimed atincreasing awareness and importance for road safetyin the City of Bangalore by other agencies. In allthese activities, detailed discussions have been heldto identify need, type of data required, areas of focus,target audience and duration. It only made thesecampaigns more specific, targeted and focussed.
August 2009: In a documentary on pedestriansafety by the Indian Institute of Journalism andMedia, and Indian Institute of Management,data on pedestrian’s deaths and injuries inBangalore was provided to the productionteam. The necessary steps that can be taken byvarious stake holders and the people have beenhighlighted in the documentary which is in thefinal stages of development.
December 2009: In a documentary underdevelopment by Terravista Films by Sree AmithMithra, entitled “ Lives : Lost and Saved”, dataon two wheelers deaths and injuries has beenprovided to highlight the specific issues of twowheeler drivers and measures for improvingroad safety aspects. The documentary is in finalstages of production ( done at very less cost )
December 2009: In a campaign developedby www.smilingdrivers.org, specific inputs onhelmet usage, seat belt use and early traumacare have been highlighted with data from theprogramme.
In a series of day to day news relatedprogrammes by the print media, data inputson number of issues have been provided onnumber of occasions. The print media fromdifferent news paper agencies covered roadsafety aspects in the City with the data availablein the programme. All partners were alsoencouraged to write articles in the press.

63
6. Academic Activities
The partners in programme also used the data fromtheir respective Institutions and from the programme(that was made available by the CC) to present papersin various conferences and scientific meetings. Newactivities from academic institutions also wereencouraged and are in progress.
Scientific paper presentations1) Suryanarayana S P, Gautham M S, Manjunath
M, Pruthvish S: Surveillance of injuries in atertiary care hospital; presented at the 21st
Annual conference of the KarnatakaAssociation of Community Health, 10-11th
October 2009, J S S Medical College, Mysore
2) Giriyanna Gowda, Ashwath Narayana D H,Girish N Rao, Gururaj G. Road Traffic InjurySurveillance Programme at KIMS Hospital,Bangalore. Presented at the 21st Annualconference of the Karnataka Association ofCommunity Health, 10-11th October 2009, J SS Medical College, Mysore
3) Giriyanna Gowda, Ashwath Narayana D H,Girish N Rao, Gururaj G. Road Traffic Injurysurveillance programme in a Tertiary CareHospital in Bangalore City. Presented at theAnnual conference of the Indian Public HealthAssociation, Jan 22 to 24th 2010, AndhraMedical College, Vishakapatnam
4) Venkatesh P, Ashok J, Girish N, Gururaj G.Profile of rural injuries. Presented at the Annual
conference of the Indian Public HealthAssociation, Jan 22 to 24th 2010, AndhraMedical College, Vishakapatnam
5) Anita et al. Injury surveillance programme intertiary care centre. Poster presentation atINDUS 2009, Coimbatore, Oct 30 to Nov 01,2009
Technical assistance provided to Dissertationand research projects6) Dr Pallavi Sarji, Postgraduate in Community
Medicine under the guidance of Dr S PSuryanaraya, Professor of CommunityMedicine, M S Ramaiah Medical College,Bangalore – 560 054 titled “Study of gapsbetween precepts and practices of preventivemeasures and pre-hospital care among injurycases” admitted to M S Ramaiah TeachingHospital.
7) Dr Sreedhara, Postgraduate student of mastersin Hospital Administartion, PadmashreeInstitute of Management initiated a studyentitled “processing of medico legal cases inselected hospitals in Bangalore”.
8) Dr. Shilpa R, Post graduate in CommunityMedicine under the guidance of Dr. BobbyJoseph, Department of Community Medicine,St. John’s Medical College started her M.D.,thesis on “Incidence and Profile of OccupationalInjuries among residents of villages under theSarjapur PHC area, Bangalore”.
9) In July 2009, BMTC took keen interest tounderstand drivers knowledge and practicesand initiated a survey among BMTC bus drivers.Nearly 4200 interviews have been completedand data analysis is in progress.
10) In addition, information pertaining to datafrom Department of Plastic Surgery and Burnsward, Victoria Hospital was utilised for displayduring Suvarna Arogya Seva Trust, a healthinsurance initiative by Government ofKarnataka for Below Poverty Line, at Gulbargaon January 1st 2010.
64 BRSIPP 2009
D. Sustainability issuesAdministrative support through a programmaticapproach – motivated and committed staff - resourceavailability – necessary back up services – continuousfeedback – and data utilization / application forpolicies and programmes are crucial for Road safetyand injury prevention and surveillance programmesto be effective. Injury surveillance, especially forRoad traffic injuries and suicides, should become aninbuilt component of injury prevention and control,road safety and suicide prevention programmes,respectively. Feasibility, sustainability and costeffectiveness should be addressed from the beginning.These aspects and possible mechanisms have beendiscussed in our previous report and some salientpoints are provided below.
There is need for a dedicated agency in thecity that can drive these programmes on acontinuous basis. This agency has to beidentified, supported and nurtured to undertakethese activities with resource allocation andcapacity strengthening at appropriate levels.As injuries are a health problem, theDirectorate of Health Services should take aleadership role and inform all major hospitals
for introduction of Emergency trauma carerecord on a regular basis. Necessaryadministrative notifications should be sent toall partnering health institutions. Apart fromsurveillance, number of other activities likeadvocacy, capacity building, monitoring andevaluation should be initiated.Capacity strengthening programmes for seniorand mid level policy makers and trainingprogrammes for other staff from police andhealth sector should be held at periodicalintervals. Injury surveillance will ensuremonitoring of activities along with data inputsfor other activities at different levels.All professionals involved in data gathering,treatment and care of injured persons inall participating institutions (police at midand junior levels + ER staff of selected –participating hospitals-medical recorddivisions) should be trained (at least twice ina year) to improve data collection, trauma careand to obtain better cooperation. The requiredtraining modules and training course contentsshould be developed jointly for ensuringuniformity in training.
7. Expansion of activitiesDuring the year, 8 new hospitals were enrolledinto the programme and these areRajarajeshwari Medical College, (MysoreRoad), Vydehi Medical College, (ITPL Road),ESI Hospital, Rajajinagar, (for occupationalinjuries). Suguna Hospital (Private Hospital),ESI Hospital, Indiranagar, (for occupationalinjuries), Ambedkar Medical College Hospital,Rajiv Gandhi Institute for Chest Diseases, andColombia Asia Hebbal and YeshwanthapurHospitals. We warmly welcome our newpartners. The nodal officers meeting was heldon 31 October 2009 and the Casualty MedicalOfficers/ Nurses training programme was heldon 26th November 2009. All the hospitals haveprinted their own forms and activities are inprogress.Discussions have been held with Bangalore citypolice and with the Centre for product design
and development at Indian Institute of scienceto initiate a centre for crash analysis tospecifically examine vehicle and road relatedfeatures for prevention and control of roadtraffic injuries.Preparations are in progress to developelectronic transmission of data from all39 police stations in the city. Thecomputerization process and related traininghas been initiated in consultation with theAdditional Commissioner for Traffic Safety inBangalore.
In summary, the activities can be summed up as -strengthening of data collection, data ledprogrammes, and beginning of new activities. Mostimportantly, linkages were established, partnershipsstrengthened and new ideas were discussed duringthe year.

65
Variety of communication channels like reports,fact sheets, websites and other channels shouldbe utilised for sensitisation, awareness buildingand use of data. The local decision makingbodies and respective departments at higherlevels should utilize and apply data fordevelopment – implementation of interventionsand for larger decision making process as well.The programme should be monitoredcontinuously and evaluated at periodicalintervals for further modifications andimprovements.A programme of this nature will requirecooperation – participation – support of stakeholders, police and transport officials, hospitaladministrators, nodal officers and teams incasualty departments. Inputs to strengthen this
component through training programmes,information sharing, continuous feedback,using data at individual and hospital levels,and joint collaborative programmes needs tobe promoted.Resources are required in the long run forcontinuous running of the surveillanceprogramme and this should be part of the largerroad safety and injury prevention programme; not an isolated activity on its own. An initialinvestment is very much required till theprogramme gets established. The localgovernment or Directorate of health servicesor state health division or city police or BBMPshould take ownership of the programme. Injuryand RTI surveillance is a part of larger injuryprevention and control and road safetyactivities.
With existing police, transport and health systemsreporting systems being patchy and fragmented and,research in all these sectors being extremely limitedin India, the obvious questions is “ how can weimprove data availability to formulate – implement– monitor and evaluate road safety and other injuryprevention and control programmes”. One of thepossible methods is to implement a surveillanceprogramme in sentinel institutions across the countryon selected injuries (RTIs and suicides) with a focuson moderate and severe injuries. The scope andambit of surveillance can be expanded to the levelof trauma registries or kept to a simple level
The way forward
depending on the technical expertise available ininstitutions and mechanisms that would evolve toaddress road safety and other IPC issues. The needfor evidence-based programmes, which wouldresult in a noticeable reduction in deaths andhospitalizations, has been acutely felt. It is hopedthis joint partnership programme with leadinginstitutions and organizations in the city ofBengaluru would pave the way to formulate effectiveinjury prevention policies and programmes inthe coming years. Injury surveillance should be apart of larger road safety and injury preventionactivities.

66 BRSIPP 2009
How can we survive?
Mr "S" is a 40 year old male residing at Hosakere in rural Bengaluru. He could not complete his
education beyond 6th standard and is now working as a daily wage laborer. In the evening at
about 6.20 pm, when walking back to home, he was hit by a two wheeler from behind at the bus
stand on the Devanahalli - Hosakote main road. He was standing on the road and was about to
cross the road, when the speeding two wheeler hit him and speeded without stopping. The
injuries were serious: apart from abrasions over face and upper limbs, he complained of pain in
the sides of the abdomen and said he could not move his legs. Seeing that he had no bleeding from
his ears or nose and not suspecting head injury, the government hospital doctor referred him to the
Government hospital in Bangalore as he was still not conscious. Nearly 4 to 5 hours were spent in
getting an ambulance transfer organized. On arrival at the hospital in Bangalore, the CMO sus-
pected internal injury and was shifted to the surgical unit for emergency surgery. S had no money
with him, and his wife and young son who accompanied him also did not have any money, and
desperately tried requesting everyone for some help. They had not had any meal since afternoon.
Fortunately, investigations revealed that there was no major damage to internal organs and he
was shifted to the ward within 24 hours. Meanwhile, his wife had gone back to their village and
had come back with a loan, which they would need to repay over the next 1 to 2 years. Because of
the surgery S would not be able to go to work for almost one month.
If only, he had got the right care.....
Mr "V" is a 50 year old male coming from Chikkanayakanahalli in Tumkur district. He is a farmerand has completed middle school. The injury happened when he was traveling in his scooter nearto his agricultural fields. The scooter toppled after slipping on the mud road leading to the tankbund area. V sustained minor injuries on face and back, but had some bleeding from his nose, andthere were lacerated wounds on his scalp.. Immediately after the accident, the patient was rushedto the nearby government hospital. First aid was given by the doctor. After stitching the scalpwound, the doctor noticed continued bleeding from the nose. Suspecting traumatic brain injury,the patient was informed to go to Bangalore for further management. Till such time, V did nothave vomiting and suddenly started complaining of giddiness and could not speak. Worried afterhis condition, the family members hired a taxi and started off to Bangalore. Half way through, asthe vomiting became worse, they took him to a nearby nursing home. After giving him someinjection to stop vomiting, the doctors asked them to rush to Bangalore. On reaching Bangalore,on suggestion by one of their friends, they took V to a private hospital on the outer ring road. TheDuty doctor refused to see the patient and asked them to take the patient to the governmenthospital. It was a delay of almost 18 hours before the patient reached the right hospital. By thattime, his conditioned had worsened. A CT scan revealed a big Subdural hematoma. After theemergency surgery, V was shifted to the head injury ward for observation and has still not recov-ered totally.

67
References1. World report on road traffic injury prevention.
(eds). Peden M, Scurfield R, Sleet D, MohanD, Hyder AA, Jarawan E, et al. World HealthOrganization, Geneva, 2004.
2. World Report on Violence and Health. WorldHealth Organization, 2002.
3. Gururaj G. Road traffic Injury Prevention inIndia. National Institute of Mental Health andNeuro sciences, Publication no. 56, 2006.Bengaluru
4. Dandona R, Mishra A. Deaths due to roadtraffic crashes in Hyderabad City in India: Needfor strengthening surveillance. NationalMedical Journal of India, 2004; 17: 74-9.
5. Mohan D. The road ahead: Traffic injuriesand fatalities in India. TransportationResearch and Injury Prevention Programme.Indian Institute of Technology, Delhi, 2004.
6. Indian Council of Medical Research.Development of a feasibility module for roadtraffic injury surveillance, 2007.
7. Serving Farmers and Saving Farming. Fifthand Final report. Jai Kisan: Revised draftnational policy for farmers. Report of thenational Commission on Farmers (availableat http://krishakayog.gov.in/ accessed on10th Feb 2010)
8. Prevention of Domestic Violence Act (http://ncw.nic.in/DomesticViolenceBill2005.pdf)
9. Krug E(ed). Injury: A leading cause of theglobal burden of disease. Geneva: Worldhealth Organization:1999
10. Gielen AC, Sleet DA and Diclemente RJ (eds).Injury and Violence prevention: Behaviouralscience theories, methods and applications.Jossey - Bass United States of America, 2006.
11. World Health Organization. InternationalClassification of Diseases. 10th Edition, 2004.
12. World Health Organization. ICECI –Guidelines for counting and classifyingexternal causes of injuries for prevention andcontrol. Report No. 208, April 1998.
13. Haddon Jr W. The changing approach to theepidemiology, prevention and ameliorationof trauma: the transition to approachesetiologically rather than descriptively.American Journal of Public Health 1968; 58:1431 – 1438.
14. World Health Organization. Injurysurveillance guidelines (eds.). Holder Y, PedenM, Gururaj G. Geneva, 2002.
15. National Crime Records Bureau. Accidentaldeaths and suicides in India. Ministry of HomeAffairs, New Delhi, Government of India, 2008.
16. National Report - Causes of Deaths in India2001-03, Government of India (2009) MillionDeath Study (phase 1) results (http://cghr.org/publications/FINAL%20REPORT-Millon%20Death%20study%202001-2003%20-phase%201.pdf accessed on 2nd February 2010)
17. Gururaj G. Injuries in India: A NationalPerspective. In: Burden of disease in India.National Commission on Macroeconomics &Health. Ministry of Health & Family Welfare.Government of India, 2005a, 325 – 347.
18. Joshi R, Cardona M, Iyengar S, Sukumar A,Ravi Raju C, Ramaraju K et.al. Chronic diseasesnow a leading cause of death in rural India –mortality data from the Andhra Pradesh RuralHealth Initiative. International Journal ofEpidemiology 2006; 35:1522 – 1529.
19. Gajalakshmi V and Peto R. Suicide rates inrural Tamil Nadu, South India: Verbal autopsyof 39000 deaths in 1997 – 1998. InternationalJournal of Epidemiology 2007 Feb 14; [Epubahead of print]
20. Singh RB, Singh V, Kulshrestha SK, Singh S,Gupta P, Kumar R et al. Social class and all-
68 BRSIPP 2009
cause mortality in an urban population of NorthIndia. Acta Cardiology 2005; 60(6): 611 – 617.
21. Dandona R, Kumar GA, Ameer MA, AhmedGM, Dandona L. Incidence and burden of roadtraffic injuries in urban India. Inj Prev. 2008Dec;14(6):354-9.
22. Dandona R, Mishra A. Deaths due to roadtraffic crashed in Hyderabad city in India: needfor strengthening surveillance. Natl Med JIndia. 2004 Mar-Apr;17(2):74-9
23. Vijay kumar L, Rajkumar S. Are risk factorsfor suicide universal? A case-control study inIndia. Acta Psychiatrica Scandivaica 1999;99: 407-11.
24. Kaur R, Garg S. Domestic Violence againstwomen: A qualitative study in a ruralcommunity. Asia Pac Journal of Public Health.2009 Aug 23.
25. Study on child Abuse: India 2007. Ministry ofWomen and Child Development, Governmentof India.
26. Gururaj G, Aeron Thomas A, Reddi MN.Underreporting of road traffic injuries inBengaluru. Implications for road safety policiesand programmes. Proceedings of the 5th worldconference on injury prevention and control.New Delhi: Macmillan India Ltd, 2000b
27. Varghese M, Mohan D. Transportation injuriesin rural Haryana, North India. Proceedings ofthe international conference on traffic safety.New Delhi: Macmillan India Ltd., 2003; 326-9.
28. Bengaluru Injury/Road traffic InjurySurveillance Programme: A feasibility study.Bengaluru Injury Surveillance Collaboratorsgroup, Gururaj et al. National Institute ofMental Health and Neuro sciences, PublicationNo. 68, Bengaluru,2008
29. Gururaj G, Shastry KVR, ChandramauliAB, Subbakrishna DK, Krous JF, Traumaticbrain injury, National institute of Mental Healthand Neuro Sciences, Publication No. 61, 2005
30. Gururaj G. Head injuries and Helmets: helmetlegislation and Enforcement in Karnatakaand India, NIMHANS Publication No. 62,Bangalore, India, 2006.
31. Gururaj G. Das BS, Channabasavanna SM.The effect of Alcohol on incidence, Severity,and Outcome from Traumatic Brain Injury.Journal of Indian Medical Association, 102(03),March 2004,157-63.
32. Gururaj G. Drinking and Driving-PublicHealth Alert. Bengaluru Injury SurveillanceProgramme. National Institute of MentalHealth and Neurosciences, 2008
33. Seat-belts and child restraints: a road safetymanual for decision-makers and practitioners.London. FIA Foundation for the AutomobileSociety, 2009
34. GRSP. Speed management: a road safety manualfor decision-makers and practitioners. Geneva,Global Road Safety Partnership, 2008
35. Pallavi Sarji. Study of Gaps between preceptsand practices of preventive measures and prehospital care among injury cases admitted toM.S. Ramaiah Teaching Hospital.
36. Ashok J. Epidemiological profile of domesticaccidents. Dissertation submitted to theRajiv Gandhi University of Health Sciences,Bangalore, Karnataka 2002.
37. Gururaj G, Das BS, Kalliaperumal VG-Thestatus and impact of prehospital care onoutcome and survival of head injured personsin Bangalore. Journal of Academy of HospitalAdministration,11(1), 1999, 7-8.
38. Gururaj G, Sateesh VL- Assessment of facilitiesof casualty and emergency services inhospitals at Bangalore. Journal of Academyof Hospital Adm.,11(1), 1999, 9-10.
39. Gururaj G, Girsih N, Isaac MK, SubbakrishnaDK. Final report of the project ‘Health behaviourSurveillance’ submitted to the Ministry of Healthand Family Welfare, Government of India; 2004.

69
Annexure - 1The cases of Injured and Killed in India for various causes, 2008
A Unintentional injuriesI Air-Crash 0 0 0 0 1 19II Collapse of Structure (Total) 16 6 29 149 991 28331 House 0 0 3 37 261 11732 Building 7 3 7 14 107 2493 Dam 0 0 0 6 2 664 Bridge 0 0 0 0 22 935 Others 9 3 18 92 599 1252III Drowning (Total) 7 102 15 2173 582 272061 Boat Capsize 0 0 0 29 58 9792 Other Cases 7 102 15 2144 524 26227IV Electrocution 3 49 11 388 400 8067V Explosion (Total) 4 0 4 11 1719 7921 Bomb Explosion 4 0 4 0 1588 4902 Others (Boilers, Gas Cyld. etc.) 0 0 0 11 131 302VI Fall (Total) 10 85 12 462 1778 106371 From Height 10 80 12 439 744 87572 Into Pit/Manhole 0 5 0 23 1034 1880VII Factory 0 0 0 29 506 12291 Machine Accidents 0 0 0 26 461 8582 Mines or Quarry Disaster 0 0 0 3 45 371VIII Fire (Total) 19 314 27 1587 2987 224541 Fireworks/Crackers 1 0 1 29 194 3422 Short-Circuit 0 4 1 102 202 10983 Cooking Gas Cylinder/Stove Burst 18 50 18 260 316 36284 Other Fire Accidents 0 260 7 1196 2275 17386IX Fire-Arms 0 0 0 7 734 1639X Killed by Animals 0 0 3 62 134 827XII Poisoning (Total) 119 30 132 1838 4405 242611 Food/Accidental intake of Insect. etc. 0 8 0 107 2098 78292 Spurious/Poisonous liquor 0 10 0 188 181 13583 Leakage of gases etc. 0 1 0 32 6 2474 Snake Bite/Animal Bite 3 1 9 658 1703 78255 Other 116 10 123 856 417 7002XIII Stampede 0 0 0 6 92 434XIV Traffic Accidents (Total) 6180 865 63314 10232 473562 1445871 Road Accidents 6180 865 63281 8814 469156 1182392 Rail-Road Accidents 0 0 33 0 124 22223 Other Railway Accidents 0 0 0 1418 4282 24126XV Other Causes 65 600 65 1117 4387 35135XVI Causes Not Known 0 199 0 1074 1493 13962
Total of unintentional injuries 6430 2524 63620 20129 498124 318316B Intentional InjuriesXVII Intentional Injury Deaths1 Homicides* 0 253 1593 359622 Dowry deaths* 0 54 251 80933 Suicides 0 2396 12222 125017XVIII Other Intentional Injuries*1 Attempt to commit murder 264 1251 274012 Rape 62 436 207373 Kidnapping and abduction 119 680 275614 Molestation 187 1828 387345 Sexual harassment 2 28 109506 Cruelty by husband and relatives 290 2507 759307 Other IPC crimes 10969 60853 8292068 Others 15156 53023 959154
Total of intentional injuries 27049 2736 120606 14148 1989673 166692Grand Total (A+B) 33479 5260 184226 34277 2487797 485008
Sl. No CausesInjured Killed
Bengaluru
Injured Killed
Karnataka
Injured Killed
India
* Data from Crime in India Report, 2007 Source: NCRB Report 2008

70 BRSIPP 2009
Annexure - 2Extracts of the report submitted to the expertcommittee set up for revisions of IndianMotor Vehicles Act
General Observations
1. With increase of road deaths and injuries inIndia due to combination of several factors,the decision to revise the IMV act is timely andappropriate. The proposed revision after 20years has to keep changes that are likely tooccur in the coming years and possible futuredevelopments.
2. All road safety laws need to be framed for safetyand health of people and the expected outcomesand impact of the act need to be measuredby reduction of deaths, hospitalizations,disabilities and socioeconomic losses.
3. The revised IMV ACT should have individualand separate sections with regard to Transportvehicles, Roads and environment, Road safety,insurance procedures and compensations. Thepresent Act is a mix up of all issues and needsto be broken up into different sections. Therecommendations provided here are withreference to road safety aspects.
4. All revisions are to be based on data andevidence available in the past few years fromthe Indian region and should also considerinternational developments and experiences.
5. The act should have specific sections that aremandatory for different groups and should bebased on consensus in the early stages to avoiddelays in implementation.
6. The entire system should be made simple andeasy to follow, thereby giving less room formisinterpretations by different groups. The lawshould be strong enough to achieve the desiredgoal.
7. Penalties should be strong enough and realisticbased on an understanding of human
psychology and limitations of human behavior(In the present act, in many places it ismentioned as life imprisonment and otherpunishments which are never followed) to deterpeople from taking risky behaviors.
8. The committee can consider uniform penaltylevels with regard to road safety laws as itbecomes easier for people to understand andremember ( Ex: the fine could be Rs.2000 fornot wearing helmets, drinking and driving, overspeeding , driver license etc., .) and these canbe grouped together in some areas. Higherlevel penalties can be considered for seriousoffenses. Areas that are of high importanceshould be kept uniform with moderately highpenalty levels.
9. The implementation of laws should be uniformacross the country with no provision for changeor manipulation by states. With thedevelopment of national databases for vehicleregistration and driver licensing systems thisshould be easy to implement.
10. Implementation mechanisms also need to bespecified and in some areas requirecoordination with related ministries of health,NHAI, police, law and others to developimplementation mechanisms. These should bediscussed with concerned professionals andsectors in the early stages to developcomprehensive mechanisms forimplementation.
11. The revised laws should be monitored seriouslyto see the impact of changes and overallreduction of road deaths and fatalities. It wouldbe helpful to establish centers for monitoringof laws and to build road safety informationsystems in select centers across the country.
The impact of all laws needs to be measured in termsof reductions in deaths, hospitalisations anddisabilities due to road crashes. This requirespromoting and strengthening crash investigation andanalysis as an independent area.

71
Specific observations
A. The Indian Penal code sections that arerelevant to road safety:
1. Section 279. Rash driving or riding on a publicway. “Whoever drives any vehicle, or rides, onany public way in a manner so rash ornegligent as to endanger human life, or to belikely to cause hurt or injury to any other person,shall be punished with imprisonment of eitherdescription for a term which may extend to sixmonths, or with fine which may extend to onethousand rupees, or with both.”
2. Section 304A. Causing death by negligence“Whoever causes the death of any person bydoing any rash or negligent act not amountingto culpable homicide, shall be punished withimprisonment of either description for a termwhich may extend to two years, or with fine,or with both.”
3. Section 336. Act endangering life or personalsafety of others “Whoever does any act so rashlyor negligently as to endanger human life or
the personal safety of others, shall be punishedwith imprisonment of either description for aterm which may extend to three months, orwith fine which may extend to two hundredand fifty rupees, or with both.”
4. Section 337. Causing hurt by act endangeringlife or personal safety of others. “Whoevercauses hurt to any person by doing any act sorashly or negligently as to endanger humanlife, or the personal safety of others, shall bepunished with imprisonment of eitherdescription for a term which may extend to sixmonths, or with fine which may extend to fivehundred rupees, or with both.”
5. Section 338. Causing grievous hurt by actendangering life or personal safety of others“Whoever causes grievous hurt to any personby doing any act so rashly or negligently as toendanger human life, or the personal safety ofothers, shall be punished with imprisonmentof either description for a term which mayextend to two years, or with fine whichmay extend to one thousand rupees, or withboth.”

72 BRSIPP 2009
Spec
ific
rec
omm
end
atio
ns
for
mod
ific
atio
ns
of e
xist
ing
act
in s
elec
t ar
eas
of r
elev
ance
to
road
saf
ety
Sr.
No
Dom
ain
Exi
stin
g Pr
ovis
ion
Just
ific
atio
n f
or r
evis
ion
Prop
osed
ch
ange
s
1D
rive
r Li
cens
ing
Syst
ems
The
exi
stin
g ac
t st
ipul
ates
tha
t N
ope
rson
sha
ll dr
ive
a m
otor
veh
icle
inan
y pu
blic
pla
ce u
nles
s he
hol
ds a
nef
fect
ive
driv
ing
licen
se i
ssue
d to
him
aut
hori
zing
him
to
driv
e th
eve
hicl
e.
Req
uir
emen
ts in
clu
de
a.Pr
oof o
f age
b.S
elf
dec
lara
tio
n o
f p
hys
ical
fitn
ess
and
med
ical
cer
tifi
cate
from
a p
hysi
cian
req
uire
d
c.In
cas
e o
f d
rive
rs o
f go
od
sca
rria
ges
carr
yin
g d
ange
rou
san
d ha
zard
ous
good
s, m
enti
ono
f m
inim
um
ed
uca
tio
nal
qual
ifica
tions
.
The
lic
ensi
ng
auth
orit
y al
so h
aspo
wer
s to
rev
oke
the
lice
nse
in
cert
ain
situ
atio
ns
Stu
die
s h
ave
fou
nd
th
at n
earl
y30
% o
f dri
vers
dri
ve w
itho
ut a
val
iddr
ivin
g lic
ense
. In
addi
tion
, it i
s w
ell
know
n th
at a
nyon
e ca
n ob
tain
adr
ivin
g lic
ense
in
any
stat
e or
cit
yw
itho
ut g
oing
thr
ough
any
for
mal
proc
edur
es
1.M
anda
tory
dri
ving
sch
ools
cer
tifi
cati
on w
ith
perm
issi
on to
run
driv
ing
scho
ols s
houl
d be
est
ablis
hed.
The
New
act
shou
ld sp
ecify
crit
eria
's an
d gu
idel
ines
for
runn
ing
driv
ing
scho
ols.
2.T
he A
ct s
houl
d co
me
out w
ith
one
set o
f ins
truc
tion
s fo
r pu
blic
on p
roce
dure
s an
d te
sts
to b
e co
mpl
eted
for o
btai
ning
a li
cens
e.A
s na
tion
al d
ata
base
s of
dri
vers
are
bei
ng s
et u
p, t
he s
yste
msh
ould
be
unif
orm
thr
ough
out
the
coun
try.
Thi
s in
form
atio
nsh
ould
be
avai
labl
e in
all
stat
e la
ngua
ges a
nd sh
ould
be
disp
laye
din
all
publ
ic s
choo
ls.
3.A
nat
iona
l cor
e cu
rric
ulum
sho
uld
be d
evel
oped
for
all
driv
erte
sts
inco
rpor
atin
g he
alth
, saf
ety,
aw
aren
ess
and
rule
s of
roa
dis
sues
.
4.D
rivi
ng t
ests
sho
uld
be m
ade
stri
cter
. T
he o
nlin
e pr
oced
ures
that
are
bei
ng
esta
bli
shed
are
hel
pfu
l m
ore
fro
m a
nad
min
istr
ativ
e po
int
of v
iew
and
do
not
real
ly t
est
driv
ing
know
ledg
e an
d sk
ills.
Min
imum
gui
delin
es sh
ould
be
esta
blis
hed
in t
his
rega
rd.
5.T
he
syst
em o
f su
spen
din
g/ca
nce
lin
g li
cen
ses
shou
ld b
ein
trod
uced
and
lis
t of
off
ence
s fo
r w
hich
the
se c
an b
e do
nesh
ould
be
noti
fied
for
publ
ic in
form
atio
n.
6.T
he f
ine
of R
s.50
0 sh
ould
be
incr
ease
d.
7.R
enew
al o
f dri
ver
licen
se o
f ind
ivid
uals
abo
ve 5
0 ye
ars
shou
ldbe
bas
ed o
n he
alth
sta
tus
and
prev
ious
hea
lth
reco
rds.
8.G
radu
ated
dri
ver
licen
se s
yste
ms
shou
ld b
e in
trod
uced
and
mad
e co
mpu
lsor
y ac
ross
the
cou
ntry
, es
peci
ally
for
dri
vers
of
publ
ic t
rans
port
veh
icle
s an
d ot
her
heav
y ca
rrie
rs.
2A
ge o
f dri
ving
No
pers
on u
nder
the
age
of e
ight
een
year
s sh
all d
rive
a m
otor
veh
icle
inan
y pu
blic
pla
ce p
rovi
ded
that
am
otor
cyc
le w
ith e
ngin
e ca
paci
ty n
otex
ceed
ing
50 c
c m
ay b
e dr
iven
in a
Dat
a fr
om B
RSI
P ha
s re
veal
ed t
hat
11
% o
f in
jure
d d
rive
rs w
ere
child
ren
less
tha
n 18
yea
rs.
Youn
gch
ildre
n le
ss t
han
18 y
ears
are
als
ofo
und
to b
e dr
iver
s on
the
road
s. N
o
Gra
duat
ed d
rive
r li
cens
ing
syst
ems
shou
ld b
e in
trod
uced
and
proc
edur
es n
eed
to b
e sy
stem
atic
. T
he t
rans
itio
n fr
om L
earn
er's
licen
se to
full
licen
se s
houl
d be
wat
ched
and
ther
e sh
ould
be
spec
ific
rest
rict
ions
for
lear
ners
. The
fina
l lic
ense
sho
uld
be a
vaila
ble
afte
rco
mpl
etio
n of
18
year
s an
d af
ter
com
plet
ion
of te
sts.

73
Sr.
No
Dom
ain
Exi
stin
g Pr
ovis
ion
Just
ific
atio
n f
or r
evis
ion
Prop
osed
ch
ange
s
pu
bli
c p
lace
by
a p
erso
n a
fter
atta
inin
g th
e ag
e of
six
teen
yea
rs.
spec
ific
det
ails
on
actu
al n
umbe
r of
driv
ers
less
tha
n 16
or
18 y
ears
are
avai
labl
e in
the
coun
try.
The
pen
alty
is a
fine
of R
s.50
0 w
ith
or w
itho
ut im
pris
onm
ent.
The
latt
eris
not
fol
low
ed i
n an
y pa
rt o
f th
eco
untr
y.
The
pen
alty
leve
ls s
houl
d be
incr
ease
d to
Rs.
1000
uni
form
ly a
cros
sth
e co
untr
y fo
r th
ose
less
tha
n 16
yea
rs a
nd f
or t
hose
bel
ow 1
8ye
ars
who
dri
ve a
veh
icle
wit
hout
a li
cens
e.
Sect
ion
112
pert
ains
to
lim
its
ofsp
eed
and
proh
ibit
s dr
ivin
g of
am
otor
veh
icle
or
it b
eing
allo
wed
tobe
dri
ven
in a
ny p
ublic
pla
ce a
t a
spee
d e
xcee
din
g th
e m
axim
um
perm
issi
ble
spee
d.
Th
e Pe
nal
ty f
or
exce
edin
g th
epr
escr
ibed
spe
ed l
imit
is
up t
o R
s.10
00,
abet
men
t fo
r ov
er s
peed
ing,
Rs 3
00, f
or o
vert
akin
g pe
rilo
usly
, for
fail
ing
to c
onfe
r w
ay t
o sa
ncti
onov
erta
kin
g an
d o
vert
akin
g fr
omw
rong
sid
e th
e fi
ne is
Rs
100.
Lim
ited
stu
dies
in In
dia
have
sho
wn
that
exc
essi
ve s
peed
in u
rban
are
asan
d
on
h
igh
way
s is
a
maj
or
cont
ribu
tor
for
cras
hes.
Dat
a fr
om B
RSI
P ha
s sh
own
the
incr
easi
ng o
ccur
renc
e of
cra
shes
on
the
outs
kirt
s of
th
e ci
ty a
nd
in
per
iph
eral
are
as,
wh
ere
spee
dex
ceed
s 80
km
per
hou
r.
Stu
die
s d
one
on h
igh
way
usi
ng
spee
d ca
mer
as i
ndic
ated
tha
t th
esp
eed
of
hea
vy v
ehic
les,
pu
blic
tran
spor
t bus
es a
nd c
ars
wer
e in
the
rang
e of
100
- 1
40 k
ms
, ev
en i
np
lace
s w
her
e h
igh
way
s p
ass
thro
ugh
villa
ges
and
othe
r tr
affi
cge
nera
tors
.
Th
is
is
also
su
bst
anti
ated
b
yin
crea
sing
cap
ture
of
viol
atio
ns b
yB
anga
lore
cit
y po
lice
wit
h th
e he
lpof
inte
rcep
tors
.
The
law
sho
uld
have
cle
ar s
peci
fica
tion
s on
spe
ed in
dif
fere
nt u
rban
- rur
al -
high
way
s - r
esid
enti
al a
reas
- ne
ar t
o sc
hool
s /
hosp
ital
s /
othe
r tr
affi
c ge
nera
tors
.
The
pen
alty
lev
els
are
not
only
low
, an
d sh
ould
be
incr
ease
dsu
bsta
ntia
lly a
nd l
inke
d to
cra
sh o
utco
mes
. Fo
r ex
ampl
e, i
f cr
ash
resu
lt in
dea
th, t
he p
enal
ty s
houl
d be
hig
her
and
to b
e m
odif
ied
for
othe
r cr
ashe
s w
ith
diff
eren
t ou
tcom
es.
As
it is
dif
ficu
lt to
est
ablis
h ev
iden
ce fo
r cou
rts,
mec
hani
sms
shou
ldal
so b
e st
ren
gthe
ned
for
mon
itor
ing
of s
peed
s, c
oord
inat
ion
mec
hani
sms
alon
g w
ith
high
pen
alty
leve
ls.
It s
houl
d be
mad
e m
anda
tory
for
all
publ
ic t
rans
port
veh
icle
s an
dhe
avy
vehi
cles
to b
e fi
tted
wit
h sp
eed
gove
rnor
s or
tach
omet
ers
toco
ntro
l spe
eds
auto
mat
ical
ly.
All
publ
ic t
rans
port
veh
icle
s m
ust
be f
itte
d w
ith
clos
ing
door
s(a
utom
atic
or m
anua
l) a
nd sh
ould
be
stri
ctly
enf
orce
d to
avo
id p
eopl
efa
lling
from
mov
ing
vehi
cles
, esp
ecia
lly in
turn
s, w
hen
vehi
cles
are
in h
igh
spee
ds.
Spee
ding
and
dri
ving
3
Eve
ry p
erso
n d
rivi
ng
or r
idin
g(o
ther
wis
e th
an i
n a
side
car
, on
am
oto
r cy
cle
of
any
clas
s o
rde
scri
ptio
n) s
hall,
whi
le in
a p
ublic
plac
e; w
ear
(pro
tect
ive
head
gea
rco
nfo
rmin
g to
th
e st
and
ard
s of
Bur
eau
of I
ndia
n St
anda
rds)
.
At
the
nat
ion
al l
evel
, da
ta f
rom
NC
RB
in
dic
ate
that
19
.08
% o
fde
aths
wer
e am
ong
two
whe
eler
ride
rs
Ho
wev
er,
all
ind
epen
den
tep
idem
iolo
gica
l stu
dies
indi
cate
that
The
Act
sho
uld
be m
ore
spec
ific
and
com
preh
ensi
ve in
all
resp
ects
.
Hel
met
legi
slat
ion
shou
ld c
over
all
mot
orcy
cle
user
s ab
ove
18 y
ears
and
all c
lass
es o
f tw
o w
heel
er v
ehic
les.
The
legi
slat
ion
shou
ld c
over
bot
h ri
ders
and
pill
ions
.
Use
of
prot
ecti
ve d
evic
eli
ke
hel
met
s fo
r tw
ow
hee
ler
dri
vers
an
dpi
llion
s.
4

74 BRSIPP 2009
Sr.
No
Dom
ain
Exi
stin
g Pr
ovis
ion
Just
ific
atio
n f
or r
evis
ion
Prop
osed
ch
ange
s
Sec
tio
n
18
4
pro
vid
es
for
puni
shm
ent
for
dang
erou
s dr
ivin
g
Pena
lty
shal
l be
puni
shab
le f
or t
hefi
rst o
ffen
ce w
ith
impr
ison
men
t for
a te
rm w
hich
may
ext
end
to s
ixm
onth
s or
wit
h f
ine
wh
ich
may
exte
nd
to
Rs.
1000
, an
d f
or a
ny
seco
nd o
r su
bseq
uent
off
ence
, if
com
mit
ted
wit
hin
thre
e ye
ars
of th
eco
mm
issi
on o
f a
prev
ious
sim
ilar
offe
nce,
wit
h im
pris
onm
ent
for
ate
rm w
hich
may
ext
end
to tw
o ye
ars,
or w
ith
fine
whi
ch m
ay e
xten
d to
Rs.
2000
, or
wit
h bo
th.
Dan
gero
us d
rivi
ng i
s a
com
mon
lyus
ed la
y te
rm a
nd is
non
spec
ific
and
not f
ocus
ed. S
ince
it is
not
def
ined
,it
will
be
diff
icul
t to
link
and
rel
ate
this
to c
rash
es.
This
sec
tion
nee
ds to
be
defin
ed p
rope
rly.
Wha
t is
dang
erou
s dr
ivin
gsh
ould
be
iden
tifie
d an
d de
fined
and
cor
resp
ondi
ngly
, pen
alty
leve
lsne
eds
to b
e re
vise
d.
Even
thou
gh li
fe im
pris
onm
ent i
s co
mm
only
see
n in
IMV
act
, it h
asno
t be
en a
pplie
d ef
fect
ivel
y du
e to
lega
l bar
rier
s an
d ot
her
issu
es
Dan
gero
us d
rivi
ng5
At
pre
sen
t th
e p
enal
ty f
or
no
tw
eari
ng a
hel
met
is R
s. 1
00.
At p
rese
nt, m
any
of th
e In
dian
stat
esdo
not
hav
e he
lmet
legi
slat
ion;
and
in o
ther
sta
tes,
the
re is
onl
y pa
rtia
lle
gisl
atio
n (f
or r
ider
s on
ly a
nd f
orse
lect
cla
ss o
f tw
o w
heel
ers)
At
pres
ent
the
law
en
forc
emen
tag
enci
es o
nly
look
for
the
pres
ence
of a
hel
met
on
the
head
and
do
not
look
into
whe
ther
it is
a s
tand
ard
orno
n-st
anda
rd h
elm
et
near
ly 3
0 -
50 %
of
both
fat
al a
ndno
nfat
al i
njur
ies
are
amon
g tw
ow
heel
er r
ider
s an
d pi
llion
s.
Spec
ific
ally
, da
ta f
rom
BR
SIP
for
2008
ind
icat
e th
at 2
6 %
of
deat
hsan
d 42
% o
f ho
spit
alis
ed i
njur
ies
wer
e am
ong
two
whe
eler
rid
ers.
Pilli
ons
acco
unte
d fo
r 11
% o
f roa
dde
aths
and
10
% o
f ho
spit
alis
edin
juri
es.
The
dat
a al
so r
epor
t tha
t onl
y 33
%of
rid
ers
and
38%
of
non
fata
lly
inju
red
had
wor
n he
lmet
s at
the
tim
e of
cra
sh.
Furt
her,
repo
rts
from
all
over
the
wo
rld
an
d f
rom
Wo
rld
Hea
lth
Org
anis
atio
n
in
par
ticu
lar
conc
lusi
vely
ind
icat
e th
at h
elm
etle
gisl
atio
n an
d en
forc
emen
t is
one
of t
he p
rove
n a
nd
cost
eff
ecti
vem
eth
od o
f re
du
cin
g d
eath
s an
din
juri
es a
mon
g tw
o w
heel
er r
ider
s.
The
law
sho
uld
be u
nifo
rm a
cros
s th
e co
untr
y an
d th
is s
houl
d be
ace
ntra
l law
with
no
flexi
bilit
y fo
r sta
tes t
o m
odify
as p
er c
onve
nien
ce.
The
pena
lty
for n
ot w
eari
ng h
elm
et s
houl
d be
in th
e ra
nge
of R
s.50
0-
Rs.
1000
.
Hel
met
s w
orn
shou
ld m
eet s
tand
ards
as
laid
dow
n by
the
Bur
eau
ofIn
dian
Sta
ndar
ds. U
se o
f hal
f hea
d he
lmet
s, c
onst
ruct
ion
helm
ets,
brok
en h
elm
ets
and
othe
rs s
houl
d be
tota
lly b
anne
d.
As
ther
e ar
e no
spe
cifi
ed s
tand
ards
for
chi
ld h
elm
ets
in I
ndia
, it
shou
ld b
e co
nsi
der
ed s
epar
atel
y af
ter
form
ula
tin
g n
eces
sary
guid
elin
es.
Law
sho
uld
be a
ppli
cabl
e fo
r al
l ca
tego
ries
of
mot
or v
ehic
les,
irre
spec
tive
of
engi
ne p
ower
.

75
Sr.
No
Dom
ain
Exi
stin
g Pr
ovis
ion
Just
ific
atio
n f
or r
evis
ion
Prop
osed
ch
ange
s
The
exi
stin
g ac
t un
der
Sect
ion
189
stip
ulat
es th
at W
hoev
er w
itho
ut th
ew
ritt
en
con
sen
t o
f th
e st
ate
gove
rnm
ent
perm
its
or t
akes
par
tin
a ra
ce o
r tri
al o
f spe
ed o
f any
kin
dbe
twee
n m
otor
veh
icle
s in
an
ypu
blic
pla
ce.
Th
is s
hal
l b
e p
un
ish
able
wit
him
pris
onm
ent f
or a
term
whi
ch m
ayex
tend
to o
ne m
onth
, or
wit
h a
fine
whi
ch m
ay e
xten
d to
Rs.
500
or w
ith
both
.
No
scie
ntifi
c da
ta is
ava
ilabl
e on
this
in In
dia
, but
ane
cdot
al m
edia
repo
rts
ind
icat
e th
at t
his
is
a co
mm
onoc
curr
ence
Thi
s sh
ould
be
stri
ctly
mod
ifie
d an
d en
forc
ed a
s it
is
beco
min
g a
com
mon
pra
ctic
e.
The
pen
alty
sho
uld
be in
the
rang
e of
Rs.
2500
- R
s.30
00 a
nd li
nked
to s
peed
ing
and
driv
ing.
Rac
ing
on r
oads
6
Wh
oev
er
wh
ile
dri
vin
g
or
atte
mpt
ing
to d
rive
a m
otor
veh
icle
a.ha
s in
his
/her
blo
od a
lcoh
olex
ceed
ing
30 m
g pe
r 10
0 m
l of
bloo
d de
tect
ed i
n a
test
by
abr
eath
ana
lyze
r or
b.is
und
er th
e in
flue
nce
of a
dru
gto
su
ch a
n e
xten
t as
to
be
inca
pabl
e of
exe
rcis
ing
prop
erco
ntro
l ove
r th
e ve
hicl
e.
A p
olic
e of
fice
r in
Uni
form
or
ano
ffic
er o
f th
e M
oto
r Ve
hic
les
depa
rtm
ent c
an a
sk fo
r br
eath
test
sto
be
done
if
they
so
susp
ect
the
driv
er o
f th
e m
otor
veh
icle
to
beun
der
the
infl
uenc
e of
alc
ohol
.
Pena
lty
for
drin
king
and
dri
ving
shal
l be
pu
nis
habl
e fo
r th
e fi
rst
offe
nce
wit
h im
pris
onm
ent
for
ate
rm w
hic
h m
ay e
xten
d t
o s
ixm
onth
s, o
r w
ith
fine
whi
ch m
ayex
tend
to
two
thou
sand
rup
ees
orw
ith
both
and
for
a se
cond
or
Ther
e is
no
natio
nal d
ata
on d
rink
ing
and
driv
ing
as r
epor
ted
in N
CR
Bre
port
s.
How
ever
, se
vera
l ep
idem
iolo
gica
lst
ud
ies
fro
m
Ban
gal
ore
h
ave
repo
rted
rep
eate
dly
that
one
thi
rdof
cra
shes
occ
ur d
urin
g ni
ght
tim
e.A
mon
g th
ese,
the
inv
olve
men
t of
alco
hol
vari
es f
rom
20
% t
o 40
%,
and
is fo
und
to b
e a
maj
or ri
sk fa
ctor
.
Stu
die
s h
ave
also
rep
orte
d t
he
alco
hol
invo
lvem
ent
in b
oth
the
inju
red
and
kille
d ca
tego
ries
.
Man
y ti
mes
, pe
ople
are
in
jure
dan
d ki
lled
by o
ther
dri
vers
und
eral
coho
l in
flue
nce,
and
it
has
not
been
pos
sibl
e to
tra
ce t
hem
in
inve
stig
atio
ns.
Sinc
e bl
ood
and
brea
th a
lcoh
ol le
vels
are
no
t es
tim
ated
in
no
nfa
tal
cras
hes
an
d i
n m
ajor
ity
of f
atal
cras
hes,
this
is a
maj
or le
gal b
arri
erin
cou
rts
of la
w a
nd fo
r re
gist
erin
g
Ad
dre
ssin
g d
rin
kin
g an
d d
rivi
ng
requ
ires
a c
ombi
nat
ion
of
inte
rven
tion
s. S
ome
of t
hese
are
Che
ckin
g fo
r al
coho
l am
ong
driv
ers
in a
ran
dom
, vi
sibl
e an
dun
ifor
m m
anne
r in
all
urba
n ar
eas,
hig
hway
s an
d di
stri
cts.
Scre
enin
g fo
r al
coho
l at
the
tim
e of
app
oint
men
t of
dri
vers
of
publ
ic t
rans
port
veh
icle
s an
d he
avy
vehi
cles
Ensu
ring
that
bre
ath
alco
hol f
indi
ngs
are
acce
pted
in a
ll co
urts
of la
w a
nd to
be
com
bine
d w
ith
bloo
d an
d vi
scer
al te
sts
for f
atal
cras
hes
All
fata
l cra
shes
to b
e in
vest
igat
ed fo
r al
coho
l inv
olve
men
t.
Hav
ing
a un
ifor
m p
olic
y w
ith
rega
rd t
o lo
cati
on,
tim
ings
and
sale
of a
lcoh
ol.
Rem
ovin
g al
coho
l se
lling
out
lets
fro
m 2
00m
on
eith
er s
ide
ofhi
ghw
ays.
All
hosp
itals
(m
edic
al c
olle
ges a
nd d
istr
ict h
ospi
tals
) to
intr
oduc
esc
reen
ing
for
alco
hol p
robl
ems.
If f
atal
cra
shes
are
link
ed t
o al
coho
l inv
olve
men
t, it
sho
uld
beco
nsid
ered
und
er th
e ca
tego
ry o
f non
baila
ble
offe
nse.
Pena
lty
leve
ls t
o be
incr
ease
d to
not
less
tha
n R
s.25
00 fo
r fi
rst
offe
nce
and
Rs.
3000
for
repe
at o
ffen
ces,
incl
udin
g ca
ncel
lati
on
Dri
nkin
g an
d dr
ivin
g7

76 BRSIPP 2009
Sr.
No
Dom
ain
Exi
stin
g Pr
ovis
ion
Just
ific
atio
n f
or r
evis
ion
Prop
osed
ch
ange
s
Th
e se
ctio
n i
s n
ot c
lear
an
d i
sim
prec
ise
with
no
defin
ition
of d
rugs
(leg
al a
nd il
lega
l), l
evel
of o
ffen
se,
pena
lty
leve
ls.
Th
ere
is n
o In
dia
n d
ata
in t
his
rega
rd a
nd n
eeds
to
be e
xam
ined
base
d on
revi
ew o
f med
ical
lite
ratu
refr
om In
dia.
The
sec
tion
of t
he a
ct s
houl
d cl
earl
y lis
t out
har
mfu
l and
haz
ardo
usdr
ugs
wit
h se
vere
pen
alty
leve
ls.
To b
e im
plem
ente
d ef
fect
ivel
y, m
echa
nism
s ne
ed to
be
esta
blis
hed
for
dete
ctio
n of
dru
gs a
long
wit
h le
gal a
ccep
tanc
e.
It w
ill b
e he
lpfu
l, if
the
Act
can
men
tion
tha
t m
anuf
actu
rers
of
drug
s ne
ed to
info
rm th
e w
arni
ng s
igns
in b
ig b
old
lett
ers
for
thos
ele
gal d
rugs
like
ly to
cau
se d
row
sine
ss a
nd d
ecre
ased
con
cent
rati
onle
vels
. Thi
s sh
ould
be
mad
e a
resp
onsi
bilit
y of
dru
g m
anuf
actu
rers
.A
list
of s
uch
drug
s ca
n be
obt
aine
d fo
r M
OH
&FW
.
Use
of d
rugs
and
dri
ving
8
subs
eque
nt o
ffen
ce,
if c
omm
itte
dw
ithin
thre
e ye
ars o
f the
com
mis
sion
of th
e pr
evio
us s
imila
r of
fenc
e w
ith
impr
ison
men
t for
a te
rm w
hich
may
exte
nd t
o tw
o ye
ars
or w
ith
fine
wh
ich
m
ay
exte
nd
to
th
ree
thou
sand
rup
ees,
or
wit
h bo
th.
deta
ils i
n bo
th p
olic
e an
d ho
spit
alre
cord
s.of
lice
nse.
Thi
s sh
ould
be
unif
orm
acr
oss
the
coun
try
and
to b
ere
vise
d on
ce in
5 y
ears
.
The
pena
lty
leve
ls c
an a
lso
be b
ased
on
brea
th a
lcoh
ol le
vels
like
oR
s.25
00 f
or t
hose
wit
h 30
- 6
0 m
g /
100m
l
oR
s.40
00 f
or t
hose
wit
h 60
- 1
20 m
g /
100m
l
oR
s.50
00 f
or t
hose
abo
ve 1
20m
g /
100m
l
At
pres
ent,
the
off
ence
of
usag
e of
mob
iles w
ill b
e pu
nish
able
und
er th
eca
tego
ry o
f da
nger
ous
driv
ing
vide
Sect
ion
184
Mot
or V
ehic
les
Act
.
Even
tho
ugh,
pre
cise
num
bers
are
not a
vaila
ble
from
Indi
a, d
ata
from
oth
er
cou
ntr
ies
hav
e cl
earl
yes
tabl
ishe
d th
at c
ell p
hone
use
whi
ledr
ivin
g is
a ri
sk fa
ctor
as i
t inf
luen
ces
atte
ntio
n an
d co
ordi
nati
on.
A n
ew s
ecti
on n
eeds
to b
e in
corp
orat
ed in
the
act.
The
pen
alty
lev
els
shou
ld b
e su
bsta
ntia
lly h
igh
in t
he r
ange
of
Rs.
2000
per
off
ense
and
to
be in
crea
sed
late
r.
Use
of
cell
phon
es w
hile
driv
ing
9
Rul
e 12
5 A
of C
entr
al M
otor
Veh
icle
Rul
es,
1989
sta
tes
that
aft
er t
heye
ar 1
993,
all
man
ufac
ture
rs s
houl
deq
uip
vehi
cles
wit
h a
seat
bel
t fo
rth
e d
rive
r an
d t
he
fro
nt
seat
occu
pant
.
The
exis
ting
act h
as a
sect
ion
on se
atbe
lts
and
pena
ltie
s ar
e R
s.10
0 fo
rno
t usi
ng s
eat b
elts
.
Stud
ies
have
sho
wn
that
sea
t be
lts
are
effe
ctiv
e in
redu
cing
dea
ths
and
inju
ries
am
ong
car
occu
pant
s.
The
cur
rent
use
of s
eat b
elts
am
ong
fron
t se
at p
asse
nger
s in
Ind
ia a
reex
trem
ely
low
, le
ss th
an 1
0 %
leve
ls
The
New
act
sho
uld
mak
e it
man
dato
ry th
at s
eat b
elt t
o be
use
d by
all f
ront
sea
t ca
r oc
cupa
nts
in a
ll ca
rs. S
ince
thi
s fa
cilit
y is
alr
eady
avai
labl
e in
all
new
car
s it
sho
uld
beco
me
man
dato
ry.
In a
ddit
ion,
the
tran
spor
t of c
hild
ren
in fr
ont s
eat o
f car
s sh
ould
be
bann
ed.
The
pena
lty
for n
ot u
sing
seat
bel
ts sh
ould
be
in th
e ra
nge
of R
s.10
00-
Rs.
2000
for
car
dri
vers
not
usi
ng s
eat
belt
s.
Use
of S
eat
belt
s1
0
The
re i
s no
men
tion
of
this
in
the
exis
ting
act
No
data
is a
vaila
ble
from
Indi
a.
Th
e ef
fect
iven
ess
of t
his
in
ter-
vent
ion
has
been
wel
l est
ablis
hed
The
spec
ific
prov
isio
ns fo
r im
plem
enta
tion
of th
is n
eed
to b
e in
clud
edin
the
new
act
.U
se o
f ch
ild r
estr
aint
s in
cars
11

77
Sr.
No
Dom
ain
Exi
stin
g Pr
ovis
ion
Just
ific
atio
n f
or r
evis
ion
Prop
osed
ch
ange
s
No
clea
r di
rect
ions
in
the
exis
ting
act,
exce
pt m
enti
on o
f gla
ring
ligh
ts,
stic
kers
for
heav
y ve
hicl
es
Poor
vis
ibili
ty is
kno
wn
to b
e a
risk
fact
or f
or c
rash
es.
Seve
ral
stud
ies
have
poi
nted
ou
t th
is f
indi
ng i
nst
udie
s.
In a
qua
litat
ive
stud
y of
150
0 br
ain
inju
red
RT
I pa
tien
ts,
it w
as s
elf
rep
orte
d t
hat
22
% o
f p
atie
nts
sust
ain
ed a
cra
sh d
ue
to p
oo
rvi
sibi
lity
fact
ors.
The
New
MVA
sho
uld
spec
ify
and
incl
ude
Com
puls
ory
runn
ing
of d
ayti
me
head
light
s by
tw
o w
heel
erdr
iver
s.
Uni
form
ref
lect
ive
stic
kers
for
all v
ehic
les
shou
ld b
e in
trod
uced
and
the
dim
ensi
ons
shap
e an
d si
ze o
f re
flec
tive
mat
eria
ls f
ordi
ffer
ent
cate
gori
es o
f ve
hicl
es h
as t
o be
dec
ided
by
the
com
mit
tee.
All
vehi
cle
man
ufac
ture
rs s
houl
d be
enc
oura
ged
to m
ake
thei
rve
hicl
es in
bri
ght a
nd re
flec
tive
col
ours
. The
act
can
enp
rovi
sion
ince
ntiv
es fo
r ve
hicl
e m
anuf
actu
rers
.
All
bicy
cles
sho
uld
be m
anuf
actu
red
in y
ello
w o
r ora
nge
colo
ur.
All
whe
els
pf b
ullo
ck c
arts
to b
e pa
inte
d in
ref
lect
ive
pain
ts.
Vis
ibili
ty is
sues
12
Sect
ion
119
prov
ides
for
the
dut
yto
obe
y tr
affi
c si
gns.
Pena
lty
of
Rs
100
for
diso
beyi
ngtr
affi
c si
gn
als/
si
gn
bo
ard
,di
sobe
ying
tra
ffic
pol
ice
offi
cer
inun
ifor
m, d
isob
eyin
g m
anua
l tra
ffic
sign
als,
dri
ving
aga
inst
pol
ice
sign
al,
faili
ng t
o gi
ve s
igna
l an
d ju
mpi
ngsi
gnal
.
Dat
a on
thi
s ca
n on
ly b
e ob
tain
edfr
om p
olic
e ch
alla
ns a
nd t
his
is n
ota
spec
ific
indi
cato
r.
Thi
s se
ctio
n is
too
vagu
e an
d sh
ould
spe
cify
list
of t
hing
s dr
iver
s ar
eno
t su
ppos
ed t
o do
and
pen
alti
es t
o be
sev
ere
enou
gh c
auti
onin
gdr
iver
s no
t to
tak
e an
y ri
sks.
Obe
ying
tra
ffic
rul
es1
3
Sect
ion
128:
Saf
ety
mea
sure
s fo
rdr
iver
s and
pill
ion
ride
rs n
ot to
car
rym
ore
than
one
per
son
excl
udin
g th
eri
der.
Thi
s is
uns
peci
fic
and
act
shou
ld s
peci
fy t
his
for
diff
eren
t ty
pes
ofve
hicl
es.
Car
ryin
g ex
cess
peo
ple
onve
hicl
es1
4
The
exi
stin
g ac
t un
der
Sect
ion
186
stip
ulat
es t
hat
Who
ever
dri
ves
ave
hicl
e in
any
pub
lic p
lace
whe
n he
is t
o hi
s kn
owle
dge
suff
erin
g fr
oman
y di
seas
e or
dis
abili
ty c
alcu
late
dto
cau
se h
is d
rivi
ng o
f the
veh
icle
tobe
a s
ourc
e of
dan
ger
to th
e pu
blic
,sh
all
be p
un
isha
ble
for
the
firs
t
Even
thou
gh n
o cl
ear
data
exi
sts
onth
is i
ssu
e in
In
dia
, it
is
easy
to
un
der
stan
d t
he
lim
itat
ion
s o
fd
isab
led
per
son
s in
usi
ng
road
envi
ronm
ent
Thi
s se
ctio
n ev
en th
ough
pre
sent
for
a lo
ng ti
me
has
been
dif
ficu
ltto
enf
orce
due
to
defi
niti
ons
of w
hat
cons
titu
tes
phys
ical
ly o
rm
enta
lly u
nfit
. Ex
pert
s fr
om d
iffe
rent
dis
cipl
ines
will
hav
e w
ide
rang
ing
inte
rpre
tati
ons
of th
e la
w.
All
pers
ons
wit
h a
med
ical
ly d
iagn
osed
con
diti
on n
eed
to c
arry
aca
rd in
dica
ting
the
ir h
ealt
h pr
oble
ms
and
the
type
of
med
icat
ions
they
are
rec
eivi
ng.
Dis
abili
ties
and
dri
ving
15

78 BRSIPP 2009
Sr.
No
Dom
ain
Exi
stin
g Pr
ovis
ion
Just
ific
atio
n f
or r
evis
ion
Prop
osed
ch
ange
s
Ther
e is
no
clar
ity
in th
e pr
esen
t act
.T
he e
xist
ing
act
is v
ery
vagu
e in
men
tion
ing
that
The
re a
re n
o cl
ear
data
ava
ilabl
efr
om I
ndia
on
this
iss
ue a
nd n
eeds
to r
evie
wed
The
re is
no
spec
ific
men
tion
of t
his
in t
he c
urre
nt a
ct a
nd n
eeds
to
incl
ude
issu
es o
f rel
evan
ce.
All
driv
ers
of h
eavy
and
com
mer
cial
veh
icle
s ca
n be
mad
e to
car
ry a
card
tha
t in
form
s of
the
ir h
ealt
h st
atus
, typ
e of
dru
gs t
hey
are
on,
resu
lts
of v
isio
n te
sts
once
in 3
yea
rs a
nd a
ny o
ther
impo
rtan
t iss
ues.
Thi
s sh
ould
be
appl
icab
le, e
spec
ially
to th
ose
abov
e 50
yea
rs.
Spec
ific
ally
for
Epi
leps
y, T
he I
ndia
n Ep
ileps
y A
ssoc
iati
on h
as f
iled
case
s in
cou
rts
wit
h th
e ar
gum
ent t
hat t
hose
dri
vers
who
are
sei
zure
free
for
mor
e th
an 1
yea
r ca
n be
per
mit
ted
to d
rive
. The
y ne
ed t
oca
rry
a ca
rd in
dica
ting
typ
es o
f dru
gs t
hey
have
bee
n re
ceiv
ing.
Hea
lth
stat
us o
f dr
iver
s1
6
The
exi
stin
g ac
t do
es n
ot a
ddre
ssth
is is
sue
in a
ny w
ay.
Wit
h ne
arly
one
thi
rd o
f cr
ashe
so
ccu
rrin
g d
uri
ng
nig
ht
tim
es,
fati
gue
and
slee
ples
snes
s is
one
of
the
maj
or c
ontr
ibu
tin
g fa
ctor
s.T
her
e h
ave
been
dif
ficu
ltie
s in
mea
suri
ng th
is r
isk
fact
or.
Spec
ially
wit
h he
avy
vehi
cles
and
publ
ic tr
ansp
ort b
uses
, thi
s ha
s be
ena
maj
or i
ssue
as
it e
ndan
gers
the
life
of m
any
pass
enge
rs o
n bo
ard
The
new
act
sho
uld
spec
ify
the
need
for
mai
ntai
ning
dri
ving
hou
rsin
all
publ
ic v
ehic
les a
nd p
riva
te fl
eets
. The
nee
d fo
r mak
ing
alte
rnat
ear
rang
emen
ts (
like
2 dr
iver
s) i
n lo
ng d
ista
nce
carr
iers
sho
uld
bein
corp
orat
ed.
Fati
gue
and
slee
ples
snes
s1
7
offe
nce
wit
h fi
ne w
hich
may
ext
end
to t
wo
hund
red
rupe
es a
nd f
or a
seco
nd o
r su
bseq
uent
off
ence
wit
hfi
ne
wh
ich
may
ext
end
to
fiv
ehu
ndre
d ru
pees
.
The
exi
stin
g ac
t un
der
Sect
ion
134
men
tions
the
duty
of a
per
son
in c
ase
of a
ccid
ent
or i
njur
y to
a p
erso
n :
Whe
n an
y pe
rson
is in
jure
d or
any
prop
erty
of a
thir
d pa
rty
is d
amag
edas
a r
esul
t of a
n ac
cide
nt in
whi
ch a
mot
or v
ehic
le is
invo
lved
, the
dri
ver
of t
he v
ehic
le o
r ot
her
pers
on i
nch
arge
of t
he v
ehic
le s
hall
-
The
Hon
. Su
prem
e co
urt
of I
ndia
has
issu
ed d
irec
tive
s in
thi
s re
gard
and
the
min
istr
y of
tra
nspo
rt a
ndhi
ghw
ays
has
give
n pu
blic
ity
for t
hesa
me.
Des
pit
e th
ese
mea
sure
s,
the
situ
atio
n co
ntin
ues
to b
e gr
im a
ndp
reh
osp
ital
car
e h
as n
ot
bee
nst
reng
then
ed
The
maj
or b
arri
er f
or t
his
is t
he p
rese
nce
of m
edic
o le
gal i
ssue
s in
both
hos
pita
ls a
nd p
olic
e. T
his
shou
ld b
e re
mov
ed a
nd th
e pr
esen
ceof
Sup
rem
e C
ourt
dir
ecti
ves
shou
ld b
e in
clud
ed in
the
act
.
In a
ddit
ion,
all
hosp
ital
s ha
ve to
pro
vide
man
dato
ry fr
ee tr
eatm
ent
till
the
pati
ent
is s
tabi
lized
and
ref
erre
d, if
req
uire
d.
Sepa
rate
com
pens
ator
y m
echa
nism
s ha
ve to
be
deve
lope
d fo
r ini
tial
care
of
pati
ents
.
Prov
isio
ns h
ave
to b
e m
ade
for
mov
emen
t of a
mbu
lanc
es a
nd r
ight
of w
ay h
as to
be
prov
ided
.
Emer
genc
y C
are
18

79
Sr.
No
Dom
ain
Exi
stin
g Pr
ovis
ion
Just
ific
atio
n f
or r
evis
ion
Prop
osed
ch
ange
s
Rul
e 11
dea
ls w
ith
pede
stri
an ri
ghts
As
per
BR
SIP
data
and
from
sev
eral
othe
r re
port
s in
the
cou
ntry
, nea
rly
50 %
of d
eath
s an
d 40
% o
f hos
pita
lre
gist
rati
ons
due
to ro
ad c
rash
es a
ream
ong
pede
stri
ans.
The
act
sho
uld
man
dato
rily
sti
pula
te t
he p
rovi
sion
of
foot
path
s,w
alki
ng s
pace
s, c
ross
ing
faci
litie
s an
d sp
eed
redu
ctio
n an
d co
ntro
lin
all
area
s , s
peci
ally
in tr
affi
c ge
nera
tors
Saf
ety
rig
hts
o
fPe
dest
rian
s1
9
a.un
less
it is
not
pra
ctic
able
to d
oso
on
acco
unt o
f mob
fury
or a
nyot
her r
easo
n be
yond
his
con
trol
,ta
ke a
ll r
easo
nab
le s
tep
s to
secu
re m
edic
al a
tten
tion
for t
hein
jure
d pe
rson
s.
b.G
ive
on d
eman
d b
y a
poli
ceof
ficer
any
info
rmat
ion
requ
ired
by h
im o
r if
no
polic
e of
fice
ris
p
rese
nt,
re
po
rt
the
circ
um
stan
ces
of o
ccu
rren
ce,
etc…
Pen
alty
: p
un
ish
able
w
ith
impr
ison
men
t for
a te
rm w
hich
may
exte
nd to
thre
e m
onth
s or
wit
h fi
new
hich
may
ext
end
to f
ive
hund
red
rupe
es o
r w
ith
both
, or
if
havi
ngbe
en p
revi
ousl
y co
nvi
cted
of
anof
fenc
e un
der
this
sec
tion
, he
is
agai
n co
nvic
ted
of a
n of
fenc
e un
der
this
sec
tion
, ,w
ith
impr
ison
men
t, fo
ra
term
whi
ch m
ay e
xten
d to
six
mon
ths,
or
wit
h fi
ne w
hich
may
exte
nd t
o on
e th
ousa
nd r
upee
s, o
rw
ith
both
.
Con
sequ
entl
y, t
he i
njur
ed d
o no
tre
ceiv
e fir
st a
id, r
each
hos
pita
ls la
te,
refe
rred
fro
m h
ospi
tal
to h
ospi
tal
and
ther
e ar
e no
tri
agin
g sy
stem
s.
Rep
orti
ng o
f all
cras
hes
to p
olic
e by
both
inju
red
peop
le a
nd b
y ho
spit
als
Wit
h in
crea
sing
occ
urre
nce
of r
oad
cras
hes
(nea
rly
1, 5
0,00
0 de
aths
and
30
tim
e th
is n
um
ber
fo
rh
osp
ital
isat
ion
s),
the
rep
orti
ng
syst
ems
are
inad
equa
te a
nd d
iffic
ult
to m
anag
e.
The
new
act
sho
uld
sim
plif
y nu
mbe
r of
thin
gs w
hile
pro
mot
ing
and
faci
litat
ing
a sc
ient
ific
app
roac
h fo
r re
duct
ion
of r
oad
cras
hes.
In
this
reg
ard
A s
impl
e, e
ssen
tial
, sc
ien
tifi
c re
port
ing
syst
em h
as t
o be
esta
blis
hed
in b
oth
polic
e (i
n co
ordi
nati
on w
ith
NC
RB
) an
dho
spit
al sy
stem
s wit
h th
e ai
m o
f ide
ntify
ing
esse
ntia
l ris
k fa
ctor
s.
Cra
sh (
acci
dent
) re
port
ing
and
inve
stig
atio
n sy
stem
s2
0

80 BRSIPP 2009
Sr.
No
Dom
ain
Exi
stin
g Pr
ovis
ion
Just
ific
atio
n f
or r
evis
ion
Prop
osed
ch
ange
s
In a
ddit
ion,
this
com
plex
ity
has
also
been
inte
rfer
ing
in p
atie
nt c
are
and
spen
ding
tim
e in
doc
umen
tati
onan
d m
ain
tati
nen
ce o
f u
mp
teen
num
ber
of r
egis
ters
in h
ospi
tals
.
All
polic
e do
cum
enta
tion
has
bee
non
goin
g fr
om a
n ad
min
istr
ativ
e,cr
imin
al a
nd le
gal p
ersp
ecti
ve a
ndha
s no
t bee
n of
hel
p fo
r pr
even
tion
and
cont
rol o
f roa
d cr
ashe
s.
Onl
ine
tran
smis
sion
of
info
rmat
ion
on c
rash
es t
o na
tion
alag
enci
es a
nd d
esig
nate
d ce
ntre
s (t
o be
est
ablis
hed)
wit
hin
the
coun
try
has
to b
e pr
omot
ed.
Thi
s sy
stem
sho
uld
supp
ort
tran
spor
t an
d po
lice
depa
rtm
ents
to ta
ke e
ffec
tive
act
ion
at a
n ea
rly
tim
e.
Mec
hani
sms
have
to
be d
elin
eate
d to
rep
ort
fata
l an
d th
ose
requ
ired
by
peop
le (
for
com
pens
atio
n pu
rpos
es o
nly)
to
bere
port
ed to
pol
ice.
Scie
ntif
ic r
esea
rch
to b
e es
tabl
ishe
d fo
r re
duct
ion
of c
rash
esba
sed
on c
rash
ana
lysi
s by
set
ting
up
of a
cra
sh in
vest
igat
ion
and
anal
ysis
in e
ach
stat
e of
Indi
a.

81
MENTOR-VIP is a global injury and violence prevention mentoring programme. Ithas been developed through the efforts of WHO and a network of global injury preventionexperts. Mentoring allows for skills development through exchange of experiencebetween a more skilled or experienced person and a person seeking to develop thoseskills. MENTOR-VIP offers an opportunity for individuals committed to the injury areato further develop key skills. MENTOR-VIP is designed to match mentees wishing todevelop certain skills with mentors who have agreed to devote their time and efforts toassist mentees develop those skills. Matching of individuals is made on the basis of theprofiles of mentee and mentor and the overall principles and objectives of MENTOR-VIP. Once a mentorship is awarded the mentee and mentor jointly plan the activitiesthat will be undertaken during the mentorship. A principle of the programme is that itprovides a low cost model for mentoring. Mentoring takes place primarily throughelectronic and telephonic forms of communication and interaction. Mentorships arefor a 12 month period and begin in September of each year.For further details visit:http://www.who.int/violence_injury_prevention/capacitybuilding/mentor_vip/en/index.html
TEACH-VIP is a comprehensive injury prevention and control curriculum which hasbeen developed through the efforts of WHO and a network of global injury preventionexperts. TEACH-VIP E-Learning has been adapted from the facilitator-based trainingcurriculum TEACH-VIP. It provides training on a broad range of topics related tounderstanding and preventing injuries and violence. It includes extensive content onusing data to understand injury problems; details the current knowledge around leadinginjury and violence problems; and covers the development of evidence-basedprogrammes to address them. TEACH-VIP E-Learning is suitable for a wide range ofaudiences, including public health professionals and care providers; staff of publichealth ministries and those in government sectors relevant to injury prevention; officialsfrom non-governmental organizations and others interested in increasing theirknowledge base in injury and violence prevention.For further details visit:http://www.who.int/violence_injury_prevention/capacitybuilding/teach_vip/e-learning/en/index.html

How many more will be lost, before we act!
On …… Jan 2009, Mr. C…, aged 34 years,
while travelling as a pillion, was hit by a …….
bus and died immediately. He was travelling
with his son, when a supposedly speeding bus
collided with him and injured two others.
Following the crash, the driver and the
conductor fled the scene and crowd gathered.
Enquiry followed, compensation was
awarded, media reported the event and road
death statistics increased by another number.
Every one said such things will happen.
However, for his family, it was
the beginning of problems.
Loss of husband for the wife,
death of father for children,
financial problem in family,
and loss of a binding force
followed in the next few
days and weeks. After 1 year,
the family has been torn
apart. This crash left an
unforgettable impact on the
family and they may or may
not recover from this tragedy.
As per official report, on any given day, nearly
350 persons die in India due to road crashes,
often those in younger age groups. About
1500 persons die due to injury causes like road
traffic injuries, falls, burns, poisoning,
drowning, suicide, assault and many others.
The real problem is much higher due to under
reporting and misclassification. Several
thousands reach our hospitals for care, and are
discharged with disabilities that will affect
them and their families for the rest of their life.
Each day, children and young adults saved
from Infectious and communicable diseases
die, get hospitalized and become disabled due
to injuries.
Each of these are considered as someone's
negligence, error, fault, wrong behaviour and
investigated from a criminal, legal
and administrative angle. Some get
compensation, many delayed. Does money
really make a difference for the bereaved
families?
In a country where road crashes and other
injuries are publicly glaring,
there are no systematic,
scientific and sustainable
programmes to address this
huge public health problem.
As long as we in this country
continue to accept road
deaths and other injuries
a s u n a v o i d a b l e a n d
unpreventable events, and as
accidents, we cannot turn this
tide.
Road crashes and other injuries are
predictable and preventable. There are
so lut ions that work. Enforcement ,
Engineering, Vehicle/Product Safety,
Education and Trauma Care can make a huge
difference to people like Mr. C …. and
thousands of others. We need to move from a
“reactive “to a “proactive approach”, and shift
from “concerns” to “actions”. Reduction in
road and injury deaths can only happen, if we
have the right policies, programmes,
resources and willingness to act by giving
road safety and injury prevention a higher
priority.