Embed Size (px)
Citation preview
elifesciences.org
Ballester et al. eLife 2014;3:e02626. DOI: 10.7554/eLife.02626 1 of 21
Multi-species, multi-transcription factor binding highlights conserved control of tissue-specific biological pathways
Benoit Ballester, et al.
Figures and figure supplements

Genomics and evolutionary biology | Human biology and medicine
Ballester et al. eLife 2014;3:e02626. DOI: 10.7554/eLife.02626 2 of 21
Figure 1. Overview of ChIP-seq, CRM construction, and multiple-species comparisons. ChIP-seq peaks were determined for four liver TFs in five mammals. (A) CRMs were constructed by merging ChIP-seq peaks whose summits occurred within 300 bp and consisted of at least two distinct TFs. Remaining peaks were designated as singletons. (B) Whole genome 9-way EPO multiple sequence alignments (MSA) were used to project CRMs/Singletons across the five species. A CRM was considered shared if its position in the EPO MSA overlapped a CRM in a second species by a minimum of 10 bp. Neither the content nor order of TFs within the CRM was required to be classified as a ‘Shared’ CRM. A singleton in one species was considered ‘Shared’ if it overlapped the same TF in a second species. (C) Relative to human, the average % of shared CRMs is shown. Human CRMs (comprised of any two TFs) that overlap a CRM from a second species are shown with empty circles. Human CRMs containing at least one of each TF (all 4 TFs) were compared to all identified CRMs in a second species (purple circles). (D) The percentage of human CRMs and singletons in different phylogenetic categories that can be found aligned within the EPO MSAs for each of the five species is shown.DOI: 10.7554/eLife.02626.003

Genomics and evolutionary biology | Human biology and medicine
Ballester et al. eLife 2014;3:e02626. DOI: 10.7554/eLife.02626 3 of 21
Figure 1—figure supplement 1. Summary of ChIP-seq peak number and TF motif enrichment. (A) Number of Peaks (B) Conservation of TF binding motifs. DNA binding specificities of CEBPA, HNF4A, FOXA1, and ONECUT1 are highly conserved. The known sequence motifs were identified de novo in each species interrogated. (C) Central position of motifs under TF binding summits were observed for each factor. Number of motifs identified using the PWM from B (y-axis) vs distance from TF binding summit obtained using the SWEMBL peak caller (x-axis).DOI: 10.7554/eLife.02626.005

Genomics and evolutionary biology | Human biology and medicine
Ballester et al. eLife 2014;3:e02626. DOI: 10.7554/eLife.02626 4 of 21
Figure 1—figure supplement 2. Pairwise analysis of individual TFs using EPO multiple sequence alignment. Shared binding events were initially identified in a pair-wise fashion using the 9-way EPO-MSA. Average % overlap was calculated and the total number of peaks that could be aligned to a second species is shown. The total peak
Figure 1—figure supplement 2. Continued on next page

Genomics and evolutionary biology | Human biology and medicine
Ballester et al. eLife 2014;3:e02626. DOI: 10.7554/eLife.02626 5 of 21
number for each species shown in brackets. A region was identified as shared if its DNA sequence overlapped in a second species by 10 or more base pairs. (A) Average % overlap for the four individual TFs in this study. (B) For each pair of species the average % of CRMs (comprised of any two TFs) that overlap another CRM, regardless of its composition from a second species is shown. The number of CRMs present within the EPO-MSA is given on the right with the total number of CRMs shown in brackets. (C) For each species, CRMs containing at least one of each TF type (all 4 TFs) were compared to all identified CRMs in a second species (Figure 1—source data 1F).DOI: 10.7554/eLife.02626.006
Figure 1—figure supplement 2. Continued

Genomics and evolutionary biology | Human biology and medicine
Ballester et al. eLife 2014;3:e02626. DOI: 10.7554/eLife.02626 6 of 21
Figure 1—figure supplement 3. A majority of the four liver-enriched TFs cluster into CRMs. (A) The number of TF binding event clusters (y-axis) vs the distance between the summits of TF binding events used to generate the clusters (x-axis) is plotted. (B) Number of CRMs (y-axis) vs CRM width (x-axis) is shown for our chosen 300 bp distance-between-summit criteria we used to build CRMs. (C) Average width in base pairs for: all CRMS; CRMs containing all four TFs; and individual peaks are shown.DOI: 10.7554/eLife.02626.007

Genomics and evolutionary biology | Human biology and medicine
Ballester et al. eLife 2014;3:e02626. DOI: 10.7554/eLife.02626 7 of 21
A
Identify CRMs (TFs within 300 bp)
Classify CRM/Singletonconservation
SharedHuman only
4,211
6,1256,981
5,046
4,6727,631 Beyond primates
Primates only
Deeply shared (3+)
ChIP-seq in human liver
Total binding events : 129,885
25,606 36,827 26,67140,781ONECUT1 FOXA1 CEBPAHNF4A
30,71813,106
Singleton43,824
CRMs31,765
19,462 12,303Shared Human only
B
CEBPA HNF4A ONECUT1FOXA1
F7 F10
F7 F10
PCID2F7 F10
PCID2F7 F10
PCID2F7 F10
2
5210930137
2
3920254152
2
98905379230
2
105190275241
2
91215101287
Mmul
Mmus
Cfam
Hsap
Rnor
rs561241
20 kb
FOXA1FOXA1HNF4ACEBPA
HNF4AFOXA1
FOXA1HNF4AFOXA1CEBPA
FOXA1
HNF4ACEBPAFOXA1
HNF4AFOXA1
HNF4AFOXA1
FOXA1ONECUT1
HNF4ACEBPA
FOXA1HNF4A
FOXA1HNF4ACEBPA
HNF6HNF4A
FOXA1
FOXA1HNF4ACEBPA
FOXA1HNF4ACEBPA
CEBPA
CEBPA HNF4AFOXA1CEBPA
HNF4ACEBPAFOXA1
HNF4ACEBPAFOXA1
HNF4A
FOXA1
CEBPA
HNF4A
FOXA1HNF4AFOXA1CEBPA
HNF4AFOXA1
FOXA1CEBPA
CEBPAHNF4A
HNF4AFOXA1
FOXA1HNF4A
CEBPAFOXA1
FOXA1FOXA1
HNF4AHNF4AFOXA1CEBPA
CEBPAFOXA1HNF4A
HNF4ACEBPA
HNF4AFOXA1
HNF4A
HNF4AHNF4A
HNF4AFOXA1
CEBPAHNF4A
FOXA1HNF4A
HNF4AFOXA1CEBPA
HNF4A
HNF4ACEBPAFOXA1CEBPA
ONECUT1
ONECUT1
ONECUT1
ONECUT1
ONECUT1 ONECUT1
ONECUT1
ONECUT1ONECUT1
ONECUT1ONECUT1
Figure 2. Annotation of human regulatory regions using interspecies combinatorial transcription factor binding. (A) Human liver ChIP-seq data from ONECUT1, HNF4A, FOXA1, and CEBPA were assembled into CRMs consisting of
Figure 2. Continued on next page

Genomics and evolutionary biology | Human biology and medicine
Ballester et al. eLife 2014;3:e02626. DOI: 10.7554/eLife.02626 8 of 21
at least 2 of the 4 TFs. The CRMs or single TFs were then broken down into categories based on their overlap with ChIP-seq data in macaque, dog, mouse, and rat. Singletons and CRMs were considered shared if they overlapped at least 10 bp with another TF bound region in the EPO multiple sequence alignment (MSA). (B) Experimentally determined combinatorial binding at the blood coagulation F7 locus. Raw sequencing reads from ChIP-seq experiments: CEBPA (red), HNF4a (green), ONECUT1 (yellow), and FOXA1 (green) are overlaid and called peaks are displayed for each species. ChIP-seq determined TF binding events were assembled into CRMs (black bars) underneath the enriched regions (peaks). Grey lines are drawn to illustrate shared CRMs using the EPO-MSA.DOI: 10.7554/eLife.02626.008
Figure 2. Continued

Genomics and evolutionary biology | Human biology and medicine
Ballester et al. eLife 2014;3:e02626. DOI: 10.7554/eLife.02626 9 of 21
Figure 3. Phylogenetic filtering of experimentally determined liver TF binding events yield distinct functional enrichments. Results were obtained using the programming interface for the online enrichment tool GREAT version 2.02 (McLean et al., 2010) and plotted with custom R scripts. Up to five of the most significant enrichments obtained for each of the six analyses are listed on the left. The −log10 of binomial Q values for Disease ontology, HGNC gene family, and MSigDB are shown along the x-axis. Bars with a black asterisk indicate significant enrichments using GREAT default parameters (binomial and hypergeometric FDR Q-value significance at P ≤ 0.05 with at least twofold region enrichment). The size of the asterisk is proportional to the fold enrichment obtained for the given database. See Figure 3—source data 1 for complete list of Q-values, fold enrichments, genes giving the enrichments along with results from additional databases. (A) Enrichment analysis of any CRM shared in human plus at least one additional species is shown on the left and human only CRMs are shown on the right (Figure 3—source data 1A). (B) Human CRMs (left panel) shared in human and at least one non-primate (Beyond Primates) is shown vs Human CRMs (right panel) shared in human and macaque but no other species (Primate only) (Figure 3—source data 1B). (C) Enrichment analysis of shared CEBPA CRMs and singletons (Figure 3—source data 1C). (D) Enrichment analysis of shared Figure 3. Continued on next page

Genomics and evolutionary biology | Human biology and medicine
Ballester et al. eLife 2014;3:e02626. DOI: 10.7554/eLife.02626 10 of 21
HNF4A CRMs and singletons (Figure 3—source data 1D). (E) Enrichment analysis of shared FOXA1 CRMs and singletons (Figure 3—source data 1E). (F). Enrichment analysis of shared ONECUT1 CRMs and singletons (Figure 3—source data 1F). (G) Human TFs in CRMs and Singletons were catego-rized by the number of species in which they are shared with. Profiles of constrained elements (sequence conservation) in a 1-kb window around CRMs or singletons were calculated using GERP scores from the 29-way multiple sequence alignments. (H) Genomic location of CRMs and Singletons. Proportion of single TFs located near transcription start sites (TSS) increases to >50%, but remains stable for CRMs at ∼20%.DOI: 10.7554/eLife.02626.010
Figure 3. Continued

Genomics and evolutionary biology | Human biology and medicine
Ballester et al. eLife 2014;3:e02626. DOI: 10.7554/eLife.02626 11 of 21
Figure 4. Comparison of TF occupied regions classified as CRMs and singletons. (A) Regions of ±5 kb are represented around the center of CRMs or singletons. Reads centered on the summit of each TF are counts subtracted by input reads in 100 bp bins plus and minus 5 kb from the summit. Colored Figure 4. Continued on next page

Genomics and evolutionary biology | Human biology and medicine
Ballester et al. eLife 2014;3:e02626. DOI: 10.7554/eLife.02626 12 of 21
boxes indicate CRMs or singletons where a peak was called for a given factor: CEBPA (red), HNF4A (blue), ONECUT1 (orange), and FOXA1 (green). Looking at read counts for all four factors reveal that many of the HNF4A singleton in fact have weak FOXA1 signal. (B) Alignment of FOXA1 de novo ChIP-seq motif to the HNF4A motif. Motif comparison (alignment) was performed using compare-matrices from RSAT. The program calculates the correlation between two matrices shifting positions; the correlation is normalized based on the width of the alignment to avoid high correlation based on few flanking positions.DOI: 10.7554/eLife.02626.012
Figure 4. Continued
Figure 4—figure supplement 1. Comparison of stringent motif matches between CRMs and singletons. Each TF peak set was scanned using the RSAT tool matrix-scan with PWMs for the four TFs. A stringent motif cutoff (10−4) was applied. The figure shows the percentage of peaks with at least one detected site for each TF below the corresponding p-value threshold (y-axis) and the motif PWM scanned (x-axis). (A) Motif scanning in CEBPA peaks; (B) Motif scanning in FOXA1 peaks; (C) Motif scanning in ONECUT1 peaks; and (D) Motif scanning in HNF4A peaks. For the stringent thresholds, significant adjusted p-values comparing singletons and CRMs are given. See all X2 test p-values for lenient (10−2) and moderate cutoffs (10−3) in Figure 4—source data 1.DOI: 10.7554/eLife.02626.014

Genomics and evolutionary biology | Human biology and medicine
Ballester et al. eLife 2014;3:e02626. DOI: 10.7554/eLife.02626 13 of 21
Figure 5. TFs in Deeply shared CRMs are near genes highly expressed in a tissue-specific manner. (A) Association of shared TFs in CRMs and Singletons with human gene expression obtained by RNA-seq in human liver (Kutter et al., 2011; E-MTAB-424). TFs in CRMs or Singletons were assigned to the nearest gene, and the FPKM (Fragments Figure 5. Continued on next page

Genomics and evolutionary biology | Human biology and medicine
Ballester et al. eLife 2014;3:e02626. DOI: 10.7554/eLife.02626 14 of 21
Per Kilobase of exon per Million reads) was recorded. In contrast to Singletons, TFs in Deeply CRMs are associated with highly expressed genes (adjusted p-values shown). The numbers of target gene associations for the singletons and CRMs in categories 1 to 5 are: 19354(S), 32706(CRM); 6325(S), 14669(CRM); 1935(S), 5755(CRM); 1005(S), 3292(CRM); and 459(S), 2530(CRM). (B) Comparison with CRMs and Singletons to a reference mRNA-seq data from 16 human tissues (E-MTAB-513) further shows that relative to singletons, liver-specific CRMs are highly expressed in liver, and that each TF contributes to this specificity. The number of gene associations for each category in the liver data is shown in white text within the heat map.DOI: 10.7554/eLife.02626.015
Figure 5. Continued
Figure 5—figure supplement 1. Association of shared TFs in CRMs and Singletons with human gene expression obtained by RNA-seq in human liver (Kutter et al., 2011; E-MTAB-424) broken down by the transcription factor in the CRM: (A) HNFA; (B) CEBPA; (C) FOXA1 and (D) ONECUT1. TFs in CRMs or singletons were assigned to the nearest gene and the FPKM (Fragments Per Kilobase of exon per Million reads) was recorded for CRMs and TFs broken down by transcription factor. Adjusted p-values are shown and like Figure 5, the CRMs were associated with more highly expressed genes in the 5-way and 4-way–shared categories.DOI: 10.7554/eLife.02626.016

Genomics and evolutionary biology | Human biology and medicine
Ballester et al. eLife 2014;3:e02626. DOI: 10.7554/eLife.02626 15 of 21
Figure 6. Shared HNF4A CRMs unravel more liver related functional classes than do the equivalent number of CRMs with the best peak enrichment scores. CRMs containing each TF were analyzed separately. (A) Read count and motif binding weight scores were calculated for: (1) all CRMs (All); (2) Figure 6. Continued on next page

Genomics and evolutionary biology | Human biology and medicine
Ballester et al. eLife 2014;3:e02626. DOI: 10.7554/eLife.02626 16 of 21
CRMs shared in human and at least one additional non-primate (Beyond primates); (2) human CRMs shared in macaque only (Primates); and (3) the equivalent number of CRMs (equal to the number of Beyond primate CRMs) ranked by the SWEMBL peak intensity score for the TF in question (Top). (B) Functional enrichments were performed using GREAT comparing the Beyond primate category to the top ranked category. The top five enrichments for all comparisons performed were collected and the enrichments, if available are plotted. Databases used for GREAT enrichment analyses are indicated by color and are ranked according to the −log10 binomial FDR q-values plotted on the x-axis. Significant enrichments are labelled with an asterisk which is sized according to fold enrichment of the given database category.DOI: 10.7554/eLife.02626.017
Figure 6. Continued
Figure 7. Using a window of ±2.5 kb, lead SNPs obtained by GWAS were enriched for shared CRMs in a tissue/disease specific manner. Heatmap representation of the −log10 of Bonferroni corrected p-values from hypergeo-metric testing for enrichment of CRMs or single TFs (broken down into categories related to their degree of conservation) by lead GWAS SNPs obtained from the NHGRI catalog (Hindorff et al., 2009). The NHGRI catalog disease traits were summarized into 25 categories prior to enrichment. Each GWAS lead SNP was given a ±2.5-kb window prior to identifying overlapping CRMs/singletons.DOI: 10.7554/eLife.02626.018
Genomics and evolutionary biology | Human biology and medicine
Ballester et al. eLife 2014;3:e02626. DOI: 10.7554/eLife.02626 17 of 21
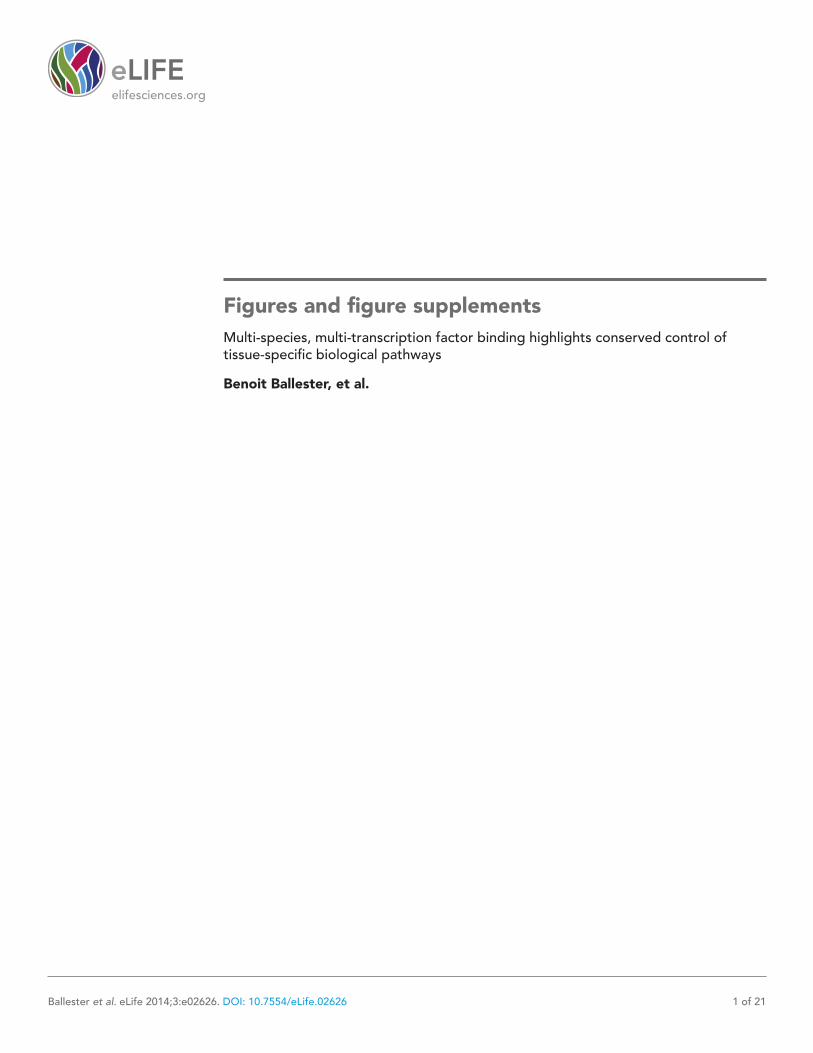
Figure 7—figure supplement 1. Using linkage disequilibrium (r2 ≥ 0.8), GWAS lead SNPs were enriched for shared CRMs in a tissue/disease specific manner. (A) Number of lead SNPs reported in the NHGRI catalog for each of the summarized GWAS categories. (B) CRM regions were classified depending on their conservation pattern. These categories were then intersected with summarized disease traits obtained from the NHGRI catalogue (Hindorff et al., 2009). Linkage disequilibrium measures were calculated for lead SNPs from the NHGRI GWAS catalog up to a maximum of 100 kb flanking the lead SNP. Windows around each SNP were created based on the largest genomic interval between two SNPs in linkage disequilibrium (r2 ≥ 0.8). The heatmap shows the −log10 of Bonferroni corrected p-values for the enrichments of CRMs and singletons broken down into categories related to their degree of conservation determined by our multi-species ChIP-seq comparisons.DOI: 10.7554/eLife.02626.020

Genomics and evolutionary biology | Human biology and medicine
Ballester et al. eLife 2014;3:e02626. DOI: 10.7554/eLife.02626 18 of 21
Figure 7—figure supplement 2. Super-enhancer enrichments obtained by GWAS lead SNPs. ‘Super-enhancers’ were directly obtained from Hnisz et al. (2013) and overlapped with lead GWAS SNPs annotated in the NHGRI catalogue (Hindorff et al., 2009). Each lead GWAS SNP was given a 5-kb window prior to identify overlapping
Figure 7—figure supplement 2. Continued on next page

Genomics and evolutionary biology | Human biology and medicine
Ballester et al. eLife 2014;3:e02626. DOI: 10.7554/eLife.02626 19 of 21
‘Super Enhancers’. The heatmap shows hierarchical clustering of the −log10 of corrected p-values for the enrich-ments of super-enhancers. A Hypergeometric test with Bonferroni correction was employed to assess the signifi-cance of enrichments in all categories. The heatmap shows significant enrichment of lead SNPs by immune cell super-enhancers. Super-enhancers from the liver cancer cell line HepG2 were not enriched for liver-related GWAS lead SNPs but were enriched for blood lipid related SNPs.DOI: 10.7554/eLife.02626.021
Figure 7—figure supplement 2. Continued

Genomics and evolutionary biology | Human biology and medicine
Ballester et al. eLife 2014;3:e02626. DOI: 10.7554/eLife.02626 20 of 21
TDO2
UGT1A4BAX
KNG1
LBP
PLG
APOB
CYP4A11F2
APCS
IGFBP1
FOXA3
LIPCFGG
ALB
CD14
NFE2L2
AHSG
INSIG2
CPB2
SLC2A2
MLH1
PPARG
PCK1
F11
FGA
IGF1APOA1FGB
SERPINA3
HSD11B1
MTTP
F9
PROZ
CYP7A1F7
G6PC
PEX1
STAT5B
PARK2
TF
ABCC2
SEL1L
CRP
VNN1
GRK4
F12
HNF1A
COMTALDOB
HAMP
ABCC3
NR1I2
HNF4ALDLR
PACRG
UGT1A1
HSPA1A
GO: response to woundingDisease genes disrupted by a regulatory DNA mutation contained within a conserved CRM
Genes predicted tobe connected in network
Pathway
Physicalinteraction
GO: blood coagulation
GO: lipid homeostasis GO: response to organic substance
Figure 8. Shared CRMs link TF binding with disease-causing variants in coagulation and lipid regulation in the liver. Human CRMs that had TF binding in syntenic regions in at least two additional species (n = 5046) were intersected with the HGMD database. All protein coding genes associated with a regulatory mutation were analysed. Relationships among these genes were investigated and a representative analysis obtained using GeneMANIA (‘Materials and methods’). Genes (large grey circles) are connected by pathways and protein–protein interactions are shown. The smaller white circles are genes predicted by GeneMANIA to be in the network. The 47 unique genes were associated into 35 clusters using DAVID (Huang da et al., 2009). Eight Gene Ontology terms from the 35 clusters had an adjusted p-value of less than 0.005 (Figure 8—source data 1A; Supplementary file 3). 4 of the 8 significant GO categories containing the most genes are illustrated: response to wounding (open red circle, p = 3.16 × 10⁻⁹; 9.9-fold enriched); blood coagulation (red dot, p = 9.34 × 10⁻⁶; 22.0-fold enriched); response to organic substance (open yellow circle, p = 1.05 × 10⁻⁵; 6.4-fold enriched); and lipid homeostasis (yellow dot, p = 6.93 × 10⁻⁵; 36.2-fold enriched).DOI: 10.7554/eLife.02626.024

Genomics and evolutionary biology | Human biology and medicine
Ballester et al. eLife 2014;3:e02626. DOI: 10.7554/eLife.02626 21 of 21
Figure 8—figure supplement 1. CRMs link TF binding with disease-causing variants in blood coagulation. Raw human ChIP-seq signals (bed graph format) are shown at the proximal promoters of three blood coagulation genes: (A) F7; and (B) F9. TF reads and significantly bound peak regions are shown as colored rectangles according to the TF (CEBPA = red; HNF4A = blue; FOXA1 = green; and ONECUT1 = yellow). All unique regulatory mutations in the HGMD overlapping human CRMs are shown with black arrows. Asterisks are shown above the position weight matrices for each TF at the position homologous to a unique human regulatory mutation (i.e., an A → T is only counted once). For each species, in silico predicted motif positions for each TF are shown above the multiple sequence alignment at each promoter when they overlap regions that have evidence of ChIP signal.DOI: 10.7554/eLife.02626.026