Embed Size (px)
Citation preview
NBER WORKING PAPER SERIES
REAL OUTPUT IN MENTAL HEALTHCARE DURING THE 1990s
Ernst R. BerndtAlisa B. Busch
Richard G. FrankSharon-Lise Normand
Working Paper 11557http://www.nber.org/papers/w11557
NATIONAL BUREAU OF ECONOMIC RESEARCH1050 Massachusetts Avenue
Cambridge, MA 02138August 2005
We gratefully acknowledge grant support from NIMH grant R01MH62028 and academic institutionalsupport from the MIT Sloan School of Management. An earlier version of this paper was presented at theTwelfth NUMH Biennial Research Conference on the Economics of Mental Health, Washington DC,September 27-28, 2004. The views expressed herein are those of the author(s) and do not necessarily reflectthe views of the National Bureau of Economic Research.
©2005 by Ernst R. Berndt, Alisa B. Busch, Richard G. Frank and Sharon-Lise Normand. All rightsreserved. Short sections of text, not to exceed two paragraphs, may be quoted without explicit permissionprovided that full credit, including © notice, is given to the source.

Real Output in Mental Health Care During the 1990sErnst R. Berndt, Alisa B. Busch, Richard G. Frank and Sharon-Lise NormandNBER Working Paper No. 11557August 2005JEL No. I10, C43, O33
ABSTRACT
Health accounts document changes over time in the level and composition of health spending. There
has been a continued evolution in the ability to track such outlays. Less rapid has been the ability
to interpret changes in spending. In this paper we apply quality adjusted price indexes for several
major mental disorders to national mental health account estimates to assess changes in real "output".
We show that using the new price indexes reveals large gains in real output relative to application
of BLS indexes.
Ernst R. BerndtSloan School of ManagementMIT, E52-45250 Memorial DriveCambridge, MA 02142and [email protected]
Alisa B. BuschMclean HospitalPh 302a115 Mill St Belmont, MA [email protected]
Richard FrankDepartment of Health Care PolicyHarvard Medical School180 Longwood AvenueBoston, MA 02115and [email protected]
Sharon-Lise NormandHarvard Medical SchoolHealth Care Policy180 Longwood Ave Boston, MA [email protected]
Page 3
I. INTRODUCTION
During times when mental health spending was increasing, a common perception
from observers was that such increases in mental health spending largely reflected rising
provider prices.1 Others have argued that spending increases manifested a moral hazard
response to insurance coverage and instead represented increased use of marginally
effective services, with a substantial portion of moneys spent on mental health care
providing low value to payers.2 In contrast, recent data showing that mental health
spending grew at 5.7% per year between 1991 and 2001 versus a comparable 6.5%
annual growth rate for all of health care has led advocates to worry that these differences
in spending growth represent diminished availability and access to care.3
In the United States’ economic statistical system of National Income and Product
Accounts, it is of course conventional practice to view expenditures as the product of
price times quantity.4 How one interprets changes in health care spending over the last
decade therefore depends critically on the extent to which the spending changes are
driven by price change, quantity change, quality change, or some combination of these.
One of the factors complicating the interpretation of spending trends is the
introduction of new treatments. Pharmacological innovations, such as the selective
serotonin reuptake inhibitors (“SSRIs”) and the serotonin-norepinephrine reuptake
inhibitors (“SNRIs”), have become common in the treatment of depression, and more
recently, of anxiety. Other pharmacological innovations include atypical antipsychotics
for the treatment of schizophrenia and for bipolar disorder. Significant changes have
occurred in other aspects of treatment, such as the development, publication and wide
dissemination of treatment guidelines for specialists and primary care physicians, disease

Page 4
management programs, and increased use of specialty mental health behavioral carve-
outs. Concepts of “price”, “quantity” and “quality” require careful exploration in the
context of a diverse and rapidly changing technology and delivery system that does not
produce an easily countable “output”.
Our goal in this paper is to offer an initial effort to decompose spending changes
for mental health care in the US between 1992 and 1997 into separate price and quantity
components, controlling for changes in quality. We disaggregate total mental health
spending into treatment of five groups of disorders: anxiety, schizophrenia, bipolar
disorders, major depressive disorders, and all other. We then utilize price indexes we
have constructed in earlier research, to convert data on nominal national mental health
spending into measures of real output change.
We find that while use of published medical care price deflators from the US
Bureau of Labor Statistics Consumer Price Index or Producer Price Index results in real
output growth of mental health services between 1992 and 1997 of 16% to 17%, use of
the episode-based price indexes that we have constructed results in much greater real
output growth over the same time period, ranging between 70% and 75%.
After explaining the basic mechanisms of how price indexes are applied to
National Income and Product Accounts, we review innovations in measuring prices,
quantity and quality for the purposes of constructing price indexes for mental health care.
We then present and compare estimates of real output growth for mental health care using
traditional indexes and those based on the new learning.
Page 5
II. THE BASICS OF DEFLATION IN THE NATIONAL INCOME AND
PRODUCT ACCOUNTS
US medical care expenditures estimates are published in the National Income and
Product Accounts (“NIPA”) of the Bureau of Economic Analysis (“BEA”), and in the
National Health Accounts (“NHA”) of the Centers for Medicare and Medicaid Services
(“CMS”).5 CMS provides the frequently cited statistic that the US spends about one-
seventh of its gross domestic product on medical care, the highest percentage in the
world.
Medical care expenditures are usefully interpreted as being the product of a series
of prices and quantities. In the language of national income accounting, the quantity of
medical care is called “real” medical care expenditures. Moreover, real medical care
expenditures can be interpreted as both the output of the medical care services sector and
as the consumption of medical care services by American residents.
Within the national accounts, the BEA estimates real medical care expenditures
by removing estimated medical inflation from the change in measured expenditures on
medical care. This process is known as “deflation”. In essence, any increase in medical
care expenditures that is not due to price changes is an increase in the quantity of health
care, where the quantity includes both changes in the number of treatments and changes
in the quality or effectiveness of treatments.
Consider prices of i distinct medical services in time periods 1 and 2, denoted pi1
and pi2, respectively, and let their corresponding quantities in time periods 1 and 2 be qi1
and qi2. Define total expenditures or spending in time periods 1 and 2 as:
S1 = � pi1qi1, and S2 = � pi2qi2.
Page 6
The traditional deflation methodology converts the nominal total spending ratio S2/S1 into
real expenditures or a real output ratio simply by dividing the spending ratio by the ratio
of aggregate price indexes, i.e., the real output in period 2 relative to period 1, Q2/Q1, is
computed as:
Q2/Q1 = (S2/S1)/(P1/P2).
This approach depends critically on the reliability of the price index deflators P1
and,P2, and in particular on the ratio P1/P2 . Any error in the price index ratio that
measures medical inflation creates an equal error of the opposite sign in the real
expenditure ratio, or relative quantity data. Thus there are at least two reasons why price
indexes for medical care are important: (i) they measure medical care inflation; and (ii)
they are used to derive measures of medical care real expenditures or real output.
Although the U.S. Bureau of Labor Statistics (BLS) has made significant efforts
to improve the reliability of its medical care related price indexes, particularly since
1997, many observers believe that the BLS’ estimates of price inflation for medical care
continue to be upward biased, for at least three reasons: (i) the set of medical care goods
and services that are sampled by the BLS is typically updated only infrequently, in the
process failing to capture the diffusion of new medical care practices and treatments, and
most importantly, pricing medical inputs rather than episodes of care;6 (ii) as recent
BLS-sponsored research has shown, prices sampled at hospitals and pharmacies tend to
be “list” or “official” prices, rather than actual transactions prices negotiated with third
party payers;7 and (iii) measures of price change fail to take into account fully associated
quality changes.8 If quality has been improving and managed care organizations negotiate
Page 7
for significant discounts off of list prices, then price indexes from the 1990s may be
biased upwards. Technological change could affect the price index in either direction.
A considerable amount of research in recent years has focused precisely on the
issue of obtaining measures of medical care price inflation that to some extent at least
incorporate attempts to capture the impact of quality changes. This new research attempts
to construct price indexes for medical care in a way that is fundamentally different from
prior methods. Specifically, in this recent research an attempt is made to define units of
“output of medical care” that reflects the changing bundle of inputs that goes into treating
an illness. Moreover, output is defined in a manner that can incorporate measures of the
quality of treatment. We now briefly summarize that literature, focusing in particular on
research involving changing costs of treating mental health disorders. Most of that work
involved some subset of the authors of this paper.
III. RECENT RESEARCH ON PRICE INDEXES FOR THE TREATMENT
OF MENTAL HEALTH DISORDERS
Recent research has examined trends in the direct medical costs of treating three
common mental disorders in the U.S.: (i) the acute (16-week) phase treatment of major
depressive disorder, based on data from 1991-1996; (ii) the ongoing treatment of
schizophrenia, using data from fiscal years 1994 through 2000; and (iii) the ongoing
treatment of bipolar I disorders over the 1991-1995 time frame. These three studies cover
various spans of years during the decade from 1991 through 2000. These treatments also
vary in how they are funded: the schizophrenia treatment cost data derive from public
sector funding through Medicaid, while data for the treatment of the major depressive and
bipolar I disorders are taken from private sector third party payers.9
Page 8
The general methodology used in this line of research that distinguishes it from
prior work on medical price indexes concerns the approach to measuring quantity and
quality of treatment. The approach to defining output taken by the BLS focuses on
specific services used in the treatment of disease as measures of “output”. That is, in the
case of mental health care, outputs would be defined as physician visits, inpatient hospital
stays, and prescriptions for psychotropic medications. In our view these are inputs in
treatment of diseases. We view output as a “course of treatment” over a specified time
period. Treatments for most mental disorders consist of combining a number of treatment
inputs. For example, in treatment of depression it is common to use combinations of
physicians’ visits for assessment and medical management, antidepressant medication,
and psychotherapy. These combinations of inputs are designed to be administered over
periods ranging from 12 weeks to 16 weeks in the acute phase and for up to eight months
in the continuation phase of treatment. Thus the treatment that produces health benefits is
not a visit or a prescription, but combinations of these inputs over time. Thus for all three
of the major illnesses discussed below, “output” is defined in terms of combinations of
inputs over time. For depression we focus on the acute phase of treatment, a period of 16
weeks. For bipolar disorder and schizophrenia that are most frequently viewed as severe
and persistent or chronic mental illnesses, we define output as combinations of treatment
inputs over a year.
There are important implications that stem from defining “output” in this way.
The first is that defining output in a way that accords with how clinical science defines
and tests treatment technologies, makes it possible to use clinical research to define the
quality of a course of treatment, in terms of the impact on symptoms and functioning. A
Page 9
second important implication of defining output as bundles of inputs for a specified time
period is that substitution among inputs is possible. That is, our approach may allow for a
particular level of health improvement for depression to be reached by either
administering 12 visits of psychotherapy over a 16 week period or by prescribing four
months of an antidepressant at an appropriate dose along with eight medication
management visits. In addition, as the quality of different inputs changes over time, due
to technological advances, the degree of substitution in production might also change. To
the extent that changes take place over time in the composition of treatments, input costs
and episode treatment costs need not move in the same direction. Our approach to
defining quality allows for such input compositional change whereas the BLS approach
has a far more limited ability to do so.
The second main feature of the new research on price indexes in mental health is
that these indexes each are constructed using information on the quality of each treatment
based on incorporating combinations of clinical research and expert clinical opinion.
Each of the three indexes does so in a somewhat different fashion. In each case clinical
research findings are utilized that compare treatment technologies corresponding to our
“output” measures; this clinical research has generated practice guidelines published by
the American Psychiatric Association, as well as leading research efforts (the
schizophrenia Patient Outcomes Research Team), and the federal government. This
clinically-based information is used to create quality indicators for each of the courses of
treatment identified in administrative claims data. Use of this information permits us to
construct quality-adjusted price indexes for courses of treatment for major depression,
schizophrenia and bipolar disorder.
Page 10
A. Price Indexes for the Treatment of Acute Phase Major Depressive Disorder
Using the combination of retrospective medical claims actual transactions cost
data from Medstat’s publicly available MarketScan database, along with clinical
literature and expert clinical opinion, recently Berndt et al. reported results of a study
examining changes over time in the costs of treating an episode of acute phase major
depressive disorder.10 The study focused on changes in spending to treat an episode of
depression, particularly that associated with changing bundles of inputs, thereby
accounting for substitution among treatment inputs. For example, even though both the
per session costs of psychotherapy and the costs of prescriptions for antidepressant
pharmaceuticals may be increasing over time, to the extent higher cost psychotherapy
sessions are substituted by increased use of lower cost antidepressant pharmaceuticals, it
is possible that this “substitution offset” compositional change results in net lower total
episode treatment costs. In contrast, the BLS’ fixed input bundle approach fails to
incorporate the potential for such substitutability among treatment inputs.
Using retrospective medical claims data from four large self-insured employers
offering more than 25 health plans to an annual average of about 425,000 employees and
their dependents, approximately 13,000 acute phase episodes of major depressive
disorder were identified over the 1991-1996 time period. For each of these episodes, all
ambulatory claims associated with either single or recurrent episodes of depression, as
defined by ICD-9 primary diagnostic codes 296.2x or 296.3x, were identified. Episodes
of care were constructed that included all treatments given in the 16 weeks following
initiation of care for depression, with distinct episodes defined in terms of eight or more
weeks of gaps in care.
Page 11
To rate outcomes from treatment that are not directly observable in retrospective
claims data, the authors used existing medical literature as an evidentiary platform, and
combined it with expert judgment to estimate expected outcomes. More specifically,
about 200 alternative treatment/patient type cells were identified in the retrospective
medical claims database. An example of a treatment/patient type cell is a woman, age
18-45, having no medical comorbidity, no history of recent substance abuse, treated with
an SSRI for more than 60 days, also having three or more psychotherapy visits, treated in
a specialty mental health treatment setting, for 16 weeks. The expert panel was asked to
rate the likelihood that patients in each cell would achieve either full remission or a
partial remission from their depression.
This process yielded expected outcomes data for treatment cells commonly
observed in the Medstat database. Health care spending for each of the elements of
treatment for depression (all payments made by the insurer to the provider, plus any cost-
sharing assigned to the patient, such as out of pocket copayments for psychotherapy or
prescription drugs) were summed into a nominal dollar total for each treatment episode.
The episodes were then classified as falling into various distinct treatment bundles.
Very substantial changes in the composition of treatment for acute phase major
depression took place in the first half of the 1990s, following the introduction of
fluoxetine, the first SSRI, in 1988, sertraline, the second SSRI in 1992, and paroxetine in
1993. The largest shift involved reduction in psychotherapy alone, from about 41% of
episodes treated in 1991, to about 27% in 1995. During the same time interval, the
combination treatment of SSRIs and psychotherapy doubled, from 23% to 48%. Solo
therapy involving only the older generation antidepressant tricyclics (“TCAs”) declined
Page 12
from about 7% to around 2% between 1991 and 1995. Hence, in the relatively short time
frame involving only five years in the early 1990s, a very dramatic shift in the
composition of treatments for depression took place, primarily involving substitution
against psychotherapy only and either TCA only or TCA in combination with
psychotherapy, and instead moving primarily toward SSRI plus psychotherapy
combination treatment, or SSRI only therapy.
This change in composition of treatments had a significant impact on the average
cost of treating an episode of acute phase major depression. In this and several related
studies, the researchers computed price indexes in a variety of ways.11 The preferred
calculation, based on a multivariate regression model with the logarithm of direct medical
costs as the dependent variable, and with patient characteristics, expected outcome (from
the expert panel rating), and yearly indicator variables as explanatory variables, yielded a
time series of price (or cost) indexes for expected full and for expected partial remissions.
Both price indexes fell from a base year index value of 100 in 1991 to about 88 in 1995,
implying a cumulative price decline of about 12%, and an average annual growth rate of
-2.7%.
By comparison, between 1993 and 1996 the BLS PPI for medical services
increased 8%, that for psychiatric hospitals rose about 10% between 1992 and 1996,
while that for psychotropic drugs increased by 21% between 1991 and 1996. Why the
difference, and which set of price trends should one find most credible?
For present purposes, it is sufficient to note that the BLS price indexes are based
on the assumption that the composition of treatment bundles is fixed. An implication is
that these price index calculations by the BLS do not permit substitution over time in the
Page 13
way a medical condition such as depression is treated. In particular, although the shift
away from psychotherapy-intensive to SSRI-intensive treatment bundles was in fact
dramatic, such compositional shifts are not incorporated in the BLS’ medical care price
indexes. It is here that the definition of output as a course of treatment for a specified
time period is most important and where it emerges as the source of differences between
the BLS indexes and the ones we constructed.
Concerning quality of care, although measurement of quality based on medical
claims data has well-known shortcomings, one can nonetheless obtain some notion of
quality change by tracing the proportion of observed episodes receiving treatment that
met the Agency for Health Care Policy Research guidelines for care. In the Medstat data,
the proportion meeting treatment guideline standards was 42% in 1991-1992, jumped to
53% and 54% in 1993 and 1994, and then fell slightly to 51% in 1996 and 49% in 1996.
In summary, for acute phase depression, not only did average treatment quality
increase as evidenced by the increase from 42% to 49% of treated episodes meeting
guideline standards, but controlling for expected outcomes, between 1991 and 1996 the
average costs of attaining expected full and partial remissions declined by about 12%.
This achievement occurred in large part due to the substitution away from more costly
psychotherapy-intensive treatment to less costly psychopharmacologic treatment
involving either psychotherapy in combination with SSRIs, or SSRI-only treatment.
B. Price Indexes for the Ongoing Treatment of Schizophrenia
In a recent article, Frank, Berndt, Busch and Lehman analyze retrospective mental
health-related Medicaid medical claims data from two counties in Florida containing the
cities of Jacksonville and Orlando, over six fiscal years, between 1994 and 2000,
Page 14
involving treatment of patients with schizophrenia.12 These claims data included
inpatient and outpatient procedure codes, pharmacy data, mental health-related diagnoses,
and the timing of any services. The setting was a lightly managed fee-for-service
environment, where primary care physicians received a capitation payment for providing
case management and gate keeping services, but where mental health services were not
carved out.
The study constructed price indexes for treatment of schizophrenia. Because
schizophrenia is a severe and persistent mental disorder, output was defined as the course
of treatment over an entire year. Using the Patient Outcomes Research Team (“PORT”)
treatment recommendations as a basic framework for classifying observed treatment
bundles and quality of care, Frank et al. identified treatment bundles whose quality was
evidence-supported (e.g., various pharmacotherapy-psychosocial treatment
combinations), was evidence-equivocal (e.g., vocational rehabilitation), and for which
there was no supporting evidence (e.g., only individual or group therapy without any
antipsychotic pharmacotherapy, or only pharmacotherapy without any psychosocial
supportive or psychotherapies).13 These quality measures clearly reflect what was
necessary to meet minimal standards of care identified in the PORT study. While the
quality of care indicators do not assess whether the patient received adequate medication
doses for adequate durations, or adequate type and number of psychotherapy sessions,
using this rather simple set of indicators of evidence-based treatment provides the basis
for documenting large variations in quality.
Frank et al. reported results of estimated multivariate regression models with the
logarithm of annual mental health spending as the dependent variable, nine solo and
Page 15
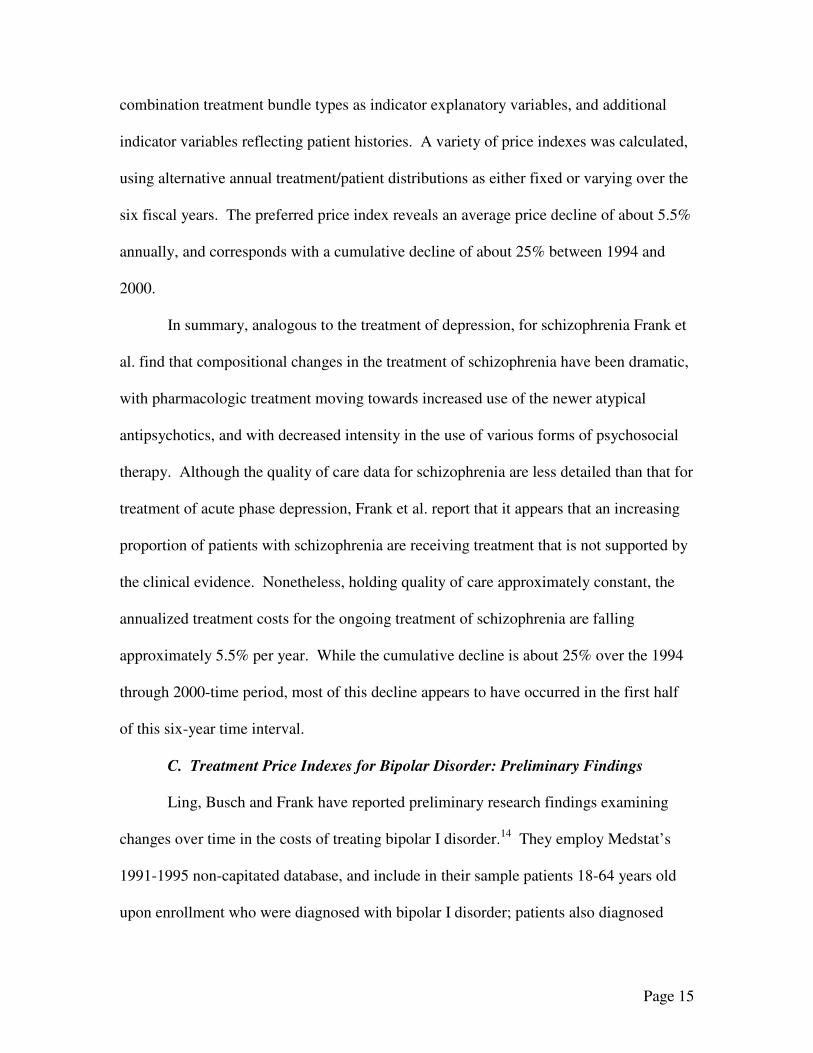
combination treatment bundle types as indicator explanatory variables, and additional
indicator variables reflecting patient histories. A variety of price indexes was calculated,
using alternative annual treatment/patient distributions as either fixed or varying over the
six fiscal years. The preferred price index reveals an average price decline of about 5.5%
annually, and corresponds with a cumulative decline of about 25% between 1994 and
2000.
In summary, analogous to the treatment of depression, for schizophrenia Frank et
al. find that compositional changes in the treatment of schizophrenia have been dramatic,
with pharmacologic treatment moving towards increased use of the newer atypical
antipsychotics, and with decreased intensity in the use of various forms of psychosocial
therapy. Although the quality of care data for schizophrenia are less detailed than that for
treatment of acute phase depression, Frank et al. report that it appears that an increasing
proportion of patients with schizophrenia are receiving treatment that is not supported by
the clinical evidence. Nonetheless, holding quality of care approximately constant, the
annualized treatment costs for the ongoing treatment of schizophrenia are falling
approximately 5.5% per year. While the cumulative decline is about 25% over the 1994
through 2000-time period, most of this decline appears to have occurred in the first half
of this six-year time interval.
C. Treatment Price Indexes for Bipolar Disorder: Preliminary Findings
Ling, Busch and Frank have reported preliminary research findings examining
changes over time in the costs of treating bipolar I disorder.14 They employ Medstat’s
1991-1995 non-capitated database, and include in their sample patients 18-64 years old
upon enrollment who were diagnosed with bipolar I disorder; patients also diagnosed
Page 16
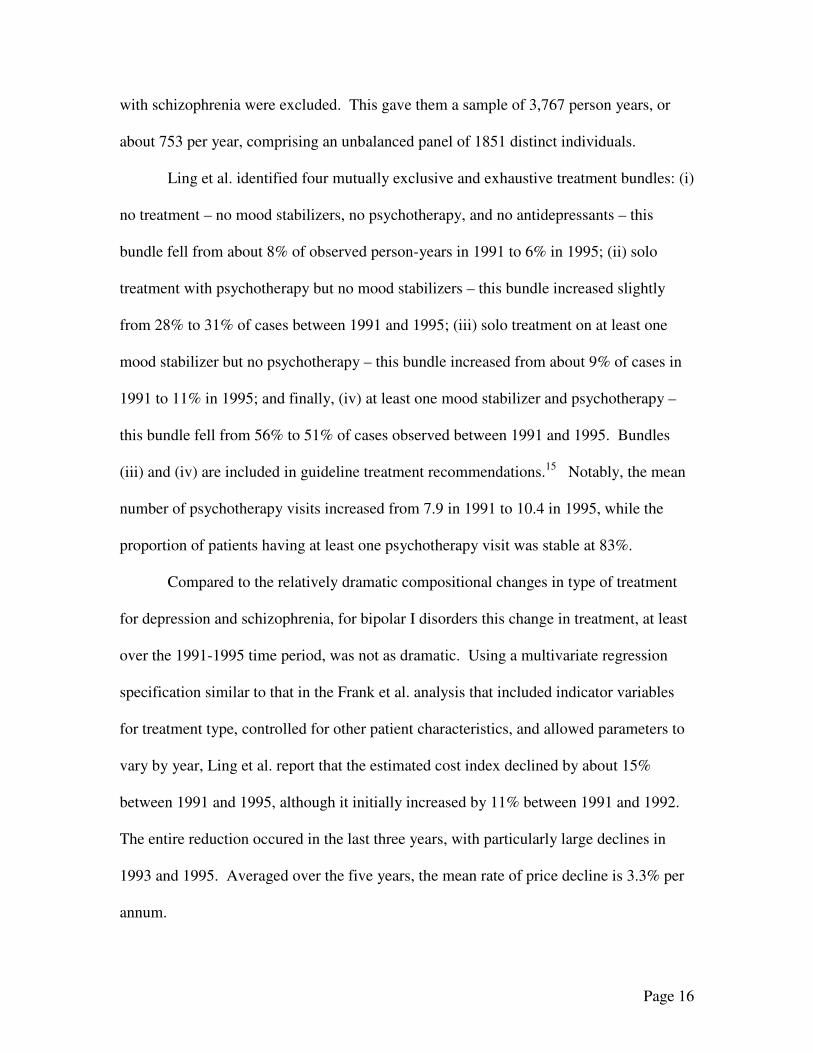
with schizophrenia were excluded. This gave them a sample of 3,767 person years, or
about 753 per year, comprising an unbalanced panel of 1851 distinct individuals.
Ling et al. identified four mutually exclusive and exhaustive treatment bundles: (i)
no treatment – no mood stabilizers, no psychotherapy, and no antidepressants – this
bundle fell from about 8% of observed person-years in 1991 to 6% in 1995; (ii) solo
treatment with psychotherapy but no mood stabilizers – this bundle increased slightly
from 28% to 31% of cases between 1991 and 1995; (iii) solo treatment on at least one
mood stabilizer but no psychotherapy – this bundle increased from about 9% of cases in
1991 to 11% in 1995; and finally, (iv) at least one mood stabilizer and psychotherapy –
this bundle fell from 56% to 51% of cases observed between 1991 and 1995. Bundles
(iii) and (iv) are included in guideline treatment recommendations.15 Notably, the mean
number of psychotherapy visits increased from 7.9 in 1991 to 10.4 in 1995, while the
proportion of patients having at least one psychotherapy visit was stable at 83%.
Compared to the relatively dramatic compositional changes in type of treatment
for depression and schizophrenia, for bipolar I disorders this change in treatment, at least
over the 1991-1995 time period, was not as dramatic. Using a multivariate regression
specification similar to that in the Frank et al. analysis that included indicator variables
for treatment type, controlled for other patient characteristics, and allowed parameters to
vary by year, Ling et al. report that the estimated cost index declined by about 15%
between 1991 and 1995, although it initially increased by 11% between 1991 and 1992.
The entire reduction occured in the last three years, with particularly large declines in
1993 and 1995. Averaged over the five years, the mean rate of price decline is 3.3% per
annum.
Page 17
IV. CONSTRUCTION OF AN OVERALL PRICE INDEX FOR MENTAL
HEALTH
Having reviewed recent research that reports quality-constant or quality-adjusted
price indexes for the treatment of selected mental disorders, we now outline how we
construct alternative price indexes aggregated over the various mental disorders. Our
goal is to use this aggregate price index to deflate nominal 1997 U.S. total mental health
expenditures, and then to convert it into real expenditures in 1992 dollars.
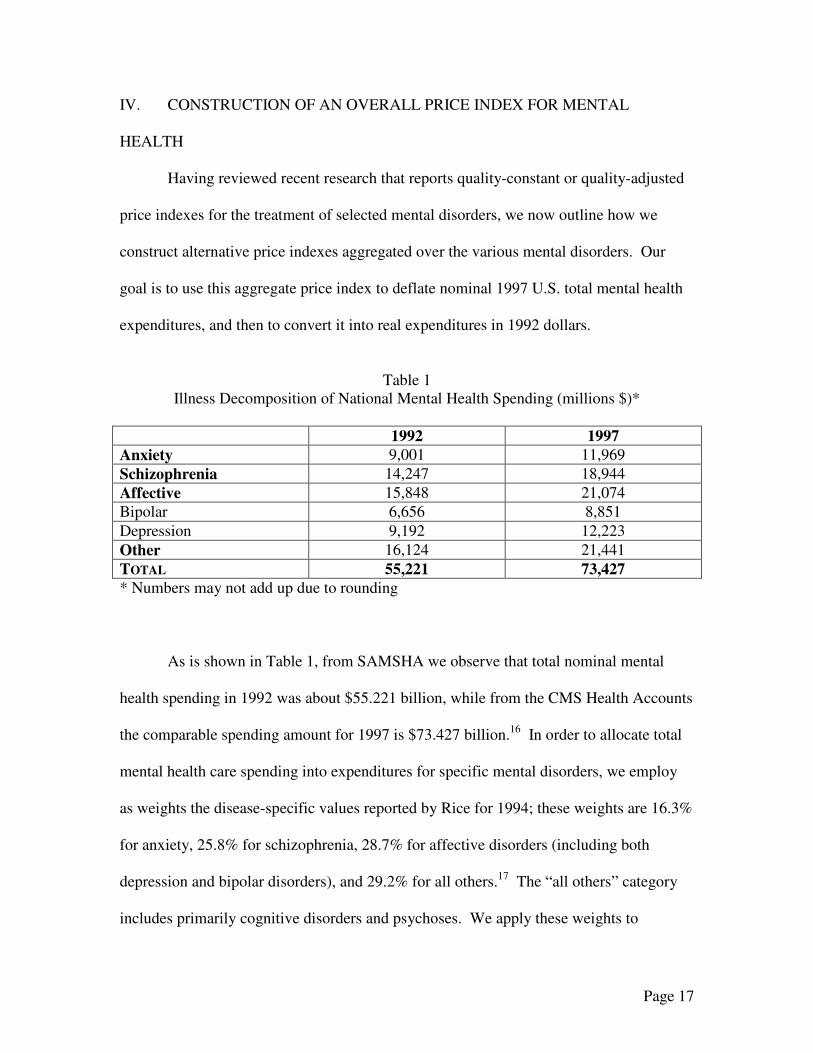
Table 1
Illness Decomposition of National Mental Health Spending (millions $)* 1992 1997 Anxiety 9,001 11,969 Schizophrenia 14,247 18,944 Affective 15,848 21,074 Bipolar 6,656 8,851 Depression 9,192 12,223 Other 16,124 21,441 TOTAL 55,221 73,427 * Numbers may not add up due to rounding
As is shown in Table 1, from SAMSHA we observe that total nominal mental
health spending in 1992 was about $55.221 billion, while from the CMS Health Accounts
the comparable spending amount for 1997 is $73.427 billion.16 In order to allocate total
mental health care spending into expenditures for specific mental disorders, we employ
as weights the disease-specific values reported by Rice for 1994; these weights are 16.3%
for anxiety, 25.8% for schizophrenia, 28.7% for affective disorders (including both
depression and bipolar disorders), and 29.2% for all others.17 The “all others” category
includes primarily cognitive disorders and psychoses. We apply these weights to
Page 18
disaggregate total mental health spending in 1992 and 1997; results are given in Table 1.
In order to decompose affective disorders into depression and bipolar disorders, we note
that the prevalence (incidence times duration) for mania is about 42% of all affective
disorders.18 Applying this 42% proportion to the 28.7% aggregate affective disorder
expenditure weight yields weights of about 12% (42% of 28.7%) to bipolar, and 16.7%
(58% of 28.7%) to depression. Using these constant weights, we decompose 1992 and
1997 nominal national total mental health spending into disease-specific expenditures;
results are given in Table 1.
We are not aware of any research to date that focuses on measuring a price index
for the treatment of anxiety. Since the treatment of anxiety typically involves use of the
SSRIs, as in the treatment of depression, we assume the price index for anxiety moves at
the same rate as that for depression; this assumption is further supported by the fact that
anxiety and depression are frequently comorbid illnesses. For the “all other” category,
since treatment typically involves use of the atypical antipsychotic medications, we
assume that prices for the treatment of the cognitive disorders and psychoses move at the
same rate as those estimated for the treatment of schizophrenia. Hence the schizophrenia
price index will be applied to 55% of the nominal spending (25.8% + 29.2%).
Recall that the depression price index we constructed covered the years 1991
through 1996, that for schizophrenia fiscal years 1994 through 2000, and that for bipolar I
disorder 1991 through 1995. In order to convert 1992 and 1997 nominal expenditures
into real magnitudes, it is necessary to extend the depression price index beyond 1996 to
1997, that for bipolar I disorder beyond 1995 to 1996 and 1997, and that for bipolar
Page 19
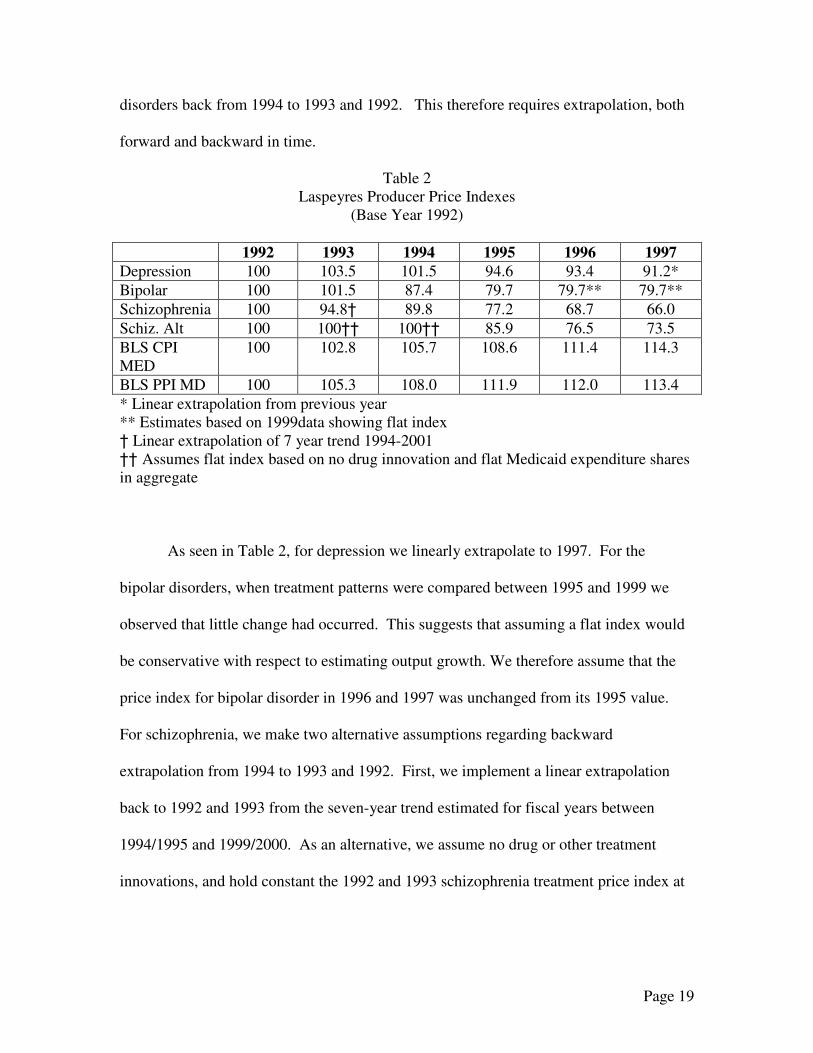
disorders back from 1994 to 1993 and 1992. This therefore requires extrapolation, both
forward and backward in time.
Table 2 Laspeyres Producer Price Indexes
(Base Year 1992) 1992 1993 1994 1995 1996 1997 Depression 100 103.5 101.5 94.6 93.4 91.2* Bipolar 100 101.5 87.4 79.7 79.7** 79.7** Schizophrenia 100 94.8† 89.8 77.2 68.7 66.0 Schiz. Alt 100 100†† 100†† 85.9 76.5 73.5 BLS CPI MED
100 102.8 105.7 108.6 111.4 114.3
BLS PPI MD 100 105.3 108.0 111.9 112.0 113.4 * Linear extrapolation from previous year ** Estimates based on 1999data showing flat index † Linear extrapolation of 7 year trend 1994-2001 †† Assumes flat index based on no drug innovation and flat Medicaid expenditure shares in aggregate
As seen in Table 2, for depression we linearly extrapolate to 1997. For the
bipolar disorders, when treatment patterns were compared between 1995 and 1999 we
observed that little change had occurred. This suggests that assuming a flat index would
be conservative with respect to estimating output growth. We therefore assume that the
price index for bipolar disorder in 1996 and 1997 was unchanged from its 1995 value.
For schizophrenia, we make two alternative assumptions regarding backward
extrapolation from 1994 to 1993 and 1992. First, we implement a linear extrapolation
back to 1992 and 1993 from the seven-year trend estimated for fiscal years between
1994/1995 and 1999/2000. As an alternative, we assume no drug or other treatment
innovations, and hold constant the 1992 and 1993 schizophrenia treatment price index at
Page 20
its 1994 value. The resulting price indexes, all normalized to 100 in the 1992 base year,
are presented in Table 2.
For purposes of comparison, we also present the BLS’s Consumer Price Index for
Medical Care (“BLS CPI MED”), and its Producer Price Index for Physicians’ Office
Visits (“BLS PPI MD”). Differences in time trends between the BLS’s price indexes and
those estimated based on retrospective medical claims data holding quality of care
constant (bipolar and schizophrenia), or adjusting for expected outcome (depression) are
surprisingly dramatic. While the BLS’s price indexes increase by 13-14% between 1992
and 1997, the alternative price index for depression declines 13%, that for bipolar
disorders declines by 20%, and those for schizophrenia fall by between 26% and 34%.
These are very large differences that have important implications for the interpretation of
changes over time in mental health spending.
To quantify the implications of differences in price indexes, we deflate 1997
nominal expenditures, by mental disorder, into real expenditures or real output by
dividing the 1997 expenditures (in Table 1) by the disease-specific price indexes (in
Table 2); for purposes of comparison, we also deflate using the BLS price indexes. We
then take the ratio of real output in 1997 to that in 1992 (“� Q97-92”); results are given
in Table 3.
Page 21
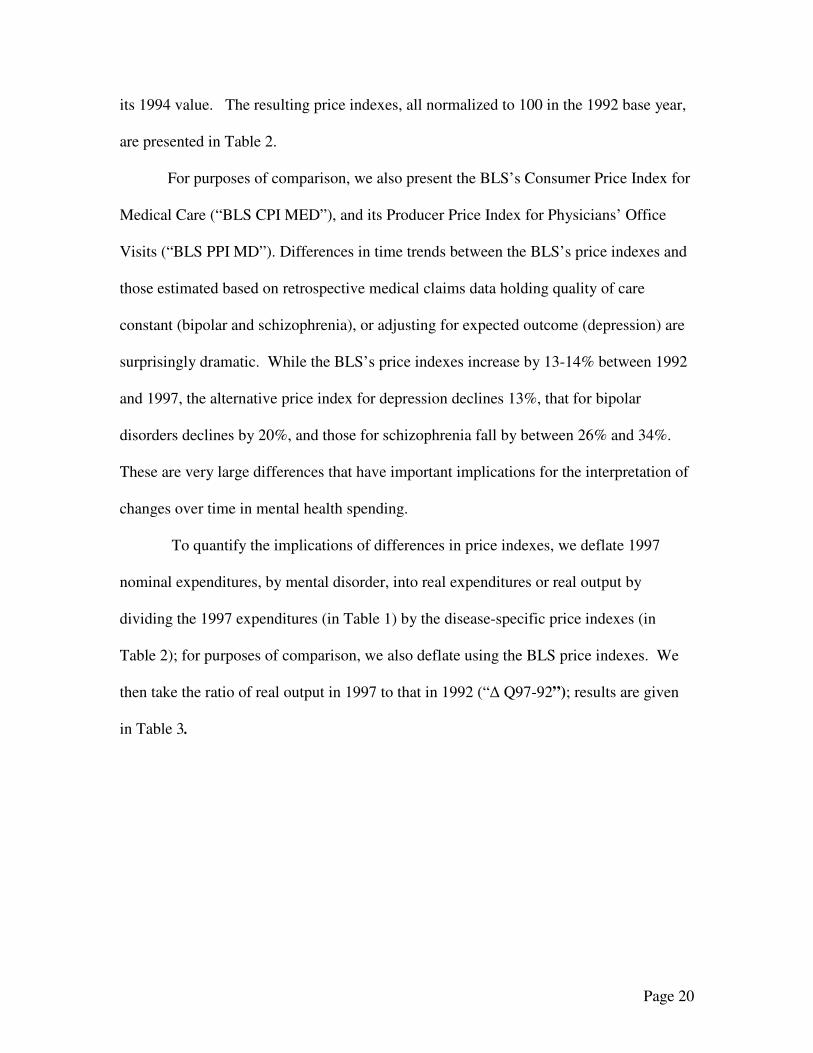
Table 3 Disaggregated Output Change Estimates
Illness � Q97-92 1. Anxiety MDD 1.46 BLS CPI MED 1.16 2. Schizophrenia Linear 2.01 Flat 1.81 3. Affective Bipolar 1.67 MDD 1.46 4. Other Schizo Alternative 1.82 BLS CPI MED 1.16 BLS PPI MD 1.18
For anxiety, use of the (depression) treatment price index as a deflator results in
1997 real output being 46% greater than in 1992, whereas with the BLS Medical Care
Consumer Price Index, this real output growth is much smaller, only 16% between 1992
and 1997. For schizophrenia, use of the backwards extrapolated schizophrenia treatment
price index to 1992 results in 1997 real output being 101% larger than in 1992, whereas if
one makes the more conservative assumption that there was no change between 1992 and
1994 in the treatment price index for schizophrenia, the real output growth in treating
schizophrenia increases by a smaller but still very substantial 81%.
In terms of the affective disorders, for the treatment of major depressive disorders
real output has grown 46% between 1992 and 1997, whereas for providers of services for
the treatment of bipolar I disorders, real output growth has been 67%; each of these is
based on the treatment price indexes that take into account the changing composition of
treatments over time. Finally, for the all other mental illness treatment category, when
Page 22
one employs the conservative “flat” schizophrenia price index (assuming no changes
between 1992 and 1994), real output growth from those providing ongoing treatment of
schizophrenia has increased by 82% between 1992 and 1997, whereas if one instead
employs the BLS’s Medical Care Consumer Price Index, this increase would be
considerably smaller at 16%. Using the physician PPI yields a quantity increase of 18%.
Finally, in order to obtain a measure of the overall growth in output of services
from mental health providers between 1992 and 1997, we weight the various measures of
disease-specific real output growth by the constant 1994 direct medical care shares
reported by Rice [1997], which are implicit in Table 1. Alternative estimates of this
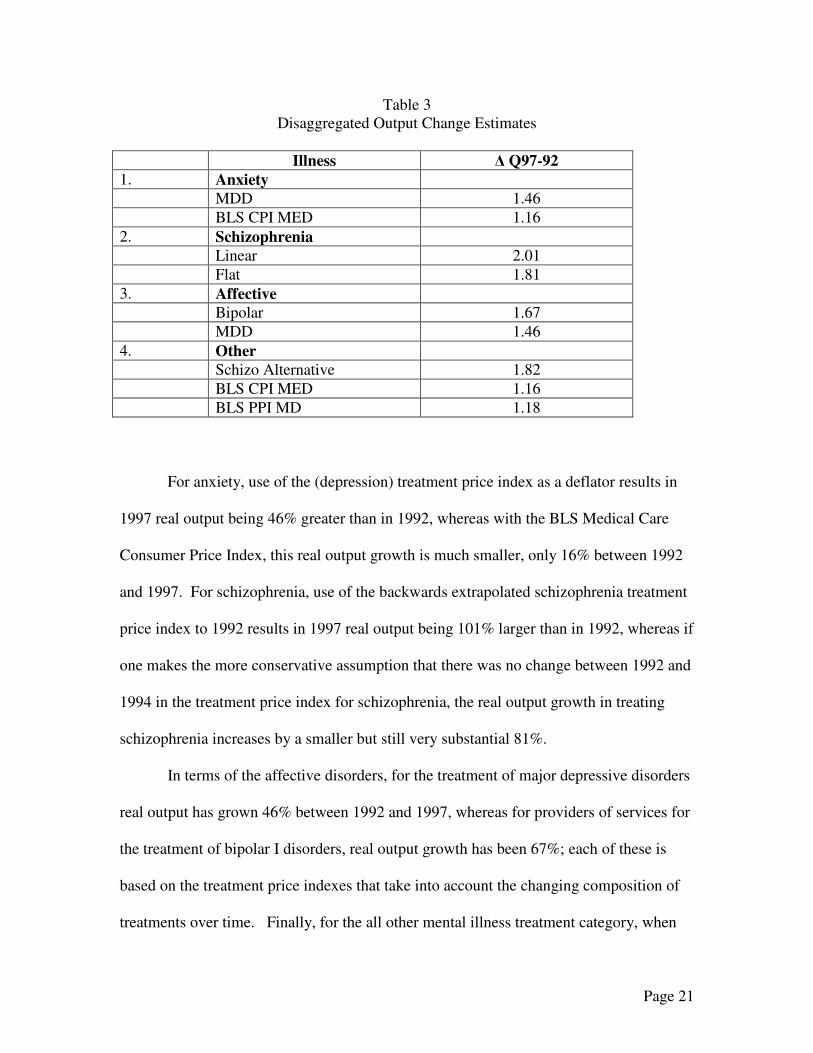
growth in real aggregate output of mental health services are presented in Table 4.
Table 4 Alternative Estimates of Aggregate Mental Health Services Output Change
� Q97-92 Mental Health Indexes Linear Schizophrenia 1.70 Flat Schizophrenia 1.66 Mix Mental Health/CPI (Flat Schizophrenia)
1.39
BLS CPI MED 1.16 BLS PPI MD 1.17
The striking conclusion that emerges from Table 4 is that when one employs
treatment price indexes that allow for compositional changes in treatment bundles, and
when one holds quality of care approximately constant, real output growth from
providers of mental health services has increased by 66% to 70% between 1992 and
1997, depending on whether one extrapolates backward in time, or holds flat the 1992
schizophrenia treatment price index relative to its 1994 value. By contrast, use of the
Page 23
BLS’s Medical Care price indexes as deflators yields only about one quarter as large an
estimate of the real output growth, 16% with the Medical Care consumer price index and
17% with the Physician Office producer price index.
Using an aggregate index that uses a CPI for anxiety disorders, the flat
schizophrenia extrapolation for schizophrenia, the bipolar and major depressions indexes
and the CPI for other mental disorders to deflate the ratio of nominal spending for 1997
and 1992, yields a real output change estimate of 1.39. Thus the conservative lower
bound that uses BLS indexes for diseases where no explicit alternative index has been
constructed indicates an increase in real output that is roughly double that which would
be obtained by simply relying exclusively on the BLS indexes.
V. DISCUSSION AND SUMMARY
In this paper we make a first attempt to use recent research on the construction of
alternative price indexes for the treatment of mental disorders to assess the aggregate
performance of the U.S. mental health delivery system. Recognizing that the task of
constructing price indexes for all mental disorders is not complete, we have used existing
work in combination with traditional indexes to provide several first order
approximations of estimated changes in the real output of the mental health sector. Our
estimates highlight the fact that even when the existing indexes are used for only those
disorders where an alternative price index has been developed, estimates of real output
growth are more than double the levels obtained from application of BLS price indexes.
One policy implication of this finding relates to concerns about the fact that
spending growth for mental health has lagged behind general medical care. Such
Page 24
comparisons implicitly use the general medical care spending growth to deflate mental
health spending. The evidence to date suggests that for major depression, bipolar disorder
and schizophrenia, prices have declined relative to alternative medical price indexes for
cardiovascular disease19. This means that some in the mental health policy community
have been significantly underestimating real output growth in the mental health sector.
A second dimension of economic performance of the mental health sector is
related to changes in productivity, which is calculated as the difference between
aggregate real output growth minus aggregate real input growth. Our estimates do not
provide direct evidence on this issue. However, there are some indirect empirical clues
about how productivity changed during the 1990s. To assess multifactor productivity one
must first estimate real output growth and then subtract the growth in real inputs from
that estimate. Data from insurance claims and reports from analyses of natural
experiments during the 1990s indicate that specialty providers generally have
experienced price declines.20 This suggests that holding quality of care constant, either
providers’ have reduced their margins or they are benefiting from productivity gains. In
either case real output from providers grew, as did real consumption by patients.
There are several other indicators of changes in real inputs. The number of
admissions per patient care staff and the number of days per patient care staff in private
psychiatric hospitals increased by about 36% between 1992 and 1998.21 Moreover, the
number of psychotherapy visits per episode of depression declined, while the quality of
care (as measured by the percentage of episodes meeting guideline standards of care)
increased.22 At the same time use of prescription drugs to treat major mental disorders
has expanded dramatically. Together these data point in the direction of net reductions in
Page 25
real inputs per episode of care, holding quality constant. These are however, not
systematic assessments and are suggestive and preliminary rather than definitive.
This paper advances a line of research that aims to provide a strong empirical
foundation for interpreting regularly collected economic statistics on the mental health
sector. To date the interpretation of changes in mental health spending and service
utilization has been too frequently left to the eye of the beholder. New research on
treatment price indexes for mental disorders is beginning to offer a method of more
clearly assessing the performance of the mental health delivery system based on data
from national health accounts. The results presented here are first approximations of
changes in real output. The important lesson from this exercise is that real output in
mental health care has increased far more than is apparent based on use of BLS price
indexes or on simple comparisons to health sector spending changes over time.
1 McKusick DT, Mark TL, King E, Harwood R, Buck JA, Dilonardo J, Genuardi JS. Spending for mental health and substance abuse treatment, 1996. Health Affairs. 1996;17(5):147157. 2 See, for example, Duggan MG. Does Medicaid pay too much for prescription drugs? A case study of atypical antipsychotics. Journal of Health Economics, 24(1):1-31, 2005; and Croghan TW. The controversy of increased spending for antidepressants. Health Affairs. 2001;20(2):129-135. 3 Mark T., R.M. Coffey, D McKusick et al National Expenditures for Mental Health Services and Substance Abuse Treatment 1991-2001, SAMHSA Publication SMA 04-3999, Rockville MD: SAMHSA, 2005; Hanson KL. Public opinion and the mental health parity debate. Lessons from the survey literature. Psychiatric Services. 1998;49(8):1-59-1066. 4 Triplett JE, Berndt ER. Introduction: New Developments in Measuring Medical Care. In Triplett JE and Berndt ER, Measuring the Prices of Medical Treatments. Washington DC: Brookings Institution Press, 1999:1-33. 5 Much of the material in this section is taken from Triplett and Berndt, supra. 6 For a recent discussion, see The special case of medical services, ch. 6 in National Research Council, At What Price: Conceptualizing and Measuring Cost-of-Living and Price Indexes, Panel on Conceptual, Measurement and Other Statistical Issues in Developing Cost-of-Living Indexes, Charles L. Schultze and Christopher Mackie, eds., Committee on National Statistics, Division of Behavioral and Social Sciences and Education, Wshington DC: National Academy Press, 2002:178-190. 7 Song X, Marder WD, Baser O, Houchens R, Conklin JE, and Bradley R. Can health care claims data improve the estimation of the Medical CPI? Paper presented at the National Bureau of Economic Research/Conference on Research in Income and Wealth Conference, Vancouver BC, June 28, 2004; also presented at the National Burau of Research Summer Institute, Health Care Program, August 6, 2004. 8 See Schultze and Mackie, supra. 9 Much of the material in this section is taken from Berndt ER. Price indexes for the treatment of mental health disorders, Pharmacoeconomics, 2004;22(Suppl 2):37-50.
Page 26
10 Berndt ER, Bir A, Busch SH, Frank RG, Normand S-L. The medical treatment of depression, 1991-1996. Productive inefficiency, expected outcome variations, and price indexes. Journal of Health Economics. 2002;21:373-396. 11 Frank RG, Busch SH, Berndt ER. Measuring prices and quantities of treatments for depression. American Economic Review. 1998;88(2):106-111; Frank RG, Berndt ER, Busch SH. Price indexes for the treatment of depression. In Triplett JE ed., Measuring the Prices of Medical Treatments. Washington DC: Brookings Institution Press, 1999:72-102. 12 Frank RG, Berndt ER, Busch AB, Lehman AF. Quality-constant prices for the ongoing treatment of schizophrenia. An exploratory study. Quarterly Review of Economics and Finance. July 2004;44(3):390-409. 13 Lehman AF. Quality of care in mental health. The case of schizophrenia. Health Affairs. 1999;18(5):52-65; Lehman AF, Steinwachs DS. Translating research into practice. The schizophrenia patient outcomes research team (PORT) recommendations. Schizophrenia Bulletin. 1998;24(1):1-10; Lehman AF, Steinwachs DS and the Survey Co-Investigators of the PORT Project. Patterns of usual care for schizophrenia. Initial results from the schizophrenia patient outcomes research team (PORT) client survey. Schizophrenia Bulletin. 1998;24(1):11-19. 14 Ling DYC, Busch AB, Frank RG. Treatment price indexes for bipolar disorder . Working paper Harvard Medical School June 2004 15 American Psychiatric Association. Practice guidelines for the treatment of patients with bipolar disorder (revision). Supplement, American Journal of Psychiatry. 2002;159(4):1-50. 16 Coffey, R.M. et al National Estimates of Expenditures for Mental Health and Substance Abuse Treatment, 1997 USDHHS, SAMHSA Publication No. SMA-00-3499; Rockville MD: SAMHSA, 2000. 17 Rice DP. Costs of mental illness. Update estimates. Rockville, MD: SAMSHA, unpublished data, 1997. 18Rouse B. (ed), Substance Abuse and Mental Health Statistics Source Book, 1998 Rockville MD: SAMHSA, 1998 19 Cutler D.M., M. McClellan, and J.P. Newhouse, “The Costs and Benefits of Intensive Treatment for Cardiovascular Disease” in J.E. Triplett (ed) Measuring the Prices of Medical Treatments, Washington DC: The Brooking Institution Press, 1999. 20 Frank, RG and JR Lave, “Economics” in S. Feldman (ed) Managed Behavioral Health Services Springfield Il: Charles Thomas Press, 2003 21 Manderschied RW and MJ Henderson, Mental Health U.S., 2002 DHHS Publication No. (SMA) 3938, Rockville MD: SAMHSA, 2004 22 Busch, SH, ER Berndt, and RG Frank, “Creating Price Indexes for Measuring Productivity in Mental Health Care” in A Garber (ed) Frontiers of Health Policy Vol 4, Chicago: University of Chicago Press, 2001.
![TOP 4 Vortrag Berndt-SIB-NLLeipzig1 [Kompatibilitätsmodus] · 2018. 3. 12. · 3 | 24. März 2014 | Dipl.-Ing. Gerlind Berndt Vergabe von Planungsleistungen 2013 Es wurden Verträge](https://img.pdfslide.net/doc/110x75/6117ec01fcb7353818072b60/top-4-vortrag-berndt-sib-nlleipzig1-kompatibilittsmodus-2018-3-12-3-24.jpg)