Embed Size (px)
Citation preview
BESC 320 (Water & Bioenvironmental Science)
Intro to probabilistic thought
Statistics answers questions:•It gives measures of effect size•It sets confidence limits on conclusions•It is simple in principles and general practice•Therefore, it is a crime to NOT be an expert
•E.g. two simple tests1. A lady is asked in eight instances whether
milk or tea is added first to her coffee2. The lady is asked to rate how much she
enjoys each cup on a scale of 1-100
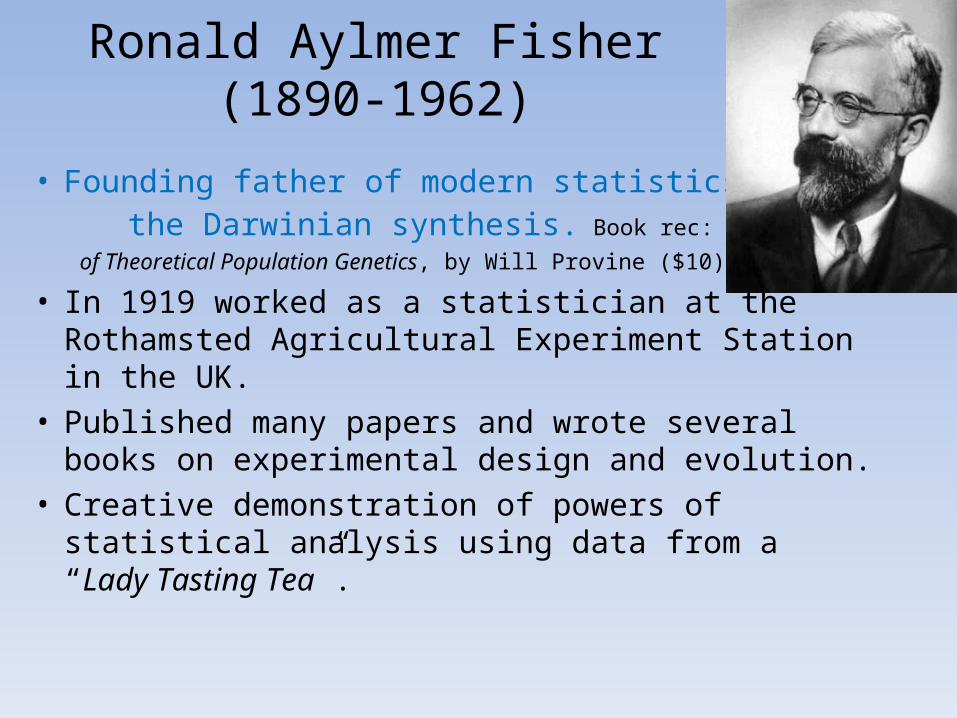
Ronald Aylmer Fisher(1890-1962)
• Founding father of modern statistics and the Darwinian synthesis. Book rec: The Origins
of Theoretical Population Genetics, by Will Provine ($10)
• In 1919 worked as a statistician at the Rothamsted Agricultural Experiment Station in the UK.
• Published many papers and wrote several books on experimental design and evolution.
• Creative demonstration of powers of statistical analysis using data from a “Lady Tasting Tea”.
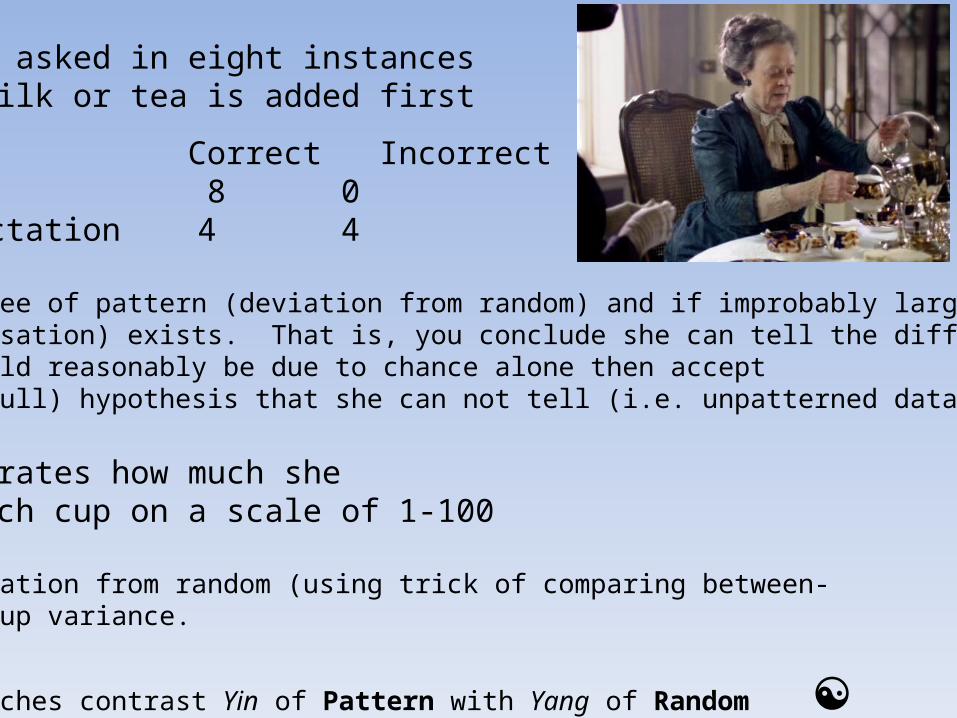
1. A lady is asked in eight instances whether milk or tea is added first
Correct IncorrectActual data 8 0Random expectation 4 4
Calculate degree of pattern (deviation from random) and if improbably largethen bias (causation) exists. That is, you conclude she can tell the difference.If pattern could reasonably be due to chance alone then accept the default (null) hypothesis that she can not tell (i.e. unpatterned data)
2. The lady rates how much she enjoys each cup on a scale of 1-100
Calculate deviation from random (using trick of comparing between-and within-group variance.
Both approaches contrast Yin of Pattern with Yang of Random ☯
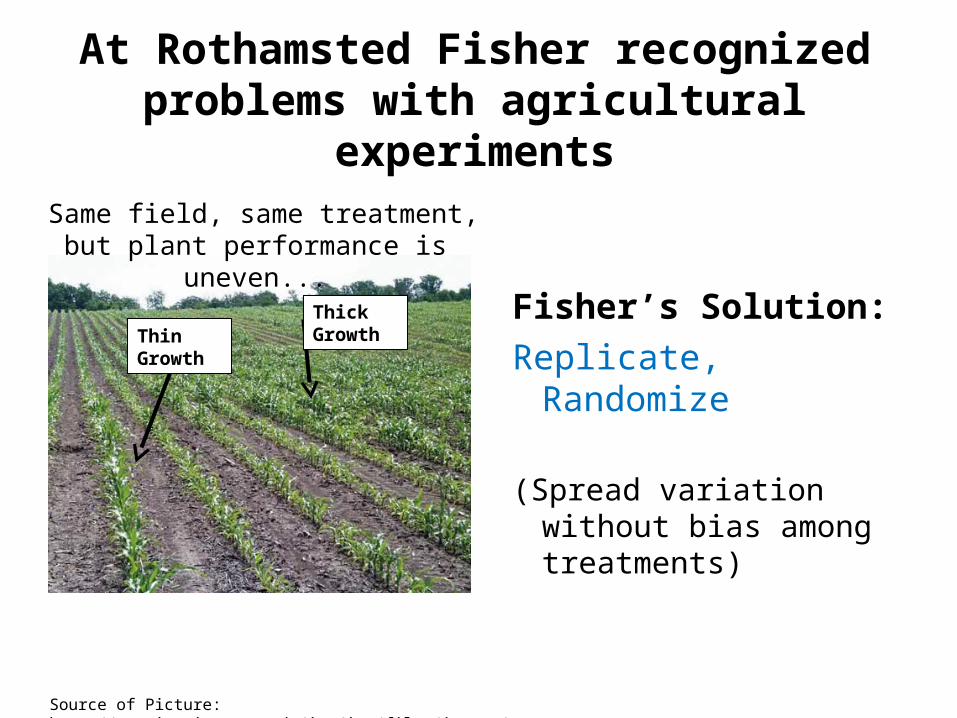
At Rothamsted Fisher recognized problems with agricultural experiments
Fisher’s Solution:Replicate, Randomize
(Spread variation without bias among treatments)
Source of Picture: http://www.ipm.iastate.edu/ipm/icm/files/images/uneven-corn-VS6.jpg
Same field, same treatment, but plant performance is uneven...
Thick GrowthThin
Growth
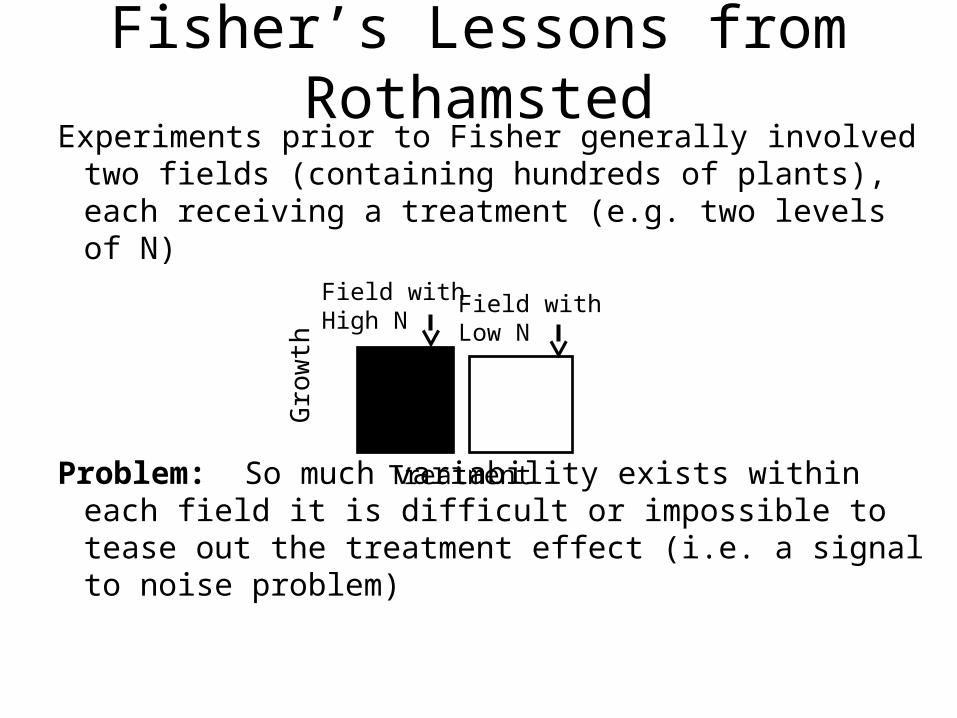
Fisher’s Lessons from RothamstedExperiments prior to Fisher generally involved two
fields (containing hundreds of plants), each receiving a treatment (e.g. two levels of N)
Problem: So much variability exists within each field it is difficult or impossible to tease out the treatment effect (i.e. a signal to noise problem)
Field withHigh N
Field withLow N
Gro
wth
Treatment
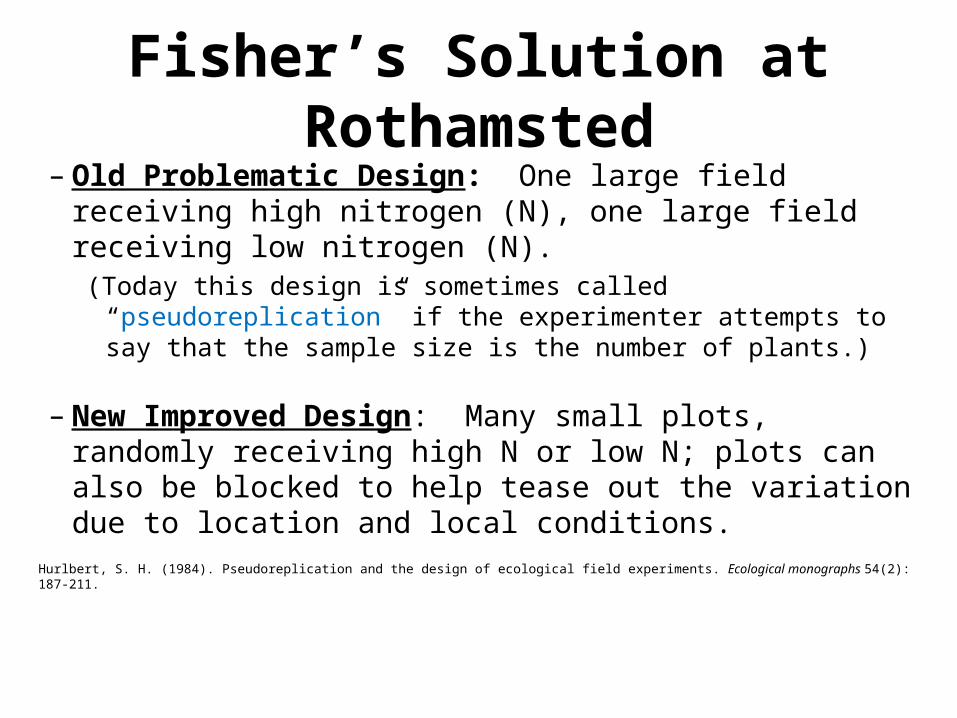
Fisher’s Solution at Rothamsted– Old Problematic Design: One large field receiving high
nitrogen (N), one large field receiving low nitrogen (N). (Today this design is sometimes called “pseudoreplication” if
the experimenter attempts to say that the sample size is the number of plants.)
– New Improved Design: Many small plots, randomly receiving high N or low N; plots can also be blocked to help tease out the variation due to location and local conditions.
Hurlbert, S. H. (1984). Pseudoreplication and the design of ecological field experiments. Ecological monographs 54(2): 187-211.
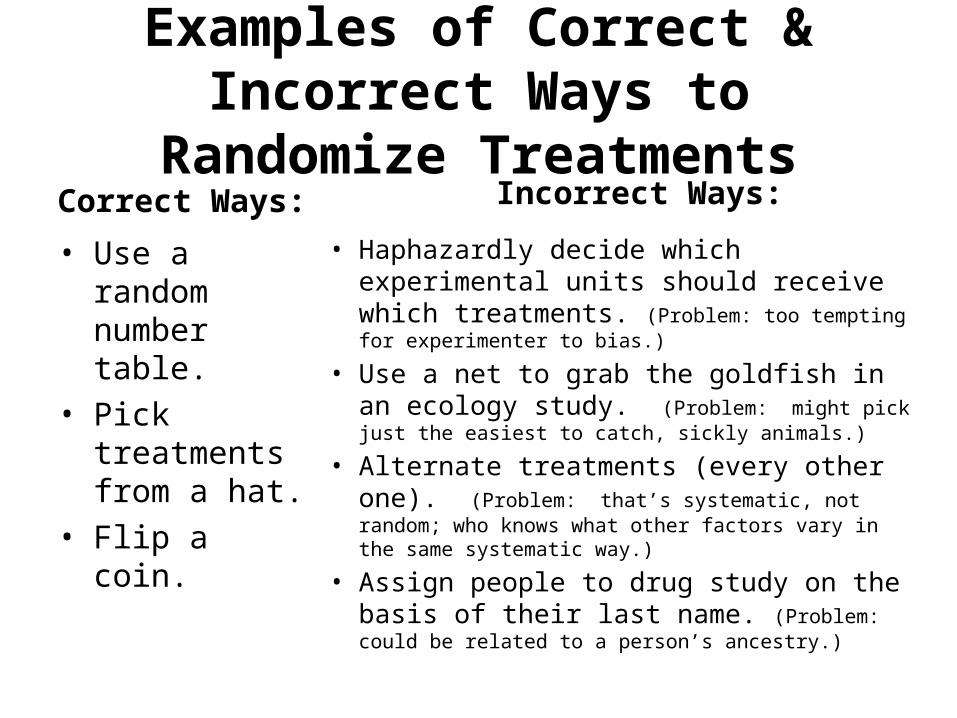
Examples of Correct & Incorrect Ways to Randomize Treatments
Correct Ways:
• Use a random number table.
• Pick treatments from a hat.
• Flip a coin.
Incorrect Ways:
• Haphazardly decide which experimental units should receive which treatments. (Problem: too tempting for experimenter to bias.)
• Use a net to grab the goldfish in an ecology study. (Problem: might pick just the easiest to catch, sickly animals.)
• Alternate treatments (every other one). (Problem: that’s systematic, not random; who knows what other factors vary in the same systematic way.)
• Assign people to drug study on the basis of their last name. (Problem: could be related to a person’s ancestry.)
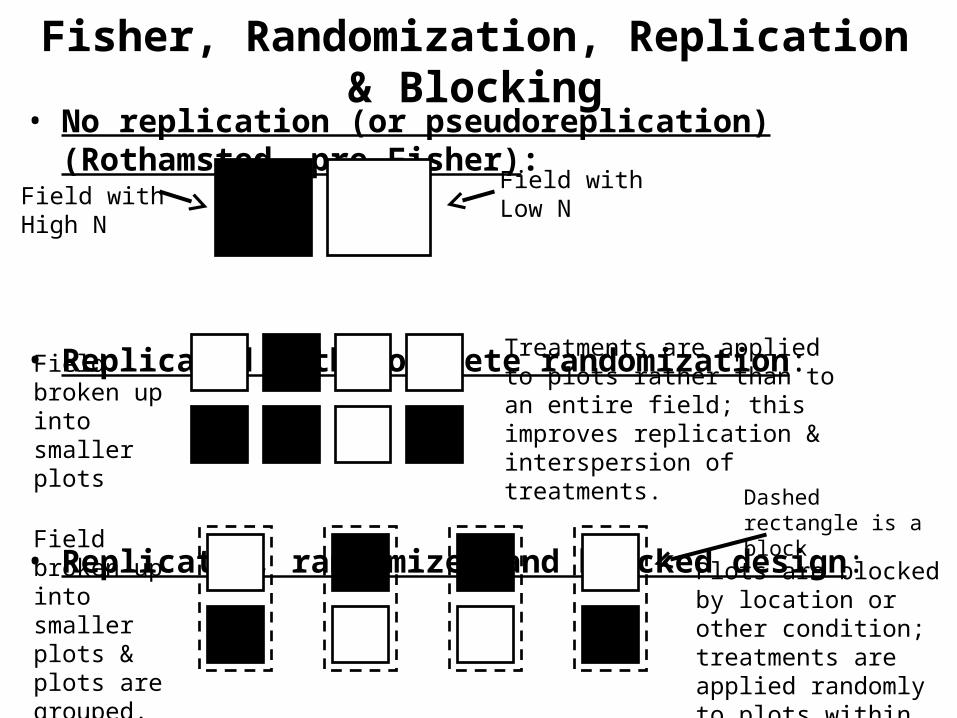
Fisher, Randomization, Replication & Blocking• No replication (or pseudoreplication) (Rothamsted, pre-Fisher):
• Replicated with complete randomization:
• Replicated, randomized and blocked design:
Field withHigh N
Field withLow N
Field broken up into smaller plots
Plots are blocked by location or other condition; treatments are applied randomly to plots within blocks.
Field broken up into smaller plots & plots are grouped.
Treatments are applied to plots rather than to an entire field; this improves replication & interspersion of treatments.
Dashed rectangle is a block
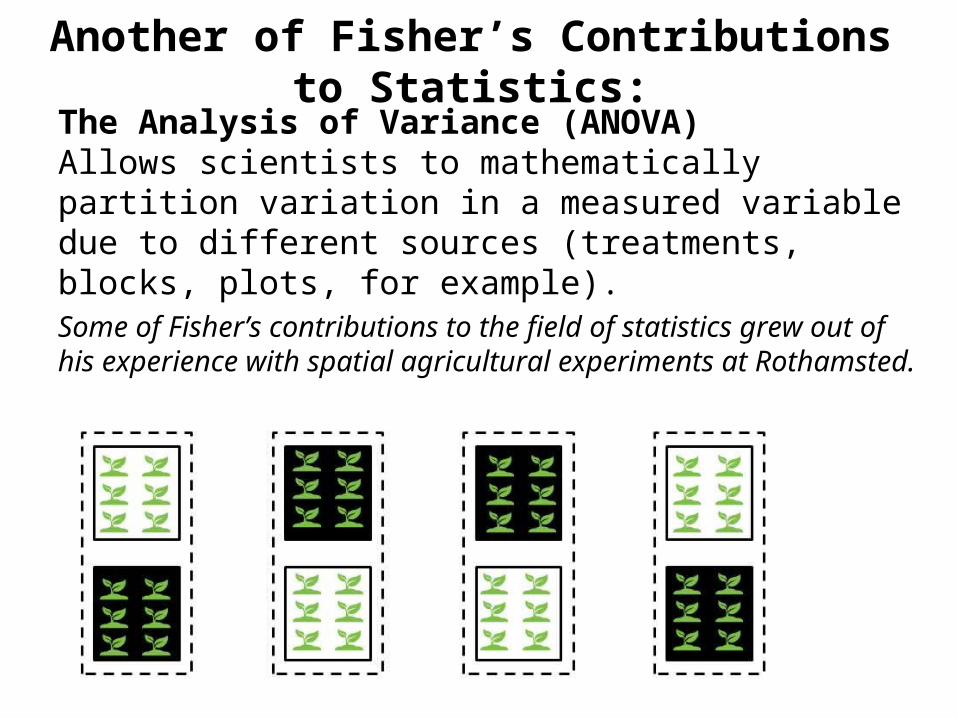
Another of Fisher’s Contributions to Statistics:The Analysis of Variance (ANOVA)Allows scientists to mathematically partition variation in a measured variable due to different sources (treatments, blocks, plots, for example).Some of Fisher’s contributions to the field of statistics grew out of his experience with spatial agricultural experiments at Rothamsted.
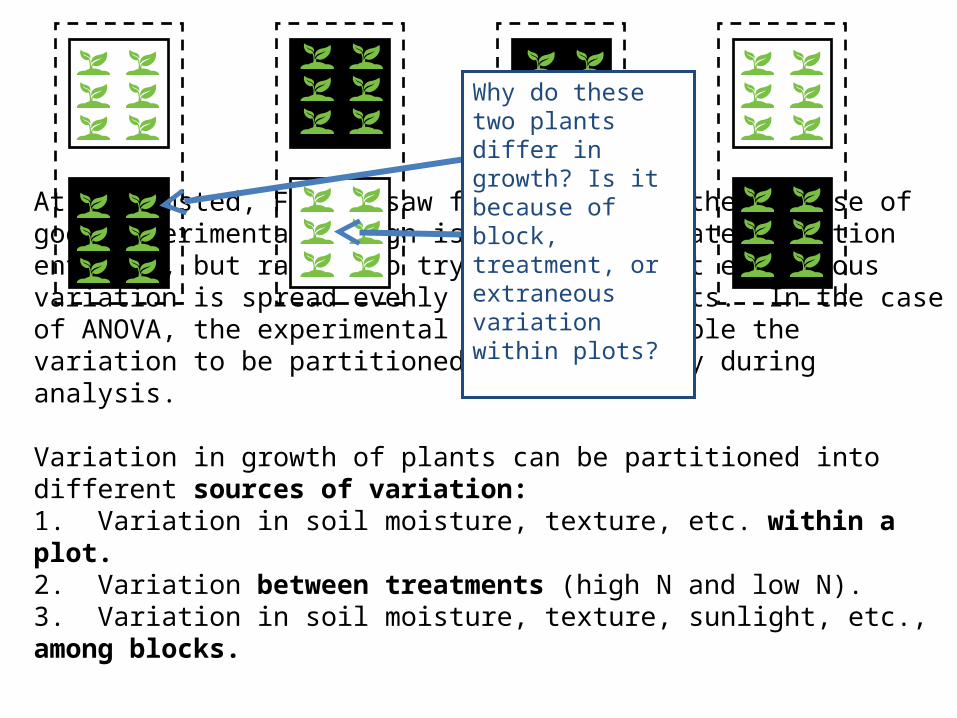
At Rothamsted, Fisher saw firsthand that the purpose of good experimental design is not to eliminate variation entirely, but rather to try to ensure that extraneous variation is spread evenly among treatments. In the case of ANOVA, the experimental design can enable the variation to be partitioned mathematically during analysis.
Variation in growth of plants can be partitioned into different sources of variation:1. Variation in soil moisture, texture, etc. within a plot.2. Variation between treatments (high N and low N).3. Variation in soil moisture, texture, sunlight, etc., among blocks.
Why do these two plants differ in growth? Is it because of block, treatment, or extraneous variation within plots?
This and following slides by TJ DeWittThis and following slides by TJ DeWitt
Let us try an experiment and analysisLet us try an experiment and analysis Fiji water is awesome Everyone knows that Let’s prove itFiji water is awesome Everyone knows that Let’s prove it
Two tests:Two tests:I.I. Side by side comparisonSide by side comparison II. Scaled measure of qualityII. Scaled measure of quality
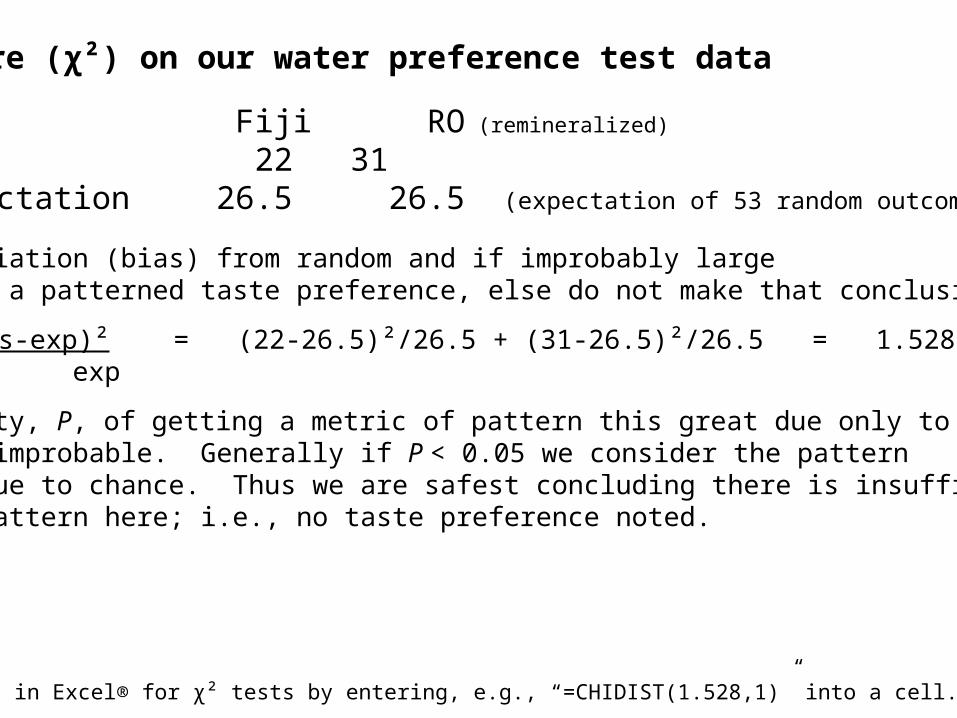
1. Chi-square (χ²) on our water preference test data
Fiji RO (remineralized)
Actual data 22 31Random expectation 26.5 26.5 (expectation of 53 random outcomes)
Calculate deviation (bias) from random and if improbably largestudents have a patterned taste preference, else do not make that conclusion.
χ² = ∑ (obs-exp)² = (22-26.5)²/26.5 + (31-26.5)²/26.5 = 1.528 exp
The probability, P, of getting a metric of pattern this great due only to chance is 0.216—not improbable. Generally if P < 0.05 we consider the pattern Improbable due to chance. Thus we are safest concluding there is insufficient evidence of pattern here; i.e., no taste preference noted.
FYI: Get P values in Excel® for χ² tests by entering, e.g., “=CHIDIST(1.528,1)” into a cell.
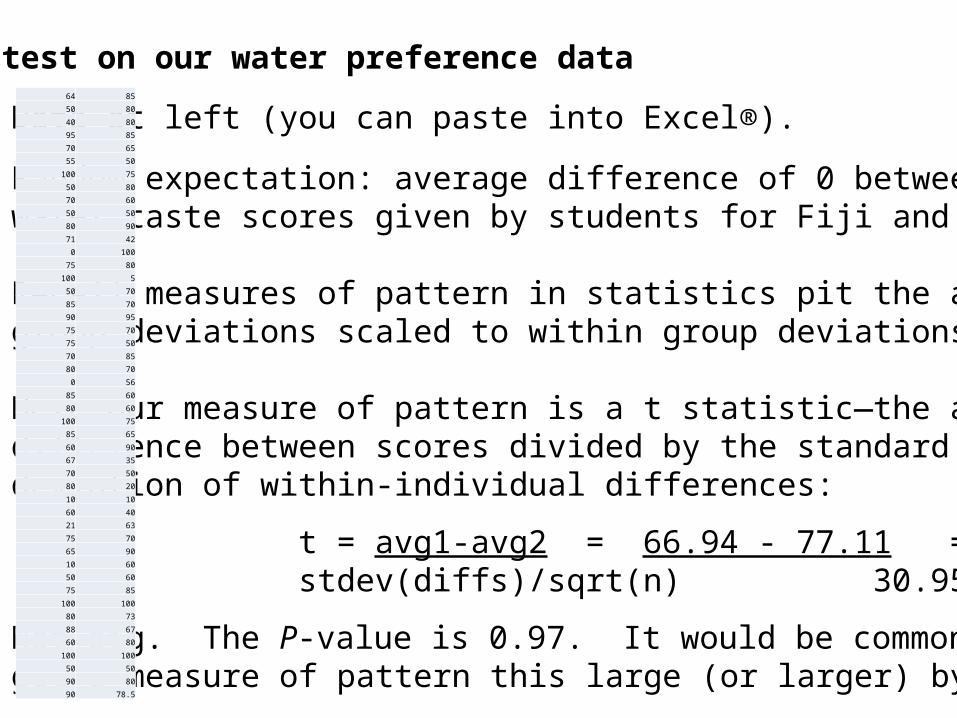
2. t-test on our water preference data
Data at left (you can paste into Excel®).
Random expectation: average difference of 0 between water taste scores given by students for Fiji and RO
Recall measures of pattern in statistics pit the amonggroup deviations scaled to within group deviations.
Here our measure of pattern is a t statistic—the averagedifference between scores divided by the standard deviation of within-individual differences:
t = avg1-avg2 = 66.94 - 77.11 = 0.04stdev(diffs)/sqrt(n) 30.95 / 6.86
Not big. The P-value is 0.97. It would be common to get a measure of pattern this large (or larger) by chance.
64 85
50 80
40 80
95 85
70 65
55 50
100 75
50 80
70 60
50 50
80 90
71 42
0 100
75 80
100 5
50 70
85 70
90 95
75 70
75 50
70 85
80 70
0 56
85 60
80 60
100 75
85 65
60 90
67 35
70 50
80 20
10 10
60 40
21 63
75 70
65 90
10 60
50 60
75 85
100 100
80 73
88 67
60 80
100 100
50 50
90 80
90 78.5
So what are the cardinal points?
The field of statistics provides tools to measure pattern againstrandom (or a priori) expectations
Test statistics, like χ², t, F, Λ, are metrics of pattern1. generally among group (or along gradient) variation relative to within group (or off gradient) variation2. Can be compared to the greatest expected values of the test statistics one might expect to arise by chance alone3. A P value is the chance of a pattern equal to or greater than that observed occurring only by chance
Independent replication is important in statistical analysis sopattern due to sloppy experimental design can not intrude tocreate either excess bias or noise.