Embed Size (px)
Citation preview

Best Practices in Port Management: An Assessment of Two Ports
By,
Abra Bacchioni Dr. Joseph Ramus, Advisor
May 2008
Masters project submitted in partial fulfillment of the requirements for the Master of Environmental Management degree in
the Nicholas School of the Environment and Earth Sciences of Duke University
2008

Abstract Corporation X owns and operates Port Y in Indonesia and will begin using Port Z in Australia, a public port, in late 2008. The ports are used to export copper concentrate, while Port Y is also used to move commodities, cargo, and people. Analysis based on field observations and personnel interviews revealed strengths and weaknesses in best management practices at each location. As the Corporation aims to demonstrate best port practices, this assessment of environmental practices and protocols addresses handling of cargo, protocols for ships, environmental controls, monitoring, and general practices. Research found that Port Y could lessen environmental impacts by enclosing the copper concentrate conveyor system. Best practices at Port Y include ballast water management and monitoring practices. Port Z could improve its management practices by increasing environmental monitoring frequency; best practices include movement of copper concentrate and air quality maintenance.

Table of Contents
I. Introduction ............................................................................................... 1 A. Port Y and Indonesia ............................................................................................... 1 B. Port Z and Australia ................................................................................................ 3
II. Methods..................................................................................................... 5
III. Assessment of Best Practices ................................................................. 6 A. Protocol for Ships..................................................................................................... 6
Ballast Water ............................................................................................................. 6 Anchoring .................................................................................................................. 9 Waste and Oil Discharge .......................................................................................... 9 Spills ......................................................................................................................... 12
B. Handling of Cargo .................................................................................................. 13 Diesel ........................................................................................................................ 13 Coal........................................................................................................................... 14 Copper Concentrate................................................................................................ 14
C. Environmental Controls and Characteristics...................................................... 16 Water Quality.......................................................................................................... 16 Stormwater .............................................................................................................. 18 Dredging................................................................................................................... 19 Air Quality ............................................................................................................... 20 Odor and Noise Management ................................................................................ 21 Land Management .................................................................................................. 22 Weather.................................................................................................................... 23 Reefs ......................................................................................................................... 23
D. Monitoring .............................................................................................................. 24 Water........................................................................................................................ 24 Air............................................................................................................................. 25 Sediment................................................................................................................... 26 Flora and Fauna ...................................................................................................... 26
E. General Management............................................................................................. 28 ISO Certification ..................................................................................................... 28 Reclamation ............................................................................................................. 28 Polluter Penalties .................................................................................................... 29
IV. Recommendations ................................................................................ 29
A. Port Y ...................................................................................................................... 29 B. Port Z....................................................................................................................... 31 C. Ports Port Y and Port Z ........................................................................................ 33
V. Conclusions ............................................................................................. 34
References .................................................................................................... 35
Photographs................................................................................................. 37

1
I. Introduction
Located on the ocean’s margins, shipping ports facilitate the movement of goods in
to and out of countries and continents. With continuous ship traffic, ports have the potential
to cause significant damage to the marine environment without proper practices and
protocols. Corporation X currently owns and operates Port Y, located in Indonesia, and will
begin to export from Port Z in Australia at the end of 2008. The names of the Corporation,
ports, and some locations have been changed and the appendices have been removed for the
purposes of confidentiality.
This report has two main objectives: 1) assessing the environmental practices at
Port Y and Port Z; and 2) recommending changes that can be made to improve
environmental practices at each port. The purpose of the assessment is to provide an
understanding of what environmental activities are occurring at the two ports.
Recommendations are made by applying best port practices to areas of weakness at each
port.
A. Port Y and Indonesia
Port Y is located in Indonesia (Photo 1). The port was built by Corporation X to
facilitate the movement of goods through the local Bay. Port Y was built for use by the
local copper and gold mine situated 15 km to the southeast. The copper extracted is not
fully processed on site, but is filtered into a copper concentrate. Copper concentrate is an
intermediate product in the copper production process. Copper sulfide ore is ground and
put through a flotation process, causing copper sulfide particles to form a froth which
separates the copper sulfide particles from the extraneous ore material, allowing it to be

2
skimmed off (Photo 2). The removed froth is dried, forming copper concentrate of various
grades (usually about 20 to 40%, based on the concentration of copper in the powder).
The Port is used to both import and export goods. Each of the four wharfs in the
Port has a designated function: general purpose, unloading, loading, or passenger
movement. The major goods imported at the Mine are coal, diesel, and mining
equipment. Copper concentrate is exported to an external processing location. The Port Y
Port provides the primary means for transporting people to and from the mine, using
seaplanes, a ferry, and a helicopter. Also within the Bay is a dock built for local island
residents to use (Photo 3). Located across the Bay from port, this dock is government run,
used by local fisherman and running a ferry to the neighboring island.
Port facilities cover about 100 hectares. Other operations at Port Y include
concentrate dewatering and storage, consumables storage, fuel oil storage, and equipment
maintenance. The Port receives an average of 20 concentrate ships per year (about two per
month) and 152 cargo and liquid fuel ships (about eight cargo ships per month and five
fuel ships per month) (PTNNT, 1996).
The Port is run by the Port Logistics Team, consulting with Environmental Affairs,
Safety, and Security groups when necessary. Working together, these groups maintain the
port environment through spill procedures, cargo movement practices, monitoring the air
and water, and environmental controls. Port Y is governed by both Indonesian regulations
and internal company policies, which are often more stringent than the domestic
regulations. Company regulations and management cover such topics as air emissions,
ballast water, marine water, point source discharges, sewage treatment, solid waste, and
spill response.
3
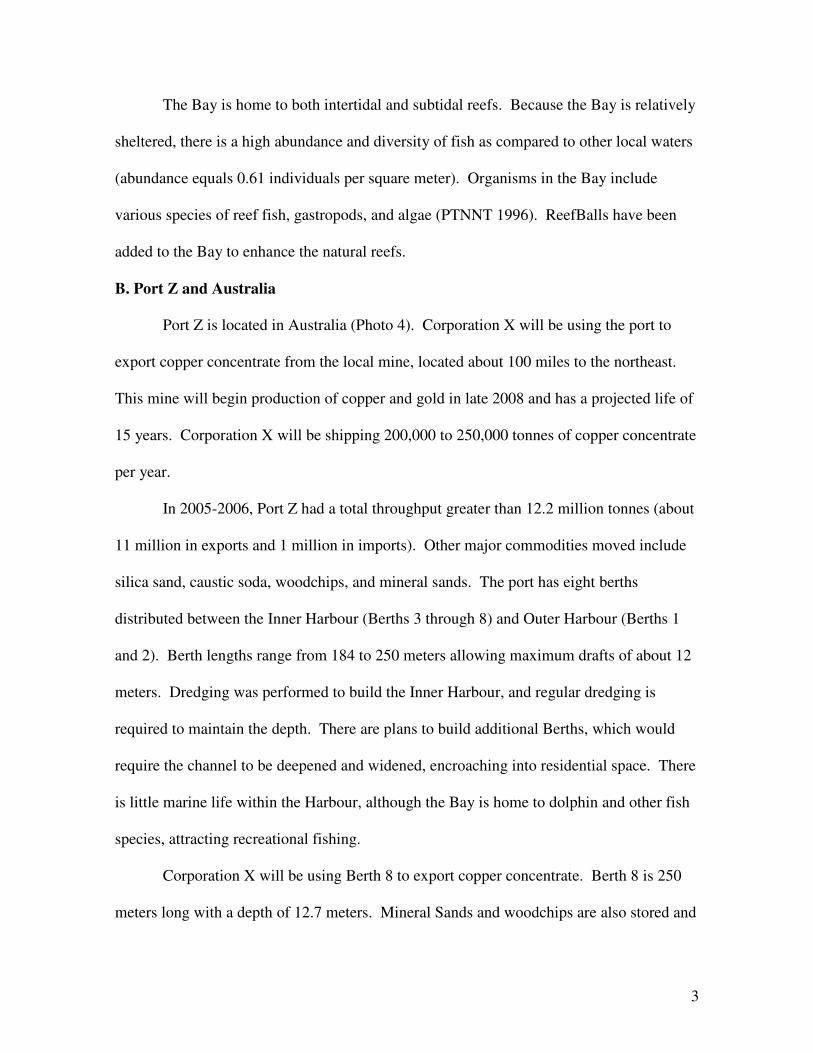
The Bay is home to both intertidal and subtidal reefs. Because the Bay is relatively
sheltered, there is a high abundance and diversity of fish as compared to other local waters
(abundance equals 0.61 individuals per square meter). Organisms in the Bay include
various species of reef fish, gastropods, and algae (PTNNT 1996). ReefBalls have been
added to the Bay to enhance the natural reefs.
B. Port Z and Australia
Port Z is located in Australia (Photo 4). Corporation X will be using the port to
export copper concentrate from the local mine, located about 100 miles to the northeast.
This mine will begin production of copper and gold in late 2008 and has a projected life of
15 years. Corporation X will be shipping 200,000 to 250,000 tonnes of copper concentrate
per year.
In 2005-2006, Port Z had a total throughput greater than 12.2 million tonnes (about
11 million in exports and 1 million in imports). Other major commodities moved include
silica sand, caustic soda, woodchips, and mineral sands. The port has eight berths
distributed between the Inner Harbour (Berths 3 through 8) and Outer Harbour (Berths 1
and 2). Berth lengths range from 184 to 250 meters allowing maximum drafts of about 12
meters. Dredging was performed to build the Inner Harbour, and regular dredging is
required to maintain the depth. There are plans to build additional Berths, which would
require the channel to be deepened and widened, encroaching into residential space. There
is little marine life within the Harbour, although the Bay is home to dolphin and other fish
species, attracting recreational fishing.
Corporation X will be using Berth 8 to export copper concentrate. Berth 8 is 250
meters long with a depth of 12.7 meters. Mineral Sands and woodchips are also stored and

4
moved from this Berth. Corporation X is a tenant of the port, and therefore must follow
port regulations. A shed is being built to store the copper concentrate before it is shipped
for processing (Photo 5). All activities beyond the shed fall under port jurisdiction,
including regulations and shipping procedures. A shared ship loader linked to the storage
shed will be used to move the concentrate onto ships.
The Port Authorities Act was proclaimed in 1999 to update and standardize port
authority management approaches in Western Australia. The Act allows each port
authority to manage and run the port, under the control of the Western Australia
Government. The government sets the goals for the ports while directing the allowable
activities (State of Western Australia 1999). Additional regulations were added in 2001,
addressing topics including pilotage, goods and cargo, and non-compliance penalties, with
a section dedicated to the Port Authority (State of Western Australia 2001).
The Port Authority, as an autonomous body, has an Environmental Management
Strategy which aims to eliminate the risk of damage to the environment. If elimination is
not possible, mitigation efforts are to be employed, with a contingency plan ready in case a
problem arises. To minimize or reduce impacts, the Port Authority is committed to
developing emergency response procedures, maintaining and monitoring systems,
providing environmental awareness programs, managing storm water runoff, maintaining
preparations for an oil spill response, maintaining marine sediment quality, and monitoring
air, noise, and water quality (Port Authority 2005).
In 2007 lead contamination was identified at Port Esperance. Lead carbonate
concentrate contaminated the local community, killing thousands of birds and affecting
community members. The contamination was linked to Magellan Metals and a lead mine

5
in Wiluna. The lead carbonate was transported 600 miles to the port by train and truck,
during which the material dried out and was blown off of the transport vehicle.
This case brought a lot of attention to port regulations and procedures in Western
Australia, affecting environmental affairs at Port Z and therefore the Corporation’s
activities at the Port. The Department of Environmental Conservation and the Department
of Heath are currently looking into port activities. Audits are being performed at every
port in WA to look for possible issues and improvements Special attention is being given
to fugitive emissions and the potential for contamination outside of the port. As
Corporation X will be trucking copper concentrate at a rate of about one truck per hour,
they must be cautious of contamination along the route. It is likely that these
investigations will result in more stringent environmental regulations for the ports in the
future. For now, ports in WA remain a very sensitive topic.
II. Methods
The primary method of data collection for this assessment was inquiries of port
personnel in Indonesia and Australia. After performing background research on port
management using online resources, both ports were visited in January of 2008. In
Indonesia primary data were collected from The Mine and Port Y. Information came from
a variety of mine and port personnel and departments, including Port Logistics, Marine
Quality, Filtration, and Environment. A series of questions were asked to determine the
status of Port Y. A tour of the facilities was provided, both by boat and on land, offering
the opportunity to observe the various machinery and operations.
At Port Z in Australia, a similar procedure was followed. At the port, a meeting
was held with members of the Port Authority, including the CEO, Environment, Health &

6
Safety Officer, and the Port Superintendent. The same questions were asked at Port Z as
were at Port Y. A tour of Berth 8 presented the ship loading machinery and the site of the
storage shed currently under construction for copper concentrate storage. Additional
information was collected at the local office and at the Mine site.
III. Assessment of Best Practices
An assessment of the ports of Z and Y was performed to provide an understanding
of port procedures and protocols related to the environment. The assessment was divided
into five categories: protocol for ships, handling of cargo, environmental controls and
characteristics, monitoring, and general management. This section will present the results
of this assessment, discussing what was observed at each port.
Best practices are presented at the end of each section. The best practices in port
management come from policy, regulations, and various port literature. The International
Maritime Organization (IMO), a United Nations specialized agency, has a series of
conventions applicable to port management. These conventions are voluntary and
demonstrate the best practices in their individual topics. Both Port Y and Port Z follow the
IMO conventions.
A. Protocol for Ships
When in port, ships follow protocols set by the port. Port Y and Port Z each have a
management regime in place to which visiting ships must comply. These protocols
address ballast water, anchoring, waste and oil discharge, and spills.
Ballast Water
Ballast water is water held on a ship to maintain balance and stability while sailing.
Water is typically taken up in one location and emptied in another, resulting in the release

7
of marine organisms into a new environment. This causes non-native species and
pathogens to be introduced, which can be harmful to the environment and human health
(GBWMP 2008).
Port Y
Port Y requires all berthing ships to exchange ballast water either through the pump
out method or the flow through method. The pump out method drains the ballast tank until
suction is lost while the flow through method pumps ocean water (a full tank’s worth)
through the ballast tank three times. This is confirmed by checking the ship logs. In
addition to monitoring logbooks, ballast water of all ships is inspected by port personnel.
Water in the ballast tank entering the port must be from water deeper than 100 meters,
although there is no required distance from the port for the exchange. If these standards are
not met, the ship must leave the Port to perform the exchange before returning to move
cargo. If it is critical that a ship release ballast water while in port, Port Y provides a
containment facility that is then dumped onto the waste site at the mine. In case of an
accidental release, a spill boom is set up around the ship and the water and sediment is
cleaned (following spill protocol).
Port Z
The primary management regimes for ballast water in Port Z is the IMO
“Guidelines for the control and management of ships ballast water” and the National
Ballast Water Management Arrangements. No ballast water discharge is allowed while in
port; a ship may not enter the port if the ballast water has not been exchanged. Ships are
required to show the shipping logs reporting that a ballast water exchange has been
performed. AQIS (Australian Quarantine and Inspection Service) may sample ballast

8
water for invasive species, and a marine pest survey is performed each year. Port Z is not
prepared to handle purposeful discharge of ballast water, but does have a spill plan in place
for accidental discharge.
Best Practices
The International Convention for the Control and Management of Ships’ Ballast
Water and Sediments aims at minimizing the risk of invasive introductions of damaging
aquatic species and pathogens and subsequent dangers to the environment and human
health (adopted in February, 2004; IMO 2004a). Under the IMO, details of the Ballast
Water Convention include ship and port procedures, reporting, enforcement and
monitoring, and research. Ships are to have ballast water management plans to facilitate
minimized introductions of pathogens and marine species. When loading ballast water, the
ship should maintain practices that minimize uptake of invasives (for example, ships
shouldn’t load in very shallow waters or in the dark when bottom organisms move
upwards). Unnecessary release of ballast water should be avoided and the tanks should be
cleaned regularly. Ports should have ballast water reception facilities, and when present,
ships should discharge water into this location (IMO 2004b).
To help ports estimate potential impacts from ballast water, the Convention
provides scientific information for different introduction scenarios. When ballast water is
released and treated or loaded, all events should be recorded and reported, with full
disclosure of any current adverse conditions (such as nearby sewage outfalls). To monitor,
the port should record effects of ballast water on the local marine environment and water
and sediment samples should be tested for survival of introduced organisms. The
Convention also looks to facilitate the exchange of research on ballast water management
9
between signatory states. As is done at Port Z with the National Ballast Water
Management Arrangements, states can supplement the Convention with domestic
legislation (IMO 2004b).
Anchoring
Port Y
A no anchor policy exists in the Bay. Ships are required to berth at the wharfs after
being escorted into the port by a tugboat. If there are too many ships at the wharf, a ship
must anchor outside of the bay until space becomes available. The no anchor policy acts to
prevent seafloor destruction, in addition to being a security measure, for example, for
fisherman or the seaplane (to ensure nothing becomes caught up in the anchor line) .
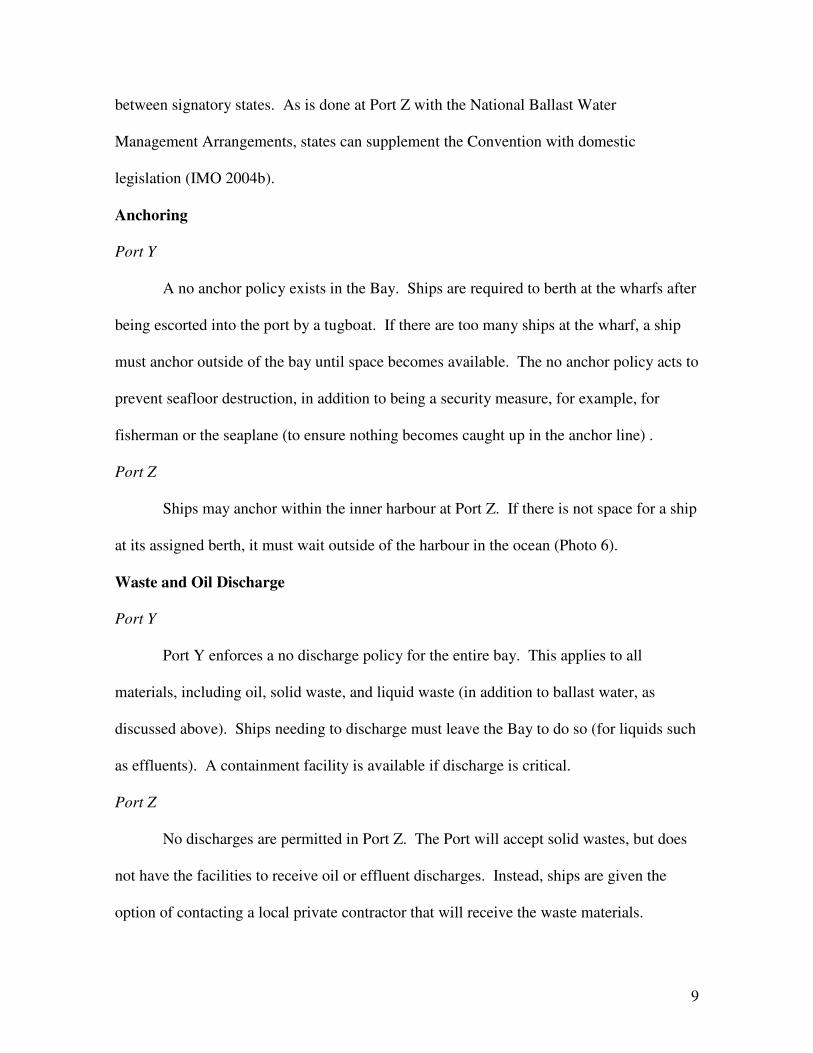
Port Z
Ships may anchor within the inner harbour at Port Z. If there is not space for a ship
at its assigned berth, it must wait outside of the harbour in the ocean (Photo 6).
Waste and Oil Discharge
Port Y
Port Y enforces a no discharge policy for the entire bay. This applies to all
materials, including oil, solid waste, and liquid waste (in addition to ballast water, as
discussed above). Ships needing to discharge must leave the Bay to do so (for liquids such
as effluents). A containment facility is available if discharge is critical.
Port Z
No discharges are permitted in Port Z. The Port will accept solid wastes, but does
not have the facilities to receive oil or effluent discharges. Instead, ships are given the
option of contacting a local private contractor that will receive the waste materials.

10
Best Practices
The Convention on the Prevention of Marine Pollution by Dumping of Wastes and
Other Matter 1972, more commonly known as the London Convention, entered into force
in 1975. The Convention was updated in 1996 with the 1996 Protocol to the Convention
on the Prevention of Marine Pollution by Dumping and Other Matter. As called for by the
UN Convention on the Law of Seas Article 210.6, the London Convention sets dumping
standards and rules. Regulatory programs are used to assess the potential impact of
dumping and whether dumping is necessary in order to prevent harm to the marine
environment and human health (IMO 2007a).
Updates to the Convention in 1996 made the regulations more stringent. The
precautionary approach was adopted, requiring ships to take preventative measures if it is
believed that the introduced waste is likely to cause harm. Additionally, a “reverse list”
approach was adopted. The updated Convention states that all dumping is prohibited,
except for a short list of acceptable wastes which includes dredged material, sewage
sludge, fish wastes, inert inorganic geological material, organic material of natural origin,
and bulky items primarily comprising iron, steel and concrete. (IMO 2005).
Combining two treaties from 1973 and 1978, MARPOL 73/78, or the International
Convention for the Prevention of Pollution from Ships, was first adopted in November of
1973. At the time, it addressed pollution from chemicals, oil, sewage, harmful substances
in packaged form, and garbage. The Protocol of 1978 was then developed, absorbing the
original 1973 Convention. Together, as MARPOL 73/78, the intent of the Convention is to
prevent and regulate pollution, accidental and routine, to the marine environment from
ships (IMO 2006a).

11
Annex I (Prevention of Pollution by Oil) sets oil discharge limits and only allows
oil discharges from tankers under specific conditions. “Special Areas” are set where, due
to vulnerability, no oil can be discharged. Amendments to Annex I include double hull
requirements for tankers being phased in. Discharge criteria for 250 noxious substances
are written in Annex II (Prevention of Pollution by noxious Liquid Substances in Bulk).
Noxious substances cannot be discharged within 12 miles of land. Categorizations for
noxious substances have been added in recent amendments, along with lowering of
allowable discharge levels (due to technology improvements) (DOTARS 2007).
Annex III (Prevention of Pollution by Harmful Substances Carried by Sea in
Packaged Form) outlines requirements for the logistics of packaging and moving of
harmful substances. Addressing sewage, Annex IV (Prevention of Pollution by Sewage
from ships) details sewage discharge to sea and required facilities and activities in port.
Sewage discharge may only occur at specified distances from land. Currently under
review, Annex V (Prevention of Pollution by Garbage from Ships) deals with the disposal
of garbage, requiring disposal at specified distances from land. No plastic may be
disposed of at sea and, like in Annex I, there are more stringent requirements in “special
areas” (DOTARS 2007).
The IMO encourages members to have reception facilities available at the port for
safe disposal of wastes. For ports to enforce MARPOL and “zero tolerance of illegal
discharges from ships” adequate reception facilities are needed as an outlet for those
wastes. There is currently an Action Plan by the Marine Environmental Protection
Committee (MEPC) addressing reception facilities. The Plan discusses proposed topics to
be covered by the IMO, including reporting, information on facilities, equipment and

12
technology, types of waste, regulatory matters, technical assistance, and a port reception
facilities database. The MEPC advises the development of a Guide to Good Practice on
Port Facilities, as a guidance document for good practices related to reception facilities,
also including applicable regulations. The Global Integrated Shipping Information System
(GISIS), an online database, lists reception facility information for member ports (IMO
2006b).
Spills
Port Y
In case of a spill or discharge, an Emergency Response Team is called in and the
first line of defense is a spill boom (Photo 7). This is immediately placed around the ship
to contain the spill. Once the spill is contained, damages to the sediment, water, or biota
can be assessed and from there the appropriate protocol is followed. Other equipment
available include Spill Kits and drums for the disposal contaminated materials. The
Environment Department on site provides guidelines to the Port Logistics group. When
unloading diesel, a spill boom is always placed around the ship as a preventive measure in
case of a spill.
Port Z
As is required by the Port Authority, Port Z has an emergency protocol for all
spills. The protocol outlines the correct actions to be taken for each spill scenario. Plans
are addressed in the Port Authority “Port Emergency Plan” (2001), “Oil Spill Contingency
Plan” (2002), and the Port “Oil Spill Contingency Plan – Action Plan” (2002). Equipment
available at the Port includes spill booms, drums for sludge, and Transpac containers for
oily residue storage (BPA, 2006)

13
Best Practices
A spill prevention, control, and countermeasure plan should exist in accordance
with the IMO Manual on Oil Pollution. This plan includes identifying areas sensitive to
spills, detailing responsibilities for managing spills, preparing specialized spill response
equipment (such as containment booms), and training personnel in spill response measures
(IFC 2007a). The IMO has a protocol for the spills of hazardous and noxious substances
(HNS), under the Protocol on Preparedness, Response and Co-operation to Pollution
Incidents by Hazardous and Noxious Substances. HNS is any substance other than oil that
can create hazards to human health or living resources, or other uses of the sea, when
introduced to the environment. The Protocol encourages ports to have spill equipment,
communications plans, and training (IMO 2007b).
B. Handling of Cargo
Loading and unloading materials in port demands certain environmental
precautions. Port Y and Port Z export, therefore load, copper concentrate. The major
imports for The Mine are diesel and coal, but as Port Z is only used for export no
unloading takes place. Best practices in this section apply for all loading and unloading
operations, therefore will be found at the end.
Diesel
Port Y
When handling diesel in port, protocol requires that only the operator and the
captain be allowed in the area. A spill boom must be placed around the ship as a
precaution before the diesel is pumped off the ship, where it is then pumped directly to the
mine (Photo 8).

14
Coal
Port Y
An excavator unloads coal, scooping coal from the ship into a waiting chute on the
wharf. This conventional method typically leads to spilling of coal, both into the water and
onto the wharf (Photo 9). During offload, the chute must have a constant water spray to
prevent dust formation. After a spill, the ground is cleaned and divers occasionally check
the water to ensure there isn’t a large coal buildup. Dredging occurs periodically to
maintain the depth under the wharf. For example, dredging occurred in 2007 for the first
time since 1999.
An alternative mechanism that results in less spillage is the screw method, but this
is not used at Port Y. Environmental personnel on site maintain that because only good
quality coal is imported, having low sulfur content, the coal does not pose a risk to the
environment. To prevent additional spills, the suppliers must comply with specific barging
requirements; otherwise the Port will not accept the coal. Barging requirements necessitate
the coal pile only reach to one meter below the top of the barge and the walls of the barge
are constructed of strong quality.
Copper Concentrate
Port Y
Copper concentrate is filtered and stored at the port. Storage takes place in a large
hanger-like building that is open at either end. The end facing the Bay has strips of rubber
hanging down the opening to lessen wind impact (Photo 10). The concentrate is kept at
about nine percent moisture to prevent dust formation.

15
A covered conveyor system runs between the filtration plant and the storage
facility, and then from the storage facility to the ship loader. Sections of the conveyor are
open on the sides while others sections have plastic plates along the sides to lessen wind
impact. Rollers below the conveyor band bend inwards to contain the copper concentrate
and trays under the conveyor catch concentrate that is lost (photo 11). A border is located
around the trays as a containment mechanism, to prevent land or water contamination
(Photo 12). The telescopic discharge chute must be positioned in the ship hold before the
transfer begins (Photo 13). All of these systems minimize the loss of copper concentrate.
Most spillage occurs when the loader is being cleaned, which is a requirement every time
copper grades are switched.
Port Z
Copper concentrate is moved onto ships through an enclosed conveyor system at
Berth 8 (Photo 14). The enclosed system ensures dust containment and wash containment.
This prevents copper contamination of the surrounding land and the harbour. Because the
conveyor is a shared system by all Berth 8 lessees (loading different materials), it must be
thoroughly washed between every use. A telescopic cascade chute is used for all dry
products for dust control, which has an end secured inside the ship’s hold before the
copper concentrate is moved (Photo 15). The infrastructure around the cascade chute is
uncontained. The Port Authority is currently looking for ways to retrofit it to provide
greater containment.
A stevedore, will carry out the ship loading for Corporation X. Although it has not
been finalized, Corporation X will likely set a moisture level of about nine percent for
copper concentrate to prevent dust formation. The first few shipments will be monitored

16
closely by the Port for spills to identify any areas that need improvement. Extra baseline
sediment levels will be taken in the Inner Harbour to check copper levels. This baseline is
imperative for future monitoring to accurately assess additional impacts from copper
concentrate loading. If a spill were to occur, a “berth pocket” exists beneath the ship
berthing space, which would provide some containment, making cleanup easier. The berth
pocket is hull-shaped deepened section of the harbour above which the ship berths.
A copper concentrate storage facility is currently being built on an open lot at Berth
8 (Photo 5). The facility is designed to have a set of double doors for the trucks to enter.
This system requires one door to always to be closed, preventing exposure to wind.
Best practices
Dust must be controlled when loading and unloading materials and during storage.
Dust suppression mechanisms should be installed, including water spray and covered
storage areas. Telescoping chutes best control dust when loading, along with continuous
screw conveyor for unloading. Free fall of material should be avoided and dry cargo pile
heights should remain low. When material isn’t being moved or handled, it should be
covered (IFC 2007a). All conveyors and sources of fugitive emissions should be enclosed
to prevent material from becoming airborne (Gupta et al. 2005).
C. Environmental Controls and Characteristics
Each port follows a number of environmental procedures to ensure that
environmental impacts are minimized. Controls are in place to protect the environment,
addressing water quality, stormwater, surface discharge, dredging, reefs, air quality, odor
and noise management, land management, and weather.
Water Quality

17
Port Y
The Bay has low current speeds and a rotary flow pattern (water flows toward all
points of the bay during a tidal cycle), resulting in a long residence time. Slow flow at the
water surface and energetic flow at depth cause surface discharges in the Bay to remain in
the region of the discharge point for hours to days. Deeper discharges disperse more
rapidly (PTNNT, 1996).
Primary protection for the water quality stems from the no discharge policy,
preventing harmful material from being introduced into the Bay. Two catchments, or
ponds, collect rainwater, wastewater, and washdown water before it enters the Bay. The
water then passes through perforated drainage, which traps debris and sediment before the
water goes into the bay. Oil water separators allow only clear water to enter the Bay. The
East Pond receives water from one of the sewage treatment plants (STP) that treats sewage
from local facilities (such as the offices and homes in the area). Water must be monitored
upstream and downstream to meet STP requirements.
The power plant located adjacent to Port Y uses water from the Bay for the cooling
system. Chlorine is added to the water to eliminate living organisms that can foul the
cooling system and the water becomes heated as it cools the plant. After use, the water is
returned to the bay (Photo 16). This water must comply with a number of parameters,
including chlorine, temperature, and sulfite, to ensure that the water doesn’t impact the bay
from temperature or chemical pollution. Both the water leaving the plant and the outfall
area in the Bay are tested for the above listed parameters.
Port Z

18
Port Z complies with ANZECC’s guidelines for ocean dumping. In the port
agreement with the state government, there are no water quality levels that must be
maintained.
Best Practices
For applicable best practices to protect water quality, see ballast water, waste and
oil discharge, and stormwater.
Stormwater
Port Y
After a major rain event, the Bay is monitored to check for any negative effects
(this monitoring is in addition to the water quality monitoring schedule listed below in the
monitoring section). As discussed above with water quality, stormwater is directed to
ponds where it can be filtered before entering the Bay.
Port Z
A revamp of the stormwater procedure will be performed over the next six months
at Port Z. Currently, stormwater and wash-water (water used to wash down the conveyor
after use) goes directly into the Inner Harbour from a point under Berth 8 (Photo 17). The
new system will direct stormwater and washwater back inland to be treated onsite,
collecting sediments in the process. Once the water is inland, an assessment will
determine the best treatment option (this has not yet been determined). This procedure will
start at Berth 8.
Best Practices
Storm drainage catch basins should not discharge directly into surface waters.
Containment basins should be used in areas with risk of accidental releases. Oil-water

19
separators should exist in all runoff collection areas and recovered contaminated soil
should be treated and disposed of as hazardous material. To prevent sediment and
particulate introduction into the water, filters should be installed (IFC 2007a).
Dredging
Port Y
No dredging was needed to build Port Y. Dredging is only performed for
maintenance purposes to remove the spilled coal from beneath the unloading berth every
five years or so in order to maintain the depth under the wharf. Dredged material is sent to
the landfill on the mine site that holds other mine wastes. Because dredging is not a major
issue, no dredging protocol exists.
Port Z
The Bay was dredged to build the Inner Harbour and must be dredged regularly to
maintain the Port. Planned expansion of the port will require additional dredging in the
near future. Removed soil is dumped two kilometers off shore under a sea dumping permit
issued by the Federal Department of Environment (under the National Ocean Dumping
Guide). The most contaminated spoil must be capped with one meter of uncontaminated
soil.
Before the spoil is dumped, predisposal monitoring occurs. Although this
monitoring takes place, the government won’t actually stop the Port from dumping the
spoil. Port Z is required to demonstrate that it is not practical to dump the spoil on land.
For the first time, the government has asked the Port to monitor the drift from the spoil
dump, especially for TBT (tributyltin), a component in antifouling material. The

20
monitoring checks for mobilization, and it needs to be ensured that the capping was
successful. Currently, a more formal dredging plan is being developed.
Best Practices
Dredging should only occur when necessary for new infrastructure, creation of safe
navigation channels, maintenance of safe navigation channels, or for environmental
purposes. The most appropriate dredging method should be used to minimize sediment
suspension and destruction of habitat. If sensitive habitat or species are present, dredging
should avoid harm. Sediment should be tested before dredging to determine reuse or
disposal options. If the sediment is uncontaminated, reuse should be considered. Other
options include lateral containment in open water or cap containment. If open water
disposal is not ideal, contained disposal facilities should be used, with the inclusion of
liners or other containment designs that will prevent leaching (IFC 2007a).
Air Quality
Port Y
Air quality is maintained at Port Y by minimizing dust suspension. Before a
transfer of copper concentrate occurs, the ship loader is secured in the ship hold. By
maintaining a nine percent moisture level of concentrate, the chances of suspension are
lessened. During unloading of coal, the material is constantly under a water spray.
Suitable weather conditions are required during transfers (as will be discussed later).
Port Z
The enclosed conveyor system ensures that copper concentrate is not suspended
during the transfer from the shed to the ship loader. A nine percent moisture level will be

21
maintained and the ship loader must be inserted in the ship’s hold before loading begins.
Movement of concentrate will only occur under appropriate weather conditions.
Best Practices
The International Association of Ports and Harbors (IAPH) recently introduced the
Resolution on Clean Air Programs for Ports, encouraging all ports to adopt a clean air
program. The Resolution advises ports to make a commitment to clean air and then create
a plan that will reduce emissions (IAPH 2007). Nitrogen oxide and sulfur oxide emissions
are to be minimized. Low sulfur fuels will reduce sulfur emissions. In port access areas,
ships should drive at partial power (IFC 2007a).
Annex VI of MARPOL (Prevention of Air Pollution from Ships) limits air
emissions. It limits nitrogen oxide emissions and requires that sulphur contents remain
under 4.5 percent (by mass). Ozone depleting substances may not be purposefully emitted
and onboard incineration is not allowed for specific items (DOTARS 2007).
Odor and Noise Management
Port Y
No strong odors have been identified at Port Y. Because containers are not opened
in the port area, odor is not an issue. The power plant adjacent to the Port creates noise,
but port operations do not. Ambient noise monitoring stations are located throughout the
mine and adjacent to the port. Although some monitoring stations recorded noise levels
exceeding regulations, none of the exceedences were associated with port operations.
Port Z
22
The prevailing wind at Port Z is normally offshore, port to ocean. This carries
odors away from the Port, causing minimal impact on local residents. Noise has not been
identified as an issue at Port Z.
Best Practices
Noise levels should not exceed maximum allowable levels. If operations create
noise, noise control methods should be implemented at the noise source. Options include
mufflers on engines, acoustic enclosures, acoustic barriers, limiting the hours of operation
for certain equipment, or using the local topography as a noise buffer. The inclusion of a
land buffer to separate community members from the port would act to prevent issues due
to noise or odor (IFC 2007b).
Land Management
Port Y
No buffers have been designated around the Port. Soil quality is maintained
through monitoring of a soil stockpile near the Port. The quality assessment allows
treatment depending on the soil condition. Additionally, trees are regularly planted around
the Port.
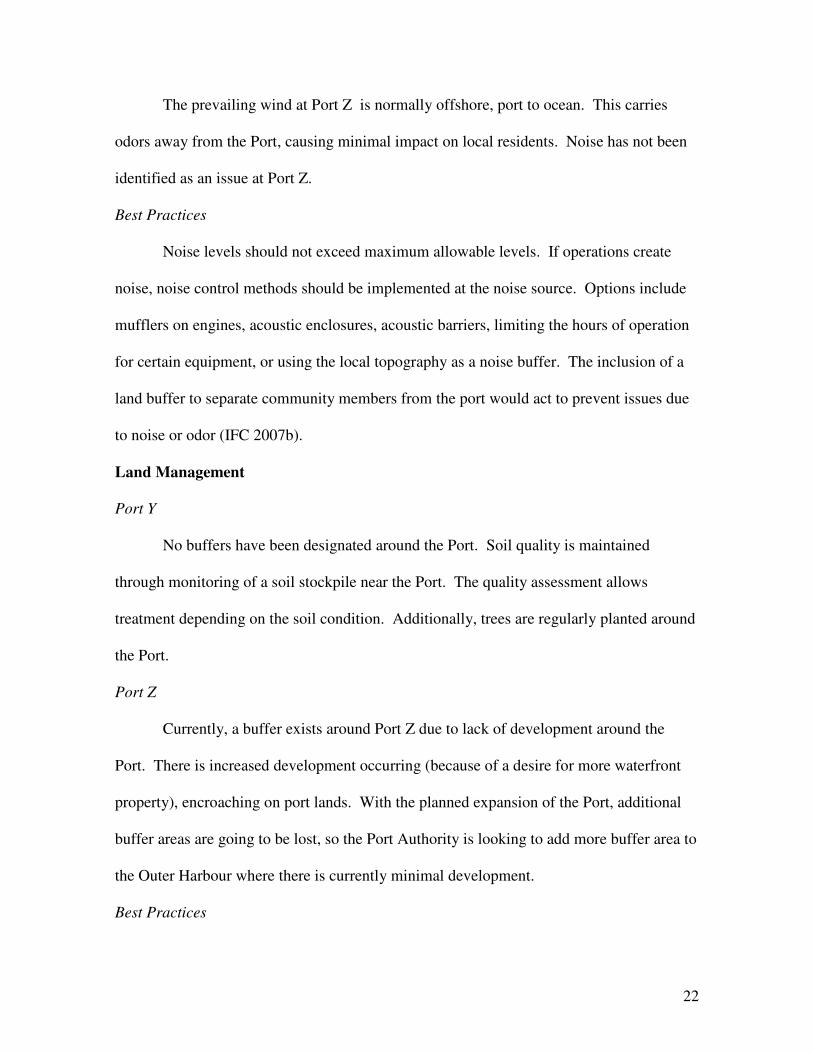
Port Z
Currently, a buffer exists around Port Z due to lack of development around the
Port. There is increased development occurring (because of a desire for more waterfront
property), encroaching on port lands. With the planned expansion of the Port, additional
buffer areas are going to be lost, so the Port Authority is looking to add more buffer area to
the Outer Harbour where there is currently minimal development.
Best Practices

23
During port construction and operation, shoreline and land impacts should be
assessed, especially those areas of high biodiversity or with endangered species (IFC
2007a). Green belts and open areas around the port should be increased. Functions of a
green belt include absorbing air and water pollution, lessening noise diffusion, lessening
erosion, and producing an aesthetic background (Gupta et al. 2005).
Weather
Port Y
Under high rain, port operations usually close. In the case of high winds, material
movement is limited, but more for the purpose of safety than the environment.
Port Z
The decision to stop loading due to poor weather conditions is made jointly
between the Port Authority, the stevedore, and Corporation X. To protect contamination
of the air or water, caution is taken in high winds and rain.
Reefs
Port Y
Intertidal coral reefs exist on the north and south sides of The Bay, with narrow
areas of fringing reefs adjacent to the cliffs. The macroalgae Sargassum, Padina, and a
variety of gastropod species, dominate the reefs. Scattered patch reefs are also present on
the coastlines and the inner eastern shore. The reef is relatively flat, lacking in structural
diversity, and therefore attracting fewer and less diverse fish (PTNNT, 1996).
To enhance the existing reefs, Corporation X began a ReefBall program in the Bay.
ReefBalls are interspersed within the natural reef to enhance the ecosystem. To date, 1072
balls have been placed, moving towards a total of 2000 balls by completion in 2010.

24
Seafloor transects determine the best location for placement, considering seafloor
characteristics (the biggest factor being bottom substrate, which ideally is comprised of
concrete ruble). Some ReefBalls receive transplanted coral pieces from natural reefs
(using only pieces that have broken off) to encourage better growth.
The Water Quality team in charge of the ReefBalls identified three characteristics
to consider when using ReefBalls: substrate, organic matter, and depth. If the seafloor is
too sandy, the ReefBall will sink down or the sand will get in the way of species
colonization. Too much organic matter can cause increased algae, which will cause
competition for the coral. Reefs at shallower depths (about 2 to 5 meters) have better
colonization than deep reefs (about 10 to 12 meters). This is because the coral needs
sunlight to grow, and therefore if it gets too deep it cannot receive the necessary sunlight
and the balls aren’t colonized or the coral doesn’t grow well.
Port Z
There are no reefs around Port Z.
D. Monitoring
Monitoring must be performed regularly to check for contamination. Monitoring
results are necessary for both Corporation X requirements and government regulations.
Water, air, sediment, and flora and fauna are monitored. Best practices apply to all
monitoring activities.
Water
Port Y
Monitoring of water in the Bay is divided into seawater quality, which considers
impacts by port operations, and marine water quality, which assesses impacts from the

25
power plant water discharge (increased temperature and chlorine from cooling water) and
seepage and spills via groundwater (of fuel oil, waste water effluent, or leachate).
Seawater is monitored every three months at seven locations in the Bay with one control
site. Monitoring looks at conductivity, temperature, density, and dissolved oxygen (CTD
monitoring) along with dissolved metal concentrations.
Marine water quality tests turbidity and total suspended solids, free chlorine, and
dissolved metals, along with conductivity, temperature, density, and dissolved oxygen.
Water quality is sampled at six locations, each at two depths, for a total of 14 samples (plus
one control at two depths) (Photo 18). CTD profiling occurs at seven locations and
temperature is recorded at five locations. The water sampling and CTD sampling takes
place quarterly, while temperature is recorded continuously. Additionally, there are a
number of groundwater monitoring locations adjacent to Port Y.
Port Z
Nutrient levels in the harbour are checked every two years at about 15 monitoring
locations. Groundwater is checked through bore monitoring in the region. These
infrequent checks are sufficient for government requirements. Any contamination
incidents are remediated and must be reported to the government.
Air
Port Y
Ambient air quality is monitored at two locations at Port Y and throughout the
mine site. Monitoring occurs twice per year (over a seven day period) and parameters
recorded include sulfur dioxide, nitrogen dioxide, nitrogen oxide, nitric oxide, hydrogen
26
nitrate, and carbon monoxide. Additionally, a continuous monitoring system monitors air
every hour.
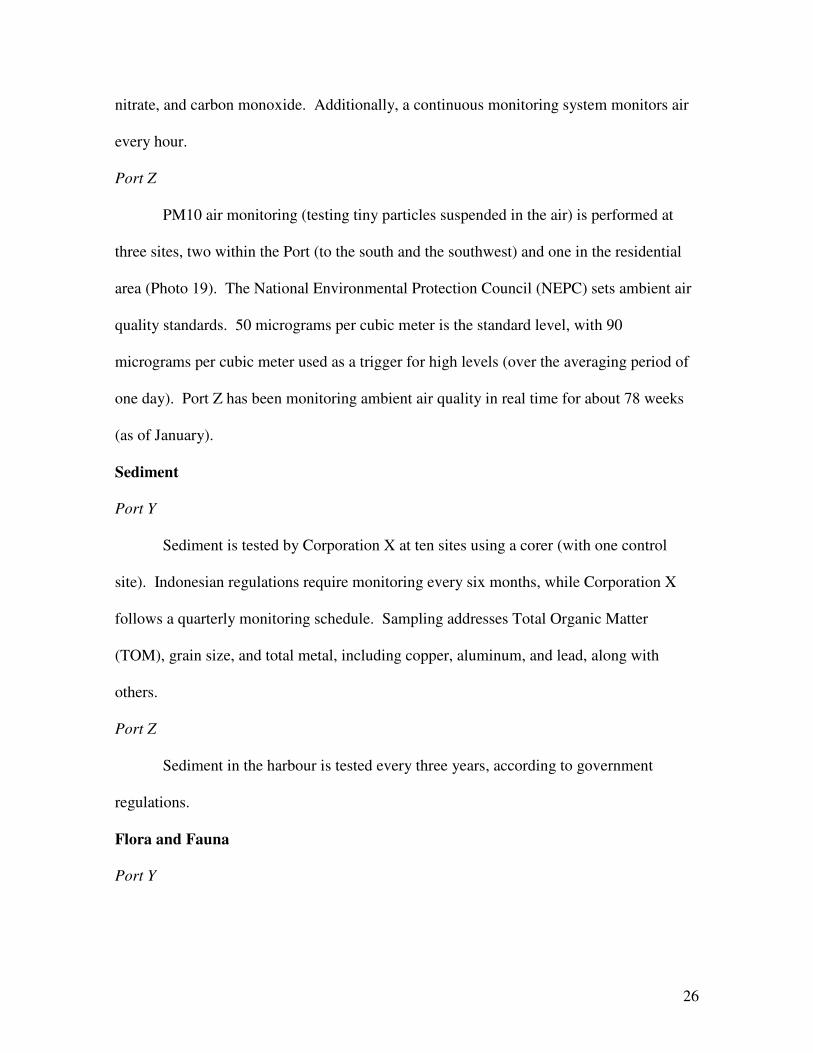
Port Z
PM10 air monitoring (testing tiny particles suspended in the air) is performed at
three sites, two within the Port (to the south and the southwest) and one in the residential
area (Photo 19). The National Environmental Protection Council (NEPC) sets ambient air
quality standards. 50 micrograms per cubic meter is the standard level, with 90
micrograms per cubic meter used as a trigger for high levels (over the averaging period of
one day). Port Z has been monitoring ambient air quality in real time for about 78 weeks
(as of January).
Sediment
Port Y
Sediment is tested by Corporation X at ten sites using a corer (with one control
site). Indonesian regulations require monitoring every six months, while Corporation X
follows a quarterly monitoring schedule. Sampling addresses Total Organic Matter
(TOM), grain size, and total metal, including copper, aluminum, and lead, along with
others.
Port Z
Sediment in the harbour is tested every three years, according to government
regulations.
Flora and Fauna
Port Y

27
Flora and fauna monitored in the Bay include coral reef, reef fish, benthic
organisms, phytoplankton, and zooplankton. Monitoring of coral reef and reef fish occur
twice per year, considering sub tidal characteristics, reef type, and reef fish communities.
Transects, point intercept methods, and visual surveys are performed. Benthic organisms
(using sieves to sample and identify benthic biota), and phytoplankton and zooplankton
(using vertical tows) are also surveyed every six months to identify any changes in
community composition. Eight monitoring locations exist for benthic organisms and five
for phytoplankton and zooplankton (including one control location for each).
Port Z
Flora and fauna studies address birds, fish, and vegetation. Monitoring is not
performed regularly, although the Department of Fisheries conduct occasional monitoring.
Best Practices
Monitoring at ports considers visual characteristics, odors, chemical quality, and
biological characteristics. Pre-construction and operation monitoring provides baseline
conditions at the port. Before operations begin, potential discharges are identified (to the
air and water). Impacts from these discharges and the possible receptors (of the impacting
activity) are then determined. The next step is to select the parameters to be monitored,
based on the types of releases and impacts predicted. The monitoring plan is then written,
with consultations and approval from local regulatory agencies and the public. Finally, the
plan is implemented, evaluating trends and identifying any harm to the environment
(AAPA 1998).
Monitoring frequency should be determined based on the parameter being
considered. Trained individuals should perform the monitoring and the results should be
28
assessed regularly. Comparisons should be made with operating standards and baseline
tests (IFC 2007a).
E. General Management
In addition to the environmental concerns at the Ports, there are also general
management issues. These topics include ISO certification, reclamation, and polluter
penalties.
ISO Certification
Port Y
ISO certification at Port Y would fall under the certification of The Mine.
Corporation X is currently seeking ISO certification of all mines by 2009, therefore the
port operations in Port Y will likely fall under site-wide certification.
Port Z
Port Z is currently seeking ISO 14001 certification. If The Mine becomes certified,
the port operations may or may not be included under the certification.
Best Practices
Internationally, ports and harbors are seeking ISO 14000 certification. ISO
certification occurs when a port or group develops and implements an Environmental
Management System (EMS) for its practice that is then verified by third party auditors
(Gupta et al. 2005).
Reclamation
Port Y
After The Mine ends production, reclamation of Port Y will take place along with
other mine reclamation activities. This would include decommissioning and removing the

29
equipment and planting around the port. Portions of the Port (such as the wharfs) may be
left for use by local residents.
Port Z
Because Corporation X is a lessee of Port Z, closure of The Mine will simply end
the contract with the Port. The storage shed will be either decommissioned or sold to the
Port Authority.
Polluter Penalties
Port Y
If a spill occurs in the Bay, the ship is required to pay $100,000 or the cost of
cleanup, as determined by the environment department.
Port Z
Port Z enforces a polluter pays policy, requiring the polluting ship to pay for the
cleanup.
Best Practices
The London Conventions includes a “polluter pays” protocol, putting the
responsibility on the ship that polluted and harmed the environment to pay for the cleanup
and any subsequent damages.
IV. Recommendations
Based on best practices being performed at Port Y and Port Z , and port
management literature, this section will make recommendations for changes each port can
make to improve environmental practices. The two ports can learn from each other, each
achieving best practice.
A. Port Y

30
1. Port Y needs to reduce copper contamination to the Bay and the port grounds.
At monitoring site B7, located just offshore of the ship loader, copper levels were
measured at 445 mg/dry kg in the fourth quarter of 2006. This is ten times higher than
levels recorded at other sites in the Bay (ranging from about 7 to 76 mg/dry kg) (PTNNT,
2007). Although the report states that these impacts were predicted by the ANDAL
(Analisis Dampak Lingkungan, or Environmental Impact Statement), which supported that
increased levels of copper wouldn’t have a secondary or cumulative impact, copper
introduction and accumulation in the Bay should be minimized.
Enclosing the ship loading equipment can minimize copper concentrate
contamination in the Bay. At Port Z, the conveyor system is fully enclosed, preventing
any discharge during washdowns or due to wind. Currently, Port Y has portions of the
conveyor fully open on the sides while other portions have plastic flaps for coverings.
Preventing releases on land protects both the port soil and adjacent portions of the Bay
vulnerable to runoff. While this will not lessen introduction from the cascading chute, it is
a large step in reducing contamination.
2. Storage facilities for the copper concentrate should be improved. The current
facility is a large hanger fully open on one end and loosely covered by strips of rubber at
the other end. The rubber strips are spaced out and do not reach the ground acting as a
poor attempt at blocking the wind. The storage shed should include doors on both ends
that can remain closed when the copper concentrate is not being moved. This will prevent
potential copper concentrate discharge from the shed, protecting the surrounding air and
soil.

31
3. Due to the amount of coal spilled during unloading of coal ships, a new transfer
method is recommended. Although the coal has low sulfur content, spills still introduce
sulfur into the environment. The current method uses a conventional excavator to simply
scoop the coal from the ship into the waiting receptacle on the shore. Coal is spilled into
the Bay, requiring dredging every few years, and onto the wharf, requiring cleanup after
every shipment. An alternative method that can be used is the screw conveyor. A tube
with a rotating blade is inserted into the coal storage, which propels the coal (or any dry
material) out of the ship from the rotating motion. This mechanism minimizes spillage,
which would minimize sulfur introduction to the environment and reduce or eliminate the
need for cleanup and dredging.
B. Port Z
It must be noted that recommendations for Port Z are aimed at Corporation X and
not at the Port Authority. Any changes made would be to improve the Corporation’s
impact at the Port as the company seeks best practices.
1. The monitoring frequency at Port Z should be increased. Currently, water
quality (nutrient levels) are checked every two years, sediment every three years, and flora
and fauna on an irregular schedule. Air monitoring is the only element measured at a high
frequency. Frequent monitoring is imperative because it allows the port to know almost
immediately if operations have negatively affected the environment. If the problem is
identified quickly it can be resolved efficiently, hopefully with no permanent damage to
the environment.
For Corporation X to achieve best practice at both ports, Port Z ’s monitoring
schedule should match the schedule employed by Port Y. This would include increasing
32
water quality and sediment monitoring to quarterly tests and checking flora and fauna
twice a year. Because Corporation X is primarily concerned with their impact at Berth 8, it
would be appropriate to set monitoring stations within a certain proximity to this berth.
Corporation X would then be aware of the company’s impacts on the Inner Harbour and
could address any environmental impacts appropriately.
2. Additionally, baseline monitoring should occur before operations begin at Port
Z. Corporation X should monitor Berth 8 for copper levels in the water and sediment in
order to have baseline readings as a comparison point for testing while copper concentrate
is being shipped. Surveying flora and fauna around Berth 8 will demonstrate whether
future activities impact biodiversity.
3. Corporation X should encourage Port Z to improve their dredging practices.
Currently, little consideration is given to the potential for contamination of the marine
environment. Dredge spoil is dumped off shore irrelevant of any contaminates in the spoil,
creating the potential to harm the environment. With the possibility of copper concentrate
being introduced into the environment from the Corporation’s activities at Berth 8,
Corporation X should be concerned with where that sediment may end up. Before
dumping, the dredge spoil should be evaluated for contaminates, the results then dictating
the best course of action for disposal. If the spoil has hazardous materials present, it may
be more favorable to clean the spoil before dumping and move any contaminated material
to a hazardous waste dump.
4. Although Corporation X has expressed interest in placing reefballs in more
locations, it is not recommended that they be used at Port Z. Reefballs are typically placed
in close proximity to natural reefs, which do not exist in the local Bay. With little wildlife

33
at the Port, the reefballs would likely never develop and provide no benefit to the marine
environment.
C. Ports Port Y and Port Z
Both Ports Port Y and Port Z should develop a Clean Air Program, as encouraged
by the IAPH. This Program would be specifically tailored to each port. As Corporation X
has been interested in climate change and emissions generated from mine operations, port
emission reductions would provide an additional sector for improvement. The IAPH
outlines a four-step process to develop the Program: plan, do, check, act. After
considering what air pollution measures are in place, the port identifies objectives and
targets for the Program. The emissions to be reduced are determined and a benchmark
goal is set. The goals set the emission reductions, activities of focus, and a timeline (IAPH
2007).
The port then must decide what technical activities will be undertaken to reduce
emissions and pollution. To help determine what approach to take, existing equipment
must be evaluated with a focus on determining which older equipment should be replaced
or repowered. Those operations creating the most emissions should be identified during
the evaluation of equipment performance. Strategies may apply to harbor crafts, cargo
handling equipment, or other aspects of the port operations that create emissions. Harbor
craft improvements include repowering harbor craft engines with cleaner engines, using
cleaner fuels with low sulfur content, implementing emission control technologies, and
providing shore power hookup or using hybridization. Cargo handling equipment
strategies include replacing old equipment with new machinery meeting higher engine

34
standards, using cleaner fuels with low sulfur content, and retrofitting the equipment with
emission control technologies (IAPH 2007).
After the strategies have been set, a baseline will help track progress. Setting
performance targets determines emissions reductions and the timeline for the reductions.
Finally, a tracking system is set to monitor the progress. Evaluation of results will
determine the progress made and identify areas where improvements are needed (IAPH
2007).
V. Conclusions
Port Y and Port Z both demonstrate strong environmental practices in port
activities. Many aspects of operations at both ports exhibit best port management
practices. Port Y’s strength lies in its monitoring program while Port Z demonstrates top
copper concentrate handling. There is room for improvement in Indonesia and Australia
and each port can learn from the other. By following the recommendations made in this
report each port can improve their practices and continue on the track to becoming global
leaders in environmental port management. Port activities are one more aspect of mining
operations in which Corporation X can demonstrate leadership in environmental practices.

35
References AAPA. 1998. Port Environmental Management Practices. Environmental Management
Handbook. BPA. 2006. Port Authority Information Guide. DOTARS. 2007. Prevention of Pollution from Ships. Government of Western Australia.
Available online: http://www.infrastructure.gov.au/maritime/environment/pollution.aspx. Accessed 3 December 2007.
GBWMP. 2008. The Problem. Available online: http://globallast.imo.org/index.asp?page=problem.htm&menu=true. Accessed 17 April 2008.
Gupta, AK et al. 2005. Environmental management plan for port and harbour projects. Clean Techn Environ Policy.
IAPH. 2007. Tool Box for Port Clean Air Programs. Improving air quality while promoting business development.
IFC. 2007a. Environmental, Health, and Safety Guidelines for Ports, Harbors, and Terminals. World Bank Group.
IFC. 2007b. Environmental Health, and Safety Guidelines. Noise Management. World Bank Group.
IMO. 2004a. International Convention for the Control and Management of Ships’ Ballast Water and Sediments. Available online: http://www.imo.org/Conventions/mainframe.asp?topic_id=867. Accessed 6 November 2007.
IMO. 2004b. International Convention for the Control and Management of Ships’ Ballast Water and Sediments. Global Ballast Water Management Programme. Available online: http://globallast.imo.org. Accessed 6 November 2007.
IMO. 2005. London Convention. Available online: http://www.imo.org/includes/blastDataOnly.asp/data_id%3D16889/LC-brochure.pdf. Accessed 6 November 2007.
IMO. 2006a. International Convention for the Prevention of Pollution from Ships, 1973, as modified by the Protocol of 1978 relating thereto (MARPOL 73/78). Available online: http://www.imo.org/Conventions/contents.asp?doc_id=678&topic_id=258. Accessed 6 November 2007.
IMO. 2006b. Port Reception Facilities. Available online: http://www.imo.org/Newsroom/mainframe.asp?topic_id=1407. Accessed 12 March 2008.
IMO. 2007a. Convention on the Prevention of Marine Pollution by Dumping of Wastes and Other Matter. Available online: http://www.imo.org/Conventions/mainframe.asp?topic_id=258&doc_id=681. Accessed 6 November 2007.
IMO. 2007b. Responding to HNS Spills. Available online: http://www.imo.org/Newsroom/mainframe.asp?topic_id=1611. Accessed 12 March 2008.
PTNNT. 1996. Environmental Impact Assessment Main Report. The Mine Copper-Gold Project.

36
PTNNT. 2007. Environmental Management and Monitoring Implementation Report. 4th Quarter October – December 2006; Annual Report 2006; and Annual Plan 2007.

37
Photographs
Photo 1. Port Y
Photo 2. Copper concentrate in flotation process, Port Y
Photo 3. Dock for local residents, Port Y Photo 4. Berths 1 and 2, Port Z
38
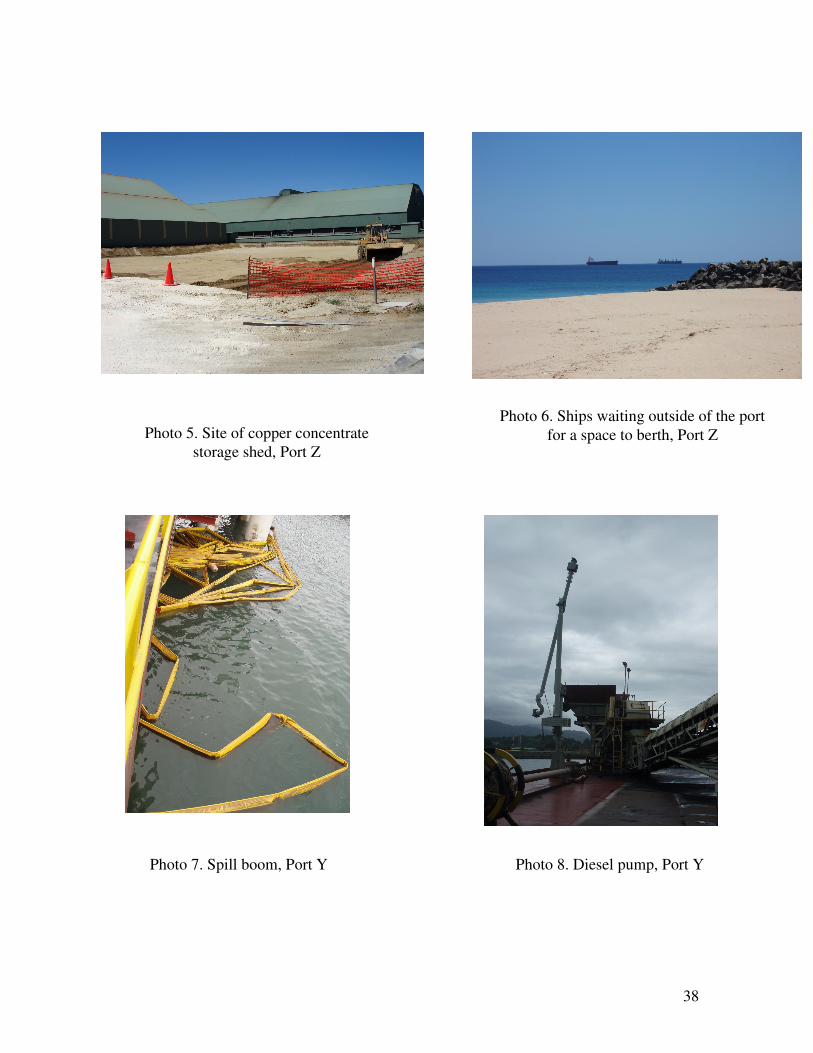
Photo 8. Diesel pump, Port Y
Photo 5. Site of copper concentrate storage shed, Port Z
Photo 6. Ships waiting outside of the port
for a space to berth, Port Z
Photo 7. Spill boom, Port Y

39
Photo 9. Coal chute with spilled coal, Port Y
Photo 10. Copper concentrate storage shed with rubber-strip
covered opening, Port Y
Photo 11. Copper concentrate conveyor, Port Y
Photo 12. Copper concentrate conveyor, Port Y

40
Photo 13. Cascading chute, Port Y Photo 14. Covered copper
concentrate conveyor, Port Z
Photo 15. Cascading chute, Port Z
Photo 16. Water outfall point from power plant, Port Y

41
Photo 18. Water monitoring marker, Port Y
Photo 19. Continuous air monitoring box, Port Z
Photo 17. Water outflow point, Port Z