Embed Size (px)
Citation preview

BEST’S RATING REPORT
Page 1 of 18 Printed September 16, 2021
BEST’S RATING REPORT BEST’S RATING REPORT
AM BEST
A Excellent
Financial Strength Rating
THE INDEPENDENT ORDER OF FORESTERS Domiciliary Address: 789 Don Mills Road, Toronto, Ontario M3C 1T9 Canada AMB #: 067409 NAIC #: N/A FEIN #: N/A Phone: 415-429-3000 Fax: 416-467-2526 Website: www.foresters.com
THE INDEPENDENT ORDER OF FORESTERS A Domiciliary Address: 789 Don Mills Road, Toronto, Ontario M3C 1T9 Canada AMB #: 060132 NAIC #: N/A AIIN #: AA-1560109 Phone: 416-429-3000 Fax: 416-467-2526 Website: www.foresters.com
Page 2 of 18 Printed September 16, 2021
BEST’S RATING REPORT
Best's Credit Rating Effective Date July 29, 2021
Analytical Contacts Frank Walko Financial Analyst [email protected] +1(908) 439-2200 Ext. 5072
Edward Kohlberg Director [email protected] +1(908) 439-2200 Ext. 5664
Information Best's Credit Rating Methodology
Guide to Best's Credit Ratings
Market Segment Outlooks
Financial Data Presented Financial data in this report: (i) includes data of affiliated entities that are not rating unit members where analytics benefit from inclusion; and/or (ii) excludes data of rating unit member entities if they operate in different segments or geographic areas than the Rating Unit generally. See list of companies for details of rating unit members and any such included and/or excluded entities. The financial data in this report reflects the most current data available to the Analytical Team at the time of the rating. Updates to the financial exhibits in this report are available here: Best's Financial Report.
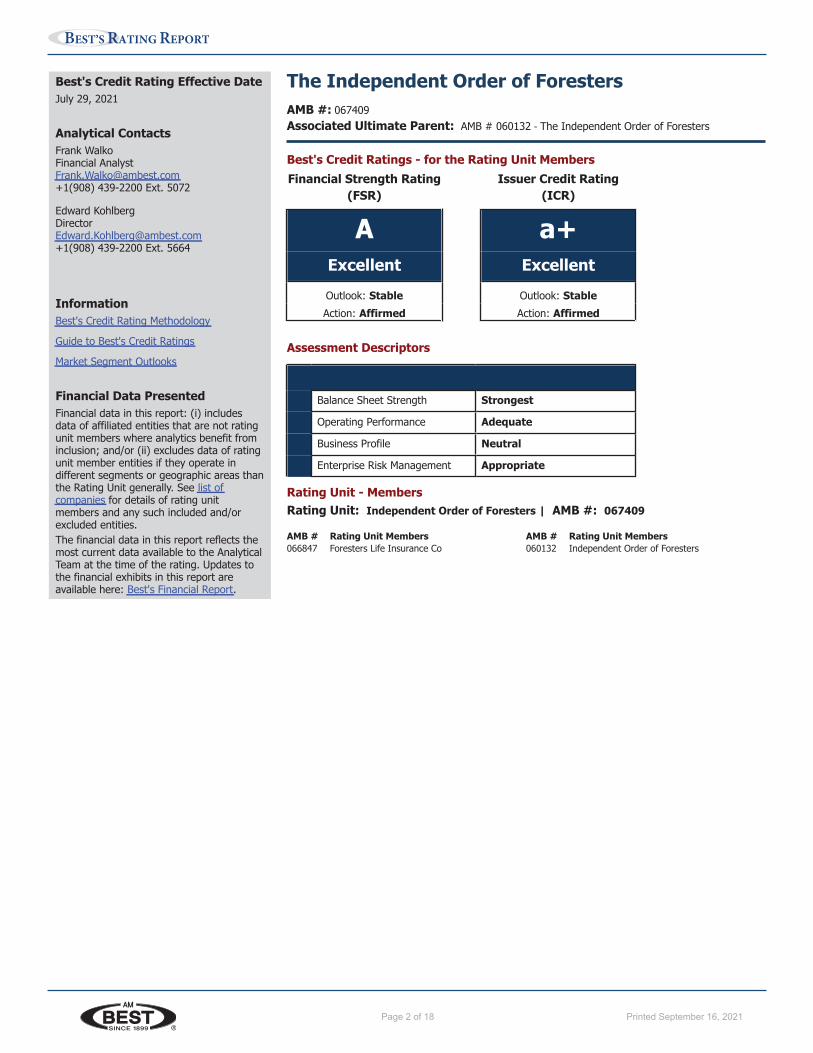
The Independent Order of Foresters AMB #: 067409 Associated Ultimate Parent: AMB # 060132 - The Independent Order of Foresters
Best's Credit Ratings - for the Rating Unit Members Financial Strength Rating Issuer Credit Rating
(FSR) (ICR)
A a+ Excellent Excellent Outlook: Stable Outlook: Stable Action: Affirmed Action: Affirmed
Assessment Descriptors
Balance Sheet Strength Strongest
Operating Performance Adequate
Business Profile Neutral
Enterprise Risk Management Appropriate
Rating Unit - Members Rating Unit: Independent Order of Foresters | AMB #: 067409
AMB # Rating Unit Members 066847 Foresters Life Insurance Co
AMB # Rating Unit Members 060132 Independent Order of Foresters
www.ambest.com Page 2Printed for Bcrs on August 10, 2021

Page 3 of 18 Printed September 16, 2021
BEST’S RATING REPORT
Rating Rationale
Balance Sheet Strength: Strongest • Strongest level of risk-adjusted capitalization as measured by Best's Capital Adequacy Ratio (BCAR). Capital is also significantly
higher than the minimum required capitalization standards across Canada, the United Kingdom and the United States. • Good quality of capital, with overall good credit quality of invested assets, manageable financial leverage and moderate use of
reinsurance. Also, Foresters Financial has demonstrated good financial flexibility with its ability to issue debt in 2020. • Strong liquidity ratios to meet cash needs in immediate and ongoing scenarios.
• Significant percentage of liabilities dependent on interest rates and/or equity markets, which has been reduced via the sale of Foresters Life Insurance and Annuity Company (FLIAC). Also offsetting is the relatively high number of provisions for adverse deviations (PFADs) backing up actuarial liabilities.
Operating Performance: Adequate • Independent Order of Foresters (Foresters Financial) has reported generally positive but fluctuating earnings in recent years. The
impact of the equity markets on fair value accounting adds a measure of volatility to earnings. • Diversified earnings profile by line of business and geographic regions.
• Foresters Financial has reported good premium growth trends in recent years. Premiums in 2020 experienced modest growth, as positive sales trends in North America were partially offset by a decline in economic activity related to the COVID-19 pandemic, particularly in the UK, and the sale of FLIAC.
Business Profile: Neutral • Diversified business profile in terms of product offerings, distribution and geographic reach.
• Foresters Financial has narrowed its focus to market life insurance to its members while disposing of business that it considers non-core.
• While Foresters Financial has prominent positions in its target markets, it is not among the market leaders.
• Sales by region show that most of the sales originate in the United States, with some premiums from Canada and a modest percentage from the United Kingdom.
Enterprise Risk Management: Appropriate • Foresters Financial has a well-developed risk management program, which includes an evaluation of proposed actions and their
impact on risk-adjusted capitalization. • Foresters Financial uses the Life Insurance Capital Adequacy Test (LICAT) as its main barometer of measuring enterprise risk,
and it incorporates non-quantitative assessments such as strategic risk, pension plan risk and asset management risk. • While Foresters Financial’s risk management capabilities are appropriate for its risk profile, it faces inherent challenges of
managing risk across three different countries, each of which have their own unique economic, financial, legislative and regulatory characteristics.
Outlook • The stable outlooks reflect the expectation that Foresters Financial will maintain a balance sheet assessment in the strongest
range over the intermediate term with adequate operating results contributing to surplus growth needed to support an expanding book of business.
Rating Drivers • Negative rating action may occur if the group's risk-adjusted capitalization declines significantly.
• Negative rating action may occur if there is a decline in operating performance.
AMB #: 067409 - Independent Order of Foresters
www.ambest.com Page 3Printed for Bcrs on August 10, 2021

Page 4 of 18 Printed September 16, 2021
BEST’S RATING REPORT
Key Financial Indicators Best's Capital Adequacy Ratio (BCAR) Scores (%) Confidence Level 95.0 99.0 99.5 99.6 BCAR Score 61.1 43.0 35.9 34.7 Source: Best's Capital Adequacy Ratio Model - L/H, Canada
Year End - December 31
Key Financial Indicators CAD (000) 2020 2019 2018 2017 2016 Assets: General Account 10,085,523 12,724,594 10,149,365 9,850,695 9,771,370 Segregated Funds 8,000,491 5,795,825 7,635,014 7,832,864 3,673,561
Total Assets 18,086,014 18,520,419 17,784,379 17,683,559 13,444,931 Liabilities: Actuarial Liabilities:
Non-Participating Life 747,102 706,131 903,976 836,065 887,179 Non-Participating Annuity 494,285 501,593 1,520,745 1,297,202 1,205,334 Non-Participating Accident & Sickness 29,057 22,434 25,729 26,362 25,034 Participating 4,931,010 4,345,097 3,962,617 3,885,538 3,753,034 Other 821,802 905,850 985,361 1,083,616 1,124,121
Other Contract Liabilities 370,004 340,572 363,072 353,969 332,831 Other Liabilities, including Segregated Funds 8,641,321 9,612,707 8,004,424 8,170,229 3,998,630
Total Liabilities 16,034,581 16,434,384 15,765,924 15,652,981 11,326,163 Net Income -1,231 92,749 -116,931 38,077 -75,332 Net Premiums 980,195 1,028,952 1,168,611 1,055,161 998,666 Net Investment Income 882,521 997,095 -129,618 541,657 466,846
Source: BestLink ® - Best's Financial Suite Local Currency: Canadian Dollar
Year End - December 31 Weighted
AverageKey Financial Ratios (%) 2020 2019 2018 2017 2016 Operating Return on Net Premiums -6.1 9.8 55.4 7.7 -5.7 13.6 Pre-Tax Investment Total Return 9.4 10.0 -1.8 6.2 5.5 6.1
Source: BestLink ® - Best's Financial Suite
Year End - December 31
Liquidity Analysis (%) 2020 2019 2018 2017 2016 Current Liquidity 108.4 73.1 105.7 106.6 108.5
Source: BestLink ® - Best's Financial Suite
Credit Analysis Balance Sheet Strength
Capitalization
The Independent Order of Foresters (Foresters Financial) risk-adjusted capitalization, as defined by the Best Capital Adequacy Ratio, is assessed as strongest and supportive of its insurance, business and investment risks. Foresters Financial’s risk-adjusted capitalization measures favorably across three countries with different measures: Life Insurance Capital Adequacy Test in Canada, Risk-Based Capital in the US, and Solvency II in the UK. While Foresters Financial has less financial flexibility relative to a stock company, the group showed they can access the capital markets via a debt issuance in October, 2020.
Absolute capitalization is strong, and good liquidity capability which is monitored closely. Quality of capital is good, with organic earnings growth, manageable financial leverage and prudent use of reinsurance. Capital is also impacted by the impact of fair value accounting on assets and liabilities and exchange rate movements, which adds an element of volatility in capital.
AMB #: 067409 - Independent Order of Foresters
www.ambest.com Page 4Printed for Bcrs on August 10, 2021
Page 5 of 18 Printed September 16, 2021
BEST’S RATING REPORT
Balance Sheet Strength (Continued...)
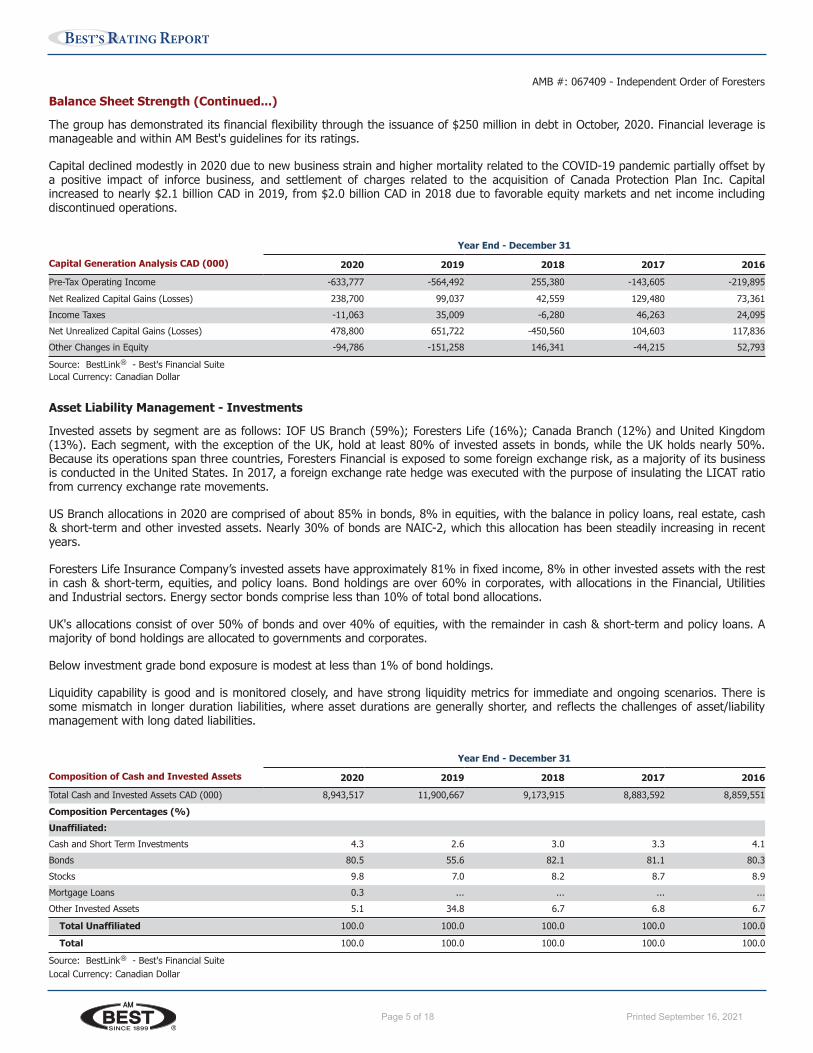
The group has demonstrated its financial flexibility through the issuance of $250 million in debt in October, 2020. Financial leverage is manageable and within AM Best's guidelines for its ratings.
Capital declined modestly in 2020 due to new business strain and higher mortality related to the COVID-19 pandemic partially offset by a positive impact of inforce business, and settlement of charges related to the acquisition of Canada Protection Plan Inc. Capital increased to nearly $2.1 billion CAD in 2019, from $2.0 billion CAD in 2018 due to favorable equity markets and net income including discontinued operations.
Year End - December 31
Capital Generation Analysis CAD (000) 2020 2019 2018 2017 2016 Pre-Tax Operating Income -633,777 -564,492 255,380 -143,605 -219,895 Net Realized Capital Gains (Losses) 238,700 99,037 42,559 129,480 73,361 Income Taxes -11,063 35,009 -6,280 46,263 24,095 Net Unrealized Capital Gains (Losses) 478,800 651,722 -450,560 104,603 117,836 Other Changes in Equity -94,786 -151,258 146,341 -44,215 52,793
Source: BestLink ® - Best's Financial Suite Local Currency: Canadian Dollar
Asset Liability Management - Investments
Invested assets by segment are as follows: IOF US Branch (59%); Foresters Life (16%); Canada Branch (12%) and United Kingdom (13%). Each segment, with the exception of the UK, hold at least 80% of invested assets in bonds, while the UK holds nearly 50%. Because its operations span three countries, Foresters Financial is exposed to some foreign exchange risk, as a majority of its business is conducted in the United States. In 2017, a foreign exchange rate hedge was executed with the purpose of insulating the LICAT ratio from currency exchange rate movements.
US Branch allocations in 2020 are comprised of about 85% in bonds, 8% in equities, with the balance in policy loans, real estate, cash & short-term and other invested assets. Nearly 30% of bonds are NAIC-2, which this allocation has been steadily increasing in recent years.
Foresters Life Insurance Company’s invested assets have approximately 81% in fixed income, 8% in other invested assets with the rest in cash & short-term, equities, and policy loans. Bond holdings are over 60% in corporates, with allocations in the Financial, Utilities and Industrial sectors. Energy sector bonds comprise less than 10% of total bond allocations.
UK's allocations consist of over 50% of bonds and over 40% of equities, with the remainder in cash & short-term and policy loans. A majority of bond holdings are allocated to governments and corporates.
Below investment grade bond exposure is modest at less than 1% of bond holdings.
Liquidity capability is good and is monitored closely, and have strong liquidity metrics for immediate and ongoing scenarios. There is some mismatch in longer duration liabilities, where asset durations are generally shorter, and reflects the challenges of asset/liability management with long dated liabilities.
Year End - December 31
Composition of Cash and Invested Assets 2020 2019 2018 2017 2016 Total Cash and Invested Assets CAD (000) 8,943,517 11,900,667 9,173,915 8,883,592 8,859,551 Composition Percentages (%) Unaffiliated: Cash and Short Term Investments 4.3 2.6 3.0 3.3 4.1 Bonds 80.5 55.6 82.1 81.1 80.3 Stocks 9.8 7.0 8.2 8.7 8.9 Mortgage Loans 0.3 ... ... ... ... Other Invested Assets 5.1 34.8 6.7 6.8 6.7
Total Unaffiliated 100.0 100.0 100.0 100.0 100.0
Total 100.0 100.0 100.0 100.0 100.0
Source: BestLink ® - Best's Financial Suite Local Currency: Canadian Dollar
AMB #: 067409 - Independent Order of Foresters
www.ambest.com Page 5Printed for Bcrs on August 10, 2021

Page 6 of 18 Printed September 16, 2021
BEST’S RATING REPORT
Balance Sheet Strength (Continued...)
Year End - December 31
Bonds - Distribution by Issuer 2020 2019 2018 2017 2016 Bonds CAD (000) 7,197,895 6,616,543 7,528,999 7,208,479 7,114,582 Government (%) 26.5 31.4 28.5 30.7 38.9 Municipal, Public Authority (%) 8.3 6.7 8.8 8.0 2.2 Corporate: Investment Grade (%) 64.4 61.6 61.8 60.2 57.3 Below Investment Grade (%) 0.9 0.4 0.9 1.1 1.6
Source: BestLink ® - Best's Financial Suite
Reserve Adequacy
Reserves for Foresters Financial are adequately set, as determined by cash flow testing in the US and LICAT and DCAT capital submissions for Canada. Reserves are also supported by provision for adverse deviations which are nearly twenty percent of total reserves.
Foresters Financial put up additional mortality reserves related to the COVID-19 pandemic and has released reserves as actual mortality was less than expected mortality.
Operating Performance
Foresters Financial’s earnings profile is evolving as the group continues to focus on its core ordinary life insurance and retirement business. The group's exposure to variable business, which is highly correlated to equity market movements, declined significantly as a result of the sale of FLIAC in July, 2020.
Total Comprehensive Income/(Loss) (TCI) for year 2020 and 2019 are ($35) million CAD and $68 million CAD, largely due to the market impacts on continuing operations due to a decline in interest rates in March, 2020, higher mortality due to the COVID-19 pandemic, a stronger Canadian dollar partially offset by strong equity markets. The North American insurance segment showed good earnings, primarily due to sales in the US Branch. UK earnings were higher due to less new business strain despite lower sales.
TCI for year 2019 and 2018 is $68 million CAD and ($10) Million CAD driven by financial market performance, foreign exchange movements, and less insurance and asset sales from FLIAC. If the impact of divestitures and discontinued operations is excluded, TCI would be significantly higher. The North American Insurance segment reported strong earnings, primarily due to strong market performance. New business strain was impacted by lower sales of products with higher negative reserves and lower fixed acquisition expense. Partially offsetting factors are mortality and experience gains. UK net income increased due to favorable equity markets, resulting in higher fee revenue, surplus returns and lower operating expenses.
Foresters Financial’s results are more volatile due to the market impacts of fair value accounting on assets and liabilities. Also, a significant percentage of business is conducted in U.S. dollars, which is subject to foreign currency fluctuations to the Canadian dollar. This is partially mitigated by the use of a foreign currency hedge.
Enterprise investment income/(loss) for 2020 and 2019 is $883 million CAD and $997 million CAD, driven by recovering equity markets, which had initially declined sharply at the onset of the COVID-19 pandemic.
Premium growth was relatively flat in 2020 due in part to the sale of FLIAC and lower sales in the UK as their salesforce was furloughed throughout much of the year. US Branch sales were good in 2020 as their products sold are simplified issue requiring less interaction. 2020 compound annual growth rate in net premiums was 2%. Foresters Life Insurance in Canada reported higher premiums driven by Canada Protection Plan sales. Ordinary life sales in the IOF-US Branch have increased by 14% from 2019, driven by higher Plan Right final expense sales and reported more normalized sales from its distribution.
AMB #: 067409 - Independent Order of Foresters
www.ambest.com Page 6Printed for Bcrs on August 10, 2021
Page 7 of 18 Printed September 16, 2021
BEST’S RATING REPORT
Operating Performance (Continued...)
Year End - December 31
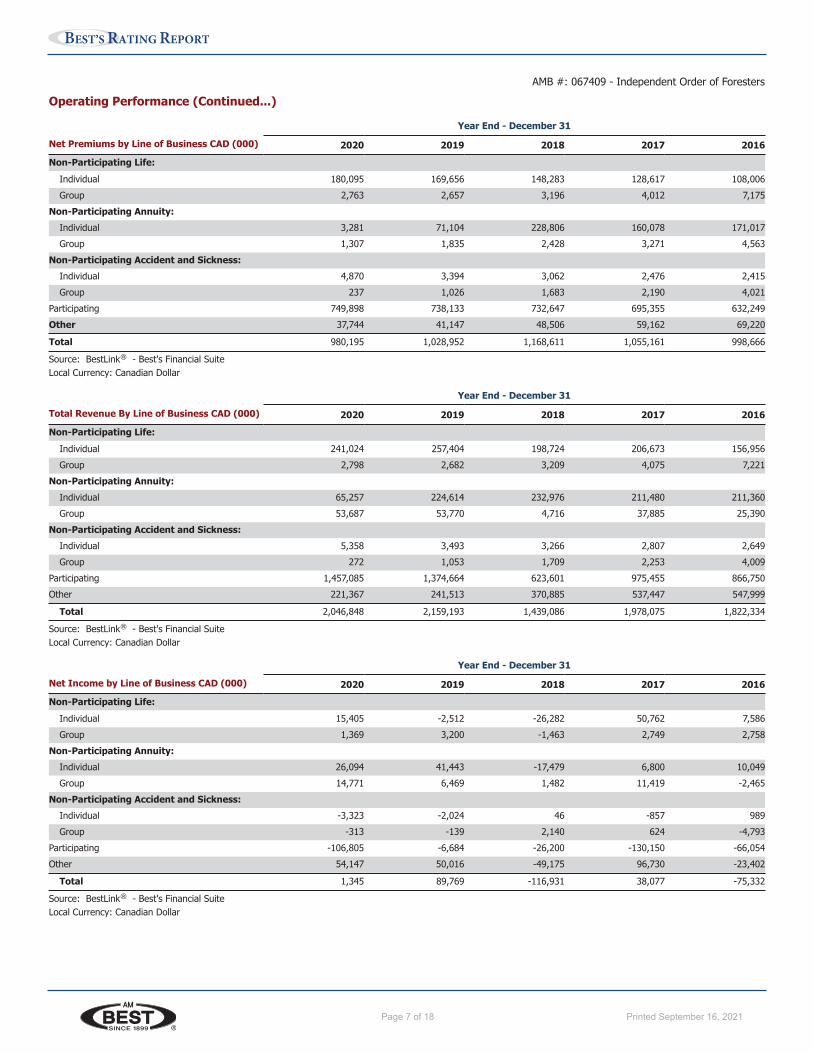
Net Premiums by Line of Business CAD (000) 2020 2019 2018 2017 2016 Non-Participating Life:
Individual 180,095 169,656 148,283 128,617 108,006 Group 2,763 2,657 3,196 4,012 7,175
Non-Participating Annuity: Individual 3,281 71,104 228,806 160,078 171,017 Group 1,307 1,835 2,428 3,271 4,563
Non-Participating Accident and Sickness: Individual 4,870 3,394 3,062 2,476 2,415 Group 237 1,026 1,683 2,190 4,021
Participating 749,898 738,133 732,647 695,355 632,249 Other 37,744 41,147 48,506 59,162 69,220
Total 980,195 1,028,952 1,168,611 1,055,161 998,666
Source: BestLink ® - Best's Financial Suite Local Currency: Canadian Dollar
Year End - December 31
Total Revenue By Line of Business CAD (000) 2020 2019 2018 2017 2016 Non-Participating Life:
Individual 241,024 257,404 198,724 206,673 156,956 Group 2,798 2,682 3,209 4,075 7,221
Non-Participating Annuity: Individual 65,257 224,614 232,976 211,480 211,360 Group 53,687 53,770 4,716 37,885 25,390
Non-Participating Accident and Sickness: Individual 5,358 3,493 3,266 2,807 2,649 Group 272 1,053 1,709 2,253 4,009
Participating 1,457,085 1,374,664 623,601 975,455 866,750 Other 221,367 241,513 370,885 537,447 547,999
Total 2,046,848 2,159,193 1,439,086 1,978,075 1,822,334
Source: BestLink ® - Best's Financial Suite Local Currency: Canadian Dollar
Year End - December 31
Net Income by Line of Business CAD (000) 2020 2019 2018 2017 2016 Non-Participating Life:
Individual 15,405 -2,512 -26,282 50,762 7,586 Group 1,369 3,200 -1,463 2,749 2,758
Non-Participating Annuity: Individual 26,094 41,443 -17,479 6,800 10,049 Group 14,771 6,469 1,482 11,419 -2,465
Non-Participating Accident and Sickness: Individual -3,323 -2,024 46 -857 989 Group -313 -139 2,140 624 -4,793
Participating -106,805 -6,684 -26,200 -130,150 -66,054 Other 54,147 50,016 -49,175 96,730 -23,402
Total 1,345 89,769 -116,931 38,077 -75,332
Source: BestLink ® - Best's Financial Suite Local Currency: Canadian Dollar
AMB #: 067409 - Independent Order of Foresters
www.ambest.com Page 7Printed for Bcrs on August 10, 2021
Page 8 of 18 Printed September 16, 2021
BEST’S RATING REPORT
Business Profile
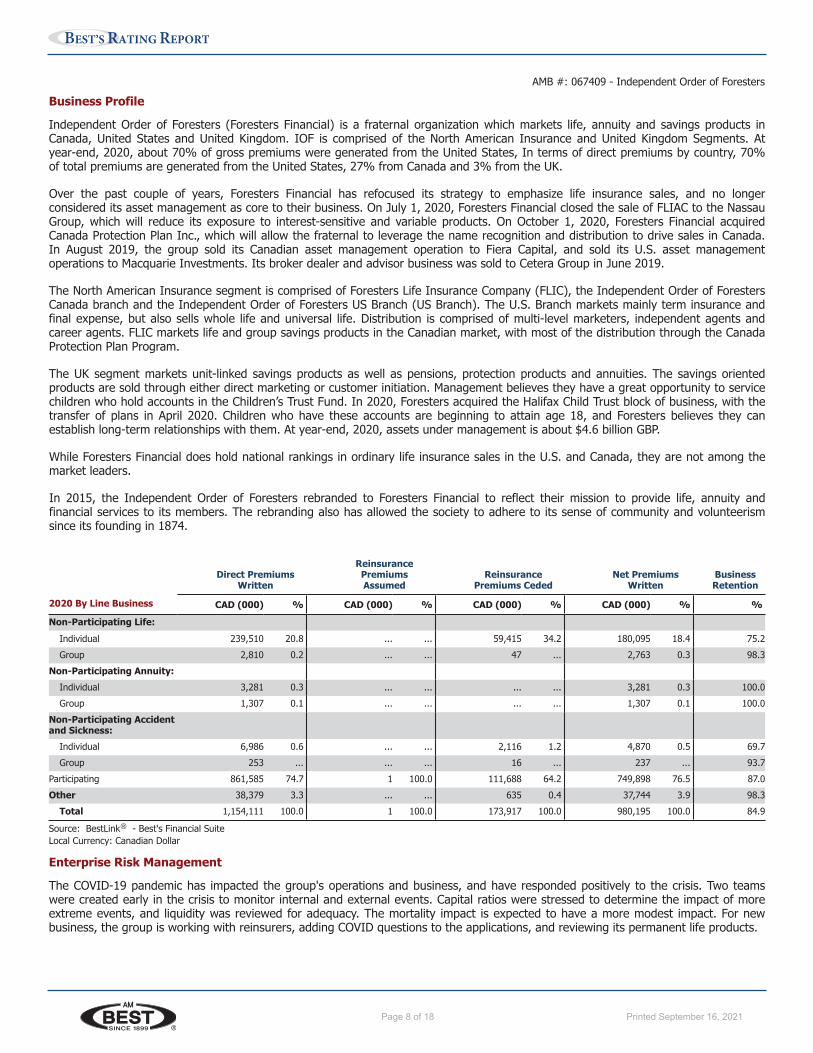
Independent Order of Foresters (Foresters Financial) is a fraternal organization which markets life, annuity and savings products in Canada, United States and United Kingdom. IOF is comprised of the North American Insurance and United Kingdom Segments. At year-end, 2020, about 70% of gross premiums were generated from the United States, In terms of direct premiums by country, 70% of total premiums are generated from the United States, 27% from Canada and 3% from the UK.
Over the past couple of years, Foresters Financial has refocused its strategy to emphasize life insurance sales, and no longer considered its asset management as core to their business. On July 1, 2020, Foresters Financial closed the sale of FLIAC to the Nassau Group, which will reduce its exposure to interest-sensitive and variable products. On October 1, 2020, Foresters Financial acquired Canada Protection Plan Inc., which will allow the fraternal to leverage the name recognition and distribution to drive sales in Canada. In August 2019, the group sold its Canadian asset management operation to Fiera Capital, and sold its U.S. asset management operations to Macquarie Investments. Its broker dealer and advisor business was sold to Cetera Group in June 2019.
The North American Insurance segment is comprised of Foresters Life Insurance Company (FLIC), the Independent Order of Foresters Canada branch and the Independent Order of Foresters US Branch (US Branch). The U.S. Branch markets mainly term insurance and final expense, but also sells whole life and universal life. Distribution is comprised of multi-level marketers, independent agents and career agents. FLIC markets life and group savings products in the Canadian market, with most of the distribution through the Canada Protection Plan Program.
The UK segment markets unit-linked savings products as well as pensions, protection products and annuities. The savings oriented products are sold through either direct marketing or customer initiation. Management believes they have a great opportunity to service children who hold accounts in the Children’s Trust Fund. In 2020, Foresters acquired the Halifax Child Trust block of business, with the transfer of plans in April 2020. Children who have these accounts are beginning to attain age 18, and Foresters believes they can establish long-term relationships with them. At year-end, 2020, assets under management is about $4.6 billion GBP.
While Foresters Financial does hold national rankings in ordinary life insurance sales in the U.S. and Canada, they are not among the market leaders.
In 2015, the Independent Order of Foresters rebranded to Foresters Financial to reflect their mission to provide life, annuity and financial services to its members. The rebranding also has allowed the society to adhere to its sense of community and volunteerism since its founding in 1874.
Direct Premiums Written
Reinsurance Premiums Assumed
Reinsurance Premiums Ceded
Net Premiums Written
Business Retention
2020 By Line Business CAD (000) % CAD (000) % CAD (000) % CAD (000) % % Non-Participating Life:
Individual 239,510 20.8 ... ... 59,415 34.2 180,095 18.4 75.2 Group 2,810 0.2 ... ... 47 ... 2,763 0.3 98.3
Non-Participating Annuity: Individual 3,281 0.3 ... ... ... ... 3,281 0.3 100.0 Group 1,307 0.1 ... ... ... ... 1,307 0.1 100.0
Non-Participating Accident and Sickness:
Individual 6,986 0.6 ... ... 2,116 1.2 4,870 0.5 69.7 Group 253 ... ... ... 16 ... 237 ... 93.7
Participating 861,585 74.7 1 100.0 111,688 64.2 749,898 76.5 87.0 Other 38,379 3.3 ... ... 635 0.4 37,744 3.9 98.3
Total 1,154,111 100.0 1 100.0 173,917 100.0 980,195 100.0 84.9
Source: BestLink ® - Best's Financial Suite Local Currency: Canadian Dollar
Enterprise Risk Management
The COVID-19 pandemic has impacted the group's operations and business, and have responded positively to the crisis. Two teams were created early in the crisis to monitor internal and external events. Capital ratios were stressed to determine the impact of more extreme events, and liquidity was reviewed for adequacy. The mortality impact is expected to have a more modest impact. For new business, the group is working with reinsurers, adding COVID questions to the applications, and reviewing its permanent life products.
AMB #: 067409 - Independent Order of Foresters
www.ambest.com Page 8Printed for Bcrs on August 10, 2021
Page 9 of 18 Printed September 16, 2021
BEST’S RATING REPORT
Enterprise Risk Management (Continued...)
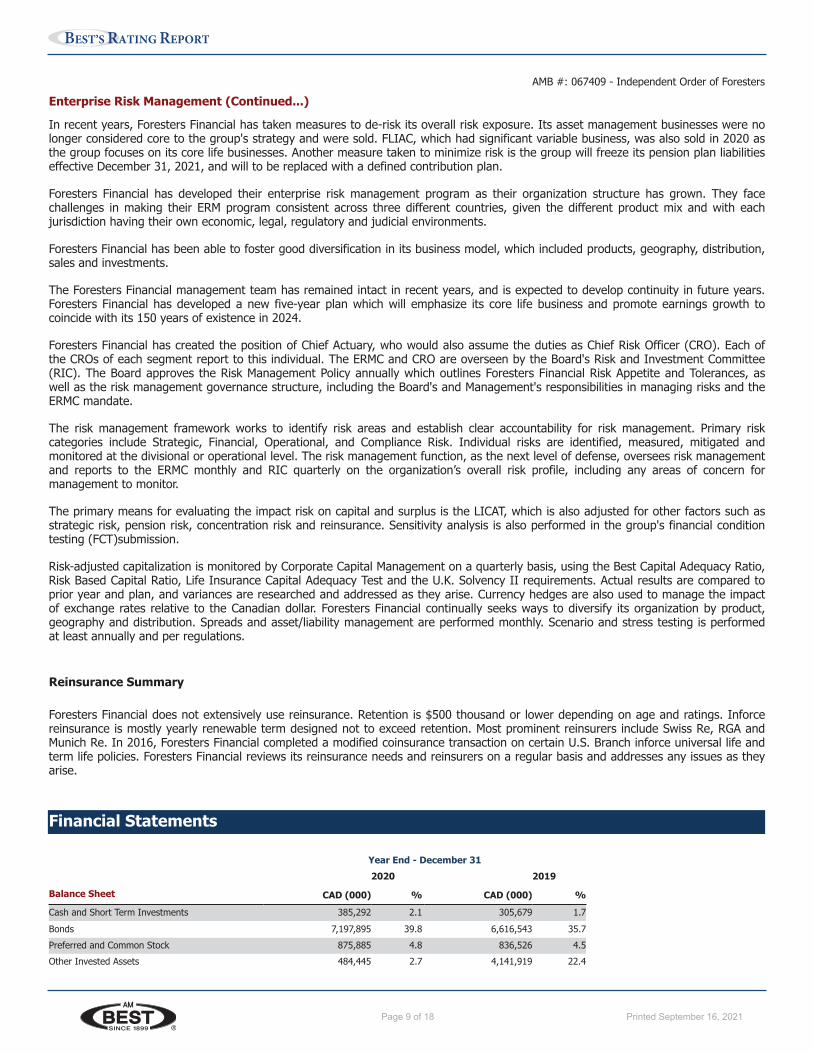
In recent years, Foresters Financial has taken measures to de-risk its overall risk exposure. Its asset management businesses were no longer considered core to the group's strategy and were sold. FLIAC, which had significant variable business, was also sold in 2020 as the group focuses on its core life businesses. Another measure taken to minimize risk is the group will freeze its pension plan liabilities effective December 31, 2021, and will to be replaced with a defined contribution plan.
Foresters Financial has developed their enterprise risk management program as their organization structure has grown. They face challenges in making their ERM program consistent across three different countries, given the different product mix and with each jurisdiction having their own economic, legal, regulatory and judicial environments.
Foresters Financial has been able to foster good diversification in its business model, which included products, geography, distribution, sales and investments.
The Foresters Financial management team has remained intact in recent years, and is expected to develop continuity in future years. Foresters Financial has developed a new five-year plan which will emphasize its core life business and promote earnings growth to coincide with its 150 years of existence in 2024.
Foresters Financial has created the position of Chief Actuary, who would also assume the duties as Chief Risk Officer (CRO). Each of the CROs of each segment report to this individual. The ERMC and CRO are overseen by the Board's Risk and Investment Committee (RIC). The Board approves the Risk Management Policy annually which outlines Foresters Financial Risk Appetite and Tolerances, as well as the risk management governance structure, including the Board's and Management's responsibilities in managing risks and the ERMC mandate.
The risk management framework works to identify risk areas and establish clear accountability for risk management. Primary risk categories include Strategic, Financial, Operational, and Compliance Risk. Individual risks are identified, measured, mitigated and monitored at the divisional or operational level. The risk management function, as the next level of defense, oversees risk management and reports to the ERMC monthly and RIC quarterly on the organization’s overall risk profile, including any areas of concern for management to monitor.
The primary means for evaluating the impact risk on capital and surplus is the LICAT, which is also adjusted for other factors such as strategic risk, pension risk, concentration risk and reinsurance. Sensitivity analysis is also performed in the group's financial condition testing (FCT)submission.
Risk-adjusted capitalization is monitored by Corporate Capital Management on a quarterly basis, using the Best Capital Adequacy Ratio, Risk Based Capital Ratio, Life Insurance Capital Adequacy Test and the U.K. Solvency II requirements. Actual results are compared to prior year and plan, and variances are researched and addressed as they arise. Currency hedges are also used to manage the impact of exchange rates relative to the Canadian dollar. Foresters Financial continually seeks ways to diversify its organization by product, geography and distribution. Spreads and asset/liability management are performed monthly. Scenario and stress testing is performed at least annually and per regulations.
Reinsurance Summary
Foresters Financial does not extensively use reinsurance. Retention is $500 thousand or lower depending on age and ratings. Inforce reinsurance is mostly yearly renewable term designed not to exceed retention. Most prominent reinsurers include Swiss Re, RGA and Munich Re. In 2016, Foresters Financial completed a modified coinsurance transaction on certain U.S. Branch inforce universal life and term life policies. Foresters Financial reviews its reinsurance needs and reinsurers on a regular basis and addresses any issues as they arise.
Financial Statements
Year End - December 31 2020 2019
Balance Sheet CAD (000) % CAD (000) % Cash and Short Term Investments 385,292 2.1 305,679 1.7 Bonds 7,197,895 39.8 6,616,543 35.7 Preferred and Common Stock 875,885 4.8 836,526 4.5 Other Invested Assets 484,445 2.7 4,141,919 22.4
AMB #: 067409 - Independent Order of Foresters
www.ambest.com Page 9Printed for Bcrs on August 10, 2021

Page 10 of 18 Printed September 16, 2021
BEST’S RATING REPORT
Year End - December 31 2020 2019
Balance Sheet CAD (000) % CAD (000) % Total Cash and Invested Assets 8,943,517 49.4 11,900,667 64.3
Accounts Receivable 50,230 0.3 54,847 0.3 Reinsurance Recoverables 655,765 3.6 501,767 2.7 Goodwill and Other Intangible Assets 205,692 1.1 46,763 0.3 Other Assets 230,319 1.3 220,550 1.2
Total General Account Assets 10,085,523 55.8 12,724,594 68.7 Segregated Funds Assets 8,000,491 44.2 5,795,825 31.3
Total Assets 18,086,014 100.0 18,520,419 100.0 Gross Actuarial Liabilities 7,023,256 38.8 6,481,105 35.0 Other Contract Liabilities 370,004 2.0 340,572 1.8 Other Liabilities 640,830 3.5 3,816,882 20.6
Total General Account Liabilities 8,034,090 44.4 10,638,559 57.4 Segregated Funds Liabilities 8,000,491 44.2 5,795,825 31.3
Total Liabilities 16,034,581 88.7 16,434,384 88.7 Other Capital and Equity 2,051,433 11.3 2,086,035 11.3
Total Liabilities and Equity 18,086,014 100.0 18,520,419 100.0
Source: BestLink ® - Best's Financial Suite Local Currency: Canadian Dollar
Year End - December 31
Income Statement CAD (000) 2020 2019
Net Premiums Earned 980,195 1,028,952 Net Investment Income 882,521 997,095 Other Revenue 184,132 133,146
Total Revenue 2,046,848 2,159,193 Net Policy and Contract Benefits 881,341 856,768 Net Changes to Actuarial and Contract Liabilities 608,812 637,334 Commissions 217,696 233,318 General and Other Expenses 350,451 315,794 Net Transfers to (from) Segregated Funds -1,734 -8,799
Total Benefits and Expenses 2,056,566 2,034,415 Pre-Tax Income -9,718 124,778 Income Taxes Incurred -11,063 35,009
Income before Attribution to Participating Policyholders and Other Funds
-1,231 92,749
Net Income -1,231 92,749
Source: BestLink ® - Best's Financial Suite Local Currency: Canadian Dollar
AMB #: 067409 - Independent Order of Foresters
www.ambest.com Page 10Printed for Bcrs on August 10, 2021

Page 11 of 18 Printed September 16, 2021
BEST’S RATING REPORT
Last Update September 15, 2021
Identifiers AMB #: 067409
Contact Information Domiciliary Address: 789 Don Mills Road, Toronto, Ontario M3C 1T9 Canada
Web: www.foresters.com Phone: 415-429-3000 Fax: 416-467-2526
Financial Data Presented The financial data in this report reflects the most current data available at the time the report was printed.
The Independent Order of Foresters
Operations
Domiciled: Ontario, Canada
Licensed: (Current since 10/07/2014). The company is licensed in all provinces and territories.
Business Type: Life, Annuity, and Accident Organization Type: Fraternal Marketing Type: Career Agent
Best's Credit Ratings Rating Relationship AM Best Rating Unit: 067409 - Independent Order of Foresters
Refer to the Best’s Credit Report for AMB# 067409 - The Independent Order of Foresters for details regarding the rating rationale, credit analysis, and financial exhibits available at the time the credit analysis was performed.
Best's Credit Ratings
AMB# Rating Unit Members Financial Strength Rating
Long-Term Issuer Credit Rating
066847 Foresters Life Insurance Co A a+ 060132 Independent Order of Foresters A a+
Corporate Structure Associated Ultimate Parent: AMB # 060132 - The Independent Order of Foresters
Based on AM Best's analysis, AMB# 060132 The Independent Order of Foresters is the AMB Associated Ultimate Parent and identifies the topmost entity of the corporate structure. Access in BestLink this company’s current Corporate Structure.
Management Officers
President and CEO: James R. Boyle CFO: Alvin Sharma (Global) President: Matt M. Berman (Foresters US) President: Henry Auyeung (Foresters Canadian Division) CEO: Latinka Pilipovic (UK (Interim)) Chief Human Resources Officer: Marcia Mendes-d'Abreu (Global) COO: Louis Gagnon SVP and Chief Information Officer: Mehul Kapadia (Global) Chief Marketing Officer: David Longfritz (Global) Chief Officer: Nicole Gourley (Membership)
www.ambest.com Page 11Printed for Bcrs on September 15, 2021

Page 12 of 18 Printed September 16, 2021
BEST’S RATING REPORT
Officers (Continued...)
SVP: Pat Colavita Vice President: J. Stephen McDonald Chief Risk Officer and Chief Actuary: Gaurav Upadhya Corporate Secretary, Chief Compliance Officer and Chief Legal Officer: Rene Zanin (Global, CPO, CAML) Vice President and Chief Investment Officer: Clark D. Wagner
Directors
Daniel J. Fortin (Chair) Katherine A. Bardswick Sonia A. Baxendale James R. Boyle Linda A. Davis Watters Michael C. Edge Shelly A. Herman Richard P. Hennick Michael Lombardi Janice M. Madon Gino A. Scapillati Michael P. Stramaglia Wendy A. Watson Robert W. Wight Cynthia L. Worley
AMB #: 067409 - Independent Order of Foresters
www.ambest.com Page 12Printed for Bcrs on September 15, 2021
Page 13 of 18 Printed September 16, 2021
BEST’S RATING REPORT
Last Update September 15, 2021
Identifiers AMB #: 060132 AIIN #: AA-1560109 LEI #: 54930076M746H2DBTP84
Contact Information Domiciliary Address: 789 Don Mills Road, Toronto, Ontario M3C 1T9 Canada
Web: www.foresters.com Phone: 416-429-3000 Fax: 416-467-2526
Financial Data Presented The financial data in this report reflects the most current data available at the time the report was printed.
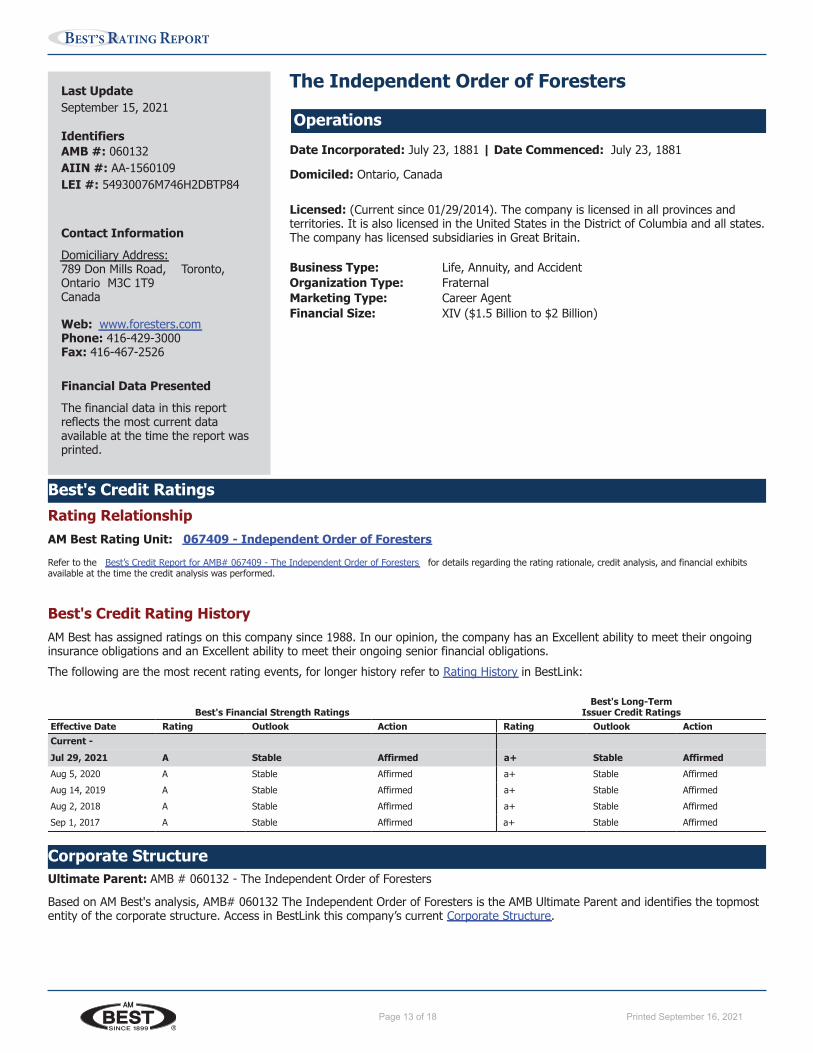
The Independent Order of Foresters
Operations Date Incorporated: July 23, 1881 | Date Commenced: July 23, 1881
Domiciled: Ontario, Canada
Licensed: (Current since 01/29/2014). The company is licensed in all provinces and territories. It is also licensed in the United States in the District of Columbia and all states. The company has licensed subsidiaries in Great Britain.
Business Type: Life, Annuity, and Accident Organization Type: Fraternal Marketing Type: Career Agent Financial Size: XIV ($1.5 Billion to $2 Billion)
Best's Credit Ratings Rating Relationship AM Best Rating Unit: 067409 - Independent Order of Foresters
Refer to the Best’s Credit Report for AMB# 067409 - The Independent Order of Foresters for details regarding the rating rationale, credit analysis, and financial exhibits available at the time the credit analysis was performed.
Best's Credit Rating History AM Best has assigned ratings on this company since 1988. In our opinion, the company has an Excellent ability to meet their ongoing insurance obligations and an Excellent ability to meet their ongoing senior financial obligations. The following are the most recent rating events, for longer history refer to Rating History in BestLink:
Best's Financial Best's Financial Strength Ratings
Best's Long-Term Issuer Credit Ratings
Effective Date Rating Outlook Action Rating Outlook Action Current -Jul 29, 2021 A Stable Affirmed a+ Stable Affirmed Aug 5, 2020 A Stable Affirmed a+ Stable Affirmed Aug 14, 2019 A Stable Affirmed a+ Stable Affirmed Aug 2, 2018 A Stable Affirmed a+ Stable Affirmed Sep 1, 2017 A Stable Affirmed a+ Stable Affirmed
Corporate Structure Ultimate Parent: AMB # 060132 - The Independent Order of Foresters
Based on AM Best's analysis, AMB# 060132 The Independent Order of Foresters is the AMB Ultimate Parent and identifies the topmost entity of the corporate structure. Access in BestLink this company’s current Corporate Structure.
www.ambest.com Page 13Printed for Bcrs on September 15, 2021
Page 14 of 18 Printed September 16, 2021
BEST’S RATING REPORT
Overview
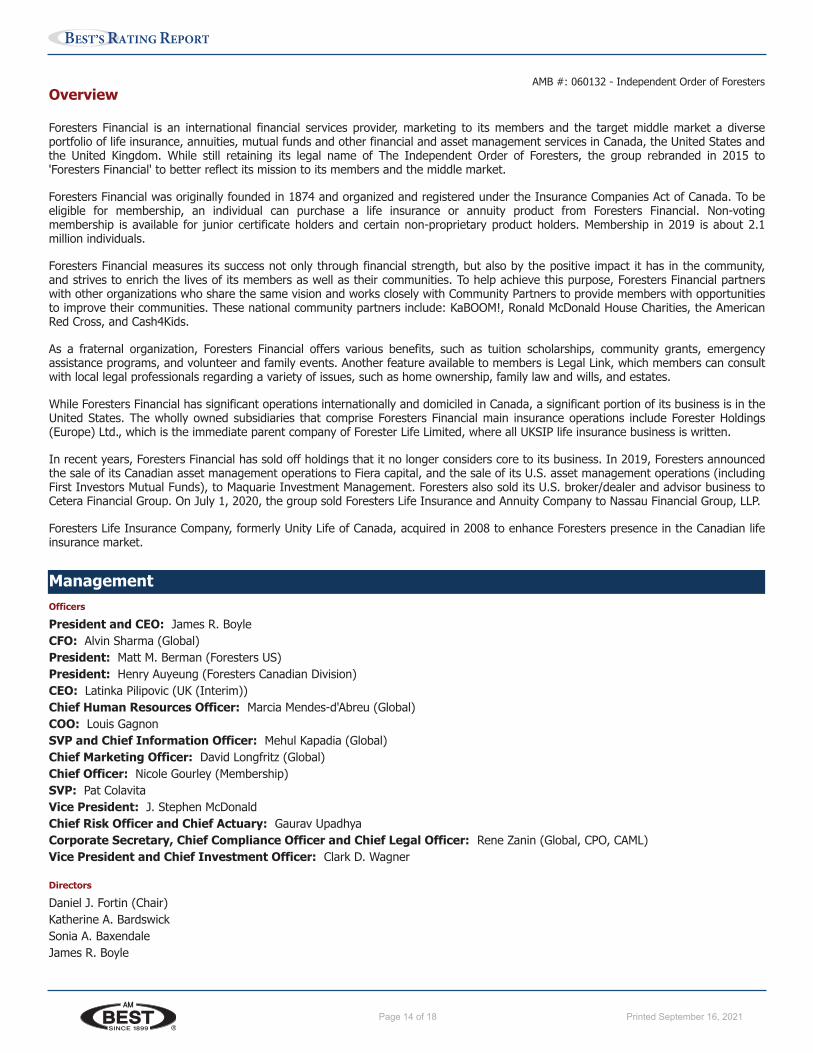
Foresters Financial is an international financial services provider, marketing to its members and the target middle market a diverse portfolio of life insurance, annuities, mutual funds and other financial and asset management services in Canada, the United States and the United Kingdom. While still retaining its legal name of The Independent Order of Foresters, the group rebranded in 2015 to 'Foresters Financial' to better reflect its mission to its members and the middle market.
Foresters Financial was originally founded in 1874 and organized and registered under the Insurance Companies Act of Canada. To be eligible for membership, an individual can purchase a life insurance or annuity product from Foresters Financial. Non-voting membership is available for junior certificate holders and certain non-proprietary product holders. Membership in 2019 is about 2.1 million individuals.
Foresters Financial measures its success not only through financial strength, but also by the positive impact it has in the community, and strives to enrich the lives of its members as well as their communities. To help achieve this purpose, Foresters Financial partners with other organizations who share the same vision and works closely with Community Partners to provide members with opportunities to improve their communities. These national community partners include: KaBOOM!, Ronald McDonald House Charities, the American Red Cross, and Cash4Kids.
As a fraternal organization, Foresters Financial offers various benefits, such as tuition scholarships, community grants, emergency assistance programs, and volunteer and family events. Another feature available to members is Legal Link, which members can consult with local legal professionals regarding a variety of issues, such as home ownership, family law and wills, and estates.
While Foresters Financial has significant operations internationally and domiciled in Canada, a significant portion of its business is in the United States. The wholly owned subsidiaries that comprise Foresters Financial main insurance operations include Forester Holdings (Europe) Ltd., which is the immediate parent company of Forester Life Limited, where all UKSIP life insurance business is written.
In recent years, Foresters Financial has sold off holdings that it no longer considers core to its business. In 2019, Foresters announced the sale of its Canadian asset management operations to Fiera capital, and the sale of its U.S. asset management operations (including First Investors Mutual Funds), to Maquarie Investment Management. Foresters also sold its U.S. broker/dealer and advisor business to Cetera Financial Group. On July 1, 2020, the group sold Foresters Life Insurance and Annuity Company to Nassau Financial Group, LLP.
Foresters Life Insurance Company, formerly Unity Life of Canada, acquired in 2008 to enhance Foresters presence in the Canadian life insurance market.
Management Officers
President and CEO: James R. Boyle CFO: Alvin Sharma (Global) President: Matt M. Berman (Foresters US) President: Henry Auyeung (Foresters Canadian Division) CEO: Latinka Pilipovic (UK (Interim)) Chief Human Resources Officer: Marcia Mendes-d'Abreu (Global) COO: Louis Gagnon SVP and Chief Information Officer: Mehul Kapadia (Global) Chief Marketing Officer: David Longfritz (Global) Chief Officer: Nicole Gourley (Membership) SVP: Pat Colavita Vice President: J. Stephen McDonald Chief Risk Officer and Chief Actuary: Gaurav Upadhya Corporate Secretary, Chief Compliance Officer and Chief Legal Officer: Rene Zanin (Global, CPO, CAML) Vice President and Chief Investment Officer: Clark D. Wagner
Directors
Daniel J. Fortin (Chair) Katherine A. Bardswick Sonia A. Baxendale James R. Boyle
AMB #: 060132 - Independent Order of Foresters
www.ambest.com Page 14Printed for Bcrs on September 15, 2021
Page 15 of 18 Printed September 16, 2021
BEST’S RATING REPORT
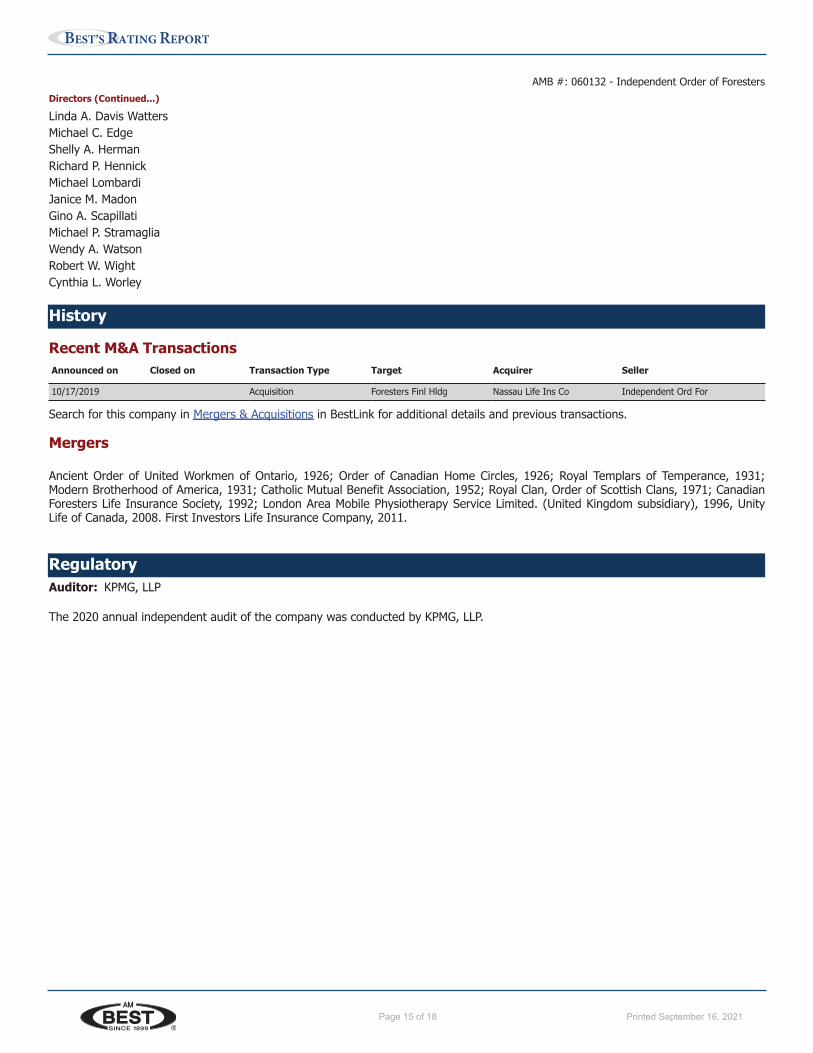
Directors (Continued...)
Linda A. Davis Watters Michael C. Edge Shelly A. Herman Richard P. Hennick Michael Lombardi Janice M. Madon Gino A. Scapillati Michael P. Stramaglia Wendy A. Watson Robert W. Wight Cynthia L. Worley
History
Recent M&A Transactions Announced on Closed on Transaction Type Target Acquirer Seller
10/17/2019 Acquisition Foresters Finl Hldg Nassau Life Ins Co Independent Ord For
Search for this company in Mergers & Acquisitions in BestLink for additional details and previous transactions.
Mergers
Ancient Order of United Workmen of Ontario, 1926; Order of Canadian Home Circles, 1926; Royal Templars of Temperance, 1931; Modern Brotherhood of America, 1931; Catholic Mutual Benefit Association, 1952; Royal Clan, Order of Scottish Clans, 1971; Canadian Foresters Life Insurance Society, 1992; London Area Mobile Physiotherapy Service Limited. (United Kingdom subsidiary), 1996, Unity Life of Canada, 2008. First Investors Life Insurance Company, 2011.
Regulatory Auditor: KPMG, LLP
The 2020 annual independent audit of the company was conducted by KPMG, LLP.
AMB #: 060132 - Independent Order of Foresters
www.ambest.com Page 15Printed for Bcrs on September 15, 2021
Page 16 of 18 Printed September 16, 2021
BEST’S RATING REPORT
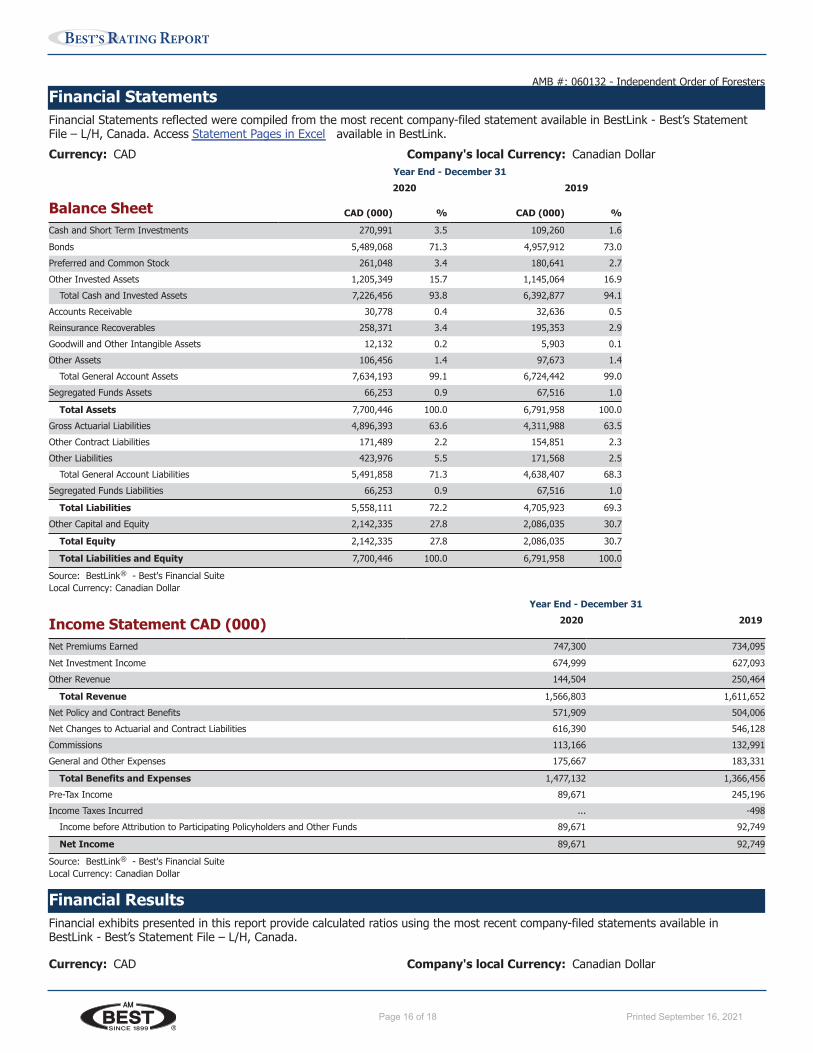
Financial Statements Financial Statements reflected were compiled from the most recent company-filed statement available in BestLink - Best’s Statement File – L/H, Canada. Access Statement Pages in Excel available in BestLink. Currency: CAD Company's local Currency: Canadian Dollar
Year End - December 31 2020 2019
Balance Sheet CAD (000) % CAD (000) % Cash and Short Term Investments 270,991 3.5 109,260 1.6 Bonds 5,489,068 71.3 4,957,912 73.0 Preferred and Common Stock 261,048 3.4 180,641 2.7 Other Invested Assets 1,205,349 15.7 1,145,064 16.9
Total Cash and Invested Assets 7,226,456 93.8 6,392,877 94.1 Accounts Receivable 30,778 0.4 32,636 0.5 Reinsurance Recoverables 258,371 3.4 195,353 2.9 Goodwill and Other Intangible Assets 12,132 0.2 5,903 0.1 Other Assets 106,456 1.4 97,673 1.4
Total General Account Assets 7,634,193 99.1 6,724,442 99.0 Segregated Funds Assets 66,253 0.9 67,516 1.0
Total Assets 7,700,446 100.0 6,791,958 100.0 Gross Actuarial Liabilities 4,896,393 63.6 4,311,988 63.5 Other Contract Liabilities 171,489 2.2 154,851 2.3 Other Liabilities 423,976 5.5 171,568 2.5
Total General Account Liabilities 5,491,858 71.3 4,638,407 68.3 Segregated Funds Liabilities 66,253 0.9 67,516 1.0
Total Liabilities 5,558,111 72.2 4,705,923 69.3 Other Capital and Equity 2,142,335 27.8 2,086,035 30.7
Total Equity 2,142,335 27.8 2,086,035 30.7
Total Liabilities and Equity 7,700,446 100.0 6,791,958 100.0
Source: BestLink ® - Best's Financial Suite Local Currency: Canadian Dollar
Year End - December 31
Income Statement CAD (000) 2020 2019
Net Premiums Earned 747,300 734,095 Net Investment Income 674,999 627,093 Other Revenue 144,504 250,464
Total Revenue 1,566,803 1,611,652 Net Policy and Contract Benefits 571,909 504,006 Net Changes to Actuarial and Contract Liabilities 616,390 546,128 Commissions 113,166 132,991 General and Other Expenses 175,667 183,331
Total Benefits and Expenses 1,477,132 1,366,456 Pre-Tax Income 89,671 245,196 Income Taxes Incurred ... -498
Income before Attribution to Participating Policyholders and Other Funds 89,671 92,749
Net Income 89,671 92,749
Source: BestLink ® - Best's Financial Suite Local Currency: Canadian Dollar
Financial Results Financial exhibits presented in this report provide calculated ratios using the most recent company-filed statements available in BestLink - Best’s Statement File – L/H, Canada.
Currency: CAD Company's local Currency: Canadian Dollar
AMB #: 060132 - Independent Order of Foresters
www.ambest.com Page 16Printed for Bcrs on September 15, 2021
Page 17 of 18 Printed September 16, 2021
BEST’S RATING REPORT
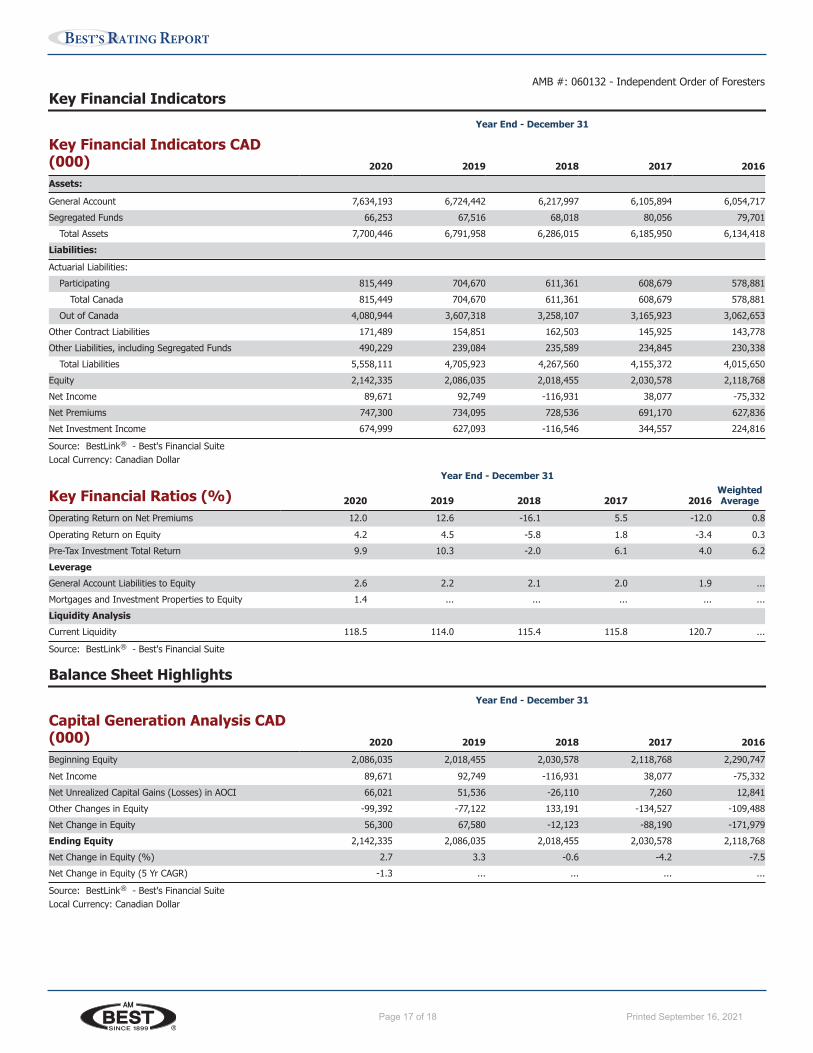
Key Financial Indicators Year End - December 31
Key Financial Indicators CAD (000) 2020 2019 2018 2017 2016 Assets:
General Account 7,634,193 6,724,442 6,217,997 6,105,894 6,054,717 Segregated Funds 66,253 67,516 68,018 80,056 79,701
Total Assets 7,700,446 6,791,958 6,286,015 6,185,950 6,134,418 Liabilities: Actuarial Liabilities:
Participating 815,449 704,670 611,361 608,679 578,881 Total Canada 815,449 704,670 611,361 608,679 578,881
Out of Canada 4,080,944 3,607,318 3,258,107 3,165,923 3,062,653 Other Contract Liabilities 171,489 154,851 162,503 145,925 143,778 Other Liabilities, including Segregated Funds 490,229 239,084 235,589 234,845 230,338
Total Liabilities 5,558,111 4,705,923 4,267,560 4,155,372 4,015,650 Equity 2,142,335 2,086,035 2,018,455 2,030,578 2,118,768 Net Income 89,671 92,749 -116,931 38,077 -75,332 Net Premiums 747,300 734,095 728,536 691,170 627,836 Net Investment Income 674,999 627,093 -116,546 344,557 224,816
Source: BestLink ® - Best's Financial Suite Local Currency: Canadian Dollar
Year End - December 31 Weighted Average Key Financial Ratios (%) 2020 2019 2018 2017 2016
Operating Return on Net Premiums 12.0 12.6 -16.1 5.5 -12.0 0.8 Operating Return on Equity 4.2 4.5 -5.8 1.8 -3.4 0.3 Pre-Tax Investment Total Return 9.9 10.3 -2.0 6.1 4.0 6.2 Leverage General Account Liabilities to Equity 2.6 2.2 2.1 2.0 1.9 ... Mortgages and Investment Properties to Equity 1.4 ... ... ... ... ... Liquidity Analysis Current Liquidity 118.5 114.0 115.4 115.8 120.7 ...
Source: BestLink ® - Best's Financial Suite
Balance Sheet Highlights Year End - December 31
Capital Generation Analysis CAD (000) 2020 2019 2018 2017 2016 Beginning Equity 2,086,035 2,018,455 2,030,578 2,118,768 2,290,747 Net Income 89,671 92,749 -116,931 38,077 -75,332 Net Unrealized Capital Gains (Losses) in AOCI 66,021 51,536 -26,110 7,260 12,841 Other Changes in Equity -99,392 -77,122 133,191 -134,527 -109,488 Net Change in Equity 56,300 67,580 -12,123 -88,190 -171,979 Ending Equity 2,142,335 2,086,035 2,018,455 2,030,578 2,118,768 Net Change in Equity (%) 2.7 3.3 -0.6 -4.2 -7.5 Net Change in Equity (5 Yr CAGR) -1.3 ... ... ... ...
Source: BestLink ® - Best's Financial Suite Local Currency: Canadian Dollar
AMB #: 060132 - Independent Order of Foresters
www.ambest.com Page 17Printed for Bcrs on September 15, 2021

BEST’S RATING REPORT
Page 18 of 18 Printed September 16, 2021
Copyright © 2021 A.M. Best Company, Inc. and/or its affiliates. All rights reserved.No portion of this content may be reproduced, distributed, or stored in a database or retrieval system, or transmitted in any form or by any means without the prior written permis-sion of AM Best. While the content was obtained from sources believed to be reliable, its accuracy is not guaranteed. For additional details, refer to our Terms of Use available at AM Best website: www.ambest.com/terms.
Best’s Credit Rating Methodology | | Best’s Credit Rating GuideDisclaimer
Balance Sheet Highlights
Asset Liability Management | Investments Year End - December 31
2020 2019 2018 2017 2016
Composition of Cash and Invested Assets Total Cash and Invested Assets CAD (000) 7,226,456 6,392,877 5,790,159 5,693,518 5,657,458 Composition Percentages (%) Unaffiliated: Cash and Short Term Investments 3.7 1.7 0.7 1.6 2.5 Bonds 76.0 77.6 79.5 76.8 76.6 Stocks 3.6 2.8 3.0 3.7 4.3 Mortgage Loans 0.4 ... ... ... ... Other Invested Assets 6.8 5.1 5.6 5.9 5.7
Total Unaffiliated 90.6 87.2 88.8 88.0 89.1
Investments in Affiliates 9.4 12.8 11.2 12.0 10.9
Total 100.0 100.0 100.0 100.0 100.0
Source: BestLink ® - Best's Financial Suite Local Currency: Canadian Dollar
Operating Performance HighlightsYear End - December 31
Net Premiums by Line of BusinessCAD (000) 2020 2019 2018 2017 2016Life:
Individual 740,492 726,662 720,589 683,957 620,683Annuity:
Individual 579 661 1,026 1,302 2,155Accident and Sickness:
Individual 6,229 6,772 6,921 5,911 4,998
Total 747,300 734,095 728,536 691,170 627,836
Source: BestLink® - Best's Financial SuiteLocal Currency: Canadian Dollar
Business Profile Highlights
Direct PremiumsWritten
ReinsurancePremiumsAssumed
ReinsurancePremiums Ceded
Net PremiumsWritten
BusinessRetention
2020 By LineBusiness CAD (000) % CAD (000) % CAD (000) % CAD (000) % %Life:
Individual 834,365 99.2 17,665 100.0 111,538 100.0 740,492 99.1 86.9Annuity:
Individual 579 0.1 ... ... ... ... 579 0.1 100.0Accident and Sickness:
Individual 6,229 0.7 ... ... ... ... 6,229 0.8 100.0Total 841,173 100.0 17,665 100.0 111,538 100.0 747,300 100.0 87.0
Source: BestLink® - Best's Financial SuiteLocal Currency: Canadian Dollar
AMB #: 060132 - Independent Order of Foresters
www.ambest.com Page 18Printed for Bcrs on September 15, 2021
Business Profile Highlights
Historical Market PresenceGeographic Breakdown by DirectPremiums Written CAD (000) 2020 2019 2018 2017 2016Out of Canada 785,639 746,174 724,142 684,039 621,054Ontario 32,742 30,313 27,630 25,148 22,017Quebec 10,331 8,373 6,365 4,023 2,999British Columbia 5,427 5,328 4,958 4,545 4,528Alberta 4,812 4,619 4,455 4,319 4,444Manitoba 1,001 935 858 900 923Saskatchewan 532 551 554 560 562Nova Scotia 426 457 439 448 454New Brunswick 176 178 177 176 181Newfoundland and Labrador 74 67 62 73 54All Other 13 13 11 3 2Total 841,173 797,008 769,651 724,234 657,218
Source: BestLink® - Best's Financial SuiteLocal Currency: Canadian Dollar
A Best's Financial Strength Rating opinion addresses the relative ability of an insurer to meet its ongoing insurance obligations. The ratings are not assigned to specific insurance policies or contracts and do not address any other risk, including, but not limited to, an insurer's claims-payment policies or procedures; the ability of the insurer to dispute or deny claims payment on grounds of misrepresentation or fraud; or any specific liability contractually borne by the policy or contract holder. A Financial Strength Rating is not a recommendation to purchase, hold or terminate any insurance policy, contract or any other financial obligation issued by an insurer, nor does it address the suitability of any particular policy or contract for a specific purpose or purchaser.
A Best's Issue/Issuer Credit Rating is an opinion regarding the relative future credit risk of an entity, a credit commitment or a debt or debt-like security.
Credit risk is the risk that an entity may not meet its contractual, financial obligations as they come due. These credit ratings do not address any other risk, including but not limited to liquidity risk, market value risk or price volatility of rated securities. The rating is not a recommendation to buy, sell or hold any securities, insurance policies, contracts or any other financial obligations, nor does it address the suitability of any particular financial obligation for a specific purpose or purchaser.
In arriving at a rating decision, AM Best relies on third-party audited financial data and/or other information provided to it. While this information is believed to be reliable, AM Best does not independently verify the accuracy or reliability of the information. Any and all ratings, opinions and information contained herein are provided "as is," without any express or implied warranty.
Visit http://www.ambest.com/ratings/index.html for additional information or http://www.ambest.com/terms.html for details on the Terms of Use. For current ratings visit www.ambest.com/ratings
AMB #: 060132 - Independent Order of Foresters
www.ambest.com Page 19Printed for Bcrs on September 15, 2021
Copyright © 2021 A.M. Best Company, Inc. and/or its affiliates. All rights reserved. No portion of this content may be reproduced, distributed, or stored in a database or retrieval system, or transmitted in any form or by any means without the prior written permis-sion of AM Best. While the content was obtained from sources believed to be reliable, its accuracy is not guaranteed. For additional details, refer to our Terms of Use available at AM Best website: www.ambest.com/terms.