Embed Size (px)
Citation preview

Beta Glucosidase from Aspergillus niger NII 08121: Molecular Characterization
and Applications in Bioethanol production
PhD Thesis January 2011
Reeta Rani Singhania Biotechnology Division
National Institute for Interdisciplinary Science & Technology – CSIR
Thiruvananthapuram 695019, INDIA

Beta -Glucosidase from Aspergillus niger NII 08121- Molecular Characterization and Applications in
Bioethanol production
Thesis submitted under the Faculty of Science of the Cochin University of Science and Technology
For the award of the degree of
Doctor of Philosophy In
Biotechnology
Reeta Rani Singhania
Reg. No. 3455
Biotechnology Division
National Institute for Interdisciplinary Science & Technology –CSIR Thiruvananthapuram 695019, INDIA
January 2011

National Institute for Interdisciplinary Science and Technology
Council of Scientific and Industrial Research, Government of India Pappanamcode, Thiruvananthapuram 695019, Kerala, India
Phone : +91 471 2515368, Fax: +91 471 2491712 Email : [email protected]; [email protected]
Rajeev Kumar S, MSc PhD Scientist, Biotechnology Division
28 December 2010
DECLARATION
I hereby declare that the work presented in this thesis entitled “ Beta Glucosidase from
Aspergillus niger NII 08121- Molecular characterization and applications in bioethanol
production” is based on the original work done by Ms Reeta Rani Singhania (Reg # 3455), under
my guidance and supervision, at the National Institute for Interdisciplinary Science and
Technology, CSIR, Trivandrum, India. I also declare that this work or no part of this work has
been submitted for the award of any degree, diploma, associateship or any other title or
recognition.
Rajeev Kumar S

Thiruvananthapuram 30 December 2010
DECLARATION
I hereby declare that the work presented in this thesis entitled “β-Glucosidases from
Aspergillus niger NII 08121- Molecular Characterization and Applications in
Bioethanol Production” is based on the original work done by me under the guidance of
Dr Rajeev Kumar Sukumaran, Scientist, Biotechnology Division, National Institute for
Interdisciplinary Science and Technology, CSIR, Trivandrum, India and the thesis or no part
of it has been submitted elsewhere for the award of any Degree, Diploma, Associateship or
any other Title or Recognition.
Reeta Rani Singhania

Dedicated to my parents and teachers

Acknowledgements
My vocabulary falls short when I try switching my thoughts into words to express the deep sense of gratitude towards my supervisor, Dr Rajeev Kumar Sukumaran, Scientist, Biotechnology Division, National Institute for Interdisciplinary Science and Technology, who is meticulous in his R&D and is a master of perfection. His constant guidance, encouragement, support and more importantly the kind of faith he has on us students; enabled me to work efficiently.
I express my deep gratitude towards Prof Ashok Pandey, Head of Biotechnology Division, National Institute for Interdisciplinary Science and Technology for his guidance, persistent support and continuous encouragement throughout the course of work. He has been meticulous in applying innovative strategies in molding us in the form that we are today and filled us with confidence which uplifted us at the present form.
It is my privilege to place on record my gratitude to Dr Suresh Das, Director, National Institute for Interdisciplinary Science and Technology for providing me necessary facilities in the Institute for the research work. My most sincerer gratitude to Prof T K Chandrashekhar and Dr B C Pai, former Directors of the Institute, and Dr KGK Warrier, Director-Grade Scientist of the institute for being constant source of encouragement for me.
I must place on record my thankfulness to Dr Edgard Gnansounou, Director, Energy Research Lab, EPFL, Lausanne, Switzerland for providing me an opportunity to visit and work in his laboratory for three months during October- December 2008. I am thankful to Simone and Juan for their help at EPFL.
I am thankful to Dr K Madhavan Nampoothiri, Dr Binod P and Dr Sindhu R for their valuable suggestions and timely support during the study. I express my thanks to Dr Vijaylakshmi Amma, Mr Sivankutty Nair PN and Mr Prakash KM for all the help and support extended to me. I also express my thanks to Dr Sudhir Singh, Dr Syed Dastager and Er Vikram Surendar, former scientists of the Division.
I owe my gratitude to the Council of Scientific and Industrial Research, New Delhi for providing me Senior Research Fellowship to undertake this study. I also thank TIFAC, New Delhi for financial support to establish Centre for Biofuels at NIIST, Trivandrum, which had helped me in completing my research studies.
I express my sincere gratitude to Dr Sarita G Bhat, Head, Department of Biotechnology, CUSAT and Expert Member of my Doctoral Committee for her valuable suggestions for improving my research studies.
I take this opportunity to thank the Academic Program Committee of the Institute and the NIIST –CUSAT Research Council for all the timely help during the entire course of my work and thesis submission. I also thank all the administrative and supporting staff of the Institute for their support and help.

My sincere thanks are due to all the members of “Team Biotech” for creating a healthy working environment in the lab, which has been unique in its own. For this my thanks are due to Vidya, Rajasree, Lalitha, Deepthy, Ushasree, Sumayya, Abraham, Gincy, Sumantha, Babitha, Dhanya, Swetha, Rojan, Saishyam, Shyam Krsihna, Kiran D, Kiran K, Archana, Sumitra, Roopesh, Salim, Sabira, Kuttiraja, Ashwathy, Bindhu, Raji, Nisha, Sajna, Nimisha, Deepti, Anisha, Asha, Nice, Niladevi, Aparna, Preeti, Sandhya, Padma, Varsha, Arya, Vipin, Janu, Anushree, Anu, Salma and Divya, who helped me in one way or other during the course of my research work.
I am indebted to Sushama aunty, Chophla uncle and aunty, Nair uncle and aunty, Ubaid, Lalitha and Satya for making me feel at home and my stay comfortable at Trivandrum - far away from my native place. They have made my stay memorable here.
It would not have been possible to undertake the journey of my career, and to reach where I am today without the support of my beloved Mother, my sister Swati, my brothers, Manoj and Amar and my sister-in-law Sanjana. I thank them for the unconditional love and care they showered on me. Their faith on me has always been a great strength which helped me throughout the way.
I am thankful to Anil, my soul-mate, for his persistent support, affection and care throughout this journey.
Above all, I express my gratefulness to the Almighty for making me able to achieve whatever I have.
Reeta Rani Singhania

i
LIST OF PUBLICATIONS
Published in SCI Journals 1. Reeta Rani Singhania, Sukumaran RK, Rajasree KP, Mathew A, Gottumukkala L, Pandey A,
(2011) Properties of a major β-glucosidase-BGL1 from Aspergillus niger NII-08121 expressed differentially in response to carbon sources. Process Biochemistry, 46(7): 1521-1524.
2. Reeta Rani Singhania, S Chiesa, RK Sukumaran, JD Villegas, AK Patel, E Gnansounou &
Ashok Pandey (2010), Pretreatment of Douglas fir wood biomass for improving saccharification efficiencies Journal of ASTM International, 7(4), 1-8.
3. Reeta Rani Singhania, RK Sukumaran, AK Patel, C Larroche & Ashok Pandey (2010),
Advancement and comparative profiles in the production technologies using solid-state and submerged fermentation for microbial cellulases. Enzyme and Microbial Technology, 46(7), 541-549.
4. Binod P, R Sindhu, Reeta Rani Singhania, Surender V, Lalithadevi G, Satyanagalakshmi K,
Kurien N, Sukumaran RK & Ashok Pandey (2010), Bioethanol production from rice straw: An overview, , Bioresource Technology, 101(14), 4767-4774.
5. Aswathy US, Sukumaran RK, Lalitha Devi G, Rajasree KP, Reeta Rani Singhania & Ashok
Pandey (2010)Bioethanol from water hyacinth biomass: an evaluation of enzymatic saccharification strategy, Bioresource Technology, 101, 925-930.
6. Sukumaran RK, Reeta Rani Singhania, Mathew GM & Ashok Pandey (2009) Cellulase
production using biomass feed stock and its application in lignocellulose saccharification for bioethanol production, Renewable Energy, 34(2), 421-424.
7. Mathew GM, Sukumaran RK, Reeta Rani Singhania & Ashok Pandey (2008)Progress in
research on fungal cellulases for lignocellulose degradation, , Journal of Scientific and Industrial Research, 67(11), 898-907.
8. Siqueira PF, Karp SG, Carvalho JC, Sturm W, Rodríguez-León JA, Tholozan JL, Reeta Rani
Singhania, Pandey A, Soccol CR (2008) Production of bio-ethanol from soybean molasses by Saccharomyces cerevisiae at laboratory, pilot and industrial scales, Bioresource Technology, 99(17), 8156-8163.
9. Mekala NK, Reeta Rani Singhania, Sukumaran RK & Ashok Pandey (2008), Cellulase
production under solid-state fermentation by Trichoderma reesei RUT C30: Statistical optimization of process parameters, , Applied Biochemistry and Biotechnology, 151(2-3), 122-131.
10. Reeta Rani Singhania, RK Sukumaran & Ashok Pandey (2007) Improved cellulase production
by Trichoderma reesei RUT C30 under SSF through process optimization, Applied Biochemistry and Biotechnology, 142, 60-70.

ii
11. Reeta Rani Singhania, RK Sukumaran, A Pillai, P Prema & Ashok Pandey, (2006), Solid-state fermentation on lignocellulosic substrates for cellulase production by Trichoderma reesei NRRL-11460, Indian Journal of Biotechnology, 5(4), 332-336.
12. Sukumaran RK, Reeta Rani Singhania & Ashok Pandey (2005), Microbial cellulases-Production,
applications and challenges, Journal of Scientific and Industrial Research, 64, 832-844. Communicated to SCI journals 1. Reeta Rani Singhania, R K. Sukumaran, Rajasree KP, Lalitha Devi G, Abraham Mathew &
Ashok Pandey, Properties of a major β-glucosidase–BGL1 from Aspergillus niger NII-8121 expressed differentially in response to carbon sources, Enzyme and Microbial Technology (2010) communicated.
Book Chapters 1. Reeta Rani Singhania (2009), Cellulolytic enzymes, In- Biotechnology for Agro-industrial
residues utilization, P Nigam & Ashok Pandey (eds), Springer, USA, Ch 20, pp 371-382 (2009) 2. Reeta Rani Singhania, P Binod & Ashok Pandey (2008), Plant-based biofuels- An Introduction,
In- Handbook of Plant-Based Biofuels, A Pandey (ed),Taylor & Francis, CRC Press, USA, Ch 1, pp 1-10
3. Reeta Rani Singhania, RK Sukumaran & Ashok Pandey (2005) Cellulase production using
cassava bagasse as a substrate, , In- Root and Tuber Crops: Post-harvest Management and Value Addition, G Padmaja, T Premkumar, S Edison & B Nambisan (eds), Published by CTCRI, Trivandrum, pp 247-251.
Conference Abstracts/Posters/Presentations 1. Reeta Rani Singhania, Lalitha Devi, KP Rajasree, RK Sukumaran & Ashok Pandey (2009),
Production, properties and differential induction of β-glucosidase in a novel strain of Aspergillus niger NII 08121, International Conference on Emerging Trends in Biotechnology and VI BRSI Convention, Banaras Hindu University, Varanasi, India, December 4-6 (2009)
2. Surender V, P Binod, R Sindhu, Reeta Rani Singhania, Lalitha Devi, KU Janu, KP Rajasree, K
Satayanagalakshmi, KV Sajna, Noble Kurian, RK Sukumaran & Ashok Pandey (2009), The Centre for Biofuels: R&D directions for second generation biofuels- Bioethanol from lignocellulosic feedstocks, International Conference on Emerging Trends in Biotechnology and VI BRSI Convention, Banaras Hindu University, Varanasi, India, December 4-6 (2009)
3. Lalitha Devi Gottumukkala, KP Rajasree, Reeta Rani Singhania, RK Sukumaran & Ashok
Pandey (2008), β-Glucosidase production from a novel Aspergillus niger, In- International Congress on Bioprocesses in Food Industries [ICBF-2008] & V BRSI Convention, Hyderabad, November 6-8 (2008)

iii
4. Reeta Rani Singhania, GM Mathew, RK Sukumaran and Ashok Pandey (2007), Cellulases for bioethanol production : Optimization and evaluation of enzyme cocktails for lignocellulose saccharification, International conference on New Horizons in Biotechnology and 4th BRSI Convention, Trivandrum, November 26-29, (2007) BEST PAPER AWARD ON BIOFUELS BY ELSEVIER SCIENCE, UK
5. Mathew GM, Reeta Rani Singhania, Ashok Pandey & RK Sukumaran (2007), Selection of
carbon sources and optimization of fermentation conditions for the production of a glucose tolerant beta glucosidase from a novel fungal isolate BTCF 58, International conference on New Horizons in Biotechnology and 4th BRSI Convention, Trivandrum, November 26-29, (2007)
6. Reeta Rani Singhania, P Binod, GM Mathew, RK Sukumaran & Ashok Pandey (2007)
Bioethanol from lignocellulosic biomass – concept of biorefinery, International conference on New Horizons in Biotechnology and 4th BRSI Convention, Trivandrum, November 26-29, (2007)
7. Reeta Rani Singhania, GM Mathew, RK Sukumaran & Ashok Pandey (2007)Plant based
biofuels- Bioethanol from lignocellulosic biomass, BioKorea’07, Seoul, Korea, September 11-14 (2007).
8. Sukumaran RK, Reeta Rani Singhania, GM Mathew & Ashok Pandey (2007), Cellulase
production using biomass feed stock and its application in lignocellulose saccharification for bioethanol production, In- International Conference on Renewable Energy for Sustainable Development in the Asia Pacific Region, Perth, Western Australia, February 4-8, (2007).
9. Reeta Rani Singhania, RK Sukumaran & Ashok Pandey (2006), Improved cellulase production
by Trichoderma reesei RUT C30 under solid-state fermentation by process parameter optimization, In- National Seminar on Biotechnology and Chemical Technology- Novel Achievements, Trivandrum, September 14-15 (2006).
10. Reeta Rani Singhania, RK Sukumaran, Ashok Pandey (2005) Study of some factors affecting
cellulase production by Trichoderma reesei RUT C30 under SSF on wheat bran using a Placket & Burman design, In - National Conference on Path to Health- Biotechnology Revolution in India & 2nd BRSI Convention, Chennai, November 24-26, (2005) .
11. Reeta Rani Singhania, A Pillai, P Prema & Ashok Pandey (2004) Fungal cellulase production
using lignocellulosic residue, In - National Conference on Developments in Biotechnology: Emerging Trends and Challenges & 1st BRSI Convention, Jalgaon, November 25-27, (2004).

i
Contents
Acknowledgements List of Publications
Chapter 1 Introduction and Review of Literature
1.1 Enzymes for biomass-to-ethanol conversion 1 1.2 β-glucosidases 3 1.3 Microbial production of β-glucosidase 4 1.4 Differential expression of β-glucosidases isoforms 4 1.5 Classification of β-glucosidases 6 1.6 Cloning of β-glucosidase genes 8 1.7 β-glucosidases in bioethanol production 9 1.8 Conclusions 10 1.9 Objectives and Scope of the current study 11 2.1 Microorganisms and preparation of inoculum 12 2.2 Medium preparation Chapter 2 Materials and Methods 2.2 Medium Preparation 13 2.2.1 Solid State Fermentation 13 2.2.2 Submerged Fermentation 13 2.3 Enzyme production and extraction 13 2.3.1 Solid State Fermentation 13 2.3.2 Submerged Fermentation 14 2.4 Analytical Methods 14 2.4.1 Enzyme Assays 14 2.4.1.1 β-glucosidase assay 14 2.4.1.2 Cellulase (Filter paper) Assay 15 2.4.1.3 Endoglucanase (CMCase) Assay 15 2.4.2 Protein Assay 16 2.4.3 Reducing sugar estimation 16 2.4.4 Estimation of Ethanol 16 2.5 Electrophoresis and Zymogram Analyses 16 2.6 Biomass (Rice Straw) Pretreatment 17 2.7 Biomass saccharification 17 2.8 Ethanol Production 18 Chapter 3 Fermentative Production of β-glucosidase 19
3 Introduction 19 3.1 Materials and Methods 21 3.1.1 Screening of carbon sources for BGL production 21 3.1.2 Bioreactor Studies 21

ii
3.1.3 Optimization of the SSF production of BGL by A. niger 22 3.2 Results and Discussion 24 3.2.1 Screening of carbon sources for BGL production by A. niger 24 3.2.2 β-glucosidase production under SmF in bioreactor 25 3.2.3 Optimization of the SSF production of BGL by A. niger 27 3.3 Conclusions 30 Chapter 4 Differential Expression of β-glucosidase by A. niger NII 08121
in response to carbon sources 31
4 Introduction 31 4.1 Materials and Methods 32 4.1.1 Production of BGL using different carbon sources under SmF 32 4.1.2 Detection of BGL protein isoforms by PAGE and Activity staining 32 4.2 Results and Discussion 33 4.2.1 Production of BGL by A. niger in media containing different
carbon sources 33
4.2.2 Differential expression of BGL protein in response to carbon sources
34
4.3 Conclusions 37 Chapter 5 Purification and characterization of the major BGL (BGL1)
from Aspergillus niger NII 08121 38
5.1 Materials and Methods 39 5.1.1 Enzyme purification 39 5.1.1.1 Acetone fractionation of crude enzyme preparation 39 5.1.1.2 Isoelectric focusing 39 5.1.1.3 Chromatography 40 5.1.1.4 Electro-elution 40 5.1.2 Characterization of the major beta-glucosidase (BGL1) from A.
niger NII 08212 41
5.1.2.1 Determination of the molecular weight of major BGL from A. niger
41
5.1.2.2 Determination of the optimal temperature of activity for the A. niger major BGL
41
5.1.2.3 Determination of the optimal pH of activity for the A. niger major BGL
41
5.1.2.4 Temperature stability of the major BGL of A. niger 42 5.1.2.5 Glucose inhibition kinetics of the A. niger major BGL 42 5.2 Results and Discussion 42 5.2.1 Acetone Fractionation of BGL 42 5.2.2 Purification of the major BGL (BGL1) of A. niger NII 08121 45 5.2.2.1 Determination of the isoelectric point (pI) of BGL from 1:1
acetone fraction 45
iii
5.2.2.2 Chromatographic separation of BGL activities from acetone precipitated enzymes
46
5.2.2.3 Purification of major BGL using Electro-elution 47 5.2.3 Characterization of the major BGL (BGL1) from A. niger NII
08121 49
5.2.3.1 Determination of the Glucose inhibition constant (Ki) of BGL1 5.3 Conclusions 51 Chapter 6 Multiplicity of A. niger BGL: Confirmation by partial gene
cloning of BGLs belonging to three glycosyl hydrolase families 53
6 Introduction 53 6.1 Materials and Methods 54 6.1.1 Molecular cloning of the partial gene sequences of A. niger β-
glucosidases 54
6.1.1.1 Chromosomal DNA Isolation from A. niger 54 6.1.1.2 Primer designing 54 6.1.1.3 PCR Amplification of partial gene sequences of BGL 57 6.1.1.4 Cloning of PCR products and sequencing of inserts 57 6.2 Results 59 6.2.1 Chromosomal DNA isolation 59 6.2.2 PCR amplification of BGL genes 59 6.2.3 Cloning, Sequencing and BLAST analysis of the partial BGL
genes of families GH1, GH3 and GH5 61
6.2.3.1 Cloning of partial genes of GH1, GH3 and GH5 BGLs 61 6.2.3.2 Sequencing and BLAST analysis of partial genes of GH1, GH3
and GH5 BGLs 63
6.2.3.2.1 Sequence of GH1-BGL insert and BLAST results 63 6.2.3.2.2 Sequence of GH3-BGL insert and BLAST results 64 6.2.3.2.3 Sequence of GH5-BGL insert and BLAST results 64 6.3 Conclusions Chapter 7 Studies on the application of A. niger β-glucosidase for
bioethanol production 66
7 Introduction 66 7.1 Materials and Methods 67 7.1.1 Organisms and culture conditions 67 7.1.2 Cellulase production using Trichoderma reesei RUT C30 67 7.1.2.1 Optimization of cellulase production by T. reesei RUT C30 under
Solid State Fermentation 67
7.1.2.1A Screening of parameters affecting cellulase production by fractional factorial design
67
7.1.2.1B Optimization of significant parameters for improving cellulase production
69
7.1.3 Optimization of Enzyme cocktail for hydrolysis of alkali 71

iv
pretreated rice straw 7.1.4 Ethanol production using the enzymatic hydrolysate of rice straw 72 7.2 Results and Discussion 73 7.2.1 Optimization of parameters for improving cellulase production
from T. reesei RUT C30 73
7.2.1.1 Screening of parameters affecting cellulase production 73 7.2.1.2 Optimization of the levels of significant parameters identified by
Placket & Burman experiments 74
7.2.1.3 Validation of the model 78 7.2.2 Preparation of Enzyme Cocktails and biomass hydrolysis 79 7.2.3 Optimization of enzyme cocktails for biomass saccharification 80 7.2.4 Ethanol production from rice straw hydrolysate 85 7.3 Conclusions 86 Chapter 8 Summary and Conclusions 88
8.1 Summary 88 8.2 Conclusions 89 References 91
Appendix 1: List of Abbreviations Appendix 2: List of Tables Appendix 3: List of Figures

Chapter 1
Introduction and Review of Literature

1
Chapter 1 Introduction and Review of Literature
1. Introduction
1.1. Enzymes for biomass-to-ethanol-conversion
Bio-refinery concept of generating commodities replacing the conventional
petrochemical route is now regarded as the future of industry and more and more research
is now directed towards moving to carbohydrate based products. Bio-ethanol production
from lignocellulosic biomass is emerging as one of the most important technologies for
sustainable production of renewable transportation fuels. Ethanol has a higher octane
rating than gasoline and produces fewer emissions, and is therefore widely recognized as a
substitute and/or additive to gasoline (Wyman 1999). Due to these apparent advantages
and also being a renewable alternative to existing transport fuels, there is now an increased
interest in commercializing technologies for ethanol production from inexpensive biomass
(Schell et al, 2004). Most of the fuel ethanol produced in the world is currently sourced
from starchy biomass or sucrose (corn /beet starch, molasses or cane juice). These
feedstock are also food or feed which leads to a direct competition with their use as food
or feed. Therefore the technology for economical conversion non-food
biomass/lignocellulosic biomass is actively sought worldwide and is expected to be
realized in the in the coming years.
The production of ethanol from lignocellulosic biomass involves the different steps
of pretreatment, hydrolysis (saccharification) and ethanol recovery (van Zessen et al,
2003). Hydrolysis of biomass is essential for generation of fermentable sugars which are
then converted to ethanol by microbial action. Two methods, i.e. acid hydrolysis and
enzymatic hydrolysis are primarily employed for biomass hydrolysis with varying
efficiencies depending on treatment conditions, type of biomass and the properties of the
hydrolytic agents. The former is a mature technology but with the disadvantages of
generation of hazardous acidic waste and the technical difficulties in recovering sugar
from the acid. The enzymatic method, however, is more efficient and proceeds under
ambient conditions without generation of any toxic waste. The later method which is
under rapid development has immense potentials for improvement in cost and efficiency
(Mishima et al, 2006). Commercialization of ethanol production from lignocellulosic

2
biomass is hindered mainly by the prohibitive cost of the currently available cellulase
preparations – the enzymes used for saccharification. Reduction in the cost of cellulases
can be achieved only by concerted efforts which address several aspects of enzyme
production from the raw material used for production to microbial strain improvement.
Use of cheaper raw materials and cost effective fermentation strategies like solid-state
fermentation can improve the economics of cellulase production. Reduction in cost of
‘‘bio-ethanol’’ may also be achieved by efficient technologies for saccharification which
includes the use of better ‘‘enzyme cocktails’’ and conditions for hydrolysis.
Cellulases are multi enzyme complexes whose synthesis and action are intricately
controlled by regulatory mechanisms in the organisms that produce these enzymes.
Majority of commercial cellulases are currently produced from a species of fungus called
Trichoderma reesei. The enzymatic hydrolysis of cellulose involves three types of
cellulase activities (cellobiohydrolases, endoglucanases and β-glucosidases) working in
synergy (Lynd et al, 2002). Endoglucanases (EC 3.2.1.4) randomly cleave the β-1,4
glycosidic linkages of cellulose; cellobiohydrolases (EC 3.2.1.91) attack cellulose chain
ends to produce the cellobiose (a dimer of glucose linked by a β-1,4 glycosidic bond); and
β-glucosidases (EC 3.2.1.21) that hydrolyze cellobiose into two molecules of glucose (Fig
1.1).
Fig 1.1 Enzymatic hydrolysis of cellulose schematic diagram showing cellulase synergy
Trichoderma reesei produces insufficient β-glucosidase (BGL) activity which results in
cellobiose accumulation. Cellobiose inhibits the action of cellobiohydrolases and
endoglucanase (Shewale 1982). Also the BGL from this fungus is subject to product
3
inhibition making the use of this cellulase complex less efficient. Blending of heterologus
BGL which can work at elevated glucose concentrations can improve the saccharification
efficiency of T. reesei cellulase complex (Krogh et al, 2004, Tu et al, 2006) and hence
improve the economics of bioethanol production.
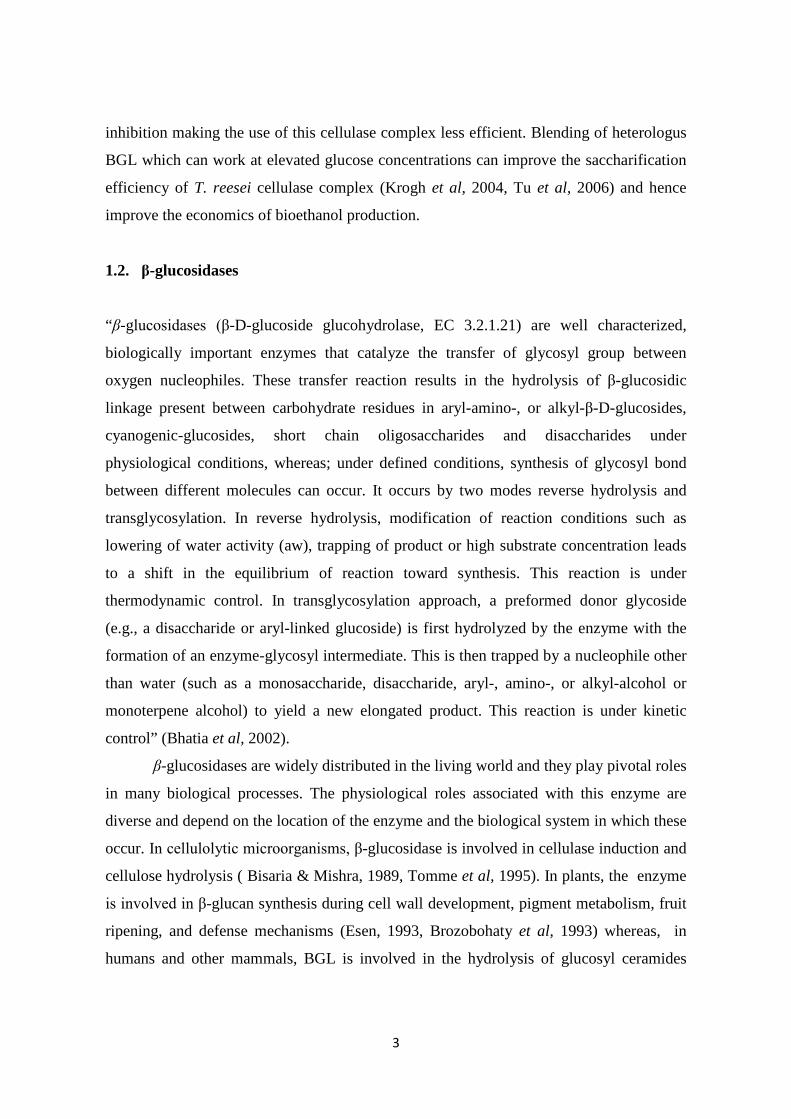
1.2. β-glucosidases
“β-glucosidases (β-D-glucoside glucohydrolase, EC 3.2.1.21) are well characterized,
biologically important enzymes that catalyze the transfer of glycosyl group between
oxygen nucleophiles. These transfer reaction results in the hydrolysis of β-glucosidic
linkage present between carbohydrate residues in aryl-amino-, or alkyl-β-D-glucosides,
cyanogenic-glucosides, short chain oligosaccharides and disaccharides under
physiological conditions, whereas; under defined conditions, synthesis of glycosyl bond
between different molecules can occur. It occurs by two modes reverse hydrolysis and
transglycosylation. In reverse hydrolysis, modification of reaction conditions such as
lowering of water activity (aw), trapping of product or high substrate concentration leads
to a shift in the equilibrium of reaction toward synthesis. This reaction is under
thermodynamic control. In transglycosylation approach, a preformed donor glycoside
(e.g., a disaccharide or aryl-linked glucoside) is first hydrolyzed by the enzyme with the
formation of an enzyme-glycosyl intermediate. This is then trapped by a nucleophile other
than water (such as a monosaccharide, disaccharide, aryl-, amino-, or alkyl-alcohol or
monoterpene alcohol) to yield a new elongated product. This reaction is under kinetic
control” (Bhatia et al, 2002).
β-glucosidases are widely distributed in the living world and they play pivotal roles
in many biological processes. The physiological roles associated with this enzyme are
diverse and depend on the location of the enzyme and the biological system in which these
occur. In cellulolytic microorganisms, β-glucosidase is involved in cellulase induction and
cellulose hydrolysis ( Bisaria & Mishra, 1989, Tomme et al, 1995). In plants, the enzyme
is involved in β-glucan synthesis during cell wall development, pigment metabolism, fruit
ripening, and defense mechanisms (Esen, 1993, Brozobohaty et al, 1993) whereas, in
humans and other mammals, BGL is involved in the hydrolysis of glucosyl ceramides

4
(Libermann et al, 2007). Due to their wide and varied roles in nature, these versatile
enzymes can be of use in several synthetic reactions as reviewed by Bhatia et al, (2002).
1.3. Microbial production of β-glucosidase
Microbial sources have been widely exploited for β-glucosidase production by both
solid-state fermentation (SSF) and submerged fermentation. There are several reports
available for β-glucosidase productions from filamentous fungi such as Aspergillus niger
(Gunata & Vallier 1999), A oryzae (Riou et al, 1998), Penicillium brasilianum (Krogh et
al, 2010) P. decumbens (Chen et al, 2010), Phanerochaete chrysosporium (Tsukada et al,
2006), Paecilomyces sp., (Yang et al, 2009) etc., though there are also various reports of
β-glucosidase production from yeasts (majority of them from Candida sp.) and few
bacteria. Submerged fermentation offers the advantage of controlled conditions such as
aeration and pH whereas, solid-state fermentation provides a cheaper alternative
production technology, as crude biomass can be employed as substrate for the production
of the metabolites. SSF imitates natural habitat of these filamentous fungi and thus are
better adapted and produces higher enzyme titers which can be directly employed for
biomass hydrolysis (Reimbault, 1998, Pandey et al, 1999). High water activity is
projected as a probable reason for high production of metabolites in SSF by
microorganisms (Pandey et al, 1999).
1.4 Differential expression of β- glucosidase isoforms
Several filamentous fungi exhibit the property of expressing different isoforms of
BGL depending on the culture conditions or carbon sources (Willick & Seligy 1985, Nazir
et al, 2010). Various isoforms of endoglucanase and β-glucosidase are reported to be
expressed in response to carbon sources in Aspergillus terreus (Nazir et al, 2010). The
sequential induction of isoforms has been associated with the presence of distinct
metabolites (Villas-Bôas et al, 2006, Panagiotou et al, 2005). As an accepted model, the
induction of the cellulases is mediated either by low molecular weight soluble
oligosaccharides that are released from complex substrates as a result of hydrolysis by
constitutive enzymes or by the products (positional isomers) of transglycosylation
reactions mediated by constituent β- glucosidase, xylanases, etc (Badhan et al, 2007).

5
These metabolites enter the cell and signal the presence of extracellular substrates and
provide the stimulus for the accelerated synthesis of constituent enzymes of cellulase
complex. However, this process is complex in view of the fact that many fungi and
bacteria are known to express functionally multiple cellulases/hemicellulases in presence
of different carbon sources. This multiplicity may be the result of genetic redundancy,
differential mRNA processing or post translational modification such as glycosylation,
autoaggregation or/and proteolytic digestion (Collins et al, 2005). However, the regulation
of expression of these multiple isoforms is still not clear which necessitates further
research regarding the sequential and differential expression of the isoforms. It must be
emphasized that though the regulation of cellulases is apparently mediated through
induction and repression as the two major mechanisms of controlling the expression of
these enzymes, the existence of highly specialized and complex nature of regulating the
expression of cellulases in diverse microorganisms has also been reported (Badhan et al,
2007a & b, Sánchez-Herrera et al, 2007). There may be relationship between the
metabolites present in the culture extracts and the induction of different isoforms. The
understanding about regulation would be important in designing culture conditions for
overproducing desired kind of isoforms or secondary metabolites. The structure and nature
of carbon source can also play an important role in differential induction of the enzyme
system. Culturing under submerged or solid substrate fermentation also influences the
expression of distinct isoforms.
Multiplicity of cellulases and hemicellulases is well known in the case of
filamentous fungi (Willick & Seligy, 1985, Decker et al, 2000, Nazir et al, 2010) and
probably this multiplicity is essential, considering the vast and diverse roles these enzymes
play in fungal metabolism and survival. β-glucosidase multiplicity can be attributed to the
presence of multiple genes or due to differential post transcriptional modifications (Collins
et al, 2007, Iwashita et al, 1999). Differential expression of the various BGL proteins are
reported in response to the carbon sources supplied in the medium or the conditions of
culture (Willick & Seligy 1985, Nazir et al, 2010) and could be a probable adaptation of
the fungi to respond to the changing immediate environments. This property however,
could be exploited for selective expression of a desired isoform from a fungus by
manipulating the culture conditions/carbon source carefully.

6
1.5 Classification of β-glucosidases
Beta-glucosidases are a heterogeneous group of hydrolytic enzymes and have been
classified according to various criteria. There is no single well-defined method for the
classification of these versatile enzymes. In general, two methods for their classification
appear in the literature, on the basis of (1) substrate specificity, and (2) nucleotide
sequence identity (NSI) (Henrissat and Bairoch, 1996).
Based on substrate specificity, these enzymes have been classified as (1) aryl β-
glucosidases, which act on aryl-glucosides, (2) true cellobiases, which hydrolyze
cellobiose to release glucose, and (3) broad substrate specificity enzymes, which act on a
wide spectrum of substrates. Most of the β-glucosidases characterized so far are placed in
the last category. The most accepted method of classification is by nucleotide sequence
identity scheme, proposed by Henrissat and Bairoch (1996) based on sequence and folding
similarities (hydrophobic cluster analysis, HCA) of these enzymes. HCA of a variety of
such enzymes suggested that the α-helices and the β-strands were localized in similar
positions in the folded conformation. Moreover, a number of highly conserved amino
acids were also clustered near the active site. Such a classification is expected to reflect
structural features, evolutionary relationships, and catalytic mechanism of these enzymes.
Also, the identification of the nucleophile and the putative acid-base catalyst in one
member of a family in effect identifies them in all members of the family. It is also
expected that as the size of the family increases, the residues conserved in all members of
the family usually will be important, structurally or catalytically. More sequence data and
three-dimensional structure of enzymes belonging to these families are required to confirm
this scheme. The sequence based classification is useful in characterizing the enzymes
from the structural point of view but the substrate specificity with respect to the aglycone
moiety still serves a primary, or, in some cases, the only lead in isolating and
characterizing unknown or structurally undefined glucosidases. The β-glucosidases are
mostly placed in either family 1 or family 3 of glycosyl hydrolases though these enzymes
are also found in families 5, 9 and 30 of glycosyl hydrolases (Henrissat, 1991, Cantarel et
al, 2009, Oppasiri et al, 2007) . Family 1 comprises nearly 62 β-glucosidases from
archaebacteria, plants, mammals, and also includes 6-phosphoglycosidases and
thioglucosidases. Most family 1 enzymes, also show significant β-galactosidase activity.

7
The family1 β-glucosidases are also classified as members of the 4/7 super family with a
common eight-fold β/α barrel motif (Fig1.2).
Fig 1.2. Representative structure of 4/7 super family with the eight fold β/α barrel motif.
Thermoascus aurantiacus xylanase 10A (TAX) structure showing the eight fold β/α barrel motif (Lo Leggio et al, 2001)
Here, the active site is placed in a wide cavity defined along the axis of the barrel, with a
putative acid/base catalyst located at the end of β-strand 4 and a catalytic nucleophile near
the end of β-strand 7 (Kaper et al, 2000). The 4/7 super family also includes other
enzymes like family 2 β-galactosidase, family 5 cellulases, family 10 xylanase, and family
17 barley glucanases (Jenkins et al, 1995).
“Family 3 of glycosyl hydrolases consists of nearly 44 β-glucosidases and
hexosaminidases of bacterial, mold, and yeast origin. Structural data on representatives of
GH3 are still scarce, since only three of their structures are known and only one of them
has been thoroughly characterized—that of a β-D-glucan (exo1→3, 1→4) glucanase (Exo
1) from Hordeum vulgare, which catalyzes the hydrolysis of call-wall polysaccharides.
The enzyme consists of N-terminal (α/β) 8 TIM barrel domain and a C-terminal domain of
six stranded β sandwich. The non-homologous region, a helix-like strand of 16 amino acid
residues, connects the two domains” (Bhatia et al, 2002). The catalytic center is located in
the pocket at the interface of the two domains. Asp285 in the N-terminal domain acts as a
catalytic nucleophile, while Glu491 in the C-terminal domain acts as a proton donor
(Varghese et al, 1999).

8
1.6 Cloning of β-glucosidase genes
“The β-glucosidase genes from a large number of bacterial, mold, yeast, plant, and
animal systems have been cloned and expressed in both E.coli and eukaryotic hosts such
as S. cerevisiae and filamentous fungi. Cloning has been performed by two methods,
either by (1) formation of a genomic DNA library followed by selection of the
recombinant clones by screening for β-glucosidase production, or (2) starting with a
cDNA library (or a genomic library), screening of recombinant clones by specific
nucleotide probes designed from a-priori knowledge of the polypeptide sequence” (Bhatia
et al, 2002). Though fungi are known to be good producers of the enzyme, reports on
cloning of BGL from fungi are relatively low. This is mostly due to the complexities
associated with the presence of introns in their genes and due to complexities associated
with glycosylation. Nevertheless, several researchers have successfully cloned and
expressed beta glucosidases from fungi including Aspergilli (Iwashita et al, 1999, Dan et
al, 2000, Kim et al, 2007). Majority of the reports also mentions the existence of multiple
genes and gene products that are differentially expressed. Fungal genes have been cloned
and expressed mostly in eukaryotic expression systems like Trichoderma reesei (Barnet et
al, 1991), Aspergillus sp (Takashima et al, 1999), S. cerevisiae (Dan et al ., 2000), and
Pichia pastoris (Dan et al, 2000).

9
1.7 Importance of β-glucosidase in bioethanol production
The cellulolytic enzyme system secreted by the filamentous fungi Trichoderma
reesei is the one mostly used in industrial applications. The hydrolysis step converting
cellulose to glucose is recognized as the major limiting operation in the development of
processes for production of biofuels from lignocellulosic raw materials because of the low
efficiency of cellulases and their cost. Enzymatic hydrolysis of cellulose is a multistep
complex process, the last step being a homogenous catalysis reaction involving the action
of β-glucosidase on cellobiose (Lynd et al, 2002). Cellobiose is a strong inhibitor of both
cellobiohydrolases and endocellulases, and the β-glucosidase action can reduce its effect.
In addition, the produced glucose also inhibits cellulolysis, although to a lesser extent
(Dekker, 1986). Glucose at high concentration can either block the active site for the
substrate or prevent the hydrolyzed substrate from leaving (Krogh et al, 2010). The
amount of β-glucosidase-1 (BGL1) generated by T. reesei hyper-producing strains
represents a very low percentage of the total secreted proteins (Lynd et al, 2002, Herpoël-
Gimbert et al, 2008). The less abundance of BGL even under conditions of cellulase
induction and the product inhibition to which it is susceptible, limits the use of native
cellulase preparations in lignocellulosic biomass hydrolysis for alcohol production. This
limitation can be alleviated either by over expressing β-glucosidase in T. reesei or by
adding extra β-glucosidase from other sources (Kumar et al, 2008, Xin et al, 1993).
Supplementing the native T. reesei enzymatic cocktail with β-glucosidase from other fungi
is often performed to avoid inhibition of cellobiose (Xiao et al, 2004).
Glucose tolerant BGL can circumvent the problem of feedback inhibition, and if
available in an enzyme cocktail for biomass hydrolysis can improve the efficiency of
hydrolysis by shifting the equilibrium towards a higher product concentration than
otherwise achievable (Sukumaran et al, 2005). Few species of Aspergilli are known to
produce glucose tolerant β-glucosidases and some of these enzymes have been cloned and
characterized (Riou et al, 1998, Gunata & Vallier, 1999). It is expected that more of such
glucose tolerant BGLs may be prevalent in nature especially in filamentous fungi.
Isolation of such enzymes and knowledge about their properties, sequences and expression
patterns can help in design of better enzyme cocktails for biomass hydrolysis as well as in
targeted approaches for modifying the glucose tolerance of existing BGLs.

10
Commercially, the enzyme majors Genencor and Novozymes have launched a
series of cocktails of cellulolytic enzymes for biomass hydrolysis, such as Accelerase®
series of enzymes (Genecor, 2010) and the Cellic series of enzymes (Novozymes, 2010).
The advanced enzyme preparations from both the companies contain beta glucosidase
supplements indicating the importance of this enzyme in biomass hydrolysis.
1.8. Conclusions
The biochemical platform for fuel ethanol production from lignocellulosic biomass
is now limited by the prohibitive cost of cellulases. Though the commercially exploited
fungus Trichoderma produces a complete cellulolytic system, the rate limiting enzyme β-
glucosidase is produced in very less quantities. Also this enzyme is slow acting.
Supplementation of exogenous β-glucosidase to the T. reesei cellulase will enable
improvement in efficiency of biomass hydrolysis and cost reduction of biomass-to ethanol
conversion by reducing feedback inhibition and cellobiose mediated repression of
cellulases. An Aspergillus niger strain isolated at NIIST was found to secrete very high
titers of BGL which comprised of multiple isoforms of this enzyme. The enzyme
preparation was also active at 250mM glucose concentration indicating its suitability as a
supplement in the biomass hydrolyzing enzyme complex. It was therefore decided to study
the production of this enzyme, its expression, multiplicity, and properties besides its
evaluation along with T. reesei cellulase for biomass hydrolysis for ethanol production

11
1.9. Objectives and Scope of the Current Study
The scope of the present investigation was confined to the following objectives 1. Evaluation of carbon sources for BGL production by A. niger NII 08121
2. Production of BGL by A. niger NII 08121 under SmF and SSF
3. Optimization of BGL production by the fungus to improve yield
4. Studies on the differences in expression of BGL isoforms in response to carbon
sources
5. Purification of the enzyme and characterization of its properties
6. Confirmation of BGL multiplicity by cloning of BGLs belonging to glycosyl hydrolase
families 1, 3 and 5
7. Use of A. niger BGL in bioethanol production
i. Production of T. reesei cellulase, and using A. niger BGL to create biomass
hydrolyzing enzyme blends
ii. Hydrolysis of alkali pretreated rice straw by enzyme cocktails
iii. Optimization of enzyme cocktails for hydrolysis of alkali pretreated rice straw.
iv. Production of ethanol from biomass hydrolysate

Chapter 2
Materials and Methods

12
Chapter 2 Materials and Methods
2.1. Microorganisms and preparation of inoculum
The fungal cultures Aspergillus niger NII 08121 and Trichoderma reesei RUT C30
were used in this study for the production of β-glucosidase (BGL) and cellulase respectively,
and the yeast Saccharomyces cerevisiae NCIM 3288 was used for alcohol fermentation.
Aspergillus niger was isolated from decaying wood at the Biotechnology division of NIIST
and identified by the Microbial Type Culture Collection (MTCC), Chandigargh, India.
Trichoderma reesei RUT-C30, was a kind gift from Prof George Scakacs, Technical
University of Budapest, Hungary and Saccharomyces cerevisiae NCIM 3288 was procured
from National Collection of Industrial Microorganisms (NCIM), Pune, India
Fungal cultures were inoculated on Potato Dextrose Agar slants and were incubated at
30oC. The fully sporulated slants obtained after three days in case of A. niger and five days in
case of T. reesei were either used immediately or stored at 4 °C for short term preservation.
Both cultures were also deposited in NII culture collection centre at NIIST. For preparing the
spore inoculum, sterile distilled water containing 0.05% (w/v) Tween-80 was added to the
slants and the spores were dislodged into it by gentle pipetting under aseptic conditions. The
suspension was recovered by aspiration and transferred to sterile 15ml tubes. The suspension
was appropriately diluted with sterile distilled water containing 0.05% Tween-80 to obtain the
required spore count. Spore counts were done under a phase contrast microscope using a
hemocytometer. One milliliter of this spore suspension was used to inoculate the medium. In
case of submerged fermentation (SmF), the medium was inoculated with 107 spores per
100ml.
S. cerevisae was grown in YEP broth (Himedia, India) for 12h with 180 rpm agitation
on rotary shaker and the culture was used at 10% v/v as inoculum for alcohol fermentation.

13
2.2 Medium preparation
2.2.1 Solid State Fermentation (SSF)
Wheat bran (WB) was used as substrate for SSF. WB purchased locally from a flour
mill was dried overnight at 60 °C in a hot air oven to remove moisture. Five grams of the
substrate was weighed into 250 ml Erlenmeyer flasks and was moistened with a specific
amount of mineral salt medium. Distilled water was added in addition to the medium to attain
the appropriate initial moisture content wherever applicable. The basal mineral salts solution
used for the experiment for β-glucosidase production had following composition in g/l: Urea -
0.3, (NH4)2SO4 - 1.4, KH2PO4 - 0.4, MgSO4.7H2O - 0.3, Peptone - 0.75, Yeast extract - 0.25,
FeSO4.7H2O - 0.05, MnSO4.7H2O - 0.01, ZnSO4.7H2O - 0.01, CoCl2 - 0.01 (Mandels &
Weber, 1969). The basal medium used for cellulase production by T. reesei had the following
composition in g/l- KH2PO4 - 0.5%, NH4NO3 - 0.5%, MgSO4.7H2O - 0.1%, Peptone - 0.1%,
NaCl - 0.1% and CaCl2 - 0.05%. Trace elements: FeSO4.7H2O - 0.005%, MnSO4.7H2O -
0.001%, ZnSO4.7H2O - 0.001% and CoCl2 - 0.0002%. The pH of the media was adjusted
with 1N HCl or 1N NaOH wherever required. The moistened bran was mixed well and was
sterilized by autoclaving at 121 °C for 15 min at 15lbs pressure.
2.2.2 Submerged Fermentation (SmF)
Mandel and Weber medium added with 1% of an additional carbon source were used
for the production of β-glucosidase. Hundred milliliters of medium was taken in 500ml
Erlenmeyer flasks and sterilized by autoclaving at 121 °C, 15lbs pressure for 15 min.
2.3 Enzyme Production and Extraction
2.3.1. Solid State Fermentation
Medium prepared for SSF was inoculated with 1ml of either A. niger or T. reesei spores
suspension containing the desired number of spores. The contents were mixed thoroughly and
were incubated under controlled conditions of temperature and humidity. Incubation was

14
continued for the duration indicated in the experimental designs and at the end of incubation
period, enzyme was recovered by extraction with 100ml of 0.05M citrate buffer (pH 4.8).
The buffer was added to each flask and the flasks were kept on a rotary shaker for 1h at 200
rpm, after which the entire slurry was recovered and was filtered using glass wool. The
filtered solution containing enzyme was centrifuged at 6000 rpm for 10min at 4 °C to remove
debris and was filtered again using 1.6µm glass microfiber filters (Whatman® GF/A). This
filtrate was used as the crude enzyme preparation.
2.3.2. Submerged fermentation
Mandel and Weber medium inoculated with the specified amount of spores were incubated
for 96 hours at 30°C on an incubated shaker at 180 rpm agitation. At the end of fermentation,
biomass was separated by centrifugation at 6000 rpm for 10 min at 4 °C, followed by
filtration using 1.6µm glass microfiber filters (Whatman® GF/A) and the supernatant was
used as the crude enzyme preparation.
2.4 Analytical Methods
2.4.1 Enzyme assays:
2.4.1.1. β-glucosidase (BGL) assay:
β-glucosidase assay was performed using p-nitrophenyl β-D glucopyranoside (pNPG)
(Sigma-Aldrich, India) as substrate as specified in Ghose & Bisaria (1987). Appropriately
diluted enzyme sample of 0.5ml was incubated with 0.5ml of 10mM pNPG in citrate buffer
(0.05M, pH 4.8) and 1ml of citrate buffer (0.05M, pH 4.8) at 40 °C for 15 min. The reaction
was terminated by adding 2ml of 0.2M Na2CO3 solution. Appropriate blanks devoid of
enzyme or substrate were also run in parallel to the enzyme assay. The color developed due to
liberation of p-Nitrophenol (pNP) was read in a UV-Visible spectrophotometer (Shimadzu,
Japan) and the amount of pNP liberated was calculated by comparing the reading corrected
for blanks against a standard curve generated using varying concentrations of pNP. One unit
of BGL activity was defined as the amount of enzyme needed to liberate 1µM of p-
nitrophenol (pNP) per minute under the standard assay conditions and was expressed in units

15
per gram dry substrate (U/gDS), in the case of SSF or as units per milliliter (U/ml) in the case
of submerged fermentation. For measurement of glucose tolerance, glucose was added in the
assay mixture to a final concentration of 0.25M and assays were performed exactly as above.
Glucose tolerance was expressed as percentage of activity compared to assay performed
without glucose and was expressed as % Activity Retention.
2.4.1.2 Cellulase Assay
Total cellulase activity was measured using the filter paper assay according to IUPAC
(Ghose, 1987). A rolled Whatman # 1 filter paper strip of dimension 1.0 x 6 cm (~50mg) was
placed into each assay tube. The filter paper strips were saturated with 0.5 ml of Na-citrate
buffer (0.05M, pH 4.8) and were equilibrated for 10 min at 50 °C in a water bath. Half
milliliter of an appropriately diluted (in Na-citrate buffer -0.05M, pH 4.8) enzyme was added
to the tube and incubated at 50 °C for 60 minutes. Appropriate controls were also run along
with the test. At the end of the incubation period, each tube was removed from the water bath
and the reaction was stopped by addition of 3ml of DNS reagent. The tubes were incubated
for 5 min in a boiling water bath for color development and were cooled rapidly by
transferring into a cold water bath. The reaction mixture was diluted appropriately and was
measured against a reagent blank at 540nm in a UV-VIS spectrophotometer (Shimadzu,
Japan). The concentration of glucose released by different dilutions of the enzyme was
determined by comparing against a standard curve constructed similarly with known
concentrations of glucose. Filter Paper Activity (FPA) was calculated following the concept
that 0.37 FPU of enzyme will liberate 2mg of glucose under the above assay conditions and
was expressed as Filter Paper Units (FPUs)
2.4.1.2 Endo Glucanase (CMCase) Activity
Endoglucanase activity was determined as outlined above for filter paper assay but
using Carboxy Methyl Cellulose as substrate (0.5ml of a 2% Na-CMC solution in citrate
buffer [0.05m, pH4.8]) instead of filter paper (Ghosh, 1987). The concentration of glucose
released by different dilutions of the enzyme was determined by comparing against a standard
curve constructed similarly with known concentrations of glucose. CMCase activity was

16
calculated following the concept that 0.185 U of enzyme will liberate 0.5 mg of glucose under
the assay conditions and was expressed as U/ml.
2.4.2. Protein Assay
Protein assays were done using the Folin-Ciocalteau reagent according to Lowry’s Method
(Lowry et al, 1951) and were expressed as mg/ml.
2.4.3. Reducing sugar Estimation
Estimation of total reducing sugar in the enzymatic hydrolysate of biomass was done
by DNS method (Miller, 1959) and was expressed as mg/ml and/or mg/g biomass.
2.4.4. Estimation of Ethanol
Ethanol estimation was done by gas chromatography as outlined in NREL Laboratory
Analytical protocol # 011 (Templeton, 1994). One milliliter fermented broth was centrifuged
at 12000 rpm for 5 minutes at 4 °C and the supernatant was filtered through a 0.45µm PES
membrane (Pall, USA) before injecting into the GC. Ethanol was detected using an FID
detector kept at 250 °C. Other conditions of operation were mobile phase – N2 (30ml/min),
Column temperature – 150 °C, Injector temperature -175 °C and injection volume 1µl.
Ethanol was detected by its elution time compared against a standard sample of pure ethanol
and the concentrations were calculated based on the peak areas of known concentrations of
ethanol. Ethanol concentrations were expressed as % v/v.
2.5. Electrophoresis and Zymogram Analyses
Standard protocol for SDS and Native PAGE were employed to prepare gels with 10%
strength and were used throughout the study. Samples were concentrated using a vacuum
concentrator (Eppendorf, Germany) before loading on to the gels. Protein was estimated by
Lowry’s method and samples were normalized to contain equal protein concentration before
loading the gel in duplicates. Gels were loaded as two halves with each half containing the
same samples exactly in the same order and concentration. After completion of the
electrophoresis, the gels were washed once in distilled water and were divided into two parts

17
each corresponding to a half containing all the samples as the other one. One of the halves
was incubated with 10mM MUG solution in citrate buffer (0.05M, pH 4.8) for 10 min at room
temperature (28+/- 2 °C. The second half was treated similarly but with a substrate solution
containing 250 mM of glucose to determine the BGL activity inhibition. BGL activity was
visualized as blue –green fluorescence under long wavelength UV trans-illumination. Both
halves were photographed simultaneously using an imaging system (Syngene-GBox, UK), to
avoid differences in lighting and exposure. Differences in fluorescence intensities of bands
were measured by pixel density analyses of the photographs using the software Scion Image
® (Scion Corp, USA). Glucose tolerance of BGL bands were expressed in terms of activity
retention which was calculated as the % of fluorescence intensity remaining in the BGL
activity band in the gel incubated in presence of glucose to that in the gel incubated in MUG
without glucose.
2.6. Biomass (rice straw) pretreatment
Rice straw (RS) was procured locally. The biomass feed stock was brought to the lab and
further dried overnight at 70 °C in a hot air oven to remove residual moisture. Feed stock was
milled in a Knife mill to reduce the size prior to pretreatment. Milled feedstock with a particle
size range 100- 2000 µm was pretreated with dilute alkali. Briefly, the sample was reacted
with 0.1N NaOH for 1h at 121 °C in an autoclave. After cooling, the slurry was dewatered by
filtration using a 140 mesh nylon sieve and washed several times in tap water to neutralize the
pH followed by a final rinse in distilled water. The pretreated rice straw was air dried at room
temperature to remove moisture by spreading on paper sheets. The pretreated feed stock was
either used immediately for hydrolysis experiments or stored in airtight containers at 4 °C
until used.
2.7. Biomass saccharification Enzymatic saccharification of biomass was done by incubating 1g of pretreated biomass (rice
straw) with the T. reesei crude cellulase alone or with various enzyme cocktails containing

18
different amounts of A. niger BGL along with the T. reesei cellulase preparation. The
saccharification studies were conducted at 45 °C, in 100 ml stoppered Erlenmeyer flasks in a
total volume of 50 ml made up with 50 mM citrate buffer (pH 4.8). The flasks were agitated
at 100 rpm in a water bath shaker. Hydrolysis efficiencies were measured as the amount of
total reducing sugars liberated from biomass according to the reducing sugar assay (Section
2.4.3).
2.8. Ethanol production
Ethanol production was studied using the enzymatic hydrolysate of rice straw as the substrate
for alcohol fermentation. The rice straw hydrolysate generated by enzymatic saccharification
(section 2.8) was clarified by centrifugation at 8000 rpm for 15 min and was concentrated by
evaporation (50 °C) to reducing sugar content of either 6% or 12% w/v. Ten milliliters of the
hydrolysate was sterilized by filtration through a 0.22µm syringe filter and was inoculated
with 10% v/v of a 12h old seed culture of S. cerevisiae. Incubation was carried out in
stoppered 15ml glass vials at room temperature (28 2°C) without agitation. Samples (1ml)
were withdrawn at 24h intervals. The samples were centrifuged at 13000 rpm for 10 min at 4
°C. The supernatant was filtered using 0.45µ syringe filter and the ethanol content was
analyzed by gas chromatography (Section 2.4.4).

i
Chapter 3
Fermentative Production of β-Glucosidase

19
Chapter 3 Fermentative production of β-glucosidase
3. Introduction
Commercial production of β-glucosidase is often achieved by use of species of Aspergilli.
Aspergilli are known to produce higher titers of the enzyme. Nevertheless, reports on large
scale production of BGL are limited. Relatively pure forms of cellulose and native as well as
pretreated biomass have been used successfully as carbon sources for production of the
enzyme under both submerged (SmF) and solid state fermentations (SSF). While submerged
fermentation is the most common strategy employed for commercial production of microbial
enzymes due to its inherent advantages of better sterility, heat and mass transfer, easiness in
process monitoring and automation etc, SSF is popular in the case of fungal fermentations for
high volume low value enzymes like amylases, cellulases etc. This is because SSF has better
productivity, low capital investment, low energy requirement, lesser waste water output,
higher product concentration, and lack of foam build up (Reimbault, 1998). However,
knowledge on process automation is limited, and there is intense heat generation in SSF
systems.
Process optimizations are essential in improving the productivity and to understand the
effect of parameters on the fermentation. In the conventional method for the optimization of
enzyme production, the “one variable at a time” approach is used, which involves changing
one parameter at a time while keeping the other entire parameters constant (Greasham &
Inamine, 1986, Chen, 1994). The optimized concentration of the previous experiment is then
incorporated in the next experiment. The same procedure is followed for all the parameters to
complete the optimization (Young et al, 1985). But this process is cost, labor and time
intensive, and also does not consider the interaction between variables. An alternative and
more efficient approach is the use of statistical methods. Several statistical methods ranging
from two factorial to multi-factorial designs are available (Monoghan & Koupal, 1989).
Placket and Burman designs (Plackett & Burman 1946) are fractional factorial designs used
when one needs to screen a large number of factors to identify those that may be important

20
(i.e., those that are related to the dependent variable of interest), In such situations a design
that allows one to test the largest number of factor main effects with the least number of
observations is desired. To enable this, the Placket and Burman design has the interaction
effects of variables confounded with new main effects. Because the added factors are created
by equating (aliasing), the "new" factors with the interactions of a full factorial design, these
designs always will have 2k runs e.g., 4, 8, 16, 32, and so on. Full factorial design is
fractionalized in a different manner, to yield saturated designs where the number of runs is a
multiple of 4, rather than a power of 2.
In an experimental procedure for studying the effects of process parameters
(independent variables) under question, the selection of high (1) and low (-1) values of the
variable is very critical (Greasham & Inamine, 1986). The difference between the levels of
each variable must be large enough to ensure that the optimum response will be included.
After performing the experiments, the responses obtained are analyzed statistically to
determine the effect of that variable on the response, experimental errors and the significance
of the influence of each variable on the response (Nelson, 1982). The effect of a variable is
the difference between the average response of that variable at higher and lower levels.
Probability tests are run to determine the level of significance of the effects of each variable.
The design of experiments and analyses of responses are now routinely done using software
made for the purpose eg – Statistical (Statsoft Inc, USA), Design Expert (Stat-Ease, USA) etc.
A filamentous fungus capable of producing moderately glucose tolerant beta
glucosidase was isolated at NIIST and was identified as Aspergillus niger (MTCC 7956 /NII
08121). The objective of present study was to determine the effect of carbon sources in
production of beta glucosidases by this fungus under SmF, and also to identify and optimize
the production of BGL under SSF using a fractional factorial (Plackett & Burman) experiment
design.

21
3.1 Materials and Methods
3.1.1 Screening of Carbon sources for BGL production
The effect of carbon sources on BGL production by A. niger NII 08121 and the level of
glucose tolerance of the enzyme secreted by it was studied under SmF by incorporating the
carbon sources in enzyme production medium. Mandel and Weber medium with composition
as given under section 2.2.1 was used with supplementation of one the carbon sources -Wheat
bran, Rice straw, Glucose, Lactose and Cellulose at 1 % (w/v) level. Enzyme production and
extraction was carried out as outlined under section 2.3.2. Enzyme assays were conducted to
determine the activity and glucose tolerance of each sample as indicated in section 2.4.1.1.
3.1.2 Bioreactor studies
Bioreactor studies for BGL production were done using a parallel fermentation system
with six 1L vessels (Infors HT, Switzerland). Three reactors were operated in parallel for
each BGL production experiment, each containing 350 ml of medium. The DO level was set
at 60% and rpm was set in the range 100- 600/min to be operated in cascading mode (Fig 3.1).
The culture was aerated at 0.5 vvm level using compressed air passed through a sterile
0.22µm filter. 1N HCl and 1N NaOH was used for maintaining the pH 4.8 and heat sterilized
silicone oil was used for foam control. The reactors were inoculated with 2 x 10⁵ spores/ml.
Operating temperature was maintained at 30°C. After 96h of cultivation, the fermentation
broth was recovered and biomass was separated by centrifugation at 8000 rpm for 15 min,
followed by filtration using a 1.6 µm pore glass microfiber filter (Whatman ® GF/A). Control
experiments were run in shake flasks under similar conditions but with 180 rpm agitation and
without control for pH and DO.

22
Fig 3.1: Reactor setup for SmF production of BGL using A. niger
3.1.3. Optimization of the SSF production of BGL by A. niger
Solid State Fermentation production of BGL was done as outlined under section 2.3.1.
A Plackett and Burman (Plackett & Burman, 1946) design was employed to determine the
effect of individual parameters affecting BGL production by the fungus under SSF. The
composition of mineral salt solution used for wetting the substrate and the important physical
parameters affecting enzyme production were screened in a design with 7 variables at two
levels in a total of 8 experimental runs (Table 3.1).
Table 3.1: Plackett & Burman design matrix for the optimization of variables influencing BGL production
Std Order X1 X2 X3 X4 X5 X6 X7
1 -1 -1 -1 1 1 1 -1 2 1 -1 -1 -1 -1 1 1 3 -1 1 -1 -1 1 -1 1 4 1 1 -1 1 -1 -1 -1 5 -1 -1 1 1 -1 -1 1 6 1 -1 1 -1 1 -1 -1 7 -1 1 1 -1 -1 1 -1 8 1 1 1 1 1 1 1

23
The parameters tested were: Incubation time, Peptone concentration, Initial moisture content
of the medium, Concentrations of Urea, Lactose, Tween 80 and Incubation temperature. The
variables were tested at two levels: a higher level designated as +1 and a lower level
designated as -1. The actual and coded values tested for each parameter are given in Table
3.2.
Table 3.2: Actual levels of variables tested with the factorial design and their effects on BGL production
Code Parameter name Low level (-1)
High Level (+1)
X1 Incubation time (h) 96 144 X2 Peptone (g/L) 1 3 X3 Initial moisture (%) 50 70 X4 Urea (g/L) 0 2 X5 Lactose (g/L) 0 1 X6 Tween 80 (g/L) 1 3 X7 Temp of Incubation (oC) 27 32
Experimental runs were performed according to the design and the response (Enzyme
activity) was recorded. A factorial model was fitted for the main effects using Design Expert
software (Statease Corp, USA). The effects of individual parameters on BGL production was
calculated by the following equation (Eqn.1)
ε = (Σμ+ - Σ μ -)/n (1)
Where ε is the effect of parameter under study and “μ+” and “μ-”are responses (BGL activity)
of trials at which the parameter was at its higher and lower levels respectively and “n” is the
total number of trials. Analysis of variance (ANOVA) was performed on the data to determine
the significance of fitted model and to test the significance of the effect of individual
parameters on BGL production. The most significant parameters affecting BGL production
and the best combination and levels of parameters for improved production were identified

24
3.2 Results and discussion
3.2.1. Screening of Carbon sources for BGL production by A. niger
Among the different carbon sources (wheat bran, rice straw, glucose, lactose and cellulose)
tested in SmF, maximal BGL activity was obtained with Wheat Bran (128 U/ml) followed by
Rice straw, Glucose, Lactose and Cellulose (Figure 3.2). Similar levels of BGL production
was observed when the carbon sources other than Wheat Bran (WB) were used.
Fig 3.2: Effect of carbon sources on BGL production by A. niger
Carbon Source (1% w/v)
Wheat bran Rice straw Glucose Lactose Cellulose
BGL
Activ
ity (U
/ml)
0
20
40
60
80
100
120
140BGL Activity (U/ml)
% A
ctiv
ity R
eten
tion*
0
5
10
15
20
25
% Activity Retention
[* % Activity retention is the amount of activity retained by the enzyme while assayed in presence of 0.25M glucose in comparison to a control experiment where the assay in conducted without glucose]
Wheat bran is a crude substrate that contains proteins, cellulose, starch and minerals and these
nutrients can apparently promote enhanced growth and consequently enzyme production.
High productivity in crude biomass could also be due to the dual role of biomass as a nutrient
source and a support matrix for fungal adherence. A. niger mycelia had grown as spherical
beads in the shake flaks culture and the size of the beads were also different with the different
carbon sources studied. With the simpler sugars and pure cellulose the mycelia beads were
comparatively larger than those in wheat bran or rice straw medium. The latter two carbon
sources are particulate in nature which would result in increased turbulence while mixing.

25
This in turn aids in better aeration as well as breakage of large pellets. Smaller pellet size in
improved mass transfer due to an increased surface.
The comparative lack of BGL production in the presence of glucose may be because;
glucose is a catabolite repressor of many cellulase genes or due to the inhibitory effect of
glucose on BGL activity (Gulati & Mahadevan, 2000). The growth of fungi on mineral salt
medium containing glucose generally represses cellulase activity and only after depletion of
glucose, the fungi resume production of the enzyme (Jørgensen et al, 2004).
Differences were also apparent in the glucose tolerance of the enzyme recovered from
cultures grown in the different carbon sources. The difference in activity retention in presence
of glucose for the enzymes prepared in different media could be due to the differences in
expression of multiple BGL proteins since it is known that multiple isoforms of BGL is
present in Aspergilli and a few of them are reported to be glucose tolerant (Gunata & Vallier,
1999, Decker et al, 2000). The properties of substrate can determine the type and level of beta
glucosidase expression (Roy et al, 1988, Perez-Pons et al, 1995). In a different context, the
expression of BGL proteins were studied (Chapter 4) which confirmed the presence of
multiple isoforms of the enzyme in A. niger NII 08121 that were expressed differently in
response to the carbon source in the medium. It was also demonstrated that at least one of the
isoforms is glucose tolerant. The possibility of driving the expression of an isoform of the
enzyme to larger extent by modulating the carbon source opens up great possibilities in
enzyme production for biomass hydrolysis since glucose tolerance is a highly desired feature
for BGLs to be used in biomass saccharification.
3.2.2. β- glucosidase production under SmF in Bioreactor
A. niger is known to produce higher levels of metabolites under controlled conditions
of pH and aeration (Liu et al, 2003, Znad et al, 2004). So BGL production was tried either
wheat bran or lactose as substrate in a bioreactor (Infors, Switzerland, See 3.2.1).
Fermentations were carried out for 96h and the BGL activities obtained were compared with
that obtained in shake flask cultures run in parallel, under similar conditions. BGL activities
obtained under unregulated conditions (Shake flasks) when compared with those where pH

26
and DO levels were regulated, were higher. Also the enzyme produced by shake flask
cultivation had better glucose tolerance (Fig 3.3). One of the reasons for this observation is
the mechanical breakage of fungal mycelia by the impellers which resulted in a comparatively
lower biomass and hence lower enzyme yield. Though the initial growth of mycelia were
faster in the bioreactor, this also resulted in a faster depletion of DO causing the reactor to
cascade to a higher rpm which had proved deleterious of the fungus. So it would be safe to
assume that A. niger cultivation at larger scales in STR’s needs to be approached with caution
and extreme care needs to be taken in maintaining the correct mixing levels and DO.
Alternatively, other reactor configurations like membrane reactors (Chang et al, 1990), airlift
reactors (Park et al, 1994) or tubular reactors (Papagianni et al, 2003) may be employed.
Fig 3.3: Comparison of BGL production and glucose tolerance
in shake flasks and bioreactor
Fermentation system/C Source
Lactose SF Lactose BR WB SF WB BR
BGL
Activ
ity (U
/ml)
0
50
100
150
200BGL Activity (U/ml)
% A
ctiv
ity R
eten
tion*
0
2
4
6
8
10
12
14
16
% Activity Retention
[ * % Activity retention is the amount of activity retained by the enzyme while assayed in presence of 0.25M glucose in comparison to a control experiment where the assay in conducted without glucose]
BGL production by A. niger was less when lactose was used as carbon source which
was surprising since lactose is a known inducer of cellulases and is employed in production of
cellulases (Sehnem et al, 2006, Fang et al, 2008). Morikawa et al (1995), had proposed a
mechanism of cellulase induction in T. reesei by lactose where they had proposed that lactose
alone is not an effective inducer and it can promote cellulase production only when it is taken
inside the cell. The role of a putative lactose permease which is inducible by other sugars like

27
sophorose was also proposed. Assuming that a similar mechanism is operational in A. niger,
wheat bran could have provided enough carbon source that the induction of the permease was
probably not necessary which could explain the reduced BGL production.
3.2.3. Optimization of the SSF production of BGL by A. niger NII 08121
To determine the important parameters which significantly affect BGL production by A.
niger NII 08121 on wheat bran under SSF, a Plackett–Burman design was used. Seven
variables were screened in 8 experimental runs. The results of the runs based on the Plackett
and Burman design showed a variation in BGL production ranging from 22100 U/gds to
29560 U/gds (Table 3.3). This variation shows the importance of optimizing these parameters
for improving BGL production by A. niger on wheat bran
Table 3.3: BGL yields for experimental runs performed according to the Placket and Burman design matrix
Std
Order X1
Time (h)
X2 Peptone
(g/L)
X3 Moisture
(%)
X4 Urea (g/L)
X5 Lactose
(g/L)
X6 Tween 80
(g/L)
X7 Temp (oC)
Y BGL activity
(U/gDS)
1 96 1 70 2.0 0.0 1 32 29560 2 144 3 50 2.0 0.0 1 27 25720 3 144 1 50 0.0 0.0 3 32 25240 4 96 3 70 0.0 0.0 3 27 27760 5 96 3 50 0.0 1 1 32 23580 6 144 3 70 2.0 1 3 32 26060 7 144 1 70 0.0 1 1 27 22100 8 96 1 50 2.0 1 3 27 23020
The average effect of the variables at their assigned levels on BGL production was calculated.
The difference between average response of each factor at level +1 and -1 indicates the
relative influence of their effect. The magnitude of the value indicates the relative extent of
their influence while the direction (the sign of the value either + or -) indicates whether the
28
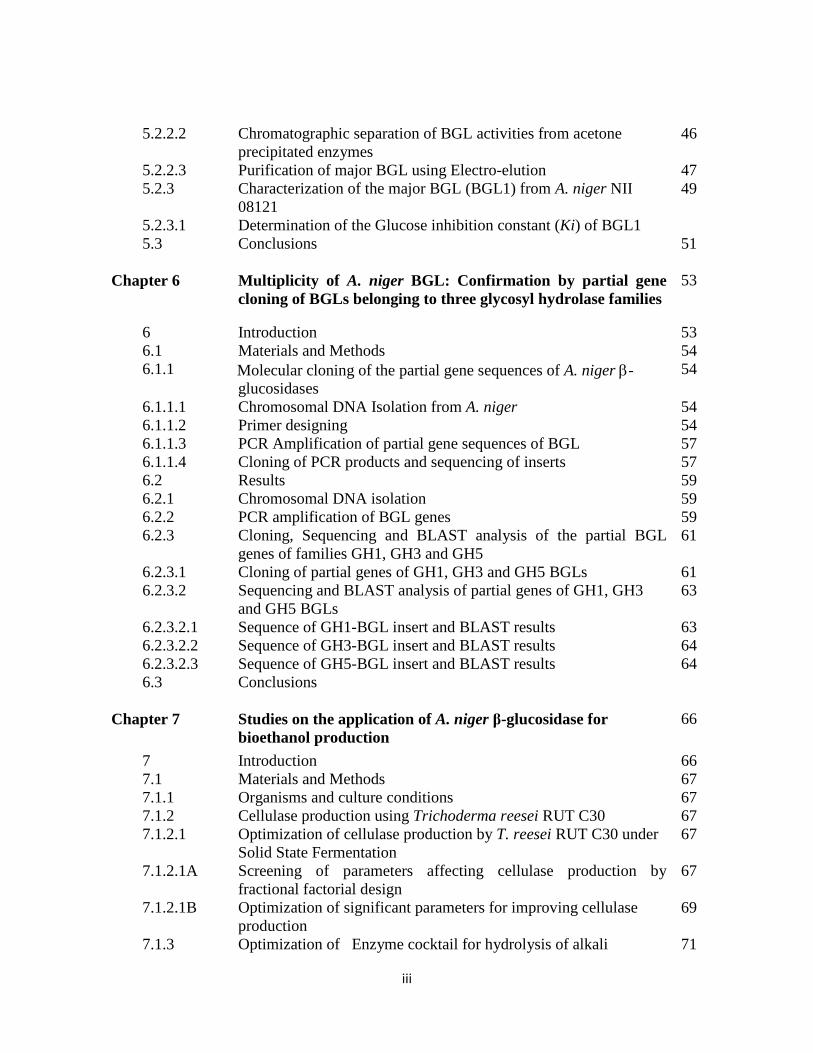
change from level -1 to +1 resulted in an increase or decrease in the response. The results
obtained for the calculation of effects is given in Figure 3.4
Figure 3.4: Estimated effect of process parameters on BGL production by A. niger
The parameters with largest effects were Lactose concentration, initial moisture
content and incubation temperature. Lactose influenced BGL production negatively while the
other two has a positive effect.
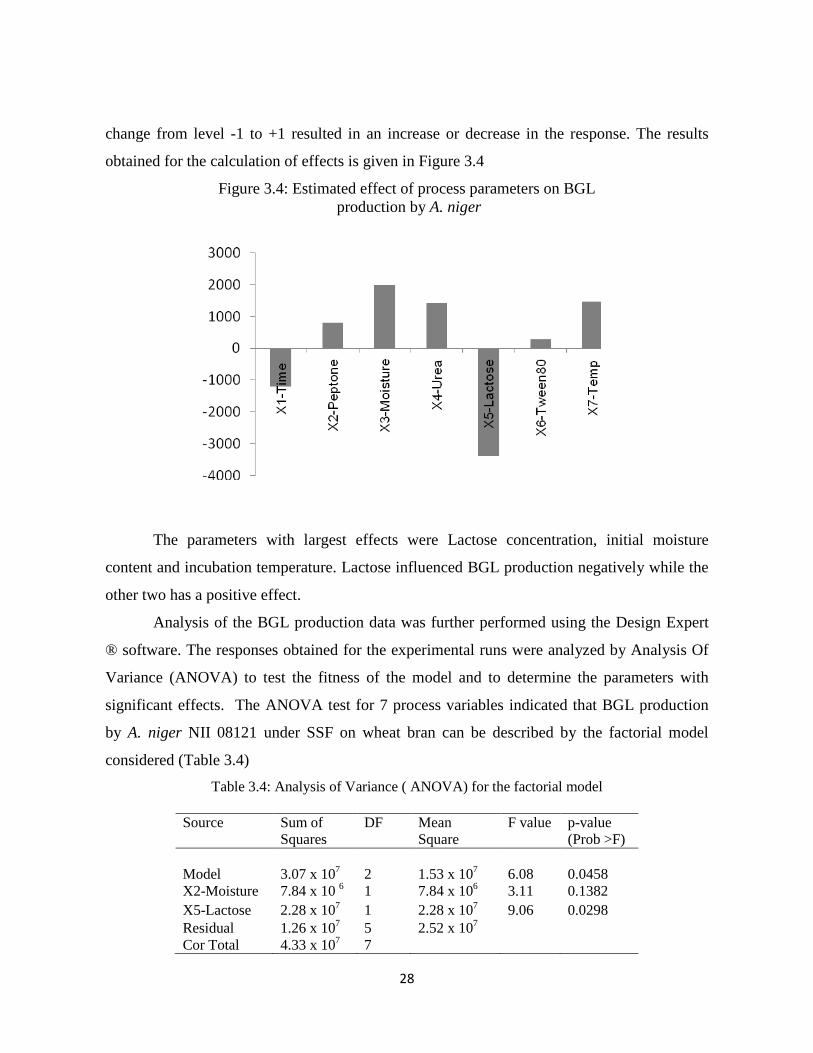
Analysis of the BGL production data was further performed using the Design Expert
® software. The responses obtained for the experimental runs were analyzed by Analysis Of
Variance (ANOVA) to test the fitness of the model and to determine the parameters with
significant effects. The ANOVA test for 7 process variables indicated that BGL production
by A. niger NII 08121 under SSF on wheat bran can be described by the factorial model
considered (Table 3.4) Table 3.4: Analysis of Variance ( ANOVA) for the factorial model
Source Sum of
Squares DF Mean
Square F value p-value
(Prob >F) Model 3.07 x 10⁷ 2 1.53 x 10⁷ 6.08 0.0458 X2-Moisture 7.84 x 10 6 1 7.84 x 10⁶ 3.11 0.1382 X5-Lactose 2.28 x 10⁷ 1 2.28 x 10⁷ 9.06 0.0298 Residual 1.26 x 10⁷ 5 2.52 x 10⁷ Cor Total 4.33 x 10⁷ 7

29
The results of the ANOVA indicated that the model is significant and can be used to define
the influence of parameters on BGL production by A. niger under SSF on wheat bran. Lactose
(X5) was the only parameter to have significant influence on BGL production with a p value
of 0.0298.
The variables X2 (initial moisture of the medium), X5 (Lactose concentration), were
included in the model. Coefficients of the model terms were calculated using design expert
software and is given in Table 3.5.
Table 3.5: Coefficients of variables included in the model
Model Term Co-efficient estimate
β0 25380 X2 990 X5 1690
β0 is the overall interaction coefficient
The equation representing the model was derived as
Y = 25380 + 990X2 - 1690X5
Where
Y = BGL yield
X2 = Initial moisture content
X5 = Lactose concentration in the medium
Lactose was the only significant model term and this was having negative impact on β-
glucosidase production. Wheat bran itself is a rich source of nutrients and can support the
growth and nutrition of microorganisms. The effect of other parameters could be influenced
significantly or even masked by the dominating influence of wheat bran. Nevertheless, the
production level was increased from 22100 U/gds to 29560U/gds which is considerably high.
The combinations of process variables that would give high BGL yields were derived by
solving the model equation using the numerical optimization function in Design Expert®.
Three combinations identified by the software are given in Table 3.6

30
Table 3.6: Optimal combinations of variables predicted for improved BGL yield and expected enzyme yields
Sl # Time
(h) Peptone (g/L)
Moisture (%)
Urea (g/L)
Lactose (g/L)
Tween80 (g/L)
Temp (oC)
Expected BGL yield
1 120 0.20 70.00 0.10 0.00 0.20 30 28060 2 120 0.20 70.00 0.10 0.00 0.20 30 27974 3 120 0.20 69.04 0.10 0.00 0.20 30 27964
3.3. Conclusions
SSF and SmF both offer several advantages over each other and each of these fermentation
techniques also have their own limitations. The studies done on screening of carbon sources
identified that wheat bran can serve as a cheap and effective substrate for BGL production by
A. niger NII 08121. For bio-fuel applications, BGL produced by SSF would be more
appropriate as production titers are very high compared to SmF. Also the crude enzyme may
be utilized without any purification for hydrolysis along with other cellulases for enzyme
cocktails. Wheat bran also supports good activity retention of BGL in presence of glucose
(~19 % in 0.25M glucose).

Chapter 4
Differential expression of β-glucosidase by Aspergillus niger NII-08121 in response to carbon sources

31
Chapter 4
Differential expression of β-glucosidase by Aspergillus niger NII-08121 in response to carbon sources
4. Introduction
β-glucosidases are enzymes found universally across all domains of living
organisms where they play a variety of functions (Ketudat Cairns & Esen, 2010). They are
important in plant microbe interactions and in the breakdown of plant cell wall. These
enzymes have been implicated primarily in biomass to glucose conversions or in breaking
of plant cell wall to establish parasitic or symbiotic relationships (Gilbert et al, 2008). β-
glucosidases play multiple roles in filamentous fungi, where they are involved in fungal
cell wall metabolism (Lymar et al, 1995), modification of the biological activities of self
produced or exogenous glycosides (Quiros et al, 1998, Xue et al, 1998), generation of the
inducers of cellulase genes by trans-glycosylation (Fowler et al, 1992, Mach et al, 1995),
in resistance against plant saponins (Bowyer et al, 1995, Osbourn et al 1995) etc.
Multiplicity of cellulases and hemicellulases is well known in the case of filamentous
fungi (Willick & Seligy, 1985, Dekker et al, 2000, Nazir et al, 2010) and probably this
multiplicity is essential, considering the vast and diverse roles these enzymes play in
fungal metabolism and survival. β-glucosidase multiplicity can be attributed to the
presence of multiple genes or due to differential post transcriptional modifications (Collins
et al, 2007, Iwashita et al, 1999). Differential expression of the various BGL proteins are
reported in response to the carbon sources supplied in the medium or the conditions of
culture (Willick & Seligy 1985, Nazir et al, 2010) and could be a probable adaptation of
the fungi to respond to the changing immediate environments. This property however,
could be exploited for selective expression of a desired isoform from a fungus by
manipulating the culture conditions/carbon source carefully.
A query of the A. niger genome sequence (Aspergillus niger v3, JGI, 2010)
returned several genes listed as β-glucosidase implicating the abundance and multiplicity
of the enzyme in this fungus. Also the strain under study - Aspergillus niger NII 08121
produced high titers of β-glucosidase and exhibited differences in BGL expression and
glucose sensitivity in response to different carbon sources supplemented in the medium. It
was therefore speculated that there could be differences in expression of the various BGL

32
proteins/isoforms. A. niger NII 08121 was grown under submerged fermentation,
supplementing different crude and pure carbon sources and the culture filtrates were
analyzed for the presence of different isoforms, their level of expression and glucose
sensitivity.
4.1. Materials and Methods
4.1.1. Production of BGL using different carbon sources under SmF
Studies were carried out under submerged fermentation using the basal mineral
salt medium (Mandels & Weber, 1969) supplemented with one of the different carbon
sources – ie -wheat bran, rice straw, glucose, lactose or cellulose at 1% w/v concentration.
Erlenmeyer flasks (500ml) containing 100 ml of the medium with appropriate carbon
source was prepared and sterilized as outlined under section 2.2.2. Each flask was
inoculated with 1ml of a spore suspension containing 107 spores (Section 2.1) and was
incubated for 96h at 30 °C in a refrigerated incubator. Enzyme preparation was done
according to section 2.3.2.
The crude enzyme samples were concentrated 10 fold by vacuum evaporation
before being analyzed for the presence of BGL isoforms. β-glucosidase assay was done
for the concentrated samples according to the method outlined under section 2.4.1.1. One
unit of BGL activity was defined as amount of 4-nitrophenol (in µM) released per ml of
enzyme per minute under the standard assay conditions.
4.1.2. Detection of BGL protein isoforms by PAGE and Activity staining
BGL isoforms produced by the fungus in media supplemented with the different
carbon sources were visualized on poly acrylamide gels by activity staining. The crude
enzyme preparation was concentrated by a centrifugal concentrator and zymogram
analyses were performed as described in section 2.5. Native PAGE (10%) was run with
the same amount of protein from each sample loaded on to the wells. Sample loadings
were duplicated in the same order in the same gel so as to stain one set (wells 1-4) in
absence of glucose and the other set (wells 5-8) in presence of 250 mM glucose. Activity

33
staining on electrophoresis gels was done by incubating the gels with 10mM Methyl
Umbelliferyl β-D-Glucopyranoside (MUG) solution in 0.05 M, pH 4.8 citrate buffer.
While staining, all the parameters and concentration of substrate were kept constant for
both the sets with the only difference being the presence of 250 mM glucose in one.
Activity bands were visualized by illumination with long wavelength UV trans-
illumination and pictures were taken using an imaging system (Syngene-GBox, UK). Both
the sets of gel were pictured simultaneously to ensure even conditions of illumination and
exposure. Differences in fluorescence intensities of bands were measured by pixel density
analyses of the photographs using the software Scion Image ® (Scion Corp, USA).
Glucose tolerance of BGL bands were expressed in terms of activity retention which was
calculated as the % of fluorescence intensity remaining in the BGL activity band in the gel
incubated in presence of glucose to that in the gel incubated in MUG without glucose.
4.2. Results and discussion
4.2.1. Production of BGL by A. niger in media containing different carbon sources
Enzyme assays done on the concentrated enzyme samples showed that wheat bran
supported the maximum production of β-glucosidase (1400U/ml for 10X sample) followed
by rice straw, cellulose, lactose and glucose respectively (Figure 4.1). Glucose did not
support BGL production, apparently due to carbon catabolite repression which is effective
in this fungus. Cellulase genes are normally expressed at a low basal level, and the
induction or repression of the cellulose degrading enzymes in several fungi are tightly
controlled with the production of cellulolytic enzymes induced only in presence of the
substrate, and repressed when easily utilizable sugars like glucose are available (Suto &
Tomita, 2001). The growth of fungal species on mineral medium containing glucose
generally represses enzyme production, and only after glucose depletion the fungi begins
the production of BGL (Jorgensen et al, 2004). Wheat bran supported maximum
production of BGL. Wheat bran is a rich source of nutrients, containing proteins, cellulose,
starch and minerals which might help in a better growth as well as enzyme production.
Rice straw which is another crude biomass resource had supported the next higher
production of the enzyme. However with rice straw as carbon source, the glucose
tolerance of the enzyme preparation was comparatively lower. High productivity in crude

34
biomass could be due to the dual role of biomass as it provides nutrients as well as support
for the fungal adherence (Pandey et al, 1999). The fact that the glucose tolerance of
enzyme preparations produced using different carbon sources are widely different,
provides further evidence to the fact that there is a differential induction of BGL isoforms
in the fungus. The differences in percentile activity retention in presence of glucose might
be due to the differences in the amount of glucose tolerant isoform in the preparation
which in turn is due to the differences in expression of the protein. This speculation was
tested by monitoring the level of expression of the different isoforms using zymogram
analysis.
Figure 4.1: BGL production and its activity retention in response to different carbon sources
Carbon Source (1% wt/v)
Whe
at b
ran
Rice
stra
w
Glu
cose
Lact
ose
Cellu
lose
BGL
Activ
ity (x
10
-1 U
/ml)
0
200
400
600
800
1000
1200
1400
1600
BGL activity
% A
ctivi
ty R
eten
tion*
0
5
10
15
20
25
Glucose Tolerance
[ * % Activity retention is the amount of activity retained by the enzyme while assayed in presence of 0.25M glucose in comparison to a control experiment where the assay in conducted without glucose]
4.2.2. Differential expression of BGL protein in response to carbon sources
Zymogram analysis showed the presence of 4 different bands showing BGL
activity in enzyme samples produced using lactose and cellulose which are known
inducers of cellulases in fungi (Fig 4.2, Lanes 3 & 4). Three of the low molecular weight
bands were visible only in these two samples whereas the high molecular weight band was
visible in samples produced on all different carbon sources. Also this was the BGL
isoform which was highly expressed, as evident from the high band intensity (Fig 4.3 &

35
Table 4.1). Activity staining done in presence of 250mM glucose showed that the two low
molecular weight isoforms retained their activity in presence of glucose. These BGL bands
in case of lactose induced sample, showed activity retention of 95% and 83% respectively
on the basis of pixel density analysis (Table 4.1)
Figure 4.2. Differential induction of BGL in response to different carbon sources
Lane Information 1&5 Sample produced in WB as
C source 2&6 Sample produced in RS as
C source 3&7 Sample produced in
Lactose as C source 4&8 Sample produced in
Cellulose as C source 1-4 Staining done without
glucose 5-8 Staining done in presence
of 0.25M glucose
[* Zymogram of BGL was prepared as described under section 2.5. The image was inverted for better clarity and to aid in pixel density analysis] Figure 4.3: Pixel density analysis of the activity bands obtained by MUG staining of BGL produced using lactose as carbon source
Pixel density analysis of the enzyme sample produced using lactose medium in presence (Lane7, Fig 4.2) and absence (Lane 3, Fig 4.2) of glucose. Area under each peak corresponds to the pixel densities (intensity of bands) and the values are indicated on the respective peaks.

36
Table 4.1. Glucose tolerance of BGL isoforms produced in lactose medium
V Lane No. / Band No. > 1 2 3 4
3 (Glucose-) 10144 788 2217 1667
7 (0.25M Glucose) 1694 0 2105 1380
Glucose Tolerance (% Activity retention) 16.7 0 94.9 82.8
It may thus be assumed that the lower two bands correspond to glucose tolerant BGLs and
the expression of these are induced more by lactose compared to other carbon sources
used in the medium. Lactose is known to induce BGL production in some fungi (Abdel
Fattah et al, 1997). It supports the glucose tolerant BGL production and it is utilized in the
commercial production of the enzyme owing to economic considerations (Sukumaran et
al, 2005). The mechanism of lactose induction of BGL however, is not fully understood
(Fekete et al, 2008).
It is generally believed that oligosaccharides play an important role in regulating
the synthesis of wood-degrading enzymes which includes BGL (Hrmova et al, 1991,
Schmoll & Kubicek, 2003) and oligosaccharides has been proved to be converted to
inducer (such as sophorose and gentiobiose) by transglyosylation (Suto & Tomita, 2001,
Kubicek, 1987). As an accepted model, the induction of the cellulases is mediated either
by low molecular weight soluble oligosaccharides that are released from complex
substrates as a result of hydrolysis by constitutive enzymes or by the products (positional
isomers) of transglycosylation reactions mediated by constituent β-glucosidase, xylanases,
etc. (Badhan et al, 2007a). Also, the effect of the growth environment manifests itself
markedly in the type of carbohydrate metabolism of heterotrophic microorganisms. Nature
and quantity of the excreted metabolites is dependent on the nature of the growth
limitations and carbon source (Neijssel, 1979).
A. niger, thus produced four different BGL proteins when induced with different
carbon sources of which the high molecular weight activity band was the most highly
expressed β-glucosidase. This β-glucosidase designated as BGL1 was the major BGL
protein which was responsible for a very significant percentage of the total BGL activity
of all samples. Sequential induction of isoforms have been associated with the presence of

37
distinct metabolites which has direct or indirect bearing on biomass degradation (Villas-
Bôas et al, 2006, Panagiotou et al, 2005). The changed profiles of the metabolites during
culture might be important in differential expression of enzymes and vice versa. The
different BGL isoforms induced differentially may be assumed to belong to different
glycosyl hydrolase families especially glycosyl hydrolase families 3, 5 and 1 since most of
the biomass active glycosyl hydrolases are grouped in these families. Chapter 5 deals with
the studies which confirm the presence of β-glucosidase belonging to above mentioned
GH families.
4.3 Conclusions
Aspergillus niger NII 08121 exhibited differences in expression of β-glucosidase (BGL) in
response to different carbon sources. Among four isoforms of BGL expressed using
lactose as carbon source, two isoforms were found to retain of 92% and 82% activity
respectively in presence of glucose indicating that they are at least moderately glucose
tolerant. The study provides conclusive evidence to the fact that multiple BGLs are
expressed in A. niger differentially in response to the carbon source provided in the culture
medium. Carbon source and other components play an important role to direct the
metabolic pathway of A. niger towards production of a desired metabolite. Careful
leveraging of the medium components could be useful for enhanced production of specific
BGL isoforms in the fungus.

Chapter 5
Purification and characterization of the major BGL (BGL1) from Aspergillus niger NII 08121

38
Chapter 5 Purification and characterization of the major BGL (BGL1) from
Aspergillus niger NII 08121 5. Introduction
Purification of enzymes is essential for detailed studies on their properties. Also it is
essential when a pure enzyme is needed for a given target application. In general, the method
of purification involves concentration of the enzyme sample followed by separation of
different proteins which is done by chromatographic techniques. Several researchers have
successfully purified beta-glucosidases from Aspergilli and have established their
characteristics. Notably Gunata & Vallier (1999) had reported the production of glucose
tolerant beta glucosidases from Aspergillus niger and Aspergillus oryzae. They had reported
the purification of two BGLs from A. oryzae and the major protein was strongly inhibited by
glucose. The minor protein was glucose tolerant with a Ki of 0.95M but was expressed only in
minor quantities. The molecular mass determined for the minor BGL was 30KDa, whereas
this was 80KDa for the major BGL. While Gunata & Vallier (1999) employed ultra-filtration
followed by gel permeation chromatography, Riou et al (1998) had used ammonium sulfate
fractionation, followed by gel permeation and ion exchange chromatography to purify BGLs
from Aspergillus niger. Other methods including affinity chromatography (Watanabe et al,
1992) and aqueous two phase partitioning (Johansson & Reczey, 1998), have also been used
for purification of BGLs from Aspergilli. It is now an established fact Aspergillus produces
different BGL and at least two BGLs are secreted by the fungus one which is highly
expressed but with lower glucose tolerance and the second which is glucose tolerant but
produced in lower quantities. It is also observed that the major BGL has a higher molecular
weight while the glucose tolerant enzyme has a low molecular weight (Woodward &
Wiseman, 1982, Kwon et al, 1992, Gunata et al, 1993, Riou et al, 1998). Characterization of
the glucose inhibition constant (Ki), and the temperature and pH optima of BGLs are
important in view of assessing their suitability in biomass hydrolysis. A BGL that is better
tolerant to glucose and capable of acting at elevated temperatures is desirable in biomass

39
hydrolysis (Saha & Bothast, 1996, Pandey & Mishra, 1997, Ghosh & Ghose, 2003). In the
present study the major BGL from A. niger NII 08121 was purified to homogeneity using a
combination of steps including acetone precipitation, cation exchange chromatography and
electro-elution.
5.1. Materials and Methods
5.1.1 Enzyme purification
5.1.1.1 Acetone fractionation of crude enzyme preparation
Enzyme production was carried out using solid state fermentation using the optimized
conditions as described in Chapter 3(Section 3.2.3). Extraction of the enzyme was performed
as outlined under section 2.3.1. Partial purification of the enzyme was carried out using
acetone fractionation with increasing volume of solvent. Approximately 500ml of the crude
enzyme preparation was used for acetone fractionation. Chilled acetone was added to pre-
chilled crude enzyme extract at a ratio of 1: 0.5 and the mixture was kept for 4h at -20 °C,
followed by centrifugation at 8000 rpm for 15 min at 4 °C. The supernatant was recovered
and acetone was added to further increase the ratio to 1:1. These steps were continued to
obtain ratios of 1:2 and 1:3 for fractional precipitation. The pellet from each step was allowed
to dry at room temperature to remove residual acetone. The pellets were then resuspended in
12.5 ml of 0.05M Citrate Buffer (pH 4.8), and were used for further studies.
5.1.1.2 Isoelectric focusing
Liquid phase isoelectric focusing (IEF) was performed using a Biorad Rotofor® unit
(Biorad, USA) according to manufacturer’s protocols for determination of the isoelectric
point (pI) of BGL and for separating the enzymes/proteins based on their pI. Ampholytes
ranging from pH 3.0 to 12.0 were employed for the separation. Samples withdrawn from
different regions of the Rotofor separation cell using a syringe and were dialyzed against
0.05M Citrate buffer (pH 4.8). The samples were then concentrated by vacuum evaporation

40
using a vacuum centrifugation unit. The dialyzed samples and concentrated (to original
volume) were analyzed for enzyme activity and were used for further studies.
5.1.1.3 Chromatography
Crude BGL preparation was purified by ion exchange chromatography on a cation
exchange column (Macro-Prep High S matrix, Biorad, USA). Experiments were performed on
a Biorad LP system. Sample in citrate buffer (0.05M, pH 3.0) was loaded by running it at 0.5
ml/min flow rate through the column and washed by running three column volumes of the
loading buffer (0.05M Citrate buffer, pH 3.0) through the column at 0.5ml/min. Elution was
performed using a continuous gradient of NaCl from 0.0-1M and 2 ml fractions were
collected. Fractions giving the maximum activity were pooled together, dialyzed against 10
mM citrate buffer (pH 4.8) and concentrated by vacuum evaporation where applicable and
were used for further studies.
5.1.1.4 Electro-Elution
Since multiple BGL isoforms could be detected in the crude preparation which eluted
together in ion-exchange chromatography, electro-elution was performed to separate the BGL
activities. Crude BGL samples concentrated using vacuum evaporation was run on 10%
Native PAGE and the BGL activity bands were visualized by activity staining as outlined
under section 2.5. The fluorescent bands were cut from the gel using a surgical blade,
chopped into small pieces and were transferred into dialysis bags containing citrate buffer
(0.05M, pH 4.8). Bags so prepared were kept horizontally on a submarine electrophoresis unit
with the citrate buffer (0.05M, pH 4.8) and was operated at 20V for 3h. After 3 hours it was
inverted and again run for another 5 minutes to detach the protein from the dialysis bag and
then the buffer from the dialysis bag was extracted. This extract was used for further
characterization of the BGL.

41
5.1.2. Characterization of the major beta-glucosidase (BGL1) from A. niger NII 08121
Purified major BGL of A. niger was characterized for its molecular weight by SDS
PAGE. The optimal temperature and pH of the enzyme and its temperature stability was
determined.
5.1.2.1. Determination of the molecular weight of major BGL from A. niger
The major BGL isoform purified by electro-elution was run on SDS PAGE (Laemmli,
1970) along with standard protein markers (Page Ruler TM Prestained Protein ladder,
Fermentas, USA). BGL activity band was visualized by MUG staining and the Zymogram
was photographed as outlined in section 2.5. The gel was then washed twice in distilled water
and was then silver stained according to a modified rapid staining protocol (Merril et al,
1981). The silver stained gel was also photographed similar to the Zymogram. The position of
major BGL isoform was confirmed by overlapping the photographs of Zymogram and the
silver stained gel and the molecular weights were determined by comparison with the standard
protein markers of known molecular weights.
5.1.2.2. Determination of the optimal temperature of activity for the A. niger major BGL
The purified major BGL protein was assayed at different temperatures (33*, 40, 50, 60
and 80 °C) using the pNPG assay as outlined under section 2.4.1.1. Optimal temperature was
defined as the temperature at which maximum pNPG hydrolysis occurred, detected by
increase in activity. [* Room temperature while this study was conducted]
5.1.2.3. Determination of the optimal pH of activity for the A. niger major BGL
Optimal pH for the activity of the major BGL protein was determined by assaying the
enzyme at different pH. The differences in pH were attained by use of 0.05M concentration of
different buffers as given below (pH 3, 4, 4.8 and 6 – Citrate buffer, pH 7 and 8 – Na-

42
Phosphate buffer, pH 9 – Tris-HCl buffer). Optimal pH was defined as the pH at which
maximal enzyme activity was obtained in the assay.
5.1.2.4. Temperature stability of the major BGL of A. niger
Temperature stability of purified BGL was studied at 50 °C which is the temperature
at which cellulases are used for biomass hydrolysis. The enzyme preparation was incubated in
a water bath maintained at 50 °C and samples withdrawn at different intervals were assayed
(according to section 2.4.1.1). Activity retention was calculated for each time interval and
plotted against incubation time. Half life of enzyme was defined as the time required for
50% activity loss under conditions of assay.
5.1.2.5. Glucose inhibition kinetics of the A. niger major BGL
The glucose inhibition constant (Ki) of the major BGL was determined graphically
using a Dixon Plot (Dixon, 1953). BGL assays were performed (section 2.4.1.1) with
different concentrations of inhibitor/glucose (50mM -500mM) for multiple substrate/pNPG
concentrations (2mM -20mM). The initial reaction velocities [1/V] were plotted against
different inhibitor [I] concentrations at a given substrate concentration [S] for each substrate
concentration. The value of [I] at which the different lines intersect which corresponds to – Ki
was determined and the absolute value of this was taken as the Ki for glucose inhibition of the
major BGL.
5.2. Results and discussion 5.2.1 Acetone fractionation of BGL
Maximum activity as well as glucose tolerance was exhibited by the fraction obtained
using 1:2 volume acetone precipitation (Figure 5.1). No activity was obtained in 1: 0.5
acetone fraction and this fraction was not used for zymogram analysis. The zymogram
analysis of the different fractions showed a prominent high molecular weight band and a low

43
molecular weight band. The sample from 1:1 acetone precipitate showed only the high
molecular weight band while the sample from 1:3 acetone precipitate showed only the low
molecular weight band. Both the high molecular weight band and the low molecular weight
band were visible in 1:2 acetone precipitate (Figure 5.2A). The differences in glucose
tolerance of the two bands were also evident from the zymogram and only the low molecular
weight band showed activity in presence of 0.25M glucose. Besides, silver staining of the gels
showed the presence of only one low molecular weight band in 1:3 acetone fractions
indicating an effective separation of BGL activities (Figure 5.2B). The results indicate that
fractional acetone precipitation could be an effective strategy for preliminary separation of the
BGL isoforms.
Figure 5.1. Fractional precipitation of BGL using Acetone

44
Figure 5.2. Activity staining (A) and Native PAGE (B) analysis of acetone fractions of BGL
A
B
MUG staining of acetone fractions
1 - 1:1 acetone precipitate 2 - 1:2 acetone precipitate 3 - 1:3 acetone precipitate
Silver staining of acetone fractions 4 - 1:1 acetone precipitate (0.25M Glucose) 5 - 1:2 acetone precipitate (0.25M Glucose) 6 - 1:3 acetone precipitate (0.25M Glucose)
[* Fig 5.2 A: Zymogram of BGL was prepared as described under section 2.5. The image was inverted for better clarity. The gels used for activity staining was washed and were used for silver staining (Fig 5.2B)]
Fractional acetone precipitation has been employed to separate proteins by several
authors and even very early reports on the technique are available in the literature (Petersen &
Sheridan, 1978, Bradley & Whitaker, 1986). The solubility of protein depends on, among
other things, the di-electric constant of the solution. Acetone added to aqueous enzyme
preparation can reduce the dielectric contestant and thereby help in precipitating the proteins
(Bell et al, 1983). Acetone has the advantage that it is relatively inexpensive and is available
in a pure form with few contaminants that may inhibit or poison the enzyme. It can also be
recovered and recycled. Molecular weight of the protein is an important determinant of the
amount of acetone required for precipitation and in general, low molecular weight proteins are
precipitated in a higher ratio of acetone (Simpson, 2004).

45
5.2.2. Purification of the major BGL (BGL1) of A. niger NII 08121
5.2.2.1. Determination of the isoelectric point (pI) of BGL from 1:1 acetone fraction
Purification of the major BGL from A. niger NII 08121 was done using the enzyme
samples produced under SSF and concentrated by acetone fractionation as mentioned earlier
(Section 5.1.1.2). The samples generated using 1:1 and 1:3 ratio acetone fractionations were
used for purification studies since at these ratios, it was observed that the major and minor
BGL activities with different molecular weights are getting separated. Purification was
effected through sequential steps of ion exchange chromatography and electro-elution. The
isoelectric point of BGL was determined for selection of the appropriate ion exchange resin.
Liquid phase isoelectric focusing done on the enzyme sample from 1: 1 acetone
fraction using Rotophore®, resulted in the BGL activity getting focused in the pH 4.5-5.0
region of the focusing column which corresponds to fractions 2-5 (Figure 5.3).
Figure 5.3: Determination of the pI of BGL using liquid phase isoelectric focusing
It was therefore presumed that the isoelectric point (pI) of the BGL in 1: 1 acetone fraction is
close to this value (pH 4.5-5). Several authors have listed the pI of high molecular weight

46
BGL proteins from Aspergilli in this range (Rodinova et al, 1987, Galas & Romanovska,
1997, Langston et al, 2006). Cation exchange chromatography was therefore selected for
further purification the enzyme.
5.2.2.2. Chromatographic separation of BGL activities from acetone precipitated enzymes On the basis of information generated on the pI of BGL, 1:1 and 1:3 acetone precipitated
fractions from the enzyme preparation was loaded separately on a cation exchange column
and elution was carried out using continuous salt gradient as outlined under section 5.1.1.3.
The best conditions of binding occurred at a pH of 3.0, where most of the proteins occur as
cation since this pH is below the pI of the major BGL. However, no activity was recovered in
1:3 acetone fractions and hence this fraction was not studied further. The 1:1 acetone fraction
when run on cation exchange column resolved into a single activity peak though there were
multiple protein peaks (Figure 5.4). There were 5 major protein peaks spanning fractions 15-
17, 20-22, 22-25, 27-31, and 33-35 respectively of which the BGL activity corresponded to
part of the peak spanning fractions 27-31. The activity peak spanned fractions 24 -30. These
fractions were pooled, and used for further studies.
Figure 5.4. Chromatographic purification of major BGL from A. niger

47
Zymogram analysis of the acetone precipitates and the pooled BGL fractions from ion
exchange chromatography indicated the presence of only the high molecular weight band in
both 1:1 and 1:3 ratio acetone precipitated samples and the pooled ion exchange fractions
(Figure 5.5A). Native PAGE followed by silver staining of the pooled BGL fractions from ion
exchange chromatography however showed two high molecular weight protein bands that are
close together (Figure 5.5B). The lower band was less intense indicating lesser expression.
There was also a faint low molecular band in the pooled ion exchange sample indicating that
the separation was not effective. It was therefore decided to separate the activity band using
electro elution after separating the proteins by gel electrophoresis.
Figure 5.5. Zymogram and Electrophoretic analysis of acetone precipitates and pooled chromatography fractions
A Zymogram B Silver Staining of Native PAGE
Lane 1 1:1 Acetone Precipitate
Lane 2 1:3 Acetone Precipitate Lane 3 1:1 Acetone precipitate after
ion exchange Lane 4 1:3 Acetone precipitate after
ion exchange
Lane 1 1:1 Acetone Precipitate Lane 2 1:3 Acetone Precipitate Lane 3 1:1 Acetone precipitate
after ion exchange
5.2.2.3. Purification of major BGL using Electro-elution
The major BGL activity as indicated by the high molecular weight band in the activity staining and
protein staining (Figure 5.5A &B, Lane 3) was purified to homogeneity by electrophoresis followed

48
by electro-elution of the band from the gel as outlined in section 5.1.1.4. Figure 5.6A shows the silver
stained SDS PAGE of BGL1 where 1st lane corresponds to the protein marker and 3rd lane corresponds
to the electro-eluted major band (BGL1). The major BGL band (BGL1) had a molecular weight of
~120 kDa as obtained by comparison with known molecular weight standards (Page RulerTM, protein
ladder-Fermentas). The confirmation of the BGL activity of this band was done by activity staining
using MUG as substrate (Section 2.5). Fluorescence of the electro-eluted band was detected by the
MUG assay in the same position as the 120KDa major BGL protein in the silver staining (Figure
5.6B), which indicates the identity of this band as the major BGL (BGL1) of Aspergillus niger NII
08121. Several authors have reported the molecular weight of major BGL protein from Aspergilli in
this range (Riou et al, 1998, Gunata & Vallier, 1999). The fact that both the Zymogram analysis and
silver stain of the SDS PAGE of electro-eluted BGL shows only a single band indicates that probably
the major BGL is a monomeric protein.
Figure 5.6: SDS PAGE and activity staining of the purified major BGL
A
B
Silver staining of the SDS PAGE of BGL1
Lane 1 Molecular weight marker
(Page Ruler –SM0671, Fermentas )
Lane 2 Sample for part of this study Lane 3 Electro eluted major BGL
Activity staining of the SDS PAGE of BGL1
Lane 1 Electro eluted major BGL (low concentration)
Lane 2 Electro eluted major BGL (high concentration)

49
5.2.3. Characterization of the major BGL (BGL1) from A. niger NII 08121
Electro-eluted 120kDa major BGL protein was characterized for its thermo tolerance, pH
range and thermo stability as outlined in the materials and methods section. The glucose
inhibition constant (Ki) which is a determinant of the glucose tolerance was also determined.
Data shown in figure 5.7 indicated that the BGL1 has an acidic range of pH optima and the
enzyme was most active at a pH of 5.0. There was a drastic decrease in activity beyond pH
7.0.
Figure 5.7. Determination of the Optimal pH for BGL1 activity
pH2 3 4 5 6 7 8 9 10
BGL
Activ
ity (U
/ml)
0
200
400
600
800
1000
1200
BGL assays done at various temperatures (33° C, 40°C, 50°C, 60°C, 70°C and 80°C) showed
that the BGL activity increased with an increase in temperature till 70°C and there was a drop
at 80°C (Figure 5.8). Maximum activity was observed at 70°C. BGLs active at higher
temepartures are very advantageous for biomass saccharification since they can mainatin a
rapid reaction rate and also help in preventing contamination by allowing the reaction to
proceed at a higher temperatures. In this respect BGL1 from A. niger NII 08121, can be a
potent supplement to the cellulases for creating better enzyme cocktails that can also act at
elevated process temperatures

50
Figure 5.8. Determination of the Optimal Temperature for BGL1 activity
Temperature (oC)
20 30 40 50 60 70 80 90
BGL
Activ
ity (U
/ml)
0
500
1000
1500
2000
2500
3000
3500
Since long term stability of BGL at elevated temperatures is critical in it’s use for biomass
hydrolysis, this property was tested by extended incubation at 50° C which is the most
commonly employed temperature for biomass hydrolysis (Sukumaran et al, 2005, Rivera e al,
2010). BGL activity was estimated till 72 h and BGL1 was active at 50° C till 72 h. It
retained about 90% activity till 48 h and almost half of the activity was still there at 72 h
(Figure 5.9). The standard retention time used for biomass hydrolysis are often less than 48h.
Figure 5.9. Temperature stability of BGL1 at 50 °C
Time (h)
0 10 20 30 40 50 60 70 80
BGL
Activ
ity (U
/ml)
0
200
400
600
800
1000

51
5.2.3.1. Determination of the Glucose inhibition constant (Ki) of BGL1 Sensitivity / tolerance to glucose can be a major parameter which determines the suitability of
a β-glucosidase for biomass hydrolysis. Major BGL protein of Aspergilli are reported to be
sensitive to glucose though it is highly active and is expressed in very high titers compared to
the glucose tolerant isoform (Riou et al, 1998, Gunata & Vallier, 1999). BGL1 from A. niger
NII 08121 was also expressed in higher quantities compared to the other isoforms and the
studies done on glucose inhibition kinetics of the major BGL revealed that it has a Ki of
20mM as estimated using a Dixon plot (Figure 5.10). The data also indicated competitive
inhibition of the enzyme by glucose.
Figure 5.10. Dixon plot for determination of glucose inhibition constant (Ki) of BGL1
5.3. Conclusions
A. niger NII 08121 produced different BGL isoforms when grown on different carbon
sources. Fractional acetone precipitation could separate out a high molecular weight major
BGL (BGL1) and a low molecular weight and glucose tolerant minor BGL. The major beta
glucosidase (BGL1) upon purification and characterization showed interesting properties

52
including an optimum temperature of 70 °C, optimum pH of 5.0 and extended stability at 50 oC for more than 48h. However, it was inhibited at 20mM glucose concentration. The
characterization of other BGL activities from A. niger would be interesting, especially in light
of the glucose tolerance exhibited by the low molecular weight BGLs observed in this study.
The major BGL from A. niger NII 08121 is a potent candidate for use in biomass hydrolysis
since normal enzymatic hydrolysis of biomass is performed at 50 °C over 24-72h and loss of
enzyme activity is a major limitation in such processes. Enhanced level of production of
BGL1 by the fungus and the improved temperature tolerance and stability of the enzyme are
highly advantageous for biomass hydrolysis.
Chapter 6
Multiplicity of Aspergillus niger BGL: Confirmation by partial gene cloning of BGLs belonging to three glycosyl hydrolase families

53
Chapter 6
Multiplicity of A. niger BGL: Confirmation by partial gene cloning of BGLs belonging to three glycosyl hydrolase families
6. Introduction
β-glucosidases are found in all living organisms where they play multiple essential
roles (Ketudat Cairns & Esen, 2010). In microorganisms, the function of BGL has been often
studied in relation to biomass degradation (Gilbert et al, 2008). However, to state that BGLs
are mostly involved in biomass degradation would be an underestimation of the roles of these
versatile enzymes since several other roles are already known for these enzymes in microbes
(Osbourn et al, 1995, Hung et al, 2001). BGLs have been classified into glycosyl hydrolase
(GH) GH1, GH3, GH5, GH9 and GH30 based on their amino acid sequences (Henrissat,
1991, Cantarel et al, 2009, Oppasiri et al, 2007) families. BGLs belonging to different GH
families are present and often expressed in response to inducers of cellulose metabolism in
fungi. A search of the Aspergillus niger genome (Aspergillus nigerV3, JGI, 2010) returns
several different genes and ESTs which indicates the multiplicity of these enzymes in this
fungus.
Several researchers have successfully cloned and expressed beta glucosidases from
Aspergilli (Iwashita et al, 1999, Dan et al, 2000, Kim et al, 2007) and majority of the reports
also mentions the existence of multiple genes and gene products that are differentially
expressed. The studies done on differential expression of BGL proteins in A. niger NII 08121
and the purification of the BGL proteins (Chapter 4 and 5) indicated the existence of at least 4
different secreted BGL proteins in this fungus while grown on biomass. To confirm the
existence of different BGL genes which could be responsible for producing these proteins, it
was proposed to look at the existence of multiple genes by PCR amplification and cloning of
the partial gene sequences. Since BGLs belong to different GH families, degenerate PCR
probes specific for amplification of GH1, GH3 and GH5 family beta glucosidases were
designed and the PCR products were cloned and sequenced. The sequences were analyzed by
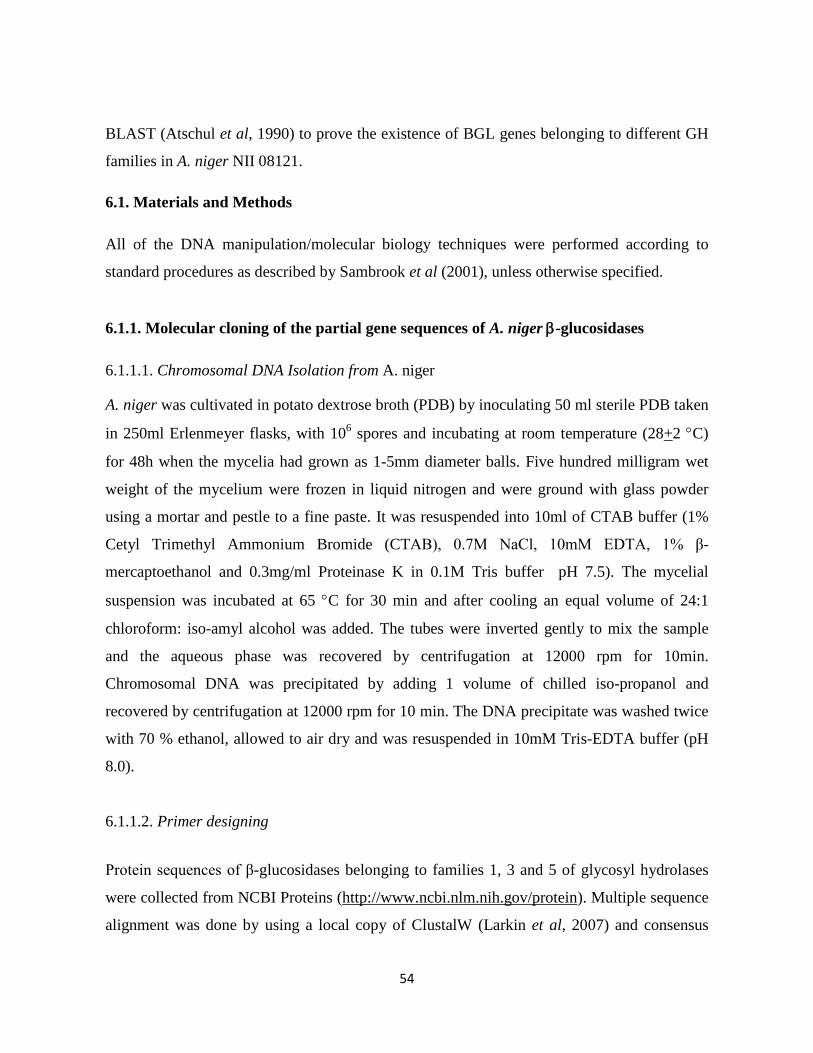
54
BLAST (Atschul et al, 1990) to prove the existence of BGL genes belonging to different GH
families in A. niger NII 08121.
6.1. Materials and Methods All of the DNA manipulation/molecular biology techniques were performed according to
standard procedures as described by Sambrook et al (2001), unless otherwise specified.
6.1.1. Molecular cloning of the partial gene sequences of A. niger β-glucosidases 6.1.1.1. Chromosomal DNA Isolation from A. niger
A. niger was cultivated in potato dextrose broth (PDB) by inoculating 50 ml sterile PDB taken
in 250ml Erlenmeyer flasks, with 106 spores and incubating at room temperature (28+2 °C)
for 48h when the mycelia had grown as 1-5mm diameter balls. Five hundred milligram wet
weight of the mycelium were frozen in liquid nitrogen and were ground with glass powder
using a mortar and pestle to a fine paste. It was resuspended into 10ml of CTAB buffer (1%
Cetyl Trimethyl Ammonium Bromide (CTAB), 0.7M NaCl, 10mM EDTA, 1% β-
mercaptoethanol and 0.3mg/ml Proteinase K in 0.1M Tris buffer pH 7.5). The mycelial
suspension was incubated at 65 °C for 30 min and after cooling an equal volume of 24:1
chloroform: iso-amyl alcohol was added. The tubes were inverted gently to mix the sample
and the aqueous phase was recovered by centrifugation at 12000 rpm for 10min.
Chromosomal DNA was precipitated by adding 1 volume of chilled iso-propanol and
recovered by centrifugation at 12000 rpm for 10 min. The DNA precipitate was washed twice
with 70 % ethanol, allowed to air dry and was resuspended in 10mM Tris-EDTA buffer (pH
8.0).
6.1.1.2. Primer designing
Protein sequences of β-glucosidases belonging to families 1, 3 and 5 of glycosyl hydrolases
were collected from NCBI Proteins (http://www.ncbi.nlm.nih.gov/protein). Multiple sequence
alignment was done by using a local copy of ClustalW (Larkin et al, 2007) and consensus

55
BLOCKS were generated using Blocks Multiple Sequence Alignment Processor web server
(Henikoff et al, 2000). The blocks data was submitted to COnsensus DEgenerate Hybrid
Oligonucleotide Primers (CODEHOP) web server (Rose et al, 1998) to design degenerate
primers. As it was evident from the current study that A. niger produced several isoforms,
BGLs belonging to more than one family of glycosyl hydrolase (GH) were expected to be
produced by the fungus. So, degenerate primers for three major GH families ie – family 1
(GH1), family 3 (GH3) and family 5 (GH5) were designed and were tried for PCR
amplification of partial BGL genes from the chromosomal DNA of the fungus. Specific
primers were designed wherever sequence information was available using either of the
software – PerlPrimer (Marshall, 2004) or FastPCR (Kalendar et al, 2009). The degenerate
primers designed for amplification of GH1, GH3 and GH5 family BGLs are listed in Table
6.1, and the specific primers designed for amplification of a short region of GH3 family BGL
of A. niger is given in Table 6.2.
Table 6.1. List of Degenerate Primers designed for PCR amplification of GH1, GH3 and GH5
family β- glucosidases
SL # SEQ CODE SEQUENCE
FAMILY 1 GLYCOSYL HYDROLASE
1 BGL1_AF1 5'-GCA ACG GCG GCT TAT CAR RTN GAR GG -3'
2 BGL1_AF2 5'-TGG TAA AGG ACA ATC TAT CTG GGA YAC NTT -3'
3 BGL1_DR1 5'-TGT AAC ACC ATG GCT CGT TGA RNG TNA YCC A -3'
4 BGL1_DR2 5'-CGT GAT GCC CGA ATA TAG TGT AAC ACY MNG GYT CRT T -3'
5 BGL1_FF1 5’-CAC TCT ACA CGG TCA CTG GTA TGA RCC NTG GRA -3'
6 BGL1_FR1 5'-TGT TGA TCC GCC GCG TYC CAN GGY TC -3'
7 BGL1_JR1 5'-CTC CCT TAC ACG TGC AGC CRT TYT CNG T -3'
8 BGL1_IR1 5'-CGG TTC CAT ACC CAA TTC AGG WRY TTN CKR AA -3'
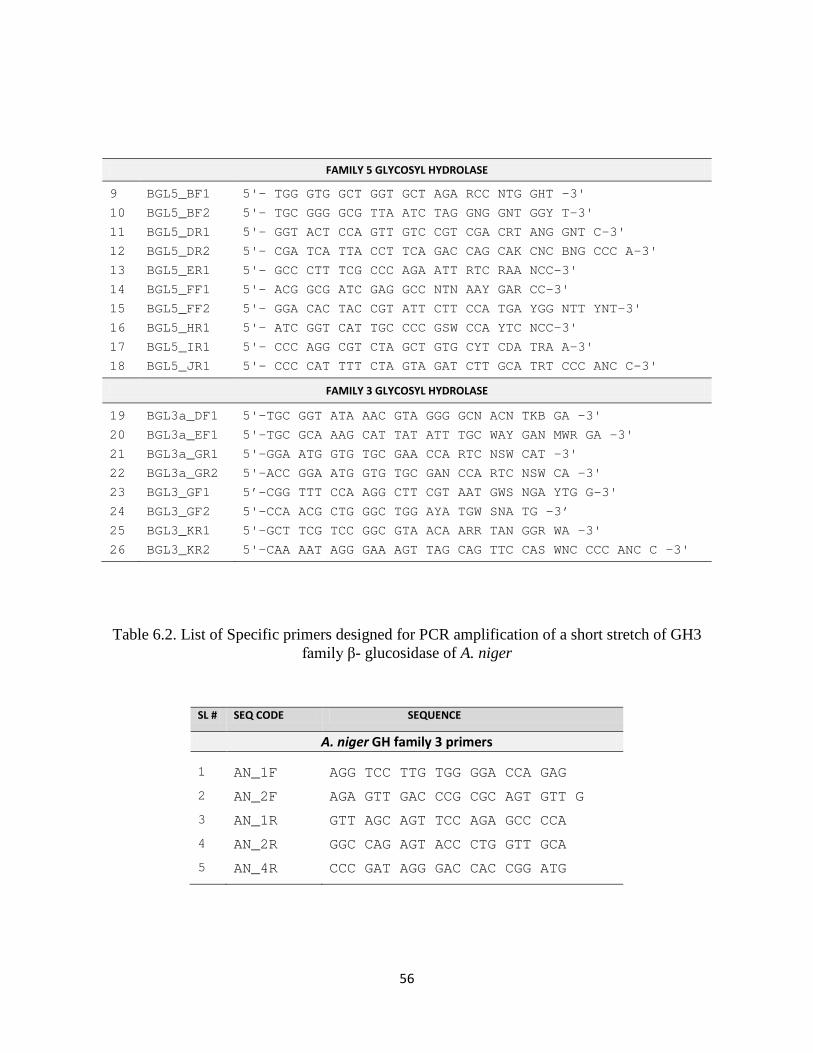
56
FAMILY 5 GLYCOSYL HYDROLASE
9 BGL5_BF1 5'- TGG GTG GCT GGT GCT AGA RCC NTG GHT -3'
10 BGL5_BF2 5'- TGC GGG GCG TTA ATC TAG GNG GNT GGY T-3'
11 BGL5_DR1 5'- GGT ACT CCA GTT GTC CGT CGA CRT ANG GNT C-3'
12 BGL5_DR2 5'- CGA TCA TTA CCT TCA GAC CAG CAK CNC BNG CCC A-3'
13 BGL5_ER1 5'- GCC CTT TCG CCC AGA ATT RTC RAA NCC-3'
14 BGL5_FF1 5'- ACG GCG ATC GAG GCC NTN AAY GAR CC-3'
15 BGL5_FF2 5'- GGA CAC TAC CGT ATT CTT CCA TGA YGG NTT YNT-3'
16 BGL5_HR1 5'- ATC GGT CAT TGC CCC GSW CCA YTC NCC-3'
17 BGL5_IR1 5'- CCC AGG CGT CTA GCT GTG CYT CDA TRA A-3'
18 BGL5_JR1 5'- CCC CAT TTT CTA GTA GAT CTT GCA TRT CCC ANC C-3'
FAMILY 3 GLYCOSYL HYDROLASE
19 BGL3a_DF1 5'-TGC GGT ATA AAC GTA GGG GCN ACN TKB GA -3'
20 BGL3a_EF1 5'-TGC GCA AAG CAT TAT ATT TGC WAY GAN MWR GA -3'
21 BGL3a_GR1 5'-GGA ATG GTG TGC GAA CCA RTC NSW CAT -3'
22 BGL3a_GR2 5'-ACC GGA ATG GTG TGC GAN CCA RTC NSW CA -3'
23 BGL3_GF1 5’-CGG TTT CCA AGG CTT CGT AAT GWS NGA YTG G-3'
24 BGL3_GF2 5'-CCA ACG CTG GGC TGG AYA TGW SNA TG -3’
25 BGL3_KR1 5'-GCT TCG TCC GGC GTA ACA ARR TAN GGR WA -3'
26 BGL3_KR2 5'-CAA AAT AGG GAA AGT TAG CAG TTC CAS WNC CCC ANC C -3'
Table 6.2. List of Specific primers designed for PCR amplification of a short stretch of GH3 family β- glucosidase of A. niger
SL # SEQ CODE SEQUENCE
A. niger GH family 3 primers 1 AN_1F AGG TCC TTG TGG GGA CCA GAG
2 AN_2F AGA GTT GAC CCG CGC AGT GTT G
3 AN_1R GTT AGC AGT TCC AGA GCC CCA
4 AN_2R GGC CAG AGT ACC CTG GTT GCA
5 AN_4R CCC GAT AGG GAC CAC CGG ATG

57
6.1.1.3. PCR Amplification of partial gene sequences of BGL
Amplification of partial gene sequences of beta glucosidases belonging to glycosyl hydrolase
families 1, 3 and 5 were performed by polymerase chain reaction using different sets of the
degenerate primers designed for each family. PCR reactions contained 0.5 unit of Fermentas
(USA) Taq DNA polymerase, 1X buffer, 200μM of each deoxynucleotide triphosphate, 2μM
MgSO4 and 0.5μM forward and reverse primers. Reaction conditions for PCR amplification
were an initial 95 °C for 4 min, followed by 25 cycles of 95 °C for 30 sec, 50 °C for 1 min
and 70 °C for 1 min; and a final extension step at 72 °C for 5 min. An Eppendorff gradient
PCR system was used for the amplification. PCR products were separated by electrophoresis
on a 1% Agarose gel and products were visualized in long range UV trans-illumination for
documentation.
6.1.1.4. Cloning of PCR products and sequencing of inserts
PCR fragments obtained using degenerate primers were gel purified using GeneJET TM PCR
purification kit (Fermentas, USA) and were then cloned into the T/A cloning vector
pTZ57R/T from Fermentas (Figure 6.1). Cloning of the PCR amplicons were performed using
“InsT/AcloneTM PCR product cloning kit (Fermentas, USA) according to the manufacturer’s
protocols. In brief, the following components were added into the 1.5ml micro centrifuge tube
to make up the final volume to 10µl (Table 6.3).
Table 6.3. Ligation reaction for cloning PCR products
Plasmid vector pTZ57R/T (0.05 µg) 1µl Purified PCR fragment (0.15 µg) 3µl 10x ligation buffer 2.5µl T4 DNA Ligase, 5U 1µl

58
Fig 6.1. Restriction map of T/A cloning vector pTZ57R/T
The ligation reaction was done at 16 °C in a refrigerated water bath for 8h. Five micro liters
of the ligation mix was used for transformation. Competent cells (E. coli strains of
XL1Blue/JM107) were prepared and transformation was performed using “TransformAidTM
Bacterial Transformation kit (Fermentas, USA) according to manufacturer’s protocols. LB
plates with XGal (40µg/ml), IPTG (0.1mM) and Ampicillin (100µg/ml) were plated with
transformed E. coli and were incubated for 12-16h at 37 °C. Colonies that appeared in the
plates were selected based on the blue white screening. White colonies were expected to
harbor the plasmid with insert and were inoculated into LB medium with Ampicillin for 12-
16h. Plasmids were isolated from the bacterial cells by “GeneJETTM Plasmid Miniprep Kit
(Fermentas, USA). Presence and size of inserts were determined by restriction digestion of the
purified plasmids (According to enzyme manufacturer’s protocols), and also by PCR
amplification of the desired fragment using the same set of primers as was used for generating
the amplicons. Sequencing of the inserts was outsourced and purified plasmids were sent to
either Scigenome (Kochi, India) or Axygen (New Delhi, India) for sequencing using M13
forward and reverse primers which are complementary to the flanking regions of pTZ57R/T
multiple cloning site. Sequence reads received from the companies were analyzed by BLAST
(Altschul et al, 1997).

59
6.2. Results and Discussion 6.2.1. Chromosomal DNA isolation
DNA preparation from A. niger was successful and the CTAB method yielded high molecular
weight chromosomal DNA (Figure 6.2). The DNA isolated was suspended in 10mM Tris
EDTA buffer (pH 8.00) and was used as template for PCR reactions. Long term storage of
DNA was done at -80 ºC.
Figure 6.2: Chromosomal DNA isolation from A. niger
Lane Information 1 -Generuler® -1kb ladder (Fermentas) 3 -Chromosomal DNA from T. reesei 5 -Chromosomal DNA from A. niger
6.2.2. PCR amplification of BGL genes
PCR Amplification of BGL genes belonging to the glycosyl hydrolase families GH1, GH3
and GH5 were performed using combination of degenerate primers designed to amplify the
BGLs from these families. The different sets of primers were designed to amplify different
regions of the gene. Figures 6.3, 6.4 and 6.5 shows the amplicons obtained with primer pairs
corresponding to GH1, GH3 and GH5 respectively.

60
Figure 6.3: PCR amplification of GH1 family BGL from A. niger genomic DNA
Lane Information 1 GeneRuler ® 1kb ladder(Fermentas) 3 Primer pair AF1 –DR1 4 Primer pair AF1 –DR2 5 Primer pair AF2 –DR1 6 Primer pair AF2 –DR2 7 Primer pair FF1 –JR1 8 Primer pair FF1 –IR1 9 Primer pair AF1 –FR1 10 Primer pair AF2 –FR1 11 Primer pair AF1 –JR1 12 Primer pair AF1 –IR1
Most of the primer pairs successfully amplified an ~200 bp region while certain combinations
of primers (AF1 –DR1, AF1 –DR2, AF2 –DR2, AF1 –FR1) produced 2 amplicons , one
~200bp and the other one >500bp. Amplicons obtained using primer pair BGL1_AF1 –
BGL1_DR1 and BGL1_AF1 – BGL1_DR2 was sharp and clear indicating better products and it
was decided to clone fragments from these two combinations separately after purification of
the fragments from gel.
Figure 6.4. PCR amplification of GH3 family BGL from A. niger
Lane Information 2 GeneRuler ® 1kb ladder(Fermentas) 3 Primer pair EF1 -GR1 8 Primer pair DF1 -KR2 9 Primer pair EF1 -GR2 10 Primer pair DF1 -KR2 11 Primer pair EF2 -KR2 12 Primer pair GF1 -KR2 13 Primer pair GF2 -KR2

61
Most of the primer pairs in the case of GH3 family amplified multiple sequences as evident
from the distribution of amplicons in lanes 8, 9, 10 and 11 in Figure 6.4. Primer pair
BGL3_EF1- BGL3_GR2 produced an ~ 300bp amplicon while primer pairs BGL3_GF1-
BGL3_KR2 and BGL3_GF2- BGL3_KR2 produced 2 amplicons each of size ~ 700 bp and
~100bp respectively. It was decided to clone the high molecular weight amplicon from
BGL3_GF2- BGL3_KR2 combination primers.
Figure 6.5. PCR amplification of GH5 family BGL from A. niger
Lane Information 1 Primer pair BF1 -DR1 2 Primer pair BF2 -DR1 4 Primer pair BF2 -DR2 8 Primer pair BF2 -HR1 10 GeneRuler ® 1kb ladder(Fermentas) 11 Primer pair BF2 -IR1 12 Primer pair BF1 -JR1 13 Primer pair BF2 -JR1 14 Primer pair FF1 -HR1 16 Primer pair FF1 -JR1 17 Primer pair FF2 -HR1 20 GeneRuler ® 1kb ladder(Fermentas)
Use of primer pairs BGL5_BF2-BGL5_DR1 and BGL5_FF2-BGL5_HR1 produced two amplicons
each, with a molecular weight of ~600 bp for the upper band. Other amplicons were either
small (~100bp) or with noise (several bands for same set of primers). It was therefore decided
to clone the upper band from these primer combinations.

62
6.2.3. Cloning, Sequencing and BLAST analysis of the partial BGL genes of families GH1,
GH3 and GH5
6.2.3.1. Cloning of partial genes of GH1, GH3 and GH5 BGLs
Amplicons of the BGLs belonging to GH1, GH3 and GH5 as selected above were gel purified
and cloned as outlined under section 6.1.1.4. Plasmids were isolated from transformants and
was purified using a GeneJet TM Plasmid Miniprep kit from Fermentas. The isolated plasmids
were used as templates for PCR amplification of the gene using the same set of degenerate
primers used for amplifying them from the genomic DNA. The presence of amplicons with
identical size from genomic DNA and plasmid confirmed successful cloning of the partial
BGL genes. Figures 6.6 – 6.7 provides the confirmation of partial gene cloning of BGLS
belonging to families GH1, GH3 and GH5.
Figure 6.6A &B: Confirmation of GH1and GH5 family BGL partial gene cloning
Lane Information
A: Amplification of GH1-BGL and GH5-BGL partial genes from genomic DNA and recombinant plasmids
1 GH1-BGL gene amplification using genomic DNA as template (Primers AF1 & DR1)
2 GH1-BGL gene amplification using plasmid DNA as template (Primers AF1 & DR1)
3 GH5-BGL gene amplification using genomic DNA as template (Primers BF2 & DR1)
4 GH5-BGL gene amplification using plasmid DNA as template (Primers BF2 & DR1)
B: Size determination of GH1-BGL and GH5-BGL partial genes amplified from plasmids 1 GeneRuler ® 1kb ladder(Fermentas) 2 GH1-BGL gene amplicon (AF1 & DR1)
(No amplification) 3 GH1-BGL gene amplicon (AF1 & DR2)
(~1200bp) 4 GH5-BGL gene amplicon (BF2 & DR1)
(~700bp)

63
Figure 6.7: Confirmation of GH3 family BGL partial gene cloning
Lane Information 1 GeneRuler ® 1kb ladder(Fermentas)
2 GH3-BGL amplicon (GF2–KR2) Amplified from genomic DNA
3 GH3-BGL amplicon (GF2–KR2) Amplified from plasmid DNA (~500bp major band and >1000bp minor band)
6.2.3.2. Sequencing and BLAST analysis of partial genes of GH1, GH3 and GH5 BGLs
Cloned partial genes of GH1, GH3 and GH5 family BGLs were sequenced using di-deoxy
chain termination method using M13 forward and reverse primers since the multiple cloning
site of pTZ57R/T vector contain flanking sequences of M13 forward and reverse primers to
facilitate sequencing. The sequences reads of appropriate quality obtained for each gene was
compared against non redundant nucleotide sequence collection at Genbank using the web
interface of NCBI-BLAST. Results are given below 6.2.3.2.1. Sequence of GH1-BGL insert and BLAST results Sequencing of the GH1 –BGL insert returned a 454bp fragment as given below
>GH1_BGL GCGACGGTCTCGCGATGCATCTAGATTCGTGATGCCCGAATATAGTGTAACACTACGGTTCGTTGAATGTAATCCAATGCTTGACTTTCGAGCCCAGGGCCTGGAACATGACTCGAGCGTAGTGTGCGAAATCCGCTACGAATTCCTCCTTGTTCAGGAGTCCACCGTAGCGCTTGTCGAGTTCATCGGGCAGATCCCAATGGAAGAGTGTCACCAGGGGTGTGATCCCCGCTGCTAGGAGGTCGTCGACAAATTTGACGTAGTGTTGGATTCCCTTTTCGTTGATGGGGTCGTTGCGGCCTCCCAGGGGGATGATGCGTGACCTGAAGGATGGGTCAGAATGATGTTCGGGGTGTGATTGAATTGAATGTTCGTCTTGGTATGGTATGGTATTAAACTCACCATGAGATTGAAAAGCGGTAGGCTTGGGCACCGCATTCTTTTAACAAGGCGA
BLAST analysis indicated that the sequence has 87 % identity with 77% coverage to
Aspergillus niger CBS 513.88 hypothetical protein An03g03740 which has the domain
signatures of glycosyl hydrolase family 1 and is thought to be a putative GH1 beta
glucosidase. Also the sequence had close similarity to the following
Aspergillus clavatus NRRL 1 beta-glucosidase, putative (ACLA_020660), (XM_001268784.1),

64
Neosartorya fischeri NRRL 181 beta-glucosidase, putative (NFIA_010690) ( XM_001264284.1),
Aspergillus fumigatus Af293 beta-glucosidase (XM_747747.1),
Aspergillus flavus NRRL3357 beta-glucosidase, putative, mRNA (XM_002374789.1),
Talaromyces emersonii beta-glucosidase 1 (bg1) gene, complete cds (AY081764.2)
The results indicated the existence of GH1- family BGL in A. niger NII 08121.
6.2.3.2.2. Sequence of GH3-BGL insert and BLAST results
GH3 –BGL insert was a 1169bp fragment as given below
> GH3_BGL GGCGTAGCATCGCGTGTGCCACTCGGGCGGACGGAAGGTCCTTGTGGGGACCAGAGTTGACCCGCGCAGTGTTGAACACCTCTGTCCCGATGGACCGGTTGAACGACATGGTGACCCGCATTGTGGCCTCCTGGTACCATCTTGGCCAGGACTTGTGGCCTCGGCCTGCTCCGGACGGTGATGGCGGGCCTACCTTTTCCTCGTGGACCAACGATGAGGTCGGATGGCTGCACCAAGGGTCTCCGGATGACGAGGCCTACGGTATCGTGAACCGGTTCATTAATGCCCAGGGCGAAGGCGAGAATGCACACTCCATCATTGCTCGCAAGGTGGCGGCCGAAGGCATCGTGATGGTGAAGAATGACCAGAACACACTGCCATTGTCCCGCCGGCCAGTGAGCCCATCCGGTGGTCCCTATCGGGTGGGCGTGTATGGCGACGACGCCGGACCGGCTGGAGGACCCAACGCCTGCCCAGACCGGGGCTGCAACCAGGGTACTCTGGCCATGGGCTGGGGCTCTGGAACTGCTAACTTTCCCTATTTTGAATCGGATCCCGGGCCCGTCGACTGCAGAGGCCTGCATGCAAGCTTTCCCTATAGTGAGTCGTATTAGAGCTTGGCGTAATCATGGTCATAGCTGTTTCCTGTGTGAAATTGTTATCCGCTCACAATTCCACACAACATACGAGCCGGAAGCATAAAGTGTAAAGCCTGGGGTGCCTAATGAGTGAGCTAACTCACATTAATTGCGTTGCGCTCACTGCCCGCTTTCCAGTCAGGAAACCTGTCGTGCCAGCTGCATTAATGAATCGGCCAACGCGCGGGGAGAGGCGGTTTGCGTATTGGGCGCTCTTCCGCTTCCTCGCTCACTGACTCGCTGCGCTCGGTCGTTCGGCTGCAGCGAGCGGTATCAGCTCACTCAAAGGCGGTATACGATATCCACAGATCAGGGATACGCAGAAAGAACATGTGAGCAAAGTCAGCAAATGCAGATCGTAAAAGCCGCGTTGCTGGCGTTTTCATAGCTCCGCCCCCTTGACTGAGCATACACATTCGAACGCCTCAGTCGAAGTGGCGAACCCGACGACTATGAGAATACAGGCGTTACCCCTGGGAGTTCCTCTTGGGCGCCTTTCCTGTTTCGAACCACTGTGCCGCGTTATCCTGA
The GH3_BGL insert sequence had 91% identity over a 44% region with the hypothetical protein An15g01890 of Aspergillus niger CBS 513.88. This protein sequence has both glycosyl hydrolase N terminal and C terminal domain signatures and is listed as a putative GH family 3 beta glucosidase. Results indicate the presence of GH3-BGL in A. niger NII 08121. 6.2.3.2.2. Sequence of GH5-BGL insert and BLAST results
>GH5_BGL ACTACCGGTCTCGCGATGCATCTAGATTACGGCGATCGAGGCCCTGAACGAACCCAACATTCCTGGTGGCGTAAACGAGGGTGACCTCAAGAACTACTATTACGGTGCTTTGGCCGATGTCCAGCGTCTCAACCCTTCTACTACTTTGTTCATGTCGGACGGCTTTCAGCCTGTAGAGTCCTGGAACGGCTTTATGCAAGGTAGCAACGTTGTCATGGATACGCATCACTATCAGGTTTTTGACACTGGCTTGCTTTCTATGAGCATCGATGATCATGTCAAAACGGCCTGTTCTCTCGCCACACAGCATACGATGCAATCAGATAAGCCCGTCGTCGTGGGCGAATGGTCCGGGGCAATGACCGATAATCGGATCCCGGGCCCGTCGACTGCAGAGGCCTGCATGCAAGCTTTCCCTATAGTGAGTCGTATTAGAGCTTGGCGTAATCATGGTCATAGCTGTTTCCTGTGTGAAATTGTTATCCGCTCACAATTCCACACAACATACGAGCCGGAAGCATAAAGTGTAAAGCCTGGGGTGCCTAATGAGTGAGCTAACTCACATTAATTGCGTTGCGCTCACTGCCCGCTTTCCAGTCGGGAAACCTGTCGTGCCAGCTGCATTAATGAATCGGGCCAACGCGCGGGGAGAGGCGGTTT

65
The sequence of GH5-BGL insert (660bp) matched Aspergillus niger CBS 513.88
hypothetical protein (An18g04100) partial mRNA. The hypothetical protein showed strong
similarity to the Aspergillus oryzae beta-glucosidase gene from patent WO9955884 (Riou &
Gunata, 1999) and has the pfam domain signature PF00150 which is specific for glycosyl
hydrolase family 5. Similarity to this hypothetical protein which is putative GH family 5 beta
glucosidase indicates that the G5-BGL gene is also present in A. niger NII 08121.
6.3. Conclusions Multiplicity of BGLs in filamentous fungi is a known fact and the presence of multiple BGLs
can be due to the presence of different BGL genes or due to the differential processing of
transcripts. Existence of different BGL activities in organisms is thought to be essential due to
the diverse roles of these enzymes. A. niger NII 08121 was found to secrete at least four
different BGL proteins as determined by electrophoretic separation and activity staining.
However, the results from the present study show that the organism has genes for BGLs
belonging to three major glycosyl hydrolase families ie GH1, GH3 and GH5. While most of
the reported BGLs belong to families GH1 and GH3, there are also reports on the existence of
GH5 BGLs in filamentous fungi. Partial gene sequences obtained from the study can be used
to probe a cDNA library or even the chromosomal DNA for isolation of full length sequences
which will be useful in characterizing the beta glucosidase activities in the fungus.

Chapter 7
Studies on the application of Aspergillus niger β-glucosidase for bioethanol production

66
Chapter 7
Studies on the application of A. niger β-glucosidase for bioethanol production
7. Introduction
One of the major applications projected for beta glucosidases is as a component in the
cellulase cocktail for biomass hydrolysis. Enzymatic conversion of biomass is the most
efficient way of breaking down the pretreated lignocellulosic feedstock to their component
sugars which can then be used for producing bioethanol. However, no single enzyme is
capable of efficient deconstruction of a wide variety of highly complex pretreated substrates
(Decker & Teter, 2008, Meyer et al, 2009). Therefore the properties desired in enzyme are
also wide and varied and often dependent on the type feedstock and the method of
pretreatment. Cellulase preparations from commercially used enzyme producer T. reesei RUT
C 30, though capable of biomass hydrolysis contains very less quantities of beta glucosidase
which necessitates the addition of exogenous BGL to improve the efficiency of
saccharification. BGL from A. niger have been used by several researchers for creating
enzyme blends suited for hydrolysis of different feedstock (Sternberg et al, 1977,
Mohagheghi et al, 1992, Xiao et al, 2004). A. niger NII 08121 was found to produce very
high titers of beta glucosidase which could be a potent supplementation in enzyme cocktails
for biomass hydrolysis. It was therefore decided to test the effectiveness of the BGL
preparation from the fungus as component in the enzyme cocktail for biomass hydrolysis.
Since cellulase preparation with only T. reesei enzyme was not available, it was decided to
produce the T. reesei cellulase and use this in blends with A. niger BGL. The combination of
enzymes and the hydrolysis conditions were optimized for best sugar yields. Alkali pretreated
rice straw was used as a model substrate. The biomass hydrolysate generated by enzymatic
saccharification with enzyme cocktail was also used for alcohol production by inoculating this
with Saccharomyces cerevisiae.

67
7.1 Materials and Methods
7.1.1. Organisms and culture conditions
Trichoderma reesei RUT-C30, was a kind gift from Prof George Scakacs, Technical
University of Budapest, Hungary and Saccharomyces cerevisiae NCIM 3288 was procured
from National Collection of Industrial Microorganisms (NCIM), Pune, India. Media and
Inoculum preparation, Solid state fermentation, enzyme extraction and concentration and
assays were done as detailed under appropriate sections in the Materials and Methods
(Chapter 2).
7.1.2. Cellulase production using Trichoderma reesei RUT C30.
Production of cellulase by Solid State Fermentation (SSF) using wheat bran as carbon
source was done as outlined in sections 2.2.1 and 2.3.1.
7.1.2.1 Optimization of cellulase production by T.reesei RUT C30 under Solid State
Fermentation
Optimization of parameters for cellulase production was performed in two stages.
Initially 11 variables were screened using a fractional factorial design to identify the
parameters which significantly influenced enzyme production and in the second stage the
levels of these parameters were optimized using a response surface design.
7.1.2.1 A. Screening of parameters affecting cellulase production by fractional factorial design
A Plackett and Burman (1946) design was employed to determine the effect of
individual parameters affecting cellulase production by the fungus under SSF. The
composition of mineral salt solution used for wetting the substrate and the important physical
parameters affecting enzyme production were screened in a design with 11 variables at two
levels in a total of 12 experimental runs (Table 7.1). The variables were tested at two levels

68
+1 and -1. The actual and coded values tested for each parameter are given in Table 7.2.
Experimental runs were performed according to the design and the response (Enzyme
activity) was recorded. A factorial model was fitted for the main effects using Design
Expert® software (Statease Corp, USA). The effects of individual parameters on cellulase
production was calculated by the following equation (Eqn.1)
ε = (Σµ+ - Σµ-)/n (1)
Where ε is the effect of parameter under study and “µ+” and “µ-”are responses (cellulase
activities) of trials at which the parameter was at its higher and lower levels respectively and
“n” is the total number of trials. Analysis of variance (ANOVA) was performed on the data to
determine the significance of fitted model and to test the significance of the effect of
individual parameters on cellulase production. The most significant parameters affecting
cellulase production were identified.
Table 7.1 Plackett & Burman design matrix for the screening of variables influencing cellulase production
Std order X1 X2 X3 X4 X5 X6 X7 X8 X9 X10 X11
1 1 -1 1 -1 -1 -1 1 1 1 -1 1 2 1 1 -1 1 -1 -1 -1 1 1 1 -1 3 -1 1 1 -1 1 -1 -1 -1 1 1 1 4 1 -1 1 1 -1 1 -1 -1 -1 1 1 5 1 1 -1 1 1 -1 1 -1 -1 -1 1 6 1 1 1 -1 1 1 -1 1 -1 -1 -1 7 -1 1 1 1 -1 1 1 -1 1 -1 -1 8 -1 -1 1 1 1 -1 1 1 -1 1 -1 9 -1 -1 -1 1 1 1 -1 1 1 -1 1
10 1 -1 -1 -1 1 1 1 -1 1 1 -1 11 -1 1 -1 -1 -1 1 1 1 -1 1 1 12 -1 -1 -1 -1 -1 -1 -1 -1 -1 -1 -1

69
Table 7.2 Actual levels of variables tested with the factorial design and their effects on cellulase production
Code Parameter name Low level (-1) High Level (+1)
X1 Moisture (%) 40 60 X2 Particle size (µM) 300-500 500-1000 X3 pH 4 7 X4 Temp of Incubation (oC) 27 32 X5 Inoculum size (spores/ml) 105 108 X6 Inoculum age ( days) 5 7 X7 NH4NO3 (g/L) 2.5 7.5 X8 Peptone (g/L) 1 3 X9 Cellobiose (g/L) 0.001 0.01 X10 Tween 80 (g/L) 0.1 0.5 X11 Incubation time (h) 96 144
7.1.2.1. B Optimization of significant parameters for improving cellulase production
The significant parameters identified by the Placket and Burman design were
optimized using a Response Surface Central Composite rotary design (CCD) (Box & Wilson,
1951). The effect of the significant variables was studied at five different levels (Table 7.3).
The design matrix with 14 experimental runs in two blocks where the midpoint is replicated 6
times is shown in Table 7.4. The screened variables: initial moisture content of the medium
and the incubation temperature were coded as X1 and X2 respectively. The behavior of the
system was modeled by a second order polynomial equation. The model equation used for
the analysis is given below (Eqn. 2)
(2)
Where, Y is the predicted response; β0 is the offset term; β i is the linear effect; β ii is the
squared effect, β ij is the interaction effect, Xi and Xj are coded terms for independent
variables under study and ε is the error factor. For two variable systems the model equation is
given below (Eqn. 3)

70
Y = β0 + β1X1 + β 2X2 + β 11X12 + β 22X2
2 + β 12X1X2
(3)
Regression analysis and estimation of the coefficients were performed using Design Expert®.
Pareto chart of the effect estimates, the three dimensional response surfaces and contour plots
were generated using Statistica software (Statsoft Inc. USA) or Design Expert. The ideal
levels and combinations of parameters were identified by optimization functions in the
software and experiments were run at these levels for validation of the model.
Table 7.3 Actual and coded levels of variables tested with the central composite design
Code Parameter name Levels of parameters
-α (−1.414) -1 0 +1 +α (+1.414)
X1 Moisture (%) 33.96 35 37.5 40 41.04
X2 Temp of Incubation (oC) 28.2 29 31 33 33.8 α = Axial /Star point (s) are levels larger than the chosen range of parameters
Table 7.4 Central Composite Design matrix for optimization of parameters identified by the
fractional factorial design
Std
order Block
Moisture (%) Temperature (oC)
Actual Coded Actual Coded
1 1 35 -1 29 -1
2 1 40 1 29 -1
3 1 35 -1 33 1
4 1 40 1 33 1
5 1 37.5 0 31 0
6 1 37.5 0 31 0
7 1 37.5 0 31 0
8 2 33.96 -1.41 31 0
9 2 41.04 1.41 31 0
10 2 37.5 0 28.17 -1.41
11 2 37.5 0 33.83 1.41
12 2 37.5 0 31 0

71
13 2 37.5 0 31 0
14 2 37.5 0 31 0
7.1.3. Optimization of Enzyme cocktail for hydrolysis of alkali pretreated rice straw
Blends of T. reesei cellulase and A. niger BGL were prepared with different ratios to
make enzyme cocktails for biomass hydrolysis. The performance of these cocktails was
assessed by using them for hydrolysis of alkali pretreated rice straw which was prepared
according to section 2.6. The carbohydrate and lignin content of pretreated biomass was
analyzed by NREL protocols (Sluiter et al, 2008). Theoretical maximum of total sugar yield
was calculated as C × 1.11 + H × 1.136 where C is the cellulose content and H is the
hemicellulose content in g/g biomass and were expressed in percentage values. The factors
used in either case represent the increase in total weight due to addition of water molecule
upon breakage of the sugar bonds. Saccharification of biomass was performed as outlined
under section 2.7. Efficiency of saccharification was gauged as the yield of reducing sugars
from the pretreated biomass. Total reducing sugars in the hydrolysate was measured by DNS
method (Miller, 1959) and was expressed in either g/g or mg/g (grams/milligrams of reducing
sugar liberated/gram pretreated biomass)
Optimization of enzyme cocktails was done using a response surface Box Behnken
design. The design matrix with 15 experimental runs in a single block is shown in Table 7.5.
The screened variables: biomass loading, enzyme loading, surfactant concentration and
residence time were coded as X1, X2 and X3 respectively.

72
Table 7.5: Box –Behnken design matrix for optimization of saccharification
Std Order Block
T. reesei cellulase (FPUs/g biomass)
X1
A. niger BGL (U/g biomass)
X2
Time (h) X3
1 1 5.00 0.00 36.00 2 1 10.00 0.00 36.00 3 1 5.00 866 36.00 4 1 10.00 866 36.00 5 1 5.00 433 24.00 6 1 10.00 433 24.00 7 1 5.00 433 48.00 8 1 10.00 433 48.00 9 1 7.50 0.00 24.00 10 1 7.50 866 24.00 11 1 7.50 0.00 48.00 12 1 7.50 866 48.00 13 1 7.50 433 36.00 14 1 7.50 433 36.00 15 1 7.50 433 36.00
The behavior of the system was modeled by a second order polynomial equation. The model
equation used for the analysis is given in equation 2 (Section 7.1.2.1B)
For three variable systems, the model equation was as given below (Eqn. 4)
Y = β0 + β 1X1 + β 2X2 + β 3X3 + β 11X12 + β 22X2
2 + β 33X32
+ β12X1X2 + β13X1X3 + β23X2X3 (4)
Regression analysis and estimation of the coefficients were performed using the DOE
software Design Expert ® (Statease Corp, USA). Three dimensional response surfaces were
generated using the software. The optimal levels and combinations of parameters were
identified by optimization functions in the software.
7.1.4. Ethanol production using the enzymatic hydrolysate of rice straw.
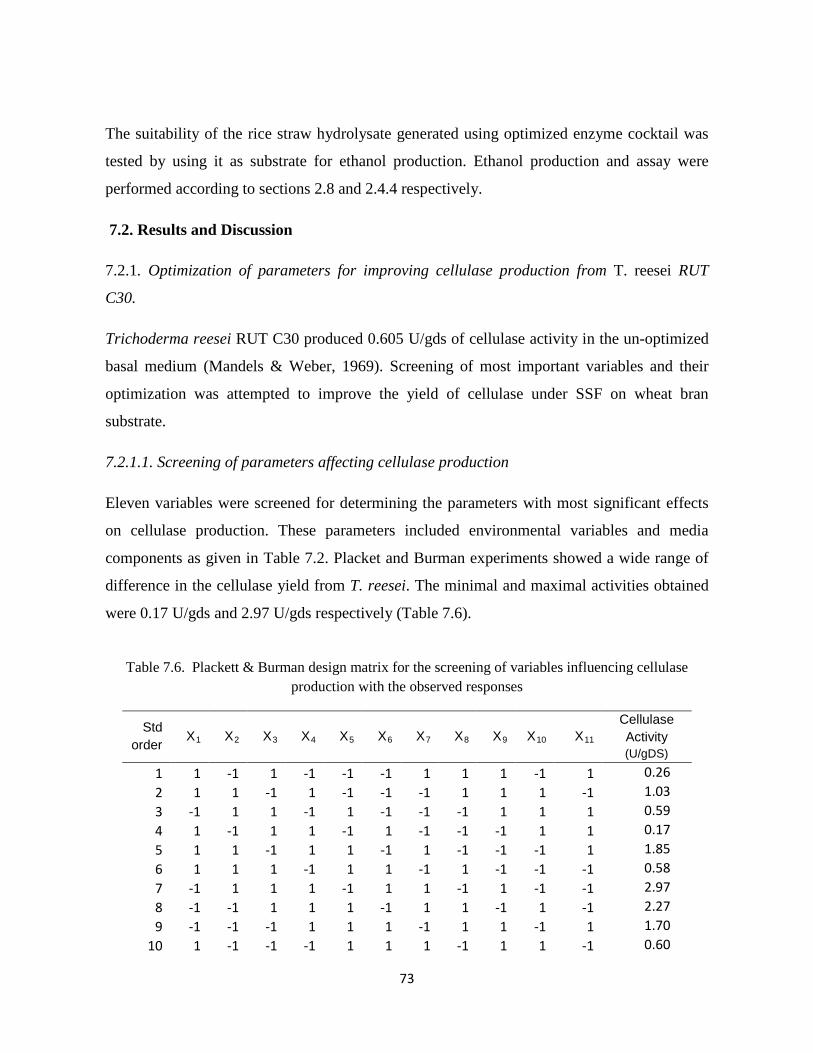
73
The suitability of the rice straw hydrolysate generated using optimized enzyme cocktail was
tested by using it as substrate for ethanol production. Ethanol production and assay were
performed according to sections 2.8 and 2.4.4 respectively.
7.2. Results and Discussion
7.2.1. Optimization of parameters for improving cellulase production from T. reesei RUT
C30.
Trichoderma reesei RUT C30 produced 0.605 U/gds of cellulase activity in the un-optimized
basal medium (Mandels & Weber, 1969). Screening of most important variables and their
optimization was attempted to improve the yield of cellulase under SSF on wheat bran
substrate.
7.2.1.1. Screening of parameters affecting cellulase production
Eleven variables were screened for determining the parameters with most significant effects
on cellulase production. These parameters included environmental variables and media
components as given in Table 7.2. Placket and Burman experiments showed a wide range of
difference in the cellulase yield from T. reesei. The minimal and maximal activities obtained
were 0.17 U/gds and 2.97 U/gds respectively (Table 7.6).
Table 7.6. Plackett & Burman design matrix for the screening of variables influencing cellulase production with the observed responses
Std order X1 X2 X3 X4 X5 X6 X7 X8 X9 X10 X11
Cellulase Activity (U/gDS)
1 1 -1 1 -1 -1 -1 1 1 1 -1 1 0.26 2 1 1 -1 1 -1 -1 -1 1 1 1 -1 1.03 3 -1 1 1 -1 1 -1 -1 -1 1 1 1 0.59 4 1 -1 1 1 -1 1 -1 -1 -1 1 1 0.17 5 1 1 -1 1 1 -1 1 -1 -1 -1 1 1.85 6 1 1 1 -1 1 1 -1 1 -1 -1 -1 0.58 7 -1 1 1 1 -1 1 1 -1 1 -1 -1 2.97 8 -1 -1 1 1 1 -1 1 1 -1 1 -1 2.27 9 -1 -1 -1 1 1 1 -1 1 1 -1 1 1.70
10 1 -1 -1 -1 1 1 1 -1 1 1 -1 0.60

74
11 -1 1 -1 -1 -1 1 1 1 -1 1 1 1.52 12 -1 -1 -1 -1 -1 -1 -1 -1 -1 -1 -1 2.04
The main effects of parameters on cellulase production were calculated as ε values as given
above (7.1.2.1A). The parameters with statistically significant effects were identified using
the Fisher’s test for analysis of variance (ANOVA). Initial moisture content (X1) and
incubation temperature (X7) had a confidence level higher than 95 % (P >F = 0.05 or lesser).
The ε-values (effect estimates of individual parameters on cellulase production) are
represented in Figure 7.1.
Figure 7.1. Influence of process parameters on cellulase production by T. reesei under SSF on wheat bran
It can be deduced that the cellulase production increased with increase in incubation
temperature and with a decrease in initial moisture content of the medium. Based on these
results, initial moisture content and incubation temperature were selected for further
optimization to improve cellulase production.
7.2.1.2. Optimization of the levels of significant parameters identified by Placket & Burman experiments

75
The two variables which showed a confidence level above 95% in the screening
experiment were selected and were optimized further using a central composite design (CCD).
Based on the results of Plackett & Burman experiment, the levels of media components were
set at their middle levels in the CCD with the following exceptions. The inducer cellobiose
was eliminated from the medium since it had an insignificant and negative effect. Particle size
had a positive effect and considering its role in proper aeration, the higher level was taken.
The level of Tween 80 was fixed at its lower level and incubation was performed till 96h
since the effects of surfactant and incubation time were negative. Table 7.7 shows the central
composite experiment design and the experimental and predicted responses obtained for
cellulase production by T. reesei.
Table 7.7. Responses obtained for the experimental runs for optimizing cellulase production using CCD design matrix with the corresponding predicted responses
The data was analyzed by multiple regression analysis and a second order polynomial
equation (Eqn.5) was derived to represent the cellulase production as a function of the
independent variables tested.
Std order
Block Moisture (%)
Temperature (oC)
Cellulase Activity (U/gds)
Observed Predicted
1 1 35 29 3.12 3.19 2 1 40 29 3.1 3.24 3 1 35 33 2.9 2.75 4 1 40 33 2.8 2.72 5 1 37.5 31 3.6 3.53 6 1 37.5 31 3.5 3.53 7 1 37.5 31 3.48 3.53 8 2 33.96 31 2.9 2.95 9 2 41.04 31 3 2.96
10 2 37.5 28.17 3.26 3.11 11 2 37.5 33.83 2.27 2.43 12 2 37.5 31 3.78 3.42 13 2 37.5 31 3.26 3.42 14 2 37.5 31 3.24 3.42

76
Y= 3.48 + 0.0026X1 - 0.24X2 - 0.23X12 - 0.32X2
2 - 0.02X1X2
(5)
Where Y = predicted response (cellulase yield), X1, X2 are coded values of initial moisture
content and incubation temperature respectively.
Testing of the model was performed by the Fisher’s statistical test for the analysis of
variance (ANOVA) using Design Expert software and the results are shown in Table 7.8.
ANOVA of the quadratic regression model suggests that the model is significant with a
computed F value of 7.26 and a p value lower than 0.05. The value of multiple correlation
coefficient (R) was 0.9156. The closer the value of R to 1, the better is the correlation
between the observed and predicted values and the R value obtained indicated a better
correlation. A lower value for the coefficient of variation suggests higher reliability of the
experiment and in this case the obtained CV value of 6.57 % demonstrated a greater reliability
of the trials. Table 7.8 also gives the P values of each of the parameters and their quadratic
and interaction terms. The significant influences on cellulase production were incubation
temperature, quadratic effects of initial moisture content and incubation temperature. The
significance of individual variables can be evaluated from their P values, the more significant
terms having a lower P value. The values of P>F less than 0.05 indicated that the model terms
are significant and this case X2, X1 2 and X2 2 were found to be significant model terms. There
was no significant interaction between the parameters.
Table 7.8 Analysis of variance for the selected quadratic model *
Source Sum of Squares
DF Mean Square
F Value
Prob > F
Model 1.564 5 0.3128 7.26 0.0108 X1 0.000 1 0.0001 0.00 0.9719 X2 0.461 1 0.4608 10.70 0.0137 X1 2 0.400 1 0.3999 9.28 0.0187 X2 2 0.781 1 0.7810 18.13 0.0038 X1X2 0.002 1 0.0016 0.04 0.8526 Residual 0.302 7 0.0431 Lack of Fit 0.106 3 0.0353 0.72 0.5898 Pure Error 0.196 4 0.0489 Corrected Total 1.910 13

77
* Coefficient of variation (CV) = 6.57 %, coefficient of determination (R2) =0.8384 correlation coefficient (R) = 0.9156, and adjusted R2 = 0.7229.
Response surface curve was plotted to understand the interaction effects of variables and for
identifying the optimal levels of each parameter for attaining maximal cellulase yield. Figure
7.2 A & B represent the response surface and the contour plot obtained for the effects of
incubation temperature and initial moisture content on cellulase yield respectively. The shapes
of contour plots indicate the nature and extent of the interactions. Prominent interactions are
shown by elliptical plots whereas less prominent or negligible or less prominent interactions
are shown by circular contour maps. It is clearly observed from the response surface and
contour plot that there is no significant interaction between the tested variables. Regardless of
the incubation temperature, the maximal cellulase yield was obtained at an initial moisture
content between 37 & 38 % and variations in initial moisture content did not affect the
temperature optima between 30 -31 oC, confirming the lack of interaction between these
parameters. The optimal temperature and initial moisture content was within these ranges
where the maximal activity of 3.52 U/gds was predicted by the model.
Figure 7.2 Three dimensional response surface (A) and the corresponding contour plot (B) for cellulase production in relation to initial moisture content and incubation temperature

78
Moisture content of the medium in SSF systems is an important parameter which affects the
productivity (Pandey et al, 1999). The moisture levels in SSF processes, which vary between
30 and 85 %, have a marked effect on growth kinetics (Oriol et al, 1988). The optimal
moisture content for growth of microorganisms differ with respect to the substrate since the
water holding capacity of substrates are different which have significant effects on water
activity- Aw (Reimbault M, 1998). Wheat bran has a higher water holding capacity compared
to the lignocellulosic substrates like sugar cane bagasse and this would account for the lower
value of initial moisture content for optimal yield of the enzyme. Effect of incubation
temperature is rather an organism dependent parameter. Though a large number experiments
for cellulase production has used an incubation temperature of 28 oC (Nakari-Setala &
Pentilla, 1995, Ilmen et al, 1997) the fungus had been cultivated largely at 30 oC for
production of the enzyme (Reczey et al, 1996, Gutierrez-Correa et al, 1999). In the current
study temperature was found to be the parameter with largest significant effect on cellulase
production. The regression equation (Eqn. 5) was solved using Design expert and the optimal
values for obtaining the highest yield was determined to be an initial moisture content of
37.56 % and an incubation temperature of 30 oC. At this combination the maximum predicted
yield was 3.52 U/gds.

79
7.2.1.3. Validation of the model The adequacy of the model equation (Eqn.5) was validated by performing a total of
three verification experiments within the experimental range as given in Table 7.9. The data
of the validation runs were also statistically analyzed to find the correlation between observed
and predicted values. The correlation coefficient (R) between experimental and predicted
values was found to be 0.9703 indicating that the group of experimental values is in good
agreement with those of the predicted demonstrating the accuracy of the model.
Table 7.9. Model validation experiments
Trial No.
Moisture (%)
Temperature (oC)
Cellulase Activity (U/gds)
Observed Predicted 1 36.0 30 3.58 3.49 2 37.0 30 3.8 3.58 3 37.5 30 3.78 3.59
Cellulase was produced under optimal conditions for further experiments on biomass
hydrolysis.
7.2.2. Preparation of Enzyme Cocktails and biomass hydrolysis
T. reesei cellulase and A. niger BGL were produced under the optimized conditions
for the preparation of enzyme cocktails. The enzymes were concentrated by acetone
precipitation (Enzyme: Acetone = 1:3) and the precipitates were resuspended in citrate buffer
(pH 4.8, 0.05M). The cellulase and BGL activities for each preparation were; T. reesei
enzyme – Cellulase- 8.98 FPUs/ml, BGL – 710 U/ml; A. niger enzyme – Cellulase -0.39
FPUs/ml, BGL – 9390 U/ml. Two different combinations of cellulase and BGL loading and
incubation times were tried for biomass saccharification using alkali pretreated rice straw as a
model substrate (Table 7.10). From the results presented in Table 7.10, it can be seen that
method B which used a BGL loading of 542 U along with 5 FPU cellulase per gram of
biomass; and an incubation time of 48 h performed much better than method A where there is
no supplementation of BGL. The results show that with the addition of BGL, the
saccharification efficiency has gone up 31 % (1.37 g/100ml to 2g/100ml). Alkali pretreated
Rice Straw had a composition of 60.41 % cellulose, 29.51% hemicellulose and 13.05% lignin

80
making the theoretical maximum of reducing sugar possible 1.006 g/g biomass (0.6706 g and
0.3352g of sugars from cellulose and hemicellulose fractions respectively). The maximum
efficiency of hydrolysis attained therefore was 39.73 %.
Table 7.10: Effect of BGL supplementation on saccharification of Rice straw
Method Cellulase (FPU/g)
Additional BGL (U/g)
Time (h)
Reducing Sugar Yield (mg/g)
A
5.00 0.00 24.00 202.90
5.00 0.00 48.00 273.10
B
5.00 542 24.00 315.44
5.00 542 48.00 399.63
Most of the commercial cellulases available are produced from T. reesei and
Aspergillus niger but T. reesei lack sufficient amount of β-glucosidase to perform a proper
and complete hydrolysis (Gusakov et al, 2007). Thus, the cellobiose accumulated due to an
incomplete conversion caused by the limiting amounts of β-glucosidase inhibits exo- and
endo-glucanases (Sukumaran et al, 2005). β -Glucosidases are also subject to product
inhibition by the glucose, beyond certain levels that vary between the different preparations
and sources of the enzyme. One way to solve this discrepancy is to add a glucose tolerant β-
glucosidase to the reaction mixture containing other cellulase components and to employ this
cocktail for biomass hydrolysis which would increase the efficiency of hydrolysis
(Sukumaran et al, 2005). The result indicates the importance of supplementing BGL and also
indicates that with further optimizations in the enzyme cocktail and other parameters, an even
higher efficiency may be achieved. Alkali treatment tends to preserve the hemicellulose
polymer and remove lignin (Grey et al, 2006). Rice straw contains up to 25-30% lignin and
the removal of lignin facilitates the loosening of cellulose fibers making them accessible to
the cellulase. Cellulases need to penetrate the polymer to access and hydrolyze it. Cellulases
have specific domains for binding their substrate so that the enzyme sits on the polymer and
effects a slow degradation (reviewed in Lynd et al, 2002) which probably could be the reason
for more efficient hydrolysis at an increased incubation time.

81
7.2.3. Optimization of enzyme cocktails for biomass saccharification
Reducing sugar yields from the different runs ranged between 373 mg/g to 535mg/g which
represented conversion efficiencies of 37.1 % and 53.2 % of the theoretical maximum (1006
mg/g) respectively. The responses obtained for each experimental run performed according to
the Box Behnken design as represented in Table 7.11, were analyzed by multiple regression
analysis and a second order polynomial equation (Eqn.6) was derived to represent the
cellulase production as a function of the independent variables tested. Maximal reducing
sugar yield obtained was 53.2 % of the theoretical maximum and 1.34 fold (34%)
improvement over method B (Section 7.2.2) above.

82
Table 7.11. Responses obtained for the experimental runs for optimizing biomass hydrolysis using Box-Behnken design matrix
Std Cellulase
(FPUs/g) X1 Additional BGL
(U/g) X2 Time (h) X3
Reducing sugar (mg) Y
1 25 542 36 392 2 50 542 36 472 3 25 1626 36 436 4 50 1626 36 494 5 25 1084 24 373 6 50 1084 24 493 7 25 1084 48 445 8 50 1084 48 528 9 37.5 542 24 477
10 37.5 1626 24 482 11 37.5 542 48 516 12 37.5 1626 48 535 13 37.5 1084 36 447 14 37.5 1084 36 466 15 37.5 1084 36 456 16 37.5 1084 36 461 17 37.5 1084 36 456
Y = 457.2 + 42.62X1 + 11.25X2 + 24.88X3 – 25.72X12 + 17.03X2
2 +28.27X32
– 5.5X1X2 -9.25X1X3 + 3.5X2X3 (6)
Where Y = predicted response (reducing sugar yield), X1, X2 and X3 are coded values of
cellulase loading, BGL loading and residence time respectively. Testing of the model was
performed by the Fisher’s statistical test for the analysis of variance (ANOVA) using Design
Expert software and the results are presented in Table 7.12.
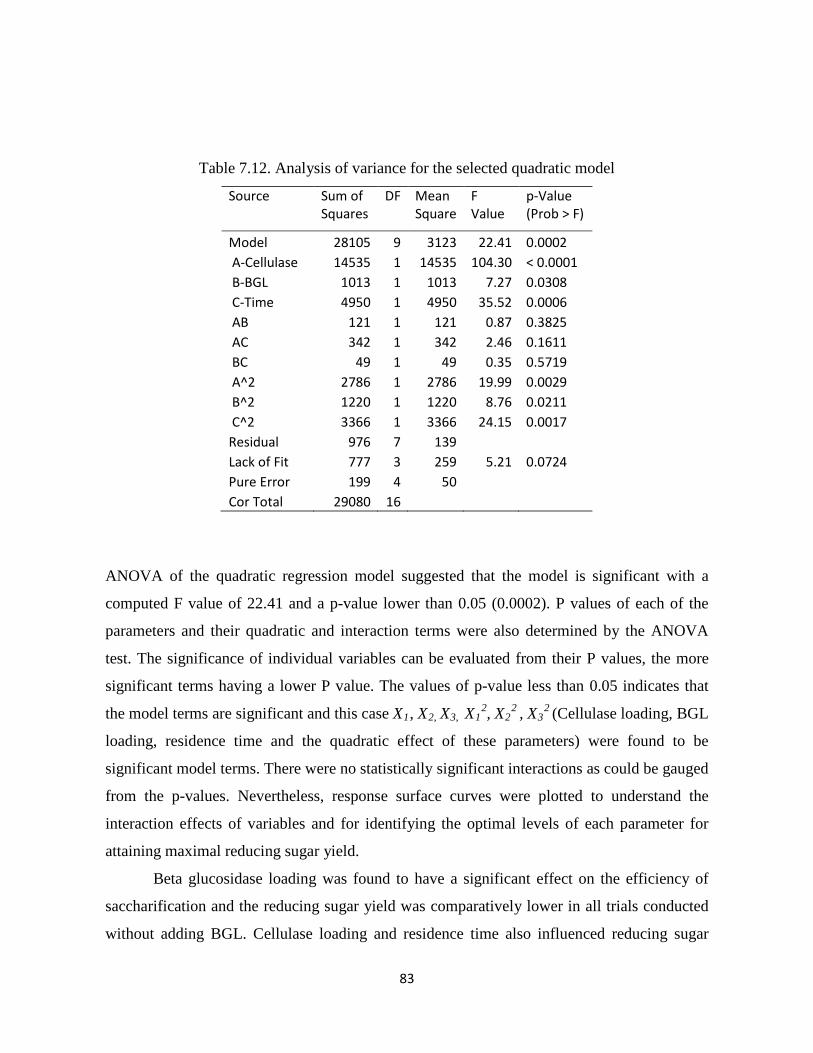
83
Table 7.12. Analysis of variance for the selected quadratic model
Source Sum of Squares
DF Mean Square
F Value
p-Value (Prob > F)
Model 28105 9 3123 22.41 0.0002 A-Cellulase 14535 1 14535 104.30 < 0.0001 B-BGL 1013 1 1013 7.27 0.0308 C-Time 4950 1 4950 35.52 0.0006 AB 121 1 121 0.87 0.3825 AC 342 1 342 2.46 0.1611 BC 49 1 49 0.35 0.5719 A^2 2786 1 2786 19.99 0.0029 B^2 1220 1 1220 8.76 0.0211 C^2 3366 1 3366 24.15 0.0017 Residual 976 7 139
Lack of Fit 777 3 259 5.21 0.0724 Pure Error 199 4 50
Cor Total 29080 16
ANOVA of the quadratic regression model suggested that the model is significant with a
computed F value of 22.41 and a p-value lower than 0.05 (0.0002). P values of each of the
parameters and their quadratic and interaction terms were also determined by the ANOVA
test. The significance of individual variables can be evaluated from their P values, the more
significant terms having a lower P value. The values of p-value less than 0.05 indicates that
the model terms are significant and this case X1, X2, X3, X12, X2
2 , X32 (Cellulase loading, BGL
loading, residence time and the quadratic effect of these parameters) were found to be
significant model terms. There were no statistically significant interactions as could be gauged
from the p-values. Nevertheless, response surface curves were plotted to understand the
interaction effects of variables and for identifying the optimal levels of each parameter for
attaining maximal reducing sugar yield.
Beta glucosidase loading was found to have a significant effect on the efficiency of
saccharification and the reducing sugar yield was comparatively lower in all trials conducted
without adding BGL. Cellulase loading and residence time also influenced reducing sugar

84
yield significantly. The longer residence time of 48h was better for saccharification. The
reason could be that cellulases need to penetrate the polymer to access and hydrolyze it,
unlike many common enzymes which take in their substrates to the active site pockets.
Cellulases have specific domains for binding their substrate so that the enzyme sits on the
polymer and effects a slow degradation (Lynd et al, 2002). At the levels added, the effect of
FPAse concentration however was the highest, indicating that the initial steps in cellulose
hydrolysis are critical. BGL activity of T. reesei cellulase can itself drive a saccharification
reaction but the addition of exogenous BGL improves the efficiency and reducing sugar yield.
Quadratic effects of all the 3 parameters were also significant. Response surface plots were
generated for the effect of different parameters (Figure 7.3-7.5).
Figure 7.3, Combined effect of T. reesei cellulase and A. niger BGL on biomass saccharification
Maximal biomass saccharification was obtained with a cellulase loading of 50FPUs/g and an
additional BGL loading of 1626 U/ml both of which were the higher extremes tested.

85
Figure 7.4, Effect of cellulase loading and residence time on sugar yield
Both at higher and lower cellulase loadings, increase in residence time resulted in a better
yield of sugars. Highest reducing sugar yield was observed at 50FPUs/g cellulase loading and
with a residence time of 48h.
Figure 7.5. Effect of BGL loading and residence time on sugar yield

86
Similar to the effect of cellulase, with both lower and higher BGL loadings, there was an
increase in sugar yield when the residence time was increased. Highest yield of sugar was
obtained with the highest BGL loading and residence time. Though the interaction effects
were insignificant, response surface analyses indicated that a higher cellulase loading should
improve the sugar yield and with increase in cellulase loading, a corresponding increase in
BGL concentration was essential to maintain the hydrolysis.
The optimal combination of variables for obtaining higher saccharification efficiency was
predicted using the numerical optimization function in Design Expert. The top 5 solutions are
given in Table 7.13.
Table 7.13. Optimized combination of parameters predicted for increasing saccharification efficiency
Sl # Cellulase
(FPUs/g) BGL
(U/g) Time (h) Predicted
Reducing sugar yield (mg/g)
1 37 1582 48 536 2 46 1511 47 536 3 49 1596 48 542 4 44 1526 48 540 5 38 1626 48 542
The experiment proved the indispensable role of BGL in saccharification and the
improvement in efficiency which can be achieved with addition of even a moderately glucose
tolerant beta-glucosidase (Since the crude BGL preparation from A. niger NII 08121 has a Ki
of ~200mM). The obtained efficiency of ~ 53 % of theoretical maximum is not very high.
Nevertheless it was achieved with a highly recalcitrant biomass with the minimal
pretreatment. Improvement in pretreatment strategies and also further optimization of enzyme
cocktails and saccharification conditions can definitely improve the saccharification
efficiencies.

87
7.2.4. Ethanol production from rice straw hydrolysate
Enzymatic hydrolysate of rice straw was concentrated by evaporation to a reducing
sugar concentration of 60g/L or 120g/L and was used for the fermentation experiments. The
results of the fermentation of alkali pretreated and enzymatically saccharified rice straw are
given in Table 7.14. The maximum ethanol concentration (25.56g/L) was obtained after 24h
using hydrolysate with 12% reducing sugar. With the hydrolysate having initial reducing
sugar concentration of 6%, the maximum ethanol concentration obtained was 12.34 g/L in
24h. The ethanol yield obtained was 0.093g and 0.096g per gram of dry substrate (gDS) for
initial sugar concentrations of 6% and 12% respectively.
The results indicated that concentration of hydrolysate is needed to obtain an ethanol
yield which is needed practically for a distillation step (>5% v/v). However, the efficiency
attained for sugar to ethanol conversion was only ~40% which could be due to the presence of
inhibitors of yeast growth in the hydrolysate. Concentration of the hydrolysate results in
concentration of the inhibitors present in it. This might prevent yeast growth and hence the
production of ethanol which could be the reason for a lower efficiency in alcohol production.
These points to the necessity of a detoxification step before the hydrolysate is used for
fermentation to produce alcohol.
Table 7.14: Ethanol production from rice straw hydrolysate by Saccharomyces cerevisiae
Reducing sugar (RS)
concentration. (g/L)
Duration of
incubation (h)
Ethanol Concentration
(g/L)
Ethanol Yield
(g/gDS)
Efficiency (RS to
ethanol) %
60 24 12.34 0.093 40.33 120 24 25.56 0.096 41.76
7.3. Conclusions
The study demonstrates the feasibility of using crude T. reesei RUT C30 cellulase and
A. niger NII 08121 β-glucosidase in combination for hydrolysis of biomass residues (at least

88
pretreated rice straw), and shows the effectiveness of enzyme cocktails over preparations from
single sources. Optimization of enzyme cocktail was performed using pretreated rice straw as
feedstock and hence would be more effective for the saccharification of this biomass type.
However, the study brings about the potential of optimized enzyme cocktails for biomass
saccharification in general. The experiment proves the indispensable role of BGL in
saccharification and the improvement in efficiency which can be achieved with addition of
even a moderately glucose tolerant beta-glucosidase. Enzymatically hydrolyzed biomass was
successfully fermented to alcohol. Further optimization of the cocktails to suit particular
biomass type and the design of efficient fermentation strategies can tremendously improve the
biomass-to-ethanol process.
The BGL preparation from A. niger NII 08121 was successfully demonstrated as a
potent enzyme for efficient biomass hydrolysis. The enzyme preparation can be used in the
formulation of highly efficient enzyme cocktails. Since the production of A. niger BGL is
easy, cost and time efficient when produced using solid state fermentation, an since the titers
of enzyme is high, the organism can be considered for industrial production of BGL for
biomass hydrolyzing enzyme cocktail preparations.

Chapter 8
Summary & Conclusions

88
Chapter 8 Summary and Conclusions
8.1. Summary
Beta- Glucosidases (BGLs) are enzymes that hydrolyze aryl beta-glucosides and/or
cellobiose and cello-oligosaccharides. In cellulolytic fungi, BGL completes the final step in
cellulose hydrolysis by converting cellobiose to glucose. In several fungi, especially
Trichoderma reesei the best known cellulase producer, the enzyme is produced in lower
quantities compared to the other two classes of cellulases, and it is slow acting, making BGL
the rate limiting component in cellulose hydrolysis. The less abundance of BGL even under
conditions of cellulase induction and the product inhibition to which it is susceptible, limits
the use of native cellulase preparations in lignocellulosic biomass hydrolysis for alcohol
production.
Glucose tolerant BGL can circumvent the problem of feedback inhibition, and if
available in an enzyme cocktail for biomass hydrolysis can improve the efficiency of
hydrolysis by shifting the equilibrium towards a higher product concentration than otherwise
achievable. Few species of Aspergilli are known to produce glucose tolerant β-glucosidases
and some of these enzymes have been cloned and characterized. It is expected that more of
such glucose tolerant BGLs may be prevalent in nature especially in filamentous fungi.
Isolation of such enzymes and knowledge about their properties, sequences and expression
patterns can help in design of better enzyme cocktails for biomass hydrolysis as well as in
targeted approaches for modifying the glucose tolerance of existing BGLs.
An Aspergillus strain was isolated at NIIST from decaying wood which produced
BGL that was active at 0.5M Glucose concentration. The fungus was identified as Aspergillus
niger and was deposited in NII culture collection with accession number NII 08121. Multiple
BGL isoforms could be detected in this fungus by Native PAGE followed by activity staining
using a fluorescent substrate for BGL. The isoforms were differentially induced in response
to carbon sources and four isomers were detected, two of which showed glucose tolerance at
250mM glucose. Degenerate primers designed for BGL gene belonging to families 1, 3 and 5
of glycosyl hydrolases could amplify stretches from the genomic DNA. The amplicons on
89
sequencing confirmed homology to BGLs belonging to respective families indicating
presence of BGLs belonging to all three families glycosyl hydrolases in the fungus. The major
BGL which was the highly expressed isoform in native strain was purified and characterized.
It was 120kDa in size and was most active at pH 5.0 and stable at 50°C till 72 hours. It
retained more than 90% of the activity up to 48h which indicated the suitability for biomass
hydrolysis.
Conditions for BGL production were optimized in Solid State Fermentation (SSF)
employing A. niger which resulted in improved enzyme yield. The enzyme produced under
SSF retained 19 % activity in presence of 0.25M glucose. The major beta glucosidase (BGL1)
of this fungus showed interesting properties including an optimum temperature of 70 °C,
optimum pH of 5.0 and extended stability at 50 oC for more than 48h. To test the efficacy of
A. niger BGL in biomass saccharification and ethanol production, enzyme blends were
created using T. reesei cellulase. Cellulase production from T. reesei under solid state
fermentation was optimized and the enzyme was produced using this fungus under optimized
conditions for saccharification trials. T. reesei cellulase and the BGL from A. niger were used
to create blends for biomass hydrolysis. Optimized enzyme cocktails were derived for
efficient hydrolysis of pretreated rice straw, and the hydrolysate was used to demonstrate
ethanol production by alcohol fermentation employing Saccharomyces cerevisiae.
The study has helped to reveal the property of differential induction of BGL isoforms
in Aspergillus niger which can be used to manipulate culture conditions to produce the
desired isoform in excess. Also, a laboratory process for producing BGL enzyme in high titers
was derived. Major BGL isoform was purified and characterized and partial gene sequences
of BGLs belonging to families 1, 3 and 5 of glycosyl hydrolases were obtained. This
information would be very useful in isolating the full length cDNAs of these genes for further
studies and possible over expression in suitable vectors.
8.2 Conclusions
Aspergillus niger NII 08121 isolated at NIIST was revealed to be a potent source of β-
glucosidase for biomass conversion. The fungus produced very high titers of the enzyme and

90
also exhibited moderate glucose tolerant –properties that are useful in biomass hydrolysis.
The study provided also conclusive evidence to the fact that multiple BGLs are expressed in
A. niger differentially in response to the carbon source provided in the culture medium.
Carbon source and other components play an important role to direct the metabolic pathway
of A. niger towards production of a desired metabolite. Careful leveraging of the medium
components could be useful for enhanced production of specific BGL isoforms in the fungus.
The major BGL from A. niger NII 08121 can be considered as a potent candidate for
use in biomass hydrolysis due to its enhanced thermal stability and high activity under
hydrolysis conditions.
Molecular cloning of the partial gene sequences confirmed the presence of BGL
belonging to different glycosyl hydrolases families which points to the multiple roles these
enzymes play in the organism. It would be interesting to look at the physiological roles of
these different BGL isoforms and the information on partial gene sequences would greatly aid
in undertaking such studies.
The study also demonstrated the feasibility of using crude T. reesei RUT C30 cellulase
and A. niger NII 08121 β-glucosidase in combination for hydrolysis of biomass residues and
showed the effectiveness of enzyme cocktails over preparations from single sources. The
study therefore brings about the potential of optimized enzyme cocktails for biomass
saccharification in general. It has also proved the indispensable role of BGL in
saccharification and the improvement in efficiency which can be achieved with addition of
even a moderately glucose tolerant beta-glucosidase.
The BGL preparation from A. niger NII 08121 was successfully demonstrated as a
potent enzyme for efficient biomass hydrolysis and the characteristic of the major BGL was
established. A. niger NII 08121 is a fast grower and producer of BGL in high titers and
therefore could be considered for industrial production of BGL for biomass hydrolyzing
enzyme cocktail preparations.

REFERENCES

91
References 1. Abdel-Fattah AF, Osman MY Abdel-Naby MA (1997) Production and immobilization
of cellobiase from Aspergillus niger A20. Chem. Eng. J. 68: 189–96. 2. Altschul SF, Gish W, Miller W, Myers EW, Lipman DJ (1990) Basic local alignment
search tool. J. Mol. Biol.215 (3): 403-410.
3. Aspergillus niger v3, Joint Genome Initiative, Genome sequence data produced by the US Department of Energy Joint Genome Institute. http://www.jgi.doe.gov/ in collaboration with the user community. http://genome.jgi-psf.org/Aspni5/Aspni5.download.html., Recent Access- November 26, 2010.
4. Badhan A, Chadha, BS, Kaur J, Saini HS, Bhat MK (2007a) Role of
transglycosylation products in the expression of multiple xylanases in Myceliophthora sp. IMI 387099. Curr. Microbiol. 54: 405–409.
5. Badhan AK, Chadha BS, Kaur J, Saini HS, Bhat MK (2007b) Production of multiple
xylanolytic and cellulolytic enzymes by thermophilic fungus Myceliophthora sp. IMI 387099. Bioresour. Technol. 98: 504–510
6. Barnett CC, Berka RM, Fowler T (1991) Cloning and amplification of the gene
encoding an extracellular beta-glucosidase from Trichoderma reesei: evidence for improved rates of saccharification of cellulosic substrates. Bio/Technology 9:562–56.
7. Bell DJ, Hoare M, Dunnill P (1983) The formation of protein precipitates and their
centrifugal recovery. Adv Biochem Eng/Biotechnol 26:1–57.
8. Bhatia Y, Mishra S, Bisaria VS (2002) Microbial beta-glucoidases: Cloning, Properties and Applications. Crit. Rev. Biotechnol. 22(4): 375-407.
9. Bisaria VS, Mishra S (1989) Regulatory aspects of cellulase biosynthesis and
secretion. CRC Crit. Rev. Biotechnol. 9: 61-103.
10. Bowyer P, Clarke BR, Lunness P, Daniels MJ, Osbourn AE (1995) Host range of a plant pathogenic fungus determined by a saponin detoxifying enzyme. Science 267:371–374.
11. Box GEP, Wilson KB (1951) On the experimental attainment of optimum conditions. J. Royal. Stat. Soc. Ser. B. 13: 1–45
12. Bradley JD, Whitaker JN (1986) Isolation and characterization of cathepsin B from
bovine brain. Neurochem. Res. 11(6): 851-67.

92
13. Brzobohatý B, Moore I, Kristoffersen P, Bako L, Campos N, Schell J, Palme K (1993) Release of active cytokinin by a beta-glucosidase localized to the maize root meristem. Science. 262(5136):1051-1054.
14. Cantarel BL, Coutinho PM, Rancurel C, Bernard T, Lombard V and Henrissat B
(2009) The Carbohydrate-Active EnZymes database (CAZy): an expert resource for glycogenomics. Nucleic Acids Res. 37:D233–D238.
15. Chang HN, Chung, BH (1990) Method for continuously producing citric acid by dual
hollow fiber membrane bioreactor, US Patent # 4910139 assigned to Korea Advanced Institute of Science and Technology, Seoul, March 20, 1990.
16. Chen HC (1994) Response surface methodology for optimizing citric acid
fermentation by Aspergillus foetidus. Process Biochem. 29: 399 – 405.
17. Chen M, Qin Y, Liu Z, Liu K, Wang F, Qu L (2010) Isolation and characterization of a β-glucosidase from Penicillium decumbens and improving hydrolysis of corncob residue by using it as cellulase supplementation, Enz. Microb. Technol. 46(6): 444-449.
18. Collins CM, Murray PG, Denman S, Morrissey JP, Byrnes L, Teeri TT and Tuohy
MG (2007) Molecular cloning and expression analysis of two distinct beta-glucosidase genes - bg1 and aven1, with very different biological roles from the thermophilic, saprophytic fungus Talaromyces emersonii. Mycol. Res. 111(7): 840-849.
19. Collins, T., Gerday, C., & Feller, G. (2005). Xylanases, xylanase families and
extremophilic xylanases. FEMS Microbiol. Rev. 29: 3–23.
20. Dan S, Marton I, Dekel M, Bravdo BA, He S, Withers SG, Shoseyov O (2000) Cloning, expression, characterization, and nucleophile identification of family 3, Aspergillus niger beta-glucosidase. J. Biol. Chem. 275(7): 4973-80.
21. Decker CH, Visser J, Schreier P (2000) β-Glucosidases from Five Black Aspergillus
Species: Study of Their Physico-Chemical and Biocatalytic Properties. J. Agric. Food Chem. 48: 4929-4936.
22. Decker SR, Teter S (2008) Introduction to Session 2: Enzyme Catalysis and
Engineering. Appl. Biochem. Biotechnol. 146(1-3): 1-2.
23. Dekker RFH (1986) Kinetic, inhibition, and stability properties of a commercial beta-D-glucosidase (cellobiase) preparation from Aspergillus-niger and its suitability in the hydrolysis of lignocellulose. Biotechnol. Bioeng. 28:1438-1442.

93
24. Dixon M (1953) The determination of enzyme inhibitor constants. Biochem J. 55:170-171.
25. Esen, A (1993) β-glucosidases: overview, In Esen A (ed), β-
Glucosidases:Biochemistry and Molecular Biology, American Chemical Society,Washington, DC, 1–14.
26. Fang X, Yano S, Inoue H, Sawayama S (2008) Lactose enhances cellulase production
by the filamentous fungus Acremonium cellulolyticus, J. BioSci. Bioeng. 106 (2): 115-120.
27. Fekete E, Seiboth B, Kubicek CP, Szentirmai A, Karaffa L (2008) Lack of aldose 1-
epimerase in Hypocrea jecorina (anamorph Trichoderma reesei): A key to cellulase gene expression on lactose, Proc. Nat. Acad. Sci. USA, 105: 7141-7146.
28. Fowler T, Brown RD Jr. (1992) The bgl1 gene encoding extracellular -glucosidase
from Trichoderma reesei is required for rapid induction of the cellulase complex. Mol. Microbiol. 6: 3225–3235.
29. Galas E, Romanowska I (1997) Purification and some properties of beta-glucosidase
from Aspergillus niger IBT-90. Acta Microbiol Pol. 46(3: 241-52
30. Genencor , 2010, http://www.genencor.com/wps/wcm/connect/genencor/genencor/products_and_services/business_development/biorefineries/accellerase/accellerase_product_line/accellerase_product_line_en.htm
31. Ghose TK (1987) Measurement of cellulase activities. Pure Appl. Chem. 59: 257–68.
32. Ghose, TK, Bisaria VS (1987) Measurement of Hemicellulase Activities, Part I-
Xylanases. Pure AppI. Chem. 59(12): 1739—1752.
33. Ghosh P, Ghose TK (2003) Bioethanol in India: recent past and emerging future. Adv Biochem. Eng. Biotechnol. 85:1-27.
34. Gilbert HJ, Stalbrand H, Brumer H (2008) How the walls come tumbling down: recent
structural biochemistry of plant polysaccharide degradation. Curr. Opin. Plant. Biol. 11: 338–348.
35. Greasham R, Inamine E (1986) Nutritional Improvement of processes. In Manual of
Industrial Microbiology. Demain A L and Solomon N A (Eds). Pp 41-48. American Society for Microbiology, Washington D.C.
36. Grey KA, Zhao L, Emptage M (2006) Bioethanol. Curr. Opin. Chem. Biol.10:141–6.

94
37. Gulati A, Mahadevan S (2000) Mechanism of catabolite repression in the bgl operon
of Escherichia coli: involvement of the anti-terminator BglG, CRP-cAMP and EIIAGlc in mediating glucose effect downstream of transcription initiation, Genes to Cells 5(4): 239–250.
38. Günata Z, Dugelay I, Sapis JC, Baumes R, Bayonove C (1993) Role of enzymes in the
use of flavour potential from grape glycosides in winemaking. In: Schreier P, Winterhalter P, eds. Progress in Flavour Precursor Studies. Carol Stream, IL: Allured Publishing Corporation, pp. 219–234.
39. Gunata Z, Vallier MJ (1999) Production of a highly glucose-tolerant extracellular β-
glucosidase by three Aspergillus strains. Biotechnol. Lett. 21:219–223.
40. Gusakov AV, Salanovich TN, Antonov AI, Ustinov BB, Okunev ON, Burlingame R, Emalfarb M, Baez M, Sinitsyn AP (2007) Design of highly efficient cellulase mixtures for enzymatic hydrolysis of cellulose. Biotechnol. Bioeng 97:1028–38.
41. Gutierrez-Correa M, Portala L, Moreno P, Tengerdy RP (1999) Mixed culture solid
substrate fermentation of Trichoderma reesei with Aspergillus niger on sugar cane bagasse. Bioresour. Technol. 68: 173-178.
42. Henikoff JG, Greene EA, Pietrokovski S, Henikoff S (2000) Increased coverage of
protein families with the blocks database servers. Nucl. Acids Res. 28: 228-230. 43. Henrissat B (1991) A classification of glycosyl hydrolases based on amino acid
sequence similarities. Biochem. J. 280: 309–316. 44. Henrissat B, Bairoch A (1996) Updating the sequence-based classification of glycosyl
hydrolases. Biochem. J. 316: 695-696.
45. Herpoël-Gimbert I, Margeot A, Dolla A, Jan G, Molle D, Lignon S, Mathis H, Sigoillot JC, Monot F, Asther M (2008) Comparison secretome analysis of two Trichoderma reesei RUT-C30 and CL847 hyper secretory strains. Biotechnol. Biofuels 1:1-18.
46. Hrmova M, Petrakova E, Biely P (1991) Induction of cellulose- and xylan-degrading
enzyme systems in Aspergillus terreus by homo- and heterodisaccharides composed of glucose and xylose. J. Gen. Microbiol. 137: 541–547.
47. Hung CY, Yu JJ, Lehmann PF, Cole GT (2001) Cloning and expression of the gene
which encodes a tube precipitin antigen and wall associated β-glucosidase of Coccidioides immitis. Infect. Immun. 69: 2211–2222.

95
48. Ilmen M, Saloheimo A, Onnela ML, Penttila ME (1997) Regulation of cellulase gene expression in the filamentous fungus Trichoderma reesei. Appl. Environ. Microbiol., 63: 1298-1306.
49. Iwashita K, Nagahara T, Kimura H, Takano M, Shimoi H, Ito K (1999) The bglA gene
of Aspergillus kawachii encodes both extracellular and cell wall-bound β-glucosidases, Appl. Environ. Microbiol. 65(12): 5546-5553.
50. Jenkins J, Leggio, LL, Harris G, Pickersgill R (1995). β-Glucosidase, β-galactosidase,
family A cellulases, family F xylanases and two barley glycanases form a superfamily of enzymes with a 8-fold α/β architecture and with two conserved glutamates near the carboxy-terminal ends of β-strands four and seven. FEBS Lett. 362: 281-285.
51. Johansson G, Reczey K (1998) Concentration and purification of beta-glucosidase
from Aspergillus niger by using aqueous two-phase partitioning. J Chromatogr. B. Biomed Sci. Appl. 711(1-2):161-72.
52. Jørgensen H, Mørkeberg A, Krogh KBR, Olsson L (2004) Growth and enzyme
production by three Penicillium species on monosaccharides, J. Biotechnol. 109: 295–299.
53. Kalendar R, Lee D, Schulman AH (2009) FastPCR Software for PCR primer and
probe design and repeat search. Genes Genom. Genomics. 3:1-14.
54. Kaper T, Lebbink JHG, Pouwels J, Kopp J, Schulz GE, van der Oost J, de Vos WM (2000). Comparative structural analysis and substrate specificity engineering of the hyperthermostable β-glucosidase CelB from Pyrococcus furiosus. Biochemistry 39: 4963-4970.
55. Ketudat Cairns JR, Esen A (2010) β-Glucosidases, Cell. Mol. Life Sci. 37: 3389-
3405.
56. Kim KH, Brown KM, Harris PV, Langstaon JA, Cherry JR (2007) A proteomics strategy to discover β-Glucosidases from Aspergillus fumigatus with two-dimensional page in-gel activity assay and tandem mass spectrometry. J. Proteome Res. 6 (12): 4749–4757.
57. Krogh KBR, Mørkeberg A, Jørgensen H, Frisvad JC, Olsson L (2004) Screening
genus Penicillium for producers of cellulolytic and xylanolytic enzymes. Appl Biochem Biotechnol 113–116: 389–401.
58. Krogh, KBR, Harris PV, Olsen CL, Johansen KS, Hojer-Pedersen J, Borjesson J,
Olsson L (2010) Characterization and kinetic analysis of a thermostable GH3 β-

96
glucosidase from Penicillium brasilianum. Appl. Microbiol. Biotechnol. 86 (1): 143-154.
59. Kubicek CP (1987) Involvement of a conidial endoglucanase and a plasma-membrane
bound ß-glucosidase in the induction of endoglucanase synthesis by cellulose in Trichoderma reesei, J. Gen. Microbiol. 133: 1481–1487.
60. Kumar R, Singh S, Singh OV (2008) Bioconversion of lignocellulosic biomass:
biochemical and molecular perspectives. J. Ind. Microbiol. Biotechnol. 35:377-391.
61. Kwon KS, Kang HG, Hah YC (1992) Purification and characterization of two extracellular β-glucosidases from Aspergillus nidulans. FEMS Microbiol. Lett. 97: 149–154.
62. Laemmli UK (1970) Cleavage of structural proteins during the assembly of the head
of bacteriophage T4. Nature 227:680-686.
63. Langston J, Sheehy N, Xu F (2006) Substrate specificity of Aspergillus oryzae family 3 β-glucosidase, Biochim. Biophys. Acta (BBA) - Proteins & Proteomics 1764 (5): 972-978.
64. Larkin MA, Blackshields G, Brown NP, Chenna R, McGettigan PA, McWilliam H,
Valentin F, Wallace IM, Wilm A, Lopez R, Thompson JD, Gibson TJ, Higgins DG (2007) ClustalW and ClustalX version 2. Bioinformatics 23: 2947-2948.
65. Lieberman RL, Wustman BA, Huertas P, Powe AC. Jr, Pine CW, Khanna R,
Schlossmacher MG, Ringe D, Petsko GA (2007) Structure of acid β-glucosidase with pharmacological chaperone provides insight into Gaucher disease. Nat. Chem. Biol. 3: 101–107.
66. Liu JZ, Weng LP, Zhang QL, Xy H, Ji LN (2003) Optimization of glucose oxidase
production by Aspergillus niger in a benchtop bioreactor using response surface methodology, World J. Microbiol. Biotechnol. 19(3):317-323.
67. Lo Leggio L, Kalogiannis S, Eckert K, Teixeira SC, Bhat MK, Andrei C, Pickersgill
RW, Larsen S (2001) Substrate specificity and subsite mobility in T. aurantiacus xylanase 10A. FEBS Lett. 509(2): 303-308
68. Lowry OH, Rosebrough NJ, Farr AL, Randall RJ (1951) Protein measurement with
the folin phenol reagent. J Biol. Chem. 193: 265-75.
69. Lymar ES, Li B, Renganathan V (1995) Purification and characterization of a cellulose-binding β-glucosidase from cellulose degrading cultures of Phanerochaete chrysosporium. Appl. Environ Microbiol. 61:2976–2980.

97
70. Lynd LR, Weimer PJ, van Zyl WH, Pretorious IS (2002) Microbial cellulase utilization: fundamentals and biotechnology. Microbiol. Mol. Biol. Rev. 66:506–77.
71. Mach RL, Seiboth B, Myasnikov A, Gonzalez R, Strauss J, Harkki AM and Kubicek
CP (1995) The bgl1 gene of Trichoderma reesei QM 9414 encodes an extracellular, cellobiose-inducible -glucosidase involved in cellulase induction by sophorose. Mol. Microbiol. 15: 687–697.
72. Mandels M, Weber J (1969) The production of cellulases, Adv. Chem. Ser. 95: 391–
413.
73. Marshall OJ (2004) PerlPrimer: cross-platform, graphical primer design for standard, bisulphite and real-time PCR. Bioinformatics. 20: 2471-2472.
74. Merril CR, Goldman D, Sedman SA, Ebert MH (1981) Ultrasensitive Stain for
Proteins in Polyacrylamide Gels Shows Regional Variation in Cerebrospinal Fluid Proteins. Science. 211:1437.
75. Meyer AS, Rosgaard L, Sørensen HR (2009) The minimal enzyme cocktail concept
for biomass processing. J. Cereal Sci. 50(3):337-344.
76. Miller GM (1959) Use of dinitrosalicylic acid reagent for determination of reducing sugar. Anal Chem. 31: 426–428.
77. Mishima D, Tateda M, Ike M, Fujita M (2006) Comparative study on chemical
pretreatments to accelerate enzymatic hydrolysis of aquatic macrophyte biomass used in water purification processes. Bioresour Technol. 97(16): 2166–72.
78. Mohagheghi A, Tucker M, Grohmann K,Wyman C (1992) High solids simultaneous
saccharification and fermentation of pretreated wheat straw to ethanol. Appl. Biochem. Biotechnol. 33:67-81.
79. Monaghan RL, Koupal LR (1989) Use of the Plackett Burman technique in a
discovery program for new natural products. In: Topics in Industrial Microbiology. Editors: A. Demain, G. Somkuti, J. Hunter-Cevera and H. W. Rossmoore. pp. 25-32.
80. Morikawa Y, Ohashi T, Mantani O, Okada H (1995) Cellulase induction by lactose in
Trichoderma reesei PC-3-7. Appl. Microbiol. Biotechnol. 44(1-2):106-111.
81. Nakari-Setala T, Pentilla M (1995) Production of Trichoderma reesei cellulases on glucose-containing media. Appl. Environ. Microbiol. 61: 3650–3655.

98
82. Nazir A, Soni R, Saini HS, Kaur A, Chadha BS (2010) Profiling Differential Expression of Cellulases and Metabolite Footprints in Aspergillus terreus. Appl. Biochem. Biotechnol. 162:538–547.
83. Neijssel OM (1979) The interaction between microorganisms and their growth
environment. Antonie van Leeuwenhoek. 45(2):, 313-314.
84. Nelson PR (1982) "Exact Critical Points for the Analysis of Means," Comm. Statistics. 11: 699–709.
85. Novozymes, (2010) http://www.bioenergy.novozymes.com/cellulosic-ethanol/cellic-
product-information/
86. Opassiri R, Pomthong B, Akiyama T, Nakphaichit M, Onkoksoong T, Ketudat-Cairns M, Ketudat Cairns JR (2007) A stress-induced rice β-glucosidase represents a new subfamily of glycosyl hydrolase family 5 containing a fascin-like domain. Biochem. J 408: 241–249.
87. Oriol E, Raimbault M, Roussos S, Viniegra- Gonzales G (1988) Water and water
activity in the solid state fermentation of cassava starch by Aspergillus niger. Appl. Microbiol. Biotechnol. 27: 498-503.
88. Osbourn A, Bowyer P, Lunness P, Clarke B, Daniels M (1995) Fungal pathogens of
oat roots and tomato leaves employ closely related enzymes to detoxify different host plant saponins. Mol. Plant-Microbe Interact. 8: 971–978.
89. Panagiotou G, Chrstakopoulos P, Olsson L (2005) Simultaneous saccharification and
fermentation of cellulose by Fusarium oxysporum F3-Growth characteristics and metabolite profiling. Enzyme Micro. Technol. 36: 693–699.
90. Pandey A, Selvakumar P, Soccol CR, Nigam P (1999) Solid state fermentation for
the production of industrial enzymes Current Science 77 (1): 149-162.
91. Pandey M, Mishra S (1997) Expression and characterization of Pichia etchellsii beta-glucosidase in Escherichia coli. Gene 190(1):45-51.
92. Papagianni M, Mattey M, Kristiansen B (2003) Design of a tubular loop bioreactor for
scale-up and scale-down of fermentation processes, Biotechnol Prog.19(5):1498-1504.
93. Park YS, Itida M, Ohta N and Okabe M (1994) Itaconic acid production using an air-
lift bioreactor in repeated batch culture of Aspergillus terreus, J. Ferment. Bioeng. 77(3):329-331.

99
94. Perez-Pons JA, Rebordosa X, Quarol E (1995) Induction and preliminary characterization of intracellular β-glucosidases from a cellulolytic Streptomyces strain, FEMS Microbiol. Lett. 128 (3):235–239.
95. Petersen JGL, Sheridan WF (1978) High Mobility Group proteins in Yeast, Carlsberg
Res. Comm. 43: 415-422.
96. Plackett RL, Burman JP (1946) The design of optimum multi-factorial experiments. Biometrika. 33 (4): 305-325.
97. Quiros LM, Aguirrezabalaga I, Olano C, Mendez C, Salas JA (1998) Two
glycosyltransferase and a glycosidase are involved in oleandomycin modification during its biosynthesis by Streptomyces antibioticus. Mol. Microbiol. 28:1177–1185.
98. Raimbault M (1998) General and microbiological aspects of solid substrate
fermentation. Electronic Journal of Biotechnology (Online) –Issue of 15 Dec 1998. Available from http://www.ejbiotechnology.info/content/vol1/issue3/full/9/index.html.
99. Reczey K, Szengyel ZS, Eklund R, Zacchi G (1996) Cellulase production by T. reesei.
Bioresource Technol. 57:25–30.
100. Riou C, Gunata Z (1999) Cloning and expressing the Aspergillus oryzae BGII β- glucosidase gene, Patent WO/1999/055884 awarded to Institut National de La Recherche Agronomique, France, November 4, 1999.
101. Riou C, Salmon JM, Vallier MJ, Gunata, Z and Barre P (1998) Purification, Characterization, and Substrate Specificity of a Novel Highly Glucose-Tolerant β-Glucosidase from Aspergillus oryzae, Appl. Environ. Microbiol. 64: 3607–3614.
102. Rivera EC, Rabelo SC, Dos Reis Garcia D, Maciel Filho R, Da Costa AC (2010)
Enzymatic hydrolysis of sugarcane bagasse for bioethanol production: Determining optimal enzyme loading using neural networks. J. Chem. Technol. Biotechnol. 85: 983-992.
103. Rodionova NA, Tavobilov IM, Martinovich LI, Buachidze TS, Kvesitadze GI and
Bezborodov AM (1987) β- glucosidases from cellulolytic fungi Aspergillus terreus, Geotrichum candidum, and Trichoderma longibrachiatum as typical glycosidases. Biotechnol. Appl. Biochem. 9: 239–250.
104. Rose TM, Schultz ER, Henikoff JG, McCallum CM, Henikoff S (1998) Consensus-
degenerate hybrid oligonucleotide primers for amplification of distantly-related sequences. Nucl. Acids Res. 26:1628-1635.

100
105. Roy SK, Raha SK, Dey SK,Chakrabarty SL (1988) Induction and catabolite repression of beta glucosidase synthesis in Myceliophthora thermophila D14 (=ATCC 48104), Appl. Environ. Microbiol. 54(8): 2152-2153.
106. Saha BC, Bothast R (1996) Production, Purification, and Characterization of a Highly
Glucose- Tolerant Novel β-Glucosidase from Candida peltata. Appl. Environ. Microbiol. 62: 3165–3170
107. Sambrook J, Russel P (2001) Molecular Cloning: A Laboratory Manual (IIIrd
Edition), CSHL press, New York, ISBN 978-087969577-4
108. Sánchez-Herrera LM, Ramos-Valdivia AC, Torre M, Salgado LM, Ponce-Noyola T (2007) Differential expression of cellulases and xylanases by Cellulomonas flavigena grown on different carbon sources. Appl. Microbiol. Biotechnol. 77: 589–595.
109. Schell DJ, Riley CJ, Dowe N, Farmer J, Ibsen KN, Ruth MF, Toon ST, Lumpkin RE
(2004) A bioethanol process development unit: initial operating experiences and results with a corn fiber feedstock. Bioresour. Technol. 91:179–188.
110. Schmoll M, Kubicek CP (2003) Regulation of Trichoderma cellulase formation: lessons in molecular biology from an industrial fungus. Acta. Microbiol. Imm. H. 50: 125–145.
111. Sehnem NT, Bittencourt LR, Camassola M, Dillon AJP (2006) Cellulase production
by Penicillium echinulatum on lactose, Appl. Microbiol. Biotechnol. 72: 163–167.
112. Shewale JG (1982), Beta glucosidase. Its role in cellulase synthesis and hydrolysis of
cellulose. Int. J. Biochem.14:435-443.
113. Simpson RJ (2004) Concentrating Solutions of Protein, In Simpson RJ (ed) Purifying Proteins for proteomics: A Laboratory Manual, Cold Spring Harbor Laboratory Press, New York, pp -701-722.
114. Sluiter A, Hames B, Ruiz R, Scarlata C, Sluiter J, Templeton D, Crocker D (2008)
Determination of Structural Carbohydrates and Lignin in Biomass, NREL Technical Report, NREL/TP-510-42618, http://www.nrel.gov/biomass/analytical_procedures.html
115. Sternberg, D, Vijayakumar P, Reese ET (1977) β-Glucosidase: microbial production
and effect on enzymatic hydrolysis of cellulose, Can. J. Microbiol. 23(2): 139-147.
116. Sukumaran RK, Singhania RR, Pandey A (2005) Microbial cellulases - Production,
applications and challenges. J. Sci. Ind. Res. 64 (11): 832-844.
101
117. Suto M, Tomita F (2001) Induction and catabolite repression mechanisms of cellulase
in fungi. J. Biosci. Bioeng. 92: 305–311.
118. Takashima S, Nakamura A, Hidaka M, Masaki H, Uozumi T (1999) Molecular cloning and expression of the novel fungal beta-glucosidase genes from Humicola grisea and Trichoderma reesei. J. Biochem. 125(4):728-736.
119. Templeton DW (1994) Determination of ethanol concentration in biomass to ethanol
fermentation supernatants by gas chromatography. National Renewable Energy Laboratory, Laboratory Analytical Procedure #011, Revision 05/05/1994.
120. Tomme PR, Warren AJ, Gilkes NR (1995) Cellulose hydrolysis by bacteria and fungi, Adv. Microbiol. Physiol. 37: 1–81.
121. Tsukada T, Igarashi K, Yoshid, M, Samejima, M. (2006) Molecular cloning and
characterization of two intracellular β-glucosidases belonging to glycoside hydrolase family 1 from the basidiomycete Phanerochaete chrysosporium, Appl. Microbiol. Biotechnol. 73 (4): 807-814.
122. Tu M, Zhang X, Kurabi A, Gilkes N, Mabee W, Saddler J (2006) Immobilization of
beta-glucosidase on Eupergit C for lignocellulose hydrolysis. Biotechnol. Lett. 28(3):151–156.
123. van Zessen E, Weismann M, Bakker RR, Elbersen HW, Reith JH, den Uil H. (2003)
Lignocellulosic ethanol, a second opinion. Report 2GAVE-03.11. Netherlands Agency for Energy & Environment. Available from: http://www.novem.nl/ default.asp?menuId 10&documentId34649.
124. Varghese JN, Hrmova M, Fincher GB (1999). Three dimensional structure of a barley
β-D glucan exohydrolase, a family 3 glycosyl hydrolase. Structure Fold. Des. 7: 179-190.
125. Villas-Bôas SG, Noel S, Lane GA, Attwood G and Cookson A (2006) Extracellular
metabolomics: A metabolic footprinting approach to assess fiber degradation in complex media. Anal. Biochem. 349: 297–305.
126. Watanabe T, Sato T, Yoshioka S, Koshijima T, Kuwahara M (1992) Purification and
properties of Aspergillus niger beta-glucosidase. Eur. J. Biochem. 209(2): 651-659.
127. Willick GE, Seligy VL (1985) Multiplicity in cellulases of Schizophyllum commune
Derivation partly from heterogeneity in transcription and glycosylation, Eur. J. Biochem. 151: 89-96.

102
128. Woodward J, Wiseman A (1982) Fungal and other beta –glucosidases: Their properties and applications. Enzyme Microb. Technol. 4: 73–79.
129. Wyman C (1999) Biomass ethanol: Technical progress, opportunities, and commercial
challenges. In: Socolow R, Anderson D, Harte J (eds). Ann. Rev. Energy Environ. 24: pp 189–226. Annual Reviews, Palo Alto, CA.
130. Xiao ZZ, Zhang X, Gregg DJ, Saddler JN (2004) Effects of sugar inhibition on
cellulases and beta-glucosidase during enzymatic hydrolysis of softwood substrates. Appl Biochem. Biotechnol. 113-16:1115-1126.
131. Xin Z, Yinbo Q, Peiji G (1993) Acceleration of ethanol production from paper mill
waste fiber by supplementation with [beta]-glucosidase. Enzyme Microb. Technol.15: 62-65.
132. Xue Y, Zhao L, Liu HW and Sherman DH (1998) A gene cluster for macrolide
biosynthesis in Streptomyces venezuelae: architecture of metabolic diversity. Proc. Natl. Acad. Sci. USA 93:12111–12116.
133. Yang S, Wang L, Yan Q, Jiang Z, Li L. (2009) Hydrolysis of soybean isoflavone
glycosides by a thermostable β-glucosidase from Paecilomyces thermophila. Food Chem. 115 (4):1247-1252.
134. Young MD, Kempe LL, Bader FG (1985) Effects of phosphate, glucose, and
ammonium on cell growth and lincomycin production by Streptomyces lincolnensis in chemically defined media. Biotechnol. Bioeng. 27(3): 327-333.
135. Znad H, Markos J, Bales V (2004) Production of gluconic acid from glucose by
Aspergillus niger: growth and non-growth conditions, Process Biochem. 39(11):1341-1345.

APPENDICES

i
APPENDIX 1 LIST OF ABBREVIATIONS
# Number
µ Micron/ micrometer
µM micromol
ANOVA Analysis of Variance
BGL β- glucosidase
BLAST Basic Local Alignment Search Tool
CBH Cellobiohydrolase
CCD Central Composite Design
cDNA Complementary DNA
cm centimeter
CMC Carboxy Methyl Cellulose
CMCase Carboxy Methyl Cellulase
CODEHOP COnsensus DEgenerate Hybrid Oligonucleotide Primers
CSIR Council of Scientific and Industrial Research
CTAB Cetyl Trimethyl Ammonium Bromide
DNA Deoxy Ribonucleic Acid
DNS 3, 5’ Dinitro Salicylic Acid
DO Dissolved Oxygen
DOE Design of Experiments
EDTA Ethylene Diamine Tetra Acetic Acid
EG Endogluanase
FID Flame Ionization Detector
FPAase Filter Paper Hydrolyzing Activity
FPU Filter paper units
g Grams
GC Gas Chromatography, Gas Chromatogram
gDS Grams Dry Substrate
GH Glycosyl Hydrolase
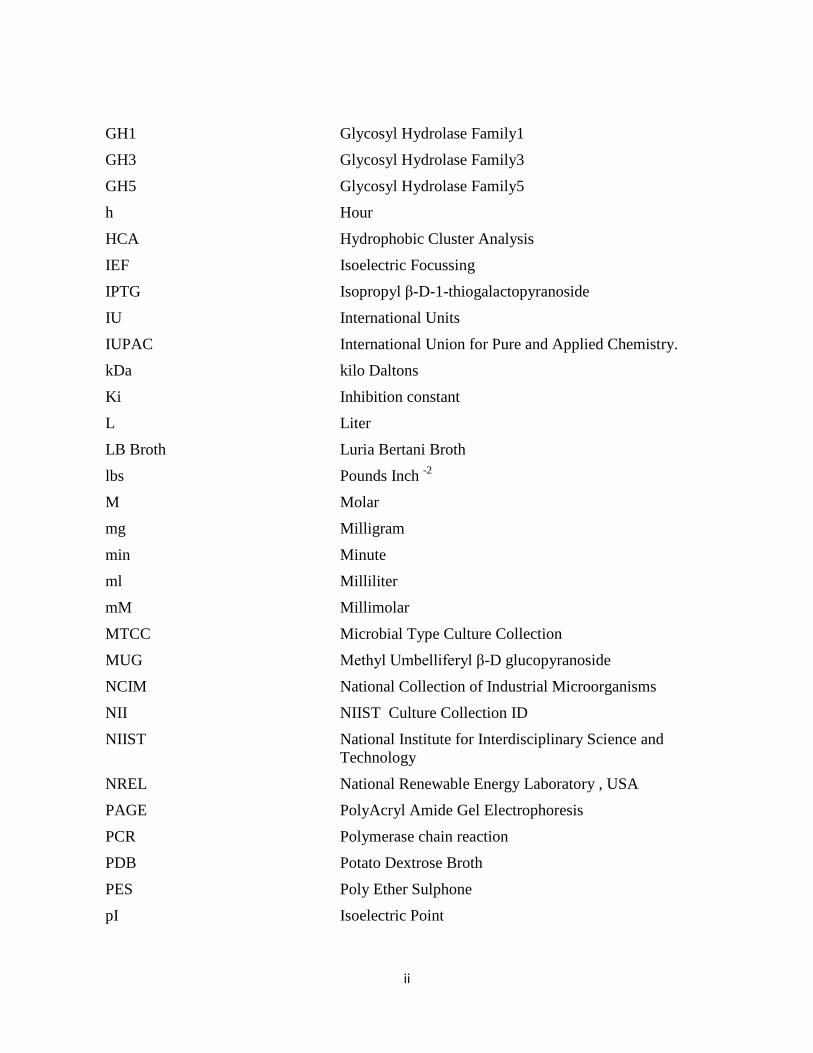
ii
GH1 Glycosyl Hydrolase Family1
GH3 Glycosyl Hydrolase Family3
GH5 Glycosyl Hydrolase Family5
h Hour
HCA Hydrophobic Cluster Analysis
IEF Isoelectric Focussing
IPTG Isopropyl β-D-1-thiogalactopyranoside
IU International Units
IUPAC International Union for Pure and Applied Chemistry.
kDa kilo Daltons
Ki Inhibition constant
L Liter
LB Broth Luria Bertani Broth
lbs Pounds Inch -2
M Molar
mg Milligram
min Minute
ml Milliliter
mM Millimolar
MTCC Microbial Type Culture Collection
MUG Methyl Umbelliferyl β-D glucopyranoside
NCIM National Collection of Industrial Microorganisms
NII NIIST Culture Collection ID
NIIST National Institute for Interdisciplinary Science and Technology
NREL National Renewable Energy Laboratory , USA
PAGE PolyAcryl Amide Gel Electrophoresis
PCR Polymerase chain reaction
PDB Potato Dextrose Broth
PES Poly Ether Sulphone
pI Isoelectric Point

iii
pNP para Nitrophenol
pNPG para –Nitrophenyl β-D glucopyranoside
RNA Ribonucleic Acid
rpm Rotations/minute
RS Rice Straw
RSM Response Surface Method/Methodology
SCB Sugar Cane Bagasse
SDS Sodium Dodecyl Sulfate
SmF Submerged Fermentation
SSF Solid State Fermentation
U Units
U/gDS Units per gram dry substrate
U/ml Units/milliliter
UV Ultra Violet
v/v Volume /Volume
vvm Volume/volume/minute
w/v Weight/Volume
WB Wheat Bran
X Gal 5-bromo-4-chloro-3-indolyl-β-D-galactopyranoside
YEP broth Yeast Extract Peptone Broth

iv
APPENDIX 2 LIST OF TABLES
Table # Title Page #
3.1 Plackett & Burman (PB) design matrix for the optimization of variables
influencing BGL production
22
3.2 Actual levels of variables tested with the PB and
their effects on BGL production
23
3.3 BGL yields for experimental runs performed according to the
Placket and Burman design matrix
27
3.4 Analysis of Variance ( ANOVA) for the factorial model 28
3.5 Coefficients of variables included in the model 29
3.6 Optimal combinations of variables predicted for improved BGL yield and expected enzyme yields
30
4.1 Glucose tolerance of BGL isoforms produced in lactose medium 36
6.1 List of Degenerate Primers designed for PCR amplification of GH1, GH3 and GH5 family β- glucosidases
55
6.2 List of Specific primers designed for PCR amplification of a short stretch of GH3 family β- glucosidase of A. niger
56
6.3 Ligation reaction for cloning PCR products 57
7.1 Plackett & Burman design matrix for the screening of variables influencing cellulase production
68
7.2 Actual levels of variables tested with the factorial design and their
effects on cellulase production
69
7.3 Actual and coded levels of variables tested with the central composite design
70
7.4 Central Composite Design matrix for optimization of parameters identified by the fractional factorial design
70
7.5 Box –Behnken design matrix for optimization of saccharification 72
7.6 Plackett & Burman design matrix for the screening of variables influencing cellulase production with the observed responses
73
7.7 Responses obtained for the experimental runs for optimizing cellulase
production using CCD design matrix with the corresponding predicted responses
75

v
7.8 Analysis of variance for the selected quadratic model 76
7.9 Model validation experiments 78
7.10 Effect of BGL supplementation on saccharification of Rice straw 79
7.11 Responses obtained for the experimental runs for optimizing
biomass hydrolysis using Box-Behnken design matrix
81
7.12 Analysis of variance for the selected quadratic model 82
7.13 Optimized combination of parameters predicted for increasing
saccharification efficiency
85
7.14 Ethanol production from rice straw hydrolysate by Saccharomyces cerevisiae
86

vi
APPENDIX 3 LIST OF figures
Fig. # Title Page #
1.1 Enzymatic hydrolysis of cellulose schematic diagram showing cellulase synergy
2
1.2 Thermoascus aurantiacus xylanase 10A (TAX) structure showing
the eight fold β/α barrel motif
7
3.1 Reactor setup for SmF production of BGL using A. niger 22
3.2 Effect of carbon sources on BGL production by A. niger 24
3.3 Comparison of BGL production and glucose tolerance
in shake flasks and bioreactor
26
3.4 Estimated effect of process parameters on BGL
production by A. niger 28
4.1 BGL production and its activity retention in response to
different carbon sources
34
4.2 Differential induction of BGL in response to different carbon sources 35
4.3 Pixel density analysis of the activity bands obtained by MUG staining of BGL produced using lactose as carbon source
35
5.1 Fractional precipitation of BGL using Acetone 43
5.2A &B Activity staining (A) and Native PAGE (B) analysis of acetone fractions of BGL
44
5.3 Determination of the pI of BGL using liquid phase isoelectric focusing 45
5.4 Chromatographic purification of major BGL from A. niger 46
5.5 Zymogram and Electrophoretic analysis of acetone precipitates and pooled chromatography fractions
47
5.6 SDS PAGE and activity staining of the purified major BGL 48
5.7 Determination of the Optimal pH for BGL1 activity 49
5.8 Determination of the Optimal Temperature for BGL1 activity 50
5.9 Temperature stability of BGL1 at 50 °C 50
5.10 Dixon plot for determination of glucose inhibition constant (Ki) of BGL1
51
6.1 Restriction map of T/A cloning vector pTZ57R/T 58

vii
6.2 Chromosomal DNA isolation from A. niger 59
6.3 PCR amplification of GH1 family BGL from A. niger genomic DNA 60
6.4 PCR amplification of GH3 family BGL from A. niger 60
6.5 PCR amplification of GH5 family BGL from A. niger 61
6.6 A&B Confirmation of GH1and GH5 family BGL partial gene cloning 62
6.7 Confirmation of GH3 family BGL partial gene cloning 62
7.1 Influence of process parameters on cellulase production by
T. reesei under SSF on wheat bran
74
7.2 A &B Three dimensional response surface (A) and the corresponding contour plot (B) for cellulase production in relation to initial moisture content and incubation temperature
77
7.3 Combined effect of T. reesei cellulase and A. niger BGL on biomass saccharification
83
7.4 Effect of cellulase loading and residence time on sugar yield 84
7.5 Effect of BGL loading and residence time on sugar yield 84


![[Micro] aspergillus](https://img.pdfslide.net/doc/110x75/55d6fc36bb61eb0d2b8b47a8/micro-aspergillus.jpg)


