Embed Size (px)
Citation preview
Better Bus Areas Programme
Final Report
September 2015
Produced by:
Integrated Transport Planning Ltd 32a Stoney Street
Lace Market Nottingham NG1 1LL
UK
Tel: +44 (115) 9886905
Contact: Nic Greaves Email: [email protected]
Web: www.itpworld.net
Document Control Sheet
Project Name Better Bus Area Evaluation
Client DfT
Project Code 1402
Project Manager Nic Greaves
Project Director Nick Ayland
Quality Manager Jon Parker
Project Folder F:\1402\
Team Members Nick Ayland, Nic Greaves, Jon Parker, Tim Edwards, Ciaran Meyers, David
Brenig-Jones
Sub-consultants Kiron Chatterjee, Graham Parkhurst, William Clayton
Ver File name Description Prepared Reviewed Approved
V2.1 BBA Final Report 010415v3.0
Revised Final
Report, taking
account of client
comments
NG NA NA
V2.0 BBA Final Report 180315 v2.0
FINAL
Revised Final
Report, taking
account of client
comments
NG NA NA
V1.0 BBA Final Report
Draft Final Report
for client
comment
NG JP JP
Notice
This report has been prepared for the Department for Transport in accordance with the terms and conditions of appointment. Integrated Transport Planning Ltd cannot accept any responsibility for any use of or reliance on the contents of this report by any third party.

BETTER BUS AREA FINAL REPORT
September 2015 i
CONTENTS
Page
1 INTRODUCTION 1
2 PROCESS EVALUATION 3
2016 process evaluation interviews 3
2019 process evaluation interviews 5
3 IMPACT EVALUATION 6
Liverpool City Region 6
Nottingham 14
Sheffield 19
4 SUMMARY AND TIMESCALES 22
APPENDIX A – PROCESS EVALUATION INTERVIEW TOPIC GUIDE – 2016 23
APPENDIX B ON-GOING TASKS FOR DFT 26


BETTER BUS AREAS FINAL REPORT
September 2015 2
that this report is read in conjunction with the evaluation plan and process and impact
evaluation reports.
1.6 This report firstly considers how and when the post-implementation process evaluation should
be carried out. It then focuses on the impact evaluation and the collation and collection of
data and evidence between 2015 and 2019.
1.7 Finally, this report sets out a number of key milestones for DfT with regards to follow up
process and impact evaluations. These are discussed throughout the report and presented in
Appendix C. It should be noted that these should be seen as recommendations made by ITP
and they do not constitute Government commitment at the time of writing.

BETTER BUS AREAS FINAL REPORT
September 2015 5
2019 process evaluation interviews
2.12 The purpose of the process evaluation interviews in 2019 – at the end of the BBA programme
– is to investigate and document the evolution of partnership working, including what worked
well, what worked less well and how different partnership arrangements impacted upon the
delivery of BBA schemes.
2.13 The process of carrying out the 2019 process evaluation interviews should be broadly similar
to that presented for 2016 above. The focus should continue to be on the five themes
highlighted in paragraph 2.6. The method for carrying out interviews should also be face to
face and interviewers should have a thorough knowledge and understanding of the history of
BBA partnership arrangements in each of the BBAs.
2.14 As the 2016 interviews will be carried out beforehand, the topic guide will need to reflect any
findings from the 2016 interviews and focus upon any issues that may have arisen in any of
the five BBAs. Therefore, at this stage, it is recommended that the topic guide in Appendix A
is adopted in 2019 but may be subject to amendments and additions. The updating of the 2019
topic guide is a task that should be carried out following the 2016 interviews, preferably by
whichever organisation carries out those interviews.
2.15 It is proposed that for the sake of consistency, it would be logical to adopt the same reporting
framework as presented within the 2014 process evaluation report. However, this is subject to
DfT’s needs and requirements.

BETTER BUS AREAS FINAL REPORT
September 2015 7
schemes include painting double yellow lines where parked cars can occasionally create an
obstruction and having discussed this with operators, they feel that any time savings are likely
to be minimal. The focus of the housing estate improvements is to make significant
improvements to bus stop infrastructure and the provision of information, and therefore the
impact evaluation should focus on changes in bus patronage, changes in bus user satisfaction
and changes to carbon emissions.
3.9 In terms of bus patronage data, Arriva North West has provided data directly to ITP and
indexed data has been reported within the impact evaluation report. Arriva provided this data
on the assumption that it would be published in an indexed format so as to remove any
commercial sensitivity.
3.10 Arriva provided patronage data for a period from January 2012 until December 2014. This
data was disaggregated by bus stops within the housing estates, while also providing data for
the entire route. Using this, a before and after comparison of passengers boarding at the
housing estate bus stops will be possible to detect any changes in patronage. The
counterfactual (estimate of what would have happened in the intervention area in absence of
housing estate improvements) requires careful consideration. By using the remainder of each
bus route as a ‘local’ comparator to establish the counterfactual, the net impact of the housing
estate improvements can be determined.
3.11 However, this approach does have some limitations. If there are more (or fewer) passenger
boardings within the intervention area, this is also likely to be echoed elsewhere along the
route as bus users are likely to make more than one journey on that route i.e. it would be
expected that a person travelling from the housing estate, will have to travel back later that
day. As a result, the counterfactual will need to be calculated as follows:
Absolute
passenger growth
for comparator
(APGC) =
No. of passenger boardings
on route excluding the
intervention area
- Change in no. of passenger boardings within
the intervention area (housing estate)
Percentage
passenger growth
for comparator
(PPGC) =
APGC / Baseline passenger boardings on route
excluding the intervention area
Expected no. of
passenger
boardings within
the intervention
area (EPBI)
Baseline passenger
boardings within the
intervention area
x PPGC
3.12 The impact of the intervention is then estimated as the difference between the measured post-
intervention passenger boardings within the intervention area (housing estate) and the EPBI
(expected absolute passenger growth for intervention area).
3.13 A second counterfactual can be obtained using the Merseyside-wide bus patronage data for
Arriva North West. This data has been collated for use in estimating the patronage
counterfactual for the evaluation of active traffic management infrastructure, and therefore can
be used to determine the general trends in bus patronage across the region. Comparing

BETTER BUS AREAS FINAL REPORT
September 2015 9
In addition, the scheme may influence car journey speeds and result in changes to carbon
emissions.
3.19 Bus journey time data is to be supplied by Merseytravel using their real time information
system. Merseytravel has made changes to its software system in order to generate reports
that provide bus journey times between bus stops. Therefore, for the post-implementation
evaluation, a comparison of bus journey times between specified stops (as presented within
the impact evaluation report) will demonstrate the impact of the bus priority technology.
3.20 Bus patronage data for routes 32, 33, 89 and 89A, 17 and 17A has been obtained as these
routes will be the most affected by changes to signal priority. These datasets are
disaggregated by route, month and passenger type (commercial or concessionary). The same
datasets will need to be obtained in 2019 for the period from January 2015 onwards, however
operators have been made aware that they will need to collate this data on an annual basis.
Again, a comparison of bus patronage across the six routes will enable the research team to
determine the impact of the bus priority measures.
3.21 Operators have provided their peak vehicle requirements for the routes affected by the signal
priority. The same data should be collected either directly from operators or through examining
the timetables and a straight forward comparison made. It is necessary to highlight that PVRs
could change as a result of the quality bus corridor agreement between Merseytravel, Arriva
and Halton Borough Transport. Therefore a qualitative interpretation whether a change in PVR
is attributable to active traffic management is required within the post-implementation
evaluation.
3.22 As buses will receive greater priority at treated junctions, it is necessary to consider the impact
on other road users. Car journey time and speed data, for the sections of corridors where the
treated junctions lie, has been obtained from DfT via their congestion statistics team. The
same data is required to be collected in 2019 and a comparison of the two datasets will
determine the impact on the journey times and speeds of non-bus modes.
3.23 In terms of the counterfactual for car journey times and speeds, it is very difficult to determine
which other roads or corridors would reflect what would have happened without the
intervention. There are a variety of other factors that could impact on other roads and corridors,
not least the introduction of the Mersey Gateway which is on the edge of the BBA area. This
is likely to have a significant impact on traffic flows around the entire BBA, potentially affecting
speeds and journey times.
3.24 The potential effects of the Mersey Gateway on traffic flows is a significant external factor that,
ideally, would be accounted for. It is possible to monitor changes in traffic flows and provide a
qualitative assessment in order to interpret the outputs from the pre and post implementation
comparison. An alternative approach may be to select a corridor, or series of corridors away
from the BBA area to act as a control area. Neither are strict counterfactuals and would require
significant interpretation from the research team. As a result, this study has not obtained
datasets to monitor the effects of this external factor.
3.25 By not having a control/comparison area, this is likely to impact upon the confidence of any
conclusions drawn from the before and after evaluation about journey times. By not knowing
what would have happened if the interventions had not been made, it is difficult to draw the
conclusion that the intervention had a specific impact when there may have been other
external factors. Due to the complexity of changes in the road layout and traffic movements
BETTER BUS AREAS FINAL REPORT
September 2015 10
as a result of the Mersey Gateway, it is simply not feasible to determine a counterfactual.
Whoever carries out the post-implementation evaluation will need to be mindful of this
significant limitation when interpreting results.
3.26 As stated above, Merseytravel procured Passenger Focus to carry out booster samples of
their annual bus user satisfaction survey across bus routes within the BBA. These surveys
asked specific questions relating to bus stop infrastructure. The same questions will be asked
in 2016 and 2019 when further booster samples are obtained, and it is proposed that a
comparison of the survey results before and after the intervention be used to determine the
impacts of the intervention. To provide a counterfactual, the results of user satisfaction surveys
across the rest of Merseyside (excluding BBA routes) should be considered.
3.27 In terms of changes to carbon emissions as a result of traffic management infrastructure, the
same approach detailed in paragraph 3.16 and 3.17 should be undertaken.

BETTER BUS AREAS FINAL REPORT
September 2015 11
Table 3.1 Housing Estate Improvements Impact Evaluation Information
Scheme Indicator Pre-Implementation data obtained to date
Where data is stored
Post-implementation data to be collected
Data Source When data should be collected
Counterfactual basis
Housing estate improvements
Absolute and % change in average bus journey times on the relevant routes
Through discussion with stakeholders, it was apparent that the possible improvements in bus journey times are so modest that they are unlikely to be detectable. In addition, they would not result in any changes to peak vehicle requirement.
n/a n/a n/a n/a n/a Absolute and % change in bus journey time difference from timetabled journey times
Changes to PVR requirements related to headway on affected routes
Changes in bus patronage (% and number of passengers)
Bus passenger boardings at bus stops within the Four Acre (service 32 and 33), Portico (89 & 89A), Australia (33) and Sutton Manor (32 and 33) estates by route, month and passenger type since January 2012
Data supplied to ITP and will be retained by ITP until required.
Bus passenger boardings at bus stops within the Four Acre (service 32 and 33), Portico (89 & 89A), Australia (33) and Sutton Manor (32 and 33) estates by route, month and passenger type from Jan 2015 to 2019
Arriva North West
Arriva will be asked to collate patronage data every year & store it themselves until 2019 when DfT will request data
Bus passenger boardings on entire routes 32, 33, 89 and 89A.
Change in level of user satisfaction (% of users satisfied or very satisfied with different aspects of service)
Passenger Focus survey outputs include satisfaction rates for the following:
• Personal safety at the bus stop
• Facilities at the bus stop
• Information provided at the bus stop
• State of repair at the bus stop
• Cleanliness and freedom from graffiti at the bus stop
Data supplied to Merseytravel by Passenger Focus. Baseline data stored on USB stick under: LCR-Housing Estates – User Satisfaction
The same passenger focus surveys should be carried out. It is currently Merseytravel’s plan to carry out these surveys (with the booster sample) in 2016 and 2019. This data should be collated by Merseytravel and available to DfT or the post-implementation research team as required.
Passenger Focus / Merseytravel
In 2016 and 2019. This is already planned by Merseytravel
Change in level of user satisfaction in rest of Merseytravel area.
Changes to carbon emissions Changes to carbon emissions reliant upon any changes to bus passenger information
n/a Bus passenger boardings as above. Arriva North West
Arriva will be asked to collate patronage data every year & store it themselves until 2019. Merseytravel will carry out modelling in November ‘16 and November ‘19
The changes to carbon emissions will be estimated based on changes in bus patronage (which take into account the counterfactual).

BETTER BUS AREAS FINAL REPORT
September 2015 12
Table 3.2 Active Traffic Management Infrastructure Impact Evaluation Information
Scheme Indicator Pre-Implementation data obtained to date
Where data is stored
Post-implementation data to be collected
Data Source When data should be collected
Counterfactual basis
Active traffic management infrastructure
Absolute and % change in average bus journey times in defined corridors / areas
Bus journey times between specified stops which straddle one or more of the AVL treated junctions for a period of one month in October 2014 on the following corridors:
• Prescott Road - 6 treated junctions
• Thatto Heath - 3 treated junctions
• Rainhill - 6 treated junctions
• Marshalls Cross -4 treated junctions
Baseline data Is stored on USB stick under: LCR-ATMI-Bus Journey Times
Bus journey times between specified stops which straddle one or more of the AVL treated junctions for a period of one month in October 2018 on the following corridors:
• Prescott Road - 6 treated junctions
• Thatto Heath - 3 treated junctions
• Rainhill - 6 treated junctions
• Marshalls Cross -4 treated junctions
Merseytravel Data should be collected in October 2017, provided all junctions have been treated by that stage and the junction priority technology is fully functional.
n/a
Absolute and % change in bus journey time difference from timetabled journey times
Data as above, but analysis will include comparison with bus timetabled journey times
As above As above, with timetables obtained for October 2018
Merseytravel and Arriva NW
October 2017, provided all junctions have been treated and technology is functional.
n/a
Changes in bus patronage (% and number of passengers)
Monthly bus patronage on Arriva routes 32, 33, 89 and 89A and HBT routes 17 and 17A disaggregated by commercial and concessionary passengers from January 2012.
Data supplied to ITP and will be retained by ITP until required.
Monthly bus patronage on Arriva routes 32, 33, 89 and 89A and HBT routes 17 and 17A, disaggregated by commercial and concessionary passengers from January 2015 until 2019.
Arriva North West and Halton Borough Transport
Arriva and HBT will be asked to collate patronage data every year & store it themselves until 2019.
Bus patronage on all Arriva North West services across Merseyside (excluding routes within the BBA)
Absolute and % changes in car journey times
Vehicle journey time/speed data by 15 minute periods for period of 3 months from September – November 2014 along the following corridors:
• Prescott Road
• Thatto Heath
• Rainhill
• Marshalls Cross
Baseline data Is stored on USB stick under: LCR-ATMI-Car Journey Times
Vehicle journey time/speed data by 15 minute periods along the following corridors:
• Prescott Road
• Thatto Heath
• Rainhill
• Marshalls Cross
Congestion stats team at DfT – Jay Symonds is main contact
September – November 2017 provided all junctions have been treated.
n/a
Changes to PVR requirements related to headway on affected routes
PVRs for routes 32, 33, 89, 89A Baseline data stored on USB stick under: LCR-ATMI – PVR
PVRs for routes 32, 33, 89, 89A Arriva North West
Data can be collected from Arriva in 2019 as part of the post-implementation evaluation
n/a
BETTER BUS AREAS FINAL REPORT
September 2015 13
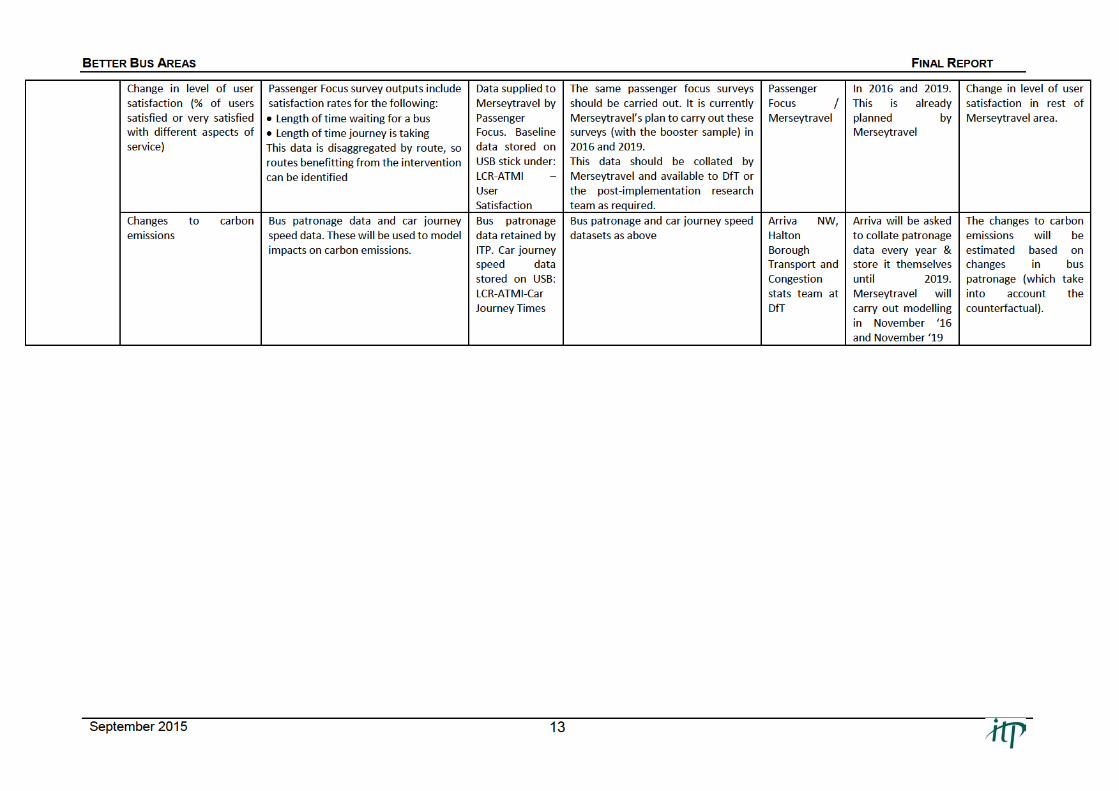
Change in level of user satisfaction (% of users satisfied or very satisfied with different aspects of service)
Passenger Focus survey outputs include satisfaction rates for the following:
• Length of time waiting for a bus
• Length of time journey is taking This data is disaggregated by route, so routes benefitting from the intervention can be identified
Data supplied to Merseytravel by Passenger Focus. Baseline data stored on USB stick under: LCR-ATMI – User Satisfaction
The same passenger focus surveys should be carried out. It is currently Merseytravel’s plan to carry out these surveys (with the booster sample) in 2016 and 2019. This data should be collated by Merseytravel and available to DfT or the post-implementation research team as required.
Passenger Focus / Merseytravel
In 2016 and 2019. This is already planned by Merseytravel
Change in level of user satisfaction in rest of Merseytravel area.
Changes to carbon emissions
Bus patronage data and car journey speed data. These will be used to model impacts on carbon emissions.
Bus patronage data retained by ITP. Car journey speed data stored on USB: LCR-ATMI-Car Journey Times
Bus patronage and car journey speed datasets as above
Arriva NW, Halton Borough Transport and Congestion stats team at DfT
Arriva will be asked to collate patronage data every year & store it themselves until 2019. Merseytravel will carry out modelling in November ‘16 and November ‘19
The changes to carbon emissions will be estimated based on changes in bus patronage (which take into account the counterfactual).
BETTER BUS AREAS FINAL REPORT
September 2015 15
Council was still in the process of introducing the ticket vending machines (TVMs) and so very
little before data was able to be obtained.
3.35 The evaluation plan explored how the smartcard retail network could be evaluated. It
concluded that “it is extremely complex to disaggregate and isolate the effects of the network
from any other public transport improvement schemes that are being carried out across the
city, particularly when considering the effects on bus patronage. While outcomes could be
monitored by the City Council in terms of the number of people using smart card tickets before
and after roll-out of the network, any measured changes in bus patronage across the city
would include influences of many initiatives and external factors. Without specific additional
targeted surveys (that could be carried out by NCC or ITP), and which would help determine
the extent to which the smartcard retail network led to a change in bus use, it would not be
possible to determine any change in the number of bus users as a result of the smartcard
retail network”.
3.36 Further discussions with DfT suggest that there is a desire to consider whether it is feasible to
measure whether the smartcard retail network leads to an increase in smartcard use across
Greater Nottingham. At present, there are four major operators (NCT, Trent Barton, Tramlink,
Yourbus) in Greater Nottingham, plus a variety of minor operators. Of these four major
operators, three have their own smartcard products for which obtaining data is not possible
due to commercial sensitivities. In addition, Nottingham City Council has its Citycard product
which can be used to store Kangaroo (multi-operator) season tickets and very soon will be
used to store season tickets for tram services.
3.37 Due to these complexities, obtaining numbers of local residents who use smartcards at
present is not feasible. Therefore, defining a baseline of existing smartcard use cannot be
carried out for this evaluation study using existing data sources. It is, of course, possible to
collect this data using on-vehicle or at-stop surveys, but this represents additional data
collection which does not fall within the brief for this commission and the local BBA partnership
is also not obliged to carry this out under its agreement with DfT.
3.38 Finally, Nottingham City Council carry out quarterly user satisfaction surveys. In their
questionnaire, they ask a specific question about user satisfaction in relation to access to
integrated ticketing. The outputs from this specific question should be compared pre and post
implementation to understand the perceptions of users. Ideally, user satisfaction surveys
would attempt to understand in greater detail the effects that the smartcard retail network has
had on how users use public transport services. It is recommended that DfT work with
Nottingham City Council to develop these surveys, and also consider how it can better
understand changes in travel behaviour as a result of the smartcard retail network through the
use of dedicated surveys and/or qualitative methods such as focus group discussions.
CCTV feed to operator control centres
3.39 Consideration was given to whether it is possible to evaluate the impacts of the CCTV feed to
control centres. The evaluation plan concluded that "in order to quantify any impacts of the
CCTV feed, it would be necessary to monitor the impact on bus services of incidents (most
likely road traffic accidents) that occur on the road network before and after the CCTV feed is
fed to operator control centres. In order for there to be a fair comparison, incidents would need
to be in the same locations before and after and be of a similar scale/severity. The likelihood
of this is very small, and therefore the ability of the study team to access data that can be
BETTER BUS AREAS FINAL REPORT
September 2015 16
compared in a fair manner is inhibited. We therefore recommend that there should be no
quantitative evaluation of the impacts of the CCTV feeds.”
3.40 Without the ability to quantify delays as a result of different incidents on the road network
before and after the intervention, it is recommended that the evaluation of this intervention is
based on the views of operators obtained during process evaluation interviews. This will limit
the evaluation and the conclusions that can be drawn, but given the nature of the intervention,
qualitative feedback is the most likely way of obtaining something tangible from which the DfT
can assess the benefits of the intervention.
BETTER BUS AREAS FINAL REPORT
September 2015 17
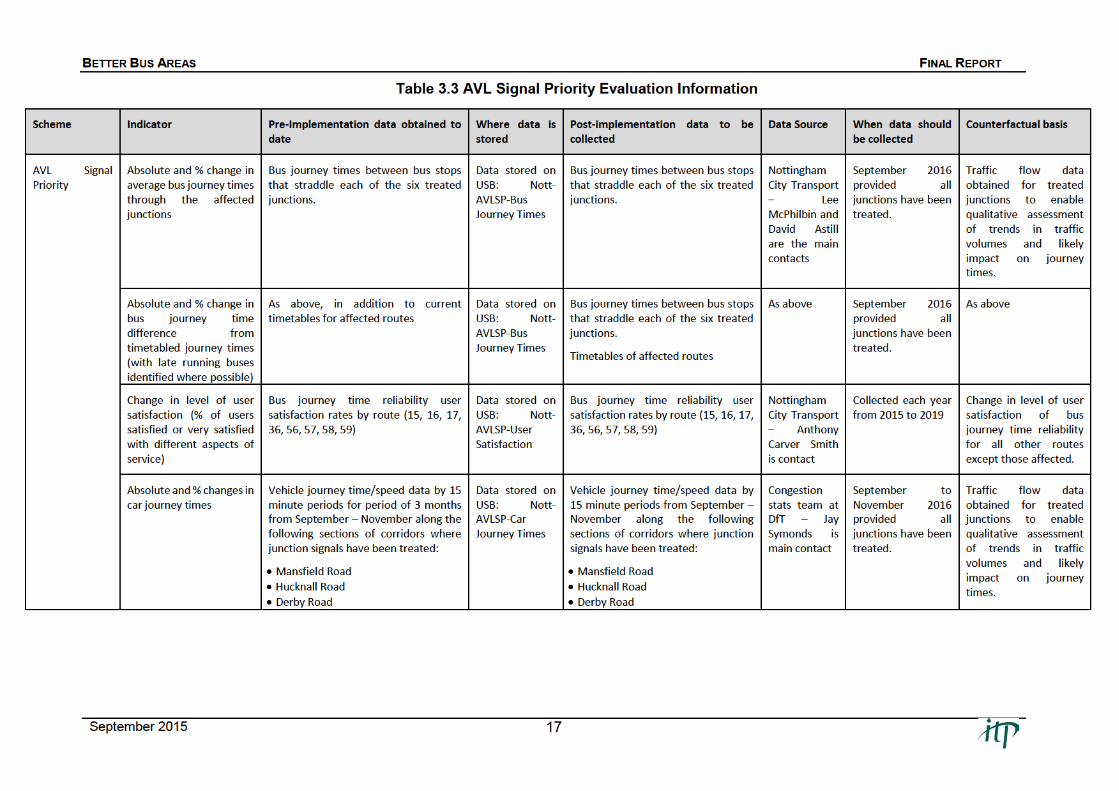
Table 3.3 AVL Signal Priority Evaluation Information
Scheme Indicator Pre-Implementation data obtained to date
Where data is stored
Post-implementation data to be collected
Data Source When data should be collected
Counterfactual basis
AVL Signal Priority
Absolute and % change in average bus journey times through the affected junctions
Bus journey times between bus stops that straddle each of the six treated junctions.
Data stored on USB: Nott-AVLSP-Bus Journey Times
Bus journey times between bus stops that straddle each of the six treated junctions.
Nottingham City Transport – Lee McPhilbin and David Astill are the main contacts
September 2016 provided all junctions have been treated.
Traffic flow data obtained for treated junctions to enable qualitative assessment of trends in traffic volumes and likely impact on journey times.
Absolute and % change in bus journey time difference from timetabled journey times (with late running buses identified where possible)
As above, in addition to current timetables for affected routes
Data stored on USB: Nott-AVLSP-Bus Journey Times
Bus journey times between bus stops that straddle each of the six treated junctions.
Timetables of affected routes
As above September 2016 provided all junctions have been treated.
As above
Change in level of user satisfaction (% of users satisfied or very satisfied with different aspects of service)
Bus journey time reliability user satisfaction rates by route (15, 16, 17, 36, 56, 57, 58, 59)
Data stored on USB: Nott-AVLSP-User Satisfaction
Bus journey time reliability user satisfaction rates by route (15, 16, 17, 36, 56, 57, 58, 59)
Nottingham City Transport – Anthony Carver Smith is contact
Collected each year from 2015 to 2019
Change in level of user satisfaction of bus journey time reliability for all other routes except those affected.
Absolute and % changes in car journey times
Vehicle journey time/speed data by 15 minute periods for period of 3 months from September – November along the following sections of corridors where junction signals have been treated:
• Mansfield Road
• Hucknall Road
• Derby Road
Data stored on USB: Nott-AVLSP-Car Journey Times
Vehicle journey time/speed data by 15 minute periods from September – November along the following sections of corridors where junction signals have been treated:
• Mansfield Road
• Hucknall Road
• Derby Road
Congestion stats team at DfT – Jay Symonds is main contact
September to November 2016 provided all junctions have been treated.
Traffic flow data obtained for treated junctions to enable qualitative assessment of trends in traffic volumes and likely impact on journey times.
BETTER BUS AREAS FINAL REPORT
September 2015 18
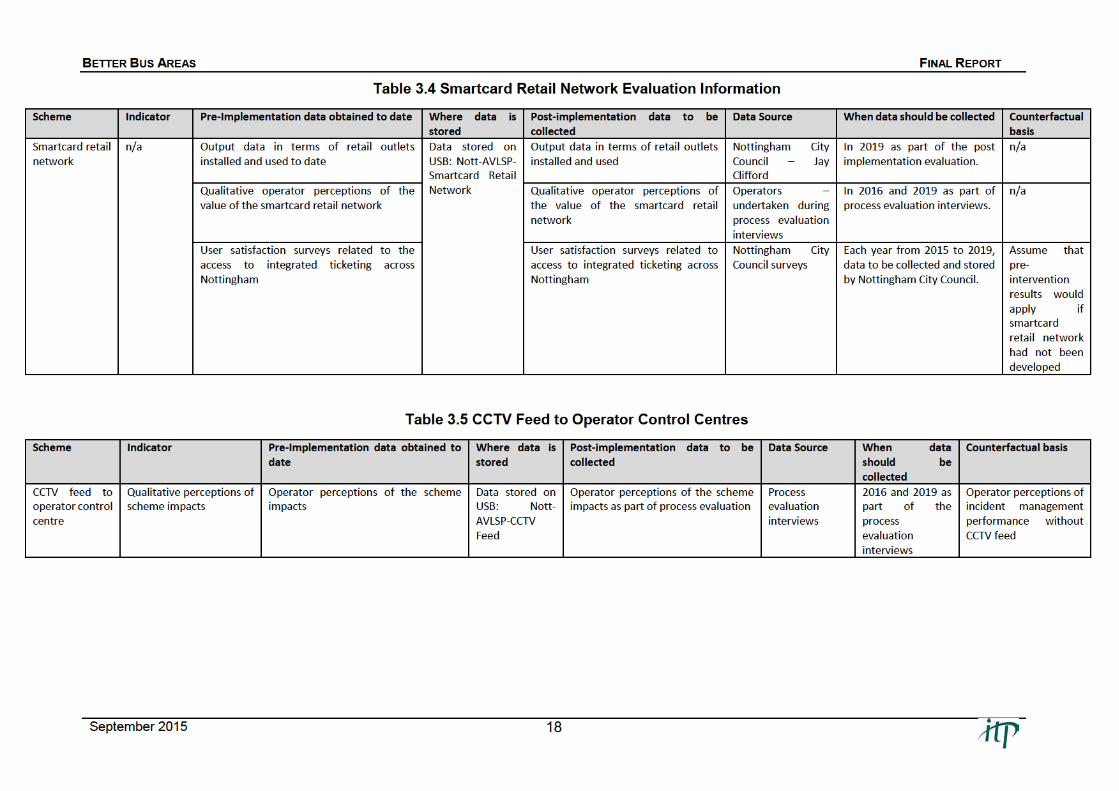
Table 3.4 Smartcard Retail Network Evaluation Information
Scheme Indicator Pre-Implementation data obtained to date Where data is stored
Post-implementation data to be collected
Data Source When data should be collected Counterfactual basis
Smartcard retail network
n/a Output data in terms of retail outlets installed and used to date
Data stored on USB: Nott-AVLSP-Smartcard Retail Network
Output data in terms of retail outlets installed and used
Nottingham City Council – Jay Clifford
In 2019 as part of the post implementation evaluation.
n/a
Qualitative operator perceptions of the value of the smartcard retail network
Qualitative operator perceptions of the value of the smartcard retail network
Operators –undertaken during process evaluation interviews
In 2016 and 2019 as part of process evaluation interviews.
n/a
User satisfaction surveys related to the access to integrated ticketing across Nottingham
User satisfaction surveys related to access to integrated ticketing across Nottingham
Nottingham City Council surveys
Each year from 2015 to 2019, data to be collected and stored by Nottingham City Council.
Assume that pre-intervention results would apply if smartcard retail network had not been developed
Table 3.5 CCTV Feed to Operator Control Centres
Scheme Indicator Pre-Implementation data obtained to date
Where data is stored
Post-implementation data to be collected
Data Source When data should be collected
Counterfactual basis
CCTV feed to operator control centre
Qualitative perceptions of scheme impacts
Operator perceptions of the scheme impacts
Data stored on USB: Nott-AVLSP-CCTV Feed
Operator perceptions of the scheme impacts as part of process evaluation
Process evaluation interviews
2016 and 2019 as part of the process evaluation interviews
Operator perceptions of incident management performance without CCTV feed
BETTER BUS AREAS FINAL REPORT
September 2015 20
On-bus audio-visual equipment
3.48 Service 120 will see audio-visual equipment installed on all buses operated by First and
Stagecoach. Therefore, examining the effects of the equipment on bus patronage pre and post
implementation, while making comparison to other services, will demonstrate whether there
are any impacts on bus patronage. The counterfactual, in this case, will be estimated based
on bus patronage growth on all other bus routes in Sheffield, excluding service 120,
disaggregated by month. This data will be provided by Stagecoach and First Group.
3.49 A second counter-factual that the research team will need to consider are the long term
patronage trends on service 120 to understand whether the technology is being implemented
on a service that has stable, declining or decreasing patronage. This analysis will help assess
how the intervention interrupts the time series trend and will help inform the assessment to
determine whether there has been an impact on bus patronage as a result of AV technology
being installed.
3.50 One specific issue that the research team should be aware of is the need to establish whether
there are any other changes to vehicles on service 120. In other areas, AV technology can be
implemented at a time when new vehicles are purchased, therefore the ability to attribute any
changes in patronage solely to the AV technology could be compromised.
3.51 While there are some complications with the development of the counterfactual i.e. the BBA
is Sheffield-wide and many bus services are likely to be impacted by a variety of the schemes,
it would be assumed that service 120 would be impacted in the same way as others, therefore
the introduction of the AV equipment is in addition to any other impacts. The research team
will need to be mindful of this when carrying out the post-implementation evaluation.
3.52 It is possible that SYPTE may look to develop their evaluation of AV technology on service
120. At the time of writing, it became apparent that preliminary work had been carried out to
consult with specific groups of people who may benefit e.g. a local ‘Guide Dogs for the Blind’
group. This further work may provide a qualitative addition to the quantitative analysis. Again,
whoever carries out the post-implementation evaluation should be aware of this and adopt any
relevant information where it feels it may benefit or supplement this evaluation.
3.53 Finally, user satisfaction surveys will be carried out by SYPTE to understand passenger
perceptions of the quality of bus service 120. A comparison of pre and post implementation
user perceptions should be carried out. In this case, comparison data cannot be obtained
because user satisfaction surveys are not being carried out across Sheffield in the same way
as they are on service 120. It will be assumed for the counterfactual that user perceptions
would have continued to be the same as those found from the pre-implementation survey, but
the possible effect of other service improvements should be considered.

BETTER BUS AREAS FINAL REPORT
September 2015 21
Table 3.6 Sheffield City Centre Improvements
Table 3.7 Audio-Visual Equipment on Service 120
Scheme Indicator Pre-Implementation data obtained to date
Where data is stored
Post-implementation data to be collected
Data Source When data should be collected
Counterfactual basis
On bus audio-visual equipment
Absolute and % change in bus patronage on service 120
Bus patronage on service 120 from October 2012, disaggregated by commercial and ENCTS passengers
USB stick: Sheff-AVE – Bus Patronage
Monthly bus patronage on service 120 from January 2015 to 2019 disaggregated by commercial and ENCTS passengers
Stagecoach South Yorkshire and First Yorkshire
Data should be collated by operators monthly, but supplied when requested in 2019
Bus patronage on all other bus routes in Sheffield
Absolute and % change in types of passengers using service 120
As above As above As above As above As above As above
% change in users satisfied or very satisfied with different aspects of service 120
2011/2012 survey to assess user. USB stick: Sheff-AVE-User Satisfaction
User satisfaction surveys to be carried out by SYPTE asking the same questions relating to the quality of the bus and overall satisfaction of the service
SYPTE Within 12 months after the implementation of AV technology on service 120 – around 2016-17
2011/2012 results on user satisfaction of the quality of the bus and the quality of the overall service on service 120
Scheme Indicator Pre-Implementation data obtained to date
Where data is stored
Post-implementation data to be collected
Data Source When data should be collected
Counterfactual basis
Sheffield City Centre improvements
Absolute and % change in average bus journey times through the city centre
Bus journey times and average speeds for bus routes as they travel through the city centre. Data from mid-September to 24th October 2014, disaggregated by AM peak, Inter Peak, and PM Peak
Data stored on USB: Sheff-SCCI – Bus Journey Times
Bus journey time data for routes affected by interventions, disaggregated by section of route within city centre. Dataset for a period of one month disaggregated by AM peak, Inter Peak, and PM Peak
SYPTE obtained data from their real time information system
For the same 6 week period in September/October 2017
n/a all routes in the city centre will be affected, so it is not possible to identify control/ comparison data
Absolute and % change in bus journey time difference from timetabled journey times
As above, with reference to timetabled journey times
As above As above As above As above As above
Absolute and % changes in car journey times
Car journey times between locations within the city centre, disaggregated by peak period, from data collected by Trafficmaster ANPR cameras. Data is for 15 September to 24 October 2014.
Data stored on ESB: Sheff-SCCI-Car Journey Times
Car journey times between locations within the city centre, disaggregated by peak period, from data collected through Trafficmaster ANPR cameras.
SYPTE to obtain data from DfT
For the same 6 week period in September/October 2017
As above
BETTER BUS AREAS FINAL REPORT
September 2015 22
4 SUMMARY AND TIMESCALES
4.1 This report has summarised what data has been collected and what data needs to be collected
in the future in order to carry out a comprehensive ex-post impact evaluation of several of the
BBA funded schemes being delivered in Nottingham, Sheffield and the Liverpool City Region.
The primary aim of this report is to enable whoever carries out the post implementation data
collection and evaluation to have access to all the knowledge gained from the pre-
implementation data collection and evaluation planning phase.
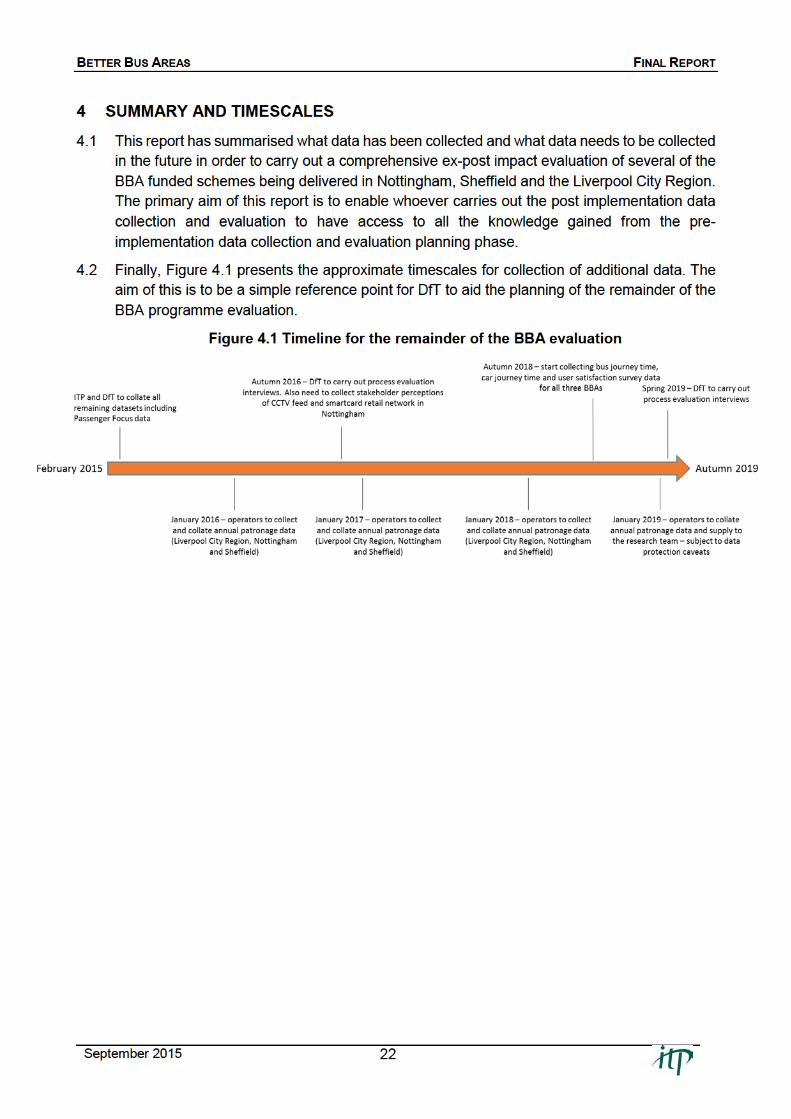
4.2 Finally, Figure 4.1 presents the approximate timescales for collection of additional data. The
aim of this is to be a simple reference point for DfT to aid the planning of the remainder of the
BBA programme evaluation.
Figure 4.1 Timeline for the remainder of the BBA evaluation
BETTER BUS AREAS FINAL REPORT
September 2015 23
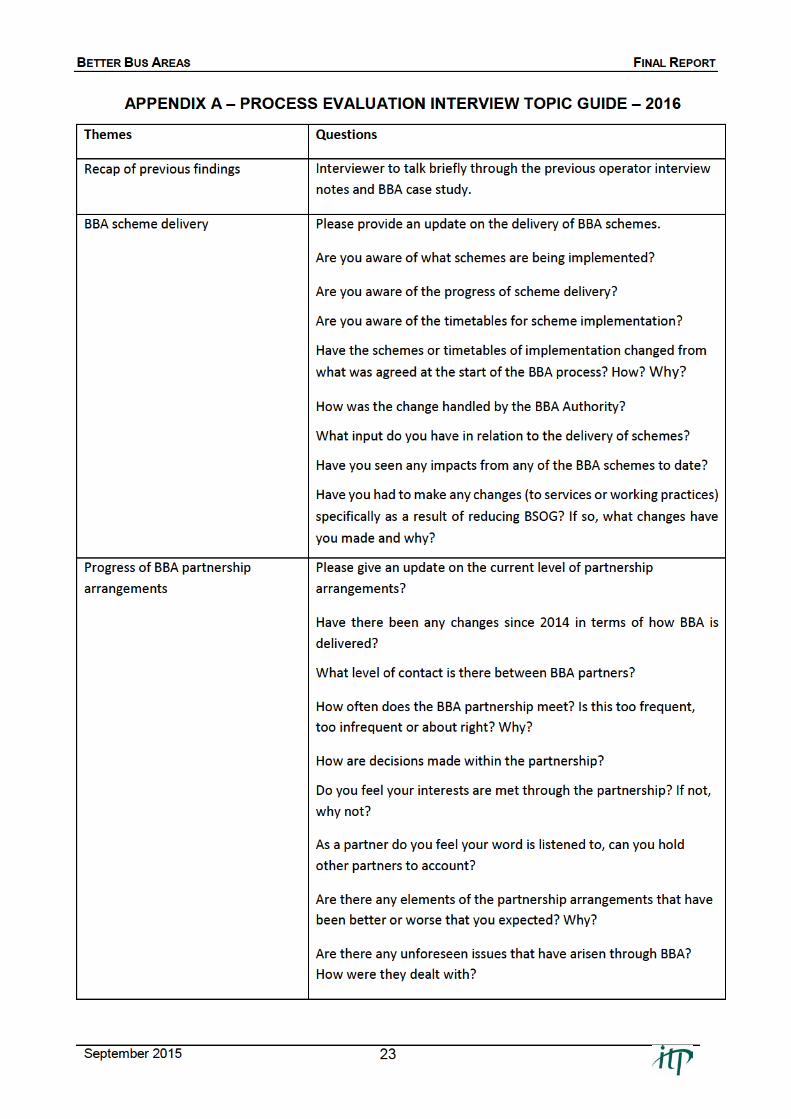
APPENDIX A – PROCESS EVALUATION INTERVIEW TOPIC GUIDE – 2016
Themes Questions
Recap of previous findings Interviewer to talk briefly through the previous operator interview
notes and BBA case study.
BBA scheme delivery Please provide an update on the delivery of BBA schemes.
Are you aware of what schemes are being implemented?
Are you aware of the progress of scheme delivery?
Are you aware of the timetables for scheme implementation?
Have the schemes or timetables of implementation changed from
what was agreed at the start of the BBA process? How? Why?
How was the change handled by the BBA Authority?
What input do you have in relation to the delivery of schemes?
Have you seen any impacts from any of the BBA schemes to date?
Have you had to make any changes (to services or working practices)
specifically as a result of reducing BSOG? If so, what changes have
you made and why?
Progress of BBA partnership
arrangements
Please give an update on the current level of partnership
arrangements?
Have there been any changes since 2014 in terms of how BBA is
delivered?
What level of contact is there between BBA partners?
How often does the BBA partnership meet? Is this too frequent,
too infrequent or about right? Why?
How are decisions made within the partnership?
Do you feel your interests are met through the partnership? If not,
why not?
As a partner do you feel your word is listened to, can you hold
other partners to account?
Are there any elements of the partnership arrangements that have
been better or worse that you expected? Why?
Are there any unforeseen issues that have arisen through BBA?
How were they dealt with?

BETTER BUS AREAS FINAL REPORT
September 2015 24
Has this BBA affected your working relationships with other
partners? How?
Are there any benefits from the partnerships that have been
developed through BBA? What? Why?
Overall, what have you learned from being part of the BBA
programme?
Do you anticipate the things you have learned from BBA to impact
on how you do things in future? If yes, how?
Problem resolution and adaptability Have there been any disputes in the delivery of the BBA
programme? What? How were they dealt with? What was the role
of the operators and authority within the dispute?
What arrangements are there in place to deal with resolving
disputes? How have those arrangements performed?
Are there any monitoring or feedback structures in place so that
lessons can be learned, or opportunities be taken advantage of?
How are lessons being learned?
The future How do you see the partnership arrangements lasting over the
remainder of the BBA programme? Why?
Is there anything that you think could be done in future to ensure
partnership arrangements are maintained or improved?
Is there anything that you foresee that could jeopardise the BBA
partnership arrangements over the remaining years?
BBA specific issues to raise LCR
Do partners still adhere to the mantra of doing ‘the right thing’?
Have there been any further benefits from including St Helens,
Knowsley and Halton Councils?
Nottingham
Have there been any newly adopted BBA governance arrangements?
Have there been any amendments to BBA schemes compared to
the bid?
What are the operator’s perceptions of CCTV feed and smartcard
retail network?
What are the Council officers’ perceptions of the smartcard retail
network?

BETTER BUS AREAS FINAL REPORT
September 2015 25
Sheffield
Have BBA schemes developed over time? What new schemes have
been adopted? If yes, what have been the operator’s roles in
developing new schemes?
Are BBA funded schemes being delivered as operators expect?
Do BBA funded schemes still face competition from other projects
in order to get delivered?
West of England
Has scheme delivery improved? If yes, how? Why?
Are the authorities any more accountable for scheme delivery now?
How have partnership relations developed?
York
Have the heads of terms stood the test of time?
Are decisions still made ‘round a table’ or has the voting structure
been applied? How? When? What were the outcomes?
Has the BBA scheme been affected by any political changes?
BETTER BUS AREAS FINAL REPORT
September 2015 26
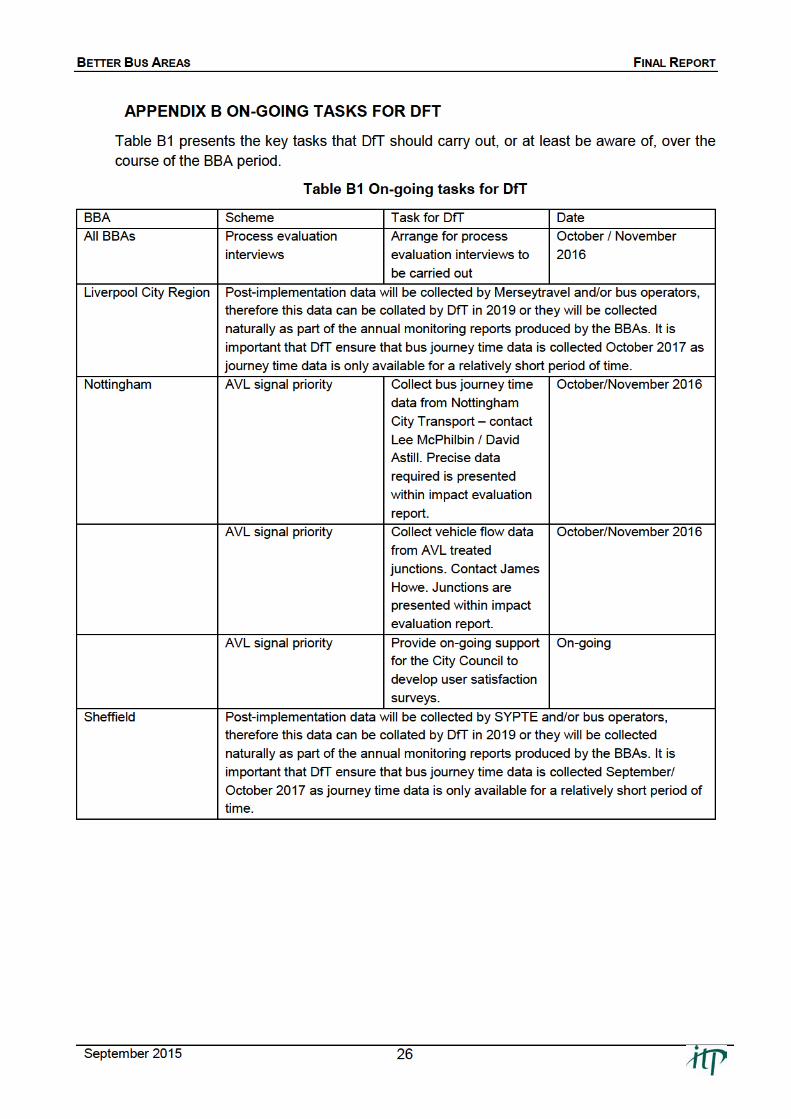
APPENDIX B ON-GOING TASKS FOR DFT
Table B1 presents the key tasks that DfT should carry out, or at least be aware of, over the
course of the BBA period.
Table B1 On-going tasks for DfT
BBA Scheme Task for DfT Date
All BBAs Process evaluation
interviews
Arrange for process
evaluation interviews to
be carried out
October / November
2016
Liverpool City Region Post-implementation data will be collected by Merseytravel and/or bus operators,
therefore this data can be collated by DfT in 2019 or they will be collected
naturally as part of the annual monitoring reports produced by the BBAs. It is
important that DfT ensure that bus journey time data is collected October 2017 as
journey time data is only available for a relatively short period of time.
Nottingham AVL signal priority Collect bus journey time
data from Nottingham
City Transport – contact
Lee McPhilbin / David
Astill. Precise data
required is presented
within impact evaluation
report.
October/November 2016
AVL signal priority Collect vehicle flow data
from AVL treated
junctions. Contact James
Howe. Junctions are
presented within impact
evaluation report.
October/November 2016
AVL signal priority Provide on-going support
for the City Council to
develop user satisfaction
surveys.
On-going
Sheffield Post-implementation data will be collected by SYPTE and/or bus operators,
therefore this data can be collated by DfT in 2019 or they will be collected
naturally as part of the annual monitoring reports produced by the BBAs. It is
important that DfT ensure that bus journey time data is collected September/
October 2017 as journey time data is only available for a relatively short period of
time.


![BUS BUS BUS BUS BUS BUS BUS BUS BUS · Sunday 15 May 2016 Liverpool Street to Colchester, Ipswich, Norwich and branches BUS BUS BUS BUS BUS BUS BUS BUS BUS] 1 1 1 1 1 1 1 1 1 1 1](https://img.pdfslide.net/doc/110x75/5fab4ce2477d2d3adf21016a/bus-bus-bus-bus-bus-bus-bus-bus-sunday-15-may-2016-liverpool-street-to-colchester.jpg)

![CUBE-BL-JP-18 CUBE-PK-JP-18 CUBE-YL-JP-18 (JP) …...CUBE-BL-JP-18 CUBE-PK-JP-18 CUBE-YL-JP-18 (JP) 1.2 Litre Capacity [JP] Operating Guide (JP)Please read this entire guide before](https://img.pdfslide.net/doc/110x75/5f0aa9a57e708231d42cb922/cube-bl-jp-18-cube-pk-jp-18-cube-yl-jp-18-jp-cube-bl-jp-18-cube-pk-jp-18-cube-yl-jp-18.jpg)


![Systemwalker Live Help 13.0 ユーザーズガイドsoftware.fujitsu.com/jp/manual/manualfiles/M060019/B1WW8621/01Z000/... · [Live Help Client]プログラムや[Live Help Expert]プログラ](https://img.pdfslide.net/doc/110x75/5e1c2ba56cbe3c059d0b2aa3/systemwalker-live-help-130-ffff-live-help-clientfffflive.jpg)