Embed Size (px)
Citation preview
RESEARCH ARTICLE
Better coverage, better outcomes? Mapping
mobile network data to official statistics using
satellite imagery and radio propagation
modelling
Till KoebeID*
Department of Economics, Freie Universitat, Berlin, Germany
Abstract
Mobile sensing data has become a popular data source for geo-spatial analysis, however,
mapping it accurately to other sources of information such as statistical data remains a chal-
lenge. Popular mapping approaches such as point allocation or voronoi tessellation provide
only crude approximations of the mobile network coverage as they do not consider holes,
overlaps and within-cell heterogeneity. More elaborate mapping schemes often require
additional proprietary data operators are highly reluctant to share. In this paper, I use human
settlement information extracted from publicly available satellite imagery in combination
with stochastic radio propagation modelling techniques to account for that. I show in a simu-
lation study and a real-world application on unemployment estimates in Senegal that better
coverage approximations do not necessarily lead to better outcome predictions.
Introduction
Mobile phone metadata has become a popular data source to complement official statistics.
When an individual makes a call, sends a message or uses the mobile internet, meta informa-
tion about this interaction, such as the time stamp and the location, are stored in a database of
the mobile network operator (MNO). Researchers exploit those spatio-temporal references for
geo-located analysis. One string of research in this field investigates the question whether a
certain characteristic such as poverty, literacy or food insecurity is reflected in mobile phone
behaviour. Matching this behaviour accurately to a ‘groundtruth’—often statistical data from
surveys or censuses provided for statistical areas—however, poses a major challenge as the two
data sources lack a common reference. In the case of call detail records (CDRs), the geographic
reference is provided by the antenna location, often stored as a point coordinate of the physical
location of the corresponding base transmitter station (BTS). Due to its simplicity, some scien-
tific literature treat antennas as point coordinates [1]. However, the interactions captured by
the antenna do not happen entirely at this exact coordinate, but within the coverage area of the
antenna—the cell. While an antenna may be located in one statistical area, most of the cell may
lie within the neighboring area. The state-of-the-art attempt to address this is to use spatial
weights based on the overlapping area size of statistical areas and cells approximated via voro-
noi tessellation [2, 3]. This approach has three major drawbacks: First, voronoi tessellation
PLOS ONE
PLOS ONE | https://doi.org/10.1371/journal.pone.0241981 November 9, 2020 1 / 28
a1111111111
a1111111111
a1111111111
a1111111111
a1111111111
OPEN ACCESS
Citation: Koebe T (2020) Better coverage, better
outcomes? Mapping mobile network data to official
statistics using satellite imagery and radio
propagation modelling. PLoS ONE 15(11):
e0241981. https://doi.org/10.1371/journal.
pone.0241981
Editor: Jacinto Estima, Instituto de Engenharia de
Sistemas e Computadores Investigacao e
Desenvolvimento em Lisboa, PORTUGAL
Received: February 25, 2020
Accepted: October 23, 2020
Published: November 9, 2020
Peer Review History: PLOS recognizes the
benefits of transparency in the peer review
process; therefore, we enable the publication of
all of the content of peer review and author
responses alongside final, published articles. The
editorial history of this article is available here:
https://doi.org/10.1371/journal.pone.0241981
Copyright: © 2020 Till Koebe. This is an open
access article distributed under the terms of the
Creative Commons Attribution License, which
permits unrestricted use, distribution, and
reproduction in any medium, provided the original
author and source are credited.
Data Availability Statement: The mobile phone
data at the antenna- and commune-level
aggregated to the year 2013 including noisy

perfectly divides the space around BTS locations depending on the distance to the surrounding
BTS. This represents a naïve approximation of the true coverage areas as it does not take over-
laps, areas without coverage and additional network complexities (multiple antennas per site/
BTS, directionality of antennas, varying frequency bands etc.) into account [4]. For example,
roughly 90 million people in Africa in 2019 were still not connected to any mobile network
hinting at major holes in the coverage [5]. Second, even though the concept of ‘home-locating’
subscribers to specific BTS offers a network-based alternative to the statistical concept of ‘usual
place of residence’, it is not reflected within cells. As the weights are based on area sizes, the
voronoi tessellation implicitly assumes that individuals/households are homogeneously dis-
tributed within cells, which in most cases does not hold true. For example, a lake would receive
the same importance in the creation of area-level mobile phone metadata aggregates as an
equally sized built-up area. Third, as mobile stations (MS, generally defined as a combination
of device and SIM card) and antennas communicate via modulated radio signals whose propa-
gation paths depend on a range of factors such as the weather, coverage areas are stochastic by
nature. More elaborate approaches to model coverage ranges of mobile networks exist [4, 6],
especially in the field of radio propagation modelling native to electrical engineering, however,
they often require detailed information on the area’s topology, a number of technical details
concerning the network infrastructure and additional information from passive monitoring
systems, which mobile network operators are generally highly reluctant to share and in the lat-
ter case often not capable to collect.
Contributions
Acknowledging this, I divide my methodological contribution in this paper in two parts: First,
I propose the use of settlement information extracted from publicly available satellite imagery
to account for within-cell heterogeneity within the mobile network when linking statistical
data with mobile phone metadata. Building on this, the second part of the methodology takes
advantage of scenarios where additional technical specifications are available in order to
address the issues for holes, overlaps and non-linearities within the mobile network using
propagation-based modelling. My main contributions are as follows:
1. The idea of using settlements retrieved from publicly available satellite imagery as a common
reference for statistical units such as households and ‘home-located’ MS in order to calculate
weights for mapping mobile phone metadata and statistical data based on settlement counts in
scenarios where MS counts are not available. This way, within-cell heterogeneity is addressed.
2. A propagation-based approach to account for overlaps, holes and non-linearities in coverage
service provision—in case additional information on the network infrastructure are available.
3. A large-scale simulation study on a synthetic population grid to systematically compare the
accuracy of different mapping approaches and their effects on predictive performance.
4. A real-world application that demonstrates the impact of the mapping choice on outcomes
in later analysis.
Datasets
In the application, I revisit the simulation study of Schmid et al. [1] published in 2017 in the
Journal of the Royal Statistical Society Series A on fine-granular unemployment estimates from
mobile phone metadata in Senegal in order to investigate the effects of different mapping
schemes on the unemployment outcomes. Therefore, I re-run the original simulation with the
difference that I implement multiple mapping schemes to derive area-level covariates from
PLOS ONE Mapping mobile network data using satellite imagery and radio propagation modelling
PLOS ONE | https://doi.org/10.1371/journal.pone.0241981 November 9, 2020 2 / 28
antenna locations as well as instructions for
replicating the study results have been added as
part of the Supporting information. In order to
access record-level mobile phone data and exact
antenna locations, one would need to contact
Sonatel directly and present the research project
that would require the data (contact: Mr El Hadji
Birahim Gueye, Direction des Systèmes
d’information Sonatel, ebgueye@orange-sonatel.
com or post mail: Orange-Sonatel, 46 Boulevard de
la Republique, BP 69 Dakar, Senegal). GUF data
cannot be shared publicly because third-party
access conditions apply (for scientific, non-
commercial use). However, it is available for
research purposes under a data user agreement.
For data access, please contact the German
Aerospace Agency under [email protected] (https://www.
dlr.de/eoc/en/PortalData/60/Resources/
dokumente/guf/DLR-GUF_LicenseAgreement-and-
OrderForm.pdf). Census data used in the study
cannot be shared publicly because third-party
access conditions apply. However, it is available for
research purposes under a data user agreement.
For data access, please visit the microdata
catalogue of the statistical office in Senegal (http://
anads.ansd.sn/index.php/catalog/51) or send the
inquiry to [email protected]. All code required
for replicating the findings of this study is fully
available in the Supporting information of this
submission (S1 and S2 Files) and under https://
github.com/tilluz/geomatching_open.
Funding: The author received no specific funding
for this work.
Competing interests: The author have declared
that no competing interests exist.

CDRs. Specifically, I use behavioural indicators and SIM card counts extracted from CDRs
provided by the major Senegalese MNO Sonatel in the context of the D4D 2014 challenge for
the whole year of 2013 and aggregated on the level of BTS, for which the exact geo-coordinates
are also provided [7]. The behavioural indicators are generated using the popular open-source
Python module Bandicoot [8]. Further, I use population counts from the full 2013 general pop-
ulation and housing census (RGPHAE 2013) available for the NUTS 4-level of Senegal—the
communes—on the website of ANSD, the National Statistical Office of Senegal. Commune-
level unemployment information are generated from a 10% sample of RGPHAE 2013. Unem-
ployment information in RGPHAE 2013 are self-reported.
Geographic information on the administrative boundaries are available for communes and
above. The settlement-based weights I present in this paper use data on human settlement
areas in Senegal extracted from the Global Urban Footprint (GUF) project [9] of the German
Aerospace Center (DLR) at a resolution of 0.4 arc seconds, which is approximately 12m x
12m. The GUF project used 180,000 TerraSAR-X and TanDEM-X images collected during the
period of 2011—2012 (with some data from 2013/14 to fill gaps) to create black and white
abstractions where white pixels represent human settlements with a true positive rate (accu-
racy to correctly detect human settlements) of 85% on average, with 68% at lowest and 98% at
heighest. GUF data for Senegal is provided as a single black and white.tif-file with a resolution
of 55568 x 39459 pixels (see Fig 1). All datasets used in this study are available for research pur-
poses under the conditions of the respective data use agreements.
Related work
Increasing processing capabilities have propelled the use of satellite imagery in official statis-
tics. The UN [11] recommends using satellite imagery to prioritize and check geospatial
Fig 1. Settlements in Senegal provided as b/w image by the GUF project. Lower resolution built-settlements extents
data reprinted from [10] under a CC BY license, with permission from WorldPop, original copyright 2018, are used in
this figure for illustrative purposes.
https://doi.org/10.1371/journal.pone.0241981.g001
PLOS ONE Mapping mobile network data using satellite imagery and radio propagation modelling
PLOS ONE | https://doi.org/10.1371/journal.pone.0241981 November 9, 2020 3 / 28
processes such as the delineation of enumeration areas during census preparation. It further
supports the construction of population grids as a common spatial reference system as pro-
posed by [12, 13]. Various studies have used remote sensing, sometimes in combination with
mobile phone metadata, to estimate key statistical indicators such as economic growth [14–
16], population density [17–20] or poverty [2, 21, 22]. Work in that field most closely related
to this study uses settlement information extracted from satellite imagery in combination with
radio propagation models for application in cost-benefit analysis concerning additional infra-
structure investments [23]. While [23] also uses population counts from official statistics to
estimate the latent demand for mobile services, the author neither investigates the effects of
different coverage mapping techniques on the results nor does he use mobile phone metadata
for statistical purposes.
In addition, the last decade has seen an impressive amount of research on proposing the
use of mobile phone metadata for official statistics foremost in the hope to overcome the limit-
ing relationship of sample size and data collection costs. [24] provides an excellent overview
on the use of mobile phone metadata that also covers its application for statistical purposes.
Use cases to produce more frequent, more granular and/or more timely data on a wide range
of statistical topics have been identified. For example, [4, 25–28] use mobile phone metadata to
investigate population dynamics for more frequent population and tourism statistics. [29, 30]
apply the question on the whereabouts of a population to the post disaster setting. Mobility
aspects such as commuting and travelling routines have been looked at in more detail by [31–
36]. By exploiting both mobility and (social) network characteristics of mobile phone meta-
data, [37–42] and [43, 44] use mobile phone metadata to model disease spreading and integra-
tion, respectively. Mobile usage patterns have been explored to provide fine granular insights
on socio-demographic indicators such as multi-dimensional poverty [2, 3], literacy [1, 45] and
economic vulnerability [46, 47]. While most of these studies have mapped mobile phone meta-
data and groundtruth data using point-to-polygon allocation or voronoi tessellation, very few
studies have applied more elaborate approximation schemes. [4] propose a methodology based
on maximum likelihood estimation that uses cell footprints provided by one or multiple
MNOs in combination with location data from passive monitoring systems to acquire more
accurate measures on the density of MS. The authors run a simulation study on a 100x100m
synthetic population grid to compare the proposed methodology against voronoi-based cover-
age maps. However, the methodology requires very detailed information from the involved
MNOs, e.g. on the cell footprints and the signalling data that may prove difficult to acquire in
practice (see Section Mobile phone metadata). Further, while the authors rightly assume a
multinomial distribution of the MS counts, finding appropriate distributions for the wide
range of behavioural covariates appears less trivial. In order to simplify and improve the cover-
age mapping process, members of the European Statistical System as part of the ESSnet BigData project are currently developing mobloc [48]—an R package that implements the free
space path loss propagation model using technical specifications of antennas as input parame-
ters. However, neither [4] nor [48] systematically evaluate different coverage mapping tech-
niques on statistical modelling approaches using real-world data.
Background
Mobile phone metadata
Mobile networks not only transport data for communication purposes, they also generate data
for reasons such as network auditing, billing, maintenance and service provision. Some of this
meta information is created in interaction with user equipment such as MS. There are four
main caveats of using mobile phone metadata for population statistics in general. All of them
PLOS ONE Mapping mobile network data using satellite imagery and radio propagation modelling
PLOS ONE | https://doi.org/10.1371/journal.pone.0241981 November 9, 2020 4 / 28

have in common that they are active areas of current research. First, the customer base of an
MNO constitutes a non-representative population sample with unknown sampling design. The
consequences are varying sampling rates, i.e. locally changing market shares and parts of the
population being structurally excluded from the sample such as children, elderly and the very
poor. Second, the unit of observation—i.e. the MS, device, the SIM card and/or the subscriber—
does not perfectly match the unit of interest, which is the individual or household, as phone
sharing schemes or multi-SIM uses illustrate. Common approaches to account for these two
caveats are calibration and/or reconstructing the sampling design empirically. Third, mobile
phone metadata lacks the statistical concept of usual residence—a concept frequently used in
official statistics to determine the geo-location of an individual/household defined as the place
where an individual has lived or intends to live for a period of at least 6 or 12 months [49]. Dif-
ferent approaches to approximate the home location of an MS exists (e.g. night-time home loca-
tion defined as the most frequently used cell by an MS between 7pm and 7am during a certain
time window), however, the definitions do not map perfectly introducing uncertainty in further
analysis [50]. Fourth, coverage areas cannot be pinpointed as radio propagation is dynamic and
stochastic by nature. Propagation models of various complexity exist to provide approximations
as coverage ranges can generally vary from couple of hundred meters to over 40km.
Most scientific studies in the context of international development and official statistics use
CDRs—logs of interactions such as calls, text messages or internet use containing attributes of
the MS, the network and the connection—as a basis for further analysis. The advantages of
CDRs compared to other mobile phone metadata such as Visitor Location Registers (VLRs) or
other signalling data are threefold: First, they provide fine-grained geographical resolution
through cell-level identifiers. Second, they provide information both on the mobility and the
(social) network of the MS. Third, CDRs are fairly easy to access and to use in analysis as the
storage of essential attributes adheres to global standards such as 3gpp 32.295. However, in addi-
tion to the aforementioned general caveats of mobile phone metadata there are important cave-
ats specific to CDRs: Social network information extracted from CDRs are increasingly
incomplete due to a shift towards app-based communication (e.g. Whatsapp and Facebook mes-
senger). Mobility patterns are fragmented as locations are logged only during active MS use—
again a case of non-random sampling. Some MNOs are able to extract more detailed informa-
tion on the location of an MS and its app usage e.g. for geo-fencing purposes or app-based pric-
ing schemes through trilateration of signalling data and deep packet inspection, respectively.
This, however, requires specific hardware equipment and software capabilities, which not every
MNO has. Consequently, these type of information are rarely available to researchers.
Radio propagation modelling
Radio propagation modelling has been subject to research for decades. Coverage mappings in
mobile networks are generally used for network planning purposes [23, 51]. Looking at Phil-
lips et al. [6] is highly recommended as they provide an excellent overview on coverage map-
ping methods. In general, radio propagation modelling techniques in mobile networks largely
focus on estimating the path loss Lp a radio signal incurs en route between a transmitter tx and
a receiver rx. Together with the output power of the transmitter Ptx, the gains through directiv-
ity and efficiency of the involved antennas Gtx and Grx and their respective technically-
incurred losses Ltx and Lrx, it defines the link budget—the received power Prx usually expressed
logarithmically in decibel per milliwatt (dBm).
Prx ¼ Ptx þ Gtx þ Grx � Ltx � Lrx � Lp ð1Þ
PLOS ONE Mapping mobile network data using satellite imagery and radio propagation modelling
PLOS ONE | https://doi.org/10.1371/journal.pone.0241981 November 9, 2020 5 / 28

Since all RHS parameters except Lp are either known in advance due to the choice of the
technical equipment (i.e. Gtx and Ltx) or hardly observable (i.e. Grx and Lrx), I assume Gtx + Grx
− Ltx − Lrx = 0 in the following, leading to a simplified link budget defined as:
Prx ¼ Ptx � Lp ð2Þ
Intuitively, Eq 2 thus states that the signal strength observed on a MS solely depends on the
output power of the connected antenna and the loss in signal strength that occurs along the
way between antenna and MS. Given the abundance of available models, I follow the guidance
of the European Conference of Postal and Telecommunications Administrations (CEPT) on
radio propagation simulation for mobile services and opt for the widely popular extended
HATA model [52], named after Masaharu Hata, the author of the 1980 landmark study on the
“Empirical Formula for Propagation Loss in Land Mobile Radio Services” [53]. It is derived
from the COST-231 HATA model [54], which in turn builds on the original HATA [53] and
Okumura model [55]. They all have in common that they are empirical models to estimate the
median path loss between a transmitter and a receiver based on real-world measurements. The
HATA model extends the Okumura model by distinguishing between urban, suburban and
rural settings, thus accounting for different levels of mean attenuation due to obstacles and
changes in terrain. The COST-231 HATA model increases the frequency range of the original
HATA model. The extended HATA model is applicable for settings with frequencies f between
30-3000 MHz, distances d between 0-100km, transmitter heights htx between 30-200m and
receiver heights hrx between 1-10m. The general form of the extended HATA model LEHp con-
sists of a loss function L for the median path loss and a path loss variation term V drawn from
a log-normal distribution that accounts for the stochastic nature of radio propagation Since
model parameters vary depending on the distance, the expected environment env (indoor/out-
door and rural/suburban/urban) and the frequency, the full extended HATA model is not
spelled out in this paper, but can be accessed here: https://ecocfl.cept.org/display/SH/A17.3.1
+Outdoor-outdoor+propagation.
LEHp ðf ; d; htx; hrx; envÞ ¼ Lðf ; d; htx; hrx; envÞ þ Vðm; s; dÞ ð3Þ
As an example, I provide the path loss function of the extended HATA model LEHp for dis-
tances above 0.1km outdoor in rural areas for frequencies between 150 and 1500 MHz:
LEHp ¼ 69:6þ
46:09 � log 10f �
13:82 � log 10htxþ
ð44:9 � 6:55 � log 10htxÞ � log 10d�
ð1:1 � log 10f � 0:7Þ � hrx�
20 � log 10ðhrx=10Þ�
20 � log 10ðhtx=30Þ�
4:78 � ð log 10f Þ2�
40:14þ
Vð12; 12Þ
ð4Þ
PLOS ONE Mapping mobile network data using satellite imagery and radio propagation modelling
PLOS ONE | https://doi.org/10.1371/journal.pone.0241981 November 9, 2020 6 / 28
So, for example, an MS 1m above the ground at a line-of-sight distance of 3km in a rural
area to an omnidirectional antenna that is 30m above the ground transmitting at the 900 MHz
frequency band would experience a path loss of LEHp � 118dBm. Assuming a GSM macro-cell
with an output power Ptx = 43 dBm using Eq 2 yields a budget for that link, also known as
received signal strength (RSS), of Prx ¼ Ptx � LEHp � � 75dBm. As a rule of thumb, signals with
RSS values above −80 dBm are considered excellent, RSS values below −110 dBm point to very
poor signals.
Methodology
Usually, statistical data on individuals or households are geo-located to statistical areas via
their respective places of residence. Further, unit-level data is aggregated to area-level aggre-
gates using some form of weighting factor such as survey weights. For example, the poverty
rate of a region can either be calculated as the share of units classified as poor among the inter-
viewed residents of the region multiplied by their sampling weight or via sub-regional poverty
rates weighted with the respective sub-regional population counts. However, neither the places
of residences nor the weights are generally available on the cell-level of a mobile network (as
an equivalent to the sub-region). Hence, they need to be estimated.
In mobile phone metadata analysis, the place of residence of an individual/household is
usually approximated with the night-time home location of an MS recorded at the cell-level.
To derive survey weight proxies, for example, point-to-polygon allocation assumes equal
weights for all cells point-located within a statistical area. Voronoi tessellation uses the area
size of the intersection of voronoi tile and statistical area as weighting factor, i.e. 1 km2 always
conveys the same importance in aggregation, no matter whether it is 1 km2 of sparsely-inhab-
ited desert or 1 km2 of a densely-populated city.
In most cases, the place of residence of an individual/household (thus is approximation
alike) is linked to some form of settlement. However, neither the statistical area nor the cover-
age area of a cell account for that fact. Consequently, the underlying idea behind the proposed
methodology is to use human settlement information extracted from publicly available satellite
imagery as common geographic reference level for both statistical units such as households
and home-located MS. This allows to a) construct weights based on settlement counts and b)
refine weights in cases where MS counts, often regarded as highly sensitive information by the
MNO, are available. Further, in combination with technical information on the antenna, it
allows for an efficient coverage estimation to address the issues of holes and overlaps in a
mobile network.
In the following, settlements are denoted as i, BTS as j, statistical areas as t, the number of
home-located MS as d, the population count as p, the number of settlements as n and metadata
covariates as R. To illustrate the value added of the proposed methodologies, Fig 2a and
Table 1 showcase a typical setup faced when one seeks to augment official statistics with mobile
phone metadata: statistical indicators are provided for statistical areas A, B and C. Mobile
phone metadata is provided as BTS-level aggregates with the corresponding point locations 1
and 2. To account for that, I treat each cell site that may host multiple antennas as single omni-
directional antenna, calling it BTS subsequently. This constitutes a simplification of real
mobile networks where usually multiple directional antennas serving on various frequency
bands are co-located at the same site that does not necessarily have to be an actual (cell) tower.
Although accounting for directionality of antennas as done by e.g. [4] is likely to affect the
overall outcome of later analysis by increasing the number of network tiles available for map-
ping, the challenges for allocating them correctly (holes, non-linearities, overlaps, within-cell
PLOS ONE Mapping mobile network data using satellite imagery and radio propagation modelling
PLOS ONE | https://doi.org/10.1371/journal.pone.0241981 November 9, 2020 7 / 28

heterogeneity) remain. Consequently, it is expected that results from this study also apply to a
setup based on directional antennas, thereby justifying the simplifying assumption. Further
details on Fig 2b–2f are provided in the following subsections.
Point-to-polygon allocation
For purposes such as model fitting one approach to combine statistical data and mobile phone
metadata is to aggregate metadata covariates onto the same geographical level, e.g. statistical
areas. To do so, the point-to-polygon approach (p2p) treats BTS point locations as such and
allocates BTS-level metadata covariates using a binary weighting scheme (see Fig 2b and Eq 5).
wp2pj;t ≔
(1 if j � t
0 otherwiseð5Þ
Consequently, all network traffic handled by a BTS is attributed to one statistical area exclu-
sively, no matter whether it was generated by a home-located MS actually ‘residing’ in this area
or not. In the toy example, but also in the real-world application presented in Section Applica-
tion this leads to a situation where no metadata covariates are available for certain area, e.g.
area C—with negative effects on the final sample size in model fitting.
Voronoi tessellation
In contrast, voronoi tessellation (denoted by superscript v) divides the total space of interest
into perfectly disjunct tiles along the equidistant lines between points, in this case the BTS
Fig 2. Popular and proposed mapping schemes. Three statistical areas (A-C), two BTS (1-2) and numerous dots
representing built-up areas illustrate how different mapping schemes affect the allocation of BTS-level data to statistical
data.
https://doi.org/10.1371/journal.pone.0241981.g002
Table 1. Example of statistical data and mobile phone metadata.
area_id poverty_rate bts_id # of calls lon lat
1 0.23 6453 34050 43.2344 23.2342
2 0.11 8348 1023 50.0988 18.84217
https://doi.org/10.1371/journal.pone.0241981.t001
PLOS ONE Mapping mobile network data using satellite imagery and radio propagation modelling
PLOS ONE | https://doi.org/10.1371/journal.pone.0241981 November 9, 2020 8 / 28
point locations (see Fig 2c). The current state-of-the-art procedure is to intersect these tiles—
representing approximated coverage areas of BTS—with the statistical areas. The weights to
aggregate BTS-level metadata covariates to the respective statistical area are derived from the
size of the intersection of tiles aj and at of BTS j and statistical area t, respectively, in relation to
the total size of at, also expressed as
wvj;t≔
aj \ at
atð6Þ
In the toy example of Fig 2c, this would reduce to be the intersection of e.g. statistical area
A and the voronoi tile of BTS 1 divided by the total area of A. However, as mentioned above,
area sizes are used in that approach to approximate the (usually) unknown population counts
per intersection by implicitly assuming homogeneous distribution of the population within a
given statistical area.
Augmented voronoi tessellation
The proposed settlement-based mapping schemes relax this obviously strong assumption by
assuming a homogeneous housing structure instead, i.e. a constant population density per set-
tlement area within a given statistical area. Applied to voronoi tessellation, Fig 2c and 2d—
with settlement areas represented as dots—illustrate the difference. Instead of using the area
sizes aj and at to calculate the weights, the “augmented” voronoi tessellation (av) uses the num-
ber of settlements per area, denoted as nj and nt, respectively.
wavj;t≔
nj \ nt
ntð7Þ
Consequently, statistical area-level covariates can easily be acquired for both approaches
using a weighted average (or a weighted median) on BTS-level data.
R t ¼XJ
j¼1
wj;tRj ð8Þ
Going back to the toy example, while BTS 1 covers the smaller part of C in Fig 2c, thus
receives a smaller weight in the calculation of area-level metadata aggregates, it looks different
in Fig 2d when comparing the number of settlements, represented by green and purple dots.
This way, the proposed methodology accounts for within-cell heterogeneity of the population
distribution.
Both voronoi tessellation and augmented voronoi tessellation splits the full space of interest
into disjunct tiles. Applied to a mobile network this means ubiquituous coverage and zero
redundancies, i.e. all dots are uniquely associated to a specific BTS in the toy example. Again
this is a strong assumption that most likely does not hold true in any real-world application.
To relax this assumption by introducing holes and overlaps in the network coverage, addi-
tional information are necessary that allow for the estimation of coverage measures such as the
received signal strength (RSS) at any given point in space. Fig 2e exemplifies the consequences:
Some settlements are not covered (black dots) and some settlements, even though closer to
one BTS, receive a stronger signal from a more distant BTS. Assuming coverages are correctly
estimated in Fig 2e and 2f, it demonstrates that point-to-polygon allocation tends to underesti-
mate the coverage of statistical areas while voronoi tessellation tends to overestimate it.
PLOS ONE Mapping mobile network data using satellite imagery and radio propagation modelling
PLOS ONE | https://doi.org/10.1371/journal.pone.0241981 November 9, 2020 9 / 28
Propagation-based mapping schemes
Previously presented schemes follow a ‘BTS-centric’ approach by first determining the respec-
tive coverage area of a BTS and then analyzing potential overlaps with other places of interest
such as settlements. In contrast, propagation-based schemes follow an ‘MS-centric’ approach
by looking at the connectivity at the place of interest, i.e. the place of usual residence or the
home location first and then estimating which (group of) BTS it most likely serves. As outlined
in Section Radio propagation modelling, multiple ways exist to estimate the ‘connectivity’ of
an MS, but all require at least information on the distance to the surrounding BTS and addi-
tional technical specifications. With that, the serving BTS can be determined at each place of
interest, thus allowing for a more nuanced coverage mapping. Here, settlements can provide a
common geographic reference for the place usual residence and the home location alike.
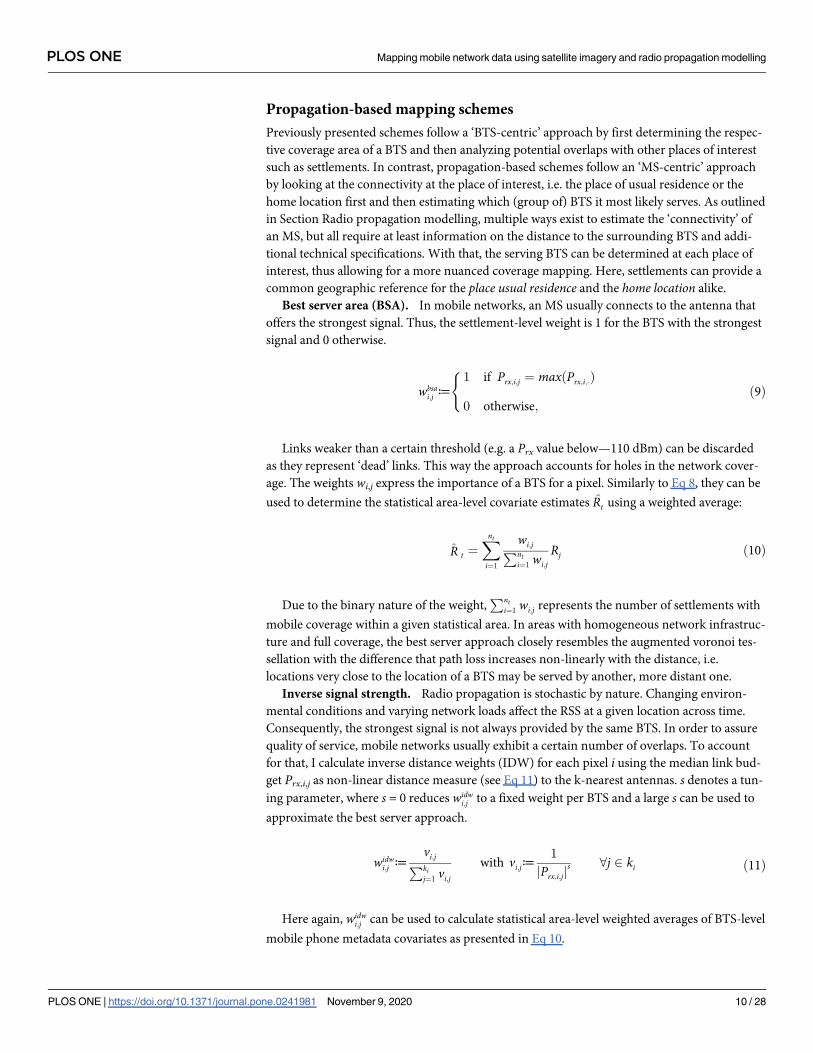
Best server area (BSA). In mobile networks, an MS usually connects to the antenna that
offers the strongest signal. Thus, the settlement-level weight is 1 for the BTS with the strongest
signal and 0 otherwise.
wbsai;j ≔
(1 if Prx;i;j ¼ maxðPrx;i;�Þ
0 otherwise;ð9Þ
Links weaker than a certain threshold (e.g. a Prx value below—110 dBm) can be discarded
as they represent ‘dead’ links. This way the approach accounts for holes in the network cover-
age. The weights wi,j express the importance of a BTS for a pixel. Similarly to Eq 8, they can be
used to determine the statistical area-level covariate estimates Rt using a weighted average:
R t ¼Xnt
i¼1
wi;jPnt
i¼1wi;j
Rj ð10Þ
Due to the binary nature of the weight,Pnt
i¼1wi;j represents the number of settlements with
mobile coverage within a given statistical area. In areas with homogeneous network infrastruc-
ture and full coverage, the best server approach closely resembles the augmented voronoi tes-
sellation with the difference that path loss increases non-linearly with the distance, i.e.
locations very close to the location of a BTS may be served by another, more distant one.
Inverse signal strength. Radio propagation is stochastic by nature. Changing environ-
mental conditions and varying network loads affect the RSS at a given location across time.
Consequently, the strongest signal is not always provided by the same BTS. In order to assure
quality of service, mobile networks usually exhibit a certain number of overlaps. To account
for that, I calculate inverse distance weights (IDW) for each pixel i using the median link bud-
get Prx,i,j as non-linear distance measure (see Eq 11) to the k-nearest antennas. s denotes a tun-
ing parameter, where s = 0 reduces widwi;j to a fixed weight per BTS and a large s can be used to
approximate the best server approach.
widwi;j ≔
vi;jPki
j¼1vi;j
with vi;j≔1
jPrx;i;jjs 8j 2 ki ð11Þ
Here again, widwi;j can be used to calculate statistical area-level weighted averages of BTS-level
mobile phone metadata covariates as presented in Eq 10.
PLOS ONE Mapping mobile network data using satellite imagery and radio propagation modelling
PLOS ONE | https://doi.org/10.1371/journal.pone.0241981 November 9, 2020 10 / 28

Potential extensions
Depending on data availability, the methodology can further be extended. While MNOs often
regard MS counts as highly sensitive information since they reveal a detailed picture of local
market shares, they can be used to further refine the weights towards more accurate population
counts. [4] presents elaborate approaches to use MS counts and advanced technical network
specifications to derive high-resolution population density estimates from signalling data.
Further, high-resolution population grid estimates such as provided by WorldPop at
100x100m [12] can be used as an alternative to binary settlement data. Here, wi;j can be substi-
tuted with the estimated population count pi per pixel directly extracted from the image.
Simulation
In order to evaluate the underlying motivation behind this methodology, i.e. more accurate
mapping schemes produce more accurate outcomes, I test the performance of the different
mapping approaches in terms of their overlap with the true coverage area and the accuracy of
the predictions in a controlled setting with groundtruth information. Therefore, I run a simu-
lation T = 1000 times on a synthetic population grid in which I re-distribute individuals, their
poverty status, BTS locations and technical BTS specifications randomly. I observe the geo-
graphical overlap of the true and the estimated coverage areas, the overlap in home-located set-
tlements and the correlation between the true and the estimated variable of interest (in this
case the poverty rate). The main challenge in this simulation is to create “true” coverage areas
for each BTS that provide a realistic, but simplified benchmark for this study. Consequently, I
opt for the extended HATA model. The choice is motivated by a series of propagation model
evaluations using real-world measurements, notably [56–58]. The stochastic component
within the HATA model is disabled in order to isolate the effect of interest.
Setup
I simulate a country including a major city, an uninhabited area such as a large lake or a
national park and rural area otherwise using a 1000 x 1000 grid where each quadratic pixel rep-
resents an edge length of 100m. The urban area is divided into 16 equally-sized (50 x 50 pixel)
small statistical areas, whereas the rural area is divided into 24 larger ones (200 x 200 pixel). I
randomly distribute one million individuals across the grid using a multivariate normal distri-
butions with μx = 10, μy = 10, Sx = [50, 0] and Sy = [0, 50] for the urban area (1/2 of the total
population) and varying parameter values for the rural centers and a uniform distribution for
the remaining rural area. Pixel-level population counts are calculated from individual-level
data. Fig 3 shows an example of the settlement distribution across space and the corresponding
population density.
In the next step, I randomly assign a poverty rate to each pixel. First, I generate a 4x4-pixel
poverty grid for which I calculate the population density (see Fig 4b). In order to account for
differences in the poverty rate between urban and rural areas, I randomly draw from a uniform
distribution with values between 0 and 1 and multiply it with the inverted normalized popula-
tion density. This poverty rate serves as the mean μ for randomly assigning poverty rates to set-
tlements within the respective grid area using a normal distribution N(μ, σ) with σ = 0.5.
Values below 0 and above 1 are windsorized. This two-step procedure tries to limit good pre-
dictive performances for areas not actually covered due to inference facilitated by the same
underlying data generating process. Further, I assume that every inhabitant has one and only
one MS and that there exists an indicator derived from mobile phone metadata that perfectly
correlates with the true poverty rate of a given set of MS. Consequently, deviations in the
PLOS ONE Mapping mobile network data using satellite imagery and radio propagation modelling
PLOS ONE | https://doi.org/10.1371/journal.pone.0241981 November 9, 2020 11 / 28

correlation between the poverty rate captured via the “true” coverage area and the poverty rate
captured via the estimated coverage area exclusively originate in their coverage mismatch.
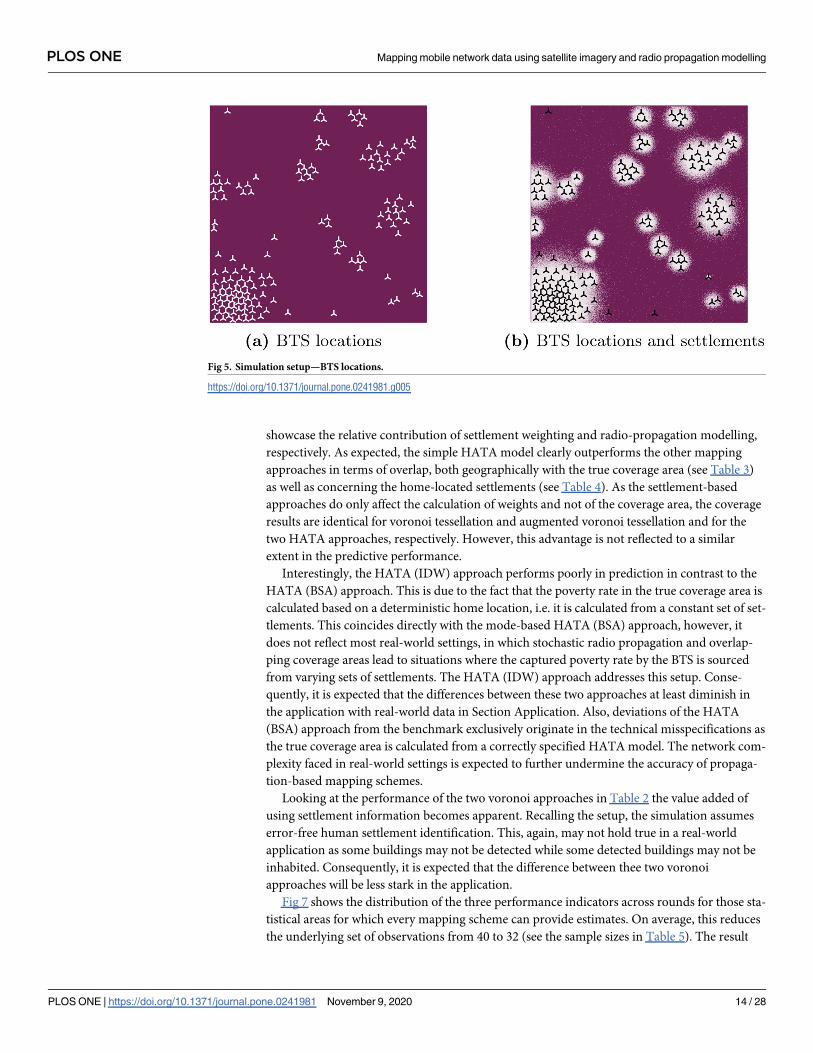
In order to create a mobile network on top of that structure, I use a clustering algorithm
based on the population density (see Fig 5b). BTS are distributed across the country at a ratio
of roughly 1 BTS per 5,000 inhabitants in urban areas and 1 BTS per 10,000 inhabitants in
rural areas. This results in 100 urban and 50 rural BTS in this simulation. BTS are interpreted
as omnidirectional antennas and assigned specific heights, frequencies and output powers.
The specifications vary more strongly in the urban area in order to reflect the greater complex-
ity of network topology generally found in metropolitan areas. Since the HATA model
requires a classification of areas into urban, suburban and rural, I use those 50% of BTS with
the smallest number of pixels associated to them by the clustering algorithm used above as
urban and those 5% of BTS with the largest number of pixels as rural, suburban otherwise. At
the end, BTS heights are between 15—60 m with frequencies at 900 MHz and 2100 MHz and
output power between 40 and 47 dBm. The MS height is fixed at 1m above ground level.
Based on these technical specifications, the true coverage areas and the true home locations
of the settlements using the extended HATA model are calculated and used to create bench-
mark estimates of the true poverty rate. The results are then compared against estimates from
point-to-polygon allocation, voronoi tessellation, augmented voronoi tessellation and BSA
and IDW approaches of a naïve (’simple’) version of the extended HATA model that does not
know the exact technical BTS specifications, but makes an educated guess based on publicly
available information such as the frequencies used in the country and the location of urban
centers. Fig 6 exemplifies how the approaches differ in terms of geographical coverage.
The results are compared in three different ways: How much do they overlap geographi-
cally? How much do they overlap in terms of home-located settlements? How well do they pre-
dict the true poverty rate of a given statistical area?
Results
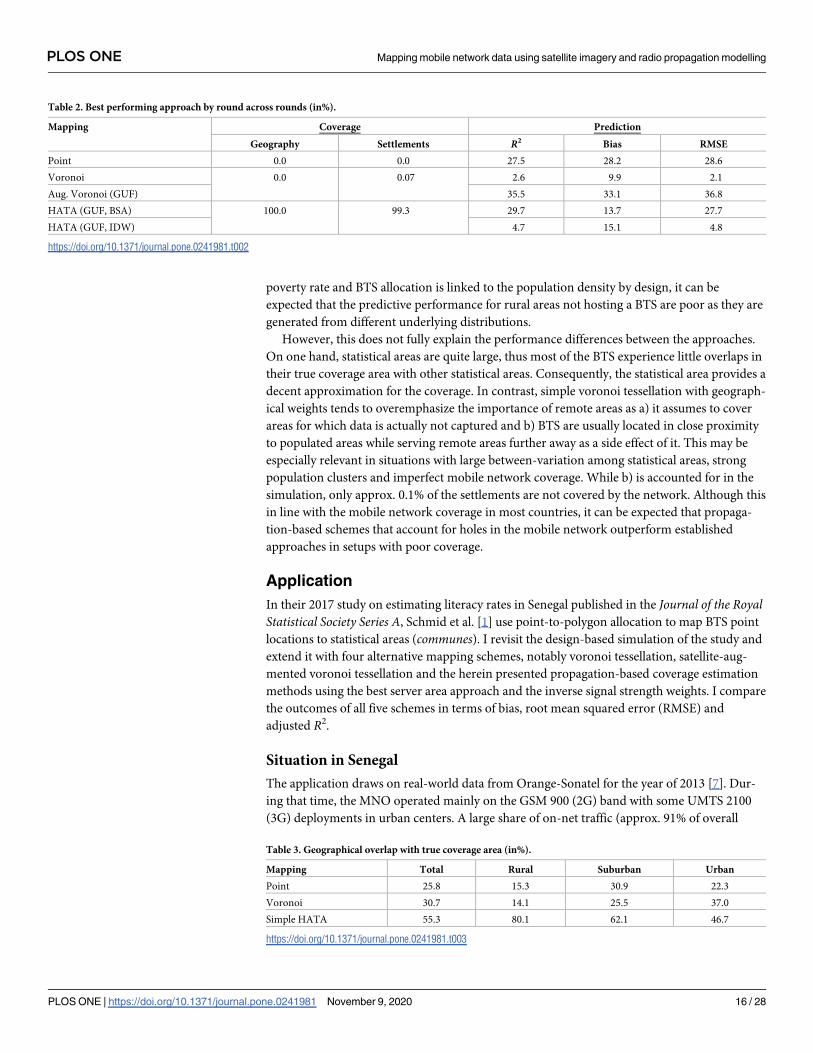
Table 2 shows the best performing approach in each round across round for all five perfor-
mance indicators. Performance differences between voronoi tessellation versus the augmented
voronoi tessellation and the augmented voronoi tessellation versus the HATA (BSA) approach
Fig 3. Simulation setup—Settlements. (a) shows locations of the built-up areas in a hypothetical country, while (b)
shows the corresponding population density in these areas (the brighter the colour, the higher the population density).
https://doi.org/10.1371/journal.pone.0241981.g003
PLOS ONE Mapping mobile network data using satellite imagery and radio propagation modelling
PLOS ONE | https://doi.org/10.1371/journal.pone.0241981 November 9, 2020 12 / 28
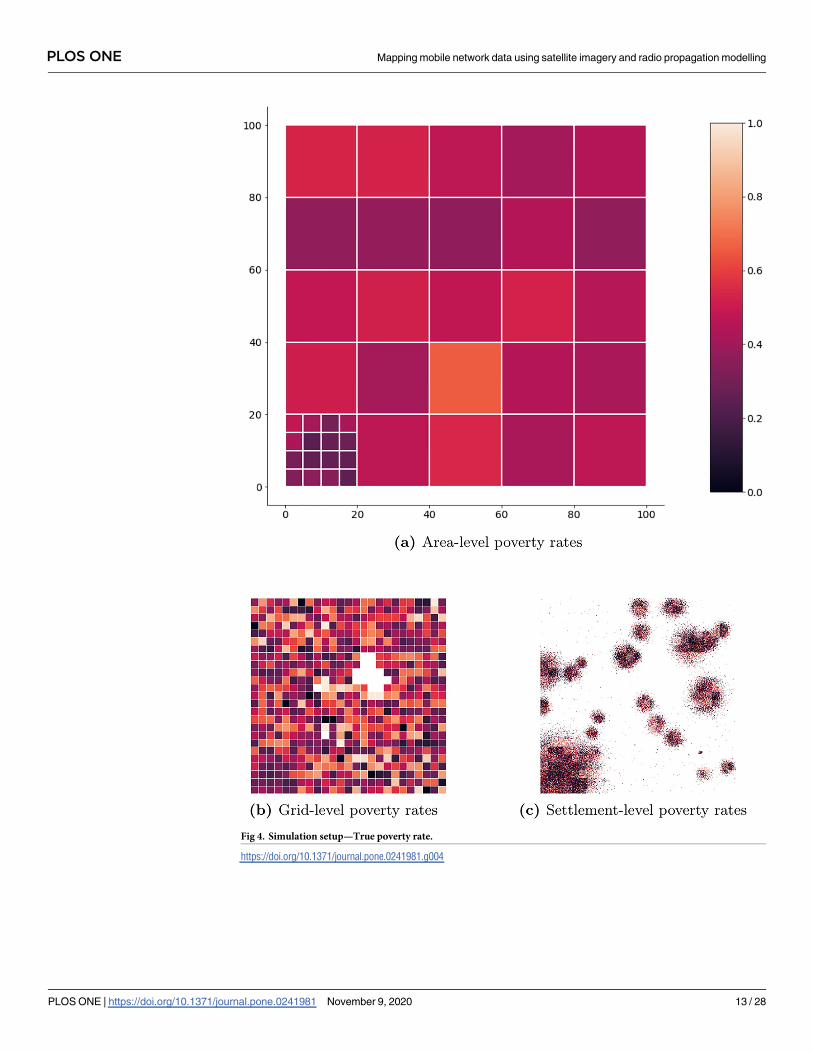
Fig 4. Simulation setup—True poverty rate.
https://doi.org/10.1371/journal.pone.0241981.g004
PLOS ONE Mapping mobile network data using satellite imagery and radio propagation modelling
PLOS ONE | https://doi.org/10.1371/journal.pone.0241981 November 9, 2020 13 / 28
showcase the relative contribution of settlement weighting and radio-propagation modelling,
respectively. As expected, the simple HATA model clearly outperforms the other mapping
approaches in terms of overlap, both geographically with the true coverage area (see Table 3)
as well as concerning the home-located settlements (see Table 4). As the settlement-based
approaches do only affect the calculation of weights and not of the coverage area, the coverage
results are identical for voronoi tessellation and augmented voronoi tessellation and for the
two HATA approaches, respectively. However, this advantage is not reflected to a similar
extent in the predictive performance.
Interestingly, the HATA (IDW) approach performs poorly in prediction in contrast to the
HATA (BSA) approach. This is due to the fact that the poverty rate in the true coverage area is
calculated based on a deterministic home location, i.e. it is calculated from a constant set of set-
tlements. This coincides directly with the mode-based HATA (BSA) approach, however, it
does not reflect most real-world settings, in which stochastic radio propagation and overlap-
ping coverage areas lead to situations where the captured poverty rate by the BTS is sourced
from varying sets of settlements. The HATA (IDW) approach addresses this setup. Conse-
quently, it is expected that the differences between these two approaches at least diminish in
the application with real-world data in Section Application. Also, deviations of the HATA
(BSA) approach from the benchmark exclusively originate in the technical misspecifications as
the true coverage area is calculated from a correctly specified HATA model. The network com-
plexity faced in real-world settings is expected to further undermine the accuracy of propaga-
tion-based mapping schemes.
Looking at the performance of the two voronoi approaches in Table 2 the value added of
using settlement information becomes apparent. Recalling the setup, the simulation assumes
error-free human settlement identification. This, again, may not hold true in a real-world
application as some buildings may not be detected while some detected buildings may not be
inhabited. Consequently, it is expected that the difference between thee two voronoi
approaches will be less stark in the application.
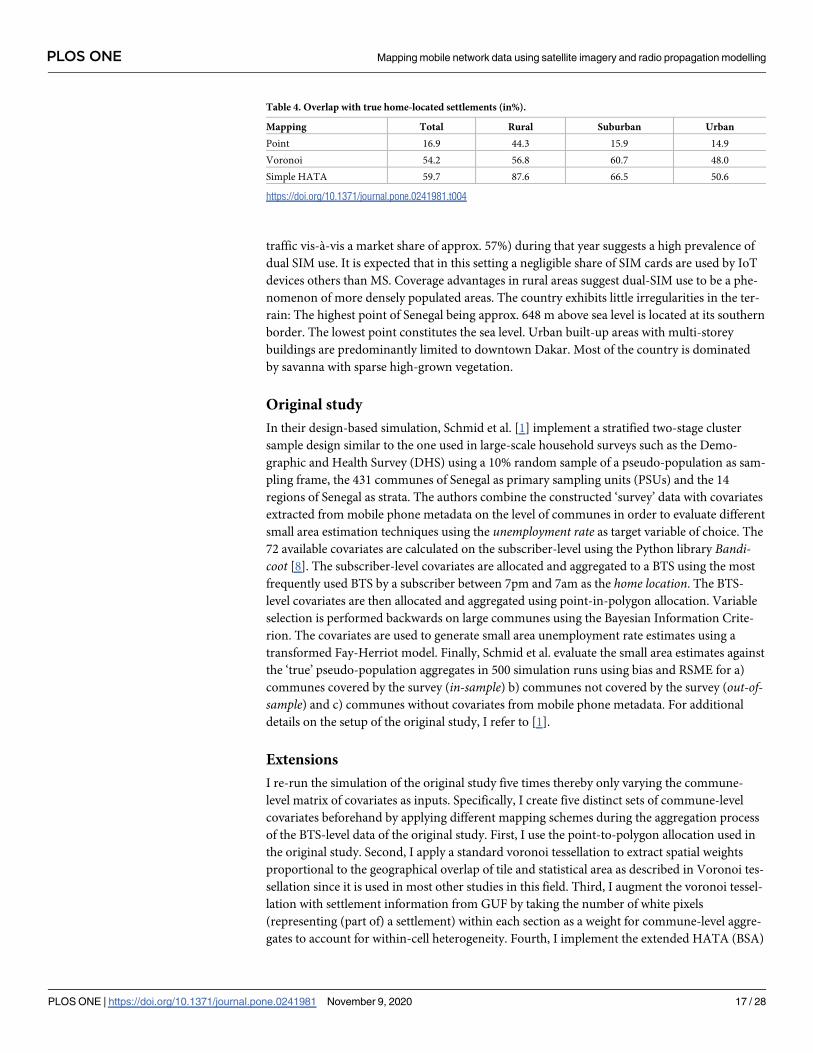
Fig 7 shows the distribution of the three performance indicators across rounds for those sta-
tistical areas for which every mapping scheme can provide estimates. On average, this reduces
the underlying set of observations from 40 to 32 (see the sample sizes in Table 5). The result
Fig 5. Simulation setup—BTS locations.
https://doi.org/10.1371/journal.pone.0241981.g005
PLOS ONE Mapping mobile network data using satellite imagery and radio propagation modelling
PLOS ONE | https://doi.org/10.1371/journal.pone.0241981 November 9, 2020 14 / 28

for the true coverage area are represented as benchmark for the other approaches as it estimates
the settlement-level poverty rates actually captured by the respective BTS. Consequently, the
benchmark should provide the upper bound for the R2 and the lower bound for the bias and
the RMSE in each round. Deviations thereof may only be due to spurious correlation.
The sample size difference also explains the difference between the performance of the
point-to-polygon approach in terms of correlation in Table 5 vis-à-vis the performance met-
rics, especially in rural areas. Point-to-polygon allocation does not provide poverty estimates
for 8 out of 40 statistical areas, on average, as they do not host a BTS (cf. Fig 6b). As both
Fig 6. Coverage areas exemplified.
https://doi.org/10.1371/journal.pone.0241981.g006
PLOS ONE Mapping mobile network data using satellite imagery and radio propagation modelling
PLOS ONE | https://doi.org/10.1371/journal.pone.0241981 November 9, 2020 15 / 28
poverty rate and BTS allocation is linked to the population density by design, it can be
expected that the predictive performance for rural areas not hosting a BTS are poor as they are
generated from different underlying distributions.
However, this does not fully explain the performance differences between the approaches.
On one hand, statistical areas are quite large, thus most of the BTS experience little overlaps in
their true coverage area with other statistical areas. Consequently, the statistical area provides a
decent approximation for the coverage. In contrast, simple voronoi tessellation with geograph-
ical weights tends to overemphasize the importance of remote areas as a) it assumes to cover
areas for which data is actually not captured and b) BTS are usually located in close proximity
to populated areas while serving remote areas further away as a side effect of it. This may be
especially relevant in situations with large between-variation among statistical areas, strong
population clusters and imperfect mobile network coverage. While b) is accounted for in the
simulation, only approx. 0.1% of the settlements are not covered by the network. Although this
in line with the mobile network coverage in most countries, it can be expected that propaga-
tion-based schemes that account for holes in the mobile network outperform established
approaches in setups with poor coverage.
Application
In their 2017 study on estimating literacy rates in Senegal published in the Journal of the RoyalStatistical Society Series A, Schmid et al. [1] use point-to-polygon allocation to map BTS point
locations to statistical areas (communes). I revisit the design-based simulation of the study and
extend it with four alternative mapping schemes, notably voronoi tessellation, satellite-aug-
mented voronoi tessellation and the herein presented propagation-based coverage estimation
methods using the best server area approach and the inverse signal strength weights. I compare
the outcomes of all five schemes in terms of bias, root mean squared error (RMSE) and
adjusted R2.
Situation in Senegal
The application draws on real-world data from Orange-Sonatel for the year of 2013 [7]. Dur-
ing that time, the MNO operated mainly on the GSM 900 (2G) band with some UMTS 2100
(3G) deployments in urban centers. A large share of on-net traffic (approx. 91% of overall
Table 2. Best performing approach by round across rounds (in%).
Mapping Coverage Prediction
Geography Settlements R2 Bias RMSE
Point 0.0 0.0 27.5 28.2 28.6
Voronoi 0.0 0.07 2.6 9.9 2.1
Aug. Voronoi (GUF) 35.5 33.1 36.8
HATA (GUF, BSA) 100.0 99.3 29.7 13.7 27.7
HATA (GUF, IDW) 4.7 15.1 4.8
https://doi.org/10.1371/journal.pone.0241981.t002
Table 3. Geographical overlap with true coverage area (in%).
Mapping Total Rural Suburban Urban
Point 25.8 15.3 30.9 22.3
Voronoi 30.7 14.1 25.5 37.0
Simple HATA 55.3 80.1 62.1 46.7
https://doi.org/10.1371/journal.pone.0241981.t003
PLOS ONE Mapping mobile network data using satellite imagery and radio propagation modelling
PLOS ONE | https://doi.org/10.1371/journal.pone.0241981 November 9, 2020 16 / 28
traffic vis-à-vis a market share of approx. 57%) during that year suggests a high prevalence of
dual SIM use. It is expected that in this setting a negligible share of SIM cards are used by IoT
devices others than MS. Coverage advantages in rural areas suggest dual-SIM use to be a phe-
nomenon of more densely populated areas. The country exhibits little irregularities in the ter-
rain: The highest point of Senegal being approx. 648 m above sea level is located at its southern
border. The lowest point constitutes the sea level. Urban built-up areas with multi-storey
buildings are predominantly limited to downtown Dakar. Most of the country is dominated
by savanna with sparse high-grown vegetation.
Original study
In their design-based simulation, Schmid et al. [1] implement a stratified two-stage cluster
sample design similar to the one used in large-scale household surveys such as the Demo-
graphic and Health Survey (DHS) using a 10% random sample of a pseudo-population as sam-
pling frame, the 431 communes of Senegal as primary sampling units (PSUs) and the 14
regions of Senegal as strata. The authors combine the constructed ‘survey’ data with covariates
extracted from mobile phone metadata on the level of communes in order to evaluate different
small area estimation techniques using the unemployment rate as target variable of choice. The
72 available covariates are calculated on the subscriber-level using the Python library Bandi-coot [8]. The subscriber-level covariates are allocated and aggregated to a BTS using the most
frequently used BTS by a subscriber between 7pm and 7am as the home location. The BTS-
level covariates are then allocated and aggregated using point-in-polygon allocation. Variable
selection is performed backwards on large communes using the Bayesian Information Crite-
rion. The covariates are used to generate small area unemployment rate estimates using a
transformed Fay-Herriot model. Finally, Schmid et al. evaluate the small area estimates against
the ‘true’ pseudo-population aggregates in 500 simulation runs using bias and RSME for a)
communes covered by the survey (in-sample) b) communes not covered by the survey (out-of-sample) and c) communes without covariates from mobile phone metadata. For additional
details on the setup of the original study, I refer to [1].
Extensions
I re-run the simulation of the original study five times thereby only varying the commune-
level matrix of covariates as inputs. Specifically, I create five distinct sets of commune-level
covariates beforehand by applying different mapping schemes during the aggregation process
of the BTS-level data of the original study. First, I use the point-to-polygon allocation used in
the original study. Second, I apply a standard voronoi tessellation to extract spatial weights
proportional to the geographical overlap of tile and statistical area as described in Voronoi tes-
sellation since it is used in most other studies in this field. Third, I augment the voronoi tessel-
lation with settlement information from GUF by taking the number of white pixels
(representing (part of) a settlement) within each section as a weight for commune-level aggre-
gates to account for within-cell heterogeneity. Fourth, I implement the extended HATA (BSA)
Table 4. Overlap with true home-located settlements (in%).
Mapping Total Rural Suburban Urban
Point 16.9 44.3 15.9 14.9
Voronoi 54.2 56.8 60.7 48.0
Simple HATA 59.7 87.6 66.5 50.6
https://doi.org/10.1371/journal.pone.0241981.t004
PLOS ONE Mapping mobile network data using satellite imagery and radio propagation modelling
PLOS ONE | https://doi.org/10.1371/journal.pone.0241981 November 9, 2020 17 / 28
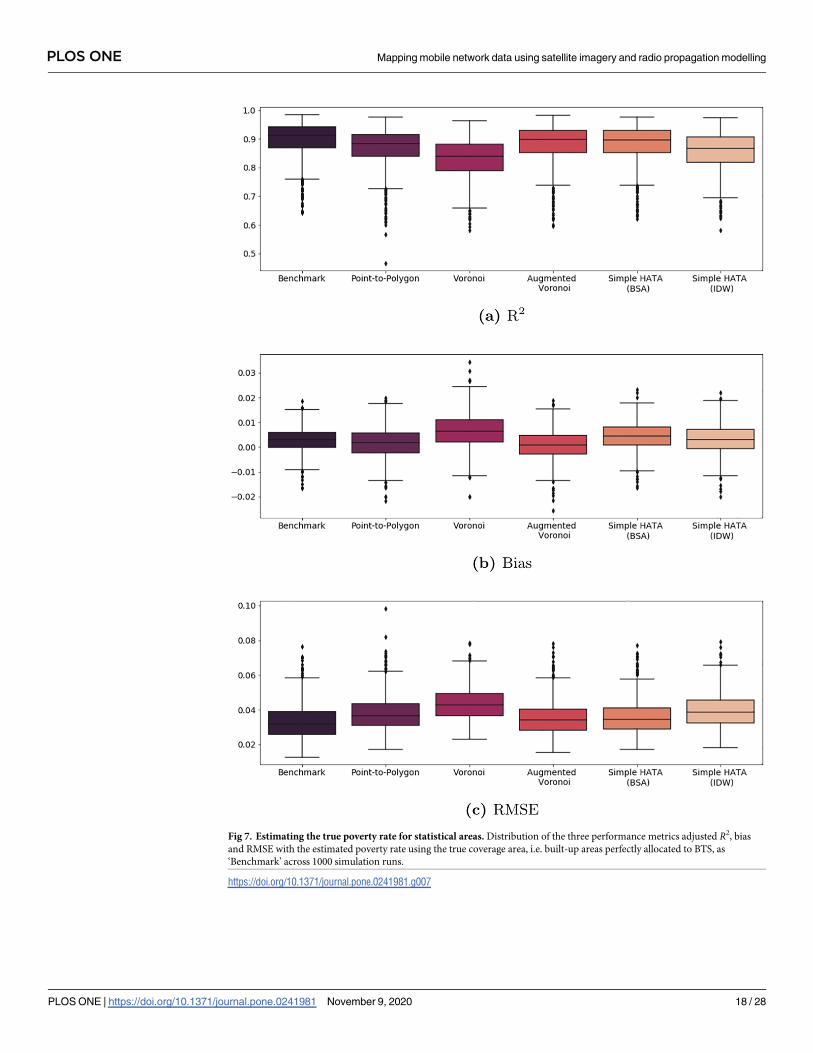
Fig 7. Estimating the true poverty rate for statistical areas. Distribution of the three performance metrics adjusted R2, bias
and RMSE with the estimated poverty rate using the true coverage area, i.e. built-up areas perfectly allocated to BTS, as
‘Benchmark’ across 1000 simulation runs.
https://doi.org/10.1371/journal.pone.0241981.g007
PLOS ONE Mapping mobile network data using satellite imagery and radio propagation modelling
PLOS ONE | https://doi.org/10.1371/journal.pone.0241981 November 9, 2020 18 / 28
model as presented in Methodology and GUF data. In densely populated areas, this approach
closely resembles voronoi tessellation, however, it allows for holes in the network and for non-
linear relationships between signal strength and distance. Fifth, I use inverse signal strength
weights—HATA (IDW)—to capture the stochastic nature of a link.
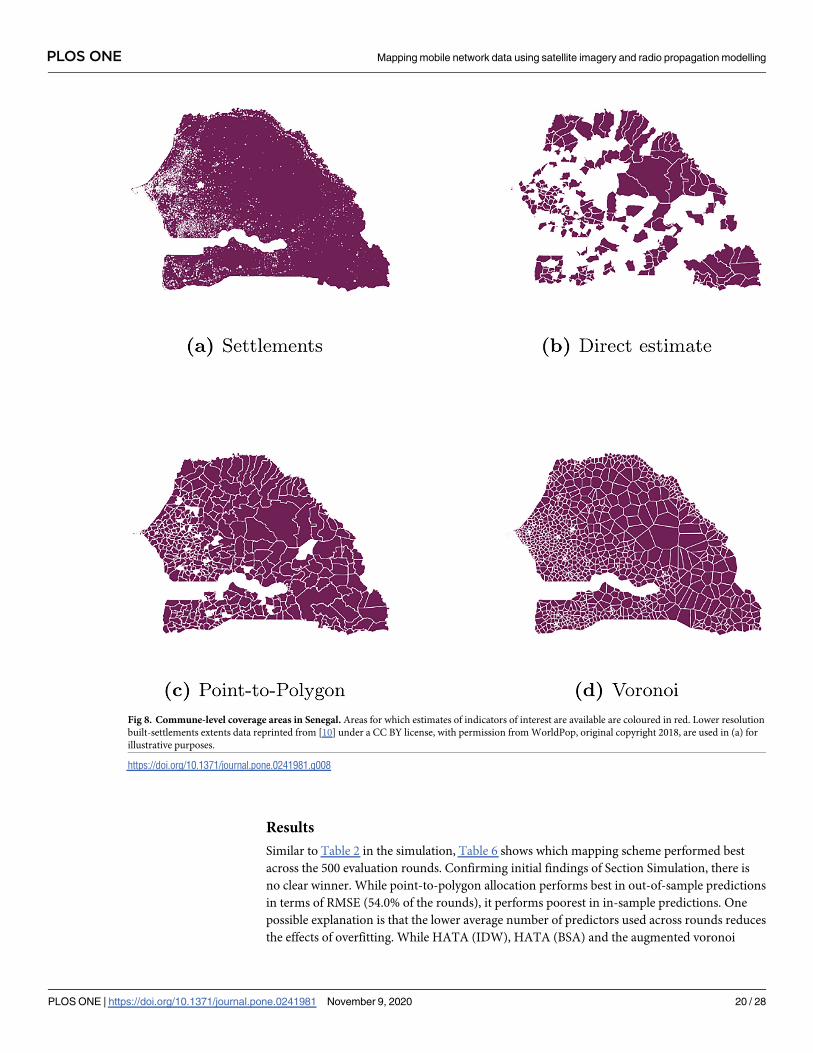
Comparing Fig 8c and 8d to the direct estimator (Fig 8b) shows the benefits of augmenting
survey data with mobile phone metadata: providing estimates for small areas not originally
covered by the survey. Looking at settlements in Fig 8a, it is noteworthy that one commune—
Thietty in the region Kolda—does not appear to host any settlement identified as such in GUF
data. While official population numbers do not support this view, it underlines the fact that
information extracted from satellite imagery, e.g. settlement classifications, are subject to some
degree of uncertainty.
Assumptions
In contrast to point-to-polygon allocation and voronoi tessellation, the extended HATA
model requires additional technical antenna specifications, notably the antenna and receiver
height, the frequency and the transmitter power. As additional information are not available
in the original study, I make following assumptions: I fix both the antenna height htx and the
receiver height hrx at the lower bound of the extended HATA model, which is 30 m and 1 m,
respectively, both located outdoors with line-of-sight and a transceiver installed above the
roof. As most of Senegal is flat without high multi-storey buildings except in downtown Dakar
and in large parts no high-grown vegetation this assumption appears reasonable. Further, I fix
the frequency in rural areas at 900 MHz and in urban centers at 2100 MHz and I interpret BTS
as omnidirectional antennas with an output power of 45 dBm. This is clearly a simplification
of the actual network topology, especially in urban areas with a mix of directed micro and
macro cells. However, in Senegal in 2013, 4G has not yet been introduced and Orange-Sonatel
was operating 3G (on the 2100 MHz frequency band) only in urban areas. The remaining
country was served with 2G technology on the 900 MHz band. Comparing own estimates with
coverage area estimates for 2G in 2017 published by Sonatel [59] allows for a rough sanity
check for the assumptions.
While Senegal offers an official classification of rural and urban on the commune-level, it is
imperfect for the purposes of this study, as it takes a wide variety of non-network-specific fac-
tors into account. This leads to a situation where places with a high population density, e.g.
Touba Mosque, are classified as commune rurale. Instead, I use BTS density per km2 as a proxy
for urbanity with a threshold of 1. Communes with more than one BTS per km2 are classified
as urban, those 50% of the communes with the lowest site density are classified as rural, the
remaining communes are classified as suburban. This represents a more network-oriented
measure of urbanity and is also in line with the area type classification of the HATA model.
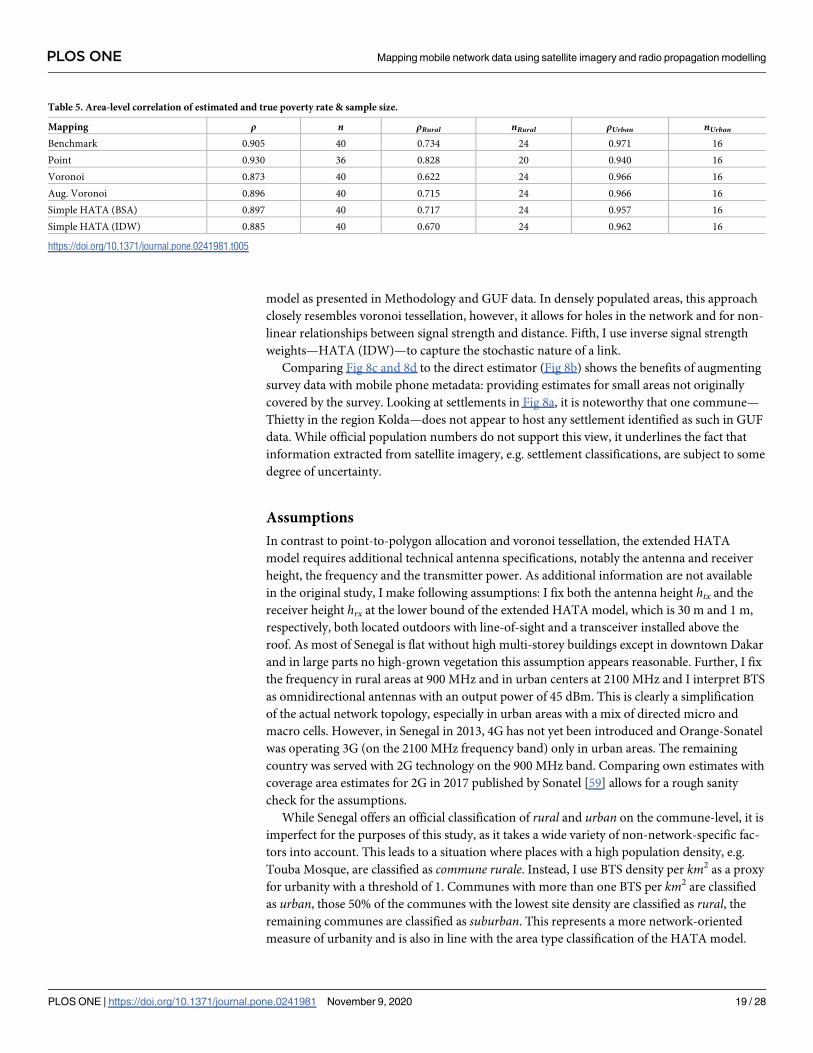
Table 5. Area-level correlation of estimated and true poverty rate & sample size.
Mapping ρ n ρRural nRural ρUrban nUrbanBenchmark 0.905 40 0.734 24 0.971 16
Point 0.930 36 0.828 20 0.940 16
Voronoi 0.873 40 0.622 24 0.966 16
Aug. Voronoi 0.896 40 0.715 24 0.966 16
Simple HATA (BSA) 0.897 40 0.717 24 0.957 16
Simple HATA (IDW) 0.885 40 0.670 24 0.962 16
https://doi.org/10.1371/journal.pone.0241981.t005
PLOS ONE Mapping mobile network data using satellite imagery and radio propagation modelling
PLOS ONE | https://doi.org/10.1371/journal.pone.0241981 November 9, 2020 19 / 28
Results
Similar to Table 2 in the simulation, Table 6 shows which mapping scheme performed best
across the 500 evaluation rounds. Confirming initial findings of Section Simulation, there is
no clear winner. While point-to-polygon allocation performs best in out-of-sample predictions
in terms of RMSE (54.0% of the rounds), it performs poorest in in-sample predictions. One
possible explanation is that the lower average number of predictors used across rounds reduces
the effects of overfitting. While HATA (IDW), HATA (BSA) and the augmented voronoi
Fig 8. Commune-level coverage areas in Senegal. Areas for which estimates of indicators of interest are available are coloured in red. Lower resolution
built-settlements extents data reprinted from [10] under a CC BY license, with permission from WorldPop, original copyright 2018, are used in (a) for
illustrative purposes.
https://doi.org/10.1371/journal.pone.0241981.g008
PLOS ONE Mapping mobile network data using satellite imagery and radio propagation modelling
PLOS ONE | https://doi.org/10.1371/journal.pone.0241981 November 9, 2020 20 / 28
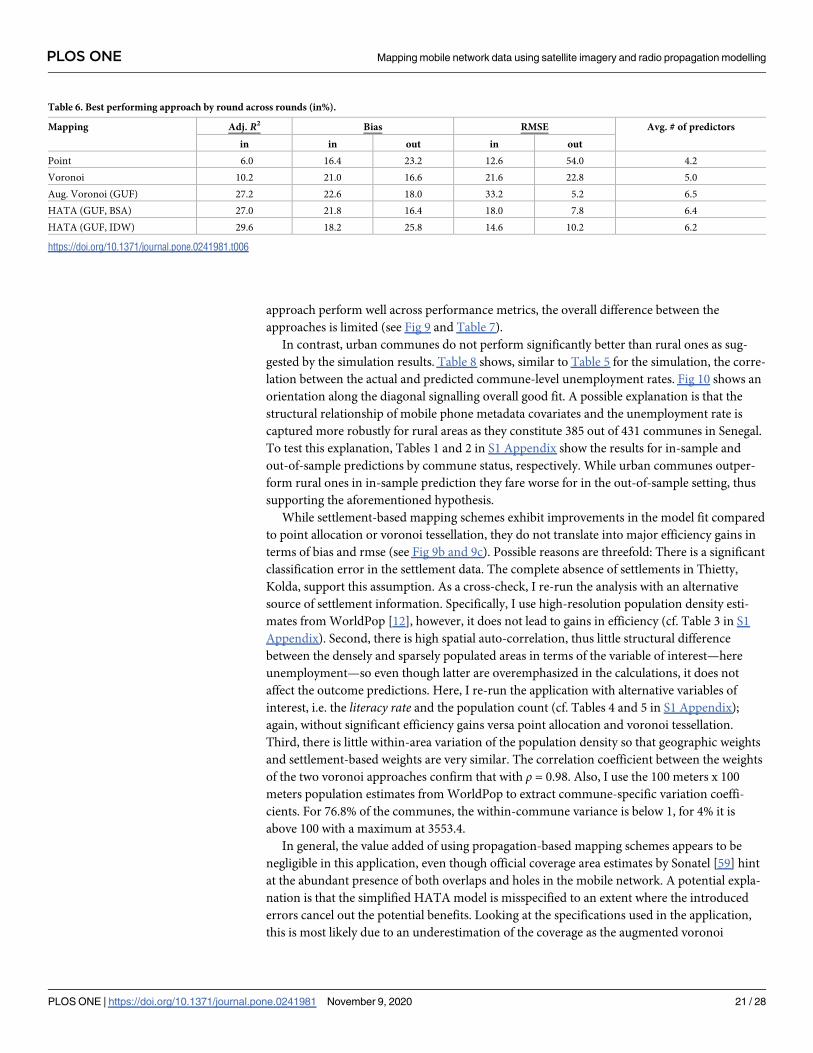
approach perform well across performance metrics, the overall difference between the
approaches is limited (see Fig 9 and Table 7).
In contrast, urban communes do not perform significantly better than rural ones as sug-
gested by the simulation results. Table 8 shows, similar to Table 5 for the simulation, the corre-
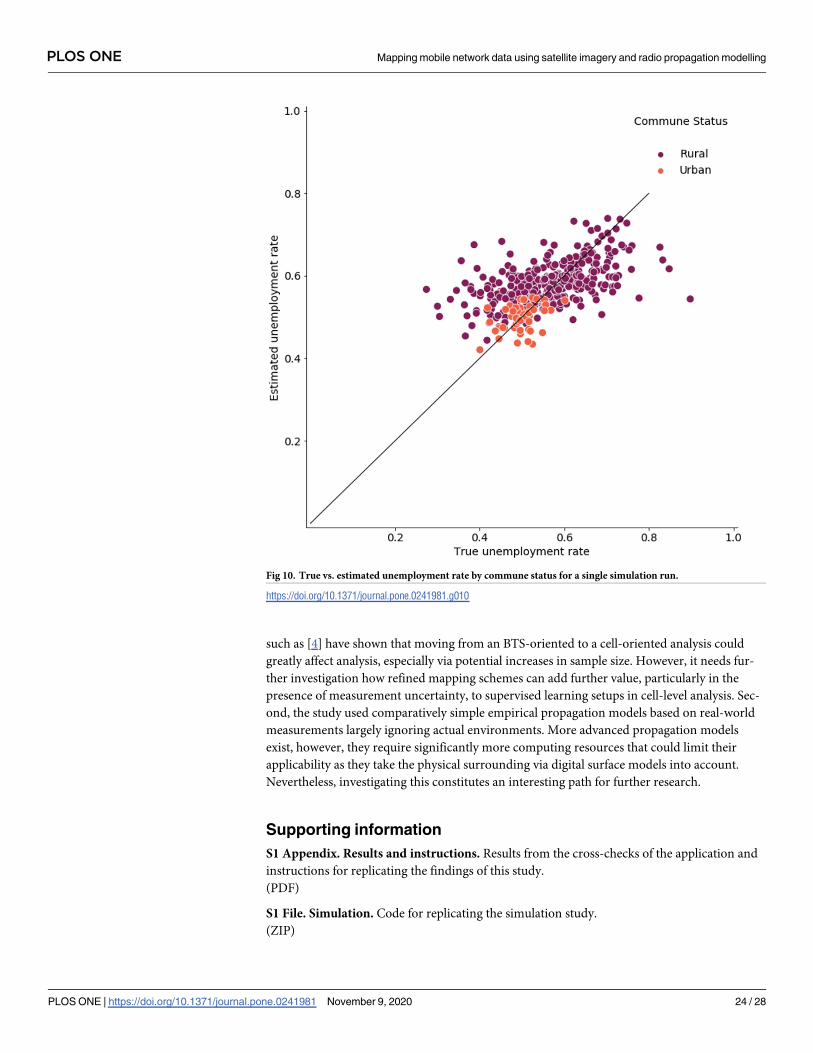
lation between the actual and predicted commune-level unemployment rates. Fig 10 shows an
orientation along the diagonal signalling overall good fit. A possible explanation is that the
structural relationship of mobile phone metadata covariates and the unemployment rate is
captured more robustly for rural areas as they constitute 385 out of 431 communes in Senegal.
To test this explanation, Tables 1 and 2 in S1 Appendix show the results for in-sample and
out-of-sample predictions by commune status, respectively. While urban communes outper-
form rural ones in in-sample prediction they fare worse for in the out-of-sample setting, thus
supporting the aforementioned hypothesis.
While settlement-based mapping schemes exhibit improvements in the model fit compared
to point allocation or voronoi tessellation, they do not translate into major efficiency gains in
terms of bias and rmse (see Fig 9b and 9c). Possible reasons are threefold: There is a significant
classification error in the settlement data. The complete absence of settlements in Thietty,
Kolda, support this assumption. As a cross-check, I re-run the analysis with an alternative
source of settlement information. Specifically, I use high-resolution population density esti-
mates from WorldPop [12], however, it does not lead to gains in efficiency (cf. Table 3 in S1
Appendix). Second, there is high spatial auto-correlation, thus little structural difference
between the densely and sparsely populated areas in terms of the variable of interest—here
unemployment—so even though latter are overemphasized in the calculations, it does not
affect the outcome predictions. Here, I re-run the application with alternative variables of
interest, i.e. the literacy rate and the population count (cf. Tables 4 and 5 in S1 Appendix);
again, without significant efficiency gains versa point allocation and voronoi tessellation.
Third, there is little within-area variation of the population density so that geographic weights
and settlement-based weights are very similar. The correlation coefficient between the weights
of the two voronoi approaches confirm that with ρ = 0.98. Also, I use the 100 meters x 100
meters population estimates from WorldPop to extract commune-specific variation coeffi-
cients. For 76.8% of the communes, the within-commune variance is below 1, for 4% it is
above 100 with a maximum at 3553.4.
In general, the value added of using propagation-based mapping schemes appears to be
negligible in this application, even though official coverage area estimates by Sonatel [59] hint
at the abundant presence of both overlaps and holes in the mobile network. A potential expla-
nation is that the simplified HATA model is misspecified to an extent where the introduced
errors cancel out the potential benefits. Looking at the specifications used in the application,
this is most likely due to an underestimation of the coverage as the augmented voronoi
Table 6. Best performing approach by round across rounds (in%).
Mapping Adj. R2 Bias RMSE Avg. # of predictors
in in out in out
Point 6.0 16.4 23.2 12.6 54.0 4.2
Voronoi 10.2 21.0 16.6 21.6 22.8 5.0
Aug. Voronoi (GUF) 27.2 22.6 18.0 33.2 5.2 6.5
HATA (GUF, BSA) 27.0 21.8 16.4 18.0 7.8 6.4
HATA (GUF, IDW) 29.6 18.2 25.8 14.6 10.2 6.2
https://doi.org/10.1371/journal.pone.0241981.t006
PLOS ONE Mapping mobile network data using satellite imagery and radio propagation modelling
PLOS ONE | https://doi.org/10.1371/journal.pone.0241981 November 9, 2020 21 / 28

Fig 9. Evaluation of poverty rate estimates for in-sample communes. Distribution of the three performance metrics adjusted
R2, bias and RMSE across 500 simulation runs on a comparable set of communes. The typical trade-off between the bias and the
variance of a small area estimator vis-à-vis the direct survey estimator becomes apparent.
https://doi.org/10.1371/journal.pone.0241981.g009
PLOS ONE Mapping mobile network data using satellite imagery and radio propagation modelling
PLOS ONE | https://doi.org/10.1371/journal.pone.0241981 November 9, 2020 22 / 28
approach closely resembles the upper bound for an overestimation using the HATA (BSA)
within a—by assumption—largely homogeneous network.
Conclusion
Augmenting official statistics with mobile phone metadata still faces multiple methodological
challenges, one of them is finding a common reference unit. As record-linkage on the individ-
ual-level presents considerable privacy risks a common procedure is to combine aggregates of
these two disparate data sources on a geographical level. However, the stochastic nature of
radio propagation makes it difficult to pin down coverage areas of the mobile network. Based
on this study the good news is that it does not have to be complicated if supervised learning /
prediction is the goal. While propagation-based models can help to refine the accuracy of cov-
erage area estimation, it does not greatly impact the quality of the outcome predictions. One
reason is that usually cells are located in a way that they provide a good service to as many MS
as possible. As radio signals fade over distance, this means they are in close proximity to areas
with high demand, i.e. densely populated places. Mapping schemes, in turn, mainly differ
from each other when looking at the limits of a cell. However, most of the traffic which is cor-
related with statistical data for training/prediction is generated nearby, so the differences
between mapping schemes become less relevant. Also, while geographical weights as used in
most applications in this field ignore heterogeneity occurring within the cells, the correspond-
ing statistical areas are often significantly larger. Therefore, cross-border cells, which could
actually profit from weighting schemes that take within-cell heterogeneity into account, occur
less frequent. In addition, cells and administrative (thus often statistical) areas are intimately
linked via population clusters as both tend to be centered around them.
However, this study just provided initial evidence to inform future mapping choices and
could be extended in multiple ways: First, both in the simulation and the application direc-
tional antennas are combined to omnidirectional antennas. While this is motivated by the typ-
ical data availability in real-world applications, it is of course a strong simplification of the
actual network topology. As the lower bound of spatial heterogeneity captured is given by the
number of unique areas resulting from intersecting coverage areas and statistical areas, studies
Table 7. Correlation with true unemployment rate and sample size in Senegal.
Mapping ρ n ρin nin ρout nout ρooc noocPoint 0.535 431 0.765 192 0.320 210 0.355 29
Voronoi 0.542 431 0.778 196 0.313 235 - 0
Aug. Voronoi (GUF) 0.519 431 0.780 195 0.280 233 0.586 3
HATA (GUF, BSA) 0.511 431 0.770 194 0.269 232 0.670 5
HATA (GUF, IDW) 0.527 431 0.781 196 0.308 234 - 1
https://doi.org/10.1371/journal.pone.0241981.t007
Table 8. Area-level correlation of estimated and true unemployment rate & sample size.
Mapping ρ n ρRural nRural ρUrban nUrbanPoint 0.535 431 0.507 385 0.527 46
Voronoi 0.542 431 0.519 385 0.469 46
Aug. Voronoi 0.519 431 0.495 385 0.411 46
Simple HATA (BSA) 0.511 431 0.487 385 0.374 46
Simple HATA (IDW) 0.527 431 0.510 385 0.369 46
https://doi.org/10.1371/journal.pone.0241981.t008
PLOS ONE Mapping mobile network data using satellite imagery and radio propagation modelling
PLOS ONE | https://doi.org/10.1371/journal.pone.0241981 November 9, 2020 23 / 28
such as [4] have shown that moving from an BTS-oriented to a cell-oriented analysis could
greatly affect analysis, especially via potential increases in sample size. However, it needs fur-
ther investigation how refined mapping schemes can add further value, particularly in the
presence of measurement uncertainty, to supervised learning setups in cell-level analysis. Sec-
ond, the study used comparatively simple empirical propagation models based on real-world
measurements largely ignoring actual environments. More advanced propagation models
exist, however, they require significantly more computing resources that could limit their
applicability as they take the physical surrounding via digital surface models into account.
Nevertheless, investigating this constitutes an interesting path for further research.
Supporting information
S1 Appendix. Results and instructions. Results from the cross-checks of the application and
instructions for replicating the findings of this study.
(PDF)
S1 File. Simulation. Code for replicating the simulation study.
(ZIP)
Fig 10. True vs. estimated unemployment rate by commune status for a single simulation run.
https://doi.org/10.1371/journal.pone.0241981.g010
PLOS ONE Mapping mobile network data using satellite imagery and radio propagation modelling
PLOS ONE | https://doi.org/10.1371/journal.pone.0241981 November 9, 2020 24 / 28
S2 File. Application. Code and data for replicating the application study. See S1 Appendix for
further details.
(ZIP)
Acknowledgments
The author would like to thank Damien Jacques, Emmanuel Letouze, Edward Oughton, Soren
Pannier, Neeti Pokhriyal and Timo Schmid for excellent comments and helpful discussions.
Author Contributions
Conceptualization: Till Koebe.
Data curation: Till Koebe.
Formal analysis: Till Koebe.
Funding acquisition: Till Koebe.
Investigation: Till Koebe.
Methodology: Till Koebe.
Project administration: Till Koebe.
Resources: Till Koebe.
Software: Till Koebe.
Supervision: Till Koebe.
Validation: Till Koebe.
Visualization: Till Koebe.
Writing – original draft: Till Koebe.
Writing – review & editing: Till Koebe.
References1. Schmid T, Bruckschen F, Salvati N, Zbiranski T. Constructing sociodemographic indicators for national
statistical institutes by using mobile phone data: estimating literacy rates in Senegal. Journal of the
Royal Statistical Society Series A: Statistics in Society. 2017; 180(4):1163–1190. https://doi.org/10.
1111/rssa.12305
2. Pokhriyal N, Jacques DC. Combining disparate data sources for improved poverty prediction and map-
ping. Proceedings of the National Academy of Sciences of the United States of America. 2017; 114(46):
E9783–E9792. https://doi.org/10.1073/pnas.1700319114 PMID: 29087949
3. Blumenstock J, Cadamuro G, On R. Predicting poverty and wealth from mobile phone metadata. Sci-
ence. 2015; 350:1073–1076. https://doi.org/10.1126/science.aac4420 PMID: 26612950
4. Ricciato F, Widhalm P, Pantisano F, Craglia M. Beyond the’single-operator, CDR-only’ paradigm: An
interoperable framework for mobile phone network data analyses and population density estimation.
Pervasive and Mobile Computing. 2017; 35:65–82. https://doi.org/10.1016/j.pmcj.2016.04.009
5. The Economist Intelligence Unit. The Inclusive Internet Index 2019; 2019. Available from: https://
theinclusiveinternet.eiu.com/.
6. Phillips C, Sicker D, Grunwald D. A survey of wireless path loss prediction and coverage mapping meth-
ods. IEEE Communications Surveys and Tutorials. 2013; 15(1):255–270. https://doi.org/10.1109/
SURV.2012.022412.00172
7. de Montjoye YA, Smoreda Z, Trinquart R, Ziemlicki C, Blondel VD. D4D-Senegal: The Second Mobile
Phone Data for Development Challenge. arXiv preprint arXiv:14074885. 2014;.
8. De Montjoye YA, Rocher L, Pentland AS. Bandicoot: A python toolbox for mobile phone metadata. Jour-
nal of Machine Learning Research. 2016; 17:1–5.
PLOS ONE Mapping mobile network data using satellite imagery and radio propagation modelling
PLOS ONE | https://doi.org/10.1371/journal.pone.0241981 November 9, 2020 25 / 28
9. Esch T, Heldens W, Hirner A, Keil M, Marconcini M, Roth A, et al. Breaking new ground in mapping
human settlements from space—The Global Urban Footprint. ISPRS Journal of Photogrammetry and
Remote Sensing. 2017; 134:30–42. https://doi.org/10.1016/j.isprsjprs.2017.10.012
10. WorldPop. (www.worldpop.org—School of Geography and Environmental Science, University of South-
ampton; Department of Geography and Geosciences, University of Louisville; Departement de Geogra-
phie, Universite de Namur) and Center for International Earth Science Information Network (CIESIN),
Columbia University; 2018. Global High Resolution Population Denominators Project—Funded by The
Bill and Melinda Gates Foundation (OPP1134076). https://dx.doi.org/10.5258/SOTON/WP00649
11. Department of Economic and Social Affairs UN. Handbook on geospatial infrastructure in support of
census activities. St/esa/sta ed. New York, USA: United Nations Publication; 2009.
12. Stevens FR, Gaughan AE, Linard C, Tatem AJ. Disaggregating census data for population mapping
using Random forests with remotely-sensed and ancillary data. PLoS ONE. 2015; 10(2):e0107042.
https://doi.org/10.1371/journal.pone.0107042 PMID: 25689585
13. Freire S, MacManus K, Pesaresi M, Doxsey-Whitfield E, Mills J. Development of new open and free
multi-temporal global population grids at 250 m resolution. AGILE. 2016; p. 6.
14. Henderson JV, Storeygard A, Weil DN. Measuring economic growth from outer space; 2012. Available
from: http://pubs.aeaweb.org/doi/10.1257/aer.102.2.994.
15. Chen X, Nordhaus WD. Using luminosity data as a proxy for economic statistics. Proceedings of the
National Academy of Sciences of the United States of America. 2011; 108(21):8589–8594. https://doi.
org/10.1073/pnas.1017031108 PMID: 21576474
16. Pinkovskiy M, Sala-i Martin X. Lights, Camera. . . Income! Illuminating the National Accounts-Household
Surveys Debate. The Quarterly Journal of Economics. 2016; 131(2):579–631. https://doi.org/10.1093/
qje/qjw003
17. Leyk S, Gaughan AE, Adamo SB, de Sherbinin A, Balk D, Freire S, et al. Allocating people to pixels: A
review of large-scale gridded population data products and their fitness for use. Earth System Science
Data Discussions. 2019; 11(3):1–30. https://doi.org/10.5194/essd-2019-82
18. Bonafilia D, Gill J, Kirsanov D, Sundram J. Mapping for humanitarian aid and development with weakly-
and semi-supervised learning. Facebook; 2019. Available from: https://bit.ly/2PxK5dx.
19. Harvey JT. Estimating census district populations from satellite imagery: Some approaches and limita-
tions. International Journal of Remote Sensing. 2002; 23(10):2071–2095. https://doi.org/10.1080/
01431160110075901
20. Steinnocher K, De Bono A, Chatenoux B, Tiede D, Wendt L. Estimating urban population patterns from
stereo-satellite imagery. European Journal of Remote Sensing. 2019; 52(sup2):12–25. https://doi.org/
10.1080/22797254.2019.1604081
21. Jean N, Burke M, Xie M, Davis WM, Lobell DB, Ermon S. Combining satellite imagery and machine
learning to predict poverty. Science. 2016; 353(6301):790–794. https://doi.org/10.1126/science.
aaf7894 PMID: 27540167
22. Weidmann NB, Schutte S. Using night light emissions for the prediction of local wealth. Journal of
Peace Research. 2017; 54(2):125–140. https://doi.org/10.1177/0022343316630359
23. Oughton E. Quantified Global Broadband Strategies for Connecting Unconnected Communities. SSRN
Electronic Journal. 2019;. https://doi.org/10.2139/ssrn.3427492
24. Blondel VD, Decuyper A, Krings G. A survey of results on mobile phone datasets analysis; 2015. Avail-
able from: http://www.epjdatascience.com/content/4/1/10.
25. Deville P, Linard C, Martin S, Gilbert M, Stevens FR, Gaughan AE, et al. Dynamic population mapping
using mobile phone data. Proceedings of the National Academy of Sciences. 2014; 111 (45):15888–
15893. https://doi.org/10.1073/pnas.1408439111 PMID: 25349388
26. Khodabandelou G, Gauthier V, Fiore M, El Yacoubi AM. Estimation of Static and Dynamic Urban Popu-
lations with Mobile Network Metadata. IEEE Transactions on Mobile Computing. 2018;. https://doi.org/
10.1109/TMC.2018.2871156
27. Botta F, Moat HS, Preis T. Quantifying crowd size with mobile phone and Twitter data. Royal Society
Open Science. 2015; 2(5):150162. https://doi.org/10.1098/rsos.150162 PMID: 26064667
28. Douglass RW, Meyer DA, Ram M, Rideout D, Song D. High resolution population estimates from tele-
communications data. EPJ Data Science. 2014; 4(1):1–13. https://doi.org/10.1140/epjds/s13688-015-
0040-6
29. Lu X, Bengtsson L, Holme P. Predictability of population displacement after the 2010 Haiti earthquake.
Proceedings of the National Academy of Sciences of the United States of America. 2012; 109
(29):11576–11581. https://doi.org/10.1073/pnas.1203882109 PMID: 22711804
30. Gundogdu D, Incel OD, Salah AA, Lepri B. Countrywide arrhythmia: emergency event detection using
mobile phone data. EPJ Data Science. 2016; 5(1):25. https://doi.org/10.1140/epjds/s13688-016-0086-0
PLOS ONE Mapping mobile network data using satellite imagery and radio propagation modelling
PLOS ONE | https://doi.org/10.1371/journal.pone.0241981 November 9, 2020 26 / 28
31. Schneider CM, Belik V, Couronne T, Smoreda Z, Gonzalez MC. Unravelling daily human mobility
motifs. Journal of the Royal Society Interface. 2013; 10(84). https://doi.org/10.1098/rsif.2013.0246
PMID: 23658117
32. Wesolowski A, Eagle N, Noor AM, Snow RW, Buckee CO. The impact of biases in mobile phone owner-
ship on estimates of human mobility. Journal of the Royal Society Interface. 2013; 10(81):20120986.
https://doi.org/10.1098/rsif.2012.0986
33. Matamalas JT, De Domenico M, Arenas A. Assessing reliable human mobility patterns from higher
order memory in mobile communications. Journal of the Royal Society Interface. 2016; 13
(121):20160203. https://doi.org/10.1098/rsif.2016.0203 PMID: 27581479
34. Iovan C, Olteanu-Raimond AM, Couronne T, Smoreda Z. Moving and calling: Mobile phone data quality
measurements and spatiotemporal uncertainty in human mobility studies. In: Lecture Notes in Geoinfor-
mation and Cartography. vol. 2013-Janua. Springer, Cham; 2013. p. 247–265. Available from: http://
link.springer.com/10.1007/978-3-319-00615-4_14.
35. Janzen M, Vanhoof M, Smoreda Z, Axhausen KW. Closer to the total? Long-distance travel of French
mobile phone users. Travel Behaviour and Society. 2018; 11:31–42. https://doi.org/10.1016/j.tbs.2017.
12.001
36. Taylor L. No place to hide? The ethics and analytics of tracking mobility using mobile phone data. Envi-
ronment and Planning D: Society and Space. 2016; 34(2):319–336. https://doi.org/10.1177/
0263775815608851
37. Wesolowski A, Eagle N, Tatem AJ, Smith DL, Noor AM, Snow RW, et al. Quantifying the impact of
human mobility on malaria. Science. 2012; 338(6104):267–270. https://doi.org/10.1126/science.
1223467 PMID: 23066082
38. Rubrichi S, Smoreda Z, Musolesi M. A comparison of spatial-based targeted disease mitigation strate-
gies using mobile phone data. EPJ Data Science. 2018; 7(1):17. https://doi.org/10.1140/epjds/s13688-
018-0145-9
39. Tizzoni M, Bajardi P, Decuyper A, Kon Kam King G, Schneider CM, Blondel V, et al. On the Use of
Human Mobility Proxies for Modeling Epidemics. PLoS Computational Biology. 2014; 10(7):e1003716.
https://doi.org/10.1371/journal.pcbi.1003716 PMID: 25010676
40. Le Menach A, Tatem AJ, Cohen JM, Hay SI, Randell H, Patil AP, et al. Travel risk, malaria importation
and malaria transmission in Zanzibar. Scientific Reports. 2011; 1(1):93. https://doi.org/10.1038/
srep00093 PMID: 22355611
41. Frıas-Martınez E, Williamson G, Frıas-Martınez V. An agent-based model of epidemic spread using
human mobility and social network information. In: Proceedings—2011 IEEE International Conference
on Privacy, Security, Risk and Trust and IEEE International Conference on Social Computing, PAS-
SAT/SocialCom 2011. IEEE; 2011. p. 57–64. Available from: http://ieeexplore.ieee.org/document/
6113095/.
42. Lima A, Domenico MD, Pejovic V, Musolesi M. Exploiting Cellular Data for Disease Containment and
Information Campaigns Strategies in Country-Wide Epidemics. CoRR. 2013;abs/1306.4.
43. Park PS, Blumenstock JE, Macy MW. The strength of long-range ties in population-scale social net-
works. Science. 2018; 362(6421):1410–1413. https://doi.org/10.1126/science.aau9735
44. Bakker MA, Piracha DA, Lu PJ, Bejgo K, Bahrami M, Leng Y, et al. Measuring Fine-Grained Multidimen-
sional Integration Using Mobile Phone Metadata: The Case of Syrian Refugees in Turkey. In: Guide to
Mobile Data Analytics in Refugee Scenarios. Cham: Springer International Publishing; 2019. p. 123–
140. Available from: http://link.springer.com/10.1007/978-3-030-12554-7_7
45. Sundsøy P. Can mobile usage predict illiteracy in a developing country? arXiv preprint
arXiv:160701337. 2016;.
46. Blumenstock J, Callen M, Ghani T. Why do defaults affect behavior? Experimental evidence from
Afghanistan. American Economic Review. 2018; 108(10):2868–2901. https://doi.org/10.1257/aer.
20171676
47. Bruckschen F, Koebe T, Ludolph M, Marino MF, Schmid T. Refugees in Undeclared Employment—A
Case Study in Turkey. In: Guide to Mobile Data Analytics in Refugee Scenarios. Cham: Springer Inter-
national Publishing; 2019. p. 329–346. Available from: http://link.springer.com/10.1007/978-3-030-
12554-7_17
48. Tennekes M. mobloc: Mobile phone location algorithms and tools; 2018. Available from: https://github.
com/MobilePhoneESSnetBigData/mobloc_v0.1.
49. OECD. Household definitions in other statistical standards. In: OECD Guidelines for Micro Statistics on
Household Wealth. OECD Publishing; 2013. p. 275–277. Available from: https://www.oecd-ilibrary.org/
docserver/9789264194878-18-en.pdf?expires=1570525698&id=id&accname=guest&checksum=
FE901313FB9732B831D7F32703E8569C.
PLOS ONE Mapping mobile network data using satellite imagery and radio propagation modelling
PLOS ONE | https://doi.org/10.1371/journal.pone.0241981 November 9, 2020 27 / 28

50. Vanhoof M, Lee C, Smoreda Z. Performance and sensitivities of home detection from mobile phone
data. arXiv preprint arXiv:180909911. 2018;.
51. Oughton EJ, Frias Z, van der Gaast S, van der Berg R. Assessing the capacity, coverage and cost of
5G infrastructure strategies: Analysis of the Netherlands. Telematics and Informatics. 2019; 37:50–69.
https://doi.org/10.1016/j.tele.2019.01.003
52. Green MP, Wang SS. Signal propagation model used to predict location accuracy of GSM mobile
phones for emergency applications. In: Proceedings—RAWCON 2002: 2002 IEEE Radio and Wireless
Conference. Institute of Electrical and Electronics Engineers Inc.; 2002. p. 119–122.
53. Hata M. Empirical Formula for Propagation Loss in Land Mobile Radio Services. IEEE Transactions on
Vehicular Technology. 1980; 29(3):317–325. https://doi.org/10.1109/T-VT.1980.23859
54. Damasso E L M Correia. Digital Mobile Radio Towards Future Generation. Luxembourg: European
Commission; 1999. 11. Available from: https://publications.europa.eu/en/publication-detail/-/
publication/f2f42003-4028-4496-af95-beaa38fd475f/language-en.
55. Okumura Y, Ohmori E, Kawano T, Fukuda K. Field Strength and Its Variability in UHF and VHF Land-
Mobile Radio Service. Review of the Electrical Communication Laboratory, September-October, 1968.
1968; 16:825–873.
56. Sharma RK Singh PK. Comparative Analysis of Propagation Path loss Models with Field Measured
Data. International Journal of Engineering Science and Technology. 2010; 2(6):2008–2013.
57. Abhayawardhana VS, Wassellt IJ, Crosby D, Sellars MP, Brown MG. Comparison of empirical propaga-
tion path loss models for fixed wireless access systems. In: IEEE Vehicular Technology Conference.
vol. 61; 2005. p. 73–77.
58. Phillips C, Sicker D, Grunwald D. Bounding the error of path loss models. In: 2011 IEEE International
Symposium on Dynamic Spectrum Access Networks, DySPAN 2011; 2011. p. 71–82.
59. Sonatel. Coverage Map Sonatel 2019; 2019. Available from: https://bit.ly/2uJplYk.
PLOS ONE Mapping mobile network data using satellite imagery and radio propagation modelling
PLOS ONE | https://doi.org/10.1371/journal.pone.0241981 November 9, 2020 28 / 28