Embed Size (px)
Citation preview
www.oecd.org/canadaOCDE Paris
2, rue André Pascal, 75775 Paris Cedex 16Tel.: +33 1 45 24 82 00
Better Policies Series
PROMOTING GREEN AND INCLUSIVE
GROWTH IN CANADA
June 2016
This document is published on the responsibility of the Secretary-General of the OECD. The opinions expressed and arguments employed herein do not necessarily reflect the official views of OECD member countries.
***
This document and any map included herein are without prejudice to the status of or sovereignty over any territory, to the delimitation of international frontiers and boundaries and to the name of any territory, city or area.
The statistical data for Israel are supplied by and under the responsibility of the relevant Israeli authorities. The use of such data by the OECD is without prejudice to the status of the Golan Heights, East Jerusalem and Israeli settlements in the West Bank under the terms of international law.
***
This document is part of the “Better Policies Series”. Under the guidance of Gabriela Ramos and Juan Yermo, Isabell Koske coordinated the publication, with the help of Ewa Klimowicz and Victor Duggan. Contributors: Jonathan Barr, Andrew Bell, Hervé Boulhol, David Bradbury, Bert Brys, David Carey, Sean Ennis, Michael Forster, Massimo Geloso Grosso, Peter Jarrett, Gaetan Lafortune, Horacio Levy, Thomas Liebig, Isabelle Luong, Corinne Luu, Rahul Malhotra, Marco Marchese, Andrew McQueen, Catherine Moreddu, Ana Novik, Paul O’Brien, Ryan Parmenter, Dirk Pilat, Jonathan Potter, Mikaela Rambali, Angelica Salvi Del Pero, Paul Swaim, Frank Van Tongeren, Elena Tosetto. Isabelle Renaud provided production and administrative support.
Photo credits: © Shutterstock.com
Corrigenda to OECD publications may be found on line at: www.oecd.org/publishing/corrigenda.© OECD 2016
You can copy, download or print OECD content for your own use, and you can include excerpts from OECD publications, databases and multimedia products in your own documents, presentations, blogs, websites and teaching materials, provided that suitable acknowledgment of the source and copyright owner is given. All requests for public or commercial use and translation rights should be submitted to [email protected]. Requests for permission to photocopy portions of this material for public or commercial use shall be addressed directly to the Copyright Clearance Center (CCC) at [email protected] or the Centre français d’exploitation du droit de copie (CFC) at [email protected].
ORGANISATION FOR ECONOMIC CO-OPERATION AND DEVELOPMENT
The OECD is a unique forum where governments work together to address the economic, social and environmental challenges of globalisation. The OECD is also at the forefront of efforts to understand and to help governments respond to new developments and concerns, such as corporate governance, the information economy and the challenges of an ageing population. The Organisation provides a setting where governments can compare policy experiences, seek answers to common problems, identify good practice and work to co-ordinate domestic and international policies.
The OECD member countries are: Australia, Austria, Belgium, Canada, Chile, the Czech Republic, Denmark, Estonia, Finland, France, Germany, Greece, Hungary, Iceland, Ireland, Israel, Italy, Japan, Korea, Luxembourg, Mexico, the Netherlands, New Zealand, Norway, Poland, Portugal, the Slovak Republic, Slovenia, Spain, Sweden, Switzerland, Turkey, the United Kingdom and the United States. The European Union takes part in the work of the OECD.
OECD Publishing disseminates widely the results of the Organisation’s statistics gathering and research on economic, social and environmental issues, as well as the conventions, guidelines and standards agreed by its members.
OECD “Better Policies” Series
The Organisation for Economic Co-operation and Development (OECD) aims to promote better policies for better lives by providing a forum in which governments gather to share experiences and seek solutions to common problems. We work with our 34 members, key partners and over 100 countries to better understand what drives economic, social and environmental change in order to foster the well-being of people around the world. The OECD Better Policies Series provides an overview of the key challenges faced by individual countries and our main policy recommendations to address them. Drawing on the OECD’s expertise in comparing country experiences and identifying best practices, the Better Policies Series tailor the OECD’s policy advice to the specific and timely priorities of member and partner countries, focusing on how governments can make reform happen.

Foreword Canada’s economy weathered the turmoil of the global financial crisis better than most other OECD countries, and Canadians enjoy a high quality of life. Household disposable income is above the OECD average and continues to increase. The country also ranks among the top-performing OECD countries on many dimensions of well-being.
But there are still areas in which Canada performs less well. Productivity gaps with the best-performing OECD countries are sizeable. Regional disparities are high, and the level of income inequality is close to the OECD average (which has been increasing), as is the level of poverty. Canada can clearly do better. In particular, there is room to reduce disparities in well-being across provinces and territories and to improve opportunities for some population groups to succeed in life, most notably Indigenous peoples. There is also room to further enhance the skills of the Canadian workforce. Some groups, mostly from socially disadvantaged backgrounds, lack the skills required in modern economies and societies.
Canada needs to step up its efforts to fight climate change. Canadian greenhouse gas emissions are among the highest in the OECD on a per capita basis. Without a change in current policies, the country will not meet the target of reducing 2005 emissions by 30% by 2030. This is crucial at the current juncture, when all governments around the world need to agree on a common strategy to limit global warming to below 2 degrees.
Moreover, the success story of the recent past was at least in part a result of the natural resources boom, which has now come to an end. To maintain economic momentum, reform efforts need to be stepped up. Catching up with the best-performing OECD countries in terms of productivity is crucial in this regard. Investments in infrastructure to avoid congestion and facilitate trade through better gateway links can also help, provided these investments are focused on high-return projects.
The new government of Prime Minister Justin Trudeau is committed to addressing these challenges and improving the well-being of Canadian citizens through stronger, fairer and greener growth. Special emphasis is being given to strengthening the middle class and providing all those who work hard the opportunity to join it. While income data point to a rather small decline in the middle class over time, less than 50% of Canadians perceive themselves as belonging to the middle class, down from almost 70% in the early 2000s, highlighting the importance of this endeavour.
Drawing on the experience and expertise of the OECD, this report was prepared to help the new government of Canada with its ambitious reform agenda. It suggests how Canada can improve productivity by adjusting its regulatory framework, its infrastructure and its competition and innovation policies. It discusses how Canada can reduce unemployment and better assist those who have lost their jobs due to the end of the natural resources boom. It also addresses the need for more inclusive growth, by further enhancing the skills level of the Canadian workforce and making sure that all Canadians, including Indigenous peoples, have the skills they need to succeed in life. The report also makes suggestions for strengthening the redistributive effects of Canada’s tax system without harming growth, and for making the pension and health care systems more inclusive. From a more global perspective, the document also suggests how Canada can reinforce the linkages between Canada’s development co-operation efforts and systemic undertakings such as climate change, the Sustainable Development Goals or world trade.
The OECD is looking forward to working with the new government of Canada to support its efforts to improve economic, social and environmental outcomes by designing, promoting and implementing better policies for better lives.
Angel Gurría
OECD Secretary-General
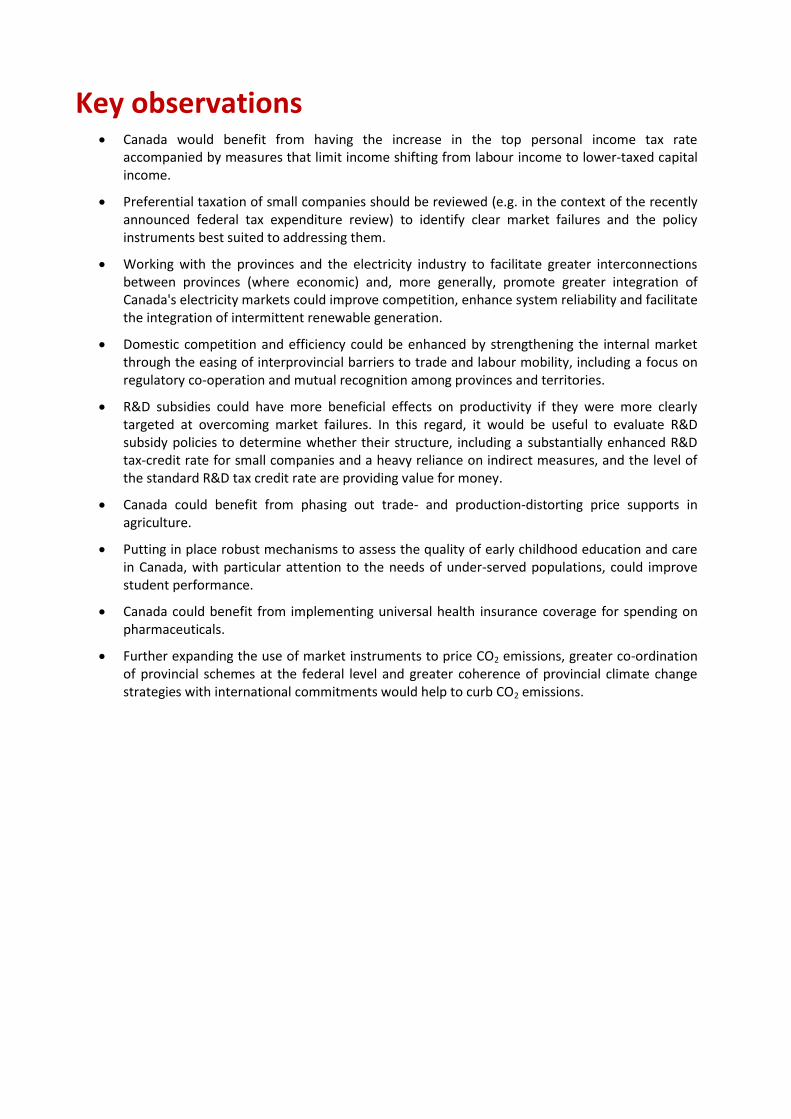
Key observations Canada would benefit from having the increase in the top personal income tax rate
accompanied by measures that limit income shifting from labour income to lower-taxed capital income.
Preferential taxation of small companies should be reviewed (e.g. in the context of the recently announced federal tax expenditure review) to identify clear market failures and the policy instruments best suited to addressing them.
Working with the provinces and the electricity industry to facilitate greater interconnections between provinces (where economic) and, more generally, promote greater integration of Canada's electricity markets could improve competition, enhance system reliability and facilitate the integration of intermittent renewable generation.
Domestic competition and efficiency could be enhanced by strengthening the internal market through the easing of interprovincial barriers to trade and labour mobility, including a focus on regulatory co-operation and mutual recognition among provinces and territories.
R&D subsidies could have more beneficial effects on productivity if they were more clearly targeted at overcoming market failures. In this regard, it would be useful to evaluate R&D subsidy policies to determine whether their structure, including a substantially enhanced R&D tax-credit rate for small companies and a heavy reliance on indirect measures, and the level of the standard R&D tax credit rate are providing value for money.
Canada could benefit from phasing out trade- and production-distorting price supports in agriculture.
Putting in place robust mechanisms to assess the quality of early childhood education and care in Canada, with particular attention to the needs of under-served populations, could improve student performance.
Canada could benefit from implementing universal health insurance coverage for spending on pharmaceuticals.
Further expanding the use of market instruments to price CO2 emissions, greater co-ordination of provincial schemes at the federal level and greater coherence of provincial climate change strategies with international commitments would help to curb CO2 emissions.

Table of contents Introduction ........................................................................................................................................ 1
Redesigning the tax and benefits system for more inclusive growth ................................................ 6
Enhancing productivity for inclusive growth ...................................................................................... 8
Enhancing Canada’s innovation performance ................................................................................. 12
Promoting sustainable productivity growth in agriculture .............................................................. 15
Raising the relevance and equity of Canada’s education and skills system ..................................... 17
Putting in place a stronger and more inclusive labour market ........................................................ 21
Enhancing the pension and health care systems ............................................................................. 25
Refocusing Canada’s development co-operation ............................................................................ 27
Addressing Climate change and other environmental challenges ................................................... 30
References ........................................................................................................................................ 34
PROMOTING GREEN AND INCLUSIVE GROWTH IN CANADA – 1
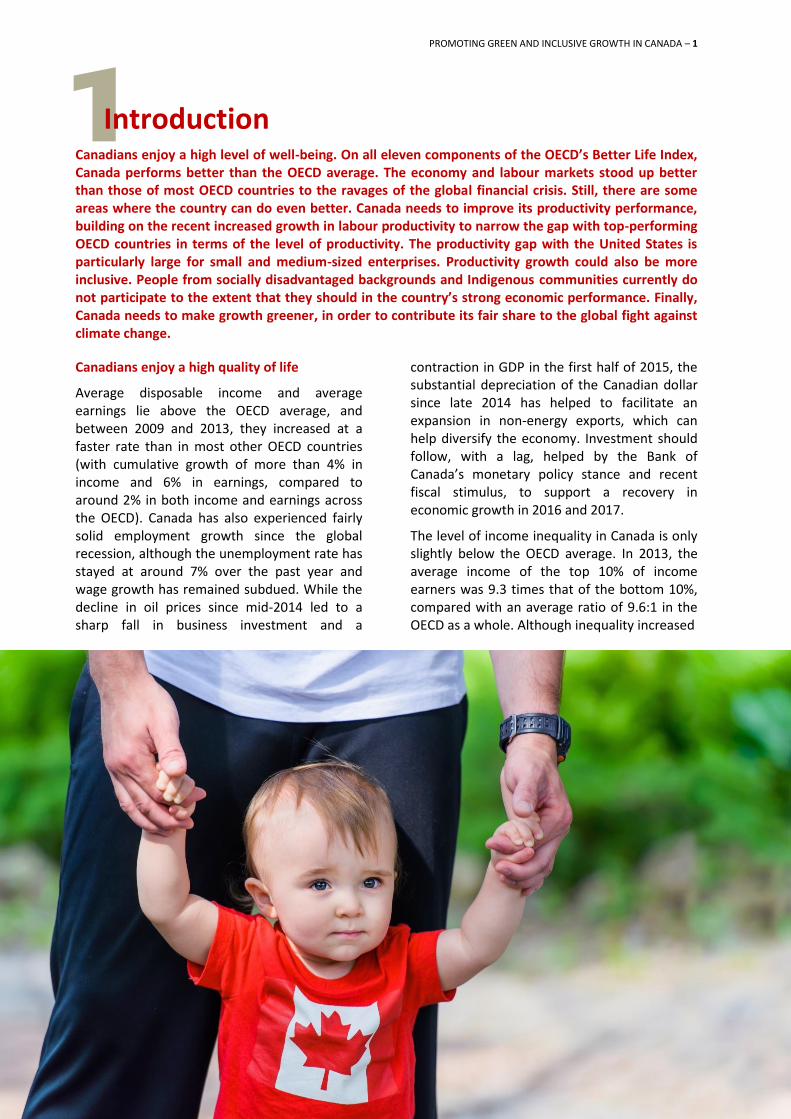
1 Introduction Canadians enjoy a high level of well-being. On all eleven components of the OECD’s Better Life Index, Canada performs better than the OECD average. The economy and labour markets stood up better than those of most OECD countries to the ravages of the global financial crisis. Still, there are some areas where the country can do even better. Canada needs to improve its productivity performance, building on the recent increased growth in labour productivity to narrow the gap with top-performing OECD countries in terms of the level of productivity. The productivity gap with the United States is particularly large for small and medium-sized enterprises. Productivity growth could also be more inclusive. People from socially disadvantaged backgrounds and Indigenous communities currently do not participate to the extent that they should in the country’s strong economic performance. Finally, Canada needs to make growth greener, in order to contribute its fair share to the global fight against climate change.
Canadians enjoy a high quality of life
Average disposable income and average earnings lie above the OECD average, and between 2009 and 2013, they increased at a faster rate than in most other OECD countries (with cumulative growth of more than 4% in income and 6% in earnings, compared to around 2% in both income and earnings across the OECD). Canada has also experienced fairly solid employment growth since the global recession, although the unemployment rate has stayed at around 7% over the past year and wage growth has remained subdued. While the decline in oil prices since mid-2014 led to a sharp fall in business investment and a
contraction in GDP in the first half of 2015, the substantial depreciation of the Canadian dollar since late 2014 has helped to facilitate an expansion in non-energy exports, which can help diversify the economy. Investment should follow, with a lag, helped by the Bank of Canada’s monetary policy stance and recent fiscal stimulus, to support a recovery in economic growth in 2016 and 2017.
The level of income inequality in Canada is only slightly below the OECD average. In 2013, the average income of the top 10% of income earners was 9.3 times that of the bottom 10%, compared with an average ratio of 9.6:1 in the OECD as a whole. Although inequality increased
2 – PROMOTING GREEN AND INCLUSIVE GROWTH IN CANADA
considerably in Canada in the 1990s, reflecting widening disparities in market wages, it has been stable since then, including during and after the global financial crisis. This stability in recent years (2007-11) reflects stagnating incomes at the top end of the income distribution, a slight increase in the middle, and stagnating incomes at the bottom. Canada’s poverty rate stood at 9.8% in 2007 and fell to 9.3% in 2011, close to the OECD average (9.5%). While Canada performs rather well in terms of the gender employment gap (6.1 percentage points, compared to the OECD average of 11.7 percentage points), Canada’s gender wage gap (19%) is above the OECD average (15.5%).
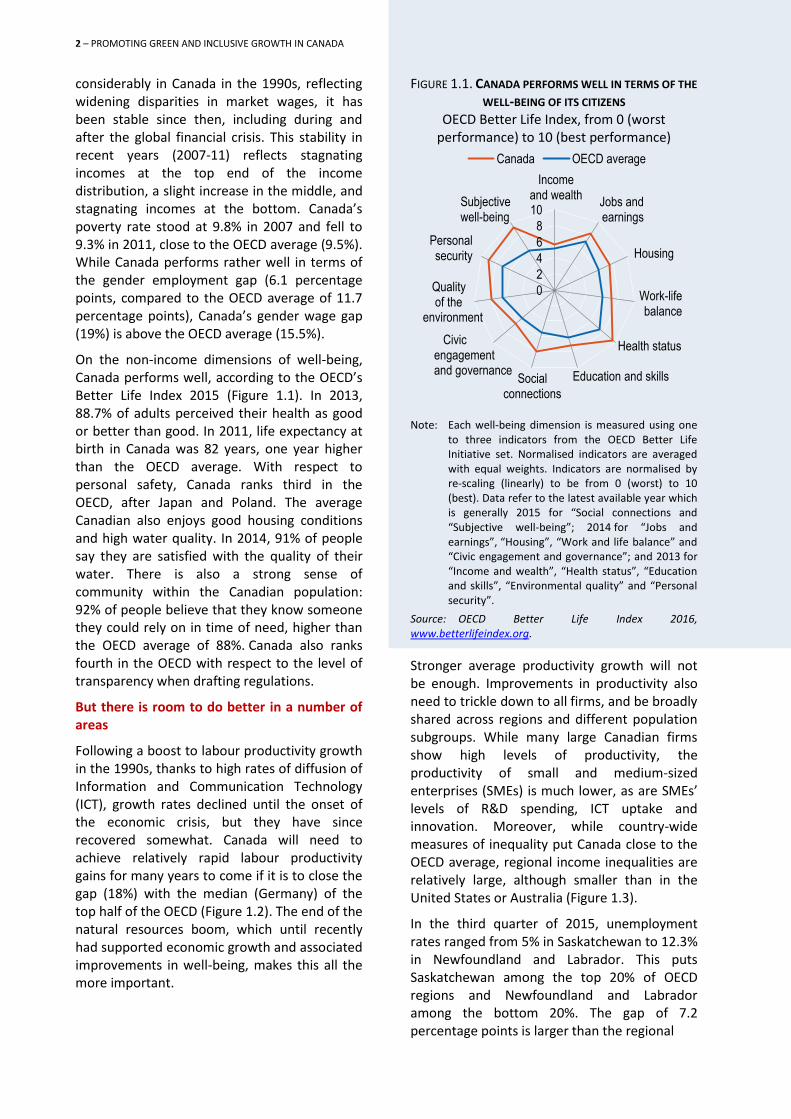
On the non-income dimensions of well-being, Canada performs well, according to the OECD’s Better Life Index 2015 (Figure 1.1). In 2013, 88.7% of adults perceived their health as good or better than good. In 2011, life expectancy at birth in Canada was 82 years, one year higher than the OECD average. With respect to personal safety, Canada ranks third in the OECD, after Japan and Poland. The average Canadian also enjoys good housing conditions and high water quality. In 2014, 91% of people say they are satisfied with the quality of their water. There is also a strong sense of community within the Canadian population: 92% of people believe that they know someone they could rely on in time of need, higher than the OECD average of 88%. Canada also ranks fourth in the OECD with respect to the level of transparency when drafting regulations.
But there is room to do better in a number of areas
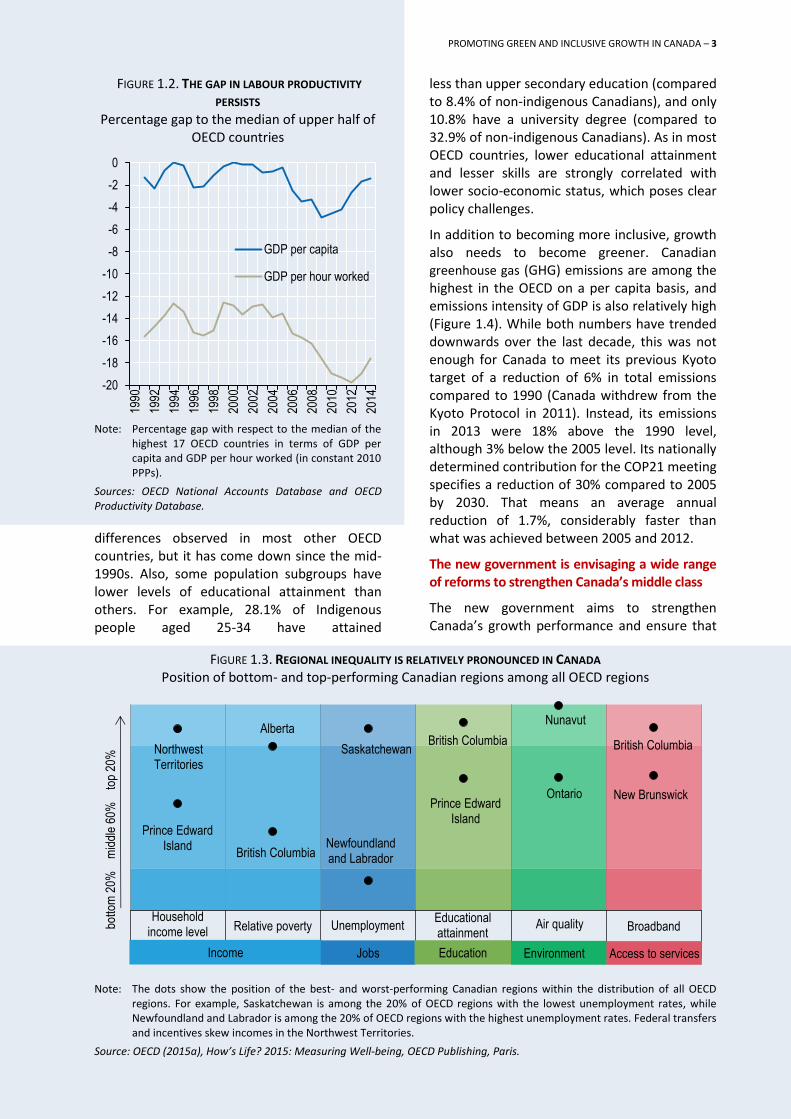
Following a boost to labour productivity growth in the 1990s, thanks to high rates of diffusion of Information and Communication Technology (ICT), growth rates declined until the onset of the economic crisis, but they have since recovered somewhat. Canada will need to achieve relatively rapid labour productivity gains for many years to come if it is to close the gap (18%) with the median (Germany) of the top half of the OECD (Figure 1.2). The end of the natural resources boom, which until recently had supported economic growth and associated improvements in well-being, makes this all the more important.
FIGURE 1.1. CANADA PERFORMS WELL IN TERMS OF THE
WELL-BEING OF ITS CITIZENS OECD Better Life Index, from 0 (worst
performance) to 10 (best performance)
Note: Each well-being dimension is measured using one
to three indicators from the OECD Better Life Initiative set. Normalised indicators are averaged with equal weights. Indicators are normalised by re-scaling (linearly) to be from 0 (worst) to 10 (best). Data refer to the latest available year which is generally 2015 for “Social connections and “Subjective well-being”; 2014 for “Jobs and earnings”, “Housing”, “Work and life balance” and “Civic engagement and governance”; and 2013 for “Income and wealth”, “Health status”, “Education and skills”, “Environmental quality” and “Personal security”.
Source: OECD Better Life Index 2016, www.betterlifeindex.org.
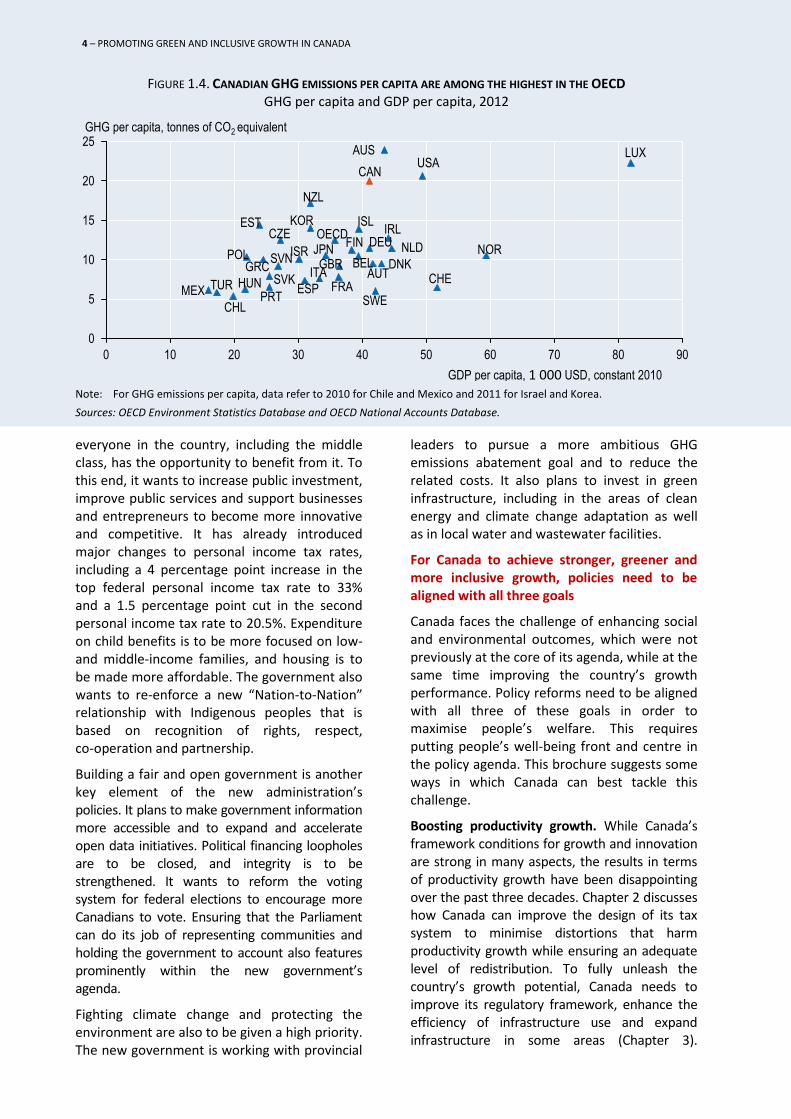
Stronger average productivity growth will not be enough. Improvements in productivity also need to trickle down to all firms, and be broadly shared across regions and different population subgroups. While many large Canadian firms show high levels of productivity, the productivity of small and medium-sized enterprises (SMEs) is much lower, as are SMEs’ levels of R&D spending, ICT uptake and innovation. Moreover, while country-wide measures of inequality put Canada close to the OECD average, regional income inequalities are relatively large, although smaller than in the United States or Australia (Figure 1.3).
In the third quarter of 2015, unemployment rates ranged from 5% in Saskatchewan to 12.3% in Newfoundland and Labrador. This puts Saskatchewan among the top 20% of OECD regions and Newfoundland and Labrador among the bottom 20%. The gap of 7.2 percentage points is larger than the regional
0
2
4
6
8
10
Canada OECD average
Income and wealth
Jobs and earnings
Work-life balance
Health status
Education and skills Social connections
Quality of the environment
Personal security
Subjective well-being
Housing
Civic engagement and governance
PROMOTING GREEN AND INCLUSIVE GROWTH IN CANADA – 3
FIGURE 1.2. THE GAP IN LABOUR PRODUCTIVITY
PERSISTS Percentage gap to the median of upper half of
OECD countries
Note: Percentage gap with respect to the median of the
highest 17 OECD countries in terms of GDP per capita and GDP per hour worked (in constant 2010 PPPs).
Sources: OECD National Accounts Database and OECD Productivity Database.
differences observed in most other OECD countries, but it has come down since the mid-1990s. Also, some population subgroups have lower levels of educational attainment than others. For example, 28.1% of Indigenous people aged 25-34 have attained
less than upper secondary education (compared to 8.4% of non-indigenous Canadians), and only 10.8% have a university degree (compared to 32.9% of non-indigenous Canadians). As in most OECD countries, lower educational attainment and lesser skills are strongly correlated with lower socio-economic status, which poses clear policy challenges.
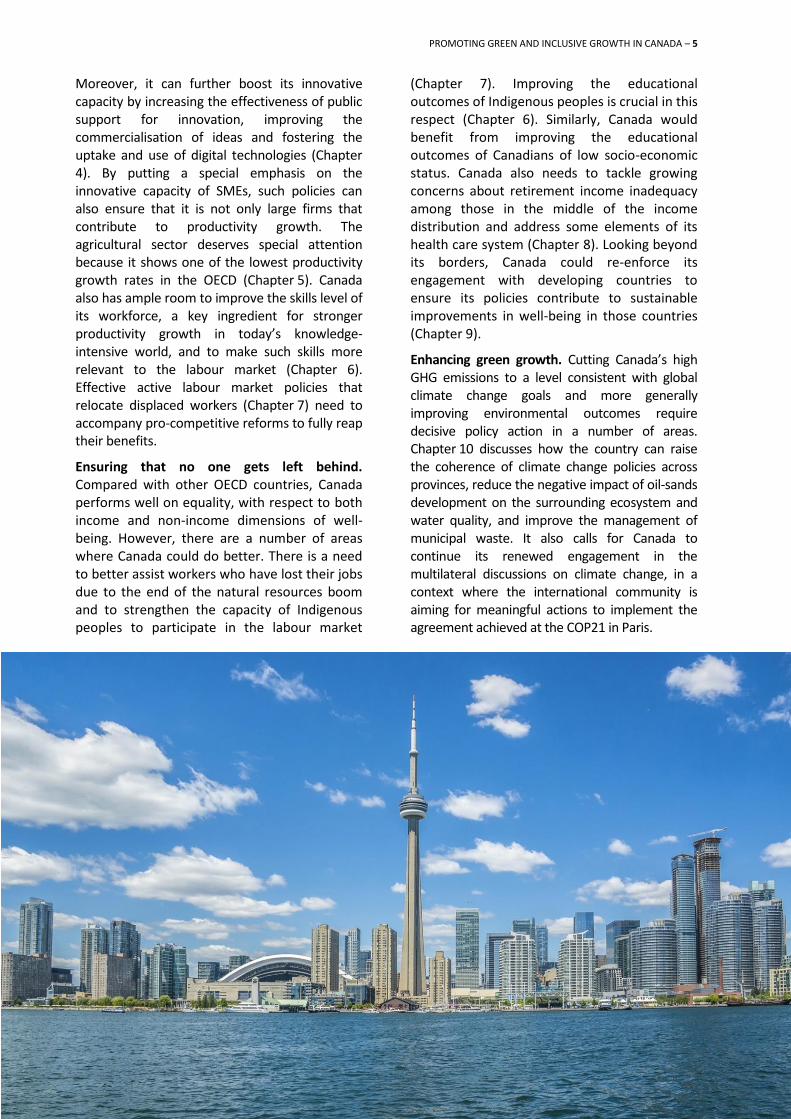
In addition to becoming more inclusive, growth also needs to become greener. Canadian greenhouse gas (GHG) emissions are among the highest in the OECD on a per capita basis, and emissions intensity of GDP is also relatively high (Figure 1.4). While both numbers have trended downwards over the last decade, this was not enough for Canada to meet its previous Kyoto target of a reduction of 6% in total emissions compared to 1990 (Canada withdrew from the Kyoto Protocol in 2011). Instead, its emissions in 2013 were 18% above the 1990 level, although 3% below the 2005 level. Its nationally determined contribution for the COP21 meeting specifies a reduction of 30% compared to 2005 by 2030. That means an average annual reduction of 1.7%, considerably faster than what was achieved between 2005 and 2012.
The new government is envisaging a wide range of reforms to strengthen Canada’s middle class
The new government aims to strengthen Canada’s growth performance and ensure that
FIGURE 1.3. REGIONAL INEQUALITY IS RELATIVELY PRONOUNCED IN CANADA Position of bottom- and top-performing Canadian regions among all OECD regions
Note: The dots show the position of the best- and worst-performing Canadian regions within the distribution of all OECD regions. For example, Saskatchewan is among the 20% of OECD regions with the lowest unemployment rates, while Newfoundland and Labrador is among the 20% of OECD regions with the highest unemployment rates. Federal transfers and incentives skew incomes in the Northwest Territories.
Source: OECD (2015a), How’s Life? 2015: Measuring Well-being, OECD Publishing, Paris.
-20
-18
-16
-14
-12
-10
-8
-6
-4
-2
0
1990
1992
1994
1996
1998
2000
2002
2004
2006
2008
2010
2012
2014
GDP per capita
GDP per hour worked
Northwest Territories
Alberta
Saskatchewan British Columbia
Nunavut
British Columbia
Prince Edward Island
British Columbia Newfoundland and Labrador
Prince Edward Island
Ontario New Brunswick
0
0.1
0.2
0.3
0.4
0.5
0.6
0.7
0.8
0.9
1
Broadband
Income Income Jobs Education Environment Access to
Relative poverty Household
income level
Income
Unemployment Educational attainment
Air quality
Jobs Education Environment Access to services
bot
tom
20%
m
iddl
e 60
%
top
20%
PROMOTING GREEN AND INCLUSIVE GROWTH IN CANADA
FIGURE 1.4. CANADIAN GHG EMISSIONS PER CAPITA ARE AMONG THE HIGHEST IN THE OECD GHG per capita and GDP per capita, 2012
Note: For GHG emissions per capita, data refer to 2010 for Chile and Mexico and 2011 for Israel and Korea.
Sources: OECD Environment Statistics Database and OECD National Accounts Database.
everyone in the country, including the middle class, has the opportunity to benefit from it. To this end, it wants to increase public investment, improve public services and support businesses and entrepreneurs to become more innovative and competitive. It has already introduced major changes to personal income tax rates, including a 4 percentage point increase in the top federal personal income tax rate to 33% and a 1.5 percentage point cut in the second personal income tax rate to 20.5%. Expenditure on child benefits is to be more focused on low- and middle-income families, and housing is to be made more affordable. The government also wants to re-enforce a new “Nation-to-Nation” relationship with Indigenous peoples that is based on recognition of rights, respect, co-operation and partnership.
Building a fair and open government is another key element of the new administration’s policies. It plans to make government information more accessible and to expand and accelerate open data initiatives. Political financing loopholes are to be closed, and integrity is to be strengthened. It wants to reform the voting system for federal elections to encourage more Canadians to vote. Ensuring that the Parliament can do its job of representing communities and holding the government to account also features prominently within the new government’s agenda.
Fighting climate change and protecting the environment are also to be given a high priority. The new government is working with provincial
leaders to pursue a more ambitious GHG emissions abatement goal and to reduce the related costs. It also plans to invest in green infrastructure, including in the areas of clean energy and climate change adaptation as well as in local water and wastewater facilities.
For Canada to achieve stronger, greener and more inclusive growth, policies need to be aligned with all three goals
Canada faces the challenge of enhancing social and environmental outcomes, which were not previously at the core of its agenda, while at the same time improving the country’s growth performance. Policy reforms need to be aligned with all three of these goals in order to maximise people’s welfare. This requires putting people’s well-being front and centre in the policy agenda. This brochure suggests some ways in which Canada can best tackle this challenge.
Boosting productivity growth. While Canada’s framework conditions for growth and innovation are strong in many aspects, the results in terms of productivity growth have been disappointing over the past three decades. Chapter 2 discusses how Canada can improve the design of its tax system to minimise distortions that harm productivity growth while ensuring an adequate level of redistribution. To fully unleash the country’s growth potential, Canada needs to improve its regulatory framework, enhance the efficiency of infrastructure use and expand infrastructure in some areas (Chapter 3).
AUS
AUT BEL
CAN
CHL
CZE
DNK
EST
FIN
FRA
DEU
GRC
HUN
ISL IRL
ISR
ITA
JPN
KOR
LUX
MEX
NLD
NZL
NOR POL
PRT
SVK
SVN
ESP SWE
CHE TUR
GBR
USA
OECD
0
5
10
15
20
25
0 10 20 30 40 50 60 70 80 90
GHG per capita, tonnes of CO2 equivalent
GDP per capita, 1 000 USD, constant 2010
4 – PROMOTING GREEN AND INCLUSIVE GROWTH IN CANADA
PROMOTING GREEN AND INCLUSIVE GROWTH IN CANADA – 5
Moreover, it can further boost its innovative capacity by increasing the effectiveness of public support for innovation, improving the commercialisation of ideas and fostering the uptake and use of digital technologies (Chapter 4). By putting a special emphasis on the innovative capacity of SMEs, such policies can also ensure that it is not only large firms that contribute to productivity growth. The agricultural sector deserves special attention because it shows one of the lowest productivity growth rates in the OECD (Chapter 5). Canada also has ample room to improve the skills level of its workforce, a key ingredient for stronger productivity growth in today’s knowledge-intensive world, and to make such skills more relevant to the labour market (Chapter 6). Effective active labour market policies that relocate displaced workers (Chapter 7) need to accompany pro-competitive reforms to fully reap their benefits.
Ensuring that no one gets left behind. Compared with other OECD countries, Canada performs well on equality, with respect to both income and non-income dimensions of well-being. However, there are a number of areas where Canada could do better. There is a need to better assist workers who have lost their jobs due to the end of the natural resources boom and to strengthen the capacity of Indigenous peoples to participate in the labour market
(Chapter 7). Improving the educational outcomes of Indigenous peoples is crucial in this respect (Chapter 6). Similarly, Canada would benefit from improving the educational outcomes of Canadians of low socio-economic status. Canada also needs to tackle growing concerns about retirement income inadequacy among those in the middle of the income distribution and address some elements of its health care system (Chapter 8). Looking beyond its borders, Canada could re-enforce its engagement with developing countries to ensure its policies contribute to sustainable improvements in well-being in those countries (Chapter 9).
Enhancing green growth. Cutting Canada’s high GHG emissions to a level consistent with global climate change goals and more generally improving environmental outcomes require decisive policy action in a number of areas. Chapter 10 discusses how the country can raise the coherence of climate change policies across provinces, reduce the negative impact of oil-sands development on the surrounding ecosystem and water quality, and improve the management of municipal waste. It also calls for Canada to continue its renewed engagement in the multilateral discussions on climate change, in a context where the international community is aiming for meaningful actions to implement the agreement achieved at the COP21 in Paris.
6 – PROMOTING GREEN AND INCLUSIVE GROWTH IN CANADA
2 Redesigning the tax and benefits system for more inclusive growth
Canada’s tax and benefits system reduces income inequality less than those of most other OECD countries. The new government is planning to implement a number of reforms to strengthen the redistributive effects of the tax system, with a particular focus on raising the incomes of the middle class. When designing these reforms, revenue and efficiency implications need to be carefully balanced, as any negative repercussions on economic performance would ultimately also harm the middle class.
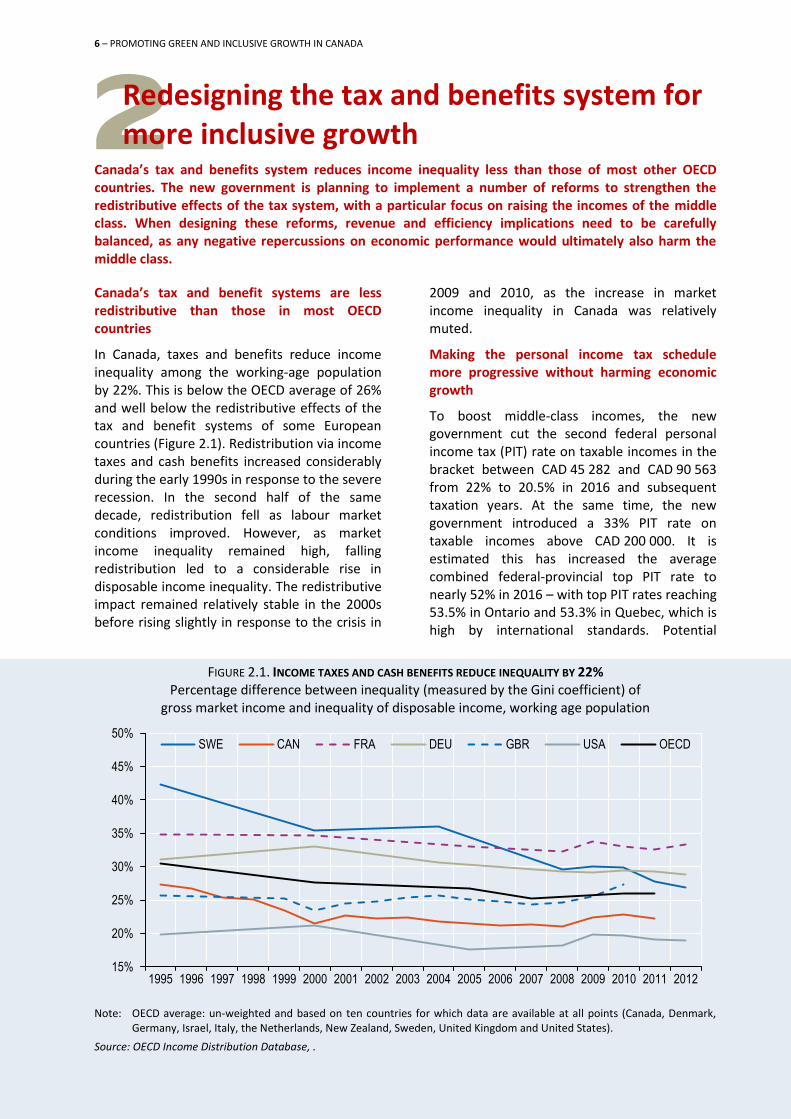
Canada’s tax and benefit systems are less redistributive than those in most OECD countries
In Canada, taxes and benefits reduce income inequality among the working-age population by 22%. This is below the OECD average of 26% and well below the redistributive effects of the tax and benefit systems of some European countries (Figure 2.1). Redistribution via income taxes and cash benefits increased considerably during the early 1990s in response to the severe recession. In the second half of the same decade, redistribution fell as labour market conditions improved. However, as market income inequality remained high, falling redistribution led to a considerable rise in disposable income inequality. The redistributive impact remained relatively stable in the 2000s before rising slightly in response to the crisis in
2009 and 2010, as the increase in market income inequality in Canada was relatively muted.
Making the personal income tax schedule more progressive without harming economic growth
To boost middle-class incomes, the new government cut the second federal personal income tax (PIT) rate on taxable incomes in the bracket between CAD 45 282 and CAD 90 563 from 22% to 20.5% in 2016 and subsequent taxation years. At the same time, the new government introduced a 33% PIT rate on taxable incomes above CAD 200 000. It is estimated this has increased the average combined federal-provincial top PIT rate to nearly 52% in 2016 – with top PIT rates reaching 53.5% in Ontario and 53.3% in Quebec, which is high by international standards. Potential
FIGURE 2.1. INCOME TAXES AND CASH BENEFITS REDUCE INEQUALITY BY 22% Percentage difference between inequality (measured by the Gini coefficient) of
gross market income and inequality of disposable income, working age population
Note: OECD average: un-weighted and based on ten countries for which data are available at all points (Canada, Denmark, Germany, Israel, Italy, the Netherlands, New Zealand, Sweden, United Kingdom and United States).
Source: OECD Income Distribution Database, .
15%
20%
25%
30%
35%
40%
45%
50%
1995 1996 1997 1998 1999 2000 2001 2002 2003 2004 2005 2006 2007 2008 2009 2010 2011 2012
SWE CAN FRA DEU GBR USA OECD
PROMOTING GREEN AND INCLUSIVE GROWTH IN CANADA – 7
harmful behavioural responses to such a top PIT rate increase include high-income individuals making greater use of tax planning (for example by shifting labour income into capital income) and the self-employed reducing their innovative and entrepreneurial activities. It might have been less costly to finance the cut in PIT rates on middle incomes by increasing taxes with lower efficency costs, such as broadening the standard Goods and Services Tax (GST) base and increasing the GST rate and increasing environmentally-related taxes (see Chapter 10). The government has also repealed income splitting for families with children, which had been introduced in 2014.
Reviewing tax expenditures
The new government also plans to review tax expenditures in order to reduce or eliminate poorly targeted and inefficient measures. As part of this process, one commitment is to set a cap on the amount of employee stock option benefits that can be claimed through the employee stock option deduction. Given that stock options are a useful compensation tool for start-up companies, the first CAD 100 000 of annual stock option gains would be unaffected by the new tax treatment. As part of the review, the tax treatment of different types of employee compensation, including stock options, cash and salary-deferral arrangements, should be considered, as well as the effectiveness of the remaining favourable tax treatment of employee stock options at the employee level.
One tax expenditure that deserves careful evaluation is the Small Business Deduction, which reduces the general corporate tax rate (26.7% on average including provincial taxes) to a reduced rate (14.7% on average in 2016) for up to CAD 500 000 of active income earned by Canadian Controlled Private Corporations. The aim of this arrangement is to leave small companies with more money to invest, effectively making it a financing programme. However, the economic literature on capital market failures does not establish a case for subsidising SMEs based on their size alone. There is more likely to be a financing gap for new and start-up firms, and this could be more
effectively addressed through targeted measures (Crawford and Freedman, 2010).
Implementing measures to create a level playing field
Canada has actively participated in the G20/OECD Base Erosion and Profit Shifting (BEPS) Project, whose outputs were approved by G20 leaders in Antalya in November 2015. Strong political support is needed in order to swiftly and consistently implement the BEPS measures, which will help governments eliminate double non-taxation and create a more level playing field. In addition, the recent global move towards the common reporting standard for Automatic Exchange of Financial Account Information in Tax Matters will improve tax compliance and make it harder for taxpayers to evade taxes using offshore accounts. It will also allow governments to re-evaluate the way they tax savings at the personal level, with the potential to make tax systems more equitable.
Key observations Canada would benefit from having the
increase in the top PIT rate accompanied by measures that limit income shifting from labour income to lower-taxed capital income.
Broadening the standard GST base and increasing environmentally-related taxes constitute an alternative means of financing tax cuts for middle-income households.
Preferential taxation of small companies should be reviewed (e.g. in the context of the recently announced federal tax expenditure review) to identify clear market failures and the policy instruments best suited to addressing them.
Canada is encouraged to swiftly implement the common reporting standard for the Automatic Exchange of Financial Account Information in Tax Matters and the measures agreed upon as part of the G20/OECD Base Erosion and Profit Shifting Project.
8 – PROMOTING GREEN AND INCLUSIVE GROWTH IN CANADA
3 Enhancing productivity for inclusive growth Unlike in many OECD countries, labour productivity growth in Canada has begun to recover from post-crisis lows. However, the gap with the OECD’s better performers in terms of GDP per hour worked remains large. Sustaining high productivity growth requires strengthening product market competition, improving the performance of small and medium-sized enterprises, boosting the use and efficiency of infrastructure and enhancing the skills of the workforce. Such policy initiatives facilitate the allocation of resources to more productive firms and the diffusion of new technologies.
Post-crisis gains in productivity growth are not sufficient to close the gap with top performers
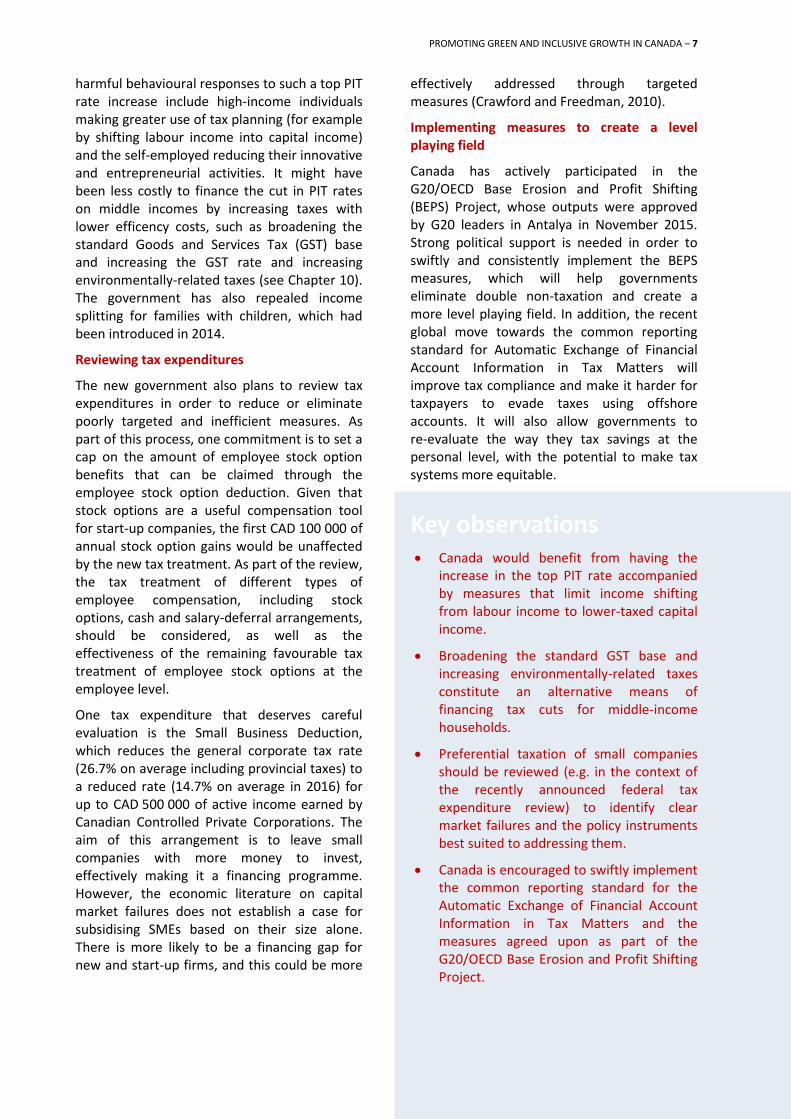
Labour productivity growth has declined in Canada since the late 1990s, when it was boosted by high rates of diffusion of ICT. Most of this decline is attributable to a slowdown in total factor productivity (TFP) growth (TFP reflects the efficiency with which resources are used). The trend in the contribution of capital deepening (i.e. the contribution of increases in the capital-to-labour ratio) has also remained quite stable, while Canada’s investment rate stood at a relatively high 23.5% in 2014. The productivity growth slowdown has been less marked in Canada than the OECD average, and the labour productivity growth rate, having picked up slightly since the crisis, is now higher than the OECD average. Nevertheless, Canada will need to maintain relatively rapid labour productivity gains for many years if it is to close the gap with the best-performing OECD countries. In 2014, for example, GDP per hour worked in Canada was 17.8% lower than in
Germany, the median of the upper half of OECD countries, and 23.7% lower than in the United States (Figure 3.1). In a welcome move, Canada has joined the OECD Productivity Network to foster dialogue and knowledge sharing around policies and institutional arrangements to support productivity improvements.
Reducing the SME productivity gap must be a priority
SME productivity (GDP per hour worked in companies with less than 500 employees) in Canada is only 47% of the productivity in larger firms, compared with 67% in the United States (Baldwin et al., 2014). This suggests that not all firms contribute equally to the country’s productivity performance and, in the same vein, do not participate equally in the potential proceeds. At the same time, SMEs account for 70% of hours worked in Canada, compared to only 56% in the United States. These two factors account for around two-thirds of Canada’s productivity gap with the United
FIGURE 3.1. CANADA RANKS 15 OUT OF 34 OECD COUNTRIES FOR GDP PER HOUR WORKED GDP per hour worked, 1 000 USD, constant 2010 PPPs, 2014
Source: OECD National Accounts Database.
0
10
20
30
40
50
60
70
80
90
ME
X
CH
L
PO
L
HU
N
ES
T
TU
R
PR
T
KO
R
CZ
E
GR
C
ISR
NZ
L
SV
K
SV
N
JPN
ISL
ITA
OE
CD
ES
P
GB
R
CA
N
FIN
AU
T
AU
S
SW
E
CH
E
DE
U
DN
K
FR
A
IRL
NLD
BE
L
US
A
NO
R
LUX

PROMOTING GREEN AND INCLUSIVE GROWTH IN CANADA – 9
States (Baldwin et al., 2014). Reducing the productivity gap between SMEs and large firms and increasing the proportion of SMEs that grow into large firms would help to raise average productivity levels in Canada.
Getting the regulatory and competition frameworks right
Canada has made a strong commitment to regulatory quality by adopting formal requirements for stakeholder engagement as well as ex ante and ex post evaluation in the development of regulations. Consequently, the country features among the best performers in regulatory policy according to the OECD’s 2015 Regulatory Policy Outlook (OECD 2015b). While regulatory quality is relatively high and overall restrictiveness (as measured by the OECD’s Product Market Regulation indicator) is around the OECD average, the regulatory burden is still relatively high in certain sectors, notably electricity, retail trade and professional services. Moreover, regulatory protection of incumbents is above the OECD average, posing a barrier to entry. Such regulation serves to lower productivity by weakening competitive pressures to innovate and to adopt technologies and organisational arrangements used by firms at the global productivity frontier
(Andrews et al., 2015). For electricity, further deregulation and the development of additional interconnections between provinces and with the United States (where economic) could improve competition, enhance system reliability and facilitate the integration of intermittent renewable generation.
More generally, network services in Canada, including transportation, telecommunications and broadcasting, are subject to higher trade and investment impediments than the OECD average, far from the best practice in many sectors (Figure 3.2). These onerous foreign direct investment (FDI) restrictions may in fact reduce access to capital, deter technology adoption and reduce competitive pressures and cost efficiency. Canada’s FDI barriers mainly take the form of foreign ownership restrictions in key sectors and the use of screening and approval mechanisms for foreign investors through the Investment Canada Act. While the gap with the OECD average has been narrowed for foreign ownership limits overall, restrictions remain high for some key network sectors. Moreover, the gap with the OECD average has widened in terms of the use of tests of economic needs or net benefits for project approval.
PROMOTING GREEN AND INCLUSIVE GROWTH IN CANADA – 9

10 – PROMOTING GREEN AND INCLUSIVE GROWTH IN CANADA
Many OECD countries have benefitted from having public advocacy powers, such as the power to require provision of relevant information in the context of market studies. Such powers can enhance transparency and openness in the policy-making process, enabling a more informed public discussion of particular industries or issues. They also provide governments at all levels with an understanding of how their current or proposed regulations may impact consumers, industry structure and, in the long term, economic growth. These powers are more effective when supplemented by a requirement that those government entities subject to recommendations by the competition authority provide a written response within a fixed time period, as is done in the United Kingdom. Providing Canada’s Competition Bureau with such powers could further strengthen the competition framework.
Strengthening the internal market, including by reducing interprovincial barriers to trade, can enhance domestic competition and efficiency. The provinces, through the Council of the Federation, are currently in the process of renewing the Agreement on Internal Trade (AIT), the main agreement to reduce interprovincial barriers to trade and labour mobility. Broadening the AIT’s coverage, including by moving towards a negative-list approach (everything is covered unless
explicitly excluded), would be a useful step in updating the AIT and for extending to producers in other provinces the more favourable conditions provided to foreign producers in recent international trade agreements (such as the EU-Canada Comprehensive Economic and Trade Agreement, CETA). As a large portion of the barriers that remain between provinces reflect regulatory measures and different standards, focusing on regulatory co-operation and implementation of mutual recognition could facilitate a win-win expansion of trade and the movement of labour. To maintain reform momentum, the current one-year rotating provincial leadership of the Committee on Internal Trade must be lengthened.
Efficient high-quality infrastructure can underpin inclusive productivity growth
While the quality of infrastructure in Canada compares favourably with other OECD countries, some constraints may exist for oil pipelines, liquefied natural gas terminals, some ports and sewage treatment facilities. Furthermore, Canada’s investment in transportation infrastructure (including road, rail and airports) as a share of GDP appears to be consistent with or higher than regional norms. Also, according to the World Economic Forum Global Competitiveness Index, Canada ranks relatively highly in terms of coverage and
FIGURE 3.2. RESTRICTIONS TO SERVICES TRADE REMAIN RELATIVELY HIGH IN SEVERAL SECTORS OECD Services Trade Restriction Index (STRI), from 0 (least restrictive) to 1 (most restrictive), 2015
Note: The STRI records measures on a most-favoured-nation basis; preferential trade agreements are not taken into account. Air transport and road freight cover only commercial establishments (with accompanying movement of people). The data have been verified and peer-reviewed by OECD members.
Source: OECD STRI Database, http://www.oecd.org/tad/services-trade/services-trade-restrictiveness-index.htm.
0
0.1
0.2
0.3
0.4
0.5
0.6
0.7
Com
pute
r
Con
stru
ctio
n
Lega
l
Acc
ount
ing
Arc
hite
ctur
e
Eng
inee
ring
Tel
ecom
Dis
trib
utio
n
Bro
adca
stin
g
Mot
ion
pict
ures
S
ound
reco
rdin
g
Com
mer
cial
b
anki
ng
Insu
ranc
e
A
irtr
ansp
ort
Mar
itim
etr
ansp
ort
R
oad
tran
spor
t
Rai
ltr
ansp
ort
Cou
rier
Regulatory transparency Barriers to competition Other discriminatory measures
Restrictions to movement of people Restrictions on foreign entry Best practice

PROMOTING GREEN AND INCLUSIVE GROWTH IN CANADA – 11
quality of transport, electricity and telephony infrastructure, both in absolute terms and relative to its large geographical size.
However, congestion may be an issue in Vancouver and, to a lesser extent, in Toronto (TomTom, 2015). In addition to constraining productivity growth, this can also hamper social inclusion in affected areas. Congestion-charging, particularly during peak periods, could ensure more efficient use of the road network. While second best in terms of efficiency, value-based pricing, such as high-occupancy toll lanes (as currently used in California and Israel and being planned in Toronto), could also help reduce congestion. The Canadian government is also focused on investing in public transit projects as well as improving co-ordination between different modes of transportation infrastructure (Gateways and Trade Corridors). This should also increase the efficiency of the overall network. Ensuring a clear and timely regulatory and environmental approval process for oil pipelines and liquefied natural gas terminals could also increase efficiency in those resource sectors.
Key observations Working with the provinces and the
electricity industry to facilitate greater interconnections between provinces (where economic) and, more generally, to promote greater integration of Canada's electricity markets could improve competition, enhance system reliability and facilitate the integration of intermittent renewable generation.
There is room to increase competition in sectors of network services by, for example, reassessing restrictions on foreign ownership in airlines, telecommunications and broadcasting.
Domestic competition and efficiency could be enhanced by strengthening the internal market through the easing of interprovincial barriers to trade and labour mobility, including a focus on regulatory co-operation and mutual recognition among provinces and territories.
Implementing infrastructure demand management strategies would help reduce urban road congestion, notably through congestion-charging.
Ensuring a clear and timely regulatory and environmental approval process for oil pipelines and liquefied natural gas terminals could increase efficiency in those resource sectors.
PROMOTING GREEN AND INCLUSIVE GROWTH IN CANADA – 11 PROMOTING GREEN AND INCLUSIVE GROWTH IN CANADA – 11
12 – PROMOTING GREEN AND INCLUSIVE GROWTH IN CANADA
4 Enhancing Canada’s innovation performance Stronger innovation is essential for Canada to support future productivity growth, job creation and higher living standards. While many large firms perform well in terms of R&D spending, innovation and ICT use, this is not the case for the SME sector. Strengthening Canada’s innovation performance and broadening it beyond large leading firms require comprehensive government action. This includes strengthening the system for commercialisation of innovation, including through fostering uptake and use of ICT by SMEs.
Canada’s SME sector is lagging behind
Making Canada a global science and technology leader has long been a policy objective. Canada has a robust science system and scores well on many OECD indicators related to scientific research. In particular, Canada's public supply of knowledge is rich, as measured for instance by the number of scientific articles per capita and spending on higher education R&D in proportion to GDP. The mobility of scientists is very high, and the country also scores above average on measures of innovation networks and clusters (OECD, 2015c). However, spending on business R&D is low, and Canada does not fully exploit the commercial opportunities of its research. The country also lags behind on broader measures of investment in knowledge-based capital, which complements and improves the impact of R&D. Part of the problem seems to be a growing divide between
different types of firms. Although many large Canadian firms perform well in terms of productivity, the SME sector performs less well and has much lower levels of R&D spending, ICT uptake, innovation and, ultimately, competitiveness (see Chapter 3). Boosting the performance of SMEs, and stimulating more young high-growth firms (known as gazelles), will help strengthen and rebalance the Canadian economy and generate new sources of growth and jobs.
Strengthening the commercialisation of ideas
One important area for policy action concerns the commercialisation of scientific research and the strengthening of co-operation between science and business. Government has a central role to set the basic rules and institutional frameworks that reflect the public interest and provide the right incentives to encourage firms,
FIGURE 4.1. PUBLIC SUPPORT FOR R&D IS HEAVILY SKEWED TOWARDS R&D TAX CREDITS Direct government funding of business R&D and tax incentives for R&D in 2013, % of GDP
Note: For Canada, estimates, on a cash basis, refer to the scientific research and experimental development tax credit for
current and capital R&D expenditures. They do not reflect the cost of provincial governments' R&D tax incentives (provided by many Canadian provinces) in order to ensure the comparability of R&D tax incentive estimates across countries. Estimates for the cost of accelerated depreciation provisions are not available.
Sources: OECD R&D Tax Incentive Indicators, www.oecd.org/sti/rd-tax-stats.htm and OECD Main Science and Technology Indicators, June 201,5 www.oecd.org/sti/msti.htm.
0.00
0.05
0.10
0.15
0.20
0.25
0.30
0.35
0.40
0.45
0.50
ME
X
CH
L
CH
E
SV
K
ZA
F
GR
C
AU
S
NLD
JPN
CA
N
TU
R
PR
T
ITA
NZ
L
FIN
BR
A
DN
K
CH
N
IRL
ES
T
DE
U
ES
P
NO
R
GB
R
ISL
BE
L
FR
A
CZ
E
SW
E
AU
T
KO
R
US
A
HU
N
SV
N
RU
SIndirect government support through R&D tax incentives
Direct government funding of business R&D expenditure
PROMOTING GREEN AND INCLUSIVE GROWTH IN CANADA – 13
public researchers and research institutions to work together. A comprehensive approach to commercialisation is key. It should go beyond the technology transfer offices of universities and focus on channels other than patenting and licensing alone, as these play only a minor role for most universities. Public-private collaborative research, student and faculty mobility, contract research, faculty consulting and student entrepreneurship also need attention. Moreover, in many cases, the challenge is not only with public research, but also with a lack of capabilities in the private sector to use and valorise the knowledge from public research. Israel’s Weizmann Institute is an example of a research organisation that has generated significant income from the commercialisation of research. Its technology transfer office, Yeda, is Weizmann’s exclusive channel for patenting, commercialisation and IP protection. It focuses on licensing contracts, and had annual royalty-generating sales in 2012 of over USD 17 billion.
Continue rebalancing expenditures towards more direct forms of innovation support
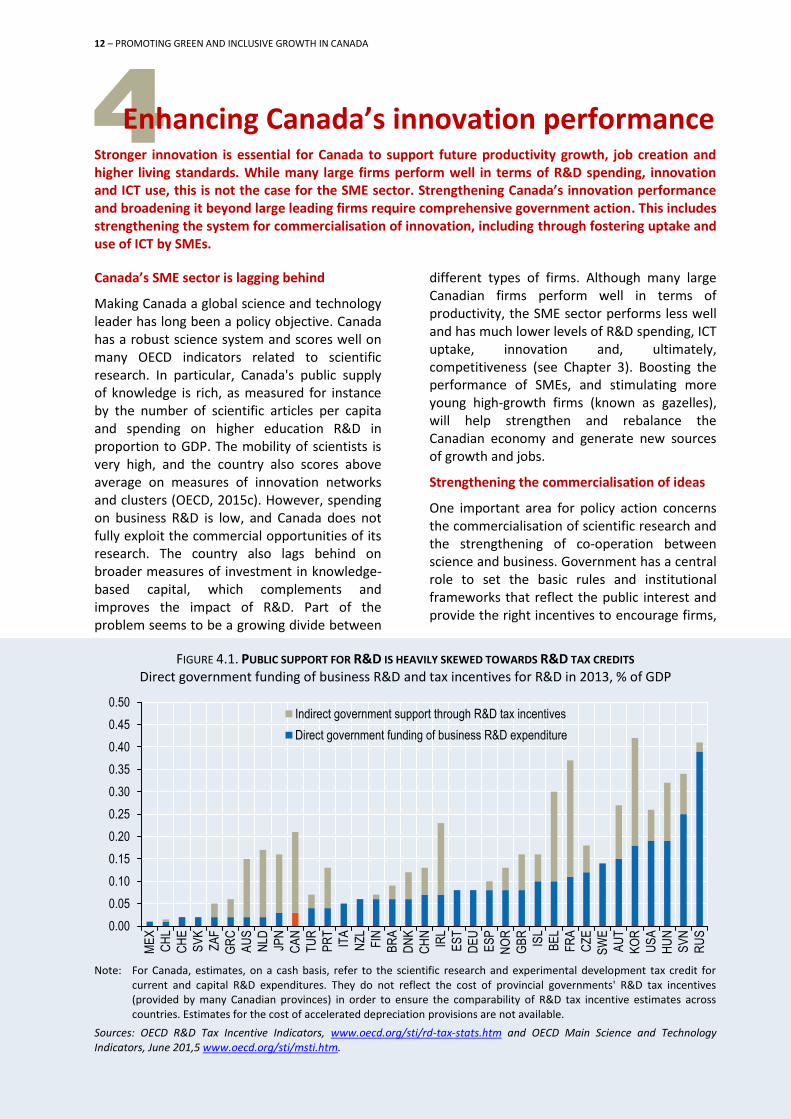
Canadian business spending on R&D has decreased steadily for over a decade, and at about 50% of gross domestic spending on R&D in 2013, it is well below the OECD average. This occurred despite generous tax incentives, which underscores the importance of rebalancing Canada’s support for innovation to increase its effectiveness. Public support to business innovation is heavily focused on R&D tax credits, with federal R&D tax incentives alone accounting for some 85% of all federal government support for business R&D in 2013 (Figure 4.1). Direct subsidy programmes, in the form of grants, subsidised loans, provision of services and public procurement of research or innovative products, are fragmented and limited in size, with the exception of the Industrial Research Assistance Program of the National Research Council (NRC). The NRC has begun to target R&D with private sector involvement. The strong focus on indirect support reveals a choice by Canadian authorities to stress forms of funding that apply neutrally, so as to establish a level playing field and a presumably more efficient let-markets-decide approach to R&D resource allocation. The downside of such a policy is a lack of targeting and likely deadweight costs.
At the same time, direct government funding of business R&D in Canada lags behind that of many other countries. OECD work finds that such direct support – contracts, grants and awards for mission-oriented R&D – is also important to stimulate innovation, particularly for young innovative firms that lack up-front funds. A well-designed, competitive and transparent system of direct support (e.g. contracts, grants and awards for mission-oriented R&D) can complement existing tax incentives and direct public funding to areas of high social and economic returns. It is important, however, that any allocation of direct support should be non-automatic and based on competitive, objective and transparent criteria (e.g. by involving independent international experts in the selection process). It can also help address specific barriers in the Canadian innovation system (e.g. lack of commercialisation of inventions or of science-industry collaboration), which are particularly important to upgrade the performance of low-productivity firms.
Recent changes in Canada have resulted in some shift of support from indirect tax support to direct programs (OECD, 2016a). In response to advice from an independent expert panel (the Jenkins Report), the 2012 federal budget announced a number of changes to the Scientific Research and Experimental Development tax incentive, including eliminating the eligibility of capital expenses to make the programme simpler and reducing the rate of the tax cedit for larger firms from 20% to 15%. The major changes took effect in 2014 and the savings have been invested in direct support and hence are not reflected in the 2013
14 – PROMOTING GREEN AND INCLUSIVE GROWTH IN CANADA
figures cited above.
Boosting the uptake and use of digital technologies
Increasing the uptake and use of digital technologies is another key area in need of policy attention. Almost no business anywhere today is run without the help of ICTs. In 2014, standard and dedicated mobile broadband penetration reached 54 subscriptions per 100 inhabitants (OECD, 2015c). However, only 18.5% of firms engaged in electronic sales (below the OECD average), and only 30% used cloud computing services, behind leaders in this area, such as Finland, Iceland, and Italy (OECD, 2015c). Overall, differences among countries in the use of various ICTs remain considerable, with Canada lagging behind the OECD leaders in several areas. Low uptake by smaller firms is one of the factors driving these differences. Thus, policies should aim to boost adoption of ICTs by stimulating investments in smart infrastructure and the Internet of Things, as well as in data and analytics.
Developing Canada’s venture capital market
Venture capital (VC) and private equity are important to boost innovation, as they focus on innovative start-ups and high-risk ventures. Canada’s venture capital market is larger than in most other countries and has grown significantly over recent years. However, it is still less than a third of the size of its US counterpart (0.08% of GDP compared to 0.28% of GDP). In 2013, Canada announced a Venture Capital Action Plan (VCAP) aimed at stimulating private sector investment in innovative businesses – a very welcome step. The plan led to the creation of four new private-sector-led funds, direct federal investments in four high-performing venture capital funds, and an accelerator and incubator programme to help entrepreneurs through mentoring and business advice and the provision of financial and commercialisation support.
Another approach which Canada has been using to encourage VC investments is through the income tax system, in large part through the Labour-Sponsored Venture Capital Corporations (LSVCCs) tax credit. Some evidence suggests,
however, that this tax credit is somewhat ineffective and might even hinder the growth of the VC market as it could diminish the returns of private VC funds, thus driving to the side-lines pension funds as well as other providers of capital to private funds. Government-sponsored venture capital funds, such as LSVCCs, may also be of lower quality than private venture capital funds in terms of both value creation and innovation (Brander, Egan and Hellmann, 2008). Consequently, the remaining federal tax credits for provincial LSVCCs should be phased out, as previously planned, and greater use of funds that operate like private, independent limited partnerships venture capital funds (like the VCAP) should be explored.
Key observations Canada could benefit from fostering the
commercialisation of research and science-industry relationships. This can be done through motivating technology transfer from academia by adopting proven best-practice models for university patenting, a research-granting process more open to the needs of business and a system of vouchers for research contracting.
R&D subsidies could have more beneficial effects on productivity if they were more clearly targeted at overcoming market failures. In this regard, it would be useful to evaluate R&D subsidy policies to determine whether their structure, including a substantially enhanced R&D tax-credit rate for small companies and a heavy reliance on indirect measures, and the level of the standard R&D tax credit rate are providing value for money.
Encouraging the uptake and use of digital technologies by SMEs could improve their productivity performance.
Phasing out the Labour-Sponsored Venture Capital Corporations tax credit could stimulate growth of the venture capital market and enhance its quality in terms of value creation and innovation.
PROMOTING GREEN AND INCLUSIVE GROWTH IN CANADA – 15
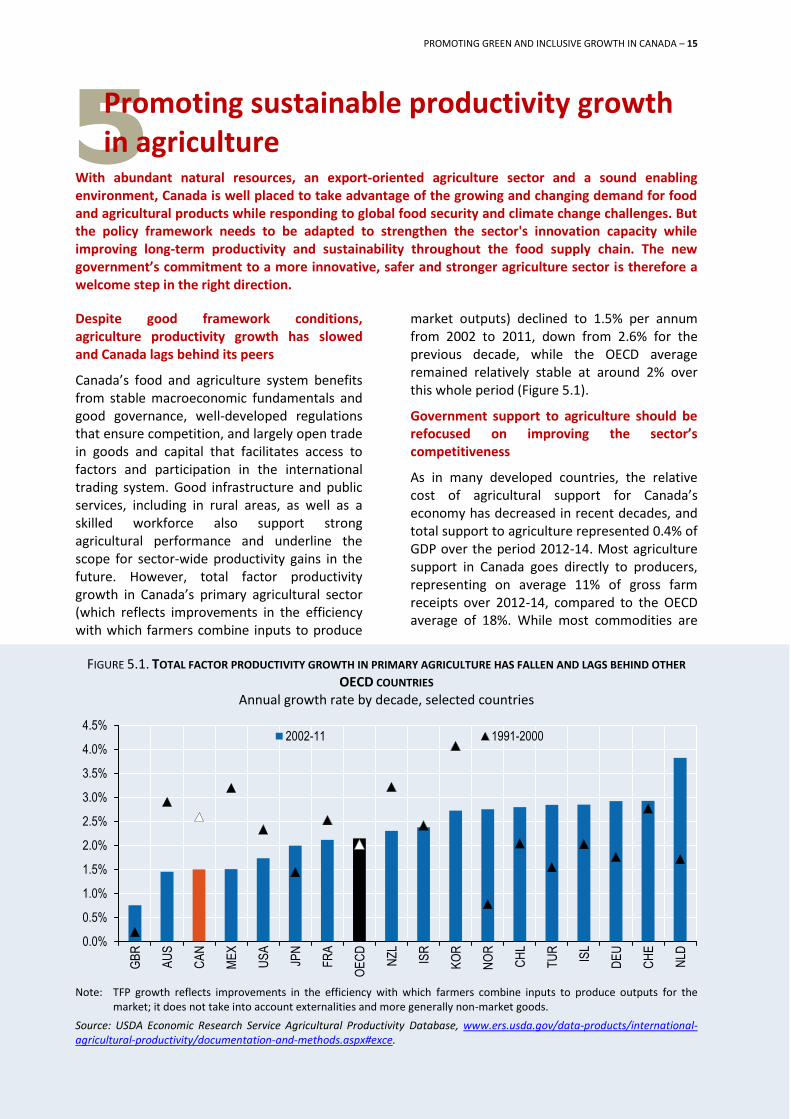
5 Promoting sustainable productivity growth in agriculture
With abundant natural resources, an export-oriented agriculture sector and a sound enabling environment, Canada is well placed to take advantage of the growing and changing demand for food and agricultural products while responding to global food security and climate change challenges. But the policy framework needs to be adapted to strengthen the sector's innovation capacity while improving long-term productivity and sustainability throughout the food supply chain. The new government’s commitment to a more innovative, safer and stronger agriculture sector is therefore a welcome step in the right direction.
Despite good framework conditions, agriculture productivity growth has slowed and Canada lags behind its peers
Canada’s food and agriculture system benefits from stable macroeconomic fundamentals and good governance, well-developed regulations that ensure competition, and largely open trade in goods and capital that facilitates access to factors and participation in the international trading system. Good infrastructure and public services, including in rural areas, as well as a skilled workforce also support strong agricultural performance and underline the scope for sector-wide productivity gains in the future. However, total factor productivity growth in Canada’s primary agricultural sector (which reflects improvements in the efficiency with which farmers combine inputs to produce
market outputs) declined to 1.5% per annum from 2002 to 2011, down from 2.6% for the previous decade, while the OECD average remained relatively stable at around 2% over this whole period (Figure 5.1).
Government support to agriculture should be refocused on improving the sector’s competitiveness
As in many developed countries, the relative cost of agricultural support for Canada’s economy has decreased in recent decades, and total support to agriculture represented 0.4% of GDP over the period 2012-14. Most agriculture support in Canada goes directly to producers, representing on average 11% of gross farm receipts over 2012-14, compared to the OECD average of 18%. While most commodities are
FIGURE 5.1. TOTAL FACTOR PRODUCTIVITY GROWTH IN PRIMARY AGRICULTURE HAS FALLEN AND LAGS BEHIND OTHER
OECD COUNTRIES Annual growth rate by decade, selected countries
Note: TFP growth reflects improvements in the efficiency with which farmers combine inputs to produce outputs for the
market; it does not take into account externalities and more generally non-market goods.
Source: USDA Economic Research Service Agricultural Productivity Database, www.ers.usda.gov/data-products/international-agricultural-productivity/documentation-and-methods.aspx#exce.
0.0%
0.5%
1.0%
1.5%
2.0%
2.5%
3.0%
3.5%
4.0%
4.5%
GB
R
AU
S
CA
N
ME
X
US
A
JPN
FR
A
OE
CD
NZ
L
ISR
KO
R
NO
R
CH
L
TU
R
ISL
DE
U
CH
E
NLD
2002-11 1991-2000

16 – PROMOTING GREEN AND INCLUSIVE GROWTH IN CANADA
competitive on world markets, the supply-managed sectors continue to receive a high level of price support, and the share of production- and trade-distorting support remained higher than the OECD average in recent years.
Furthermore, most of this support is directed towards stabilising farm incomes in the short term, while policy efforts that strengthen the long-term productivity, sustainability and competitiveness of the sector (such as investments in agricultural knowledge and innovation, rural infrastructure, and inspection services) account for only about a quarter of that support. While the performance of many OECD countries is poor in this regard, Canada should strive to be among the best performers, seeking to shift policies more towards fostering the long-term competitiveness of its agriculture sector. The new government’s commitment to invest an additional CAD 100 million over four years in agricultural research and an additional CAD 80 million over four years in the Canadian Food Inspection Agency are positive signs.
Boosting private investment in agriculture will be critical to boosting productivity
Public investment in agricultural innovation has traditionally been strong, and the agricultural innovation system performs relatively well. Although public investment in agricultural R&D has declined in recent years, R&D intensity remains high by international comparison. The knowledge infrastructure (including institutions, networks and databases) is well developed, but it will require stable funding in order to maintain current capacity. Collaboration and partnerships in research and innovation between public and private actors are increasingly encouraged, but there remains room for improvement in the level of private investment, which stagnated following the economic downturn. The recent strengthening of Plant Breeders' Rights is expected to attract private investment in this area, for example.
Direct incentives for innovation in agriculture have increased over time, but the general approach to agricultural policy remains focused on risk management and investment support. However, incentives for co-operation between the public and private sectors and the adoption of innovation by the food and agricultural sector have also increased in the current policy
framework. To enhance competitiveness of the sector, Canada could incorporate innovation as a core element of future agriculture policy frameworks and evaluate current and new policy proposals through the lens of the expected impact on productivity growth and sustainable resource use (OECD, 2015d). For example, some existing agricultural policies (such as price pooling arrangements that do not reward innovative farmers and supply management schemes that control dairy, poultry and egg production and prices) distort production and trade, with high rents being capitalised in the value of production quotas. Regarding innovation policy, there is also a need to simplify the plethora of existing incentive measures to innovation in food and agriculture, including by establishing a single window for the agri-food industry to identify available assistance measures. Finally, alternative public and private sources of funding and possible public-private-partnership (PPP) arrangements should be explored to enlarge the innovation infrastructure.
Key observations The performance of the agricultural sector
could be enhanced by shifting the focus of agricultural policies towards ensuring the sector’s long-term competitiveness, and supporting investments in agricultural knowledge and innovation as well as inspection services.
Canada could benefit from phasing out trade- and production-distorting price supports in agriculture.
Continuing to incorporate innovation as a core element of future agriculture policy frameworks would help enhance the competitiveness of the agricultural sector.
Establishing a single window for the agri-food industry would raise awareness among stakeholders and interested parties of available incentives for innovatation.
Examining alternative public and private sources of funding and possible PPP arrangements would help to not just maintain but to enlarge innovation infrastructure.

PROMOTING GREEN AND INCLUSIVE GROWTH IN CANADA – 17
6 Raising the relevance and equity of Canada’s education and skills system
Canada performs well on measures of educational attainment and skills. For example, the country has the second-highest share of young tertiary graduates in the OECD. But overall achievement levels mask the fact that some parts of the working-age population lack the skills required in modern economies and societies. Given that skills are crucial for people to succeed in life and enjoy a high level of well-being, Canada would benefit from ensuring that its education and skills system – which falls primarily under provincial jurisdiction but is supported in many ways by federal investments – provides all individuals with access to strong and relevant skills.
Good skills are vital for success in the labour market and general well-being
High levels of education and skills are increasingly important for success in Canada’s labour market. Employment growth over the past three decades has been highest for people with tertiary education (especially holders of a university degree) and lowest for those who have not graduated from upper secondary education (OECD, 2014a). This trend is expected to continue, with the Canadian Occupational Projection System suggesting that approximately two-thirds of all job openings between 2013 and 2022 will require tertiary education (ESDC, 2013).
Better skills also foster equity, inclusion and participation. People with higher levels of education and skills are more likely to report positive social outcomes such as good health, trust in others, participation in voluntary activities, and political engagement (OECD,
2015e and OECD, 2012a). This means that it is not enough for a country to simply have good educational and skills outcomes at the aggregate level. National success in education and skills requires that everyone has the potential to share in prosperity and fully participate in society.
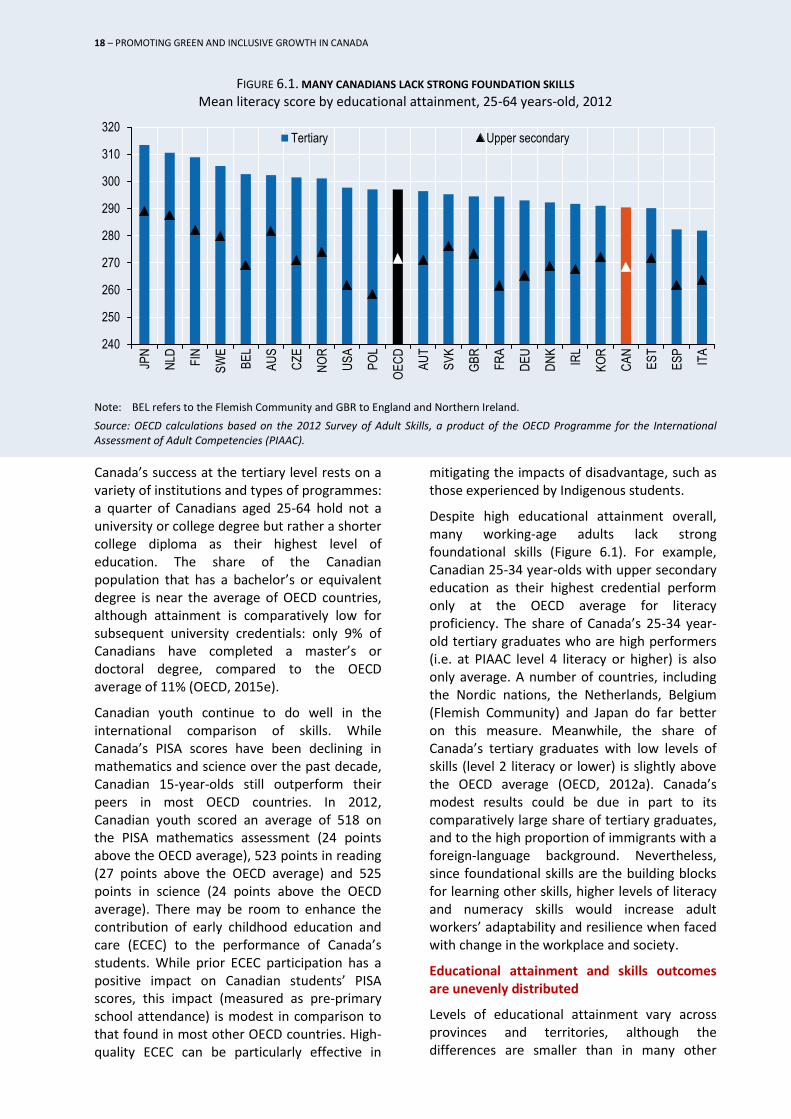
Overall educational attainment is high, but many graduates lack strong foundational skills
Over the past decades, Canada has been very successful in expanding educational attainment. Compared to other OECD countries, the share of the population that has completed at least upper secondary is high – and it continues to rise, with 93% of Canadians aged 25-34 holding at least an upper secondary credential, compared to 85% of 55-64 year-olds. And 58% of Canadian 25-34 year-olds have completed some form of tertiary education (within the OECD, only Korea, at 68%, has a higher share of young tertiary graduates).
18 – PROMOTING GREEN AND INCLUSIVE GROWTH IN CANADA
FIGURE 6.1. MANY CANADIANS LACK STRONG FOUNDATION SKILLS Mean literacy score by educational attainment, 25-64 years-old, 2012
Note: BEL refers to the Flemish Community and GBR to England and Northern Ireland.
Source: OECD calculations based on the 2012 Survey of Adult Skills, a product of the OECD Programme for the International Assessment of Adult Competencies (PIAAC).
Canada’s success at the tertiary level rests on a variety of institutions and types of programmes: a quarter of Canadians aged 25-64 hold not a university or college degree but rather a shorter college diploma as their highest level of education. The share of the Canadian population that has a bachelor’s or equivalent degree is near the average of OECD countries, although attainment is comparatively low for subsequent university credentials: only 9% of Canadians have completed a master’s or doctoral degree, compared to the OECD average of 11% (OECD, 2015e).
Canadian youth continue to do well in the international comparison of skills. While Canada’s PISA scores have been declining in mathematics and science over the past decade, Canadian 15-year-olds still outperform their peers in most OECD countries. In 2012, Canadian youth scored an average of 518 on the PISA mathematics assessment (24 points above the OECD average), 523 points in reading (27 points above the OECD average) and 525 points in science (24 points above the OECD average). There may be room to enhance the contribution of early childhood education and care (ECEC) to the performance of Canada’s students. While prior ECEC participation has a positive impact on Canadian students’ PISA scores, this impact (measured as pre-primary school attendance) is modest in comparison to that found in most other OECD countries. High-quality ECEC can be particularly effective in
mitigating the impacts of disadvantage, such as those experienced by Indigenous students.
Despite high educational attainment overall, many working-age adults lack strong foundational skills (Figure 6.1). For example, Canadian 25-34 year-olds with upper secondary education as their highest credential perform only at the OECD average for literacy proficiency. The share of Canada’s 25-34 year-old tertiary graduates who are high performers (i.e. at PIAAC level 4 literacy or higher) is also only average. A number of countries, including the Nordic nations, the Netherlands, Belgium (Flemish Community) and Japan do far better on this measure. Meanwhile, the share of Canada’s tertiary graduates with low levels of skills (level 2 literacy or lower) is slightly above the OECD average (OECD, 2012a). Canada’s modest results could be due in part to its comparatively large share of tertiary graduates, and to the high proportion of immigrants with a foreign-language background. Nevertheless, since foundational skills are the building blocks for learning other skills, higher levels of literacy and numeracy skills would increase adult workers’ adaptability and resilience when faced with change in the workplace and society.
Educational attainment and skills outcomes are unevenly distributed
Levels of educational attainment vary across provinces and territories, although the differences are smaller than in many other
240
250
260
270
280
290
300
310
320
JPN
NLD FIN
SW
E
BE
L
AU
S
CZ
E
NO
R
US
A
PO
L
OE
CD
AU
T
SV
K
GB
R
FR
A
DE
U
DN
K
IRL
KO
R
CA
N
ES
T
ES
P
ITA
Tertiary Upper secondary
18 – PROMOTING GREEN AND INCLUSIVE GROWTH IN CANADA
PROMOTING GREEN AND INCLUSIVE GROWTH IN CANADA – 19
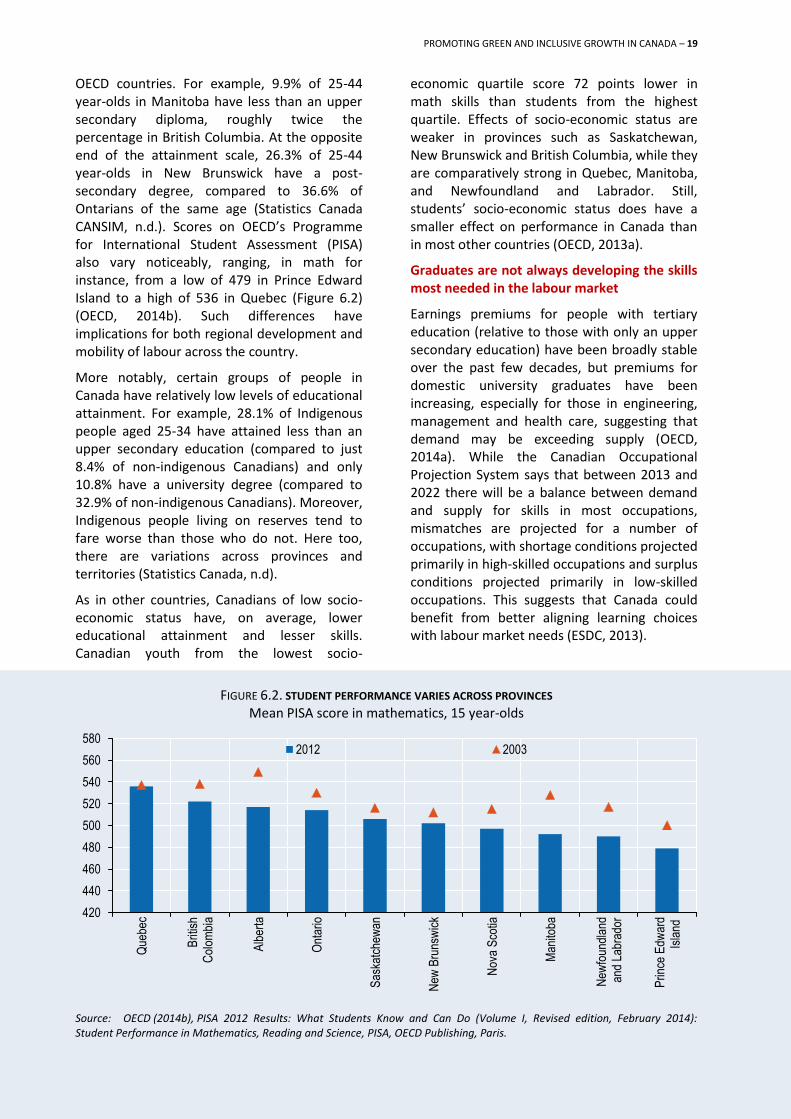
OECD countries. For example, 9.9% of 25-44 year-olds in Manitoba have less than an upper secondary diploma, roughly twice the percentage in British Columbia. At the opposite end of the attainment scale, 26.3% of 25-44 year-olds in New Brunswick have a post-secondary degree, compared to 36.6% of Ontarians of the same age (Statistics Canada CANSIM, n.d.). Scores on OECD’s Programme for International Student Assessment (PISA) also vary noticeably, ranging, in math for instance, from a low of 479 in Prince Edward Island to a high of 536 in Quebec (Figure 6.2) (OECD, 2014b). Such differences have implications for both regional development and mobility of labour across the country.
More notably, certain groups of people in Canada have relatively low levels of educational attainment. For example, 28.1% of Indigenous people aged 25-34 have attained less than an upper secondary education (compared to just 8.4% of non-indigenous Canadians) and only 10.8% have a university degree (compared to 32.9% of non-indigenous Canadians). Moreover, Indigenous people living on reserves tend to fare worse than those who do not. Here too, there are variations across provinces and territories (Statistics Canada, n.d).
As in other countries, Canadians of low socio-economic status have, on average, lower educational attainment and lesser skills. Canadian youth from the lowest socio-
economic quartile score 72 points lower in math skills than students from the highest quartile. Effects of socio-economic status are weaker in provinces such as Saskatchewan, New Brunswick and British Columbia, while they are comparatively strong in Quebec, Manitoba, and Newfoundland and Labrador. Still, students’ socio-economic status does have a smaller effect on performance in Canada than in most other countries (OECD, 2013a).
Graduates are not always developing the skills most needed in the labour market
Earnings premiums for people with tertiary education (relative to those with only an upper secondary education) have been broadly stable over the past few decades, but premiums for domestic university graduates have been increasing, especially for those in engineering, management and health care, suggesting that demand may be exceeding supply (OECD, 2014a). While the Canadian Occupational Projection System says that between 2013 and 2022 there will be a balance between demand and supply for skills in most occupations, mismatches are projected for a number of occupations, with shortage conditions projected primarily in high-skilled occupations and surplus conditions projected primarily in low-skilled occupations. This suggests that Canada could benefit from better aligning learning choices with labour market needs (ESDC, 2013).
FIGURE 6.2. STUDENT PERFORMANCE VARIES ACROSS PROVINCES Mean PISA score in mathematics, 15 year-olds
Source: OECD (2014b), PISA 2012 Results: What Students Know and Can Do (Volume I, Revised edition, February 2014): Student Performance in Mathematics, Reading and Science, PISA, OECD Publishing, Paris.
420
440
460
480
500
520
540
560
580
Que
bec
B
ritis
hC
olom
bia
Alb
erta
Ont
ario
Sas
katc
hew
an
New
Bru
nsw
ick
Nov
a S
cotia
Man
itoba
New
foun
dlan
d a
nd L
abra
dor
Prin
ce E
dwar
d
Is
land
2012 2003

20 – PROMOTING GREEN AND INCLUSIVE GROWTH IN CANADA
Moreover, employers are expressing concerns about the skills of young Canadians leaving the education system. In a recent survey of Canada, only a third of employers agreed that graduates of Canada’s education systems are adequately prepared for the workforce. By way of contrast, nearly half of employers in the United States consider that graduates are prepared (McKinsey, 2015). Good systems need to be in place to assess and anticipate the skills needed in the labour market.
While Canada is already promoting opportunities for work-based learning, more can be done in this area. The same applies to the development of entrepreneurship skills. Canada’s community colleges and polytechnics are reaching out to employers to design and deliver training that responds to local labour market needs (OECD, 2015f). Employers can work with universities and colleges and other partners to ensure that all students are able to benefit from work-based learning experiences (including apprenticeships). They can also play a leadership role in promoting workplace literacy, numeracy, essential skills training and entrepreneurship skills.
Key observations Canada could benefit from expanding the
education system’s capacity to equip all youth with the skills that prepare them for satisfying lives, through school- and community-based initiatives, targeted investments and the sharing of best practices across jurisdictions. Special attention might be warranted for under-served populations such as Indigenous peoples and lagging regions and socio-economic groups.
Putting in place robust mechanisms to assess the quality of early childhood education and care in Canada, with particular attention to the needs of under-served populations, could improve student performance.
The labour market relevance of people’s skills could be improved through better data on the outcomes of recent graduates, the expansion of high-quality learning and labour market information and, above all, the communication of this information in ways that support good education and career choices.
Broader co-operation between education systems and employers could also increase the relevance of skills. This includes further expanding opportunities for work-based learning (e.g. internships, apprenticeships and work placements), expanding entrepreneurship education and developing further policies for lifelong learning.
Canada would benefit from evaluating current federal, provincial/territorial and employer investments in skills maintenance and skills upgrading of the adult workforce – with attention to both foundational and technical skills – to ensure that individuals are acquiring the skills required to adapt to the needs of an evolving labour market.
A more coherent, co-ordinated national skills system could be established by building on the strengths of Canada’s federal system, which allows different jurisdictions to experiment and tailor programming to local needs.
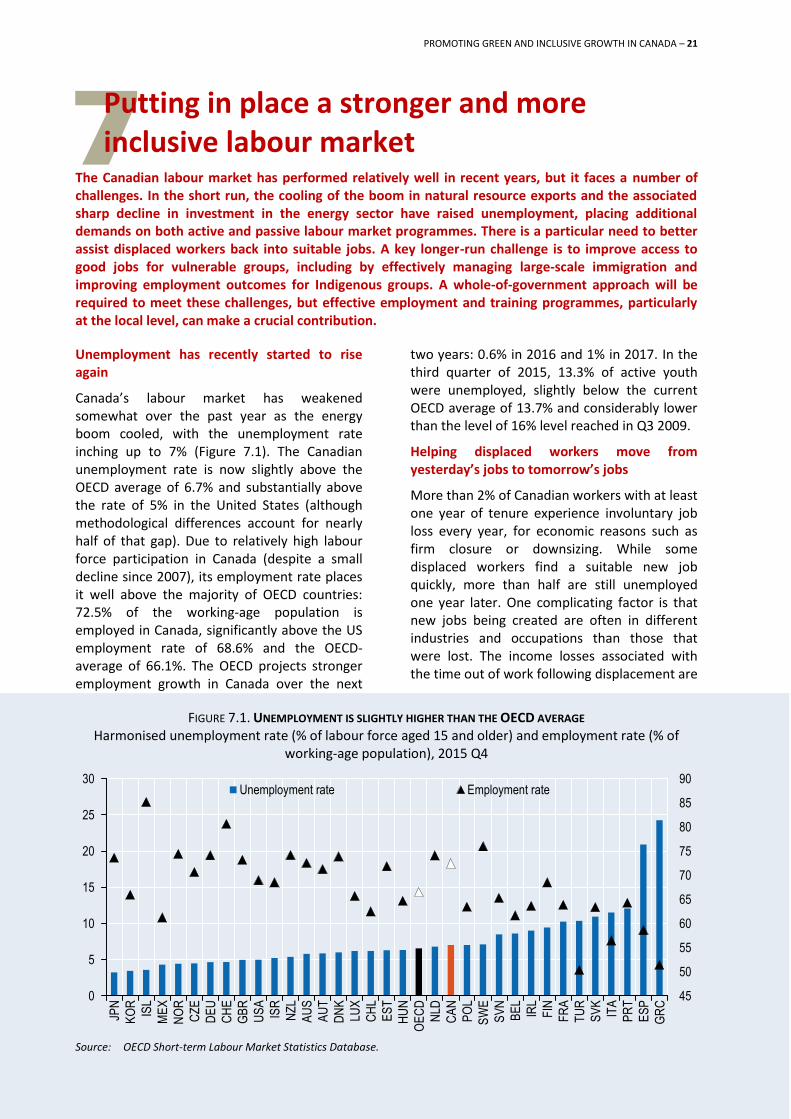
PROMOTING GREEN AND INCLUSIVE GROWTH IN CANADA – 21
7 Putting in place a stronger and more inclusive labour market
The Canadian labour market has performed relatively well in recent years, but it faces a number of challenges. In the short run, the cooling of the boom in natural resource exports and the associated sharp decline in investment in the energy sector have raised unemployment, placing additional demands on both active and passive labour market programmes. There is a particular need to better assist displaced workers back into suitable jobs. A key longer-run challenge is to improve access to good jobs for vulnerable groups, including by effectively managing large-scale immigration and improving employment outcomes for Indigenous groups. A whole-of-government approach will be required to meet these challenges, but effective employment and training programmes, particularly at the local level, can make a crucial contribution.
Unemployment has recently started to rise again
Canada’s labour market has weakened somewhat over the past year as the energy boom cooled, with the unemployment rate inching up to 7% (Figure 7.1). The Canadian unemployment rate is now slightly above the OECD average of 6.7% and substantially above the rate of 5% in the United States (although methodological differences account for nearly half of that gap). Due to relatively high labour force participation in Canada (despite a small decline since 2007), its employment rate places it well above the majority of OECD countries: 72.5% of the working-age population is employed in Canada, significantly above the US employment rate of 68.6% and the OECD-average of 66.1%. The OECD projects stronger employment growth in Canada over the next
two years: 0.6% in 2016 and 1% in 2017. In the third quarter of 2015, 13.3% of active youth were unemployed, slightly below the current OECD average of 13.7% and considerably lower than the level of 16% level reached in Q3 2009.
Helping displaced workers move from yesterday’s jobs to tomorrow’s jobs
More than 2% of Canadian workers with at least one year of tenure experience involuntary job loss every year, for economic reasons such as firm closure or downsizing. While some displaced workers find a suitable new job quickly, more than half are still unemployed one year later. One complicating factor is that new jobs being created are often in different industries and occupations than those that were lost. The income losses associated with the time out of work following displacement are
FIGURE 7.1. UNEMPLOYMENT IS SLIGHTLY HIGHER THAN THE OECD AVERAGE Harmonised unemployment rate (% of labour force aged 15 and older) and employment rate (% of
working-age population), 2015 Q4
Source: OECD Short-term Labour Market Statistics Database.
45
50
55
60
65
70
75
80
85
90
0
5
10
15
20
25
30
JPN
KO
R
ISL
ME
X
NO
R
CZ
E
DE
U
CH
E
GB
R
US
A
ISR
NZ
L
AU
S
AU
T
DN
K
LUX
CH
L
ES
T
HU
N
OE
CD
NLD
CA
N
PO
L
SW
E
SV
N
BE
L
IRL
FIN
FR
A
TU
R
SV
K
ITA
PR
T
ES
P
GR
C
Unemployment rate Employment rate

26 – PROMOTING GREEN AND INCLUSIVE GROWTH IN CANADA
often compounded when displaced workers move into new jobs that pay substantially less than the jobs they lost. The new jobs are also often located far away from workers whose jobs have disappeared. This is reflected in the strong regional variation of unemployment rates, which range from 5% in Saskatchewan to 12.3% in Newfoundland and Labrador. Older and long-tenured workers are at the highest risk of falling into long-term unemployment after displacement and experiencing large and lasting wage reductions.
While job displacement is a source of insecurity for workers, it is also an inescapable part of a dynamic labour market. The challenge for labour market policy is thus to provide displaced workers with adequate income support and effective re-employment services, including training (see Chapter 6). A new OECD study (OECD, 2015g) shows that Canada has a relatively favourable overall policy set-up for assisting displaced workers, but also areas of weakness, such as inadequate income support for the hardest-hit individuals and excessive
delays before displaced workers begin to receive re-employment assistance.
Enhancing the decentralised system of labour market programmes
Strengthening local-level involvement in the implementation of employment and training policies is vital to align skills development efforts with employers’ needs (OECD, 2015f). Labour market agreements in Canada provide a flexible mechanism for provinces and territories to respond to regional needs, but there is room to do even better. At the local level, community colleges across Canada are well placed to partner with employers to maximise the contributions that people can make in the workplace, and this can create broader economic spin-off benefits in communities (OECD, 2015f). Better skills use could also address underemployment of graduates. Governments at higher levels in Canada should seek to engage with local levels early and often in the policy development process to ensure that policies and programmes reflect local needs and circumstances. Efforts in this area also require integration across employment,
22 – PROMOTING GREEN AND INCLUSIVE GROWTH IN CANADA
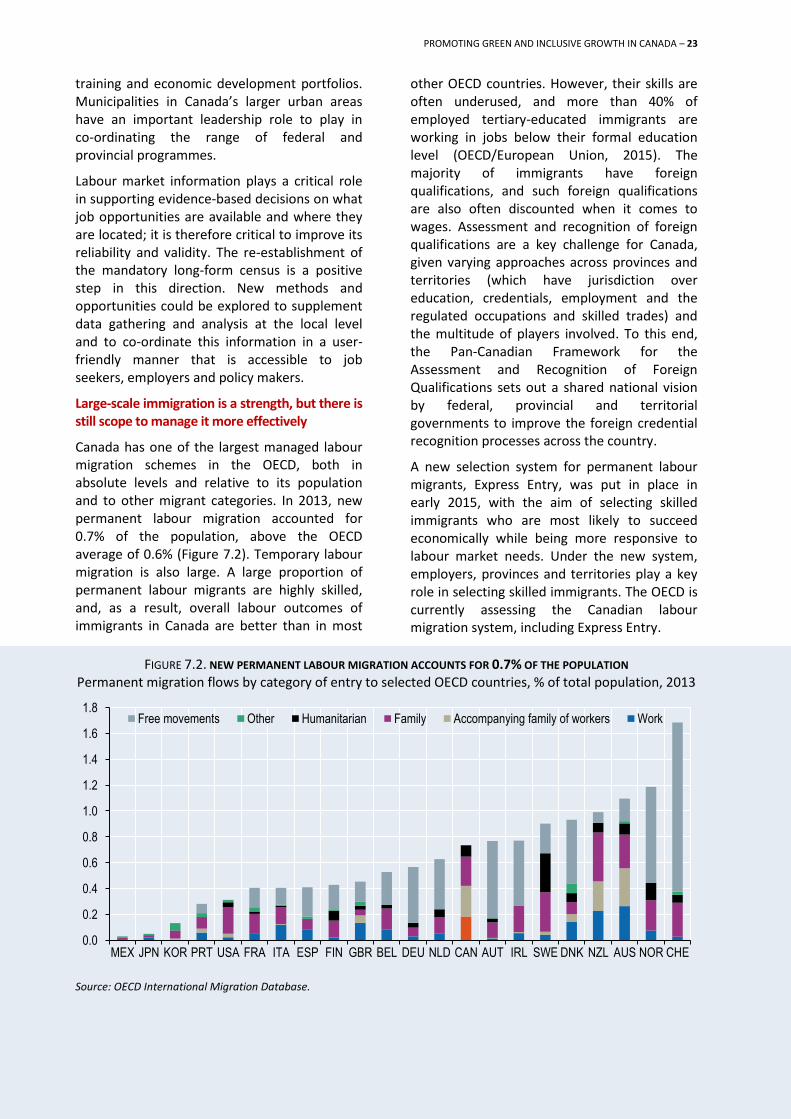
PROMOTING GREEN AND INCLUSIVE GROWTH IN CANADA – 23
training and economic development portfolios. Municipalities in Canada’s larger urban areas have an important leadership role to play in co-ordinating the range of federal and provincial programmes.
Labour market information plays a critical role in supporting evidence-based decisions on what job opportunities are available and where they are located; it is therefore critical to improve its reliability and validity. The re-establishment of the mandatory long-form census is a positive step in this direction. New methods and opportunities could be explored to supplement data gathering and analysis at the local level and to co-ordinate this information in a user-friendly manner that is accessible to job seekers, employers and policy makers.
Large-scale immigration is a strength, but there is still scope to manage it more effectively
Canada has one of the largest managed labour migration schemes in the OECD, both in absolute levels and relative to its population and to other migrant categories. In 2013, new permanent labour migration accounted for 0.7% of the population, above the OECD average of 0.6% (Figure 7.2). Temporary labour migration is also large. A large proportion of permanent labour migrants are highly skilled, and, as a result, overall labour outcomes of immigrants in Canada are better than in most
other OECD countries. However, their skills are often underused, and more than 40% of employed tertiary-educated immigrants are working in jobs below their formal education level (OECD/European Union, 2015). The majority of immigrants have foreign qualifications, and such foreign qualifications are also often discounted when it comes to wages. Assessment and recognition of foreign qualifications are a key challenge for Canada, given varying approaches across provinces and territories (which have jurisdiction over education, credentials, employment and the regulated occupations and skilled trades) and the multitude of players involved. To this end, the Pan-Canadian Framework for the Assessment and Recognition of Foreign Qualifications sets out a shared national vision by federal, provincial and territorial governments to improve the foreign credential recognition processes across the country.
A new selection system for permanent labour migrants, Express Entry, was put in place in early 2015, with the aim of selecting skilled immigrants who are most likely to succeed economically while being more responsive to labour market needs. Under the new system, employers, provinces and territories play a key role in selecting skilled immigrants. The OECD is currently assessing the Canadian labour migration system, including Express Entry.
FIGURE 7.2. NEW PERMANENT LABOUR MIGRATION ACCOUNTS FOR 0.7% OF THE POPULATION Permanent migration flows by category of entry to selected OECD countries, % of total population, 2013
Source: OECD International Migration Database.
0.0
0.2
0.4
0.6
0.8
1.0
1.2
1.4
1.6
1.8
MEX JPN KOR PRT USA FRA ITA ESP FIN GBR BEL DEU NLD CAN AUT IRL SWE DNK NZL AUS NOR CHE
Free movements Other Humanitarian Family Accompanying family of workers Work

22 – PROMOTING GREEN AND INCLUSIVE GROWTH IN CANADA
Building the capacity of Indigenous communities to participate in the labour market
Indigenous peoples in Canada face a number of significant barriers to labour market participation. In 2015, the unemployment rate of the indigenous population was 12.4%, almost twice the rate of the non-indigenous population, which was 6.8% (Statistics Canada, 2016). Self-government agreements in Canada are empowering some communities to govern themselves in a manner that is responsive to the needs and interests of their people. Strong stable leadership at the local level can play a significant role in the success of these agreements as well as broader approaches to equip Indigenous peoples for labour market success (OECD, 2016b). The federal government could examine how best to improve the governance capacities of First Nations, Inuit and Metis communities in the area of employment and job creation and facilitate the exchange of information about successful approaches to support their labour market participation.
Key observations Inclusiveness could be improved by
reinforcing efforts to provide early and effective re-employment support to older and long-tenure displaced workers and others who need more intensive help.
Canada could benefit from increasing the income support available to older and long-tenure displaced workers, such as allowing a longer maximum period of benefits, although any such increase would need to be accompanied by systematic monitoring of job search and mandatory participation in active labour market programmes.
Labour market outcomes could be improved by ensuring sufficient flexibility within the employment and training systems at the federal and provincial levels to create customised solutions for local employers and by ensuring policy co-ordination across employment, training and economic development portfolios.
Canada would benefit from building upon recent progress in improving labour market information to expand the scope for evidence-based decisions by students, job seekers, suppliers of training and employers.
The labour market integration of immigrants could be improved by enhancing transparency on the assessment and recognition of foreign qualifications and, where appropriate, linking the outcomes with bridging courses to complement education degrees acquired abroad for acquiring a local degree.
Examining how best to improve the governance capacities of First Nations, Inuit and Metis communities and facilitating the sharing of best practices would help improve their capacity to participate in the labour market
24- PROMOTING GREEN AND INCLUSIVE GROWTH IN CANADA
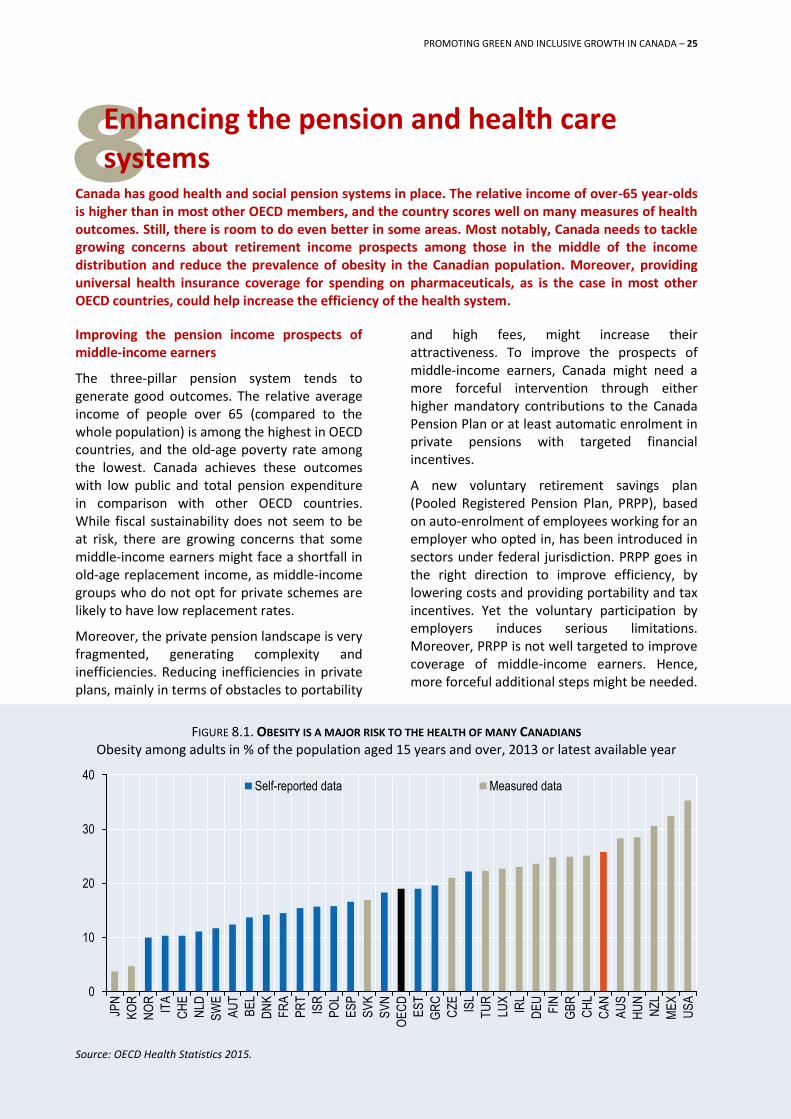
PROMOTING GREEN AND INCLUSIVE GROWTH IN CANADA – 25
8 Enhancing the pension and health care systems
Canada has good health and social pension systems in place. The relative income of over-65 year-olds is higher than in most other OECD members, and the country scores well on many measures of health outcomes. Still, there is room to do even better in some areas. Most notably, Canada needs to tackle growing concerns about retirement income prospects among those in the middle of the income distribution and reduce the prevalence of obesity in the Canadian population. Moreover, providing universal health insurance coverage for spending on pharmaceuticals, as is the case in most other OECD countries, could help increase the efficiency of the health system.
Improving the pension income prospects of middle-income earners
The three-pillar pension system tends to generate good outcomes. The relative average income of people over 65 (compared to the whole population) is among the highest in OECD countries, and the old-age poverty rate among the lowest. Canada achieves these outcomes with low public and total pension expenditure in comparison with other OECD countries. While fiscal sustainability does not seem to be at risk, there are growing concerns that some middle-income earners might face a shortfall in old-age replacement income, as middle-income groups who do not opt for private schemes are likely to have low replacement rates.
Moreover, the private pension landscape is very fragmented, generating complexity and inefficiencies. Reducing inefficiencies in private plans, mainly in terms of obstacles to portability
and high fees, might increase their attractiveness. To improve the prospects of middle-income earners, Canada might need a more forceful intervention through either higher mandatory contributions to the Canada Pension Plan or at least automatic enrolment in private pensions with targeted financial incentives.
A new voluntary retirement savings plan (Pooled Registered Pension Plan, PRPP), based on auto-enrolment of employees working for an employer who opted in, has been introduced in sectors under federal jurisdiction. PRPP goes in the right direction to improve efficiency, by lowering costs and providing portability and tax incentives. Yet the voluntary participation by employers induces serious limitations. Moreover, PRPP is not well targeted to improve coverage of middle-income earners. Hence, more forceful additional steps might be needed.
FIGURE 8.1. OBESITY IS A MAJOR RISK TO THE HEALTH OF MANY CANADIANS Obesity among adults in % of the population aged 15 years and over, 2013 or latest available year
Source: OECD Health Statistics 2015.
0
10
20
30
40
JPN
KO
R
NO
R
ITA
CH
E
NLD
SW
E
AU
T
BE
L
DN
K
FR
A
PR
T
ISR
PO
L
ES
P
SV
K
SV
N
OE
CD
ES
T
GR
C
CZ
E
ISL
TU
R
LUX
IRL
DE
U
FIN
GB
R
CH
L
CA
N
AU
S
HU
N
NZ
L
ME
X
US
A
Self-reported data Measured data
26 – PROMOTING GREEN AND INCLUSIVE GROWTH IN CANADA
Plans to expand the second pillar through higher wage thresholds for contributions and/or higher replacement rates were rejected by the federal government in 2013.
Further enhancing public health and the health care system
Following fairly strong increases up to 2010, the growth rate in health spending in Canada has slowed down in recent years. But at 10% of GDP, outlays remain slightly above the OECD average. Canadians enjoy good health outcomes. Life expectancy is one year higher than the OECD average and about three years higher than in the United States, although it remains lower than in leading OECD countries (Japan, Spain and Switzerland).
A lot of progress has been achieved over the past few decades in reducing tobacco smoking in Canada, which is now among the lowest in OECD countries (15% of Canadians smoked every day in 2013, compared to 33% in 1980). Alcohol consumption is also below the OECD average, but it has been rising. The obesity rate among children and adults is among the highest in the OECD (Figure 8.1). Obesity is a known risk factor for many health problems, and it threatens the progress that has been achieved in recent decades in reducing mortality rates from cardiovascular diseases. OECD work has shown that a wide range of measures would be cost-effective in reducing obesity rates in Canada, including strengthening food labelling regulations, ensuring better education on healthy foods and promoting greater counselling by doctors and dieticians. Any steps in this direction would need to account for the division of roles between federal and provincial governments.
While the overall quality of health care is good, Canada could do better in filling gaps in the provision of care outside hospital for people with chronic conditions, in order to avoid unnecessary hospital emergency visits and admissions. For example, appropriate access to and use of pharmaceuticals are an important component to prevent complications in the management of chronic diseases, such as diabetes and hypertension. However, in Canada, there is variation across jurisdictions regarding the insurance coverage for spending on pharmaceuticals outside hospitals.
Canada should consider implementing universal health coverage for spending on pharmaceuticals, as exists in most other OECD countries. Given the division of roles between federal and provincial governments, the provinces would need to take the lead on such a measure. The current system does not guarantee efficient spending on pharmaceuticals. First, the fragmentation of drug coverage does not allow efficient purchasing (although provincial and territorial governments created the pan-Canadian Pharmaceutical Alliance (pCPA) in 2010 to capitalise on the combined purchasing power of public drug plans, improve the consistency of drug listing decisions and increase access to drug treatment options). Second, drug costs are sometimes too high for both insured and uninsured patients, compromising take-up and adherence to treatments, as well as efficient treatment options (for example, when expensive drugs are only covered when used in inpatient care). Some analysts suggest that Canadians could save money by implementing well-designed universal pharmaceutical coverage. Although it would add to government spending, it might be good value for money. When appropriately used, pharmaceuticals help prevent disease complications and the need for more costly care.
Key observations Introducing effective auto-enrolment of
middle-income earners in private pensions with temporary and targeted financial incentives would increase the retirement incomes of this population group.
Obesity rates could be reduced by making greater use of measures such as food labelling regulations, promoting healthy foods, and counselling by doctors and dieticians.
Promoting more integrated care outside hospitals for people with chronic conditions would avoid unnecessary hospital emergency department visits and admissions.
Canada could benefit from implementing universal health insurance coverage for spending on pharmaceuticals.
PROMOTING GREEN AND INCLUSIVE GROWTH IN CANADA – 27
9 Refocusing Canada’s development co-operation
Canada has always been recognised for its generosity towards less developed countries through grants of important financial and technical support. However, this international engagement declined in recent years, and Canada moved away from the UN target for Official Development Assistance (ODA). As the new government prepares to refocus Canada’s development co-operation, it will be important to reverse the trend decline in ODA and to improve the efficiency and effectiveness of the country’s development co-operation programme.
Canada’s development assistance has been declining
Canada has traditionally been associated with a strong and principled development co-operation policy. Declining ODA since 2010 (Figure 9.1) has, however, caused Canada to lose ground on the path set out by the UN and to fall further below the average country effort of its peers in the OECD Development Assistance Committee (DAC). There has also been a declining share of Canadian development assistance directed towards the least developed countries since 2010. It is therefore encouraging that the mandate given to the Minister of International Development and La Francophonie, under the new government, is
to refocus Canada’s development assistance on helping the poorest and most vulnerable and supporting fragile states.
Developing a policy vision for development assistance
The new universal Sustainable Development Goals present Canada with an opportunity to shape a development co-operation narrative with a whole-of-government approach focused on achieving results and ending poverty, and to rethink the international community’s efforts to deliver on its universality. As recommended by the 2012 DAC peer review (OECD, 2012b), and given the new context, it is important that Canada consult on and set out a new policy
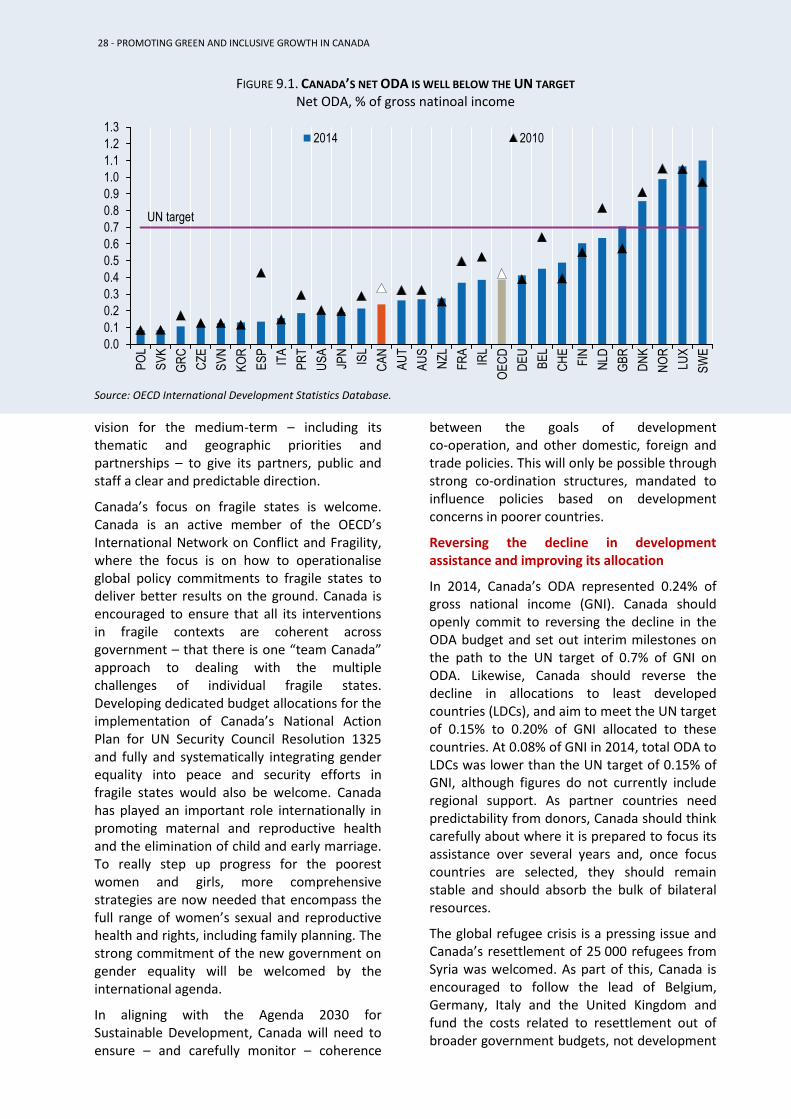
28 – PROMOTING GREEN AND INCLUSIVE GROWTH IN CANADA
FIGURE 9.1. CANADA’S NET ODA IS WELL BELOW THE UN TARGET Net ODA, % of gross natinoal income
Source: OECD International Development Statistics Database.
vision for the medium-term – including its thematic and geographic priorities and partnerships – to give its partners, public and staff a clear and predictable direction.
Canada’s focus on fragile states is welcome. Canada is an active member of the OECD’s International Network on Conflict and Fragility, where the focus is on how to operationalise global policy commitments to fragile states to deliver better results on the ground. Canada is encouraged to ensure that all its interventions in fragile contexts are coherent across government – that there is one “team Canada” approach to dealing with the multiple challenges of individual fragile states. Developing dedicated budget allocations for the implementation of Canada’s National Action Plan for UN Security Council Resolution 1325 and fully and systematically integrating gender equality into peace and security efforts in fragile states would also be welcome. Canada has played an important role internationally in promoting maternal and reproductive health and the elimination of child and early marriage. To really step up progress for the poorest women and girls, more comprehensive strategies are now needed that encompass the full range of women’s sexual and reproductive health and rights, including family planning. The strong commitment of the new government on gender equality will be welcomed by the international agenda.
In aligning with the Agenda 2030 for Sustainable Development, Canada will need to ensure – and carefully monitor – coherence
between the goals of development co-operation, and other domestic, foreign and trade policies. This will only be possible through strong co-ordination structures, mandated to influence policies based on development concerns in poorer countries.
Reversing the decline in development assistance and improving its allocation
In 2014, Canada’s ODA represented 0.24% of gross national income (GNI). Canada should openly commit to reversing the decline in the ODA budget and set out interim milestones on the path to the UN target of 0.7% of GNI on ODA. Likewise, Canada should reverse the decline in allocations to least developed countries (LDCs), and aim to meet the UN target of 0.15% to 0.20% of GNI allocated to these countries. At 0.08% of GNI in 2014, total ODA to LDCs was lower than the UN target of 0.15% of GNI, although figures do not currently include regional support. As partner countries need predictability from donors, Canada should think carefully about where it is prepared to focus its assistance over several years and, once focus countries are selected, they should remain stable and should absorb the bulk of bilateral resources.
The global refugee crisis is a pressing issue and Canada’s resettlement of 25 000 refugees from Syria was welcomed. As part of this, Canada is encouraged to follow the lead of Belgium, Germany, Italy and the United Kingdom and fund the costs related to resettlement out of broader government budgets, not development
0.0
0.1
0.2
0.3
0.4
0.5
0.6
0.7
0.8
0.9
1.0
1.1
1.2
1.3P
OL
SV
K
GR
C
CZ
E
SV
N
KO
R
ES
P
ITA
PR
T
US
A
JPN
ISL
CA
N
AU
T
AU
S
NZ
L
FR
A
IRL
OE
CD
DE
U
BE
L
CH
E
FIN
NLD
GB
R
DN
K
NO
R
LUX
SW
E
2014 2010
UN target
28 - PROMOTING GREEN AND INCLUSIVE GROWTH IN CANADA
PROMOTING GREEN AND INCLUSIVE GROWTH IN CANADA – 29
budgets. This would ensure that development funds continue to be available for their intended purpose: delivering on the Agenda 2030 commitments and “leaving no one behind”.
Improving the organisation and management of development co-operation
To be fit for purpose, Canada will need to bring efficiency and effectiveness to the operation of its programme. This includes taking stock of the development skills available to the programme, matched against future needs. It also includes delegating authority for decision-making – giving field staff more flexibility and enabling them to be responsive to partner countries. Cnaada is an active participant in the Global Partnership for Effective Development Co-operation and is currently engaged in its Second Monitoring Round, but it could be more active in other platforms that seek to improve the effectiveness of development co-operation, such as the International Dialogue on Peacebuilding and Statebuilding.
Relationships with civil society have suffered over the last few years, with the lack of an overall policy approach and with the clear trend of replacing core funding with non-core funding. The new administration will need to recover these relationships with a clear strategy, meaningful consultation and transparent funding opportunities. Canada is encouraged to continue its innovative approaches in using ODA to leverage private finance, so long as they result in development relevance, effectiveness and impact. These have the potential to mobilise significant resources and expertise towards meeting the sustainable development goals.
Key observations The new government presents an
opportunity for setting out a new policy vision for the medium term, including the thematic priorities and focus countries, priority partnerships, and how Canada’s domestic and foreign policies can be made coherent with development goals.
Canada’s development co-operation efforts would benefit from ensuring the coherence of all interventions in fragile contexts and fully and systematically integrating gender equality into peace and security efforts in fragile states.
A comprehensive approach to the maternal and reproductive health policy priority, encompassing the full range of women’s sexual and reproductive health and rights, would step up progress for the poorest women and girls.
Reversing the decline in the ODA budget, including allocations to least developed countries, would help Canada to make progress towards UN targets.
Funding the costs related to resettlement of refugees out of broader government budgets rather than development budgets would ensure that development funds continue to be available for their intended purpose.
The efficiency and effectiveness of the operation of Canada’s development assistance programme could be improved, with strengthened tools, delegations and human resources.
Canada could benefit from engaging actively with global platforms that seek to improve the effectiveness of aid, and develop meaningful relationships with non-governmental actors.
PROMOTING GREEN AND INCLUSIVE GROWTH IN CANADA – 29
30 – PROMOTING GREEN AND INCLUSIVE GROWTH IN CANADA
10 Addressing climate change and other environmental challenges
While Canada’s emissions of greenhouse gases have fallen in recent years, policy efforts need to be stepped up to meet the target of reducing GHG emissions by 30% below 2005 levels by 2030. Federal leadership and greater federal-provincial co-ordination of climate change strategies will have to play a significant role. Moreover, municipalities have also required the federal government's assistance to tackle challenges concerning waste management, as well as air and water pollution.
On a per capita basis, Canada is one of the highest GHG emitters in the OECD
Canadian GHG emissions are among the highest in the OECD on a per capita basis. Factors contributing to high per capita emissions include high incomes, high climate variability, and sparse population density. Canada’s oil and gas sector accounts for about one-quarter of Canada’s total emissions. Within the oil and gas sector, emissions from fuel combustion account for 67% of total GHG emissions, and fugitive methane and CO2 emissions, including venting and flaring, account for 33%. Canada is a major supplier of oil, exporting energy predominantly to the United States. The next largest emitting sector in Canada is the transportation sector, which accounts for approximately 28% of Canada’s GHG emissions. The electricity and building sectors each account for just under 12% of Canada’s emissions, although regulations are in place to reduce emissions from coal-fired electricity generation. A highly variable climate and sparse population density will influence the ease with which the country makes the transition to a low GHG-emissions economy, as compared to other countries.
Despite the abundance of fossil fuels, emissions intensity in electricity generation is relatively low. Hydropower supplies 60% of electricity generation and nuclear power 14%. Other renewable energy represents only 3% of the total electricity generation. Integrating renewable energy sources into the electricity network is challenging, owing to their intermittent nature. Increasing the electricity arbitrage between provinces and with the United States has the potential to bring down the cost of renewables. This would require increased imports of electricity through local networks to meet temporary shortfalls, instead of having to maintain reserve generation capacity. Co-operation with the United States to
develop transmission lines would need to be envisaged to facilitate cross-border arbitrage. Even though fossil fuels account for a high share of energy-related R&D spending, a significant share is also spent on low-carbon options, including biofuels and nuclear energy, with research on carbon capture and storage (CCS) accounting for a significant part of the total R&D expenditure, especially at the provincial level. In October 2014, Canada launched the world's first commercial-scale coal-fired power plant with CCS, at Boundary Dam near Estevan, Saskatchewan.
Federal-provincial-territorial co-ordination will be key in taking action on climate change
In Canada, environmental protection is a constitutional responsibility shared among federal, provincial and territorial governments. The federal government is working with the provinces and territories to develop a pan-Canadian framework for clean growth and climate change. The goal will be to enable Canada to meet or exceed its international emissions targets and transition to a stronger, more resilient, low-carbon economy. The federal, provincial and territorial governments have established working groups to identify options for action in four areas: clean technology, innovation and jobs; carbon pricing mechanisms; specific mitigation opportunities; and adaptation and climate resilience. The government has announced CAD 2 billion for the creation of a Low Carbon Economy Fund, which will support provincial and territorial actions to address climate change. The government also announced CAD 1 billion to support clean technologies, which it states will play a critical role in Canada's transformation into a low-carbon economy.
Federal policy action on climate change under the previous government operated primarily through a sector-based regulatory approach.
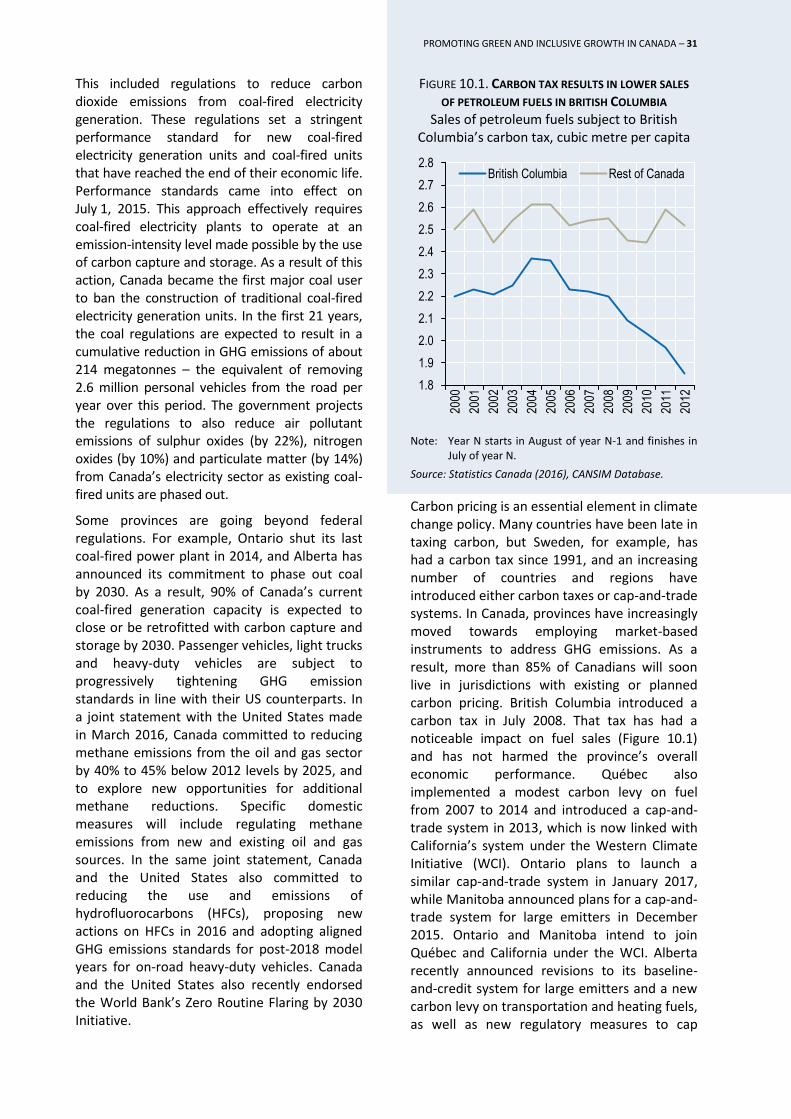
PROMOTING GREEN AND INCLUSIVE GROWTH IN CANADA – 33
This included regulations to reduce carbon dioxide emissions from coal-fired electricity generation. These regulations set a stringent performance standard for new coal-fired electricity generation units and coal-fired units that have reached the end of their economic life. Performance standards came into effect on July 1, 2015. This approach effectively requires coal-fired electricity plants to operate at an emission-intensity level made possible by the use of carbon capture and storage. As a result of this action, Canada became the first major coal user to ban the construction of traditional coal-fired electricity generation units. In the first 21 years, the coal regulations are expected to result in a cumulative reduction in GHG emissions of about 214 megatonnes – the equivalent of removing 2.6 million personal vehicles from the road per year over this period. The government projects the regulations to also reduce air pollutant emissions of sulphur oxides (by 22%), nitrogen oxides (by 10%) and particulate matter (by 14%) from Canada’s electricity sector as existing coal-fired units are phased out.
Some provinces are going beyond federal regulations. For example, Ontario shut its last coal-fired power plant in 2014, and Alberta has announced its commitment to phase out coal by 2030. As a result, 90% of Canada’s current coal-fired generation capacity is expected to close or be retrofitted with carbon capture and storage by 2030. Passenger vehicles, light trucks and heavy-duty vehicles are subject to progressively tightening GHG emission standards in line with their US counterparts. In a joint statement with the United States made in March 2016, Canada committed to reducing methane emissions from the oil and gas sector by 40% to 45% below 2012 levels by 2025, and to explore new opportunities for additional methane reductions. Specific domestic measures will include regulating methane emissions from new and existing oil and gas sources. In the same joint statement, Canada and the United States also committed to reducing the use and emissions of hydrofluorocarbons (HFCs), proposing new actions on HFCs in 2016 and adopting aligned GHG emissions standards for post-2018 model years for on-road heavy-duty vehicles. Canada and the United States also recently endorsed the World Bank’s Zero Routine Flaring by 2030 Initiative.
FIGURE 10.1. CARBON TAX RESULTS IN LOWER SALES OF PETROLEUM FUELS IN BRITISH COLUMBIA
Sales of petroleum fuels subject to British Columbia’s carbon tax, cubic metre per capita
Note: Year N starts in August of year N-1 and finishes in July of year N.
Source: Statistics Canada (2016), CANSIM Database.
Carbon pricing is an essential element in climate change policy. Many countries have been late in taxing carbon, but Sweden, for example, has had a carbon tax since 1991, and an increasing number of countries and regions have introduced either carbon taxes or cap-and-trade systems. In Canada, provinces have increasingly moved towards employing market-based instruments to address GHG emissions. As a result, more than 85% of Canadians will soon live in jurisdictions with existing or planned carbon pricing. British Columbia introduced a carbon tax in July 2008. That tax has had a noticeable impact on fuel sales (Figure 10.1) and has not harmed the province’s overall economic performance. Québec also implemented a modest carbon levy on fuel from 2007 to 2014 and introduced a cap-and-trade system in 2013, which is now linked with California’s system under the Western Climate Initiative (WCI). Ontario plans to launch a similar cap-and-trade system in January 2017, while Manitoba announced plans for a cap-and-trade system for large emitters in December 2015. Ontario and Manitoba intend to join Québec and California under the WCI. Alberta recently announced revisions to its baseline-and-credit system for large emitters and a new carbon levy on transportation and heating fuels, as well as new regulatory measures to cap
1.8
1.9
2.0
2.1
2.2
2.3
2.4
2.5
2.6
2.7
2.8
2000
2001
2002
2003
2004
2005
2006
2007
2008
2009
2010
2011
2012
British Columbia Rest of Canada
PROMOTING GREEN AND INCLUSIVE GROWTH IN CANADA – 31

36 – PROMOTING GREEN AND INCLUSIVE GROWTH IN CANADA
FIGURE 10.2. REVENUES FROM ENVIRONMENTALLY RELATED TAXES ARE LOW Percent of GDP, 2014 or latest available year
Note: For Canada, the data include both federal and provincial tax revenues.
Source: OECD (2016c), "Green Growth Indicators", OECD Environment Statistics Database, http://dx.doi.org/10.1787/data-00665-en.
emissions from the oil sands and phase out coal-fired power plants. The federal government’s work with the provinces and territories to develop a pan-Canadian framework on clean growth and climate change will include an approach to carbon pricing.
Canadian provinces and territories have different emission levels and profiles. For example, Alberta and Saskatchewan, which accounted for 36.8% and 10.3% of Canada’s 726 MtCO2e emitted in 2013, both have high energy-related emissions and relatively low effective carbon prices. On November 22, 2015, the new Alberta government announced a comprehensive climate change plan which will extend and raise the current carbon tax economy-wide, phase out coal-fired power generation, reduce methane emissions and impose a cap on emissions on the oil-sands sector.
Overall, the price of carbon in Canada remains relatively low, even if specific energy taxes other than carbon taxes are considered in addition to carbon taxes and cap-and-trade systems (OECD, 2013b). Canada has taken action to withdraw or progressively reduce a number of measures that effectively subsidise fossil fuels, but it still has one of the widest ranges of such measures among OECD countries (OECD, 2015h). Road fuel is lightly taxed, especially diesel (which is taxed at a rate lower than in any other OECD country except Mexico and New Zealand). The result is that road fuel
use has risen by more than the OECD average since both 1990 and 2000. Indeed, environmentally related tax revenue constitutes a small share of both total tax revenue and GDP (Figure 10.2).
Urgent action is needed on reducing SOx and NOx emissions
Since 2000, Canada has reduced its total emissions of SOx and NOx at close to the OECD average level of reductions, achieving a decoupling of SOx and NOx emissions from GDP growth. Nonetheless, Canada remains among the OECD countries with the highest intensities of emissions of SOx and NOx emissions per unit of GDP and per capita, partly due to the country’s industrial structure.
Between 2000 and 2012, the national averages of the annual and the 24-hour concentrations of fine particulate matter (PM2.5) decreased by 4% (annual) and 6.5% (24-hour). More significantly, the percentage of Canadians living in communities where ambient concentrations of PM2.5 exceeded the 2015 Canadian ambient air quality standard for PM2.5 dropped from approximately 40% to 11% between 2003 and 2012. Anthropogenic emissions of PM2.5
decreased by 57% between 1990 and 2014, with a steady decline in emissions from all sectors. The national average of ambient levels PM2.5 in Canada has remained stable over the last 14 years. This is because, although emissions from industrial sources, residential wood
0.0
0.5
1.0
1.5
2.0
2.5
3.0
3.5
4.0
4.5
5.0U
SA
CA
N
NZ
L
CH
L
JPN
SV
K
CH
E
ES
P
PO
L
FR
A
ISL
BE
L
DE
U
AU
S
NO
R
LUX
AU
T
CR
I
KO
R
OE
CD
PR
T
IRL
SW
E
ES
T
GB
R
GR
C
HU
N
CZ
E
ITA
ISR
FIN
NLD
DN
K
TU
R
SV
N
Other Motor vehicles Energy
32 - PROMOTING GREEN AND INCLUSIVE GROWTH IN CANADA
PROMOTING GREEN AND INCLUSIVE GROWTH IN CANADA – 33
combustion and transportation declined over this period, emissions from road dust and construction activities increased enough to offset this decline (Environment and Climate Change Canada, 2016).
Water management and waste accumulation in tailing ponds are key concerns
Oil sands production requires substantial volumes of water, resulting in significant waste accumulation in tailings ponds. There are concerns that oil sands development impacts the surrounding ecosystem and water quality (Frank et al., 2014). Although the Alberta government set regulations for managing and reducing waste in 2009, the methodologies used by mining operators did not enable them to meet the 2011/12 targets (ERCB, 2013). The government introduced the Tailings Management Framework in 2015 to get tailings ponds remediated more quickly and to slow their growth. These objectives are now subject to timelines. The government also introduced the Surface Water Quantity Management Framework, which restricts water use by mineable oil sands operators.
Municipal waste management relies heavily on landfilling and generates GHG emissions
In Canada, municipal waste consists of waste from residential and non-residential sources, which includes industrial, commercial and institutional wastes. When disposing of their municipal waste, Canadian municipalities continue to resort to landfill to a relatively large extent (72%, compared to the OECD average of 44%). Waste diversion is carried out to a lesser extent than elsewhere (24%, compared to the OECD average of 34%). This can be attributed to a range of factors, including the low cost of landfilling, more limited markets for secondary materials and low population density in many regions, which makes recycling an economically less viable option than in other OECD countries. GHG emissions generated by the waste sector have increased by 6% since 1990, while most OECD countries have reduced them. However, with provincial measures in place to divert solid waste and capture landfill gas, emission trends from waste have been decreasing since 2005. With municipal waste predominantly landfilled in Canada, there are some key opportunities to improve waste management in the country through improved waste policy frameworks and continued efforts to increase waste diversion, upstream prevention and energy recovery.
Canada is on track to meet the goal of safe use of chemicals by 2020
Canada’s Chemicals Management Plan continues to make progress on its mandate of reducing the risks posed by chemicals to human health and the environment. In 2006, Canada completed a priority-setting exercise of the 23 000 chemicals that had been in commercial use during the 1980s and which can continue to be used in Canada. That exercise identified 4 300 substances for further review, which the government has committed to address by 2020. To date, of the approximately 2 750 substances that have been assessed, 363 have been identified as needing some type of risk management action. So far, 78 risk management actions have been put in place to address these substances (many of these actions address multiple substances). Canada will need to maintain its current level of efforts to assess the risks of the 1 550 remaining priority substances and, where needed, implement additional risk reduction measures.
While Canada was one of the first countries to systematically start addressing the risks of legacy chemicals, the priority-setting exercise is now almost a decade old. It is essential for Canada to take into consideration new scientific information regarding chemicals and to support the continued development of modernised and harmonised approaches for the assessment and management, of chemicals, ensuring a sustainable chemicals management programme beyond the 2020 goal.
Key observations Further expanding the use of market
instruments to price CO2 emissions, greaterco-ordination of provincial schemes at thefederal level and greater coherence ofprovincial climate change strategies withinternational commitments would help tocurb CO2 emissions.
The environmental impacts of oil sandsproduction should be reduced by ensuringthat regulatory objectives for treatingwaste from oil sands projects are met.
Environmental outcomes could beimproved by shifting tax revenues towardsenvironmentally related taxes. Inparticular, higher taxes on road fuels,especially diesel, would help.
34 – PROMOTING GREEN AND INCLUSIVE GROWTH IN CANADA
References Andrews,D., C. Criscuolo and P.N. Gal (2015), "Frontier Firms, Technology Diffusion and Public Policy: Micro Evidence from OECD Countries", OECD Productivity Working Papers, No. 2, OECD Publishing, Paris, http://dx.doi.org/10.1787/5jrql2q2jj7b-en.
Baldwin, J. R., D. Leung and L. Rispoli (2014), “Canada-United States Labour Productivity Gap Across Firm Size Classes”, Research Paper, The Canadian Productivity Review, Statistics Canada, Ottawa, http://www.statcan.gc.ca/pub/15-206-x/15-206-x2014033-eng.pdf.
Brander, J. A., E. Egan and T.F. Hellmann, Government Sponsored versus Private Venture Capital: Canadian Evidence, National Bureau of Economic Research (NBER) Working Paper No. 14029, NBER, Cambridge, http://dx.doi.org/10.3386/w14029.
Crawford, C. and J. Freedman (2010), “Small Business Taxation”, in J. Mirrlees et al.(eds.), Dimensions of Tax Design: The Mirrlees Review, Oxford University Press, Oxford, http://ssrn.com/abstract=1804333.
ESDC (Employment and Social Development Canada) (2013), Canadian Occupational Projection System: Projections 2013-2022, http://occupations.esdc.gc.ca/sppc-cops/content.jsp?cid=49&lang=en&preview=1.
Environment and Climate Change Canada (2016), Ambient Levels of Fine Particulate Matter, http://www.ec.gc.ca/indicateurs-indicators/default.asp?lang=en&n=029BB000-1#pm1.
ERCB (Energy Resources Conservation Board) (2013), 2012 Tailings Management Assessment Report: Oil Sands Mining Industry, ERCB, Edmonton, https://www.aer.ca/documents/oilsands/tailings-plans/TailingsManagementAssessmentReport2011-2012.pdf.
Frank, R.A. et al. (2014), “Profiling Oil Sands Mixtures from Industrial Developments and Natural Groundwaters for Source Identification”, Environmental Science & Technology, Vol. 1/2014.
McKinsey (2015), Youth in transition: Bridging Canada’s path from education to employment. http://www.mckinsey.com/~/media/McKinsey%20Offices/Canada/Latest%20thinking/PDFs/Youth_in_transition_Bridging_Canadas_path_from_education_to_employment.ashx.
OECD Better Life Index 2016, www.betterlifeindex.org.
OECD Income Distribution Database, www.oecd.org/social/income-distribution-database.htm.
OECD STRI Database, http://www.oecd.org/tad/services-trade/services-trade-restrictiveness-index.htm.
OECD R&D Tax Incentive Indicators, www.oecd.org/sti/rd-tax-stats.htm
OECD Main Science and Technology Indicators, June 2015, www.oecd.org/sti/msti.htm.
OECD (2016a), “R&D Tax Incentive Country Profiles 2015: Canada, Measuring R&D Tax Incentives, Directorate for Science, Technology and Innovation, February 2016, http://www.oecd.org/sti/OECD-STI-RDTaxIncentives-CountryProfile_CAN.pdf.
OECD (2016b), Employment and Skills Strategies in Yukon and Saskatchewan, Canada, OECD Reviews on Local Job Creation, OECD Publishing, Paris, forthcoming.
OECD (2016c), "Green Growth Indicators", OECD Environment Statistics Database, http://dx.doi.org/10.1787/data-00665-en.

PROMOTING GREEN AND INCLUSIVE GROWTH IN CANADA – 35
OECD (2015a), How's Life? 2015: Measuring Well-being, OECD Publishing, Paris, http://dx.doi.org/10.1787/how_life-2015-en.
OECD (2015b), OECD Regulatory Policy Outlook 2015, OECD Publishing, Paris, http://dx.doi.org/10.1787/9789264238770-en.
OECD (2015c), Science, Technology and Industry Scoreboard 2015: Innovation for Growth and Society, OECD Publishing, Paris, http://dx.doi.org/10.1787/sti_scoreboard-2015-en.
OECD (2015d), Innovation, Agricultural Productivity and Sustainability in Canada, OECD Publishing, Paris. http://dx.doi.org/10.1787/9789264238541-en.
OECD (2015e), Education at a Glance 2015: OECD Indicators, OECD Publishing, Paris, http://dx.doi.org/10.1787/eag-2015-en.
OECD (2015f), Employment and Skills Strategies in Canada, OECD Reviews on Local Job Creation, OECD Publishing, Paris, http://dx.doi.org/10.1787/9789264209374-en.
OECD (2015g), Back to Work Canada: Improving the Re-employment Prospects of Displaced Workers, Back to Work, OECD Publishing, Paris, http://dx.doi.org/10.1787/9789264233454-en.
OECD (2015h), OECD Companion to the Inventory of Support Measures for Fossil Fuels 2015, OECD Publishing, Paris, http://dx.doi.org/10.1787/9789264239616-en.
OECD (2014a), OECD Economic Surveys: Canada 2014, OECD Publishing, Paris, http://dx.doi.org/10.1787/eco_surveys-can-2014-en
OECD (2014b), PISA 2012 Results: What Students Know and Can Do (Volume I, Revised edition, February 2014): Student Performance in Mathematics, Reading and Science, PISA, OECD Publishing, Paris, http://dx.doi.org/10.1787/9789264208780-en.
OECD (2013a), PISA 2012 Results: Excellence through Equity (Volume II): Giving Every Student the Chance to Succeed, PISA, OECD Publishing, Paris, http://dx.doi.org/10.1787/9789264201132-en.
OECD (2013b), Taxing Energy Use: A Graphical Analysis, OECD Publishing, Paris, http://dx.doi.org/10.1787/9789264183933-en.
OECD (2012a), Survey of Adult Skills (PIAAC) (database), www.oecd.org/site/piaac/surveyofadultskills.htm (accessed November 18, 2015).
OECD (2012b), Canada: Development Assistance Committee Peer Review 2012, OECD Publishing, Paris. http://www.oecd.org/dac/peer-reviews/canadapeerreview2012.pdf.
OECD/European Union (2015), Indicators of Immigrant Integration 2015: Settling In, OECD Publishing, Paris, http://dx.doi.org/10.1787/9789264234024-en.
Statistics Canada (2016), Labour Force Survey, Cansim table 282-0226, http://www5.statcan.gc.ca/cansim/a26?lang=eng&id=2820226 (accessed March 15, 2016).
Statistics Canada (n.d.), National Household Survey 2011: data tables, https://www12.statcan.gc.ca/nhs-enm/2011/dp-pd/dt-td/Lp-eng.cfm?LANG=E&APATH=3&DETAIL=0&DIM=0&FL=A&FREE=0&GC=0&GID=0&GK=0&GRP=0&PID=0&PRID=0&PTYPE=105277&S=0&SHOWALL=1&SUB=0&Temporal=2013&THEME=96&VID=0&VNAMEE=&VNAMEF= (accessed November 18, 2015).

36 – PROMOTING GREEN AND INCLUSIVE GROWTH IN CANADA
Statistics Canada (2011), Fact Sheet - 2011 National Household Survey Aboriginal Demographics, Educational Attainment and Labour Market Outcomes. https://www.aadnc-aandc.gc.ca/eng/1376329205785/1376329233875.
Statistics Canada CANSIM, (n.d.), Tables 282-0004 and 477-0020, http://www5.statcan.gc.ca/cansim/a26?lang=eng&id=2820004 and http://www5.statcan.gc.ca/cansim/a26?lang=eng&id=4770020 (accessed November 18, 2015).
TomTom (2015), TomTom Traffic Index, www.tomtom.com/en_gb/trafficindex/#/ (accessed 17 November 2015).
USDA Economic Research Service Agricultural Productivity Database, www.ers.usda.gov/data-products/international-agricultural-productivity/documentation-and-methods.aspx#exce.

This document is published on the responsibility of the Secretary-General of the OECD. The opinions expressed and arguments employed herein do not necessarily reflect the official views of OECD member countries.
***
This document and any map included herein are without prejudice to the status of or sovereignty over any territory, to the delimitation of international frontiers and boundaries and to the name of any territory, city or area.
The statistical data for Israel are supplied by and under the responsibility of the relevant Israeli authorities. The use of such data by the OECD is without prejudice to the status of the Golan Heights, East Jerusalem and Israeli settlements in the West Bank under the terms of international law.
***
This document is part of the “Better Policies Series”. Under the guidance of Gabriela Ramos and Juan Yermo, Isabell Koske coordinated the publication, with the help of Ewa Klimowicz and Victor Duggan. Contributors: Jonathan Barr, Andrew Bell, Hervé Boulhol, David Bradbury, Bert Brys, David Carey, Sean Ennis, Michael Forster, Massimo Geloso Grosso, Peter Jarrett, Gaetan Lafortune, Horacio Levy, Thomas Liebig, Isabelle Luong, Corinne Luu, Rahul Malhotra, Marco Marchese, Andrew McQueen, Catherine Moreddu, Ana Novik, Paul O’Brien, Ryan Parmenter, Dirk Pilat, Jonathan Potter, Mikaela Rambali, Angelica Salvi Del Pero, Paul Swaim, Frank Van Tongeren, Elena Tosetto. Isabelle Renaud provided production and administrative support.
Photo credits: © Shutterstock.com
Corrigenda to OECD publications may be found on line at: www.oecd.org/publishing/corrigenda.© OECD 2016
You can copy, download or print OECD content for your own use, and you can include excerpts from OECD publications, databases and multimedia products in your own documents, presentations, blogs, websites and teaching materials, provided that suitable acknowledgment of the source and copyright owner is given. All requests for public or commercial use and translation rights should be submitted to [email protected]. Requests for permission to photocopy portions of this material for public or commercial use shall be addressed directly to the Copyright Clearance Center (CCC) at [email protected] or the Centre français d’exploitation du droit de copie (CFC) at [email protected].
ORGANISATION FOR ECONOMIC CO-OPERATION AND DEVELOPMENT
The OECD is a unique forum where governments work together to address the economic, social and environmental challenges of globalisation. The OECD is also at the forefront of efforts to understand and to help governments respond to new developments and concerns, such as corporate governance, the information economy and the challenges of an ageing population. The Organisation provides a setting where governments can compare policy experiences, seek answers to common problems, identify good practice and work to co-ordinate domestic and international policies.
The OECD member countries are: Australia, Austria, Belgium, Canada, Chile, the Czech Republic, Denmark, Estonia, Finland, France, Germany, Greece, Hungary, Iceland, Ireland, Israel, Italy, Japan, Korea, Luxembourg, Mexico, the Netherlands, New Zealand, Norway, Poland, Portugal, the Slovak Republic, Slovenia, Spain, Sweden, Switzerland, Turkey, the United Kingdom and the United States. The European Union takes part in the work of the OECD.
OECD Publishing disseminates widely the results of the Organisation’s statistics gathering and research on economic, social and environmental issues, as well as the conventions, guidelines and standards agreed by its members.
OECD “Better Policies” Series
The Organisation for Economic Co-operation and Development (OECD) aims to promote better policies for better lives by providing a forum in which governments gather to share experiences and seek solutions to common problems. We work with our 34 members, key partners and over 100 countries to better understand what drives economic, social and environmental change in order to foster the well-being of people around the world. The OECD Better Policies Series provides an overview of the key challenges faced by individual countries and our main policy recommendations to address them. Drawing on the OECD’s expertise in comparing country experiences and identifying best practices, the Better Policies Series tailor the OECD’s policy advice to the specific and timely priorities of member and partner countries, focusing on how governments can make reform happen.

www.oecd.org/canadaOCDE Paris
2, rue André Pascal, 75775 Paris Cedex 16Tel.: +33 1 45 24 82 00
Better Policies Series
PROMOTING GREEN AND INCLUSIVE
GROWTH IN CANADA
June 2016